Article

Analysis of the Vibration Characteristics and Vibration Reduction Methods of Iron Core Reactor

1
School of Electrical Engineering, Shenyang University of Technology, Shenyang 110870, China
2
Building Electrification Institute, Shenyang Railway Prospecting Design Institute, Shenyang 110000, China
*
Authors to whom correspondence should be addressed.
Actuators 2023, 12(9), 365; https://doi.org/10.3390/act12090365
Submission received: 23 August 2023 / Revised: 13 September 2023 / Accepted: 14 September 2023 / Published: 20 September 2023
(This article belongs to the Special Issue Vibration Control Using Electromagnetic Actuators)

Abstract

:
Series iron core reactors are one of the most commonly used electrical equipments in power systems, which can limit short-circuit currents and suppress harmonic waves from capacitor banks. However, the vibration of the reactor will not only generate noise pollution but also diminish the service life of the reactor and jeopardize power system safety. In order to reduce the vibration noise in the core disc region of the reactor, the vibration characteristics of a core reactor are calculated by modifying the anisotropy parameters of the Young’s modulus of the core disc lamellar structure and introducing the core magnetostriction effect based on the simulation analysis method of electromagnetic and mechanical coupling. A detachable single-phase series core reactor model is established, and the validity of the simulation calculation is measured and verified. At the same time, from the perspective of improving the air gap size of the series core reactor and the arrangement of electrical steel sheets, the corresponding iron core vibration reduction scheme is given. The average vibration reduction in the reactor is about 11.6% after comprehensive improvement according to the vibration reduction scheme, which provides an effective method for realizing the vibration and noise reduction in the reactor.

1. Introduction

With the advent of the high-capacity grid era, an increasing number of nonlinear loads are installed in the grid, and sine wave voltages on nonlinear loads become distorted into harmonics. Reactors and transformers are also installed in populated areas, hence, transformers and reactors in the course of work will produce vibration noise; the presence of harmonic vibration noise is particularly noticeable, which has led to increasing concern about environmental noise pollution. Noise can not only affect people’s hearing, but also cause great psychological damage unconsciously. The improvement and optimization of electrical equipment is one of the important means to solve the noise pollution of industrial equipment at the source.
In order to solve the noise problem, there are plenty of noise reduction methods for reactor vibration, such as: timing and regular adjustment of the tank base of the correction oil immersion reactor. These noise cancellation methods generally do not address the root causes of vibration problems in terms of isolation and noise reduction. Therefore, this paper will study the vibration problem of iron cores, the main source of vibration from the reactor.
The ferromagnetic material of the core of the reactor is mainly electrical steel sheet; the magnetic domain of the electrical steel turns in the same direction under the action of the external magnetic field. The outward manifestation of the electrical steel sheet shape and size is the phenomenon of the shortening or elongation of the nanoscale; this phenomenon is called magnetostrictive. Since the upper and lower iron yoke of the reactor and the discus are stacked from electrical steel sheets, the magnetostrictive effect causes vibration of the reactor, whose vibration period is closely related to the frequency at which the excitation is applied. Because the reactor core air gap is larger, the electromagnetic force is larger, so the electromagnetic force in the reactor caused by the core vibration must not be ignored.
As an important parameter for reactor noise simulation, magnetostriction has attracted much attention. In 2011, scholars such as Piotr K. Klimczyk used the Epstein Frame to study the magnetostriction phenomenon, and the research showed that the peak value of rotational magnetostriction in the vertical rolling direction of the electrical steel sheet was smaller. A measuring device of rotating magnetostrictive can be used to predict the data measured by the Epstein Frame under stress [1]. In 2012, Piotr K. Klimczyk et al. used different processing methods to explore the sensitivity of magnetostrictive stress, and the results showed that laser cutting would produce greater sensitivity curve deviation [2]. Since 2013, Yuichiro Kai and other scholars have designed vector magnetic properties and magnetostriction measurement devices under stress and tested electrical steel sheets under uniaxial stress. The results show that uniaxial stress increases the amplitude of magnetostriction. In 2014, two mutually perpendicular biaxial stresses were applied, and the research showed that the biaxial tension could improve the magnetic characteristics of the electrical steel sheet and reduce magnetostriction at the same time. In 2015, the shear stress under alternating and rotating magnetic fields was studied, and the results showed that the amplitude and phase of magnetostriction changed [3,4,5]. In 2013, Hirotoshi Tada et al. studied magnetostriction and hysteresis loss under different stresses and crystal structures, so they added different proportions of silicon and aluminum to electrical steel sheets and measured their hysteresis loss [6]. In 2014, Yoshihiko Oda found that when the proportion of silicon elements exceeded 3.5%, the strain decreased significantly [7]. In 2015, Daisuke Wakabayashi et al. discussed the vector characteristics of magnetostriction under alternating magnetization and adopted a new measurement method to deal with the angular relationship between magnetostriction and magnetic flux density [8]. In 2016, Sakda Somkun studied local deformation caused by magnetostriction [9]. In the same year, Setareh Gorji Ghalamestani and other scholars measured electrical steel sheets under higher harmonics and explained this phenomenon with magnetic domains [10]. In 2018, Otmane Lahyaoni et al. performed finite element calculations using a laminated model and performed vibration measurements, demonstrating that magnetostrictive strain can induce mechanical resonance at a very low amplitude [11]. Since 2020, a large number of scholars have studied the giant magnetostrictive brake. A giant magnetostrictive actuator has the characteristics of small volume, large stress, large strain, and fast response, and has been widely used in ultra-precision machining, micro-machining, micro-vibration control, precision positioning, and other fields. Xiaojun Ju et al. established the displacement model of giant magnetostrictive actuators based on the Jiles–Atherton theory and the quadratic law. Zhaoqi Zhou et al. analyzed the internal magnetic field characteristics of giant magnetostrictive brakes based on electromagnetic theory and the finite element method [12,13,14,15].
In terms of vibration research on a reactor, Liu Ji analyzed the vibration of the reactor core through a multi-physics coupling simulation and showed that the vibration was caused by both magnetostrictive force and electromagnetic force, in which the magnetostrictive force was dominant [16]. Zhu Lihua and other scholars carried out multi-physical field simulation on a 4.4 kVar/220 V reactor. The time-domain and frequency-domain signals of the core vibration are analyzed, and it is pointed out that changing the excitation magnitude will change the vibration of adjacent periods of the reactor [17]. Zhang Pengning et al. studied the vibration characteristics of magnetron reactors under different working conditions. The rated voltage of a 10.5 kV reactor is modeled, and a finite element analysis shows that the air gap of different Young’s moduli has a great influence on the vibration performance of the reactor. Later, the vibration of the transformer core and shunt reactor model was simulated by the magnetostrictive quadrature calculation method. The results show that the air gap has a great influence on the vibration of the shunt reactor core [18,19,20]. Yan Rongge et al. established a reactor simulation model. After harmonic injection, the vibration decreases and the stress is concentrated in the air gap, corner, and core surface [21]. Wu Shuyu et al. conducted a coupling calculation of the multi-physical field on the vibration noise of the reactor by electromagnetic structure-noise and obtained the conclusions that the force direction of the winding makes the reactor tend to diverge, the axial force is small in the middle and the two sides are large, the radial force is large in the middle and the two sides are small, and the maximum noise point is located in the upper yoke of the core [22]. Wu Yongye proposed a method of operating the state recognition of converter transformers based on vibration detection technology and a deep belief network optimization algorithm [23]. Scholars such as Guo Jiayi have provided a vibration reduction scheme based on an air gap length differential arrangement for the iron core design of existing UHV shunt reactors [24]. Ben Tong et al. combined the vector magnetostriction model with the finite element method to simulate the vector vibration characteristics of a DC biased magnetron reactor [25,26]. Yang Kai et al. conducted an in-depth study on the wideband active vibration isolation of nonlinear bistable electromagnetic actuators with elastic boundaries [27].
In order to reduce the vibration noise of the reactor and ensure the safety and reliability of the reactor and power system operation, the vibration performance of the reactor core is studied from the angle of combining experiment and theory, and the vibration and noise reduction scheme is put forward. By modifying the anisotropy characteristics of the Young’s modulus of the reactor core disc, a reactor core model is simulated based on the modified data and the vibration reduction effect of changing the core disc parameters is tested according to the modified reactor core model.

2. Adjustment of Young’s Modulus for Core Disc

2.1. Experimental Test of Natural Frequency of Reactor Core Disc

In this paper, a self-made series reactor core disc is measured through a modal experiment, and the natural frequencies are determined from the free vibration response data. The experimental apparatuses utilized for the measurement are presented in Table 1.
The entire structure of the reactor core disc includes laminates made of electrical steel sheets and outer adhesive tape, among other structures. The outer adhesive tape structure is used to secure the electrical steel sheet laminates in the core disc. If the fixed structure is removed, the electrical steel sheet will be completely loose and the mode of the core disc cannot be determined, so this part of the structure is retained during the experiment.
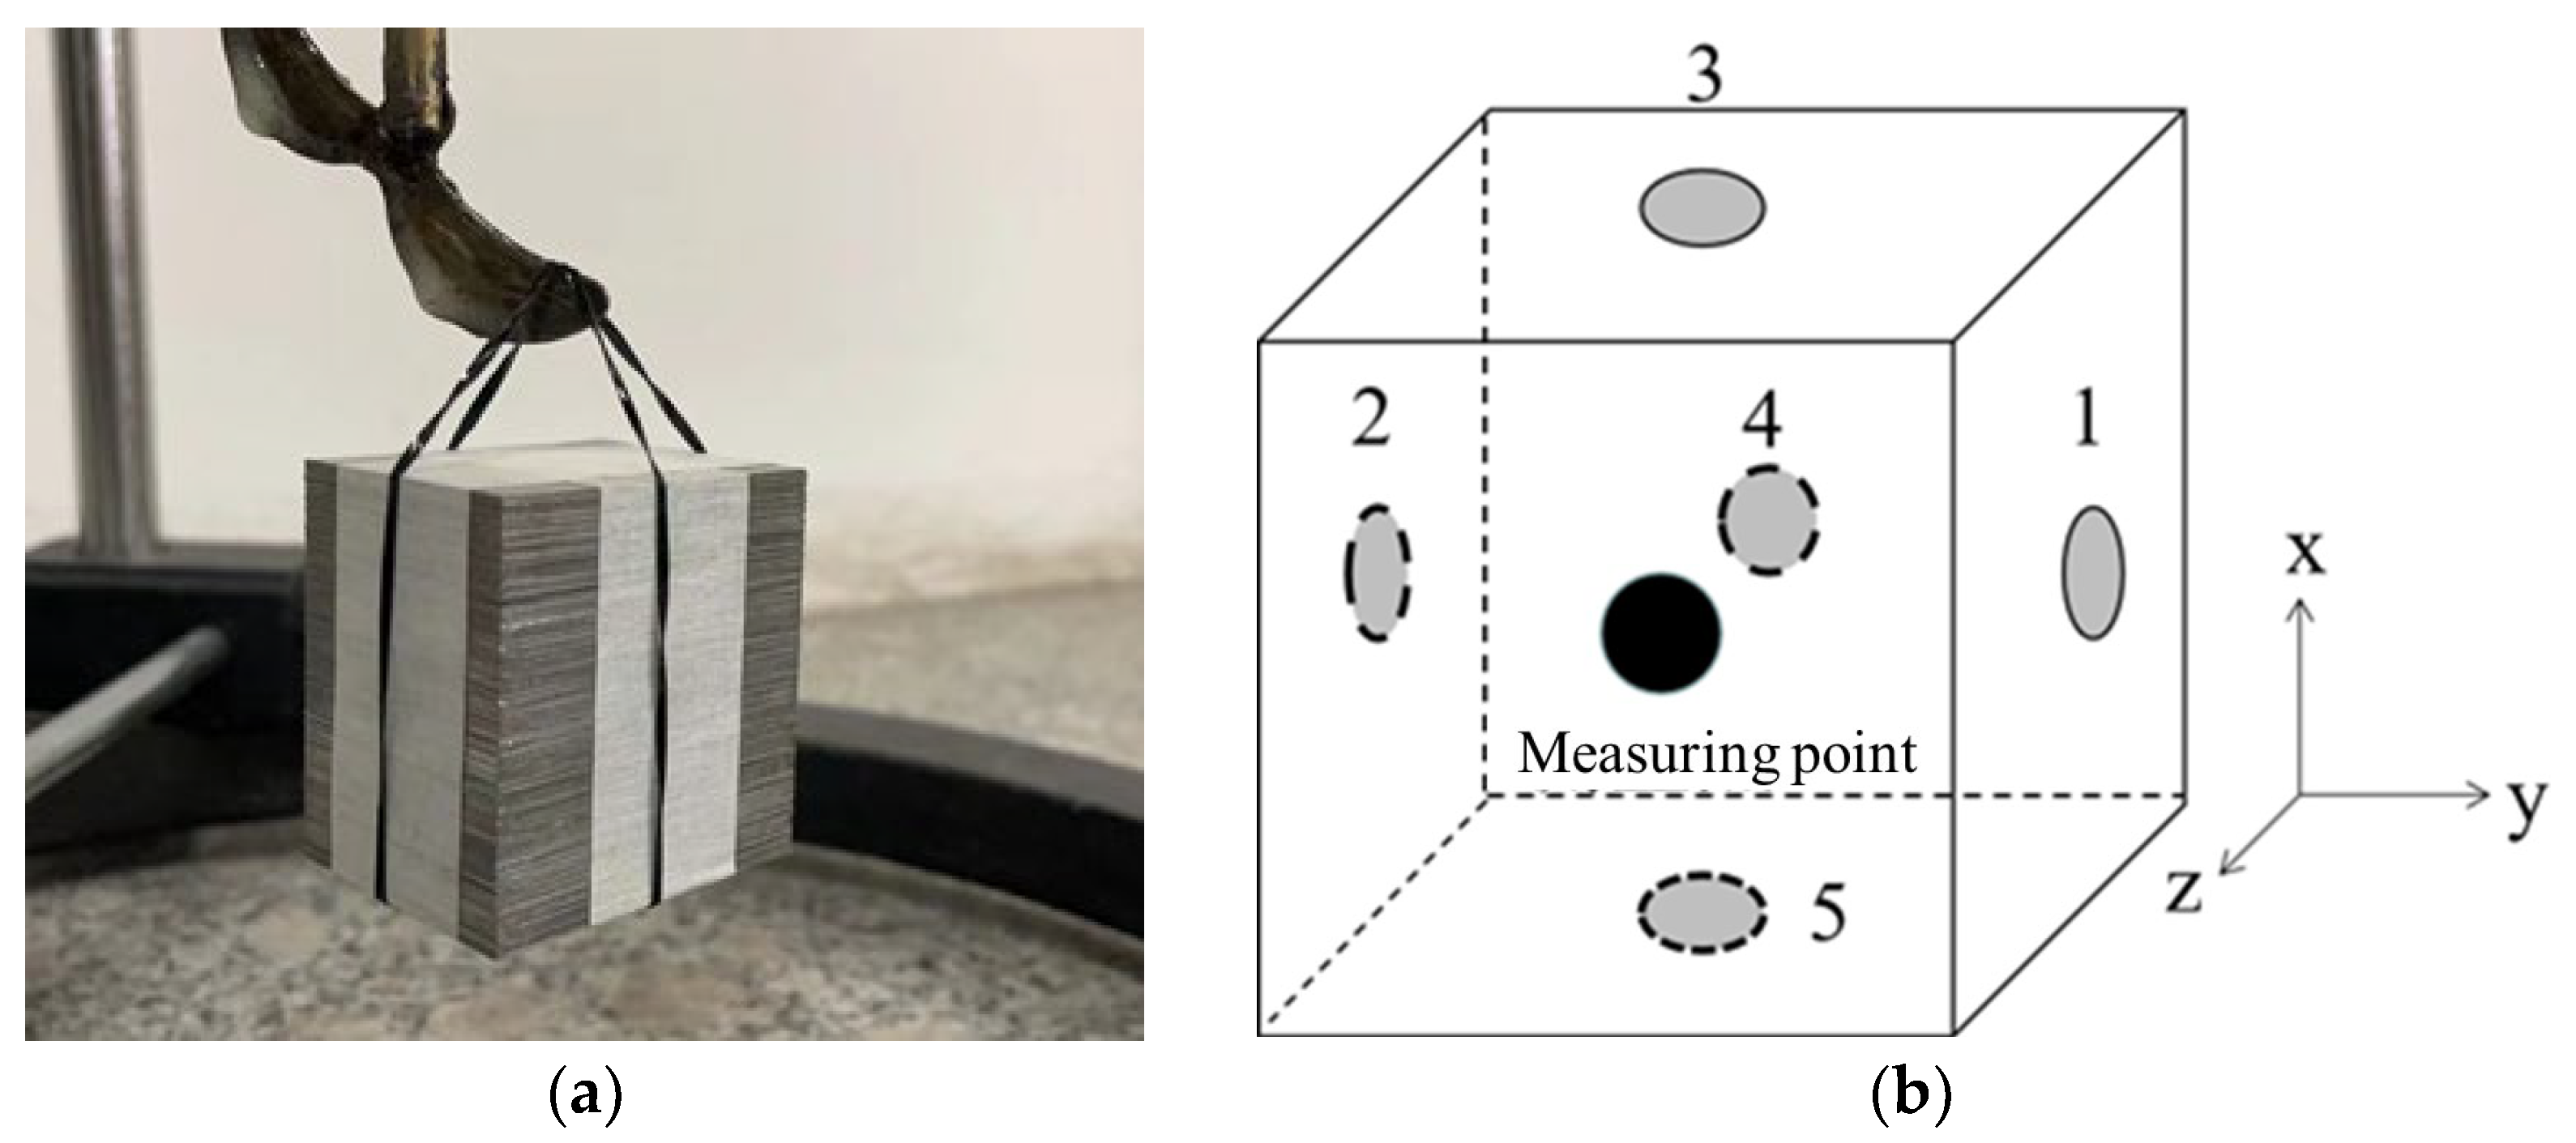
In the experiment, the natural frequency of the reactor core disc was measured by a single-point measurement and multi-point tapping methods. Due to the small size of a single core disc, in order to better obtain the natural frequency of core disc, the core disc was lifted by elastic rope in the laboratory. A sensor was installed on the side of the core disc and tapping points were evenly arranged around it. The experimental device and tapping point are shown in Figure 1. Black is the location of the measuring point; gray is the location of the tapping point.
At each tapping point, we tapped three times and took the average value of the three results to draw the frequency response curve of the tapping point. The natural frequency of the reactor core disc was obtained after processing the vibration signal.
In this paper, only natural frequencies within 2000 Hz are considered in the modal experimental measurement and simulation of reactor core disc, so only the first nine orders of core disc free modal are made. Table 2 shows the experimental results of the core disc free modal natural frequencies, and each order of reactor core disc natural frequencies can be seen.

2.2. Young’s Modulus Adjustment in the Core Disc Direction

The natural frequency of the reactor core disc was obtained through modal experiments, and the Young’s modulus of the core disc in the lamination direction was modified based on this. The initial values of the structural mechanical parameters of the iron core materials are shown in Table 3.
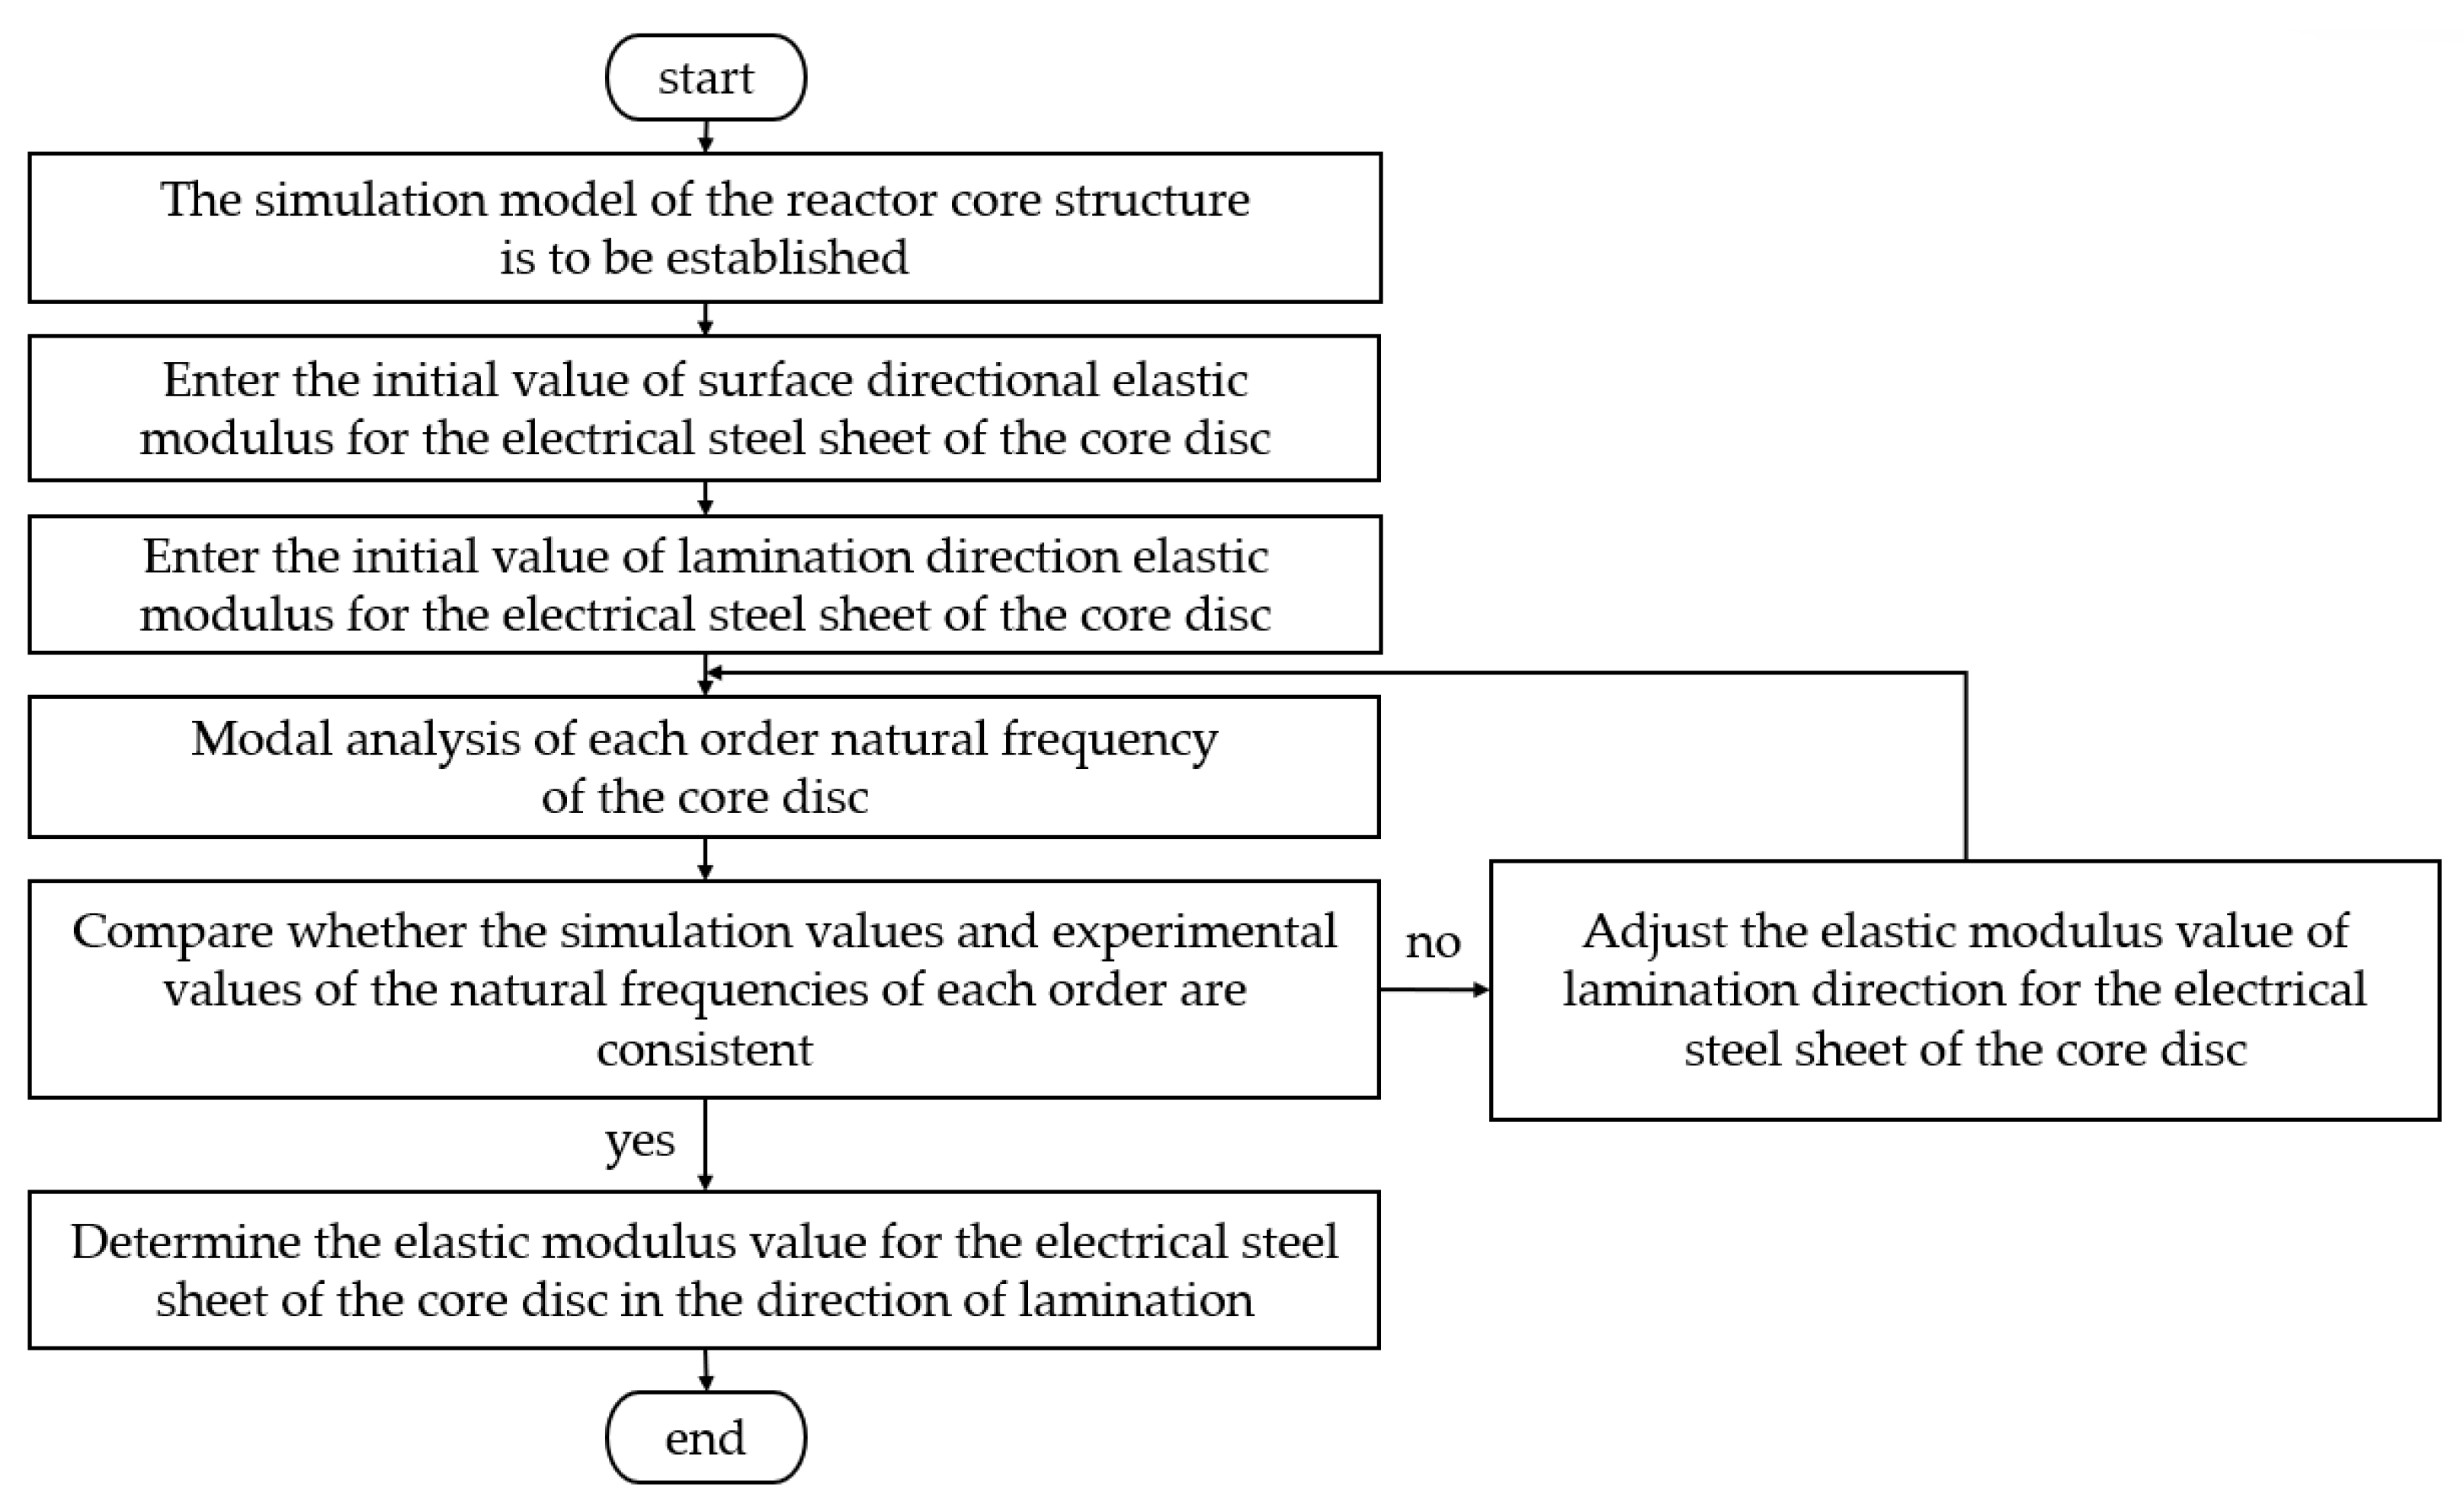
The present study employs the “modal experimental proofreading method” to determine the elastic modulus in the direction of the core lamination. The specific process of modal experimental proofreading method is as follows: first, the natural frequency of the reactor core disc was determined by the experimental measurement of free modal. Then, the reactor core disc was modeled, and its core material is set as an orthotropic material. By keeping the elastic modulus of the two directions in the laminated plane (assuming that the two directions in the plane are, respectively, x and y directions) unchanged, the elastic modulus of the reactor core disc in the laminated direction (assuming that it is z direction) is constantly adjusted, and the natural frequencies of the core disc model with different elastic modulus are calculated by simulation. Finally, the natural frequency calculated by the simulation is compared with the natural frequency measured in the experiment, and the elastic modulus in the z direction set by the simulation is found when the two are closest to each other, and this value is regarded as the elastic modulus in the direction of the actual reactor core disc lamination. The flow chart of the above process is shown in Figure 2.
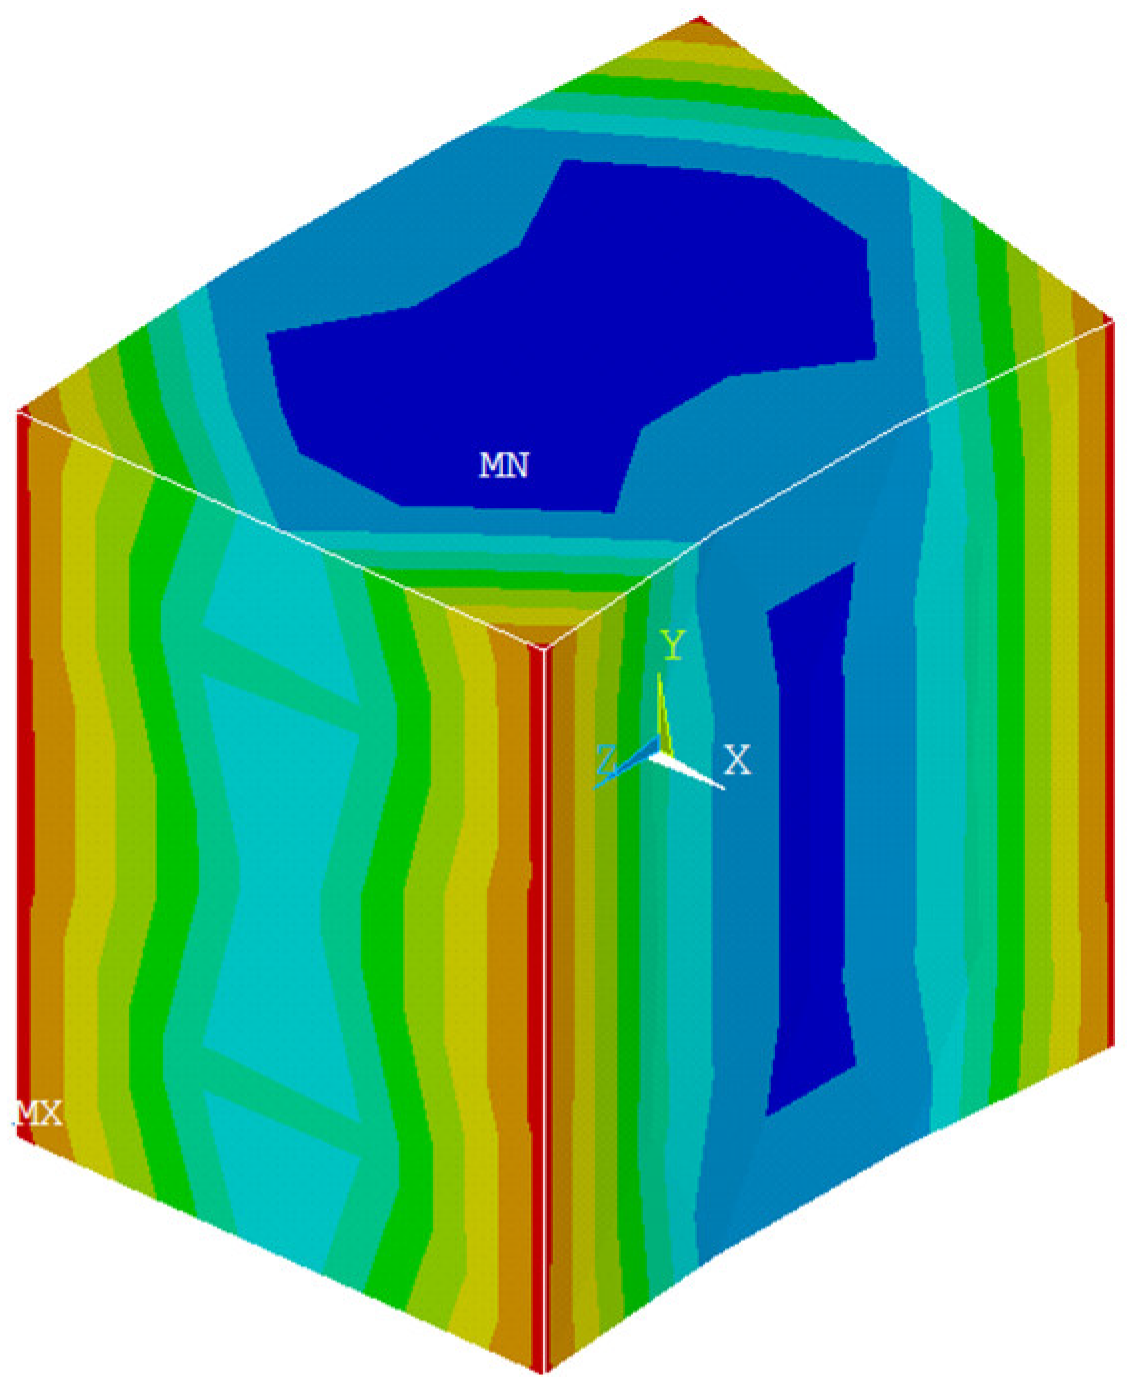
Based on the modal experimental proofreading method, the Young’s modulus and shear modulus of the lamination direction (z direction) in the modal analysis simulation are constantly adjusted by comparing with the natural frequency results of the reactor core disc modal experiment, so that the modal analysis results are close to the experimental results. Figure 3 shows the mode shape of the reactor core disc at a natural frequency of 840 Hz. In the figure, the red color part indicates the larger deformation, and the blue color part indicates the smaller deformation.
It is easy to see from the figure that in this mode, the four corners of vibration of the reactor core disc are larger than the middle vibration. The value of Young’s modulus after adjustment is shown in Table 4.
The modified elastic modulus was used for simulation calculations and the natural frequency of the core disc in the range of 2000 Hz was obtained; the simulation value was compared with the experimental value, as shown in Table 5.
It can be seen from the table that by adjusting the Young’s modulus and shear modulus of the core disc in the lamination direction of the reactor core disc modal simulation, the error between the simulation results of the reactor core disc and the natural frequency of the modal test is the largest at the seventh order, which is 8.75%.
The modal simulation is simplified on the fixed structure of the core disc. The comparison between the simulation results and the measured results demonstrates that the simplification of the vibration calculation model of the core disc has little impact on its modal results, while still accurately reflecting the vibration characteristics of the actual core disc. At the same time, the change of Young’s modulus and shear modulus in the lamination direction makes the results closer to the measured values. This lays a foundation for the follow-up study of reactor vibration performance closer to the actual situation.

3. Vibration Performance Analysis of Reactor Core

3.1. Establishment of Magnetic Mechanical Coupling Model of Iron Core Reactor

Under the action of magnetostrictive force and electromagnetic force, electrical equipment such as reactors will produce vibration. In order to study the electromagnetic vibration of reactors, it is necessary to couple the electromagnetic field with solid mechanics, and then solve the vibration of reactors under working conditions.
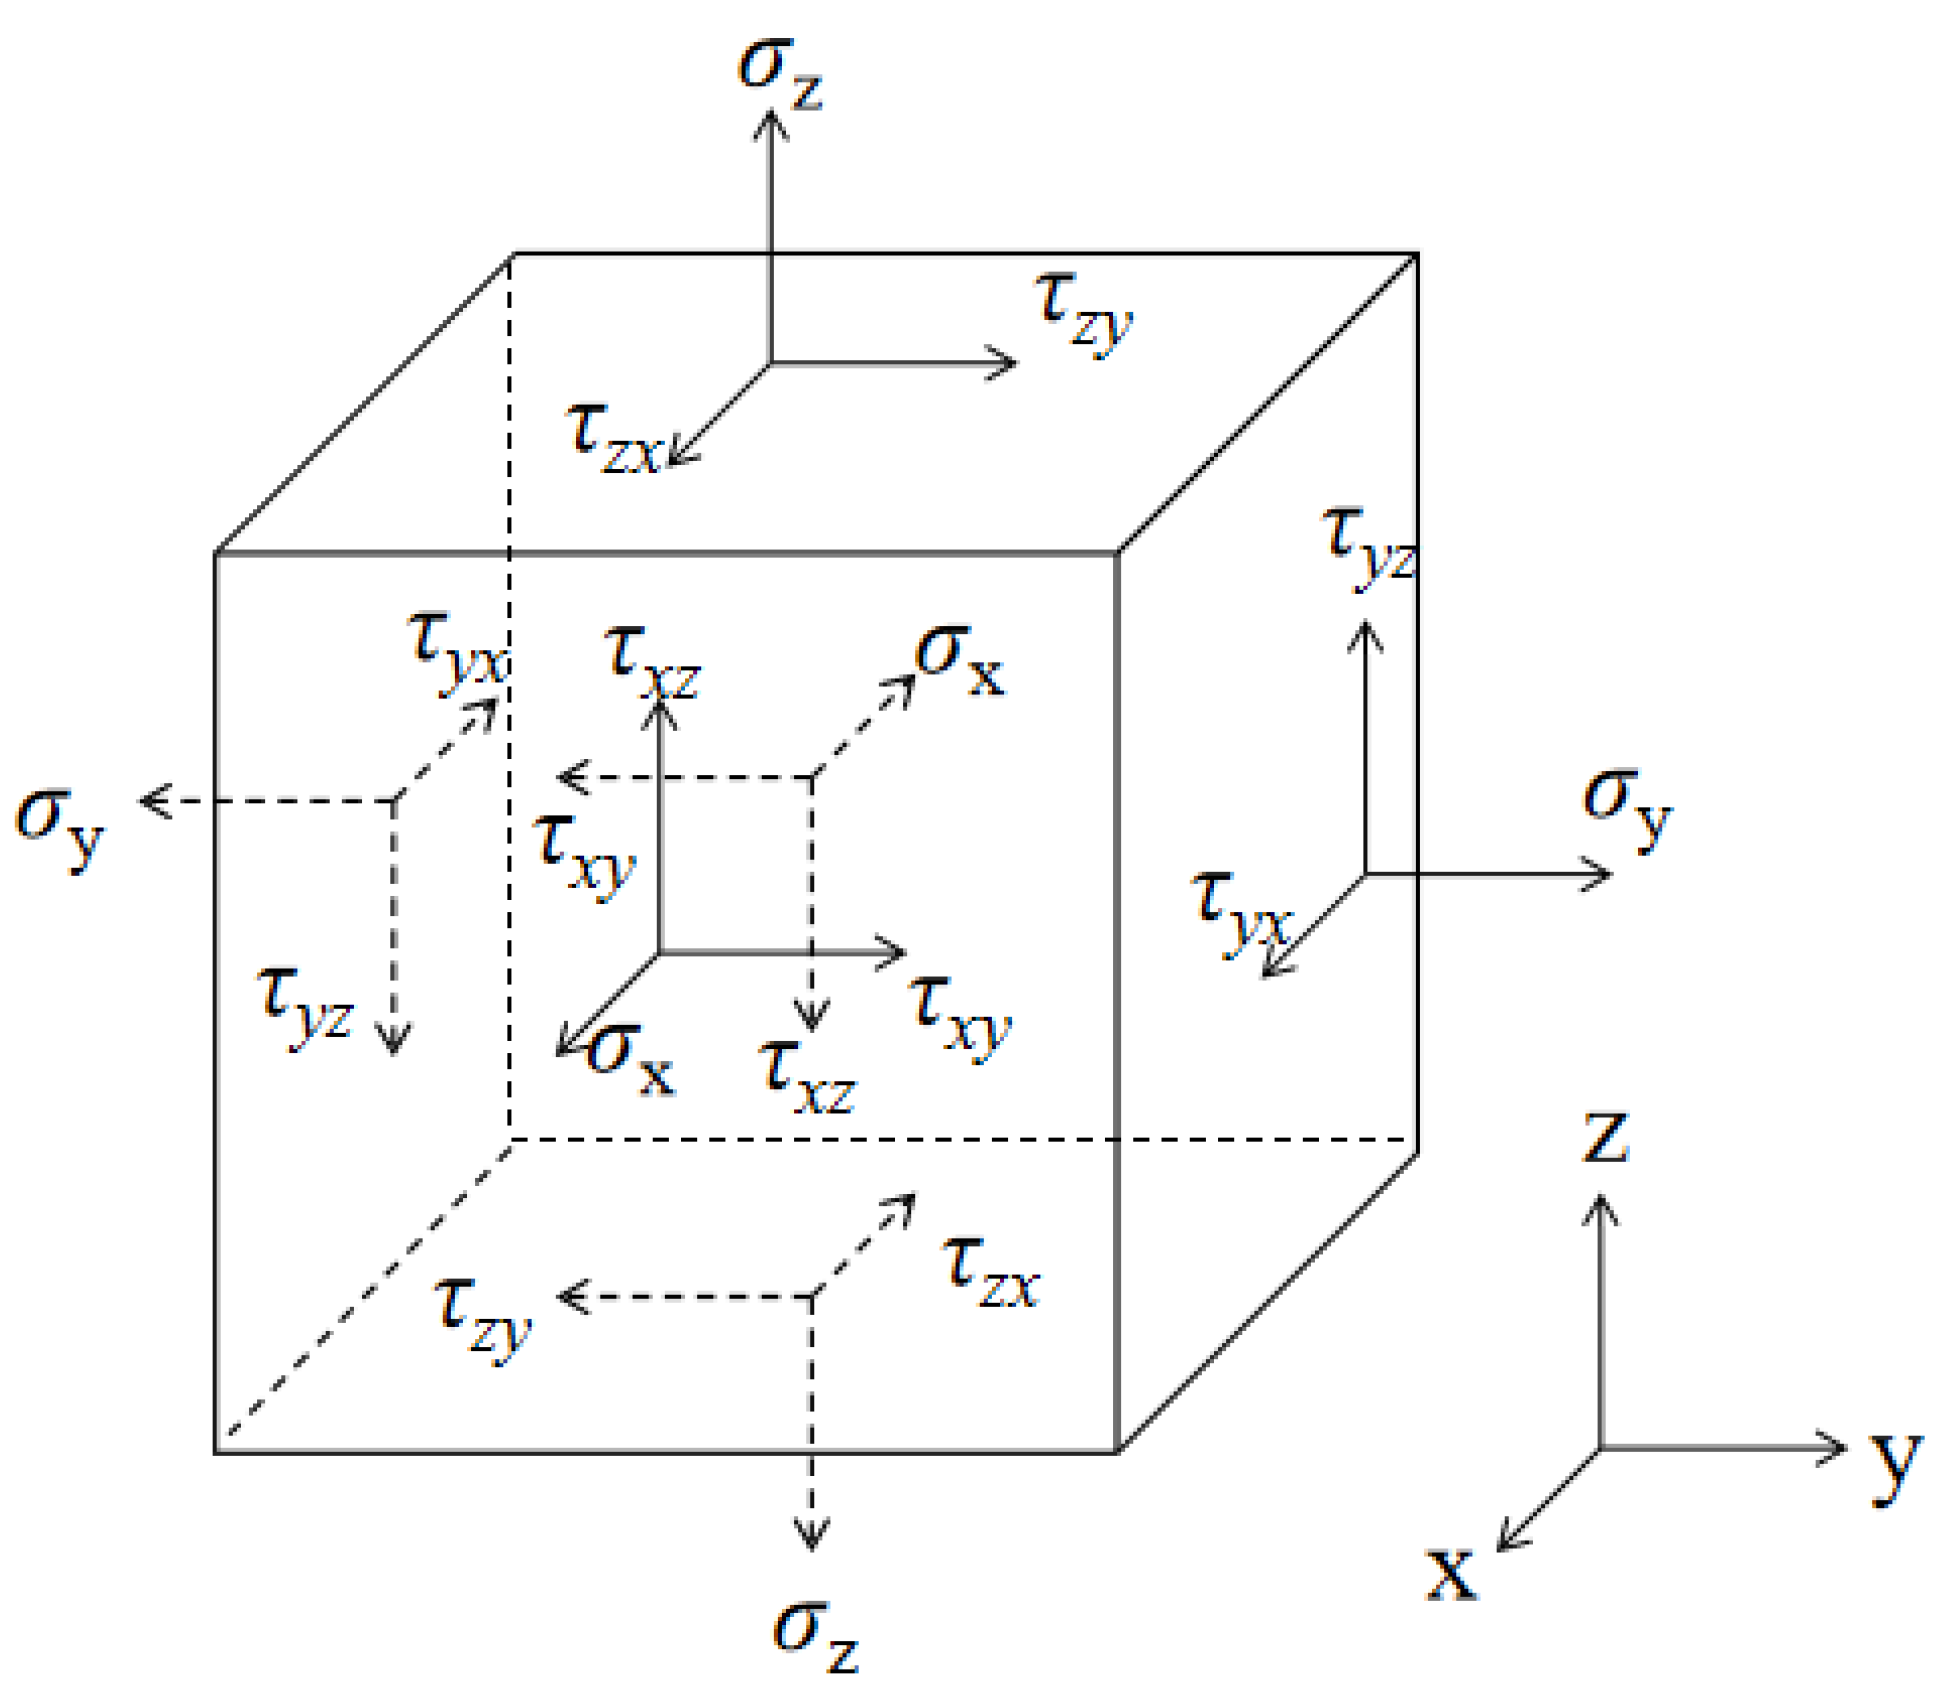
Stress and strain can describe the mechanical state of any continuum. When studying the stress state at a point in the object, the stress is usually decomposed into normal stress and shear stress, which are perpendicular to the action surface and parallel to the action surface. The stress tensor is generally used to represent the multiple directionality of the stress state at a point in the object. A tiny parallelepiped is taken around the point along the x, y, and z directions, as shown in Figure 4.
In Figure 4, the normal vectors of each side of the parallelepiped coincide with the three-dimensional coordinate axis, respectively. There are nine stress components in the six faces, namely the normal stress σx, σy, σz, and the shear stress τxy, τyx, τxz, τzx, τyz, τzy. According to the law of reciprocal shear force, τxy = −τyx, τxz = −τzx, τyz = −τzy, and the nine stress components can be reduced to six independent components. That is, the stress state at a certain point of the object is described by the normal stresses σx, σy, σz, and the shear stresses τxy, τyz, and τzx.
A non-contact force like electromagnetic force, gravity, and so on is a volumetric force acting on all particles inside an object. If the object is in equilibrium under the action of volume force, then the object is divided into arbitrary shape units, and the units are also in equilibrium. In elasticity, the equation describing the relationship between volume force and stress is called an equilibrium differential equation and is expressed in Equation (1).
σ x x + τ y x y + τ z x z + F x = 0 τ x y x + σ y y + τ z y z + F y = 0 τ x z x + τ y z y + σ z z + F z = 0
In the formula, the unit forces in the x, y, and z directions are represented by Fx, Fy, and Fz.
The length and thickness of the object will change after the force is exerted. Generally, the length is lengthened or shortened, and the thickness will become thinner or thicker. This deformation is described by strain. Similar to the method of studying stress, the strain at a point of an object can take three line segments along the x, y, z directions near the point. The elongation of the line segment is positive and the direction is the elongation direction, denoted by εx, εy, and εz. The right angle between line segments decreases to positive, and the direction is the direction in which the angle decreases, expressed by γxy, γyz, and γzx.
In elasticity, geometric equations are used to express the relationship between the strain and displacement of a stressed object. The displacement generated by the force object in space is decomposed into three directions x, y, and z along the coordinate axis, then the geometric equation is as shown in Equation (2).
ε x = u x , γ y z = w y + v z ε y = v y , γ z x = u z + w x ε z = w z , γ x y = v x + u y
where u, v, and w represent the displacement in the x, y, and z directions, respectively.
In order to describe the relationship between stress and strain in space objects, the constitutive equation of elastic materials is also needed, that is, the physical equation. In elasticity, the physical equation is expressed as Formula (3).
σ x σ y σ z τ x y τ y z τ z x = E 1 α 1 + α 1 2 α 1 α 1 α α 1 α 0 0 0 α 1 α 1 α 1 α 0 0 0 α 1 α α 1 α 1 0 0 0 0 0 0 1 2 α 2 1 α 0 0 0 0 0 0 1 2 α 2 1 α 0 0 0 0 0 0 1 2 α 2 1 α ε x ε y ε z γ x y γ y z γ z x
where E is the Young’s modulus of the material; α is Poisson’s ratio.
The potential energy of the current of the core reactor, the potential energy of the magnetic field and its boundary, the magnetostrictive energy, the strain energy, and the work force balance achieved by external forces are as follows (4):
I = Ω 1 0 B H · d B d Ω Ω 1 0 A J · d A d Ω Γ 1 0 A H × n d A d Γ + Ω 2 σ T · d H d Ω + Ω 2 0 ε σ · d ε d Ω Γ 2 f Γ · u d Γ Ω 2 f Ω · u d Ω
where, Ω1, Ω2, Γ1, and Γ2 are the analytical domains and boundaries of the electromagnetic field and the mechanical field; ƒΓ, ƒΩ are the outer surface force and outer volume force densities of the mechanical field. σT is the magnetostrictive stress under the external magnetic field; d is the magnetostrictive coefficient.
The reactor is stationary when it works; it is balanced by gravity and supporting forces, and the reactor can be regarded as not subject to external forces, namely:
Γ 2 f Γ · u d Γ Ω 2 f Ω · u d Ω = 0
I = Ω 1 1 2 H · B d Ω Ω 1 A · J d Ω + Ω 2 σ T · d H d Ω + Ω 2 1 2 σ · ε d Ω
Formula (6) is expanded according to Formula (3) to get Formula (7):
I = Ω 1 1 2 v B x 2 + B y 2 + B z 2 d x d y d z Ω 1 A x J x + A y J y + A z J z d x d y d z + E Ω 2 d v B x ε x + d v B y ε y + d v B z ε z d x d y d z + Ω 2 E 1 α 1 + α 1 2 α ε x 2 + ε y 2 + ε z 2 + 2 α 1 α ε x ε y + ε x ε z + ε y ε z + 1 2 α 2 1 α γ x y 2 + γ y z 2 + γ z x 2 d x d y d z
The relationship between vector magnetic potential and magnetic flux density is as follows (8):
B x = A z y A y z B y = A x z A z x B z = A y x A x y
Node vector magnetic potential and vibration displacement are as follows (9):
I A j i = e I e A j i e = 0 i = 1 , 2 , m ; j = x , y , z I u j i = e I e u j i e = 0 i = 1 , 2 , n ; j = x , y , z
where, m and n are the nodes of the electromagnetic field and the mechanical field.
The finite element matrix equation can be obtained, which can be expressed as:
K X = F
where, K is the stiffness matrix; X is the column matrix of vector magnetic potential A and vibration displacement u; F is the column matrix of impressed current density and external force density. The vector magnetic potential A and vibration displacement u of the reactor core can be obtained by solving the finite element matrix equation.

3.2. Comparative Analysis of Simulation Results of Core Reactors under Different Prestrains

The vibration of the reactor core is the primary contributing factor to the overall reactor vibration, and the electromagnetic force between the core discs induces mutual attraction, leading to deformation. Next, the magnetic mechanical coupling model of core reactors considering the elastic modulus in the direction of core disc lamination and different pre strains will be established, and the core reactor with a rated current of 28 A will be simulated and analyzed. The core simulation model of the reactor is shown in Figure 5.
The specific size and material of the iron core are as follows: the length of the upper and lower iron yoke is 180 mm, the height is 30 mm, and the thickness is 40 mm. The core disc is 40 mm long, 30 mm high, and 40 mm thick, and the upper and lower iron yoke and core disc are oriented electrical steel sheet 30Q120. There are 12 square air gaps between the core disc and the upper and lower yoke as well as between the core disc. Each air gap has a side length of 40 mm and a thickness of 1 mm. The material of the air gap is epoxying laminated glass cloth plate.
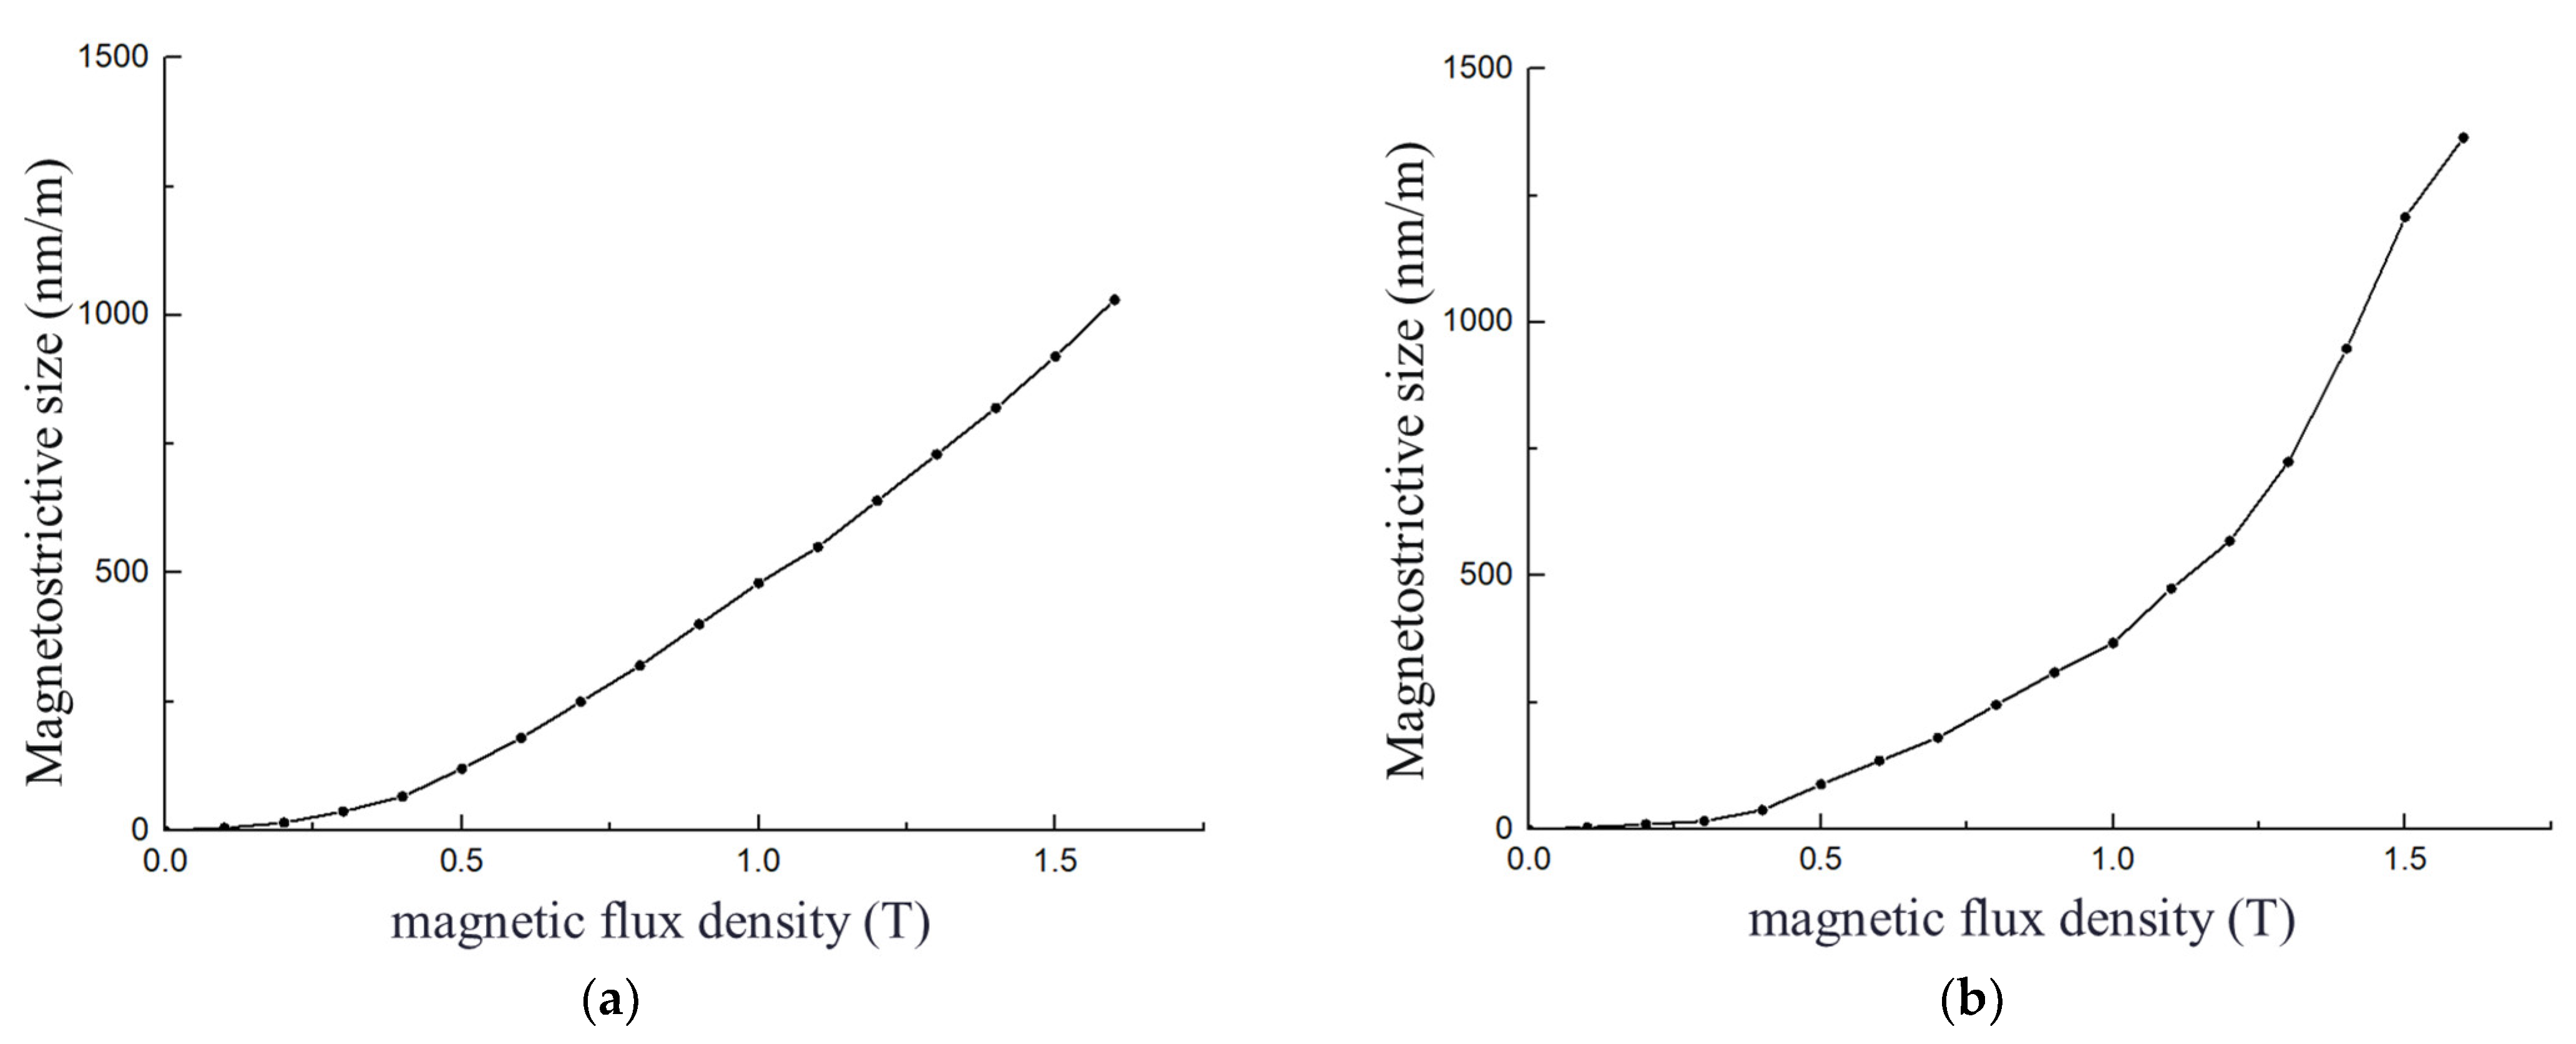
In order to describe the magnetostrictive effect accurately and effectively in the simulation software, it is necessary to set the prestrain on the material properties of the electrical steel sheet of the reactor core and core disc. The magnetostrictive measuring instrument was used to measure the materials of oriented electrical steel 30Q120 and non-oriented electrical steel 50AW40 several times. After taking the average of the multiple measurement results, the cubic spline interpolation method was used to fit. The results of curve fitting are shown in Figure 6.
In order to enhance the accuracy and effectiveness of modeling and simulating vibrations in a core reactor, the Young’s modulus of the core disc stacking direction was adjusted using the modal experimental verification method. The final modified orthogonal anisotropic structural mechanical parameters of the core disc are presented in Table 4.
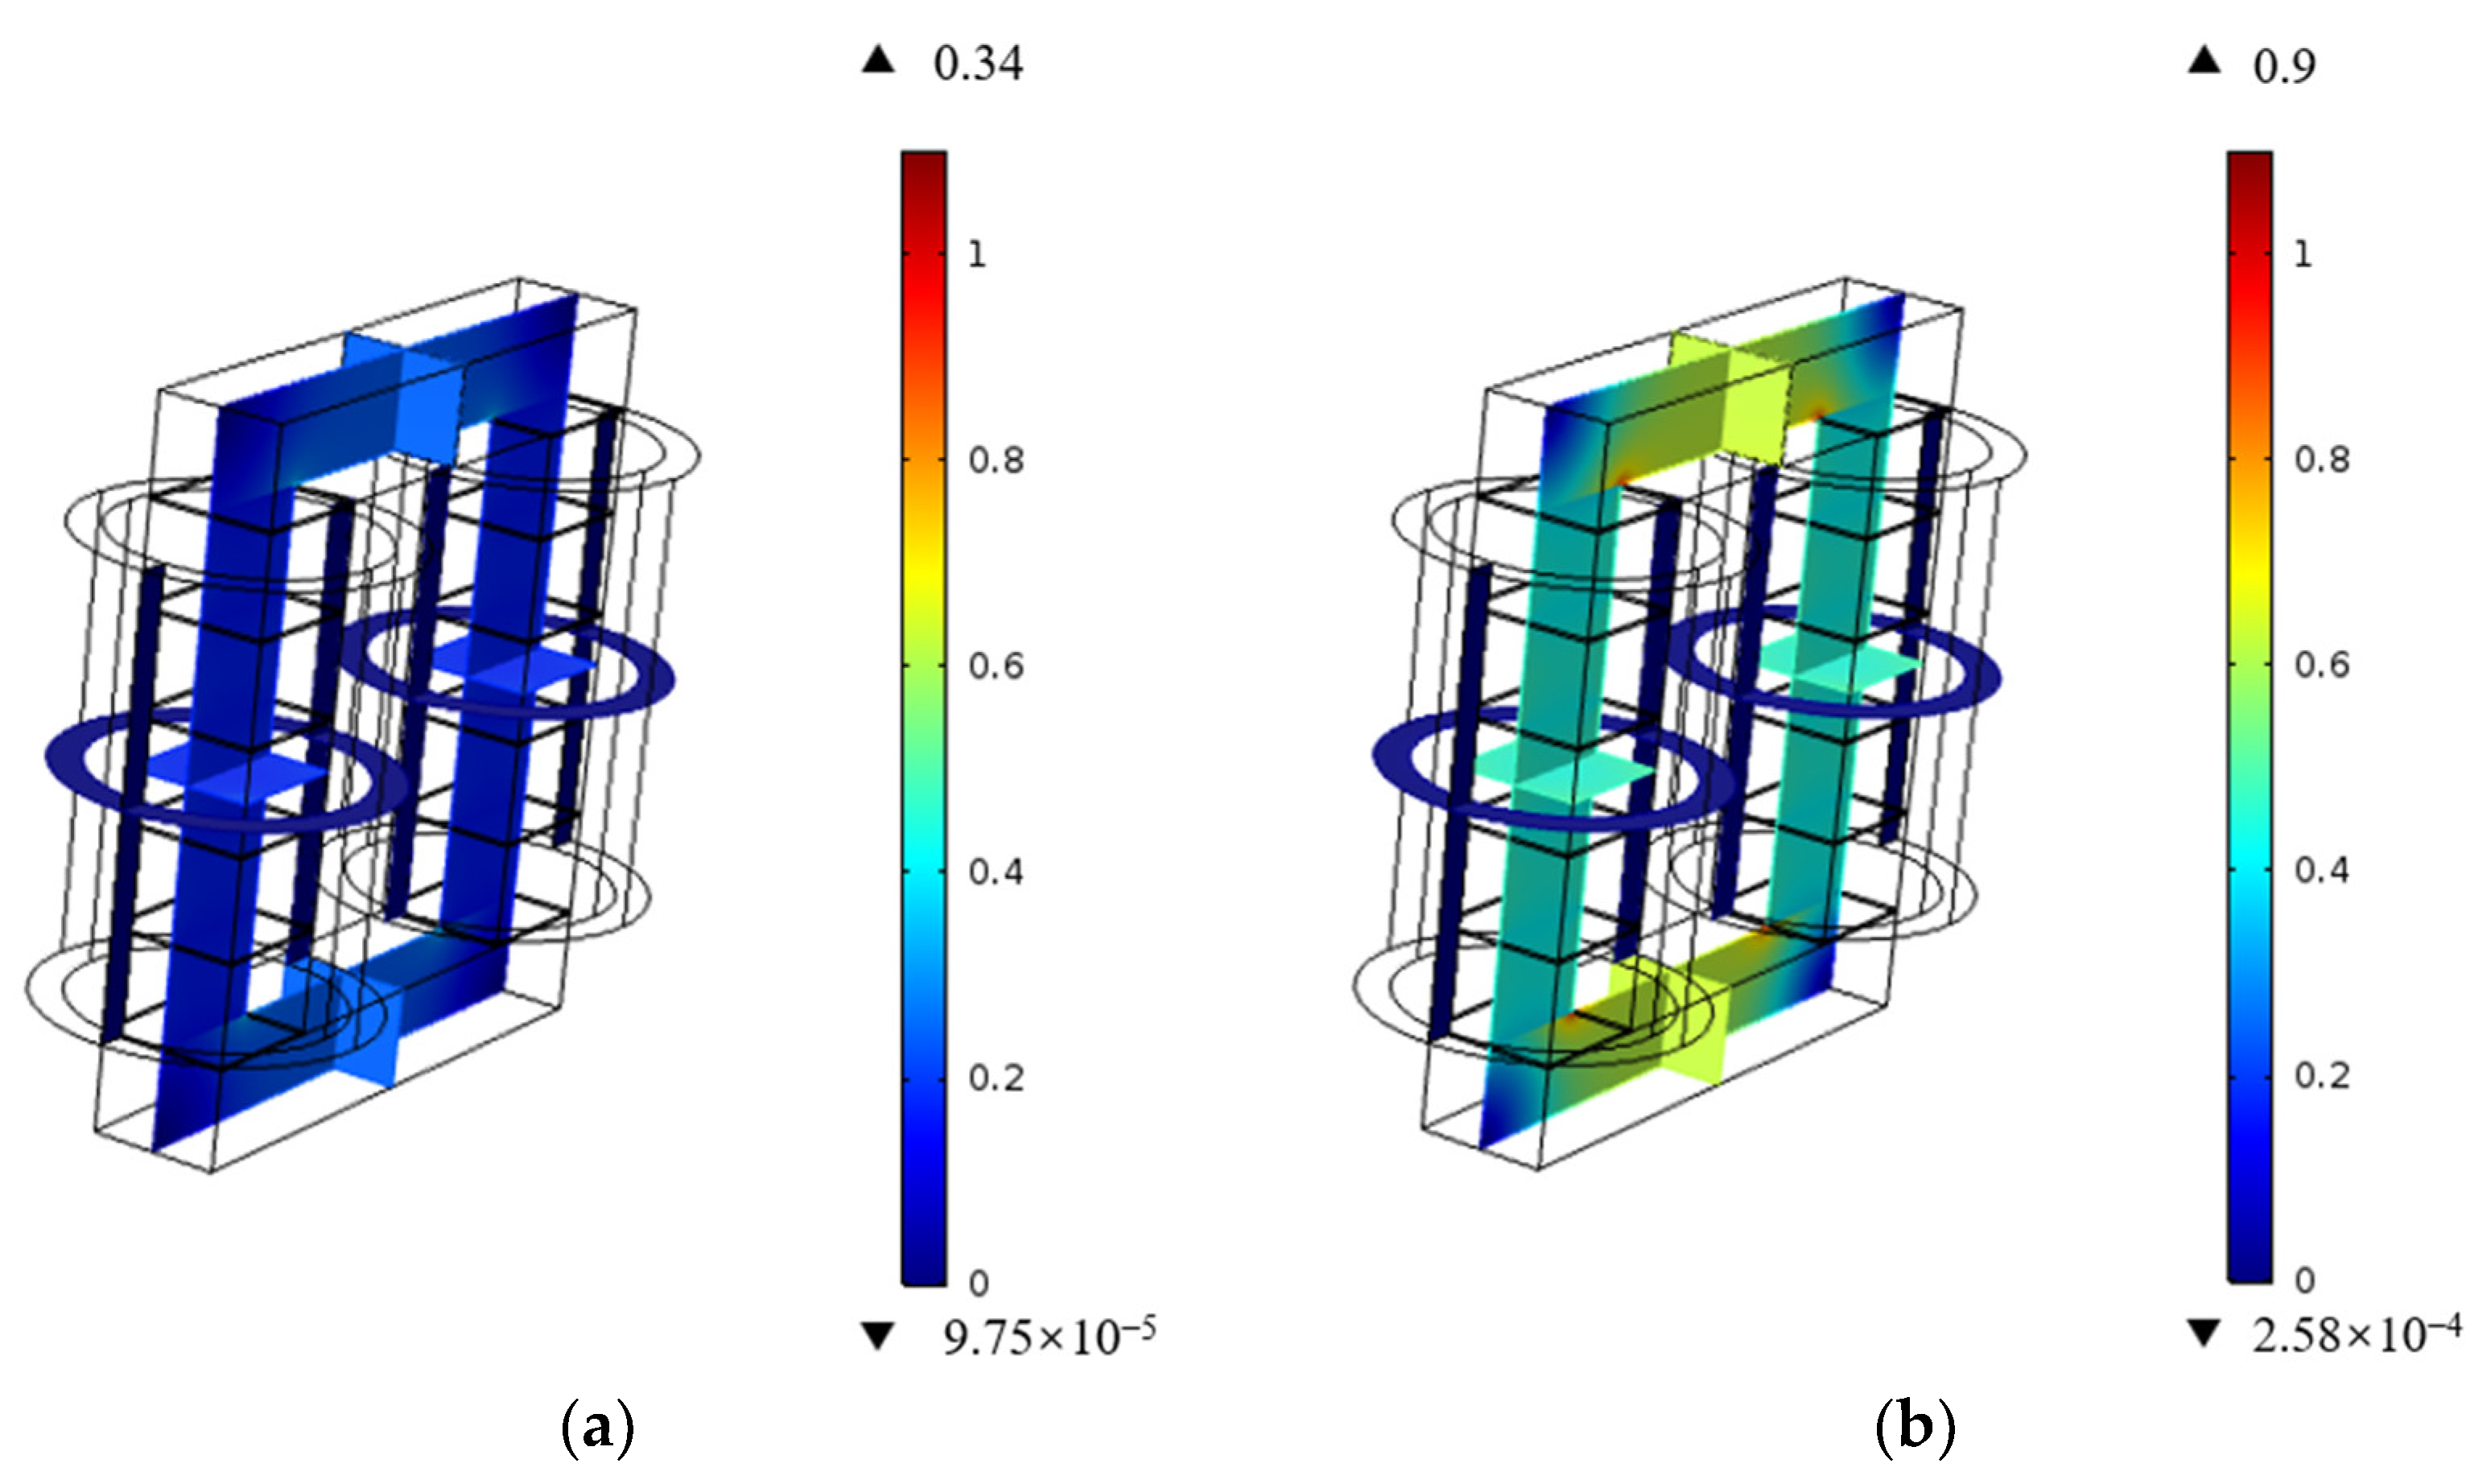
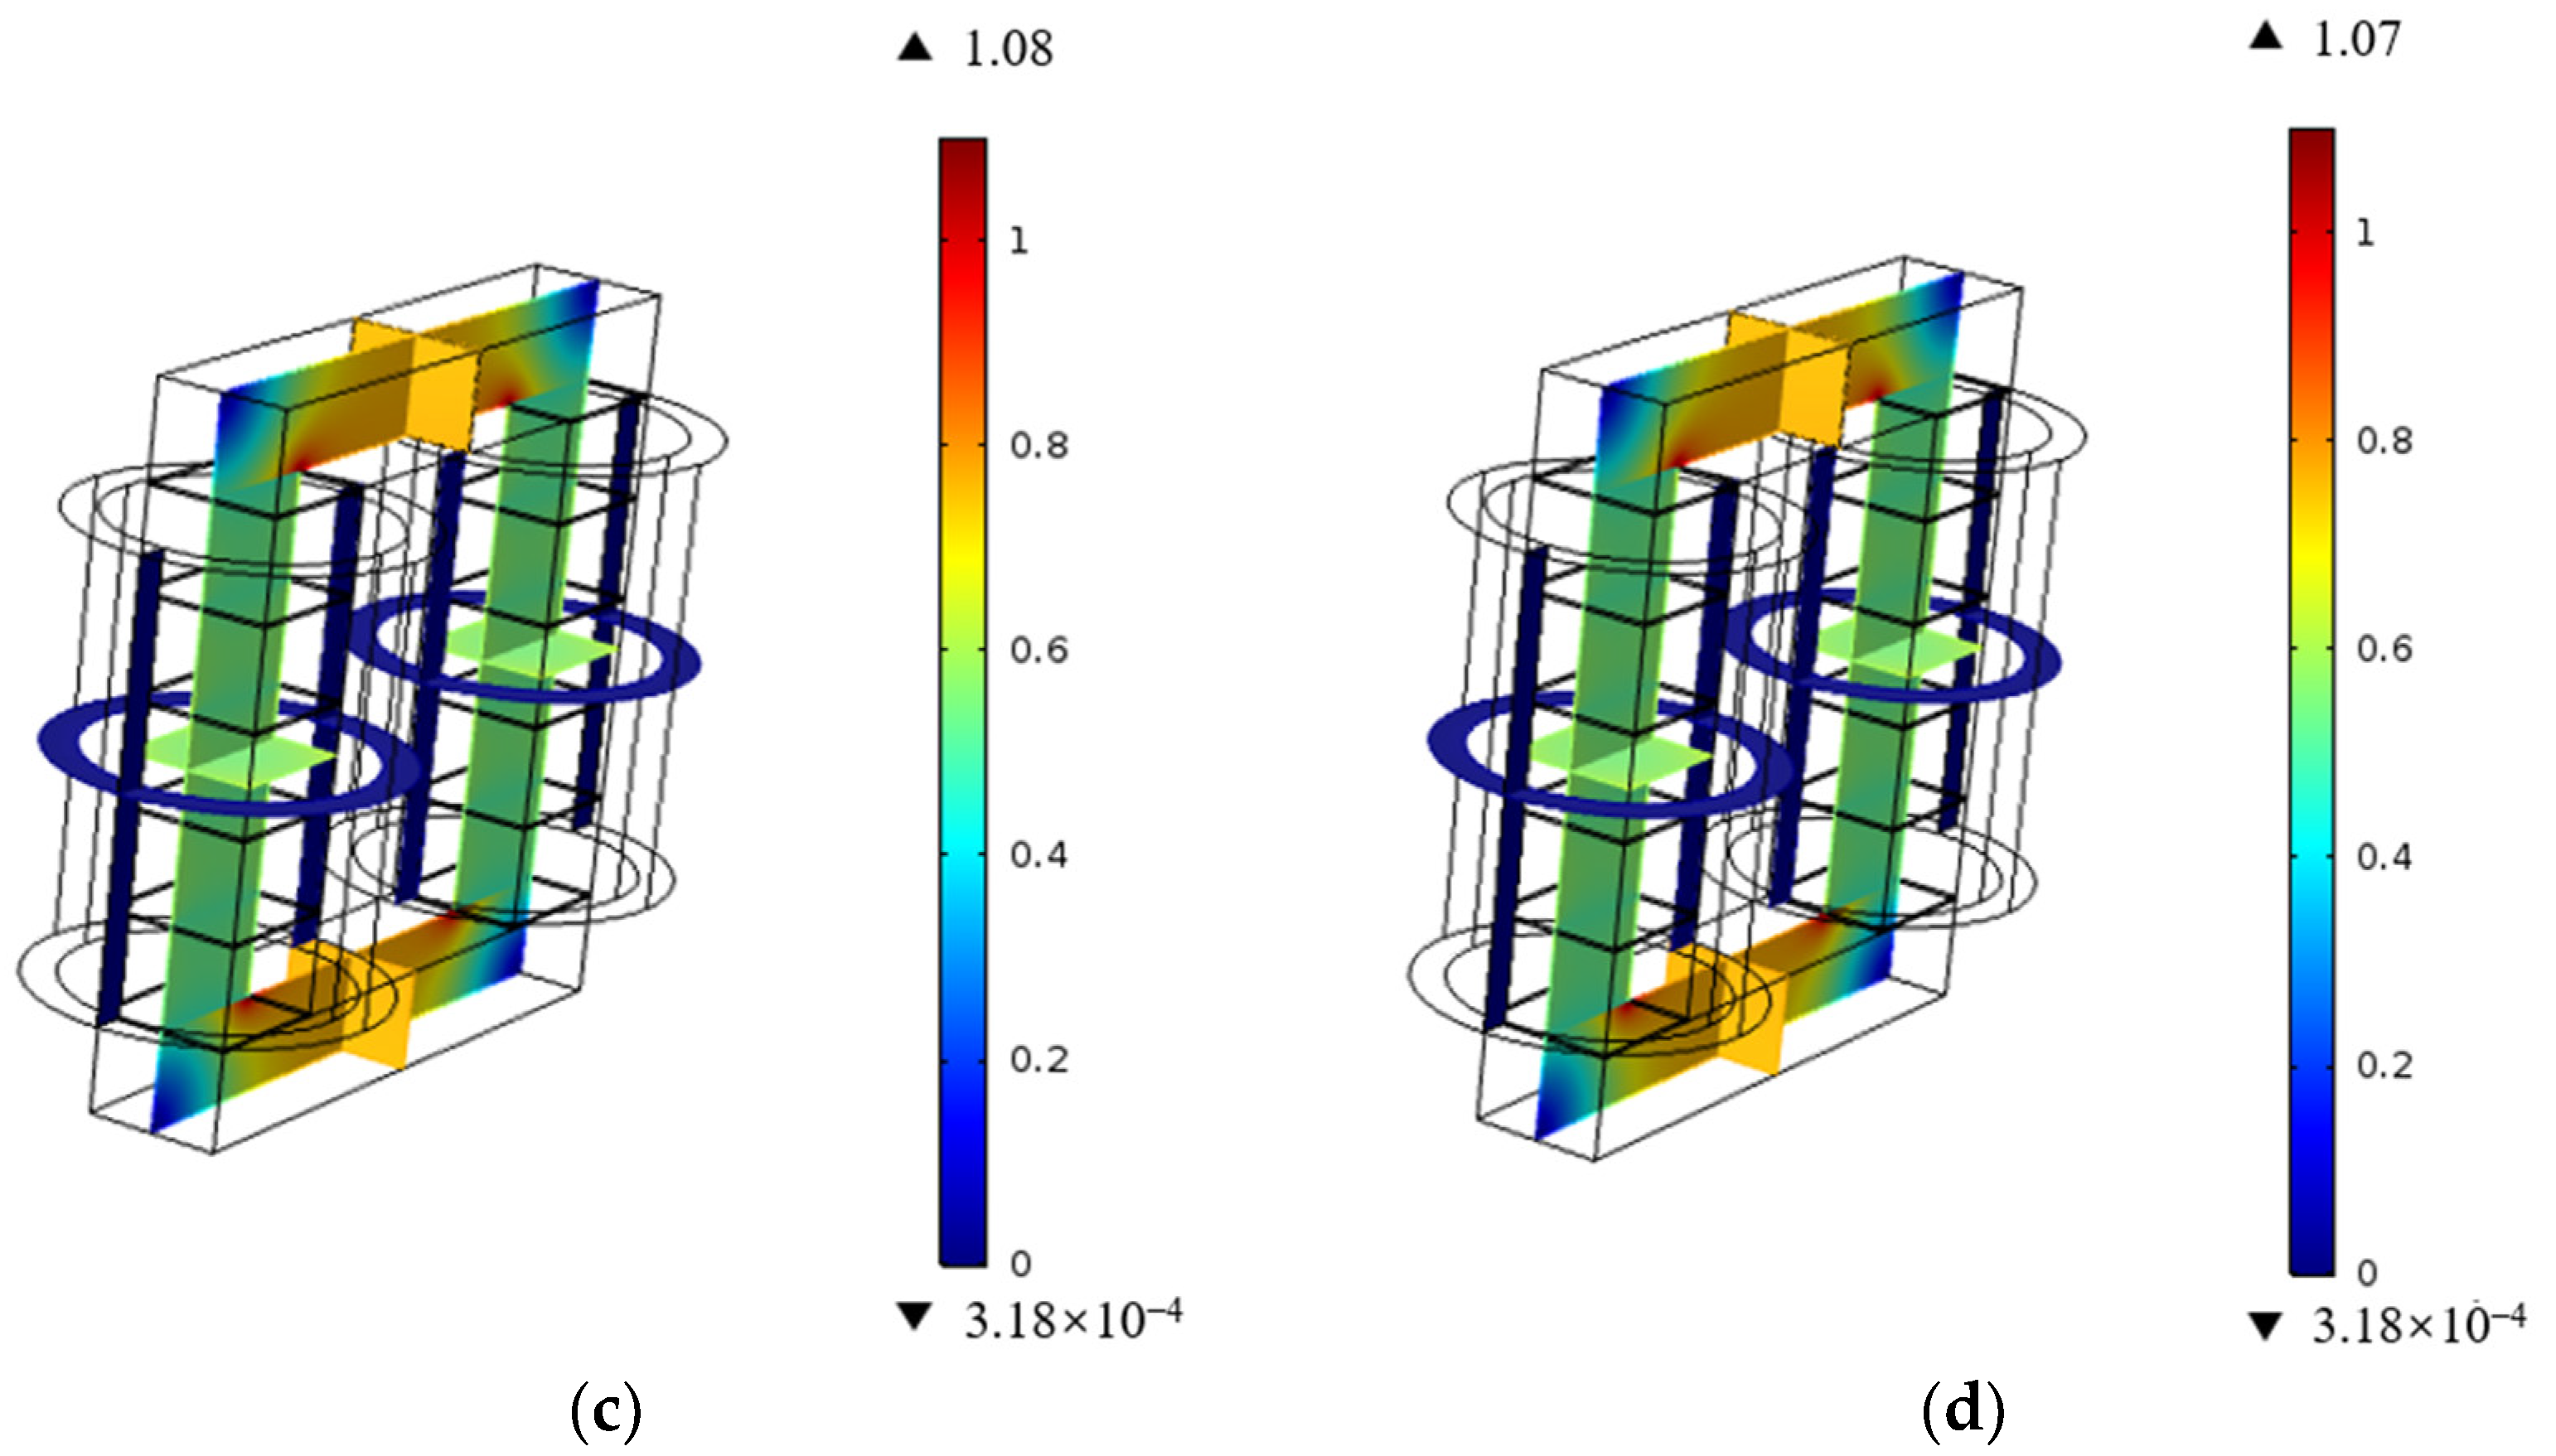
When current excitation is applied to the reactor, the coil is set to uniform multiple turns and a 50 Hz 28A sinusoidal current is applied to the winding. Figure 7a–d shows the distribution of the magnetic flux density modulus of the reactor core when t is 0.004 s, 0.008 s, 0.01 s, and 0.02 s, respectively.
It can be seen that the current sizes of the four moments are different, and the magnetic flux density modulus are also different. When t = 0.004 s, the maximum flux density modulus is 0.34 T, and when t = 0.01, the maximum flux is 1.08 T, and the maximum flux is at the upper and lower yoke corners of the core. Due to the significant air gap at the core disc, the magnetic flux density modulus value is not large, which is half of the maximum magnetic flux density modulus value at the corresponding time.
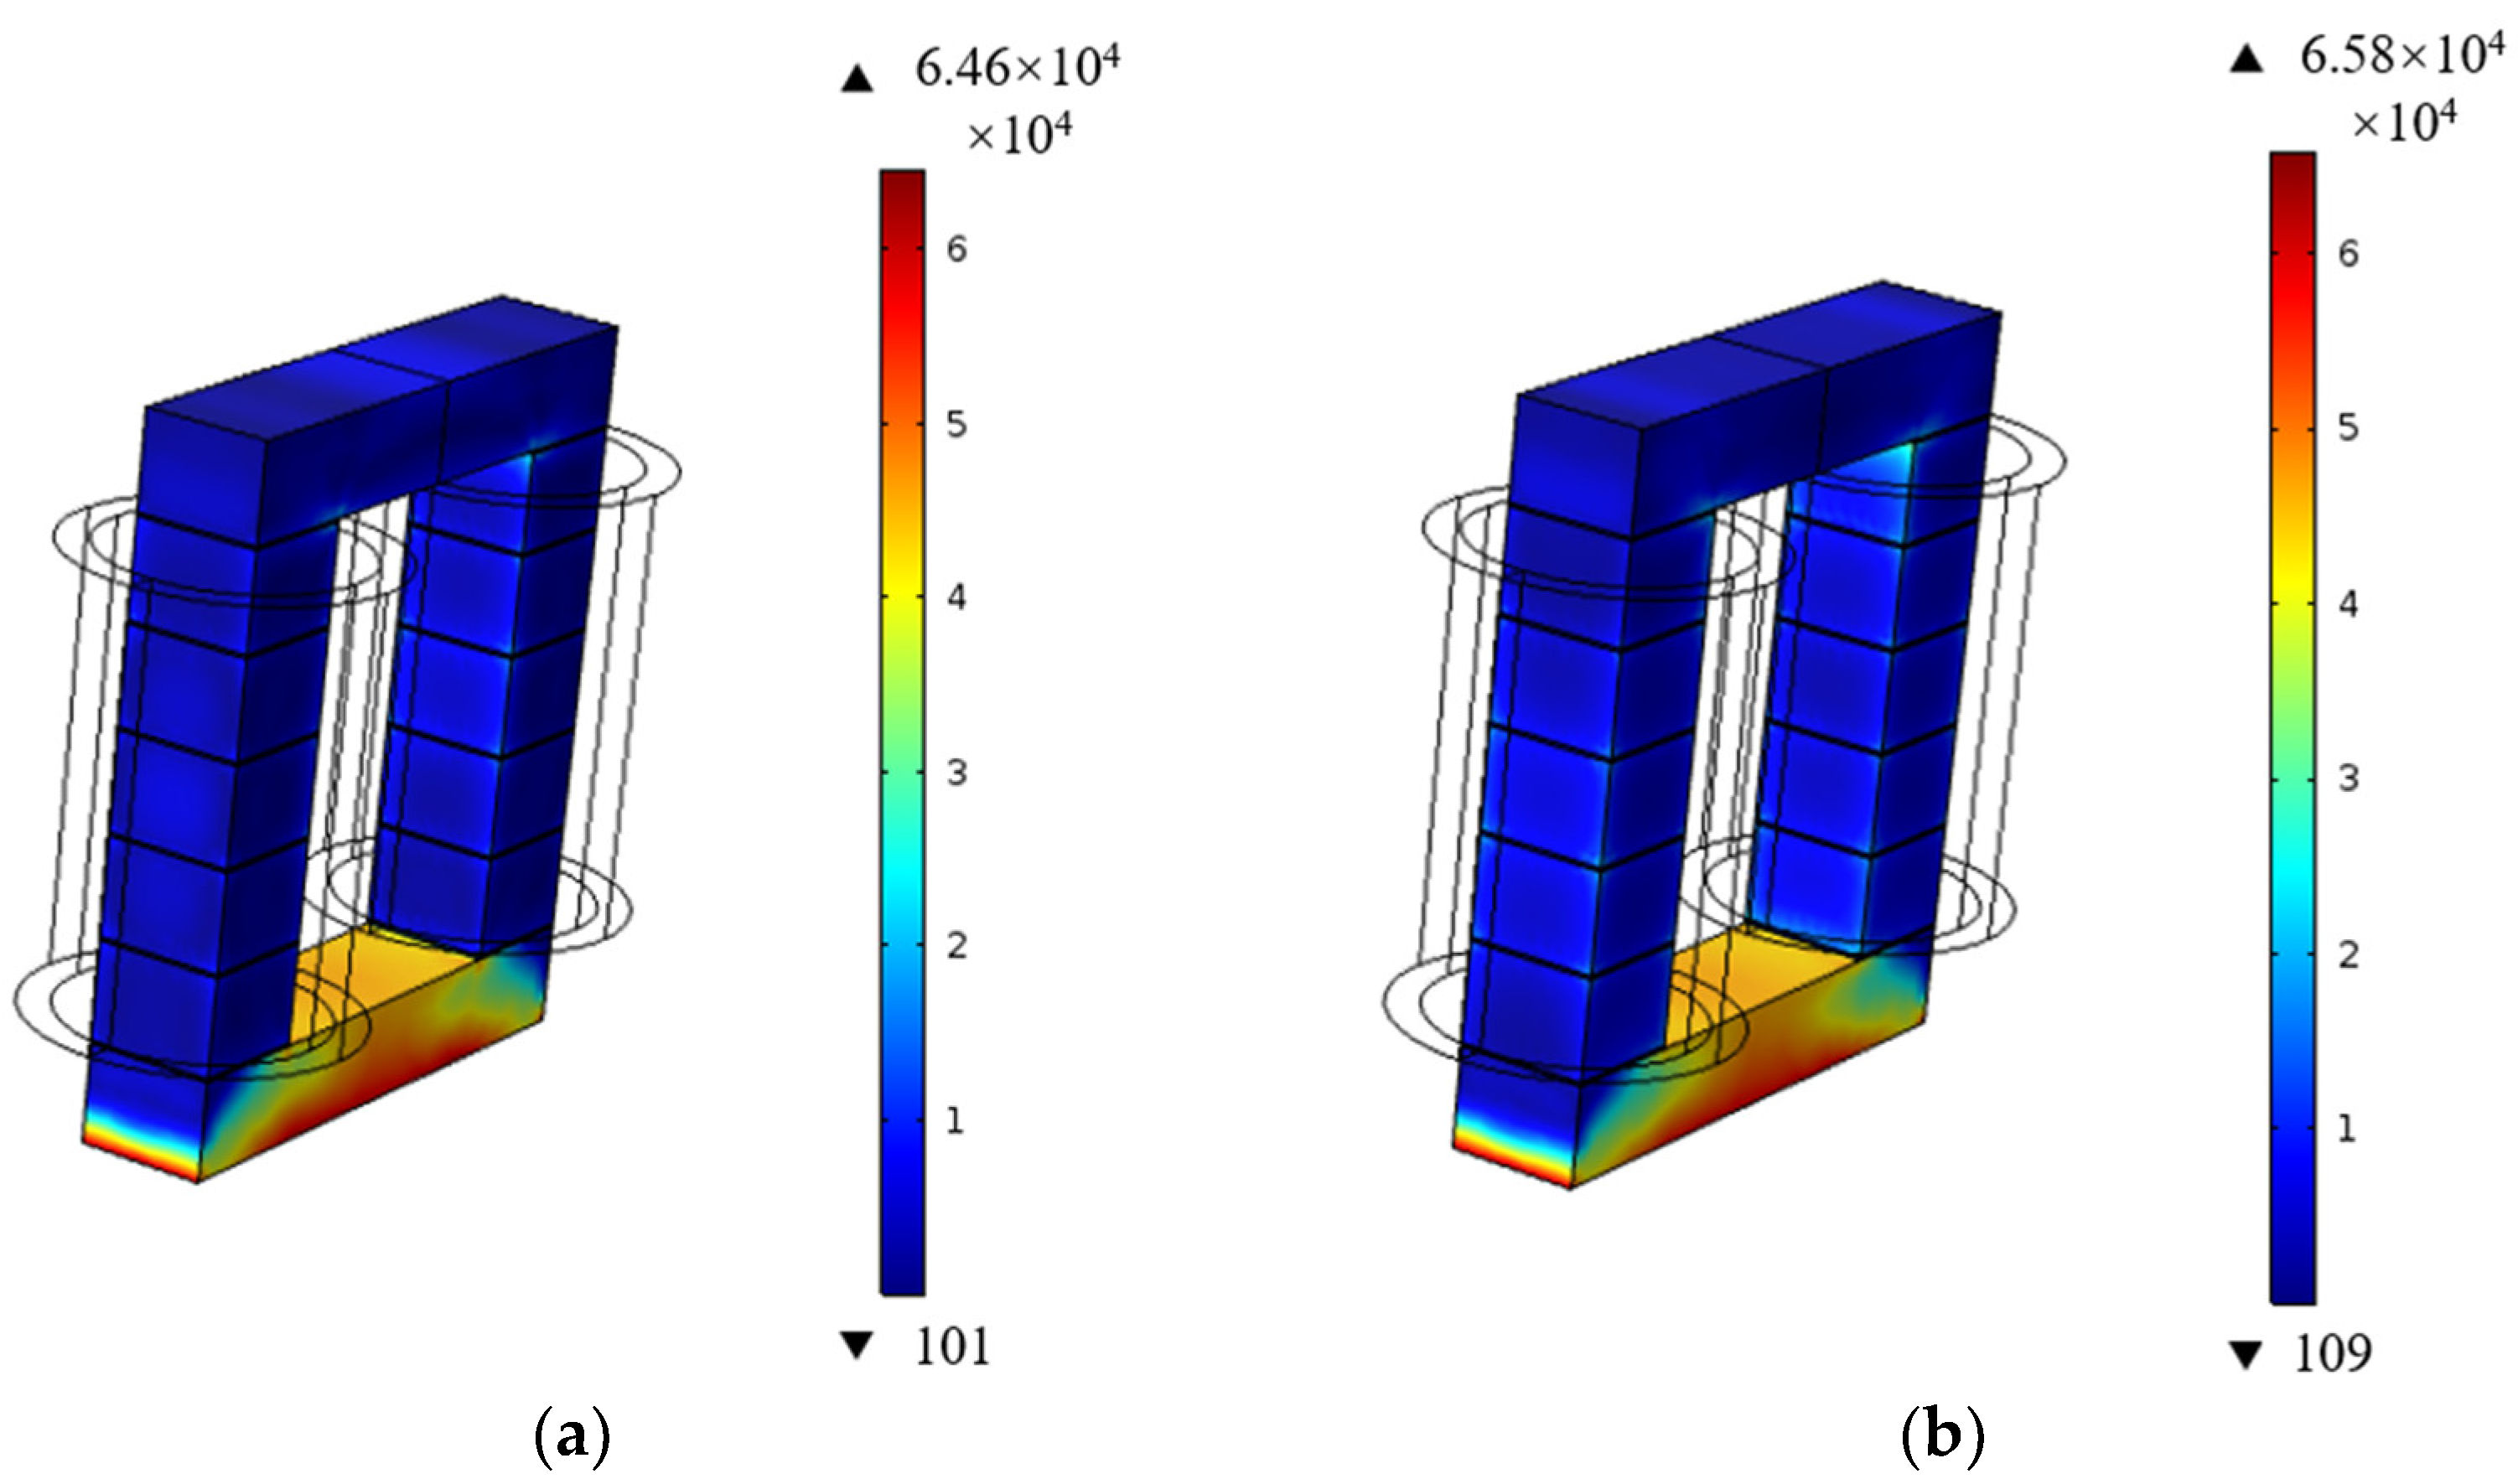
In order to explore the contribution of electromagnetic force and magnetostriction to the reactor vibration, the force distribution diagram of the iron core under the combined action of them is shown in Figure 8, when t = 0.004 s and t = 0.01 s. It can be seen from Figure 8 that the reactor is subjected to different stresses at different times. At t = 0.004 s, the force is measured to be 6.46 × 10⁴ N/m2, while at t = 0.01 s, it increases to 6.58 × 10⁴ N/m2, indicating a larger force magnitude. Compared with Figure 7, it is found that when t = 0.004 s, the magnetic flux density is small, and the force is small. When t = 0.01 s, the magnetic flux density is larger, and the force on the reactor is also larger; so, the force on the reactor is closely related to the magnetic field distribution.
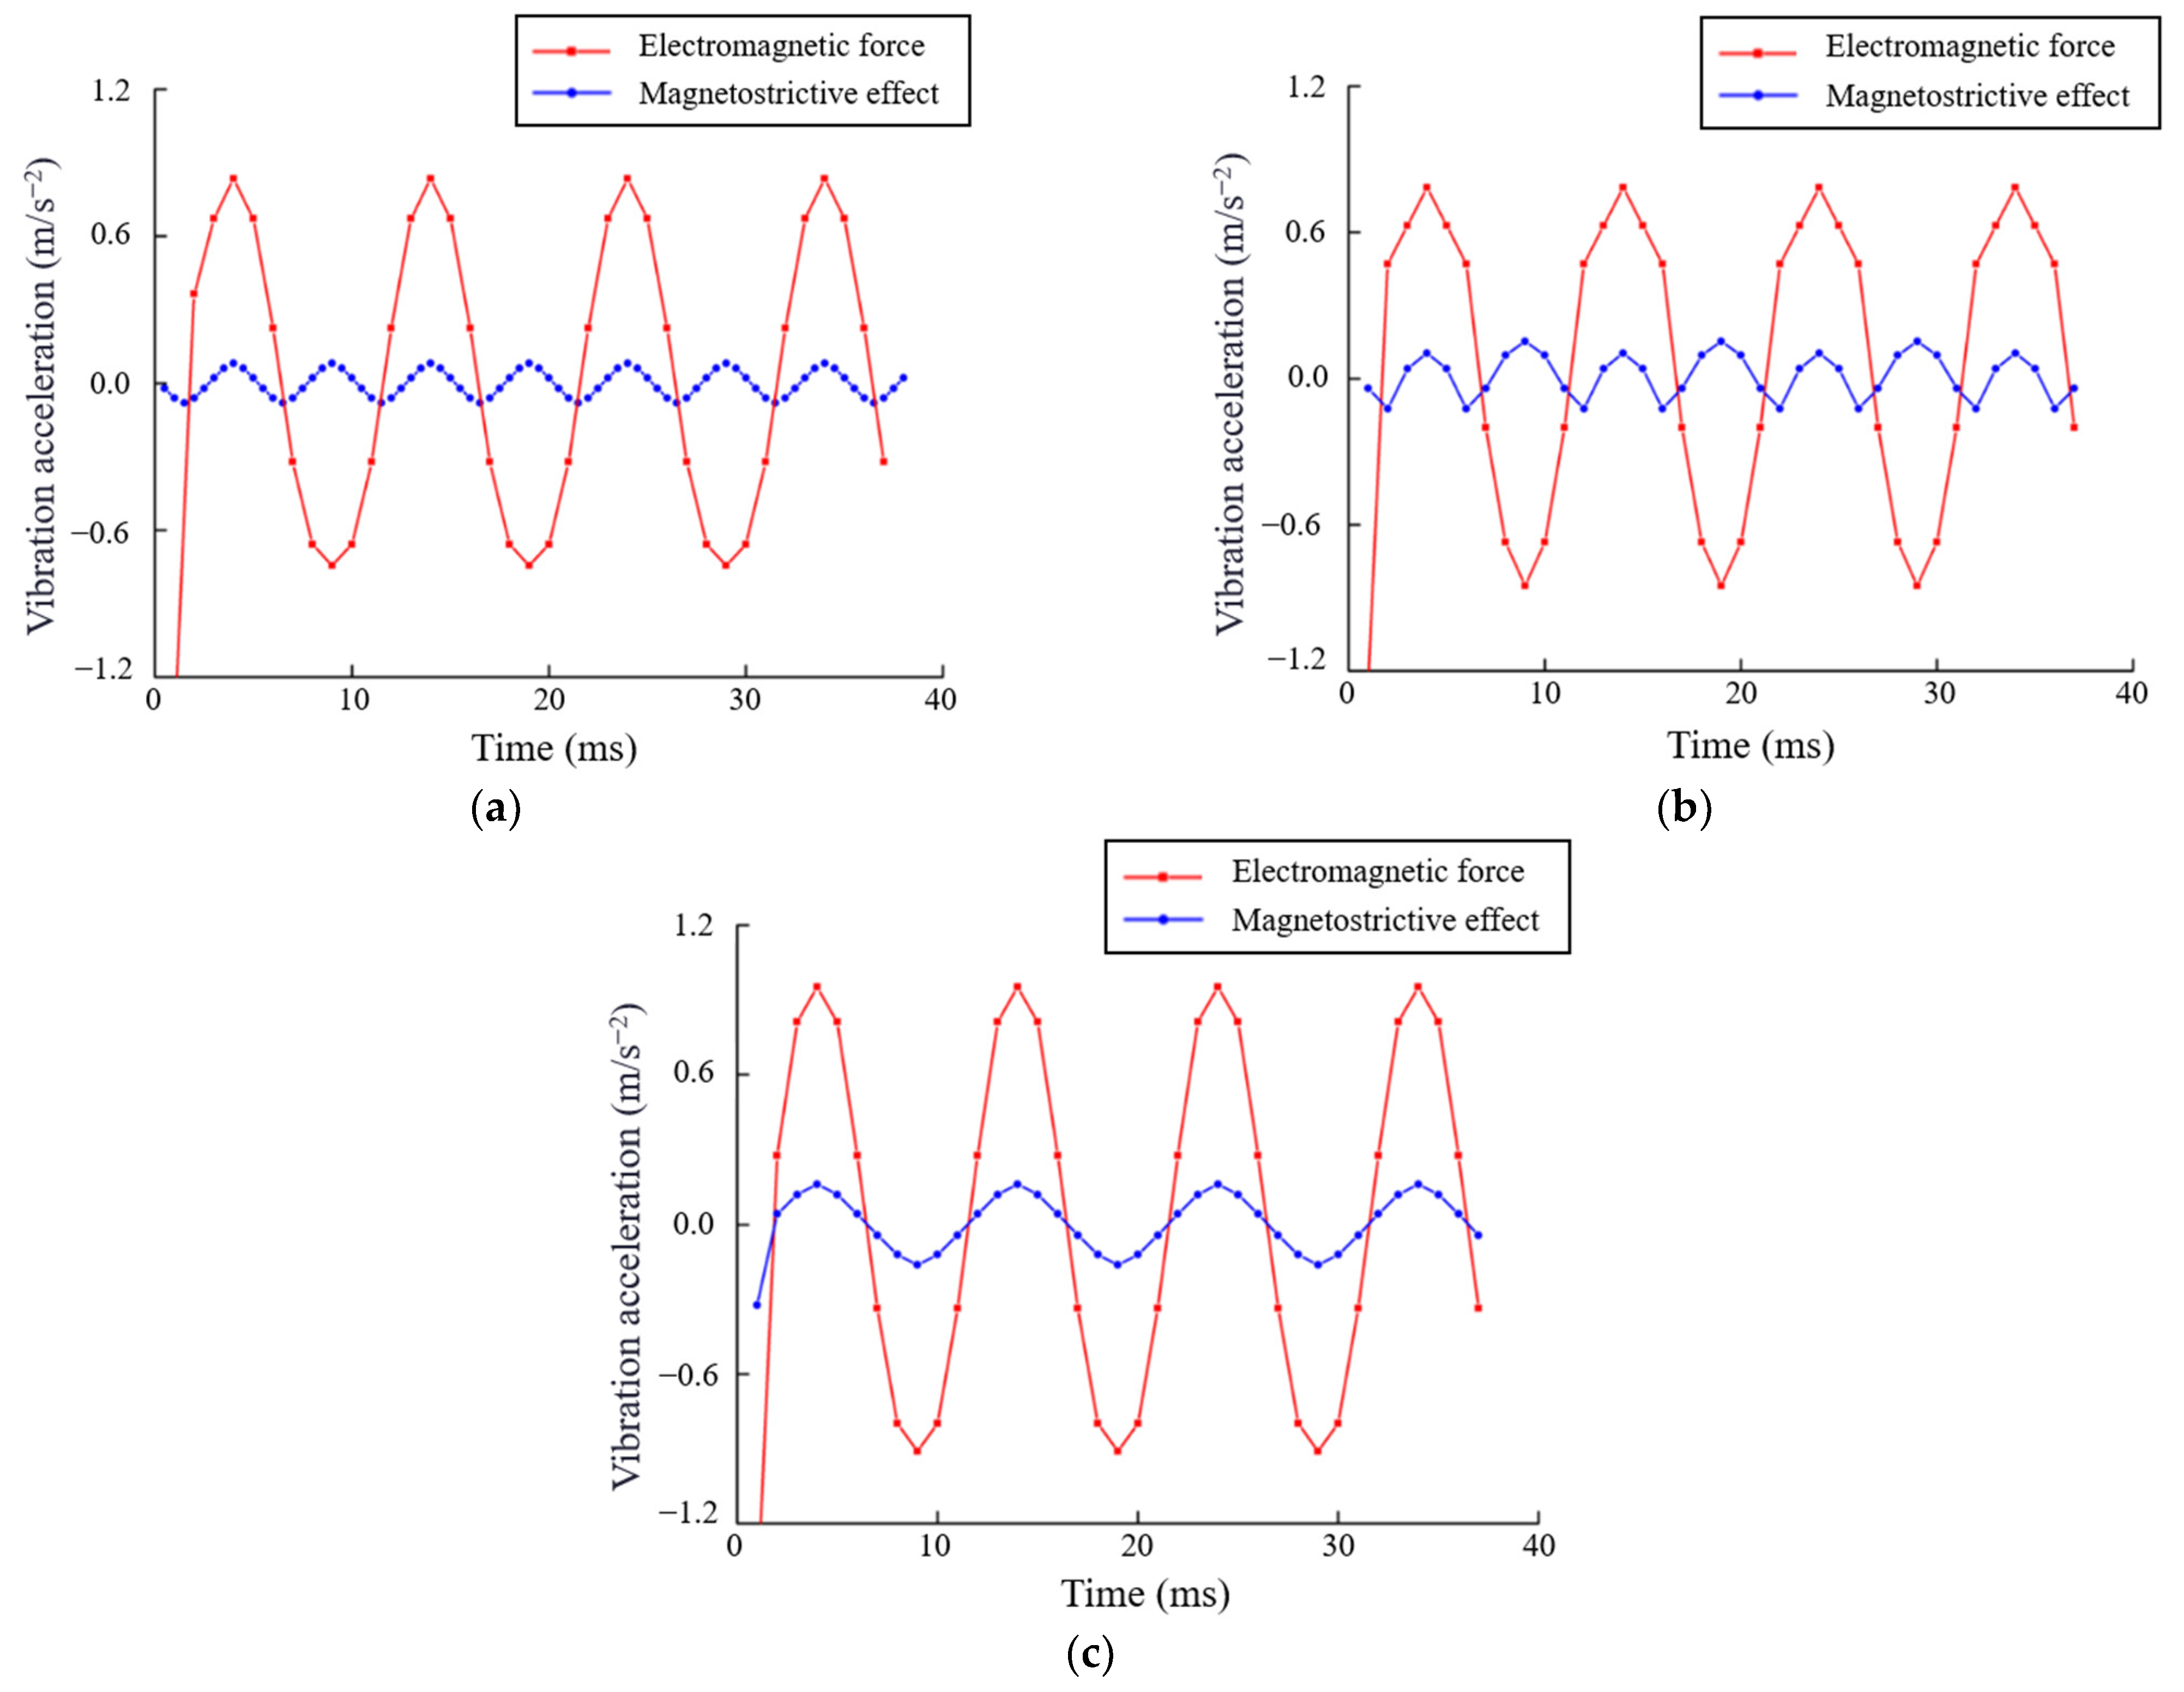
In order to investigate the vibration acceleration resulting from the separate influence of the electromagnetic force and the magnetostriction effect on the reactor core in different directions, the positive center of the upper yoke A was selected as the test point to simulate the vibration acceleration of the test point A, as shown in Figure 9.
In the figure, the red line represents the vibration acceleration at point A when only electromagnetic force is applied, and the blue line represents the vibration acceleration at point A when only magnetostriction is applied.
It is not difficult to find that the contribution of electromagnetic force to vibration at the test point A in different directions is greater than that of the magnetostriction effect. The vibration frequency of the reactor core is 100 Hz, that is, the period is 0.01 s. When the magnetostrictive effect is not considered, the amplitude of vibration acceleration in the z direction is the largest, with a maximum value of 0.95 m/s2; when the electromagnetic force is not considered, the amplitude of vibration acceleration in the z direction is the largest, with a maximum value of 0.16 m/s2.

4. Research on Vibration Reduction Measures of Iron Core

4.1. Vibration Measurement System

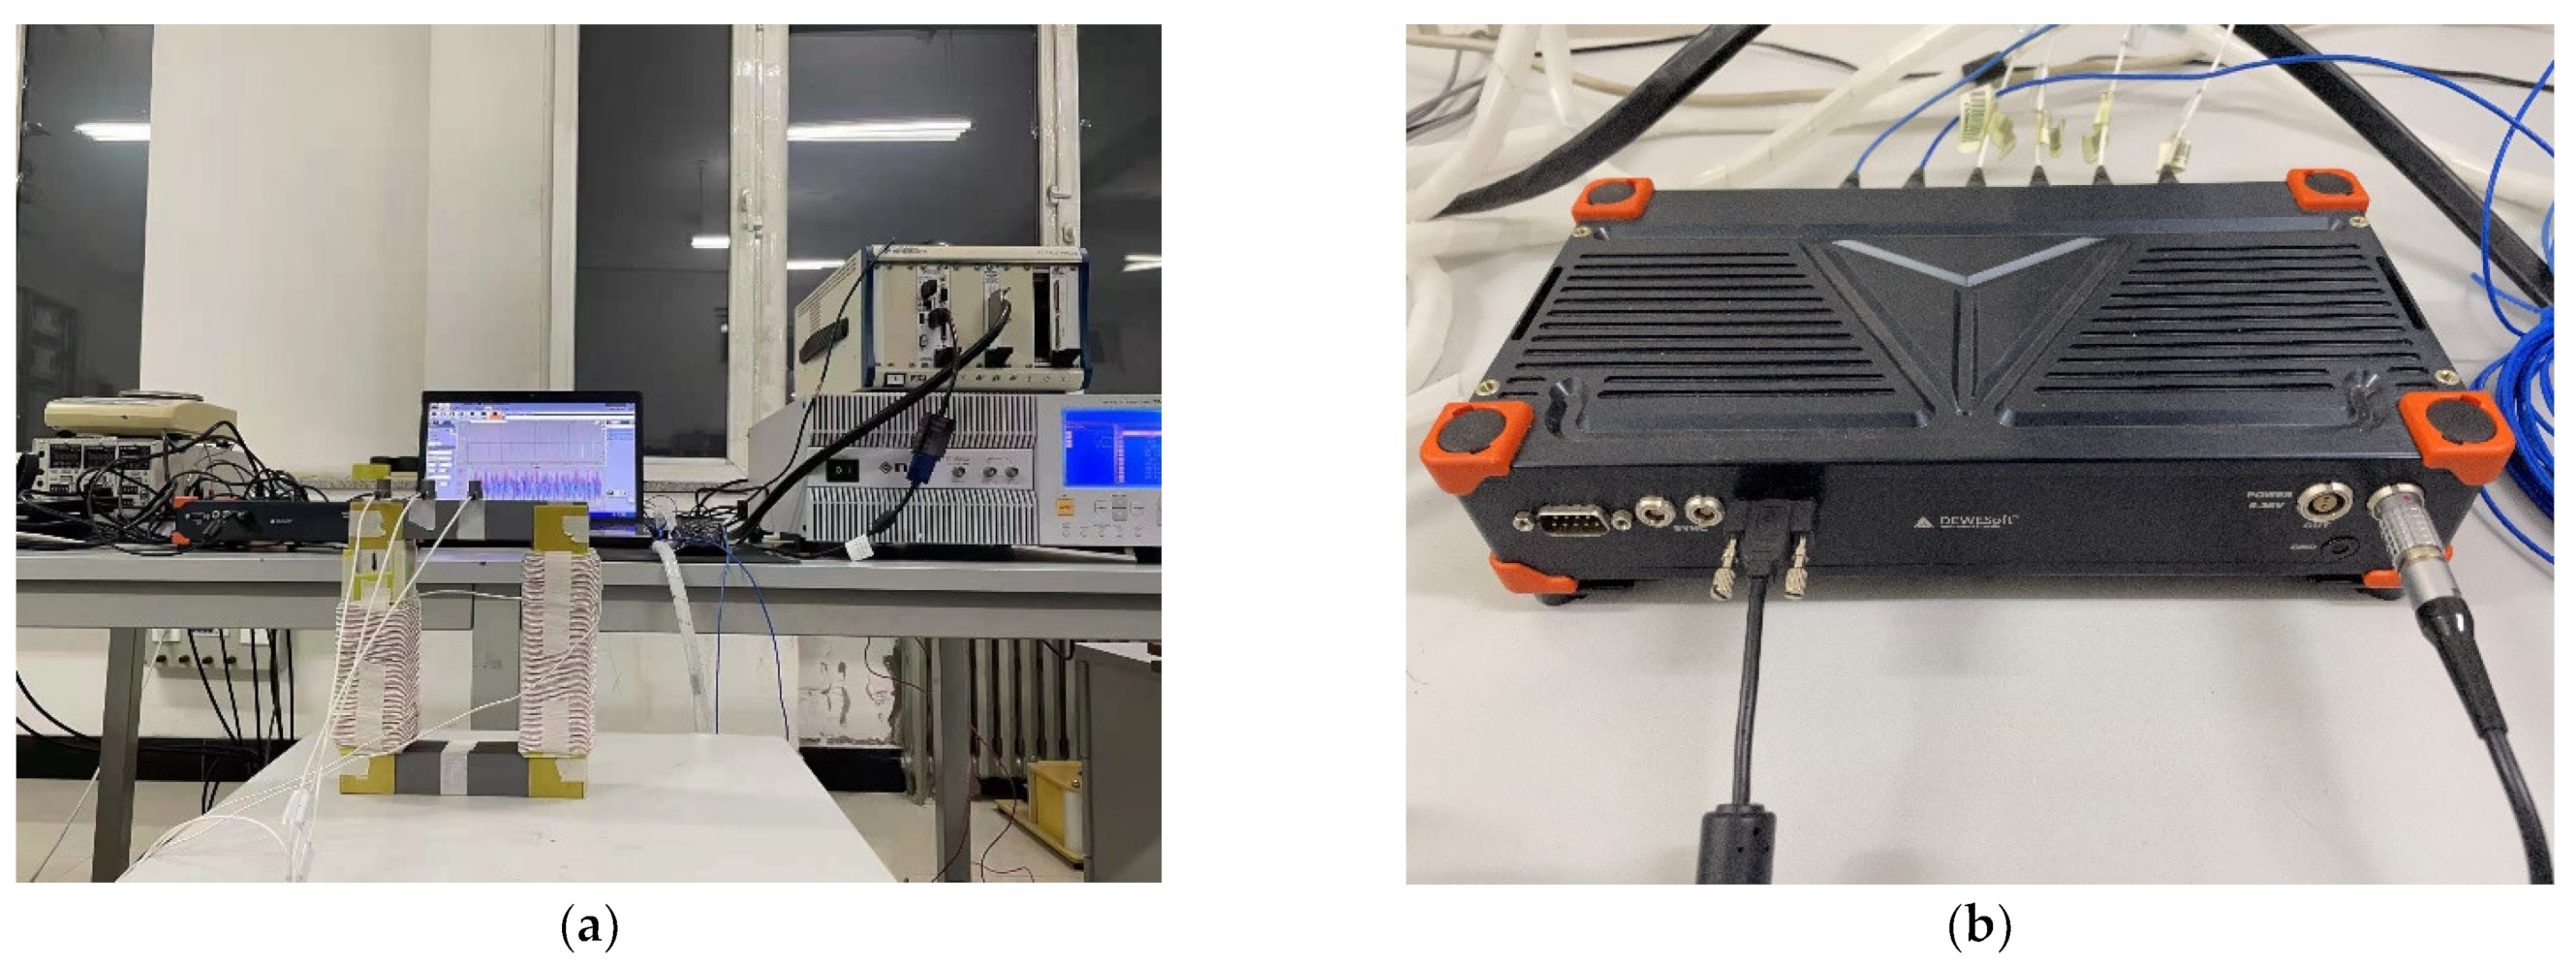
In this paper, a series core reactor model with a disassembly core disc is built and the vibration performance of the reactor core is tested. The inertial vibration measurement method is adopted in this paper. During measurement, the instrument is directly fixed on the object to be measured. When the test object vibrates, the sensor will vibrate together with the test object, and the inertial mass of the elastic support in the sensor will move relative to the sensor housing. The absolute vibration displacement waveform of the object can be obtained through the relative vibration displacement relation between the two, and other vibration parameters can be obtained. The vibration measurement system is mainly divided into three parts: experimental reactor body, vibration sensor, and signal processing device. In this paper, a PCB piezoelectric acceleration sensor produced in the United States is selected as the test probe, and its measurement accuracy and accuracy meet the experimental requirements. The PCB sensor can obtain the vibration signal in real time. The experimental device and sensor are shown in Figure 10.
In order to explore the vibration characteristics of the reactor core, a dry type series iron core reactor was designed and made for research, which mainly carried out uniform spacing air gap experiments, non-uniform spacing air gap experiments, and different core disc electrical steel sheet arrangement experiments. The reactor prototype parameters are shown in Table 6.
During each experiment, the probe of the data acquisition system was utilized to collect signals at the test point of the dry type series iron core reactor, and the vibration signals of each experiment were saved and recorded for subsequent analysis and processing. In this specific experiment, the vibration sensor is affixed to the yoke on the core using specialized wax. This method is characterized by its simplicity, repeatability, non-interference with electromagnetic and vibration signals of the reactor, as well as excellent frequency response characteristics.

4.2. Research on Vibration Reduction Scheme of Reactor Core

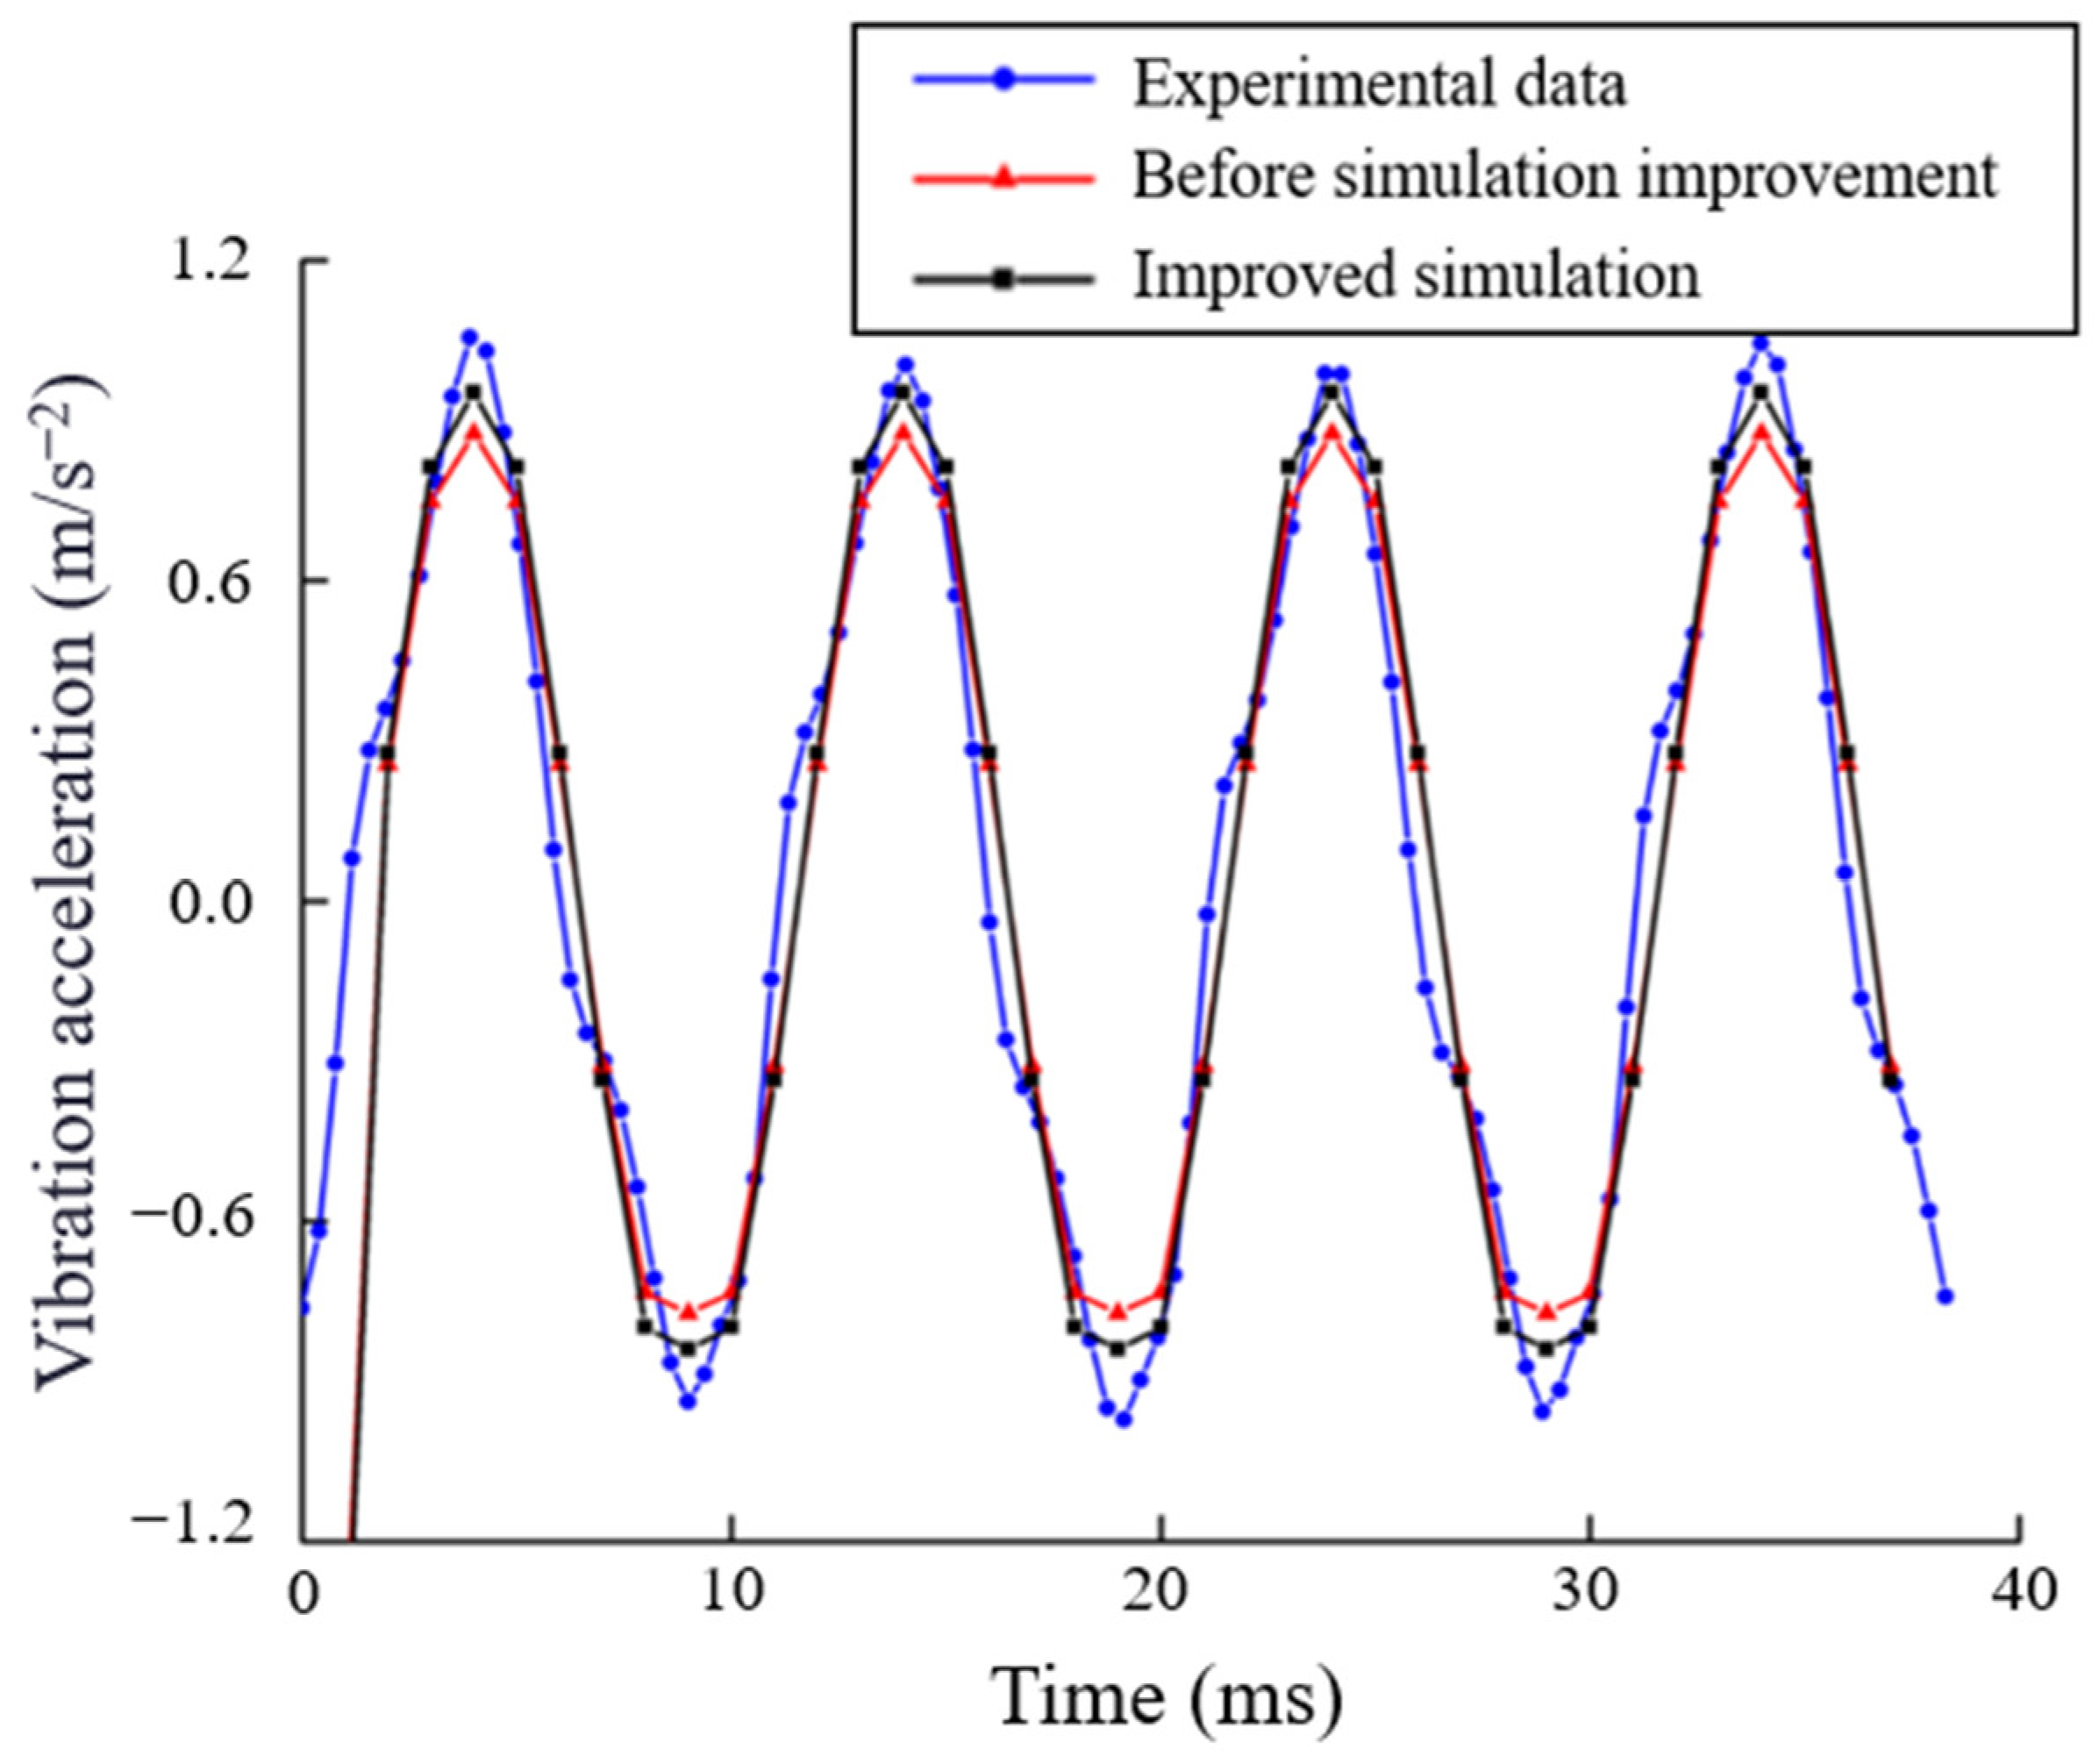
In order to verify the validity of the simulation adjustment of Young’s modulus in Section 2, a comparative analysis was conducted between the simulation and experiment before and after correcting the Young’s modulus of the core reactor. The positive center of the upper yoke A was selected as the test point, and the results are shown in Figure 11.
The improved simulation results in Figure 11 demonstrate a higher level of agreement between the Young’s modulus values for the laminated sheet of the reactor core disc, considering its structural characteristics, and the corresponding experimental data. This substantiates that modifying the Young’s modulus of the core disc enables a more accurate representation of its actual situation. However, there is still a certain error from the actual value, which is because the fixed constraint structure such as clamps and bolts, which have little influence on vibration performance, is ignored during the modeling of the reactor core and winding. Although only ignoring the constraint structure has little influence on vibration performance, in the actual experiment, the reactor will also be affected by many external factors such as air resistance, mechanical friction, and process problems of homemade reactors. Considering the influence of the above factors, there will be certain errors between the simulation calculation and the experimental measurement results.
The overall vibration of the reactor can be effectively minimized by reducing the vibration in the z direction, which is where the primary vibration of the reactor core is concentrated. Therefore, in the actual experiment, only the vibration acceleration in the z direction of the reactor is collected. By keeping the total length of the air gap between core discs unchanged at 6 mm and adjusting the length of the air gap at different positions of the core, the influence of the change of the air gap length between the core discs on reactor vibration was calculated and summarized.
The iron yoke of the reactor was assessed for vibration at three designated test points: central test point A, test point B located above the edge of the reactor core disc, and test point C positioned above the center of the reactor core disc. The distribution of test points for reactor vibration parameters is shown in Figure 12.
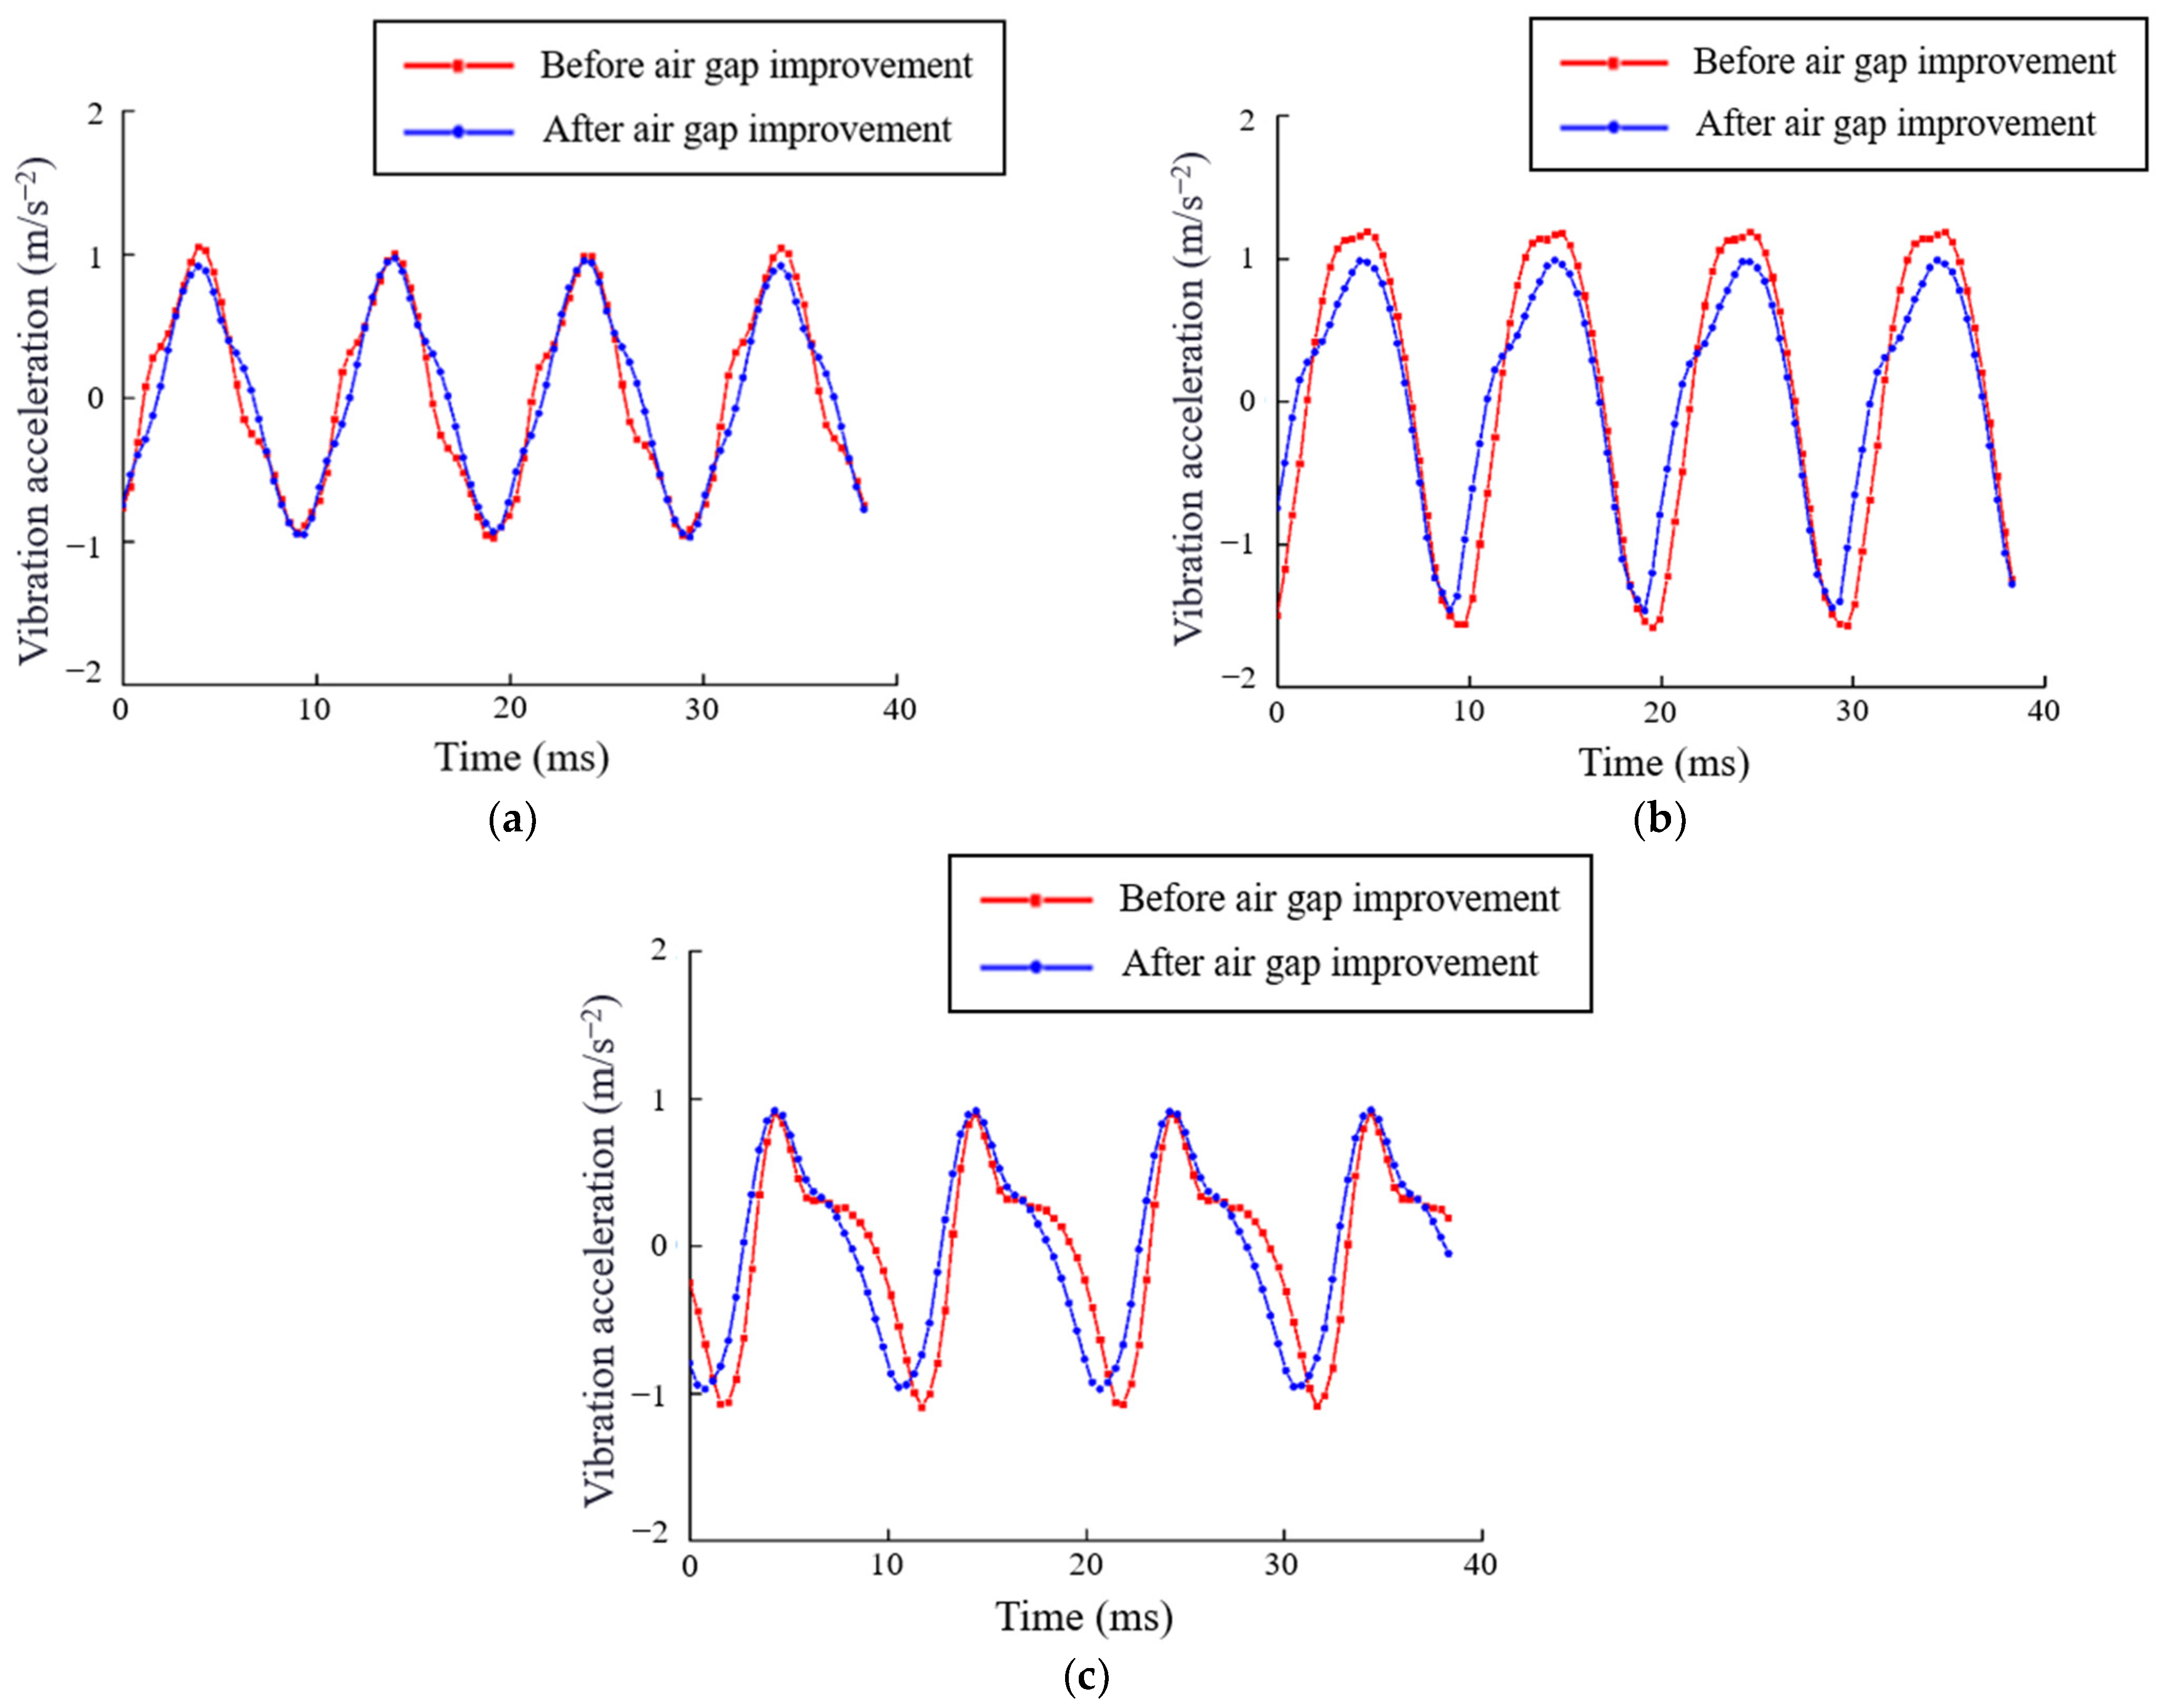
After screening by a simulation calculation, the air gap arrangement of the improved reconstituted reactor is 1 mm, 0.5 mm, 2 mm, 1 mm, 0.5 mm, and 1 mm from top to bottom, respectively. In contrast, the unimproved reactor maintains a uniform air gap arrangement of 1 mm. Other parameters of the reactor are consistent except the length of the air gap. The vibration parameters of A, B, and C are shown in Figure 13.
It can be seen that the overall improved vibration acceleration value is slightly less than the pre-improved vibration acceleration value. The specific vibration acceleration value pairs of the three test points are shown in Table 7. It can be found that the vibration acceleration of measuring point B is the largest, and the vibration acceleration after improving the air gap is 8.051% lower than that before the transformation.
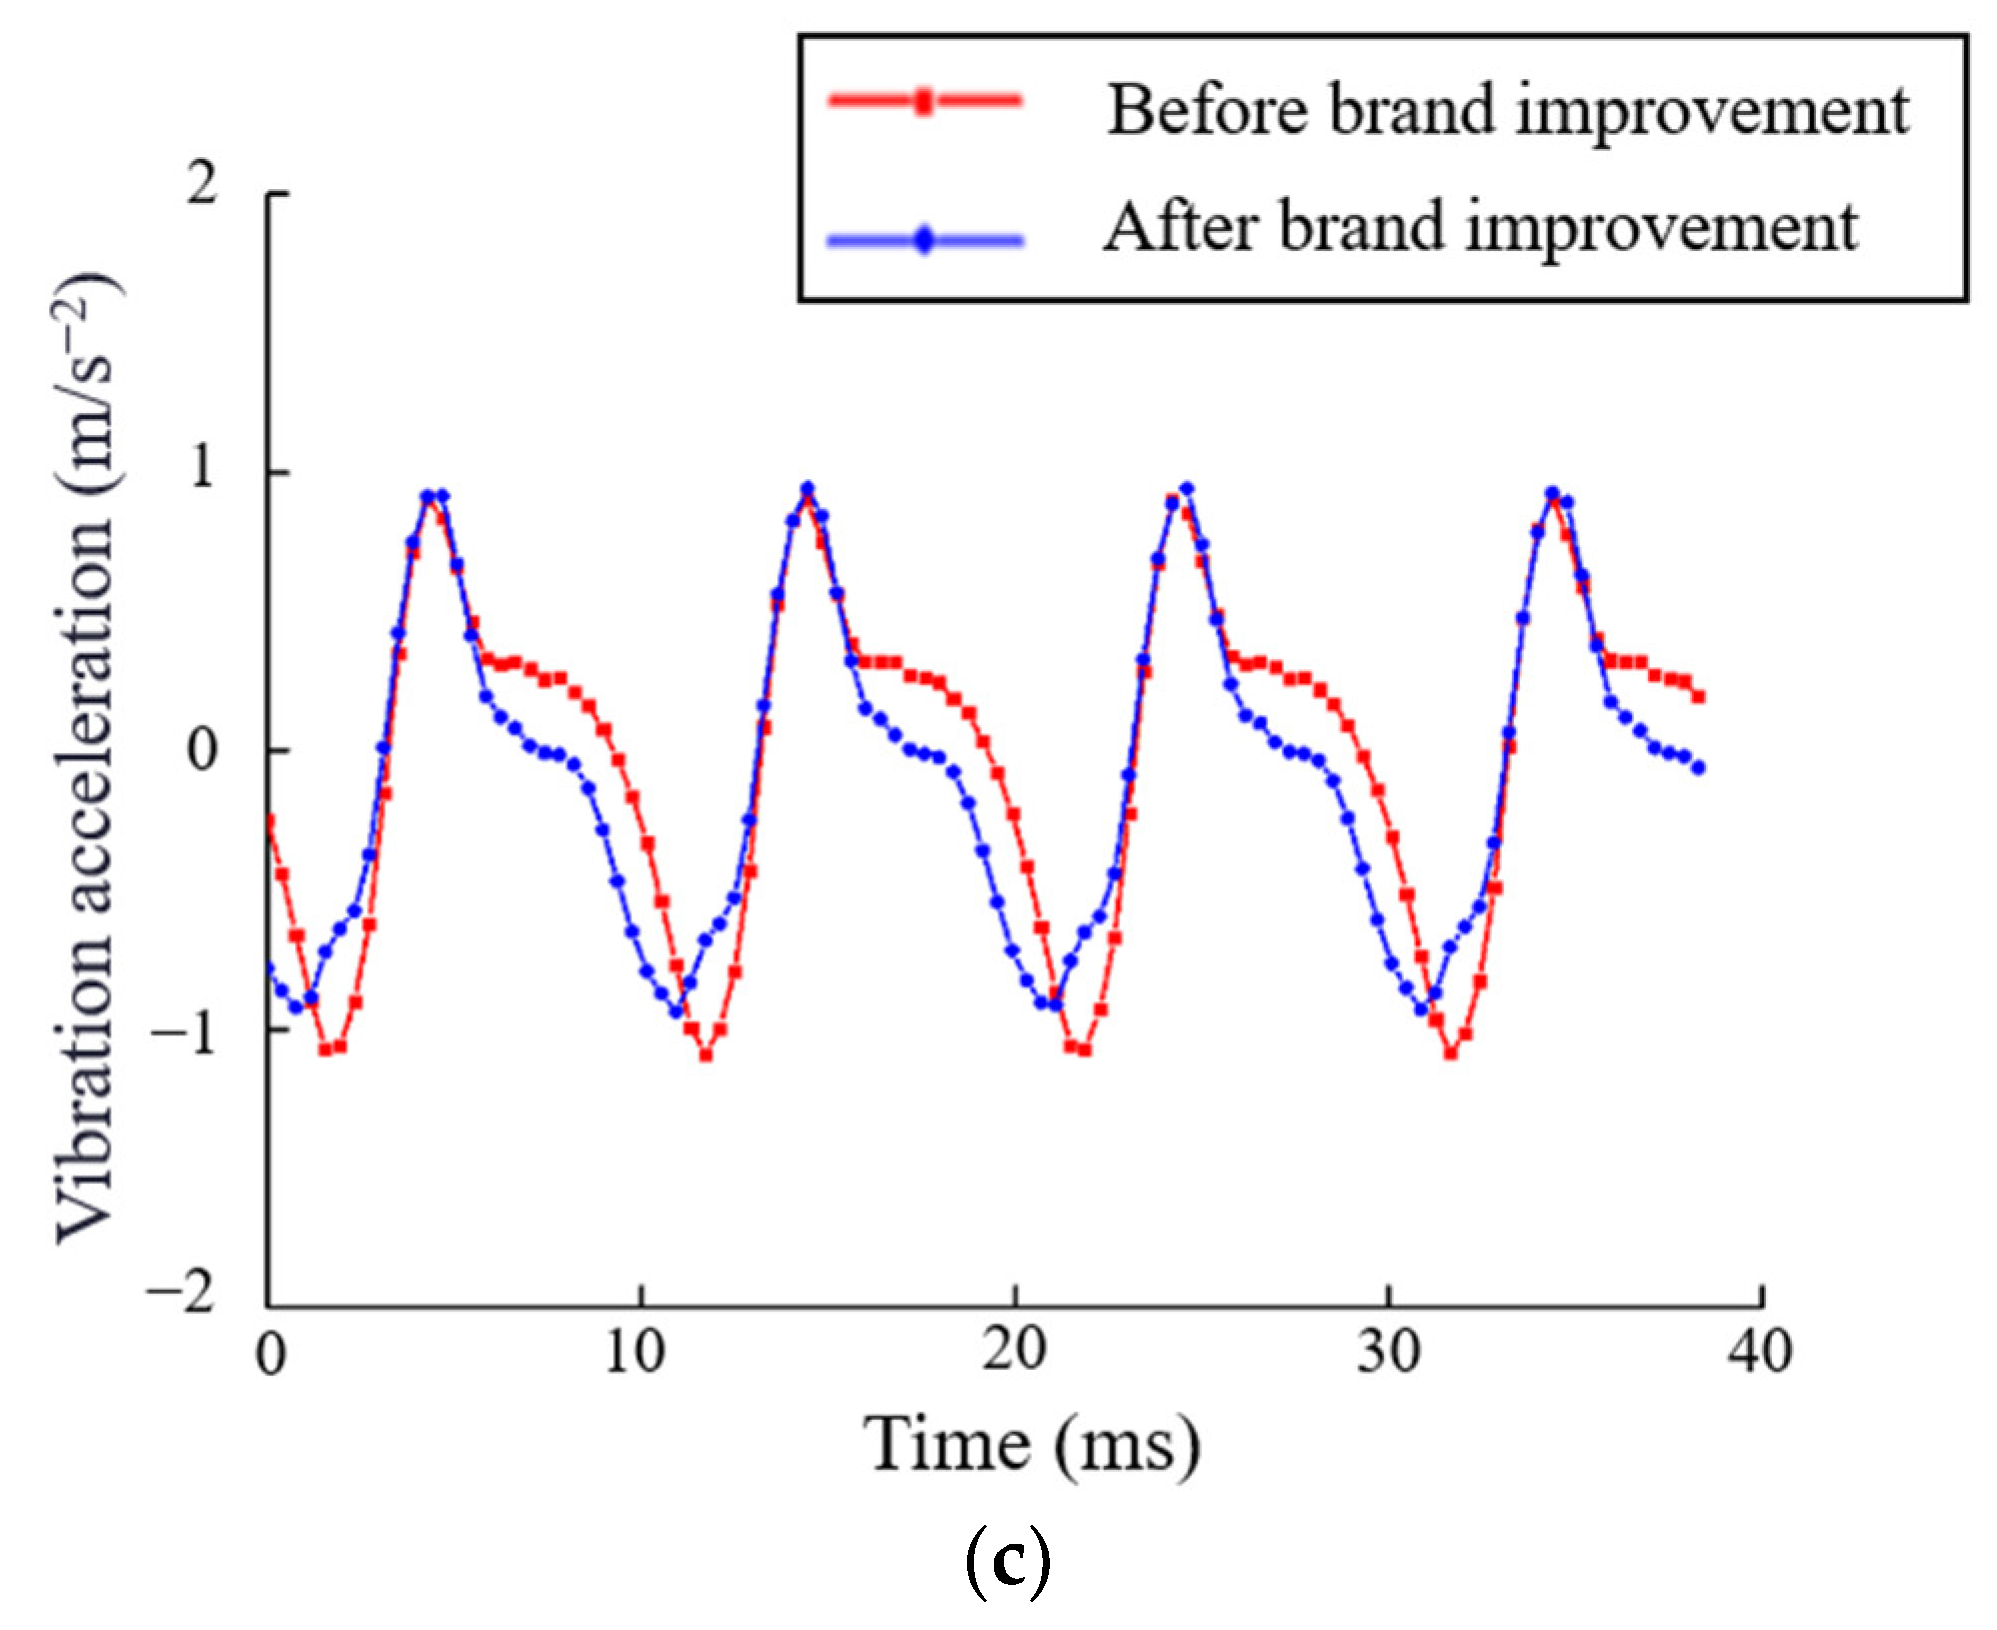
Next, the influence of the arrangement of electrical steel sheets on reactor vibration is explored. For the reactor used in the experiment, there are theoretically a variety of arrangement modes of core disc electrical steel sheet. After the simulation calculation, the improved and restructured reactor core disc electrical steel sheet is arranged as 50AW400, 30Q120, 50AW400, 30Q120, 50AW400, respectively. In contrast, the grade arrangement of the reactor core disc electrical steel sheet in the control group is five pieces of 30Q120. The measurement results are shown in Figure 14. The specific vibration acceleration measurement results of the test points are shown in Table 8.
After improving the arrangement mode of the core disc electrical steel sheet, the vibration acceleration is reduced by 5.107% on average, compared with that before the transformation. Although the vibration reduction effect is not as obvious as adjusting the air gap arrangement mode between the core disc, it does not conflict with adjusting the air gap arrangement mode between the core disc and can be comprehensively applied.
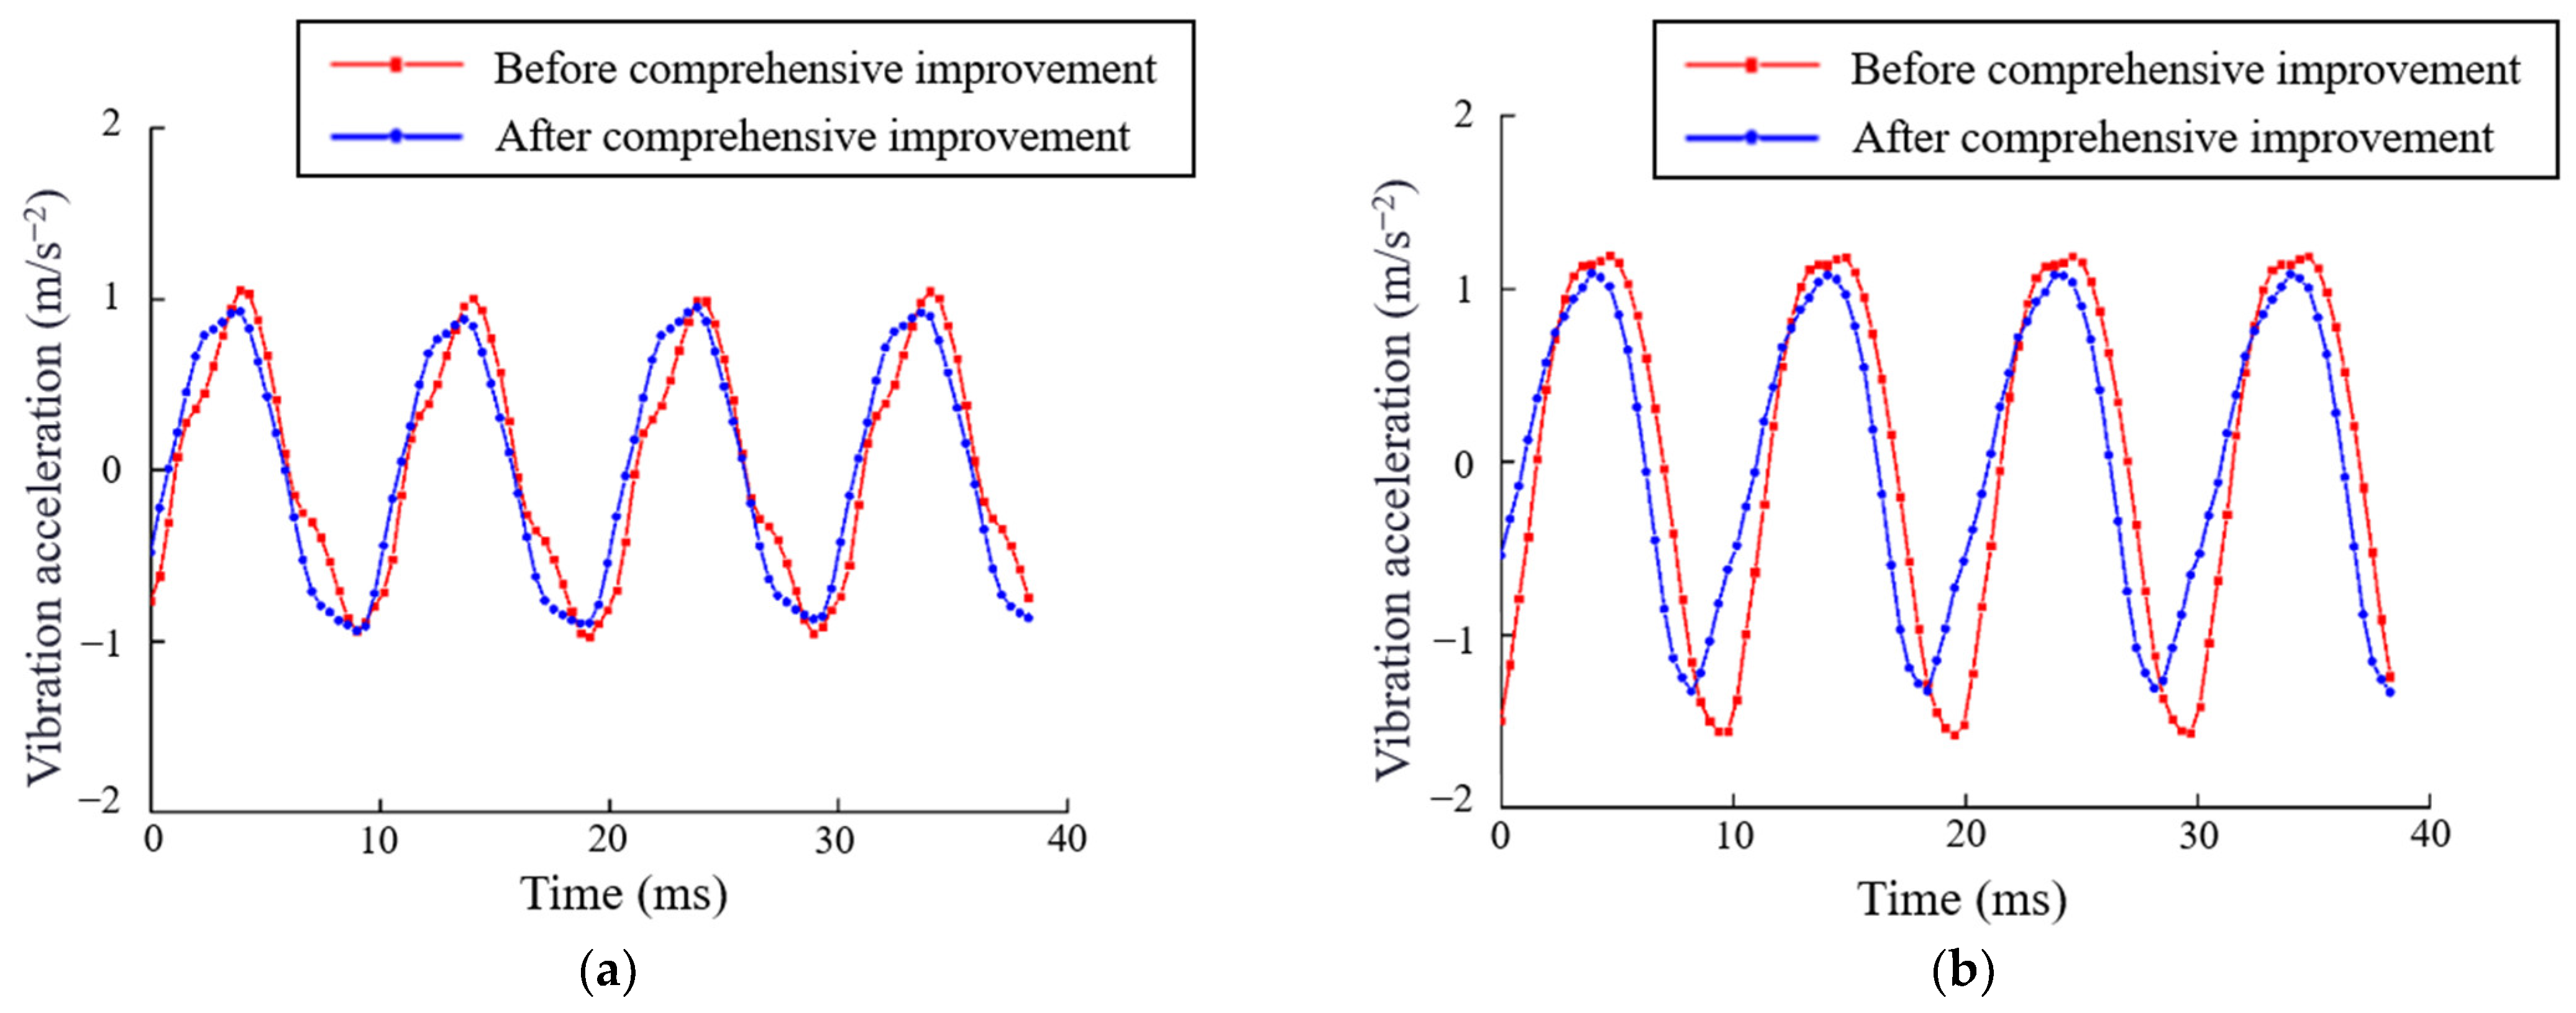
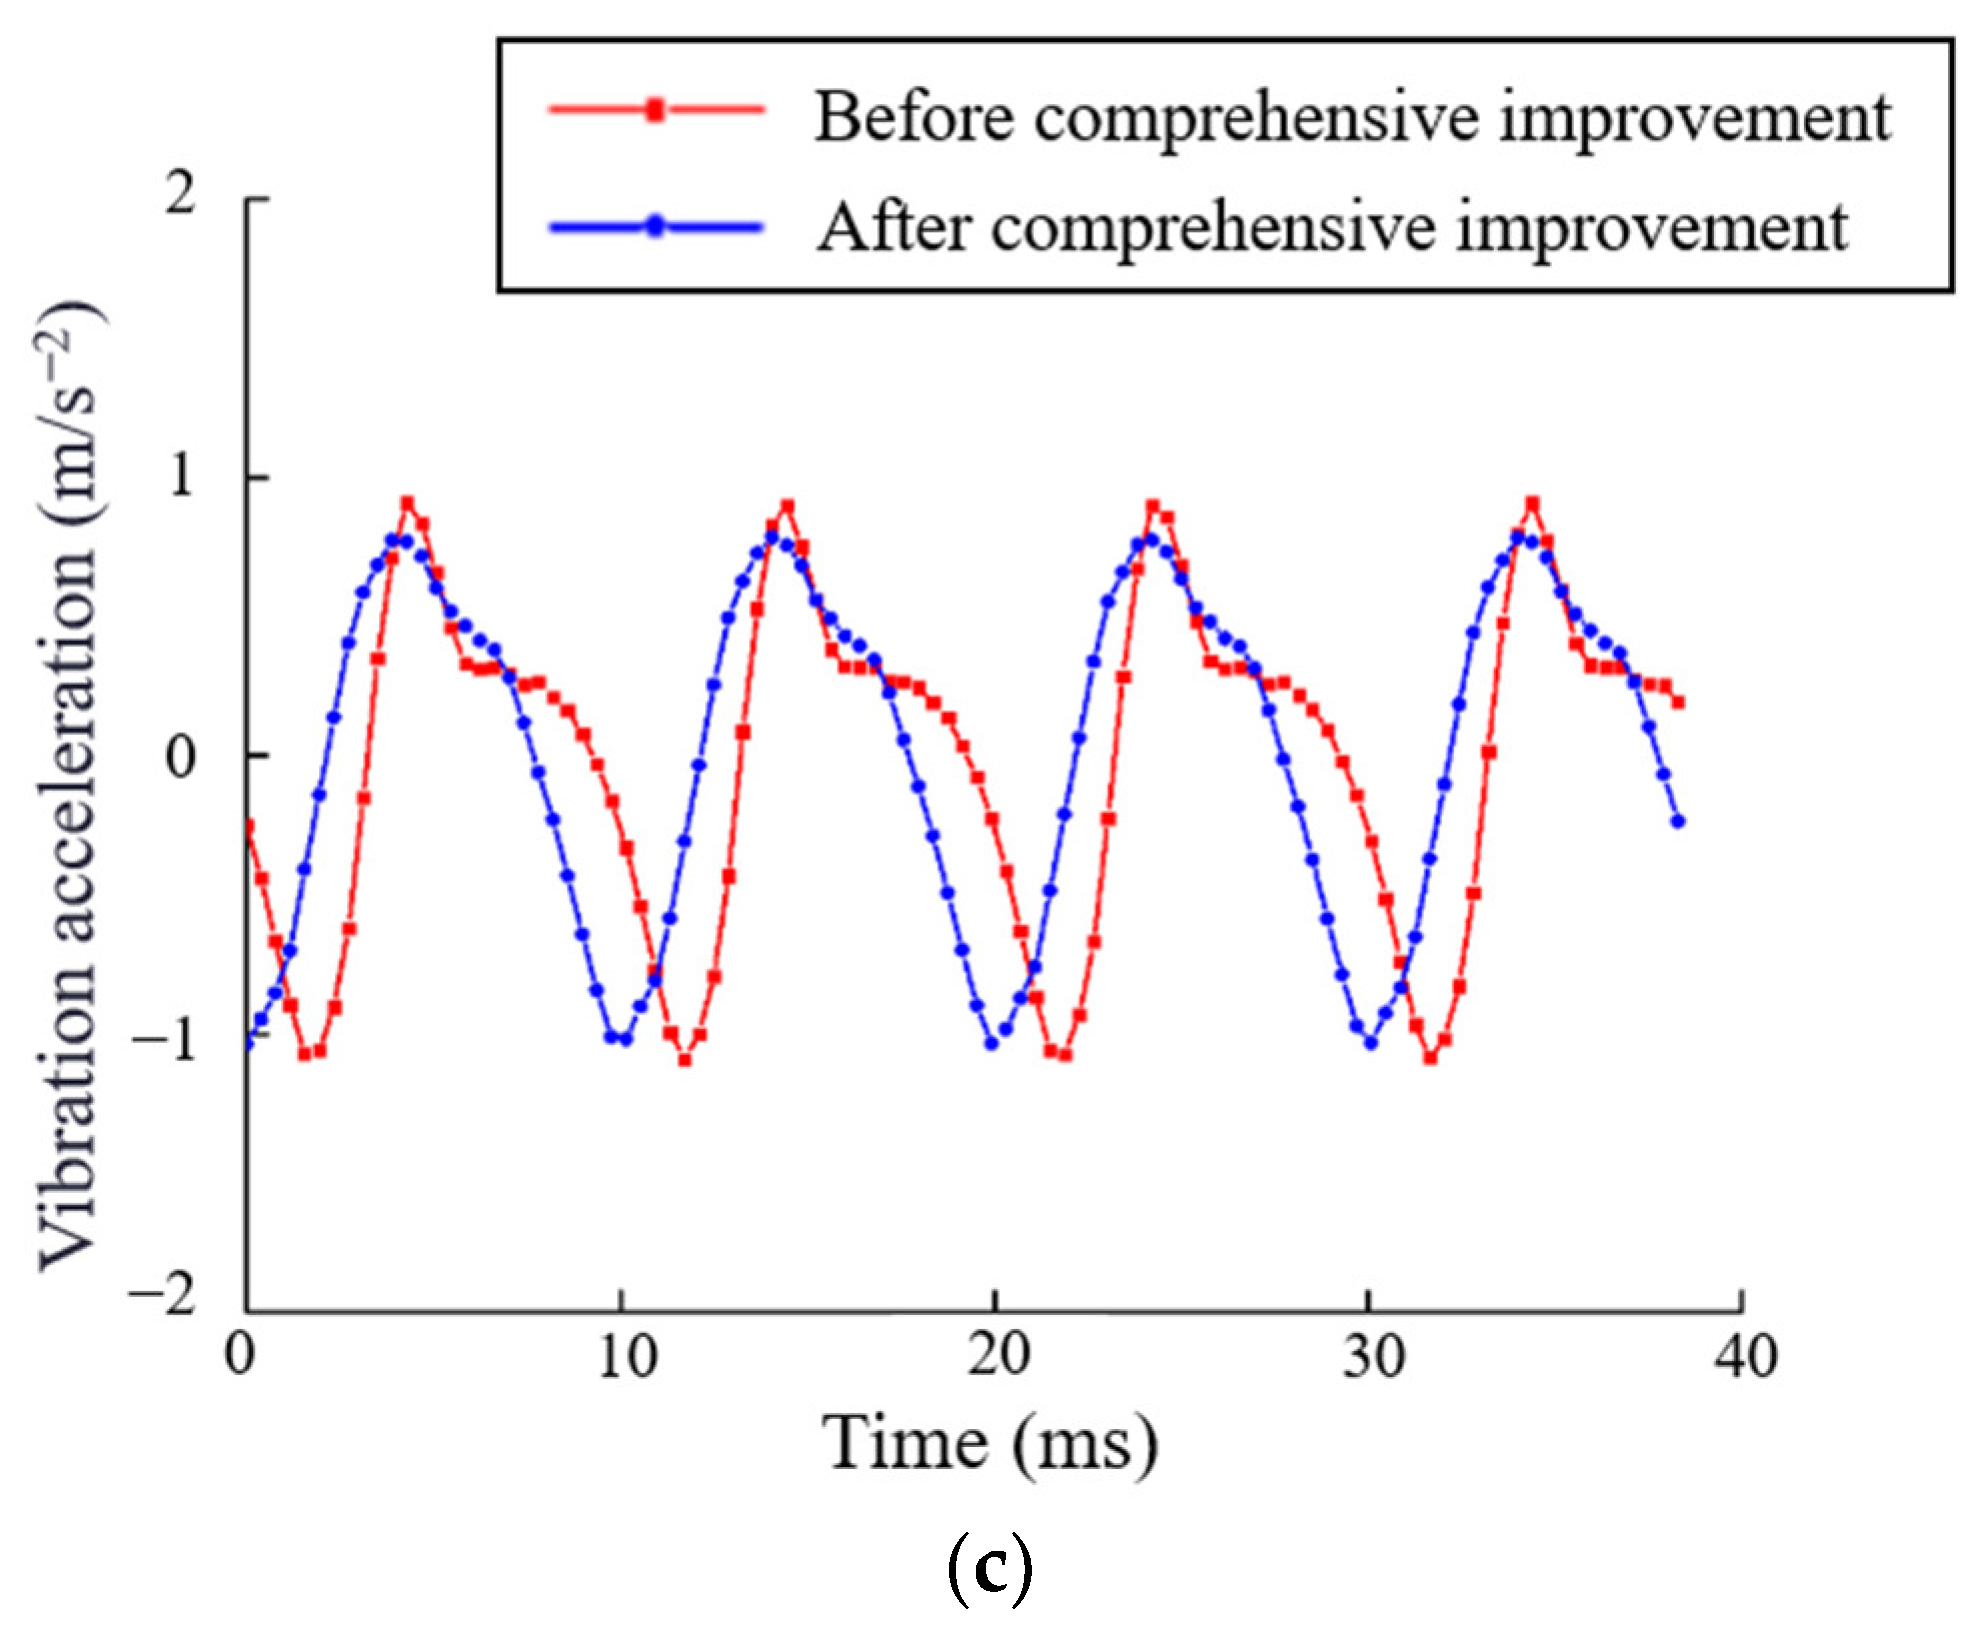
The length of the air gap between the core disc and the arrangement of the core disc electrical steel sheet are comprehensively applied. After comprehensive application, the vibration parameters of the reactor are re-measured. The measurement results are shown in Figure 15. The specific vibration acceleration measurement results of the test point are shown in Table 9.
It can be seen that through the comprehensive improvement of the vibration reduction scheme, the vibration acceleration at point A is reduced by about 8.858%. At point B, the vibration acceleration decreases about 16.68%. At point C, the vibration acceleration decreases by 7.674%. The overall average vibration acceleration is reduced by about 11.60%, and the comprehensive improvement of the air gap and electrical steel sheet grade arrangement can further reduce the reactor vibration and, effectively, reduce the vibration.

5. Conclusions

Based on the experimental measurements, the elastic modulus in the lamination direction of the core sheet is modified, and the structural anisotropic of the mechanical parameters of the electrical steel sheet are considered. On this basis, the simulation and experimental verification of the core reactor are carried out and the vibration reduction scheme of the reactor core vibration performance is proposed. The results are as follows:
(1) Through a modal experimental proofreading method, the Young’s modulus in the lamination direction is adjusted. The experimental data show that the adjusted simulation results are closer to the experimental values, which lays a foundation for the subsequent vibration performance research of the reactor to be closer to the actual situation.
(2) The results show that the magnetostrictive force and the electromagnetic force of the reactor have different effects on its vibration in different directions. When the two act together, the vibration acceleration amplitude of the reactor core in the z direction is the largest.
(3) A self-made detachable single-phase series core reactor is experimentally analyzed. The effects of the air gap length between different core discs and the arrangement of the core disc electrical steel sheet on the vibration acceleration of the reactor are measured; the results show that the vibration reduction in the reactor is about 11.6% after comprehensive improvement. It provides a theoretical basis for further research on vibration and noise reduction in reactors.
Author Contributions

Conceptualization, Z.W.; methodology, R.Y.; software, C.D.; validation Z.F.; investigation, X.L. and C.D.; writing—original draft preparation, R.Y.; writing—review and editing, Z.W. and X.L.; visualization, X.L.; All authors have read and agreed to the published version of the manuscript.

Funding

This research was funded by the Education Department of Liaoning Province, China. Grant number LJKMZ20220469.

Conflicts of Interest

The authors declare no conflict of interest.

References

  1. Klimczyk, P.; Somkun, S.; Anderson, P.; Moses, A.J. Comparison of uniaxial and rotational magnetostriction of non-oriented and grain-oriented electrical steel. Prz. Elektrotechniczny 2011, 87, 33–36. [Google Scholar]
  2. Klimczyk, P.K.; Anderson, P.; Moses, A.; Davies, M. Influence of cutting techniques on magnetostriction under stress of grain oriented electrical steel. IEEE Trans. Magn. 2012, 48, 1417–1420. [Google Scholar] [CrossRef]
  3. Kai, Y.; Tsuchida, Y.; Todaka, T.; Enokizono, M. Effect of stress on vector magnetic property and two-dimensional magnetostriction of a non-oriented electrical steel sheet. J. Jpn. Soc. Appl. Electromagn. Mech. 2013, 21, 482–487. [Google Scholar] [CrossRef]
  4. Kai, Y.; Tsuchida, Y.; Todaka, T.; Enokizono, M. Influence of biaxial stress on vector magnetic properties and 2-D magnetostriction of a nonoriented electrical steel sheet under alternating magnetic flux conditions. IEEE Trans. Magn. 2014, 50, 1–4. [Google Scholar] [CrossRef]
  5. Kai, Y.; Enokizono, M. Measurement of two-dimensional magnetostriction of a non-oriented electrical steel sheet under shear stress. Int. J. Appl. Electromagn. Mech. 2015, 48, 233–238. [Google Scholar] [CrossRef]
  6. Tada, H.; Fujimura, H.; Yashiki, H. Influence of magnetostriction on hysteresis loss of electrical steel sheet. J. Magn. Magn. Mater. 2013, 326, 217–219. [Google Scholar] [CrossRef]
  7. Oda, Y.; Toda, H.; Shiga, N.; Kasai, S.; Hiratani, T. Effect of Si content on iron loss of electrical steel sheet under compressive stress. IEEE Trans. Magn. 2014, 50, 1–4. [Google Scholar] [CrossRef]
  8. Wakabayashi, D.; Enokizono, M. Two-dimensional magnetostriction under vector magnetic characteristic. J. Appl. Phys. 2015, 117, 17. [Google Scholar] [CrossRef]
  9. Somkun, S.; Moses, A.J.; Anderson, P.I. Magnetostriction in grain-oriented electrical steels under AC magnetization at angles to the rolling direction. IET Electric Power Appl. 2016, 10, 932–938. [Google Scholar] [CrossRef]
  10. Ghalamestani, S.G.; Darba, A.; Vandevelde, L.; Melkebeek, J. Macroscopic description of the magnetostrictive behavior of electrical steel in the presence of high-order harmonics in the magnetization. IEEE Trans. Magn. 2016, 52, 1–4. [Google Scholar] [CrossRef]
  11. Lahyaoui, O.; Lanfranchi, V.; Buiron, N.; Chazot, J.D.; Langlois, C. Investigation on Mechanical Resonance Induced by Magnetostriction in a Structure Based on Si-Fe Sheets. IEEE Trans. Magn. 2018, 54, 1–12. [Google Scholar] [CrossRef]
  12. Apicella, V.; Clemente, C.S.; Davino, D.; Leone, D.; Visone, C. Review of Modeling and Control of Magnetostrictive Actuators. Actuators 2019, 8, 45. [Google Scholar] [CrossRef]
  13. Pîslaru-Dănescu, L.; Morega, A.-M.; Chihaia, R.-A.; Popescu, I.; Morega, M.; Flore, L.; Popa, M.; Pătroi, E.-A. New Type of Linear Magnetostrictive Motor Designed for Outer Space Applications, from Concept to End-Product. Actuators 2021, 10, 266. [Google Scholar] [CrossRef]
  14. Ju, X.; Lu, J.; Rong, B.; Jin, H. Parameter Identification of Displacement Model for Giant Magnetostrictive Actuator Using Differential Evolution Algorithm. Actuators 2023, 12, 76. [Google Scholar] [CrossRef]
  15. Zhou, Z.; He, Z.; Xue, G.; Zhou, J.; Rong, C.; Liu, G. Analysis of Magnetic Field Characteristics of a Giant Magnetostrictive Actuator with a Semi-Closed Magnetic Circuit. Actuators 2022, 11, 108. [Google Scholar] [CrossRef]
  16. Liu, J.; Zhang, M.; Li, K.; Zhao, D.; Huang, L. Multi field coupling research on iron-core vibration noise of power reactor. Electr. Mach. Control 2016, 20, 17–25. [Google Scholar]
  17. Zhu, L.; Wang, B.; Liu, S.; Yang, Y.; Yang, Q. Research on Electromagnetic Vibration of Dry Type Transformer under Different Types of Load. Trans. China Electrotech. Soc. 2018, 33, 1599–1606. [Google Scholar]
  18. Zhang, P.; Li, L. Vibration Properties of Two-Stage Magnetic-Valve Controllable Reactor. IEEE Trans. Magn. 2018, 54, 1–4. [Google Scholar] [CrossRef]
  19. Zhang, P.; Li, L.; Cheng, Z.; Tian, C.; Liu, Y. Vibration Simulation and Experiment Comparison of Shunt Reactor and Transformer Model Core. Trans. China Electrotech. Soc. 2018, 33, 5273–5281. [Google Scholar]
  20. Zhang, P.; Li, L.; Cheng, Z.; Tian, C.; Han, Y. Study on Vibration of Iron Core of Transformer and Reactor Based on Maxwell Stress and Anisotropic Magnetostriction. IEEE Trans. Magn. 2019, 55, 1–5. [Google Scholar] [CrossRef]
  21. Yan, R.; Zhao, W.; Chen, J.; Zhang, X. Research on vibration reduction of series reactor based on harmonic injection. Trans. China Electrotech. Soc. 2020, 35, 3445–3452. [Google Scholar]
  22. Wu, S.; Ma, H.; Jiang, N.; Dai, F.; Zhu, C.; Tan, F. Simulation analysis and experimental research on vibration and noise of UHV shunt reactor based on multi physical field coupling. Electr. Power Autom. Equip. 2020, 40, 122–127. [Google Scholar]
  23. Wu, Y.; Zhang, Z.; Xiao, R.; Jiang, P.; Dong, Z.; Deng, J. Operation State Identification Method for Converter Transformers Based on Vibration Detection Technology and Deep Belief Network Optimization Algorithm. Actuators 2021, 10, 56. [Google Scholar] [CrossRef]
  24. Guo, J.; Geng, J.; Lv, F.; Cheng, H.; Niu, L.; Pan, Y. Vibration Reduction Technology of UHV Shunt Reactor Core Based on Air Gap Structure. High Volt. Eng. 2021, 47, 3892–3901. [Google Scholar]
  25. Ben, T.; Hou, L.; Chen, L.; Zhang, P.; Kong, Y.; Yan, R. The Vector Electromagnetic Vibration of Magnetically Controlled Reactor Considering the Vector Hysteretic Magnetostriction Effect. IEEE Trans. Magn. 2022, 58, 1–5. [Google Scholar] [CrossRef]
  26. Ben, T.; Hou, L.; Chen, L.; Zhang, P.; Yan, R. Vector electromagnetic vibration characteristics of magnetically controlled reactor core under DC bias. High Volt. Eng. 2022, 10, 1–11. [Google Scholar]
  27. Yang, K.; Tong, W.; Lin, L.; Yurchenko, D.; Wang, J. Active vibration isolation performance of the bistable nonlinear electromagnetic actuator with the elastic boundary. J. Sound Vib. 2022, 520, 116588. [Google Scholar] [CrossRef]
Figure 1. The distribution of test points and tapping points in the core disc modal experiment. (a) Physical drawing; (b) core disc test point diagram.
Actuators 12 00365 g001
Figure 2. Flow chart of modal experimental alignment method.
Actuators 12 00365 g002
Figure 3. Mode shape of core disc with natural frequency of 840 Hz.
Actuators 12 00365 g003
Figure 4. Stress tensor.
Actuators 12 00365 g004
Figure 5. Reactor core simulation model diagram.
Actuators 12 00365 g005
Figure 6. The fitting curve of magnetostriction and magnetic flux density of electrical steel sheet. (a) 30Q120; (b) 50AW40.
Actuators 12 00365 g006
Figure 7. Magnetic flux density modulus distribution of reactor core. (a) T = 0.004 s; (b) T = 008 s; (c) T = 0.01 s; (d) T = 0.02 s.
Actuators 12 00365 g007aActuators 12 00365 g007b
Figure 8. Core stress distribution. (a) T = 0.004 s; (b) T = 0.01 s.
Actuators 12 00365 g008
Figure 9. The vibration acceleration of point A is measured under the separate action of electromagnetic force and magnetostriction effect. (a) X direction; (b) Y direction; (c) Z direction.
Actuators 12 00365 g009
Figure 10. Experimental devices and sensor. (a) Experimental apparatus; (b) sensor.
Actuators 12 00365 g010
Figure 11. The simulation improves the vibration acceleration curve.
Actuators 12 00365 g011
Figure 12. Reactor vibration test points.
Actuators 12 00365 g012
Figure 13. Vibration acceleration curve before and after air gap length improvement. (a) Point A; (b) Point B; (c) Point C.
Actuators 12 00365 g013
Figure 14. Vibration acceleration curve of electrical steel sheet before and after improvement. (a) Point A; (b) Point B; (c) Point C.
Actuators 12 00365 g014aActuators 12 00365 g014b
Figure 15. Comprehensively improve the acceleration curve of front and rear vibration. (a) Point A; (b) Point B; (c) Point C.
Actuators 12 00365 g015aActuators 12 00365 g015b
Table 1. Experimental apparatuses for modal analysis.
Device NameProducerModel Number
data collection systemGermany HBMQuantum MX410B
excitation force hammerDenmark B&K8206-002
acceleration sensorDenmark B&K4528B
Table 2. Reactor core disc modal test results.
RankFrequency/Hz
132.6
246.8
375.4
4187
5224
6479
7880
81435
91638
Table 3. Initial values of structural mechanical parameters of iron core materials.
Structural Mechanics ParameterX DirectionY DirectionZ Direction
Young’s modulus (Pa)1.5 × 10111.5 × 10114 × 107
Poisson’s ratio0.280.280.28
Shear modulus (Pa)5.9 × 10105.9 × 10101.56 × 107
Table 4. Adjustment value of structural mechanical parameters of iron core materials.
Structural Mechanics ParameterX DirectionY DirectionZ Direction
Young’s modulus (Pa)1.5 × 10111.5 × 10112.6 × 107
Poisson’s ratio0.280.280.28
shear modulus (Pa)5.9 × 10105.9 × 10101.02 × 107
Table 5. Comparative analysis of reactor core disc modal experiment results.
RankSimulation Frequency/HzExperimental Frequency/HzError/%
135.132.67.67
248.346.83.21
378.475.43.98
41981875.88
52422248.04
65164797.72
79578808.75
8152514356.27
9177816388.55
Table 6. Reactor prototype parameters.
TypeArgument
number of turns/N180
number of gaps/n6
gap thickness/mm1
yoke width/mm180
column width/mm40
The height of the tortilla/mm30
Table 7. Comparison of vibration reduction effect before and after air gap length improvement.
Station NumberABCMean Value
before improvement/m·s−20.9839761.386900.9793531.11674
after improvement/
m·s−2
0.9205311.220780.9448551.02872
relative acceleration reduction/%6.89213.613.6518.051
Table 8. Comparison of vibration reduction effect of electrical steel sheet before and after improvement.
Station NumberABCMean Value
before improvement/m·s−20.9839761.386900.9793531.11674
after improvement/
m·s−2
0.9260631.335250.9261361.06248
relative acceleration reduction/%6.2543.8685.7465.107
Table 9. Comparison of vibration reduction effect before and after comprehensive improvement.
Station NumberABCMean Value
before improvement/m·s−20.9839761.386900.9793531.11674
after improvement/
m·s−2
0.9039111.188580.9095471.00068
relative acceleration reduction/%8.85816.687.67411.60
Disclaimer/Publisher’s Note: The statements, opinions and data contained in all publications are solely those of the individual author(s) and contributor(s) and not of MDPI and/or the editor(s). MDPI and/or the editor(s) disclaim responsibility for any injury to people or property resulting from any ideas, methods, instructions or products referred to in the content.