Abstract
Concepts, such as power and condition monitoring or smart systems, are becoming increasingly important but require extensive insight into the process or machine, which is mostly gained by additional sensors. However, this development is contrasted by growing global competition and cost pressure. The measurement concept of a soft flow rate sensor presented here, addresses this discrepancy by means of a cost-effective software-based sensor, utilizing the dependence between flow rate and flow force in hydraulic spool valves. In the presented work, the feasibility of the introduced approach and the anticipated challenges, such as the modeling of disturbances in the mechanical, fluidic and electromagnetic subdomain, are assessed. For this purpose, important phenomena influencing measurement accuracy are identified on the basis of previous work. With the help of these findings, a greatly simplified version of the soft sensor is built and evaluated with a commercial valve to perform an initial test of the concept. Regardless of future implementations, the soft sensor concept presented here may have limitations in terms of dynamics and accuracy. However, the aim is not to replace a classic flow rate sensor, such as a gear sensor, but rather to create a cost-effective way to determine the flow rate without any additional integration effort.
1. Introduction
Numerous efforts are being made to integrate more functionalities into hydraulic drive components. During this development, power and condition monitoring, smart systems and the creation of redundancies to increase safety are becoming more and more important but require extensive insight into the process or the machine. This information is mostly obtained using measurement data and additional sensors. However, the development is contrasted by cost pressure as well as the aim to reduce system complexity and integration effort, fueled by growing global competition.
The measurement concept presented here addresses this predicament with cost-effective software-based flow rate sensors, taking advantage of the dependence between flow rate and flow force.
A spool valve is a device that regulates the flow within a hydraulic system. It typically consists of a spool, moving within a valve body. An actuator, such as a solenoid, is used to move the spool. A position sensor, if present, detects the position of the spool and provides feedback to the control system.
The fluid flowing through the valve causes a flow force acting on the spool, which particularly depends on the spool position and flow rate. For most industrially relevant valves, this relationship is unambiguous, meaning, if the spool position and flow force are known, the flow rate can be inferred. The flow force commonly acts in the closing direction of the valve, counteracting the solenoid or spring (depending on the configuration). As shown in Figure 1, this results in an equilibrium of forces, consisting of the axial force of the actuator, the flow force , the inertial force , the friction force and a spring force , holding the spool in a predefined position. If the inertial, frictional and spring forces are known, the flow force can be deduced from the actuator force. The works [1,2] refer to this possibility. The axial force can be estimated from the state variables of the solenoid (current, voltage and position). In this study, spool valves with proportional solenoids and position feedback are considered.
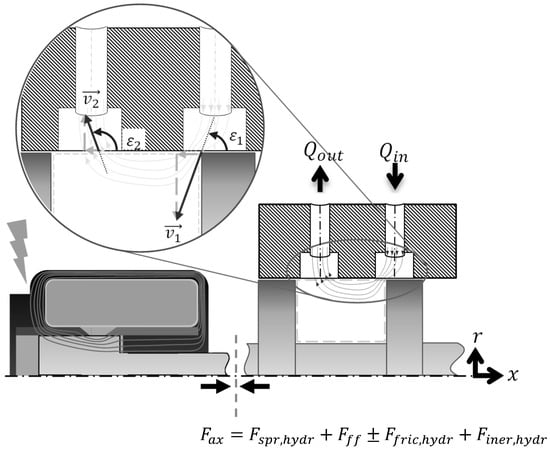
Figure 1.
Valve with Solenoid and Axial Forces.
In summary, as illustrated in Figure 2, with the measurement concept, the state variables of the solenoid current , voltage and the armature position are used to infer the solenoid force , which, in turn, is used to determine the flow force and, thus, the flow rate . Depending on the valve configuration, the variables required to determine the flow rate are already available in the control electronics. Thus, additional functionality can be provided cost effectively by extending the control software.

Figure 2.
Measurement Concept of the Soft Sensor.
The measurement concept presented might be limited in terms of dynamics and accuracy. However, the aim is not to replace a classic flow rate sensor, such as a gear sensor, but rather to create a cost-effective way to determine the flow rate without an additional integration effort. Especially in machines and plants where no flow rate sensors can be installed for economic reasons, this concept offers additional information. The information can be used for power and condition monitoring, for monitoring tasks or for application-specific purposes.
Due to the wide use of magnetically actuated spool valves, there are various preliminary works within individual subdomains [1,2,3,4,5]. However, none of these works combine these findings into a sensor concept comparable to the one proposed in this paper.
The basis of the presented soft sensor is a model of the valve system, which allows for the deduction of the flow rate from given state variables.
A model, especially a real-time model, is always a trade-off between model accuracy and computation time. As such, important mechanisms significantly affecting the system behavior must be identified. Hence, in the following section, based on relevant preliminary work, system properties are identified that could influence the measurement concept and must, therefore, be taken into account in the modeling. Subsequently, a simplified model is created on the basis of experimental data, which is intended to represent a static/low dynamic system. Finally, an initial metrological investigation using a commercially available valve is carried out, and the concept is tested in practice.
2. Literature Review, Conception of the Soft Sensor and Identification of Relevant System Properties
In this section, with the help of relevant literature, the concept of soft sensors is briefly explained, a model structure is developed and the main mechanisms of the system are identified.
A soft sensor is a software-based system using mathematical algorithms to estimate process variables or properties that are not directly measured by physical sensors from known variables. It can provide real-time monitoring and control of industrial processes by predicting key process variables. While soft sensors are also models, they are more specialized and are focused on estimating the value of a specific variable in a particular process or system [6].
According to [6,7], it is possible to distinguish soft sensors into model- or physically driven sensors and data-driven sensors. The former models are also called white box models and have complete phenomenological knowledge about the process. Data-driven models are also called black box models because they are based on empirical observations and have no knowledge about the process. White and black box models represent the two extremes. Between these two main types, numerous gradations/combinations are possible. For example, parts of a model-driven soft sensor can be realized by data-driven sub models that cannot be easily represented by physical models. These models are referred to as hybrid or grey box models.
Soft sensors have been used for several decades in monitoring and control, especially in the process industry.
Partly, this is because process industries typically involve complex processes and systems that include a wide range of process variables. Many of these variables are difficult or expensive to measure and require the use of costly sensors or specialized instrumentation. Soft sensors provide a cost-effective way to estimate these variables. Due to the complexity of the processes, analytical descriptions are often difficult. Given the historical data that are often available, data-driven approaches are commonly used. In [6,7,8], detailed examples and an overview of the applications and the design of soft sensors are presented.
In fluid technology, soft sensors have not yet been widely used. Examples can be found for the determination of the flow rate of pumps, for example, by [9,10,11]. In the works of [12,13], several soft sensors for hydraulic components based on simple physical models are presented and combined to sensor networks. In contrast to the approaches presented in [12,13], no additional sensors are required for the proposed measurement concept. Furthermore, the focus lies on a more detailed modeling of the component.
Therefore, it is aimed at a physically motivated model with physical- and data-driven sub models, i.e., a grey box model.
Based on the descriptions in Section 1, a conceptual structure of the soft sensor and its sub models is derived, as shown in Figure 3. The soft sensor can be divided into two main subsystems: The actuator and the valve.
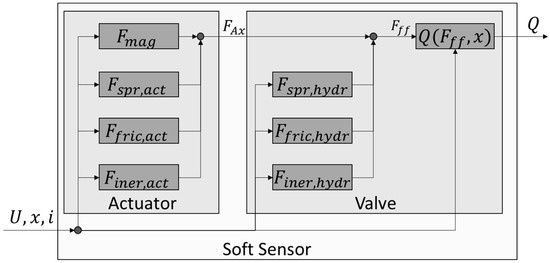
Figure 3.
Conceptual Structure of the Soft Sensor.
These sub models are coupled by the axial force , as shown in Equation (1). The axial force exerted by the actuator is obtained by offsetting the estimated magnetic force with the force of the actuator spring , the frictional force acting in the actuator and the acceleration force on the armature . In the valve model, the axial force is offset with the force of the valve spring , the friction force in the valve and the acceleration force at the spool to obtain the flow force. The flow force is then used to determine the flow rate .
The described forces, their underlying mechanisms and the relationship between flow force and flow rate are considered in the following sections. Following the measurement procedure shown in Figure 2, the analysis begins with the relationship between the flow rate and the flow force and, thus, with the valve. Subsequently, the actuator and the influences on it are considered.
2.1. Flow Force–Flow Rate Relationship
Flow forces act on the spool and the sleeve/housing due to changes in momentum of the fluid in the valve chamber. These forces are usually considered as a disturbance variable in the position control of the spool. They can be divided into static and dynamic flow forces. Static flow forces are those continuously exerted by the fluid, even when the spool is at rest and the flow rate is constant. Static flow forces usually act in a closing manner. They have been investigated in numerous works, such as [3,14,15,16], often with the aim of reducing the flow forces in order to decrease the required actuation force. Dynamic flow forces usually result from the acceleration or deceleration of the fluid in the valve chamber, for instance, when the spool moves, or pressure or flow rate pulsation occurs. Dynamic flow forces can act in both opening and closing directions.
There are different approaches to determine the flow forces, including analytical calculation, determination by CFD simulation, as well as by measurement. For the analytical calculation of the flow forces, the approach formulated in Equation (2) proposed by Schmitz and Murrenhoff [17] can be used. It has been applied in several works [3,14,18,19] and has been extensively studied by Bordowski [3].
The first two expressions in Equation (2) describe the steady-state flow force; the third describes the dynamic flow force. The areas and denote the in- and outlet metering areas, the angles and the in- and outflow angles, the density of the fluid, Q the flow rate and the flow force acting on the spool in axial direction. When examining the analytical description, it becomes evident that influences which change the fluid density, the flow angles or geometric parameters, have a direct effect on the relationship between the flow force and flow rate. These influences are considered in more detail subsequently.
2.1.1. Influence of the Oil Properties
Considering Equation (2), it can be seen that the density and, thus, the fluid temperature influence the magnitude of the flow forces. For a common hydraulic oil, for example, mineral oil of type HLP46, the density changes up to 3% with a change in oil temperature of 50 °C.
The results of Schuster et al. [20], Yuan et. al [1], Bordowski et al. [21] and Hucko et al. [19] suggest that changes in viscosity due to temperature variation also affect the flow forces. In the latter investigation, a temperature change of 50 °C (30→80 °C) at a constant flow rate caused a maximum decrease in flow force of 23%.
Relating these findings to the presented measurement concept, such a temperature-induced change in the flow force–flow rate relationship, if not considered, would lead to a significant estimation error. In addition to investigating the temperature influence on the flow force–flow rate relationship, Hucko et al. [19] presented a method to compensate for this influence at a known temperature.
In many systems, the oil temperature is roughly known. In addition, some valves already have temperature sensors or have the capability to receive temperature values from other modules within a modern automation architecture [22]. In summary, the influence of the fluid temperature can and should be considered in the soft sensor.
2.1.2. Geometric Factors
In addition to the oil properties, geometric factors, such as the distance between in- and outflow ports [23], metering edges, radial clearance [24], geometry of the spool chamber and metering area, have a considerable influence on the flow forces.
Changes in valve geometry, for example, in the metering edges, can occur due to wear, which may alter the in- and outflow angles and, thus, the flow force–flow rate characteristics. At present, the author is not aware of any studies on the extent to which wear of the metering edges affects the flow force–flow rate relationship.
In addition to wear, geometric parameters can vary due to temperature changes and the associated material expansion. For the valves considered, the clearance between the spool and sleeve/housing as well as the metering areas are of particular interest. The change in clearance can be compensated for by matching the expansion coefficients of the spool and sleeve to another. To ensure safe operation in the operating range, this is usually accounted for in the design. According to Hucko et al. [19], the change in opening areas has a negligible effect on the flow force–flow rate relationship for the nominal size 6 valves considered there. However, a change in temperature can have an effect on more than just the geometric variables. The sensors installed in valves to detect the spool or armature position can be influenced by temperature changes. This drift is usually specified in the data sheets of the sensors and can be adjusted for with little effort, provided the temperature is known. For commercially available linear variable differential transformers (LVDTs), often used in valves, the drift is 0.01–0.02% F.S./K.
In summary, to date, little research has been devoted to wear-related influences on the flow force. Additionally, the temperature-related influence of geometric variables has a minor effect on the flow force–flow rate relationship, according to current research. The influence of position sensors, however, should be considered, depending on the mounting position and operating temperature span.
2.1.3. Influence of Frictional Forces in the Valve
The central idea of the presented soft sensor is to infer the flow rate from the flow forces. Flow forces cannot be measured directly. However, they can be calculated from the sum of the axial forces acting on the spool. For this purpose, the frictional forces acting on the spool must be taken into account.
Friction can be differentiated according to the type of friction, into solid, boundary, mixed and fluid friction, as well as according to the kinematics in static, sliding and rolling friction [25]. The annular seal usually used in spool valves causes a permanent leakage flow, resulting in a liquid film in the clearance between the spool and the valve sleeve/housing. In most cases, solid sliding friction and liquid friction are superimposed. The frictional force depends on the surface condition, the clearance, the viscosity of the oil, the spool velocity and the acting normal force [16].
Lu and Tiainen [26] investigated friction in spool valves, both simulatively and experimentally, and were able to identify radial flow and pressure forces as the main contributors. These occur when the flow around the metering edge is not symmetrical and radial forces, therefore, do not completely negate each other. It was also shown that the radial forces caused by static pressure increase linearly with the pressure difference.
The friction occurring in spool valves was investigated for valves of different sizes in [18,19]. Here, an assumption was made that the amount of friction during opening and closing of the valve is the same. By averaging the axial force recorded during the opening and closing process, the flow forces can be calculated. The measurements showed a high repeatability of the measured axial forces and, thus, good reproducibility of the friction. It was shown that the frictional forces account for a non-negligible proportion of the axial force. The investigations mentioned were limited to the quasi-static movement of the spool. If the Stribeck curve described in [25] is taken into consideration, a decrease in the frictional force can be expected as the spool velocity increases.
In conclusion, it can be stated that friction forces should be considered in the sensor concept, in order to improve the determination of the flow forces. The described dependence on operating parameters, such as speed, should also be accounted for. In case the dependence of the friction forces on pressure difference or flow rate is observed for the investigated valve, the flow rate calculated by the soft sensor could be fed back and used for a better estimation of the friction.
2.1.4. Dynamic Influences
As previously mentioned, movement of the spool as well as pressure pulsations lead to an acceleration of the fluid in the valve chamber and cause dynamic flow forces. Del Vescovo and Lippolis [27] analyzed these, using the law of the conservation of momentum and CFD simulation. They found that the influence of the spool movement up to a velocity of 1 m/s, which corresponds to an opening time of 20 ms (for a common stroke of 2 mm), as well as pressure pulses up to 1 kHz are negligible and the consideration of static flow forces is sufficient. Manring and Zhang [28] investigated the influence of the dynamic flow forces experimentally and argued that the pressure transient term needs to be considered but did not elaborate further.
Nakada and Ikebe [29] also studied the influence of dynamic flow forces experimentally and found a correlation between the damping length and the magnitude of the dynamic flow forces. In the valves investigated, the static flow forces were dominant. An influence of the dynamic flow forces was found from 20 Hz.
Tanaka and Kamata [2] examined the flow forces occurring in a spool valve using three-dimensional unsteady CFD simulations and analytical models. The spool-sleeve geometry was described as complex, due to radial cylindrical notches, which were explicitly taken into account. Validation was performed mathematically using the law of momentum as well as experimentally by comparing measured static flow forces to the calculated ones. It was found that in the analytical calculation, both the inflow and outflow angles must be considered. Furthermore, it was shown that an assumption of constant flow angles leads to increased deviation. The influence of dynamic flow forces was examined for a spool movement of 100 Hz at full stroke. It was concluded that the velocity and acceleration terms are negligible. Only the damping term contributes 7% to the flow forces at the given excitation.
In summary, the preliminary simulative and experimental work of [2,27,28,29], amongst others, dealt with the influence of the spool movement and the pressure pulsation on the flow forces. The studies show that, for the valves considered, the influence is most significant in case of increased dynamics.
2.2. Disturbances Occurring at the Solenoid
In the presented measurement principle, the electromagnet used for positioning the spool simultaneously serves to measure the axial force. For this purpose, the unknown actuator force, generated by the solenoid, needs to be inferred from the known state variables, voltage, current and armature position.
The current force characteristic of proportional solenoids is usually manipulated by constructive measures, so that the force generated is proportional to the current, regardless of the valve position. Despite intensive efforts, this proportionality is limited, even when restricted to certain stroke ranges. In addition to a nonlinear current and position dependence, a pronounced force hysteresis can usually be observed, especially in proportional solenoids. The hysteresis is caused by various overlapping effects. For a precise and computationally efficient force estimation, the effects with the most significant influence have to be modeled.
According to [30], mechanical friction between the armature and the pole tube, eddy currents and magnetic hysteresis contributes significantly to the force hysteresis. These effects and common approaches to modeling them are described in [30]. In static conditions, experience shows that the force hysteresis using dithers is between 2 and 10% of the total force of the actuator. As the current rate increases, so does the effect of eddy currents. Neglecting this effect would lead to a significant deviation between the model and system and, thus, must be accounted for.
2.3. Summary
The described system properties and mechanisms influence the accuracy of the presented soft sensor. By measuring and modeling these influences, the estimation error can be reduced.
For the valve sub model, the influence of the fluid temperature as well as that of the state-dependent friction and, at higher spool speeds, dynamic influences should be considered. The latter ought to be modeled as part of the flow force–flow rate relationship.
For the actuator sub model, the friction occurring between the armature and the pole tube, the magnetic hysteresis and eddy currents must be taken into account. The magnetic hysteresis and eddy currents should be considered within the magnetic force estimation.
3. Simplified Model and Parameterization
To verify the feasibility of the described sensor concept, it was implemented in simplified form, using a commercially available valve, as shown in Figure 4. The modeled valve is a proportional 4/3-way valve of nominal size 6. It is equipped with position feedback and built-in electronics.
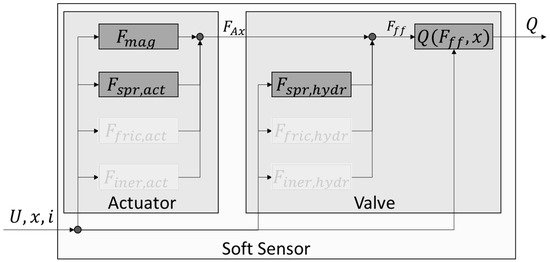
Figure 4.
Simplified Soft Sensor Model.
As discussed, friction in both the solenoid and the valve is dependent on system variables that change during operation, thus requiring a complex model to sufficiently describe the friction within the system. To provide an initial assessment, the friction is, therefore, not modeled. Instead, the measured force and the flow rate hysteresis are averaged. Since the validation is limited to a quasi-static case, the acceleration forces are omitted. This simplifies the model shown in Figure 3 to that in Figure 4.
As depicted in this figure, only the two most important relationships, the estimation of the solenoid force and of the flow rate, are considered. In this way, the model offers the possibility to validate the basic function of the concept. Since all other phenomena described in Section 2 are neglected, an upper estimation error can be determined. The magnetic force is estimated using the electrical quantities and position. The estimation of the flow rate is made using the flow force and the position. The spring forces are also taken into account.
To model the generation of the magnetic force and the flow force–flow rate characteristic, lookup tables determined by measurements were used. Their determination is explained in the following.
Using the setup described in [19], the axial force was determined for different flow rates and piston positions. Pressure and temperature, upstream and downstream of the considered metering edge, as well as the flow rate, were also recorded. The axial force was measured with a load cell. The purpose of these measurements was to determine the relationship between flow force, position and flow rate. Intuitively, it would, therefore, make sense to adjust the flow rate across the considered metering edge and to open and close the valve. However, since pressure sensors have significantly higher dynamics than flow rate sensors, better results could be achieved by controlling the pressure difference.
To record the characteristic diagram, the valve was opened and closed, while a constant pressure difference across the metering edge was maintained. This was repeated for the different pressure differences shown in Figure 5.
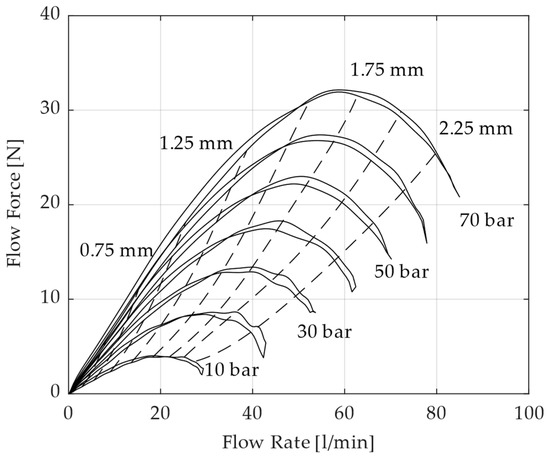
Figure 5.
Relationship Between Spool Position, Axial Force and Flow Rate.
Since the valve was opened and closed at each set pressure difference, the hysteresis of the axial force was also recorded. To determine the flow force, the assumption is made that the friction in both directions of movement has the same value but a different sign, as described in [19]. Hence, the flow force was obtained by averaging the two measured curves of axial force of each pressure difference. The curves were then interpolated, so that the flow rate can be determined for any spool position and flow force. In Figure 5, it can be seen that if the hysteresis is neglected, the relationship between flow rate, flow force and position is always unique for the measured valve. Thus, for a given flow force and position, the flow rate can be calculated. A further examination of the measured curves shows that the slope of the dashed position curves is a good indicator for the sensitivity of the used correlation. As the slope of these lines increases, so does the accuracy with which the flow rate can be inferred from the flow force and position.
For the determination of the magnetic force, a metrologically obtained lookup table was used. It was generated by measuring the magnetic force at different currents and positions. Due to the simplified approach, the applied voltage was not used for modeling. The setup shown in Figure 6 and Figure 7 was used to measure the magnetic force. The test setup was designed to allow for precise measurement of a wide variety of valve solenoids. Figure 6 shows the mechanical part of the test rig.
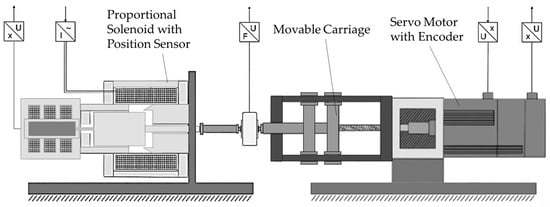
Figure 6.
Schematic Depiction of the Mechanical Setup for Measuring Solenoids. On the left, the Solenoid to be Measured.
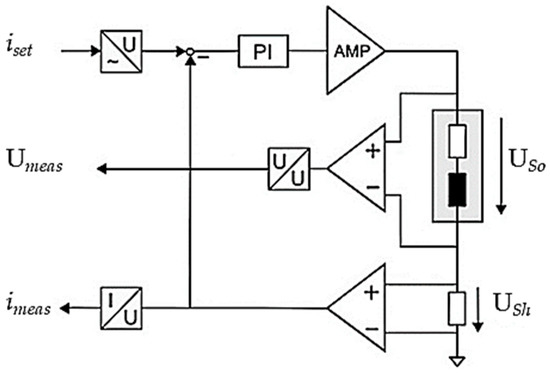
Figure 7.
Electrical Schematic for Measuring Solenoids.
On the left side, the solenoid to be measured is mounted in a rigid frame. A movable carriage driven by a servo motor allows for precise, dynamic positioning of a mechanical stop against which the armature presses. The force generated by the armature is recorded by a force sensor (MES KM40). Both the position of the armature and the position of the carriage are measured to precisely control the armature position and eliminate possible position deviations, e.g., due to backlash or the limited stiffness of the force sensor.
Figure 7 schematically shows the electrical part of the experimental setup. The circuit consists of the solenoid itself, an amplifier and a low-side measurement shunt (3 Ω 0.02%) for current measurement. The amplifier (Kikusuiu PBZ80-5) allows for, in push/pull configuration, the application of arbitrary currents and voltages. The solenoid is highlighted by a gray rectangle and is represented by an inductor and an ohmic resistor. The temperature change in the measurement shunt is small due to sufficient cooling. The resulting change in resistance is, therefore, negligible. The voltage is measured across the solenoid. The synchronized acquisition of voltage, current and force is carried out using a measuring amplifier (MC USB 404-60).
The force characteristics determined with this measurement setup are shown in Figure 8. In order to avoid static friction at a constant current, the armature was moved quasi-statically between the stops using the servo motor shown in Figure 6. The position was detected using the actuator’s own position sensor.
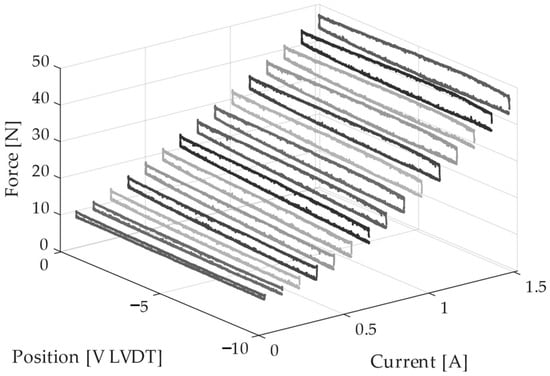
Figure 8.
Measured Force Characteristics of a Solenoid.
The equally shaded lines on top of each other represent the force progression with ascending and descending directions of movement for each current step. The force hysteresis is clearly visible. The solenoid’s air gap is reduced with decreasing voltage of the LVDT. The force increasing with the growing air gap can be observed, especially with proportional magnets, and is due to the design influence on the force characteristics. The hysteresis width increases with the current. This can be seen from the growing distance between the force curves measured at the same current. Without using a dither signal, the force hysteresis for this solenoid is 1–5 N. According to [30], the static force hysteresis of the magnet depends mainly on the radial magnetic flux and the material hysteresis and, thus, on the momentary state of excitation. However, modeling this relationship would exceed the scope of this paper. Therefore, a simplified approach was chosen to validate the sensor concept. The individually recorded hysteresis curves were averaged and then interpolated, resulting in a lookup table, which provides the magnetic force for a given current and position.
4. Validation of the Sensor/Measurement Concept
In order to validate the soft sensor concept, the determined characteristic diagrams and the measured spring constants were combined to form a simplified model, as shown in Figure 4. This model was then tested with measured data. The test data were generated on a test rig using the methods described in Section 3. A differential pressure of 60 bar was applied across the control edge PB of the valve, and the spool was opened and closed at a rate of 5%/s. During the measurement, the current through the coil and the flow rate were recorded. The measured flow rate is shown by a solid line in Figure 9. Simultaneously, the flow rate was estimated using the soft sensor and is represented by a dashed line.
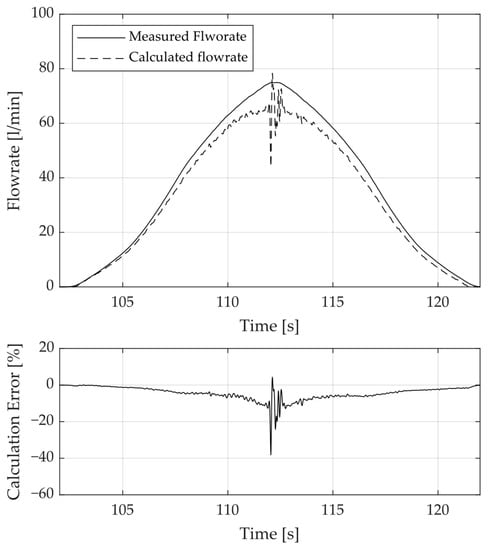
Figure 9.
Measured and Estimated Flow Rate while Opening and Closing the Valve.
Examining Figure 9, it can be seen that a qualitative estimation of the flow rate is possible even with the use of a condensed model. The error between measured and estimated flow rate grows with increasing flow rates to up to 9 L/min or 11% FS and is maximum at the reversal point of the signal, with up to 30 L/min or 38% FS. The maximum flow rate of the valve is 80 L/min and defines the full-scale value. Other measurements also showed an increased estimation error with growing valve openings and flow rate.
It is assumed that with increasing flow rate, the flow and pressure distribution around the metering edge is no longer symmetrical. Therefore, radial flow forces and static pressures no longer fully compensate. This leads to a force, which acts perpendicular to the direction of movement. It creates friction and depends on the flow rate and the position of the spool. The frictional force depends on the perpendicular acting force and, therefore, on the operating point. This was confirmed by further measurements.
The oscillation clearly visible at the reversal point, when the spool is at rest, increases with the flow rate or flow force. In a more detailed examination, the current imposed by the valve control and the resulting forces were examined. The current profile shows that the position controller exhibits pronounced oscillations when the spool is at rest, increasing with the flow rate.
It was observed that if the spool is stationary with only a slight control error, the current and, therefore, the axial force is increased by the controller until static friction is overcome. This causes an overshoot of the spool position and the force is reduced until the spool slips again below the target position. For a conventional application, this behavior is not a problem, as the change in spool position and flow rate is negligible. In this concept, however, the mechanism is relevant.
The solenoid current serves as the input of the model and is used to determine the actuator force and, subsequently, the flow force. Without modelling static friction forces, the determination of the flow force from the axial force exhibits high errors.
In terms of frictional forces, increasing dynamics could have a positive effect, as static friction forces would be reduced. However, when increasing the dynamics, the acceleration forces, the dynamic flow forces described in Equation (2) and the eddy currents must be taken into account.
As already shown in Figure 5, various combinations of spool positions and flow rates are possible during operation. For this reason, the validation was also carried out for other pressure differences, as depicted in Figure 10. Like before, over the control edge PB of the valve, five various differential pressures of 30, 40, 50, 60 and 70 bar were applied. At each pressure level, the spool was opened and closed at a rate of 5%/s. This leads to the measured triangular increasing and decreasing flow rate signal represented by a solid line. The estimated flow rate is indicated by a dashed line. The error between the estimated and measured flow rate is given as before. Figure 10 shows that for the other pressure levels considered, the error also grows with increasing valve opening or flow rate. In all measurements, the error is greatest when the spool is at rest, while the direction of movement is changed. This observation can be explained by the occurrence of frictional forces described above. Both at the second pressure level of 40 bar and at the last level of 70 bar, sharp increases in the measurement error can be observed. After further examination, these could be traced back to acquisition errors of the position signal. In order to make the soft sensor more robust against such errors, future models will aim at filtering the position signal.
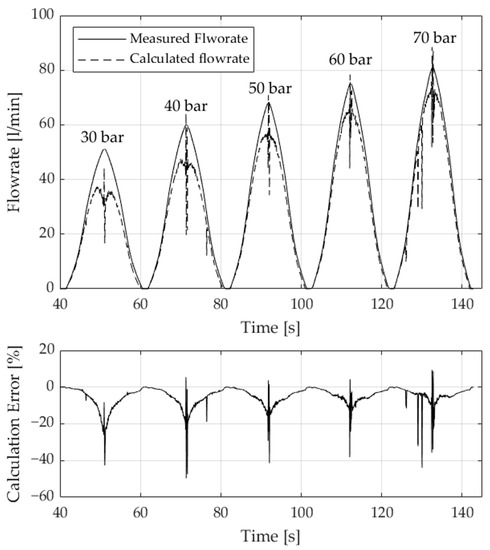
Figure 10.
Measured and Estimated Flow Rate while Opening and Closing the Valve at differential Pressure Levels of 30–70 bar.
5. Conclusions and Results
In this paper, a new concept for measuring the flow rate with a soft sensor is presented. The concept uses the relationship between the flow rate and the flow forces in valves. To measure the flow forces, the solenoid is not only used to position the spool but also as a force sensor. With the electrical parameters and the valve position, which are both already recorded by the valve controller, the flow forces and from these the flow rate can be derived with a suitable model. In the first section of the paper, the basic concept was explained, and relevant preliminary work was briefly summarized. Subsequently, important mechanisms and phenomena which affect the measurement concept were identified. To examine whether the presented concept can be practically implemented, a condensed version of the soft sensor was realized with a commercially available valve. In this model, only the flow and spring forces were considered to determine the flow rate. Other influences, such as friction, inertial and dynamic flow forces, were not taken into account. In the actuator sub model, phenomena, such as magnetic hysteresis, eddy currents and friction, causing hysteretic behavior of the actuator force, were not considered. During validation of the soft sensor, the flow rate could be measured at low dynamics with an error of less than 9 L/min or 11% FS (FS: 80 L/min). The maximum measured flow rate was 76 L/min. The accuracy of estimation decreases significantly with decreasing flow rate or smaller valve opening. When the spool is at rest, frictional forces cause oscillations of the position controller, increasing the error up to 30 L/min or 38% FS. It is expected that by taking the frictional forces into account, the estimation error can be significantly reduced.
Overall, it is shown that the presented soft sensor concept applied to a commercially available valve can be used to estimate the flow rate. The estimation of the flow rate can be further improved in future works by more detailed modeling of the valve and the actuator to include identified relevant phenomena. After further enhancements of the soft sensor, a sensitivity analysis for the valve and actuator variables as well as an uncertainty analysis are planned for future work.
However, the aim of this soft sensor is not to replace conventional flow rate sensors. With the achievable accuracy, this concept is more suitable for cost-effective applications to estimate the flow rate from data already known in the valve control. Possible applications include power or condition monitoring as well as smart systems.
Author Contributions
Conceptualization, S.H. and H.K.; Methodology, S.H.; Software, S.H. and H.K.; Validation, S.H. and H.K.; Formal analysis, S.H.; Investigation, S.H.; Data curation, H.K.; Writing—original draft, S.H.; Writing—review & editing, S.H., H.K. and K.S.; Visualization, S.H. and H.K.; Supervision, S.H. and K.S.; Project administration, S.H.; Funding acquisition, S.H. and K.S. All authors have read and agreed to the published version of the manuscript.
Funding
This research was funded by Forschungskuratorium Maschinenbau e.V.–FKM, grant number 7052200.
Data Availability Statement
The data are not publicly available. The data presented in this study are available upon request from the corresponding author if the institution funding the project agrees to their disclosure.
Conflicts of Interest
The authors declare no conflict of interest.
Nomenclature
| Oil density [kg/] | |
| Q | Flow Rate [ |
| Metering Areas [] | |
| Flow angle [°] | |
| x | Spool Position [mm] |
| Momentum [kg m/s] |
References
- Yuan, Q.; Singh, S.; Kulkarni, A. Flow Forces Investigation through Computational Fluid Dynamics and Experimental Study. In Proceedings of the Symposium of 9th International Fluid Power Conference, Aachen, Germany, 24–26 March 2014; pp. 101–109. [Google Scholar]
- Tanaka, K.; Kamata, K. Steady and Unsteady Flow Force acting on a Spool Valve. In Proceedings of the Fluid Power and Motion Control, FPMC, Bath, Great Britain, 12–14 September 2012; pp. 451–465. [Google Scholar]
- Bordovský, P. Evaluation of Steady-State Flow Forces in Spool Valves; Shaker Verlag: Düren, Germany, 2019; ISBN 9783844066999. [Google Scholar]
- Kallenbach, E.; Eick, R.; Ströhla, T.; Feindt, K.; Kallenbach, M.; Radler, O. Elektromagnete: Grundlagen, Berechnung, Entwurf und Anwendung, 5th ed.; Vieweg: Wiesbaden, Germany, 2018; ISBN 9783658147884. [Google Scholar]
- Vaughan, N.D.; Gamble, J.B. The Modeling and Simulation of a Proportional Solenoid Valve. J. Dyn. Syst. Meas. Control 1996, 118, 120–125. [Google Scholar] [CrossRef]
- Fortuna, L.; Graziani, S.; Rizzo, A.; Xibilia, M. Soft Sensors for Monitoring and Control of Industrial Processes; Springer: London, UK, 2007; ISBN 9781846284809. [Google Scholar]
- Kadlec, P.; Gabrys, B.; Strandt, S. Data-driven Soft Sensors in the process industry. Comput. Chem. Eng. 2009, 33, 795–814. [Google Scholar] [CrossRef]
- Desai, K.; Badhe, Y.; Tambe, S.S.; Kulkarni, B.D. Soft-sensor development for fed-batch bioreactors using support vector regression. Biochem. Eng. J. 2006, 27, 225–239. [Google Scholar] [CrossRef]
- Ahonen, T. Monitoring of Centrifugal Pump Operation by a Frequency Converter; Lappeenranta University of Technology: Lappeenranta, Finland; Lappeenrannan Teknillinen Yliopisto: Lappeenranta, Finland, 2011; ISBN 9789522650757. [Google Scholar]
- Leonow, S.; Monnigmann, M. Soft sensor based dynamic flow rate estimation in low speed radial pumps. In Proceedings of the European Control Conference, Zurich, Switzerland, 17–19 July 2013; IEEE: Piscataway, NJ, USA, 2013; pp. 778–783, ISBN 978-3-033-03962-9. [Google Scholar]
- Jia, Y.F.; Gu, L.C.; Tian, Q.Q. Soft-Sensing Method for Flow of the Variable Speed Drive Constant Pump. AMM 2013, 318, 55–58. [Google Scholar] [CrossRef]
- Pelz, P.F.; Dietrich, I.; Schänzle, C.; Preuß, N. Towards digitalization of hydraulic systems using soft sensor networks. In Proceedings of the 11 International Fluid Power Conference, Aachen, Germany, 21–23 March 2022. [Google Scholar]
- Hartig, J.; Schänzle, C.; Pelz, P.F. Validation of a soft sensor network for condition monitoring in hydraulic systems. In Proceedings of the 12th International Fluid Power Conference, Dresden, Germany, 19–21 March 2020; Volume 2, pp. 167–173. [Google Scholar]
- Schrank, K.; Murrenhoff, H. Beschreibung der Strömungskraft in Längsschieberventilen mittels Impulserhaltung. O+P-Journal 2013, 4, 4–15. [Google Scholar]
- Opitz, H. Über Die Dynamische Stabilität Hydraulischer Steuerungen Unter Berücksichtigung der Strömungskräfte; VS Verlag fur Sozialwissenschaften GmbH: Wiesbaden, Germany, 1964; ISBN 9783663073451. [Google Scholar]
- Merrit, H.E. Hydraulic Control Systems; Wiley: New York, NY, USA, 1967; ISBN 0471596175. [Google Scholar]
- Schmitz, K.; Murrenhoff, H. Umdruck zur Vorlesung Grundlagen der Fluidtechnik/Hubertus Murrenhoff; Vollständig neu Bearbeitete Shaker Verlag: Düren, Germany, 2018; ISBN 9783844062465. [Google Scholar]
- Bordovsky, P.; Schmitz, K.; Murrenhoff, H. CFD Simulation and Measurement of Flow Forces Acting on a Spool Valve. In Proceedings of the 10th International Fluid Power Conference, Dresden, Germany, 8–10 March 2016. [Google Scholar]
- Hucko, S.; Vonderbank, V.; Krampe, H.; Schmitz, K. Investigation of the influence of Fluid Temperature on Flow Forces in Spool Valves. In Proceedings of the 18th Scandinavian International Conference on Fluid Power, SICFP’23, Linköping, Sweden, 30 May–1 June 2023. [Google Scholar]
- Schuster, G. CFD-Gestützte Maßnahmen zur Reduktion von Strömungskraft und Kavitation am Beispiel eines hydraulischen Schaltventils; Shaker: Aachen, Germany, 2005; ISBN 3832244662. [Google Scholar]
- Bordovsky, P.; Murrenhoff, H. Investigation of Steady-State Flow Forces in Spool Valves of Different Geometries and at Different Oil Temperatures With the Help of Measurements and CFD Simulations. In Proceedings of the Symposium on Fluid Power and Motion Control, FPMC2016. Bath, UK, 7–9 September 2016. [Google Scholar]
- Alt, R.; Murrenhoff, H.; Schmitz, K. A survey of “Industrie 4.0” in the field of Fluid Power–challenges and opportunities by the example of field device integration. In Proceedings of the 11th International Fluid Power Conference, Aachen, Germany, 19–21 March 2018. [Google Scholar]
- Tatar, H. Störkräfte bei Elektromagnetisch Betätigten Wegeventilen. Ph.D. Thesis, RWTH, Aachen, Germany, 1974. [Google Scholar]
- Kipping, M. Experimentelle Untersuchungen und numerische Berechnungen zur Innenströmung in Schieberventilen der Ölhydraulik. O+P-Journal 1997, 42, 12. [Google Scholar]
- Czichos, H.; Habig, K.-H. (Eds.) Tribologie-Handbuch: Tribometrie, Tribomaterialien, Tribotechnik; Springer: Wiesbaden, Germany, 2015; ISBN 9783834822369. [Google Scholar]
- Lu, Q.; Tiainen, J.; Kiani-Oshtorjani, M.; Wu, Y. Lateral Force Acting on the Sliding Spool of Control Valve Due to Radial Flow Force and Static Pressure. IEEE Access 2021, 9, 126658–126669. [Google Scholar] [CrossRef]
- Del Vescovo, G.; Lippolis, A. A Review Analysis of Unsteady Forces in Hydraulic Valves. Int. J. Fluid Power 2006, 7, 29–39. [Google Scholar] [CrossRef]
- Manring, N.D.; Zhang, S. Pressure Transient Flow Forces for Hydraulic Spool Valves. J. Dyn. Syst. Meas. Control 2012, 134, 034501. [Google Scholar] [CrossRef]
- Nakada, T.; Ikebe, Y. Measurement of the Unsteady Axial Flow Force on a Spool Valve. IFAC Proc. Vol. 1980, 13, 193–198. [Google Scholar] [CrossRef]
- Hucko, S.; Matthiesen, G.; Reinertz, O.; Schmitz, K. Investigation of Magnetic Force Hysteresis in Electromechanical Actuators. Chem. Eng. Technol 2023, 46, 158–166. [Google Scholar] [CrossRef]
Disclaimer/Publisher’s Note: The statements, opinions and data contained in all publications are solely those of the individual author(s) and contributor(s) and not of MDPI and/or the editor(s). MDPI and/or the editor(s) disclaim responsibility for any injury to people or property resulting from any ideas, methods, instructions or products referred to in the content. |
© 2023 by the authors. Licensee MDPI, Basel, Switzerland. This article is an open access article distributed under the terms and conditions of the Creative Commons Attribution (CC BY) license (https://creativecommons.org/licenses/by/4.0/).