
Combined Passive/Active Flow Control of Drag and Lift Forces on a Cylinder in Crossflow Using a Synthetic Jet Actuator and Porous Coatings


Abstract
:1. Introduction
1.1. Synthetic Jet Actuators
1.2. Porous Coatings
1.3. Summary
2. Materials and Methods
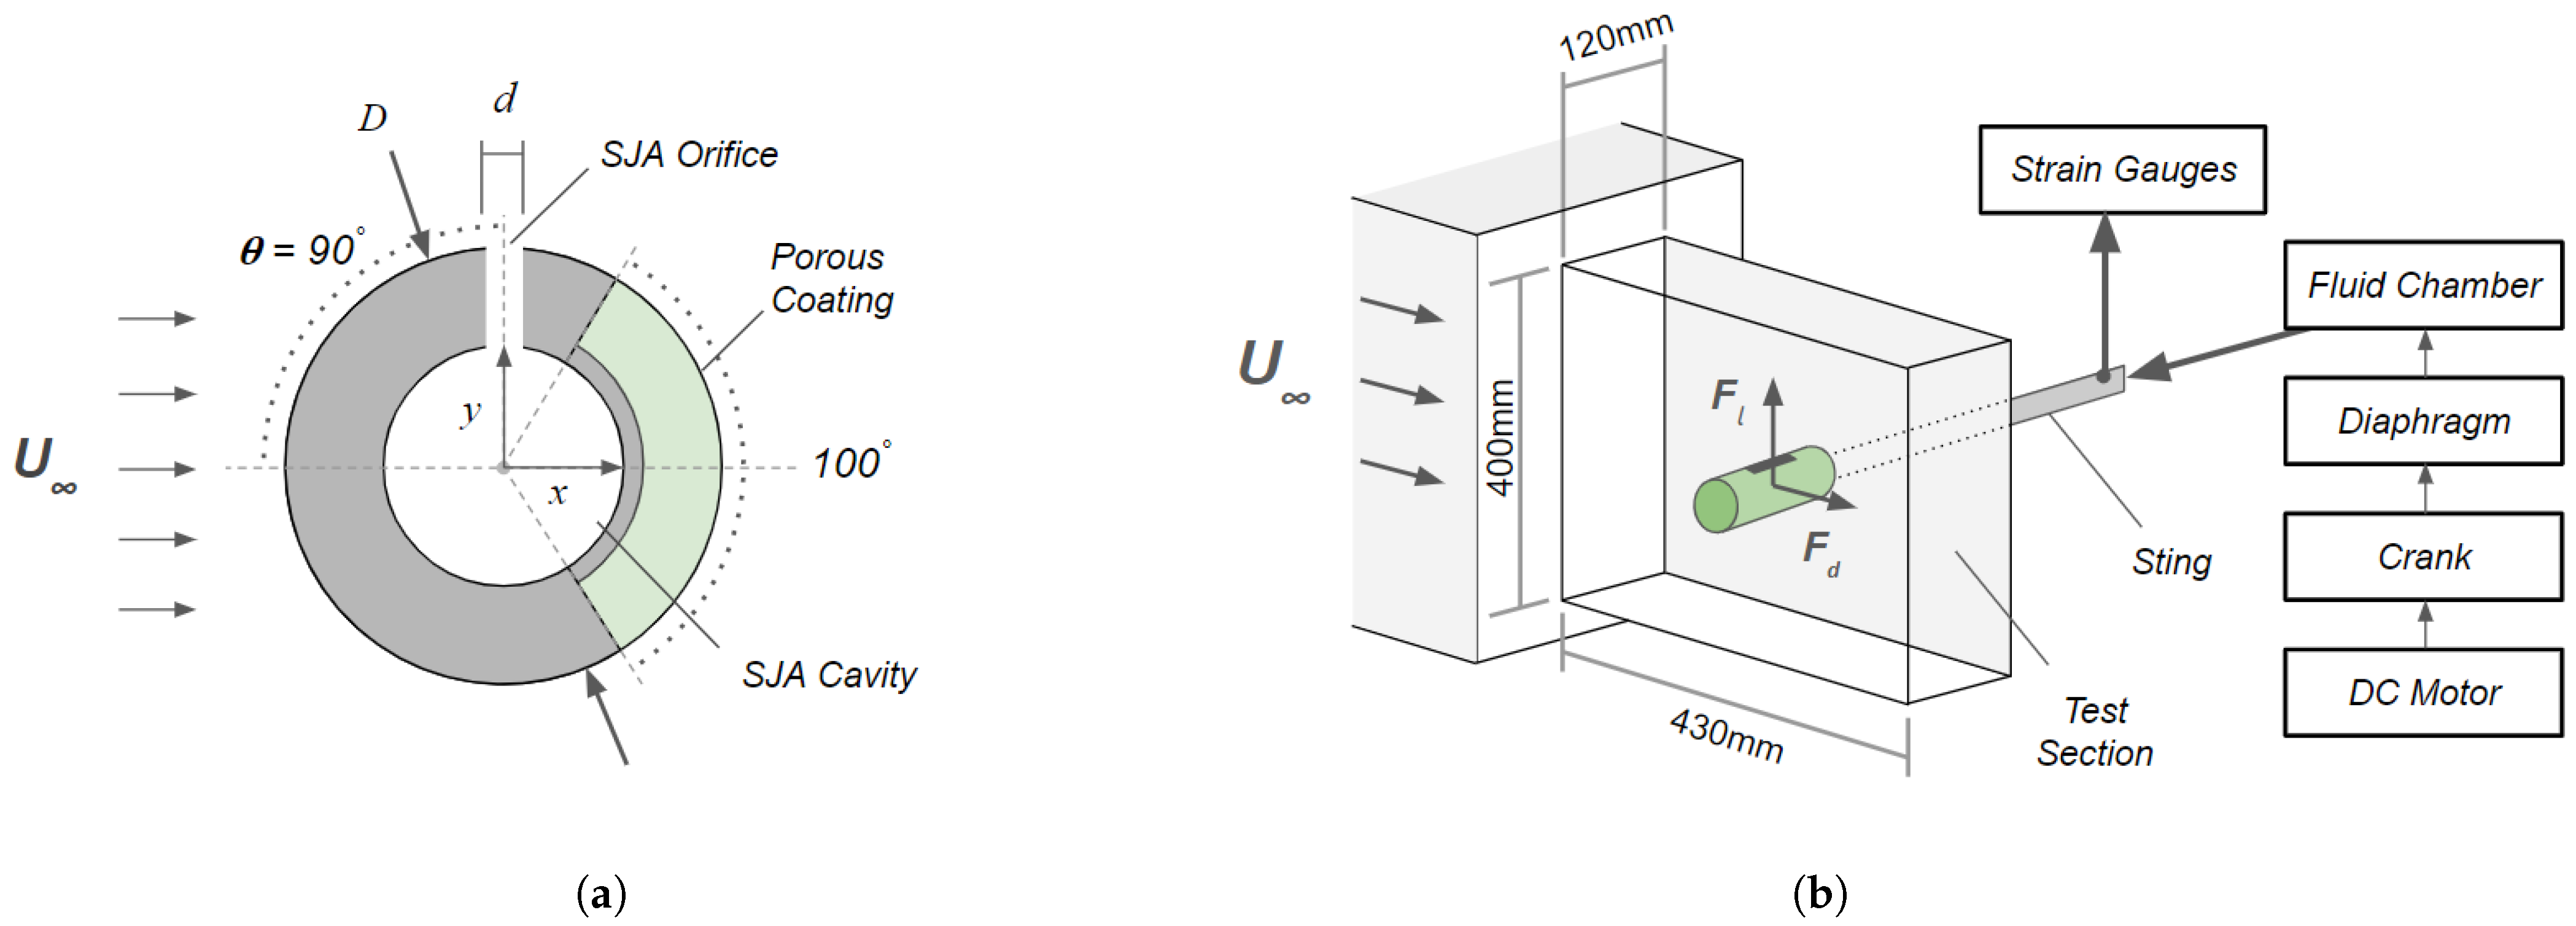
2.1. Experimental Setup
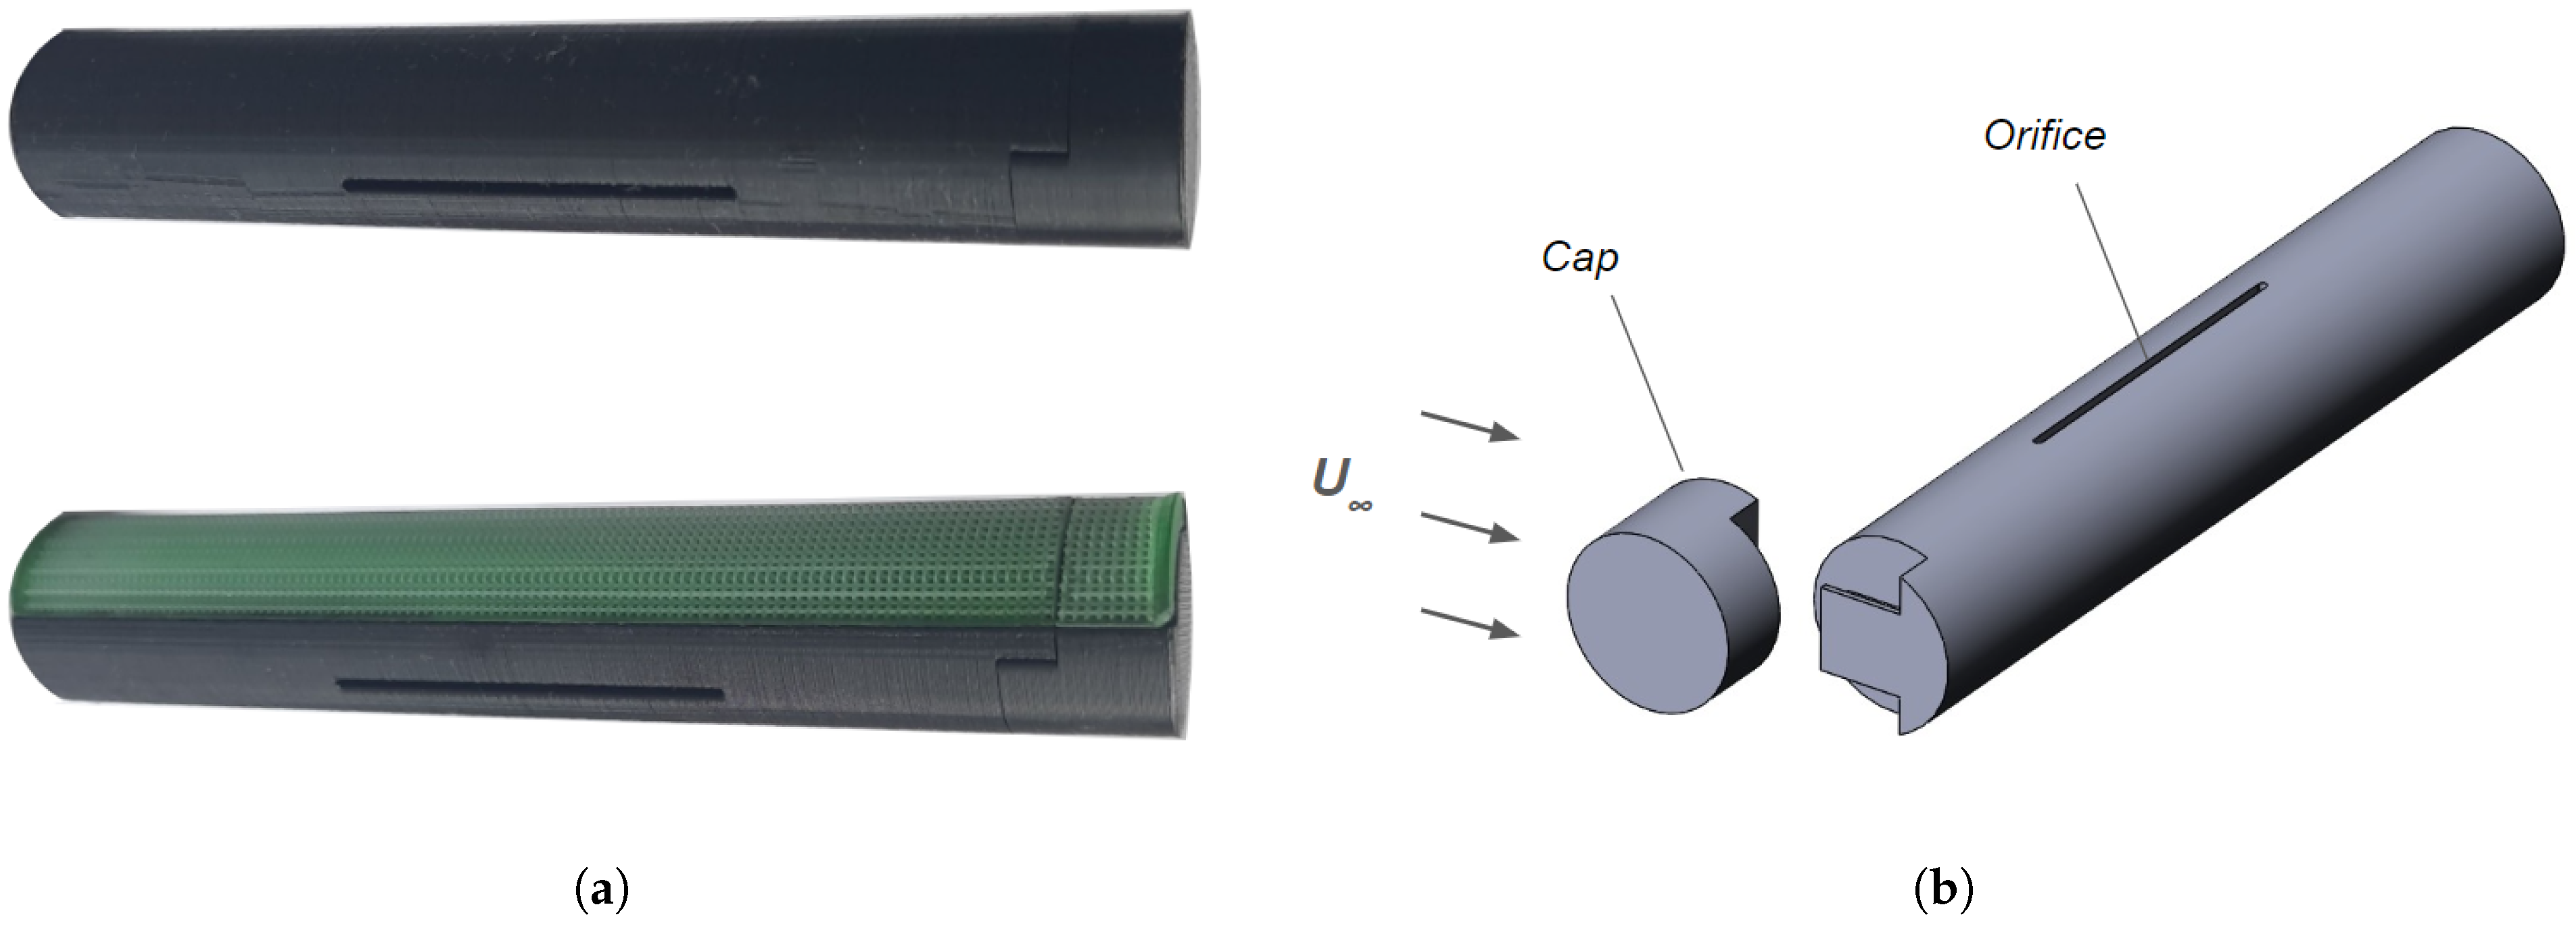
2.2. Test Samples
2.3. Numerical Setup
2.4. Porous Medium Model
2.5. SJA Model
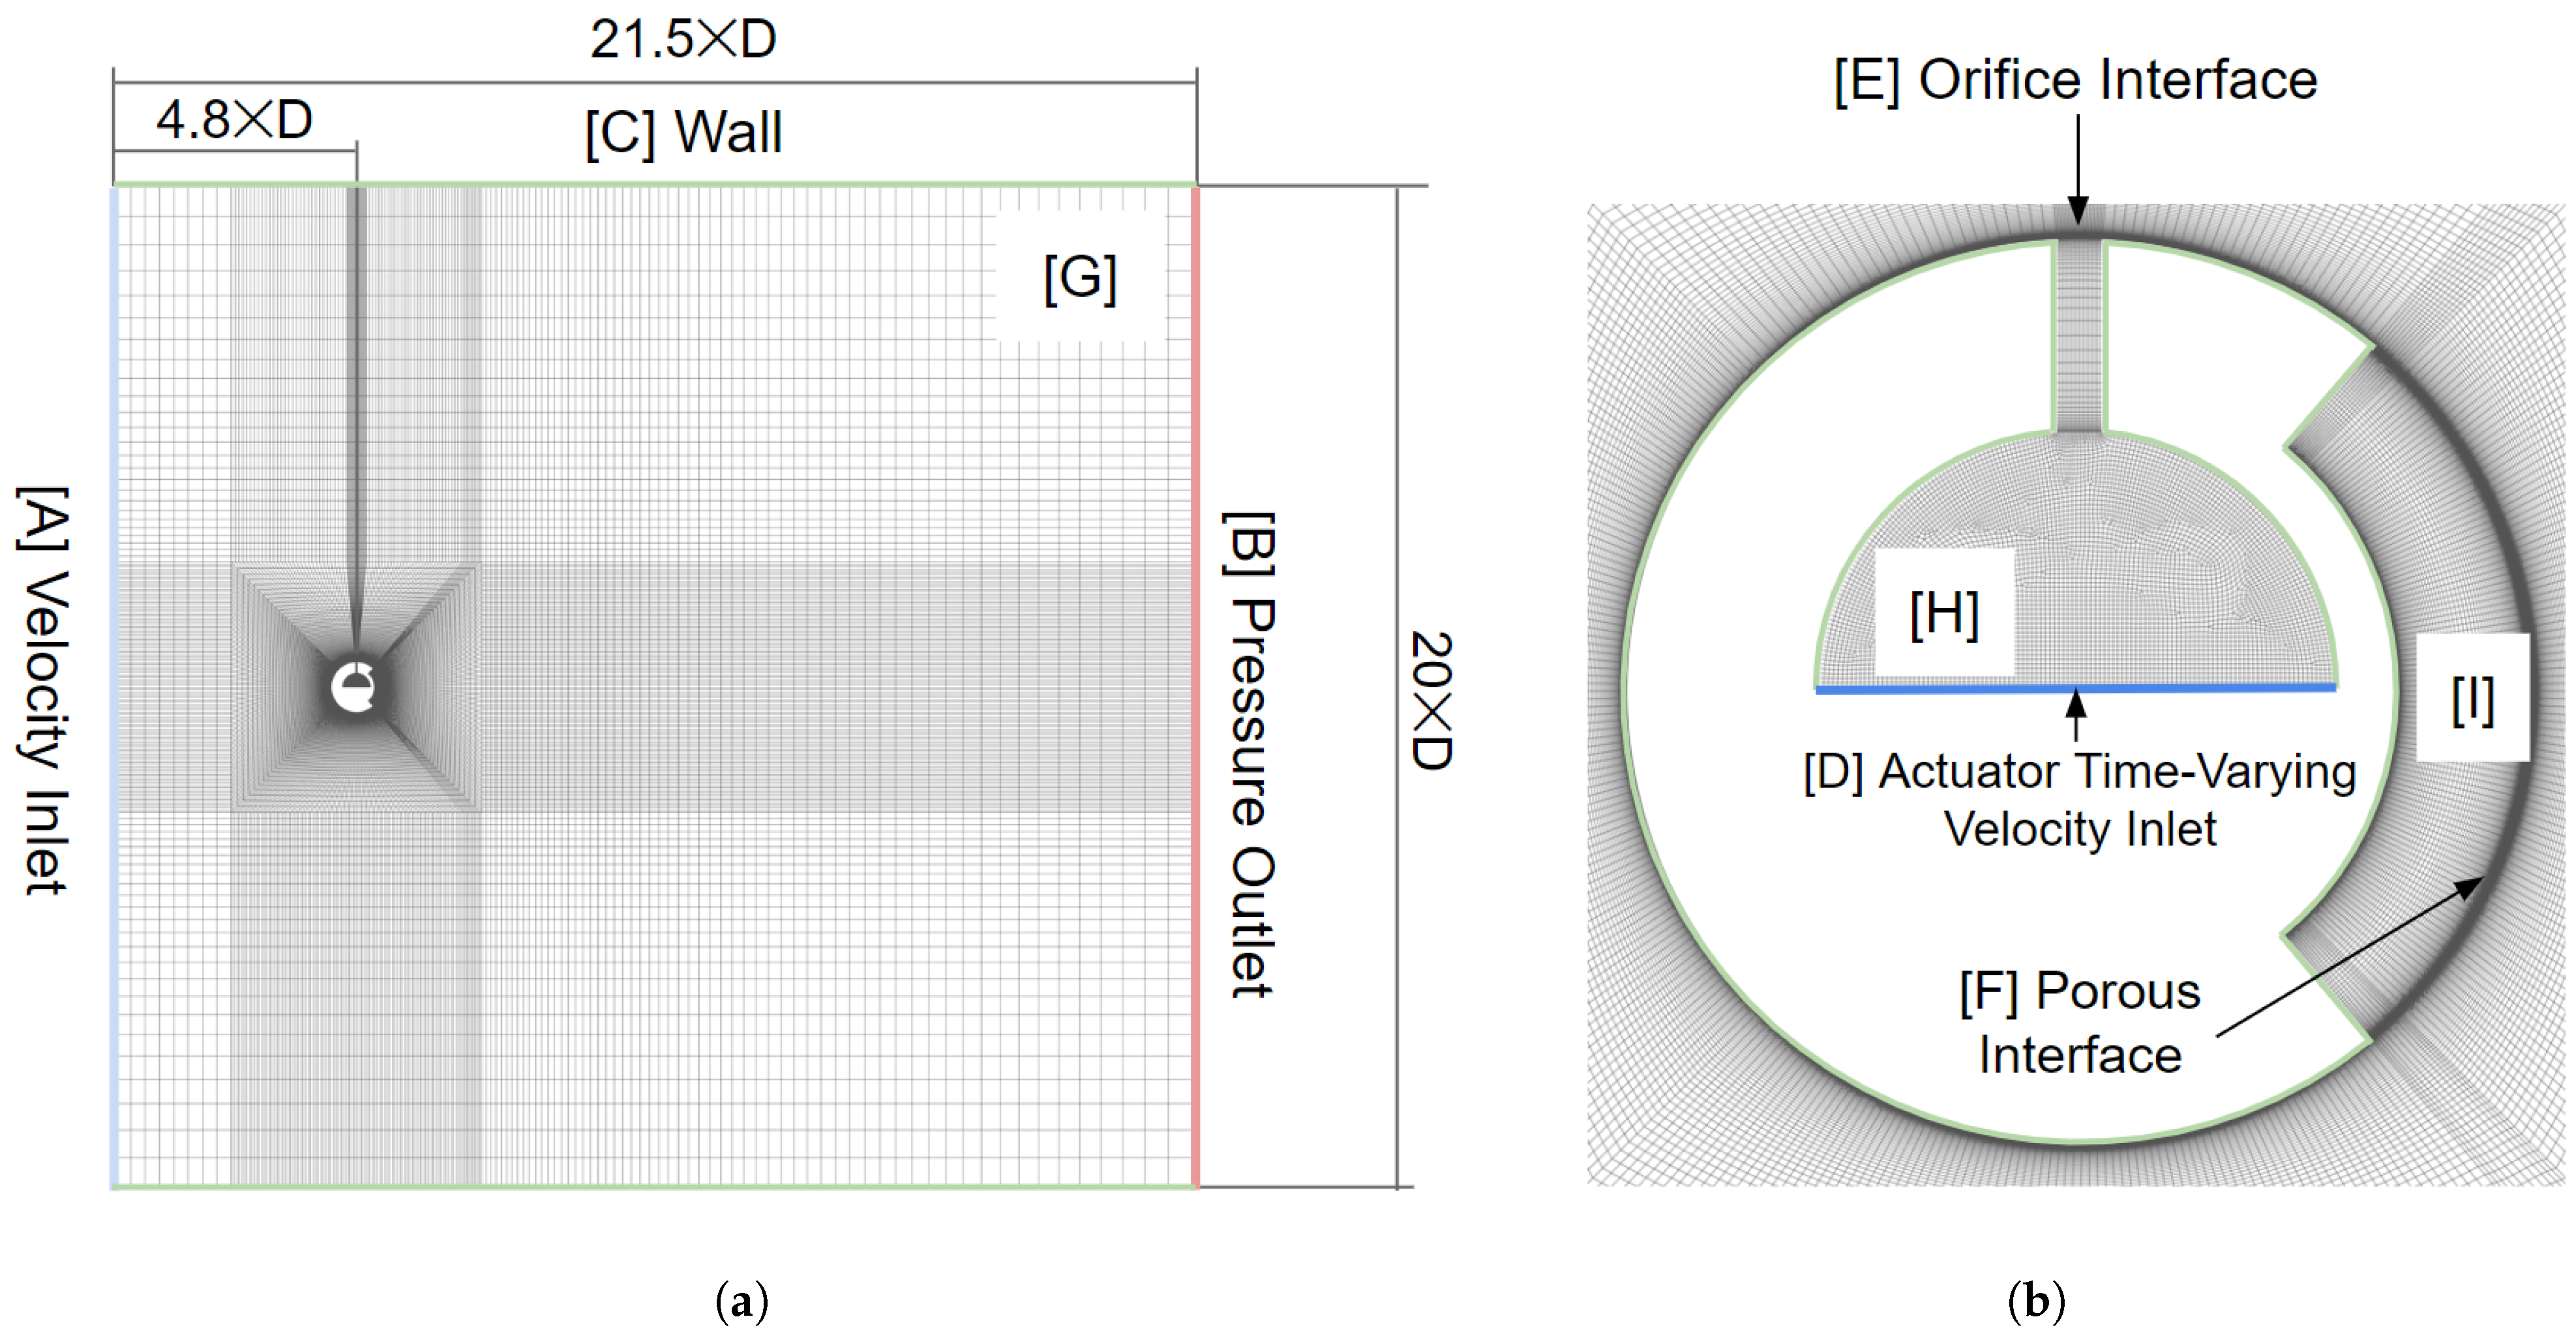
2.6. Domain and Boundary Conditions
- ‘Combined SJA and Porous Coating’ (SJPC) model by making both [E] and [F] internal boundaries.
- ‘Porous Coating Only’ (PCO) model by making [E] a wall and [F] an internal boundary.
- ‘SJA Only’ (SJO) model by making [F] a wall and [E] an internal boundary.
2.7. Mesh Development
2.8. Verification and Validation
3. Results
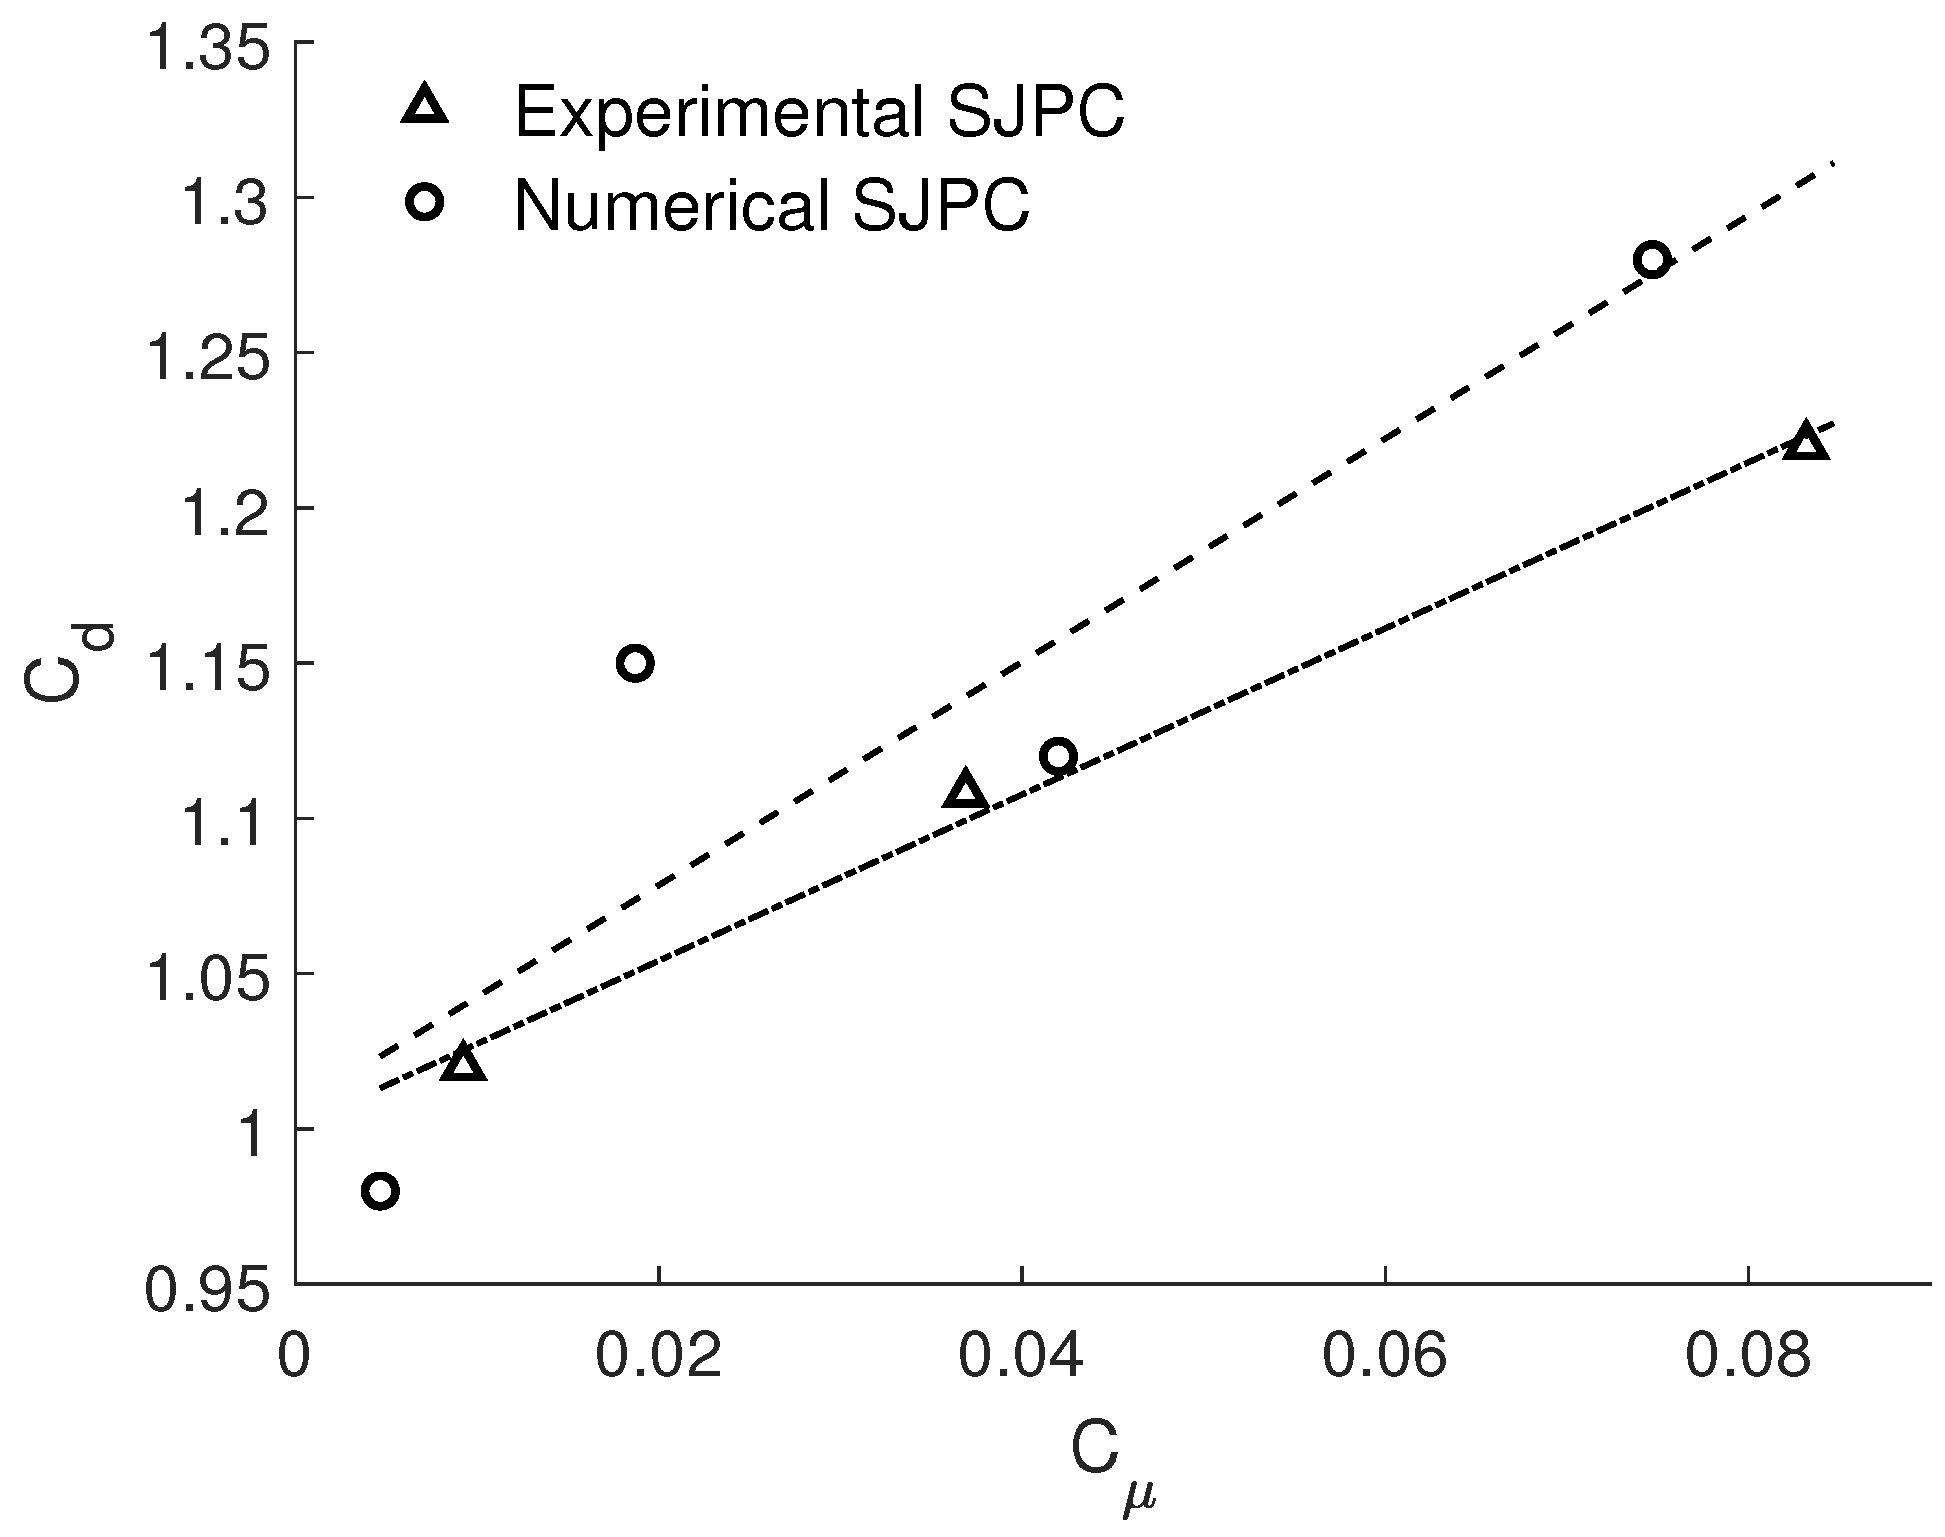
3.1. Experimental Results
3.1.1. Uncertainty and Baseline Values
3.1.2. Combined Cases
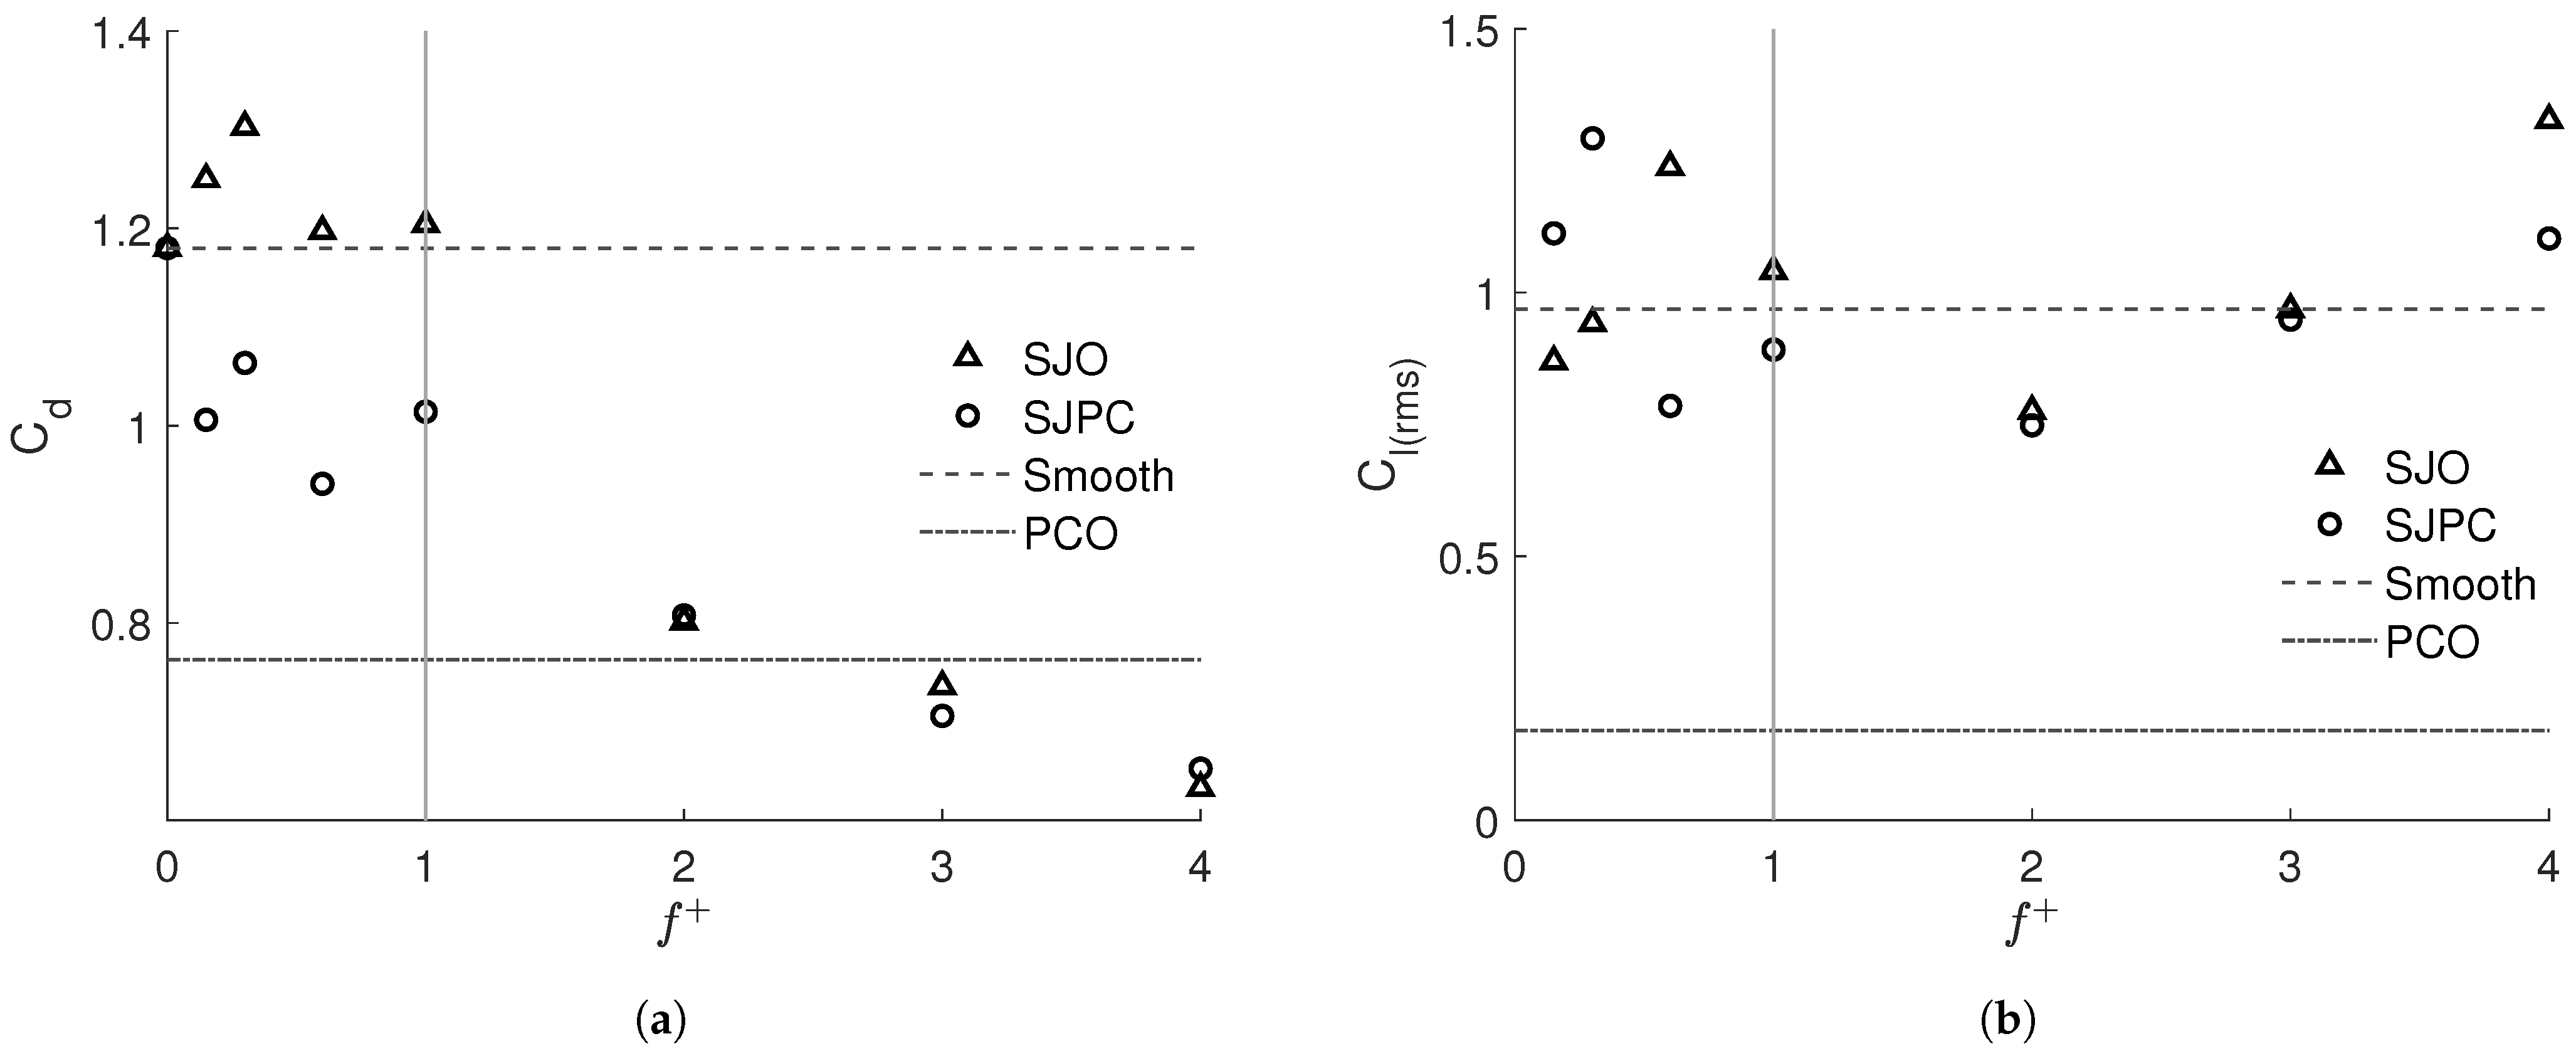
3.2. Numerical Results
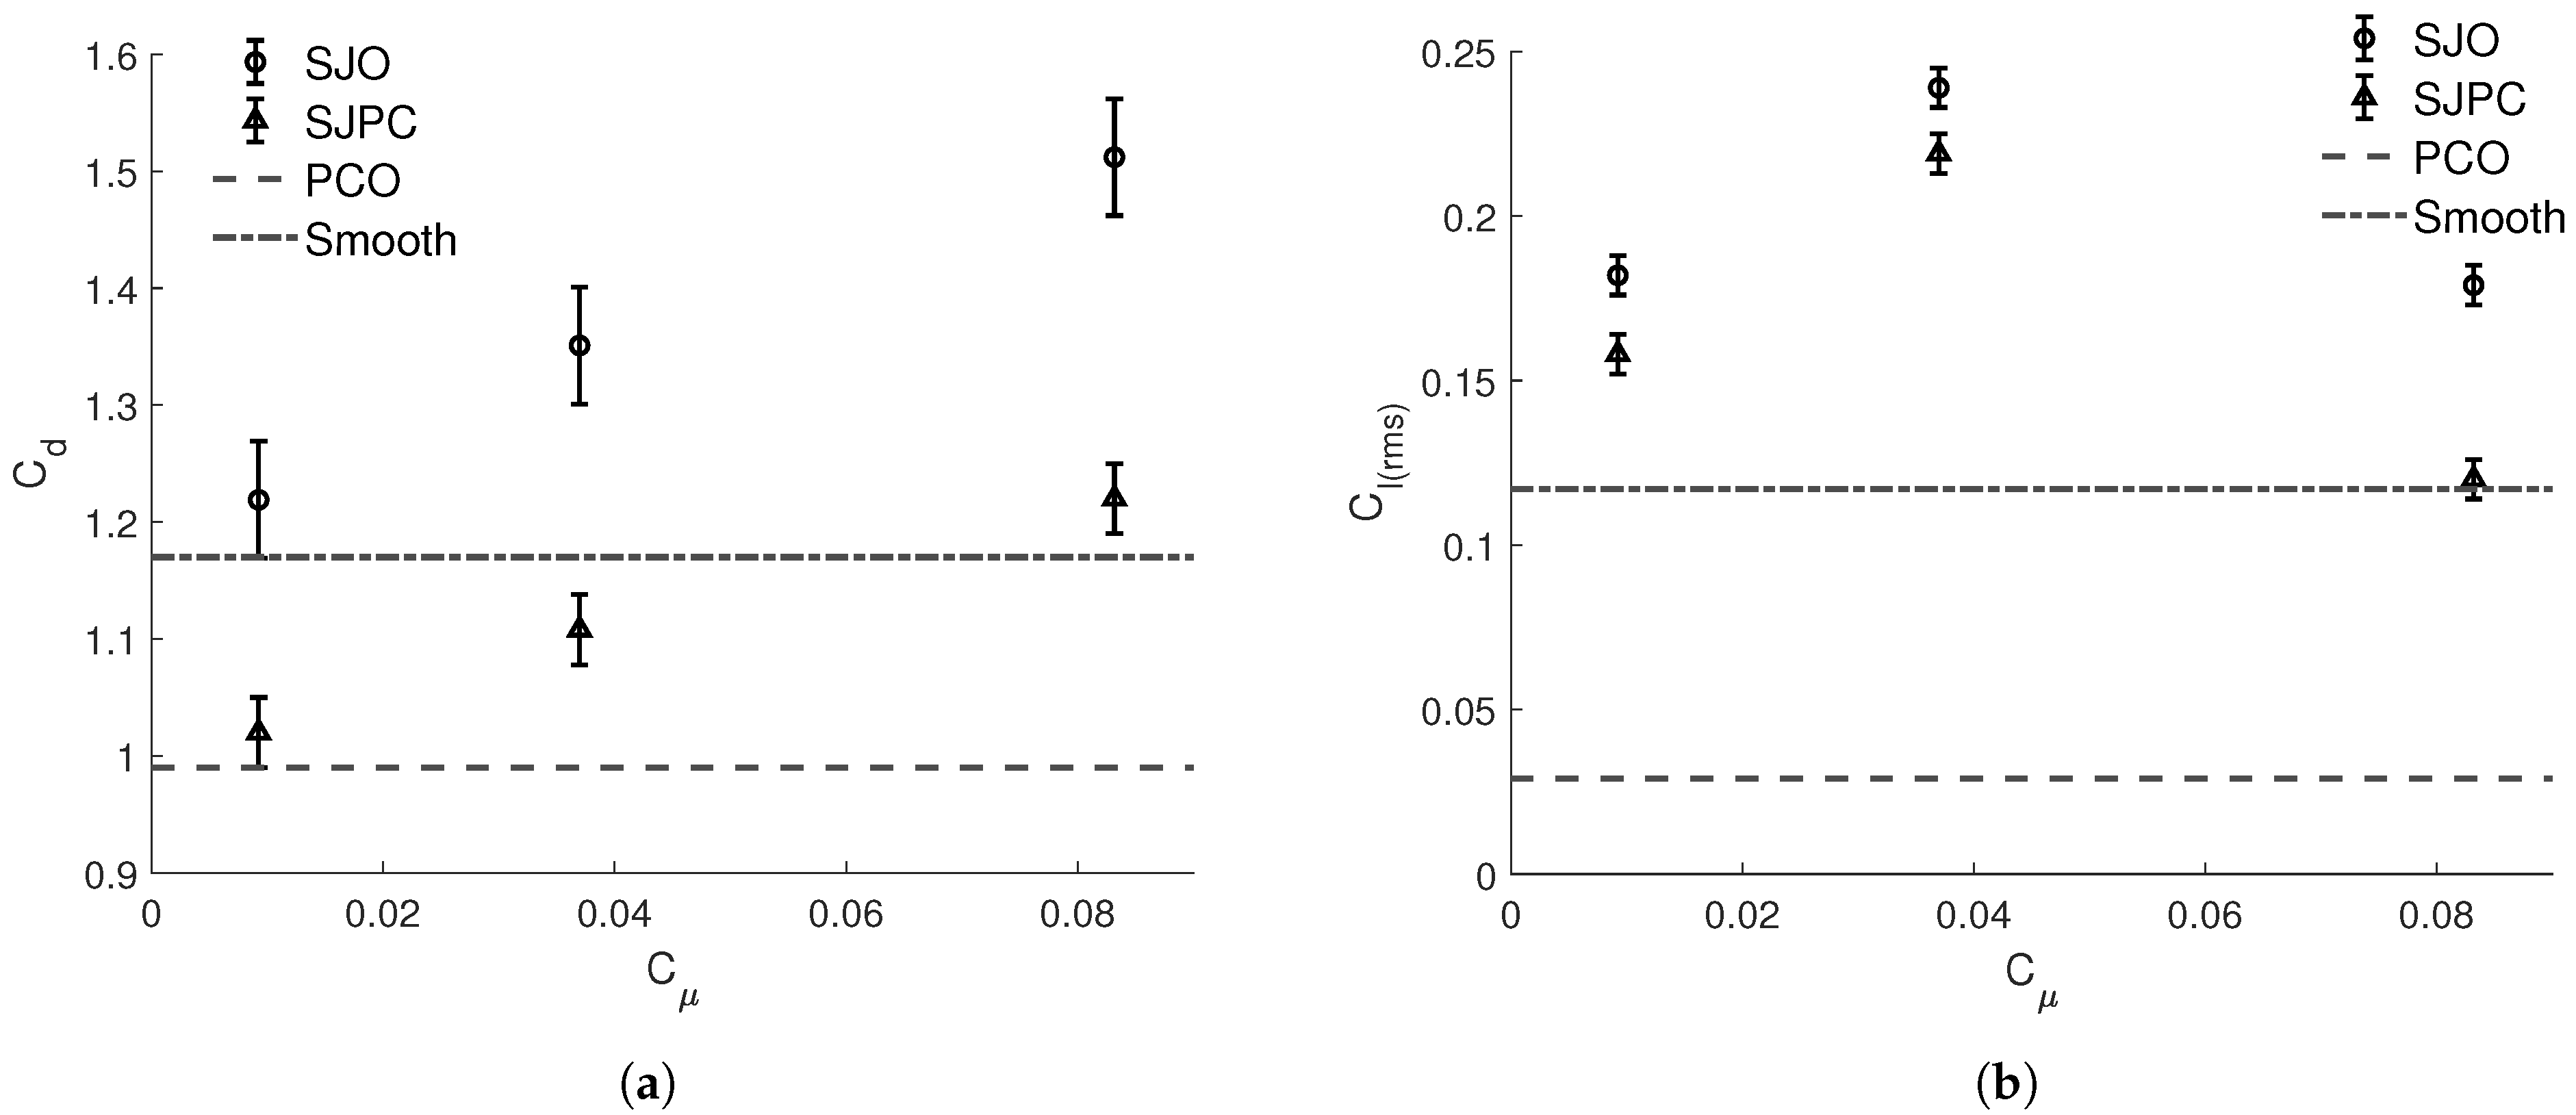
3.2.1. Effect of
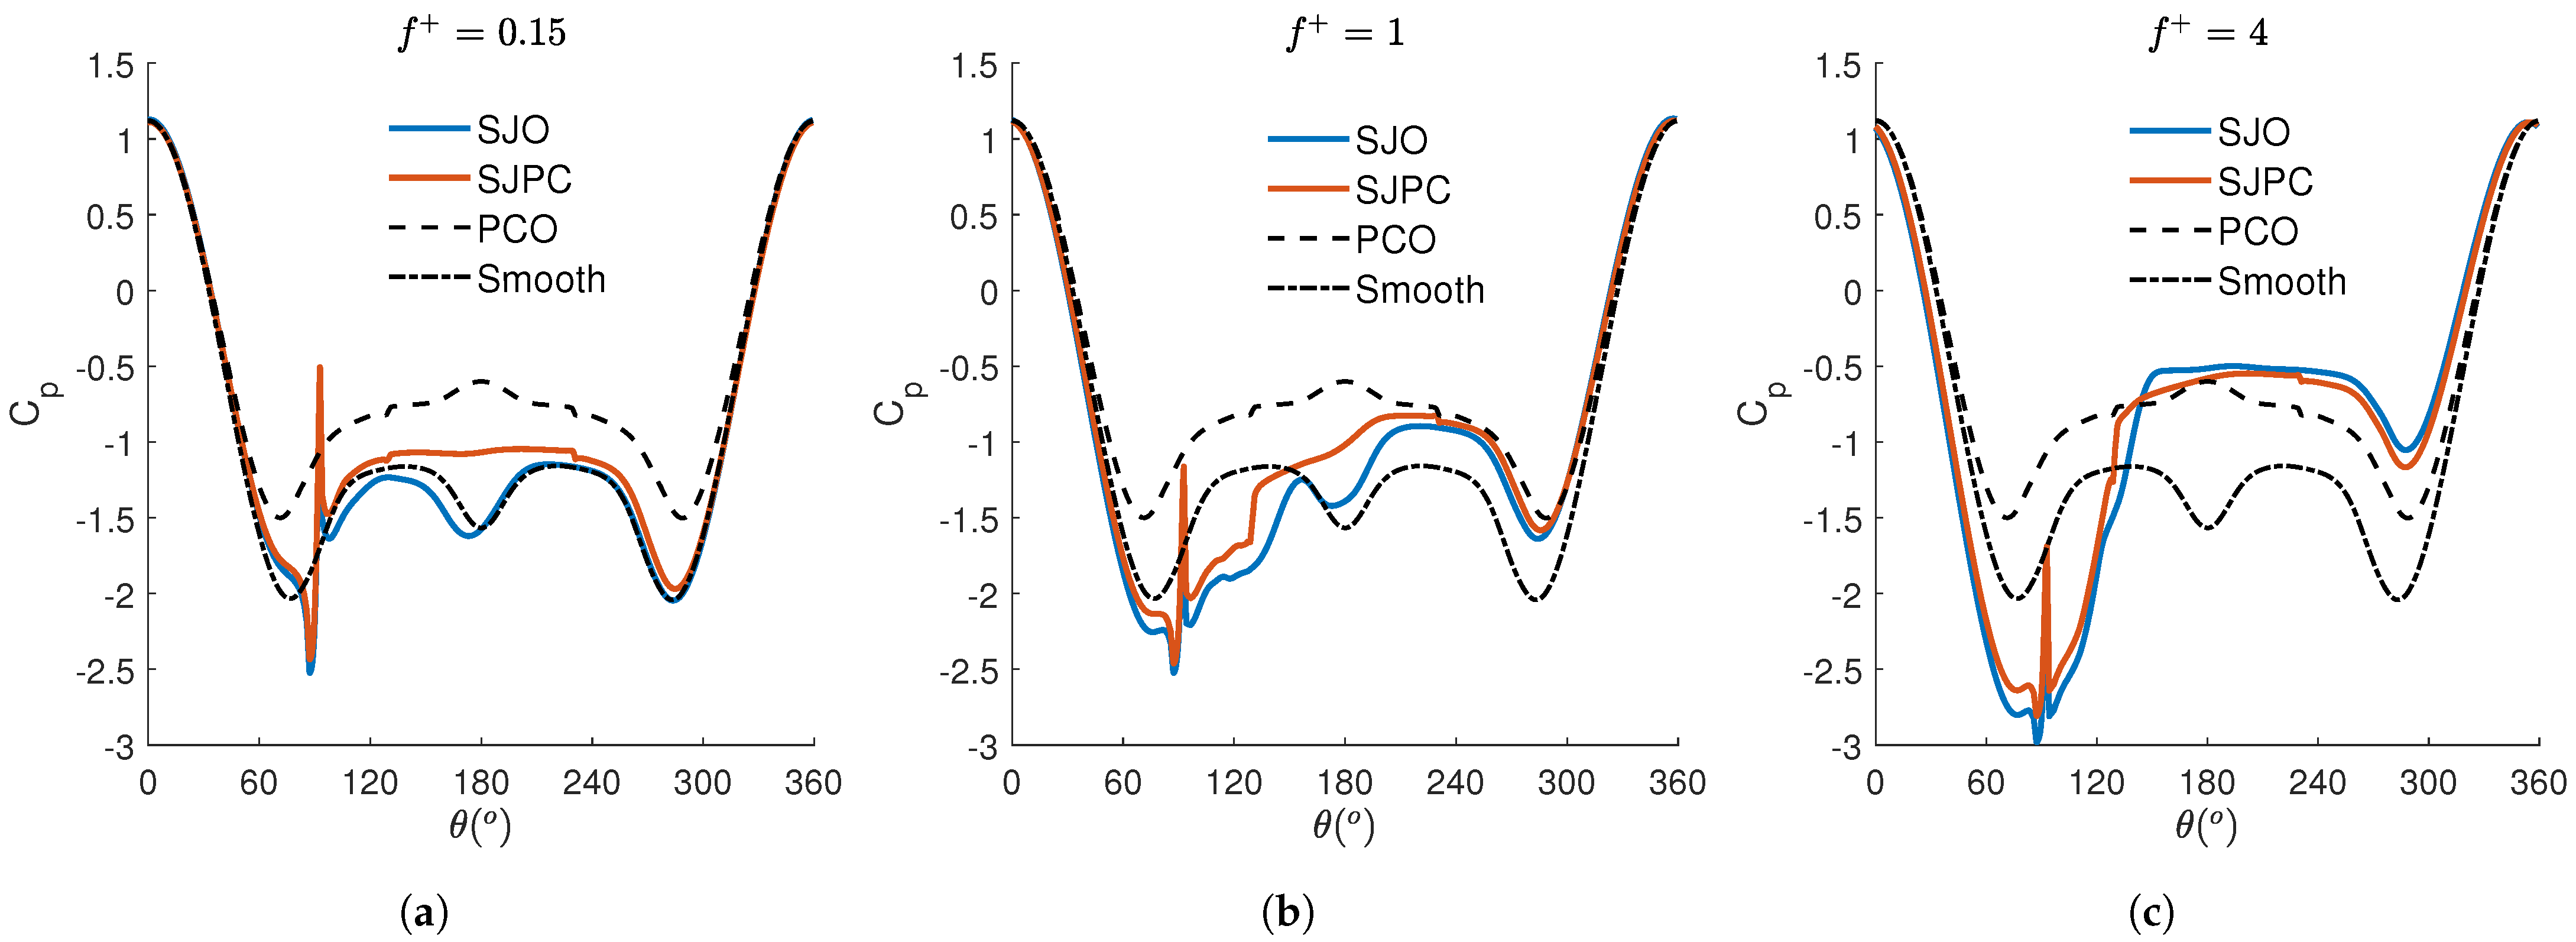
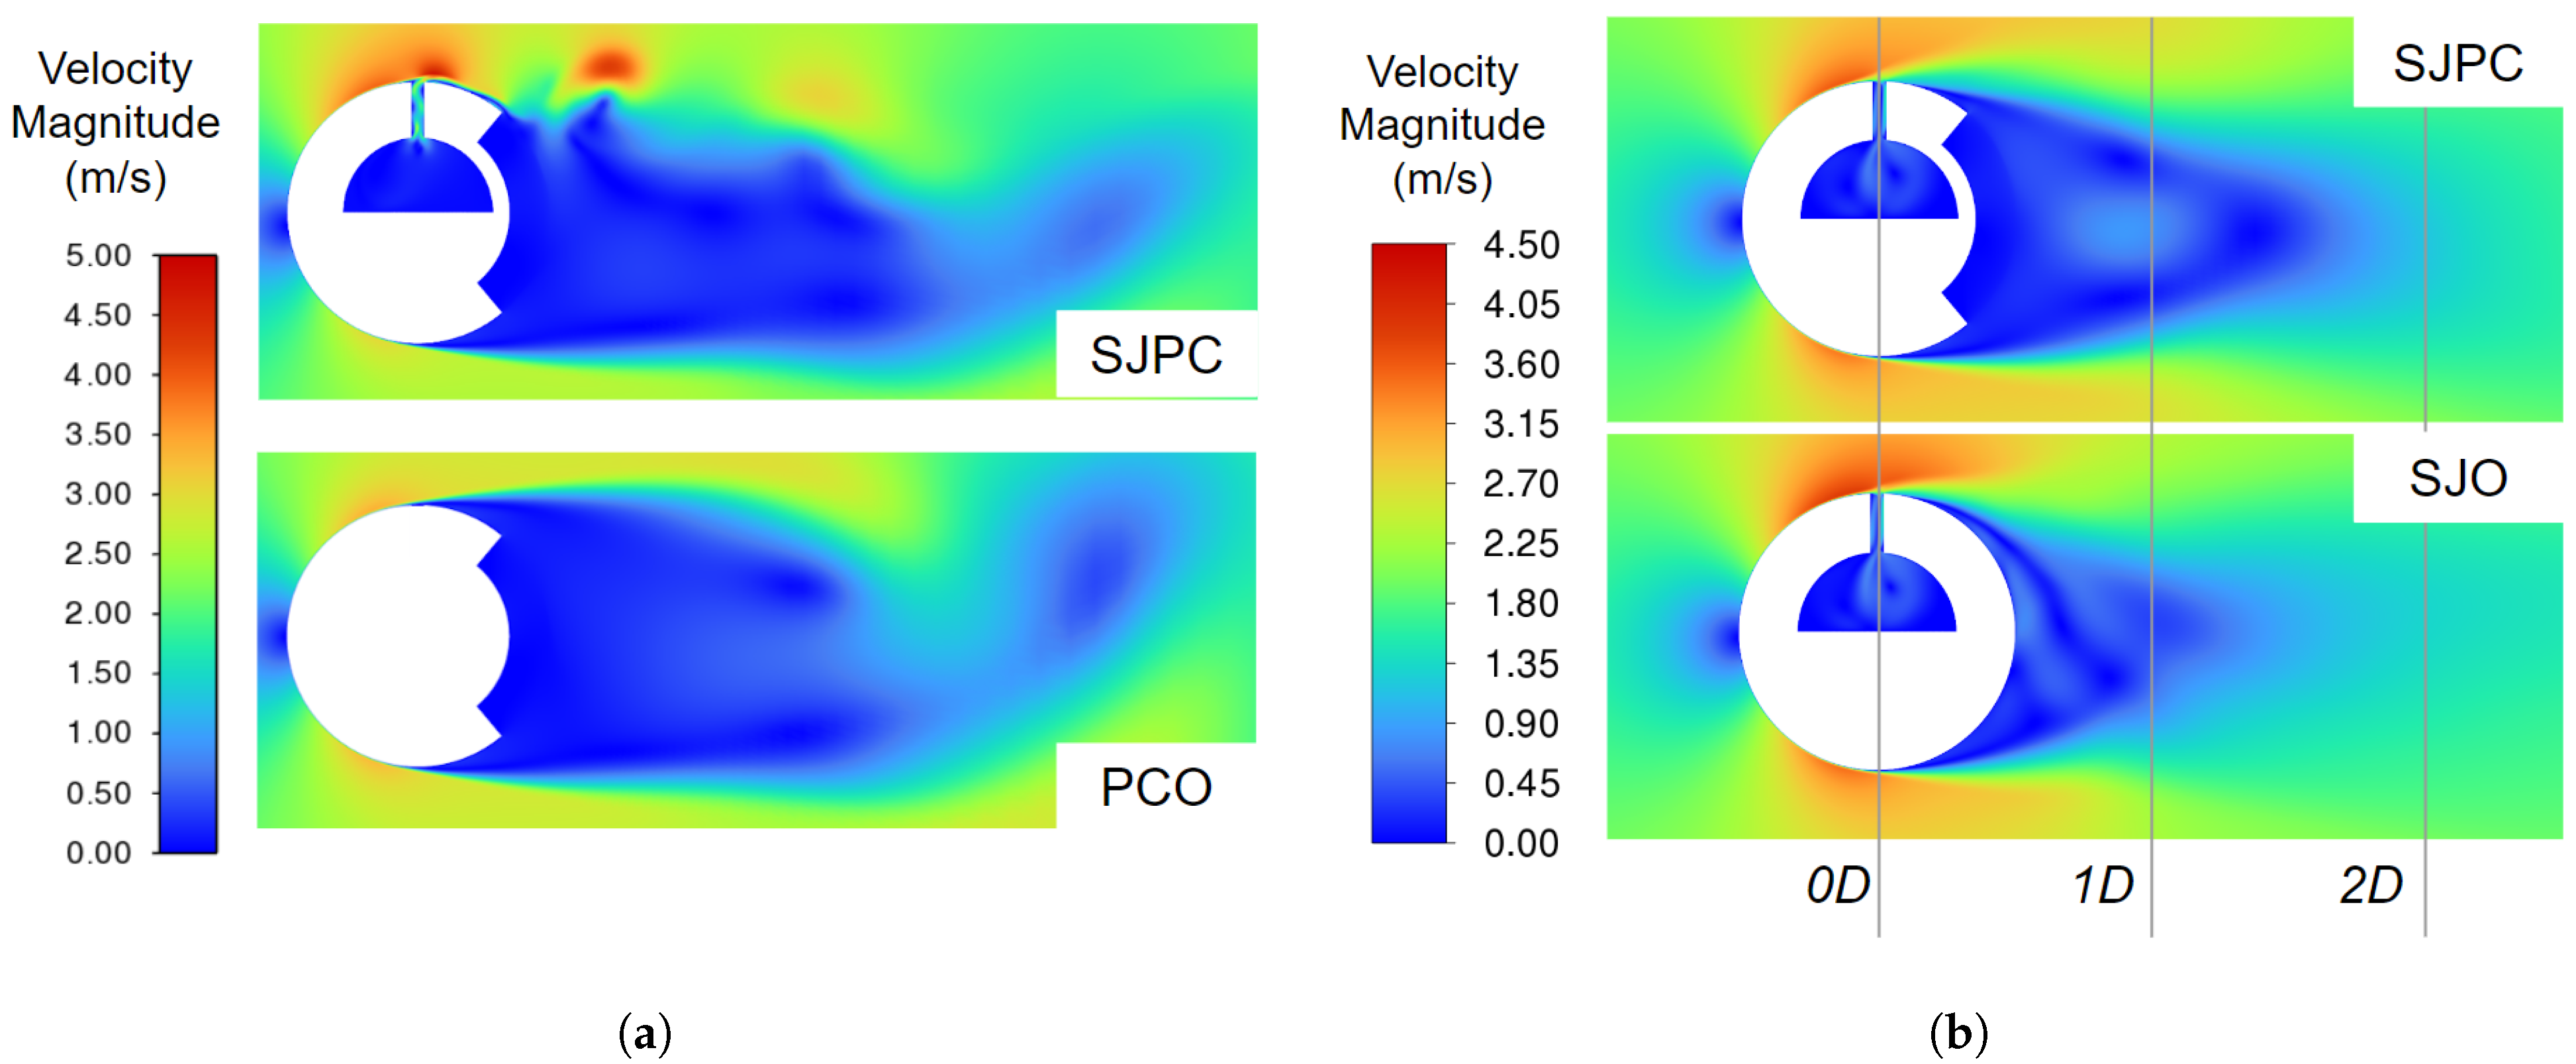
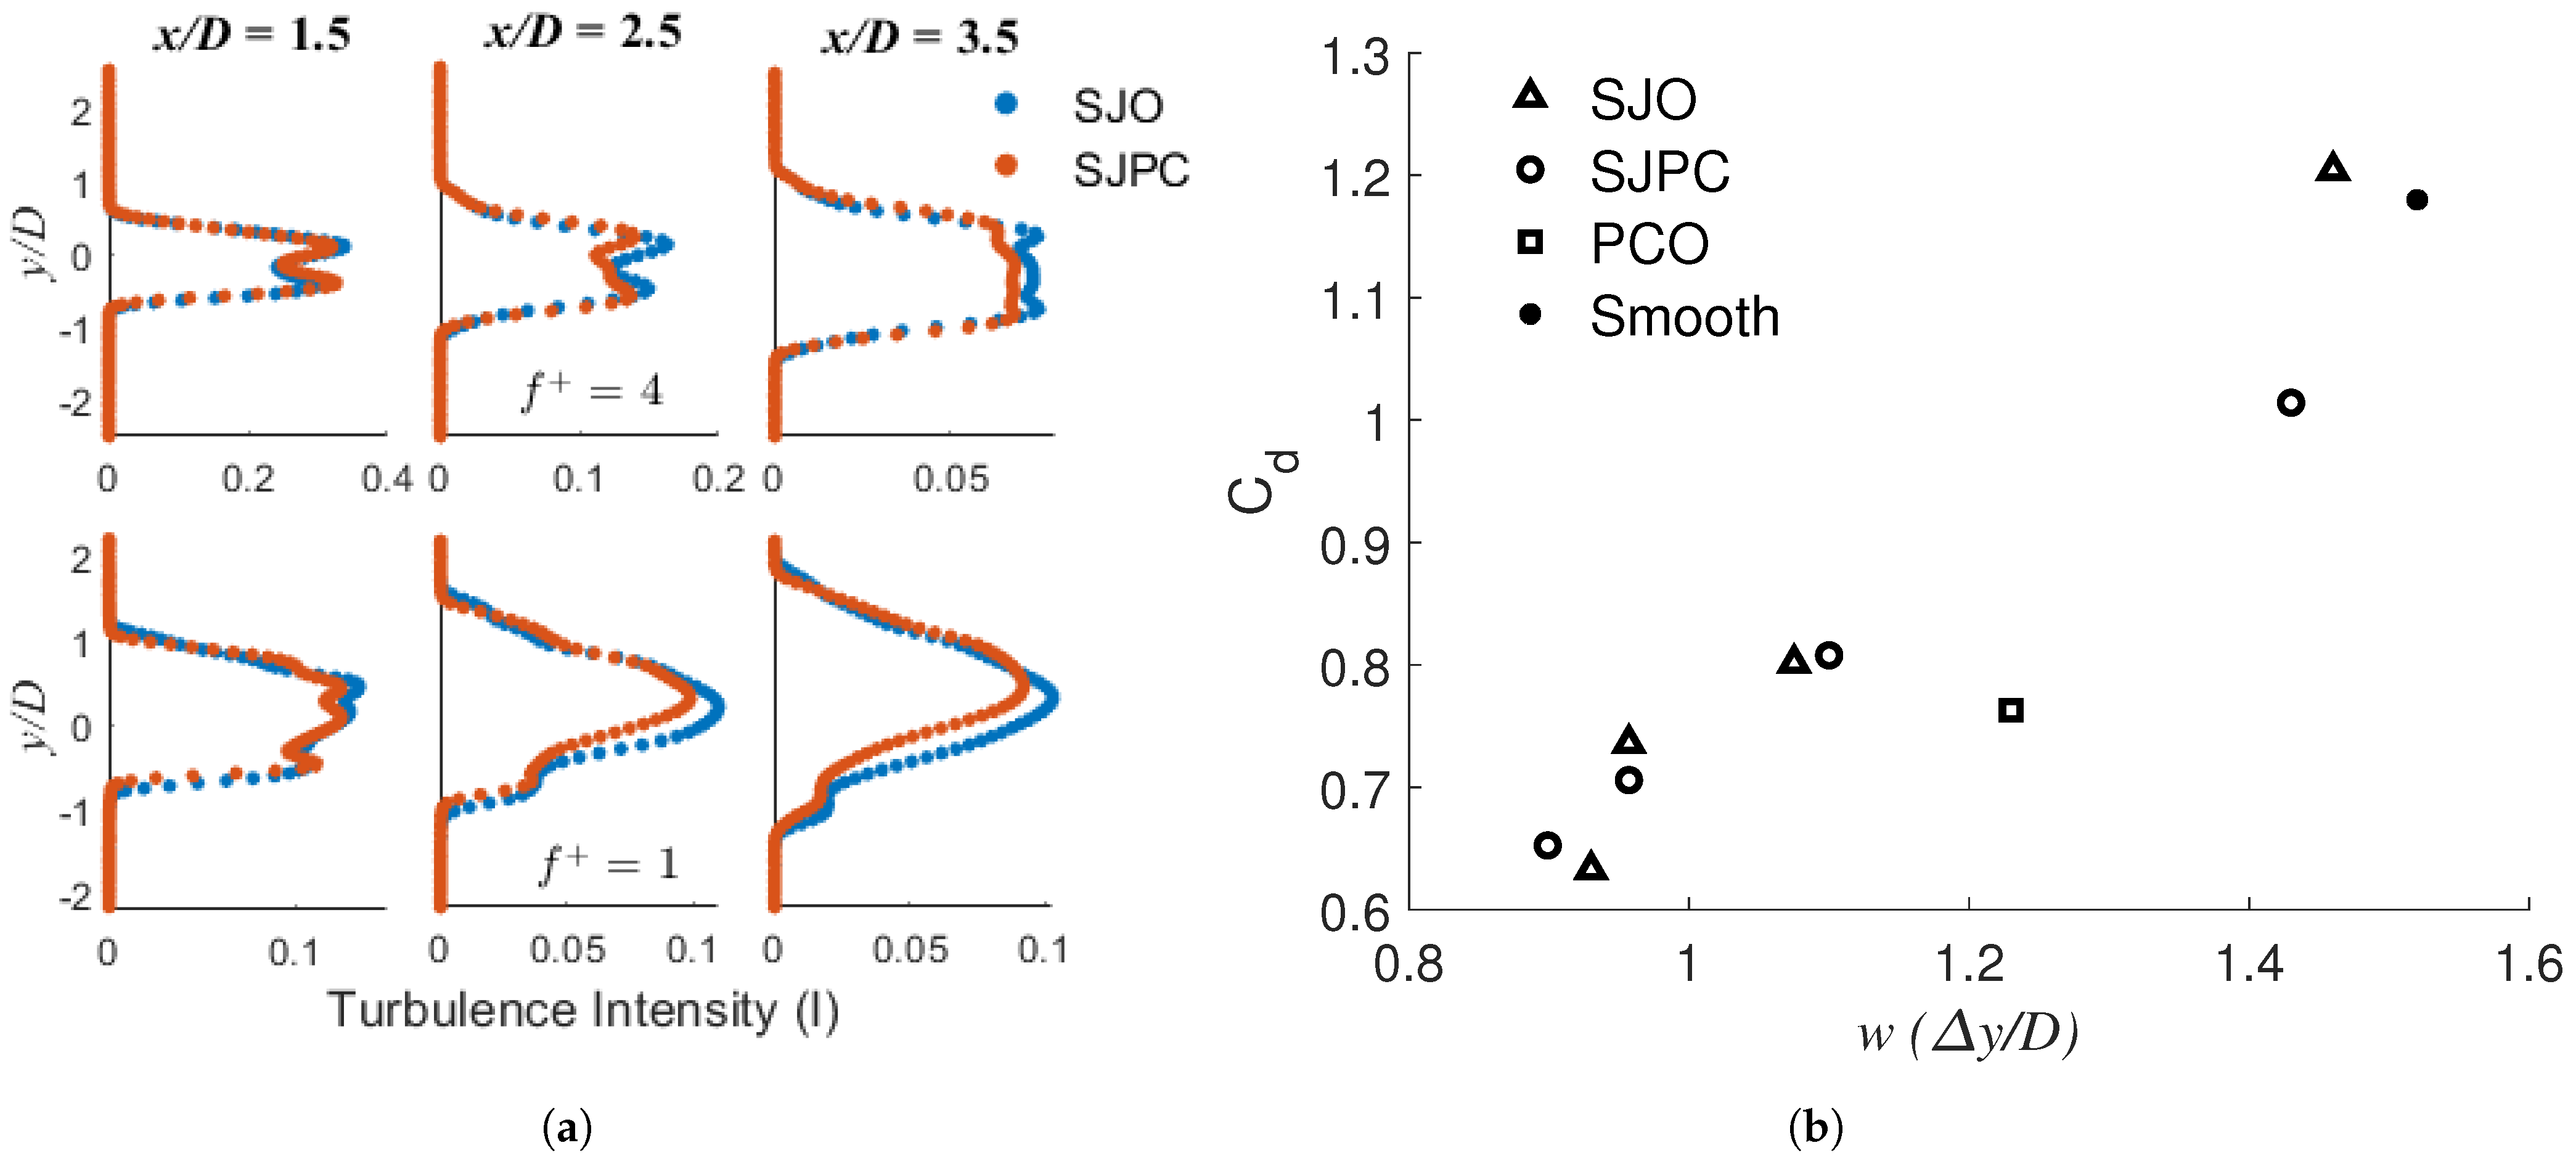
3.2.2. Flow Field and Wake Behaviour
4. Discussion
5. Conclusions
Author Contributions
Funding
Institutional Review Board Statement
Informed Consent Statement
Data Availability Statement
Acknowledgments
Conflicts of Interest
Abbreviations
| SJA | Synthetic jet actuator |
| SJ | Synthetic jet |
| RMS | Root-mean-square |
| VR | Velocity ratio |
| PPI | Pores per inch |
| FDM | Fused deposition modelling |
| SLA | Stereolithography |
| URANS | Unsteady Reynolds-averaged Navier-Stokes |
| SST | Shear stress transport |
| UDF | User-defined function |
| SJPC | Combined SJA and porous coating configuration |
| PCO | Porous coating only configuration |
| SJO | SJA only configuration |
Appendix A. Actuator Surface UDF
- # inc lude “udf . h”
- DEFINE_PROFILE(unsteady_velocity, thread, position)
- {
- face_t f;
- realt = CURRENT_TIME;
- real V_max, L, freq, pi, time, h, d;
- d = 0.08695;
- pi = 3.14159;
- freq = 4;
- L = 0.0571 * 2;
- V_max = L * freq * pi * d;
- begin_f_loop (f, thread)
- {
- F_PROFILE(f, thread, position) = V_max * sin(2 * pi * freq * t);
- }
- end_f_loop(f, thread)
- }
References
- Munson, B.; Rothmayer, A.; Okiishi, T.; Huebsch, W. Fundamentals of Fluid Mechanics, 7th ed.; Wiley: Hoboken, NJ, USA, 2013. [Google Scholar]
- Gad-el Hak, M.; Gad-El-Hak, C. Flow Control: Passive, Active, and Reactive Flow Management; Cambridge University Press: Cambridge, UK, 2000. [Google Scholar]
- Shehata, A.; Xiao, Q.; Saqr, K.; Naguib, A.; Alexander, D. Passive flow control for aerodynamic performance enhancement of airfoil with its application in Wells turbine—Under oscillating flow condition. Ocean. Eng. 2017, 136, 31–53. [Google Scholar] [CrossRef] [Green Version]
- Amitay, M.; Honohan, A.; Trautman, M.; Glezer, A. Modification of the aerodynamic characteristics of bluff bodies using fluidic actuators. In Proceedings of the 28th Fluid Dynamics Conference 28th Fluid Dynamics Conference, Snowmass Village, CO, USA, 29 June–2 July 1997. [Google Scholar] [CrossRef]
- Fujisawa, N.; Takeda, G. Flow control around a circular cylinder by internal acoustic excitation. J. Fluids Struct. 2003, 17, 903–913. [Google Scholar] [CrossRef]
- Catalano, P.; Wang, M.; Iaccarino, G.; Sbalzarini, I. Optimization of cylinder flow control via zero net mass flux actuators. In Center for Turbulence Research Summer Program; Wiley: Stanford, CA, USA, 2002; Available online: https://onlinelibrary.wiley.com/doi/epdf/10.1002/fld.4755 (accessed on 10 June 2022).
- Greco, C.S.; Paolillo, G.; Astarita, T.; Cardone, G. The von Kármán street behind a circular cylinder: Flow control through synthetic jet placed at the rear stagnation point. J. Fluid Mech. 2020, 901, A39. [Google Scholar] [CrossRef]
- Zhang, P.; Liu, Y.; Li, Z.; Liu, H.; Yang, Y. Numerical study on reducing aerodynamic drag and noise of circular cylinders with non-uniform porous coatings. Aerosp. Sci. Technol. 2020, 107, 106308. [Google Scholar] [CrossRef]
- Guinness, I.; Persoons, T. Passive flow control for drag reduction on a cylinder in cross-flow using leeward partial porous coatings. Fluids 2021, 6, 289. [Google Scholar] [CrossRef]
- Klausmann, K.; Ruck, B. Drag reduction of circular cylinders by porous coating on the leeward side. J. Fluid Mech. 2017, 813, 382–411. [Google Scholar] [CrossRef]
- Bruneau, C.; Mortazavi, I. Control of vortex shedding around a pipe section using a porous sheath. Int. J. Offshore Polar Eng. 2006, 16, 90–96. [Google Scholar]
- Bathla, P.; Kennedy, J. 3D printed structured porous treatments for flow control around a circular cylinder. Fluids 2020, 5, 136. [Google Scholar] [CrossRef]
- Smith, B.; Glezer, A. The formation and evolution of synthetic jets. Phys. Fluids 1998, 10, 2281–2297. [Google Scholar] [CrossRef]
- Hong, M.; Cheng, S.; Zhong, S. Effect of geometric parameters on synthetic jet: A review. Phys. Fluids 2020, 32, 031301. [Google Scholar] [CrossRef] [Green Version]
- Auerbach, D. Experiments on the trajectory and circulation of the starting vortex. J. Fluid Mech. 1987, 183, 185–198. [Google Scholar] [CrossRef]
- Feng, L.; Wang, J. Synthetic jet control of separation in the flow over a circular cylinder. Exp. Fluids 2012, 53, 467–480. [Google Scholar] [CrossRef]
- Holman, R.; Utturkar, Y.; Mittal, R.; Smith, B.; Cattafesta, L. Formation criterion for synthetic jets. AIAA J. 2005, 43, 2110–2116. [Google Scholar] [CrossRef] [Green Version]
- Jabbal, M.; Zhong, S. The near wall effect of synthetic jets in a laminar boundary layer. In Proceedings of the 3rd AIAA Flow Control Conference, San Francisco, CA, USA, 5–8 June 2006. [Google Scholar] [CrossRef]
- Sahni, O.; Wood, J.; Jansen, K.E.; Amitay, M. Three-dimensional interactions between a finite-span synthetic jet and a crossflow. J. Fluid Mech. 2011, 671, 254–287. [Google Scholar] [CrossRef]
- Rathay, N.; Amitay, M. Interaction of synthetic jets with a massively separated three-dimensional flow field. Phys. Rev. Fluids 2022, 7, 034702. [Google Scholar] [CrossRef]
- Chiatto, M.; Marchitto, L.; Valentino, G.; de Luca, L. Influence of piezo-driven synthetic jet on water spray behavior. At. Sprays 2017, 27, 691–706. [Google Scholar] [CrossRef]
- Feng, L.; Wang, J. Modification of a circular cylinder wake with synthetic jet: Vortex shedding modes and mechanism. Eur. J. Mech.—B/Fluids 2014, 43, 14–32. [Google Scholar] [CrossRef]
- Tensi, J.; Boué, I.; Paillé, F.; Dury, G. Modification of the wake behind a circular cylinder by using synthetic jets. J. Vis. 2002, 5, 37–44. [Google Scholar] [CrossRef]
- Hsiao, F.; Shyu, J. Influence of internal acoustic excitation upon flow passing a circular cylinder. J. Fluids Struct. 1991, 5, 427–442. [Google Scholar] [CrossRef]
- Glezer, A.; Amitay, M.; Honohan, A. Aspects of low- and high-frequency actuation for aerodynamic flow control. AIAA J. 2005, 43, 1501–1511. [Google Scholar] [CrossRef]
- Bruneau, C.; Mortazavi, I.; Gilliéron, P. Flow regularisation and drag reduction around blunt bodies using porous devices. In Proceedings of the IUTAM Symposium on Flow Control and MEMS, London, UK, 19–22 September 2006; Springer: Dordrecht, The Netherlands, 2006; Volume 7. [Google Scholar]
- Teruna, C.; Avallone, F.; Ragni, D.; Casalino, D. On the noise reduction of a porous trailing edge applied to an airfoil at lifting condition. Phys. Fluids 2021, 33, 055132. [Google Scholar] [CrossRef]
- Bhattacharyya, S.; Singh, A. Reduction in drag and vortex shedding frequency through porous sheath around a circular cylinder. Int. J. Numer. Methods Fluids 2011, 65, 683–698. [Google Scholar] [CrossRef]
- Sueki, T.; Takaishi, T.; Ikeda, M.; Arai, N. Application of porous material to reduce aerodynamic sound from bluff bodies. Fluid Dyn. Res. 2010, 42, 015004. [Google Scholar] [CrossRef]
- Hu, Z.; Liu, H.; Chen, N.; Hu, J.; Tong, F. Vortex shedding noise and flow mode analysis of cylinder with full/partial porous coating. Aerosp. Sci. Technol. 2020, 106, 106154. [Google Scholar] [CrossRef]
- Naito, H.; Fukagata, K. Numerical simulation of flow around a circular cylinder having porous surface. Phys. Fluids 2012, 24, 117102. [Google Scholar] [CrossRef]
- Galbraith, R. Flow pattern around a shrouded cylinder at Re = 5000. J. Wind. Eng. Ind. Aerodyn. 1980, 6, 227–242. [Google Scholar] [CrossRef]
- Igarashi, T. Flow characteristics around a circular cylinder with a slit: 1st report, flow control and flow patterns. Bull. JSME 1978, 21, 656–664. [Google Scholar] [CrossRef] [Green Version]
- Steiros, K.; Bempedelis, N.; Ding, L. Recirculation regions in wakes with base bleed. Phys. Rev. Fluids 2021, 6, 034608. [Google Scholar] [CrossRef]
- Jackson, D. Active Flow Control of a Cylinder in Crossflow using Synthetic Jet Actuators. Ph.D. Thesis, Trinity College Dublin, Dublin, Ireland, 2016. Available online: http://www.tara.tcd.ie/handle/2262/82914 (accessed on 15 July 2022).
- Argyropoulos, C.; Markatos, N. Recent advances on the numerical modelling of turbulent flows. Appl. Math. Model. 2015, 39, 693–732. [Google Scholar] [CrossRef]
- Rosetti, G.; Vaz, G.; Fujarra, A. URANS calculations for smooth circular cylinder flow in a wide range of Reynolds numbers: Solution verification and validation. J. Fluids Eng. 2012, 134, 121103. [Google Scholar] [CrossRef]
- ANSYS. ANSYS Fluent User’s Guide; ANSYS: Canonsburg, PA, USA, 2021. [Google Scholar]
- Alimohammadi, S.; Fanning, E.; Persoons, T.; Murray, D. Characterization of flow vectoring phenomenon in adjacent synthetic jets using CFD and PIV. Comput. Fluids 2016, 140, 232–246. [Google Scholar] [CrossRef]
- Jain, M.; Puranik, B.; Agrawal, A. A numerical investigation of effects of cavity and orifice parameters on the characteristics of a synthetic jet flow. Sens. Actuators A Phys. 2011, 165, 351–366. [Google Scholar] [CrossRef]
- Freitas, C. Verification and validation in computational fluid dynamics and heat transfer: PTC 61. In Proceedings of the ASME 2006 Power Conference, Atlanta, GA, USA, 2–4 May 2006; pp. 793–800. [Google Scholar] [CrossRef]
- Liu, H.; Wei, J.; Qu, Z. The interaction of porous material coating with the near wake of bluff body. J. Fluids Eng. 2013, 136, 021302. [Google Scholar] [CrossRef]
- Roshko, A. Experiments on the flow past a circular cylinder at very high Reynolds number. J. Fluid Mech. 1961, 10, 345–356. [Google Scholar] [CrossRef] [Green Version]
- Kirkup, L.; Frenkel, R.B. The t-distribution and Welch-Satterthwaite formula. In An Introduction to Uncertainty in Measurement: Using the GUM (Guide to the Expression of Uncertainty in Measurement); Cambridge University Press: Cambridge, UK, 2006; pp. 162–190. [Google Scholar] [CrossRef]


| Author | Study | (°) | (×10) | |||
|---|---|---|---|---|---|---|
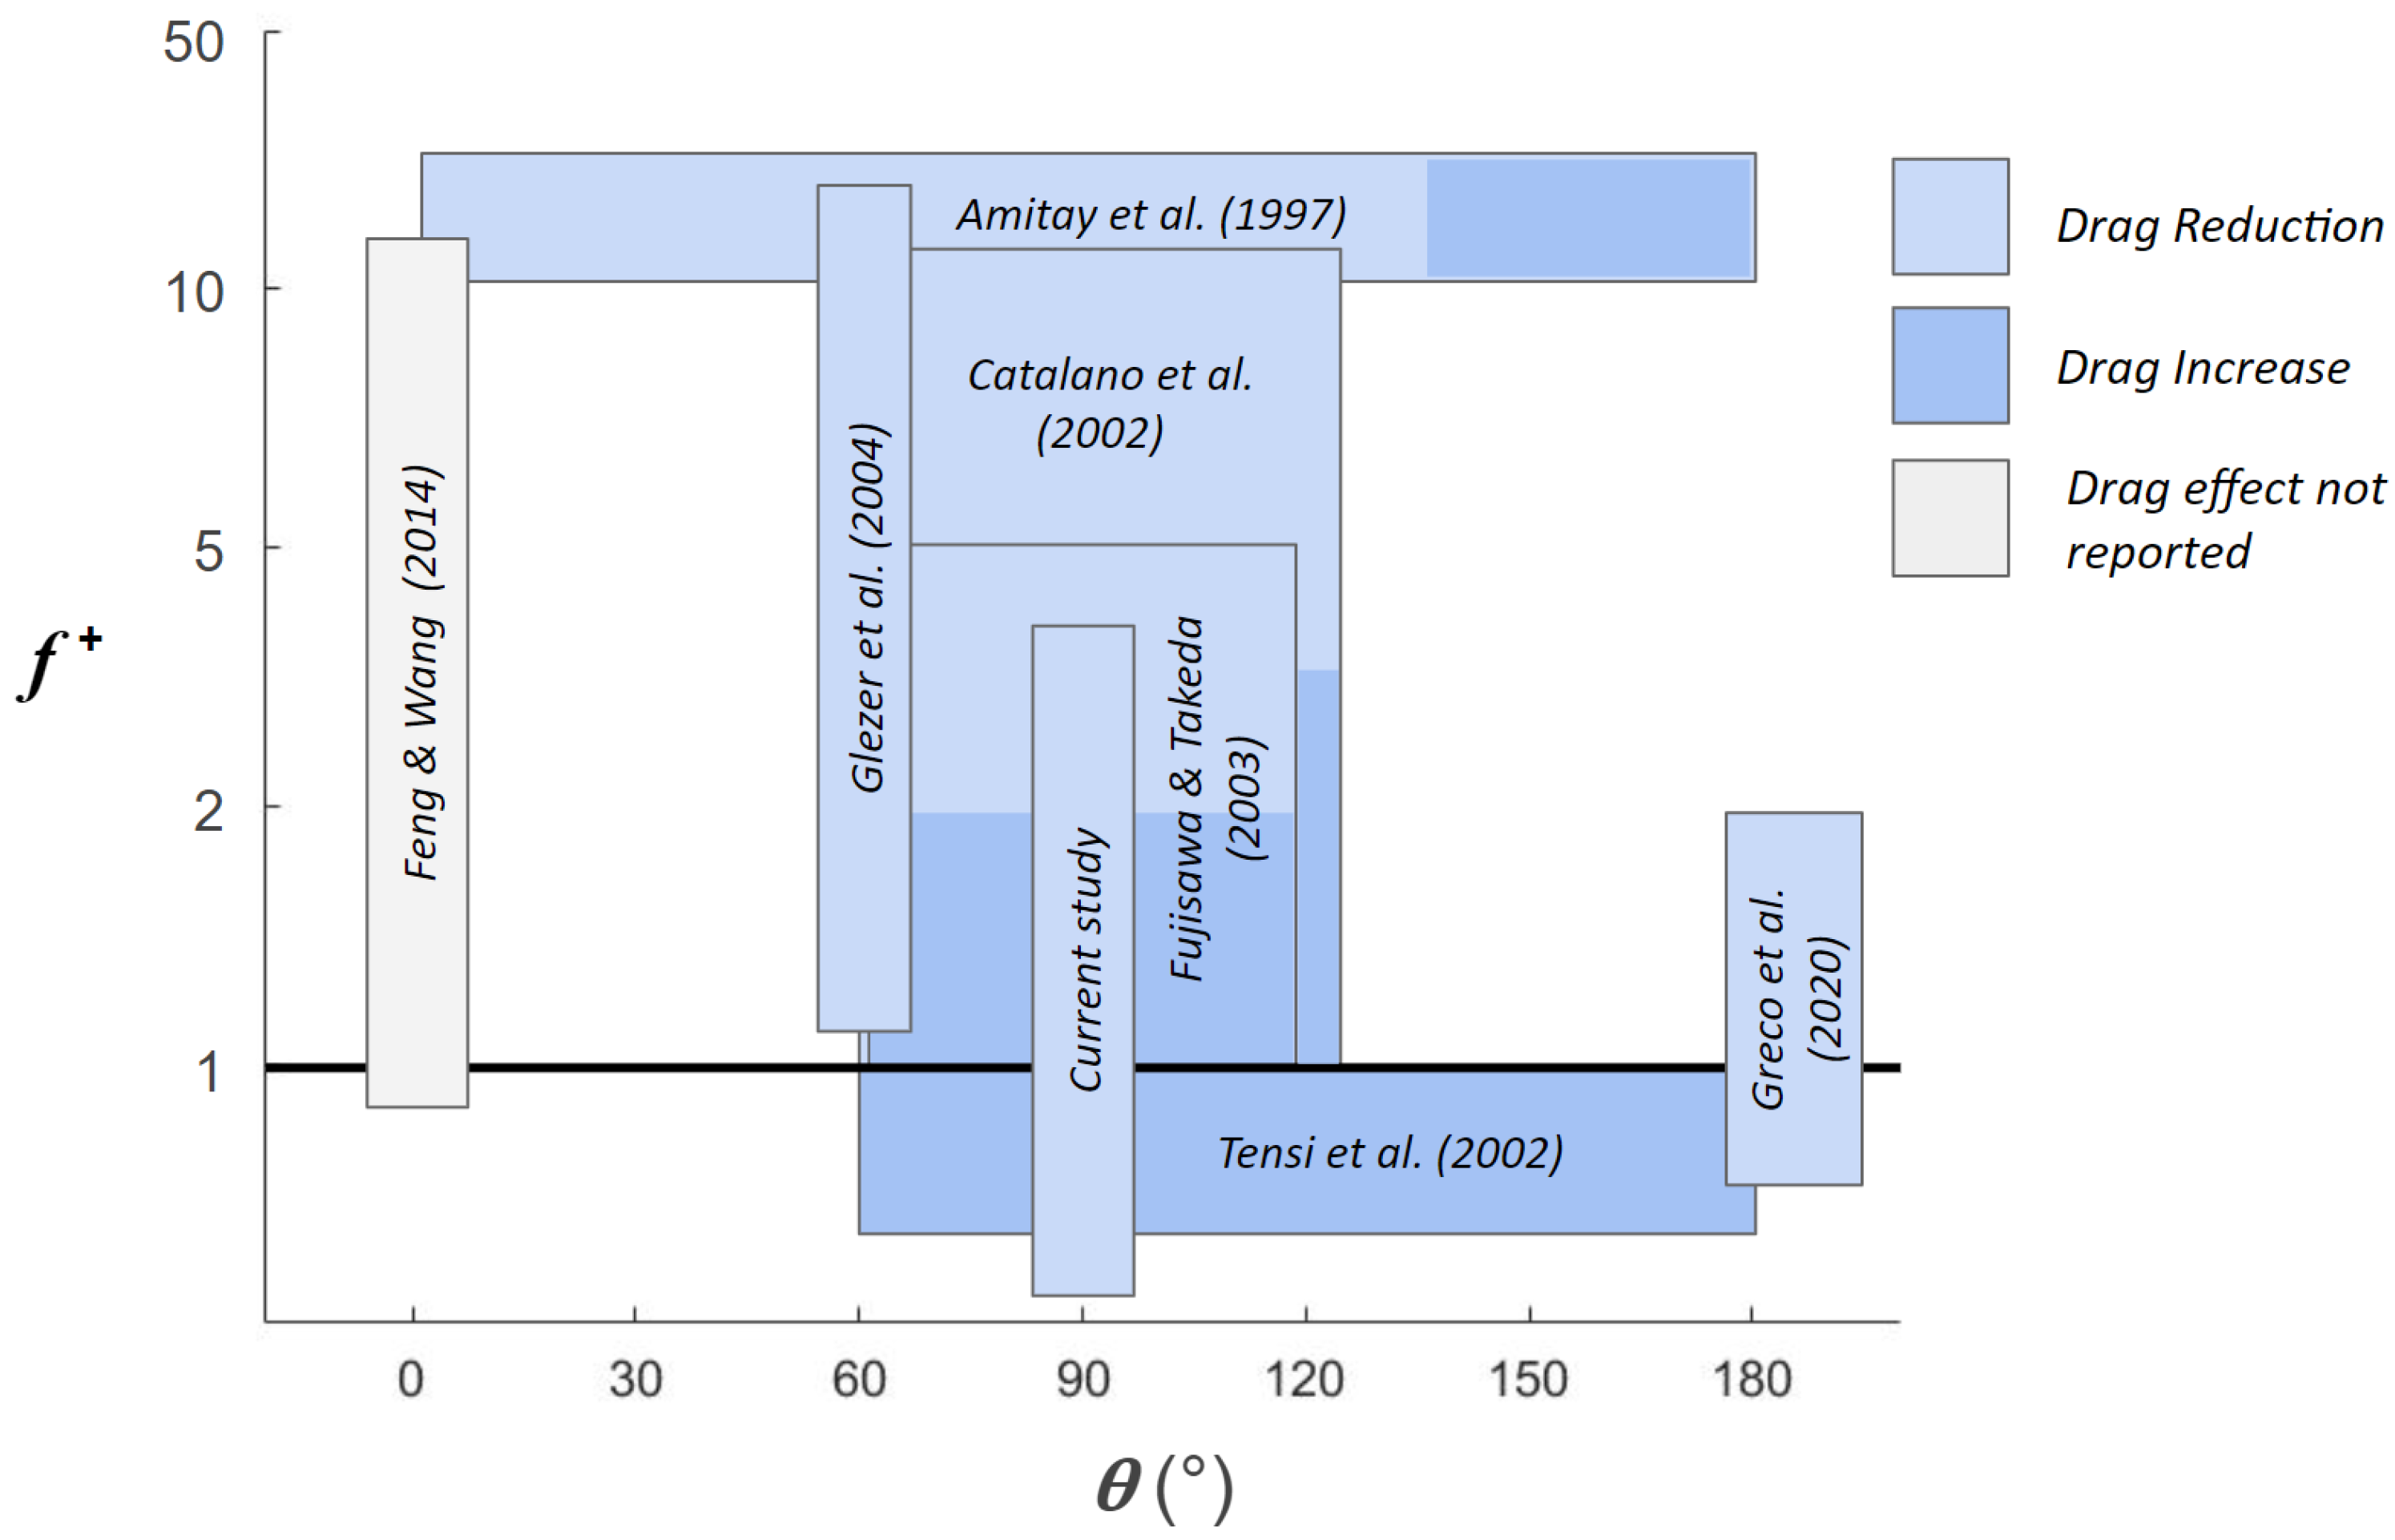
| Amitay et al. [4] | Exp. | 0–180 | 0.03–0.6 | 11.5–20 | 4000, 7.5 | −30% |
| Catalano et al. [6] | Num. | 60–120 | 6.5 | 2–14 | 500, 3900 | −13% |
| Tensi et al. [23] | Exp. | (−)60–180 | 0.81–6.48 | 0.33–1 | 1.0 × 10 | +36% |
| Fujisawa & Takeda [5] | Exp. | 60–120 | 0.41–6.5 | 1–5 | 9.0 | −30% |
| Glezer et al. [25] | Exp. | 60 | 0.6 | 1.15–23 | 7.6 | −17% |
| Current study | Num. | 90 | 3.6 | 0.15–4 | 4.2 |
| Author | Study | Coating | Turb. Model | |||
|---|---|---|---|---|---|---|
| Bruneau et al. [11] | Num. | Full | DNS | 2400–3×10 | - | −75% |
| Naito et al. [31] | Num. | Full | DNS/LES | 100–1 × 10 | +70% | −73% |
| Zhang et al. [8] | Num. | Full | k-/LES | 4.7 | −30% | - |
| Klausmann & Ruck [10] | Exp. | Partial | - | 3 –1.4 × 10 | −13% | - |
| Guinness & Persoons [9] | Num. | Partial | k- | 4.2 | −15% | −54% |
| Author | ||||
|---|---|---|---|---|
| Current | 4.2 | 1.18 | 0.969 | 0.255 |
| Klausmann & Ruck [10] | 4.2 | 1.24 | - | - |
| Roshko [43] | 4.2 | 1.2 | - | - |
| Liu et al. [42] | 9.3 | 1.31 | 0.88 | 0.196 |
| Case | ||||
|---|---|---|---|---|
| Smooth | 1.17 | 0.117 | 0.03 | 0.01 |
| SJO | 1.22 | 0.182 | 0.06 | 0.01 |
| PCO | 0.99 | 0.029 | 0.03 | 0.003 |
| SJPC | 1.02 | 0.158 | 0.03 | 0.01 |
Publisher’s Note: MDPI stays neutral with regard to jurisdictional claims in published maps and institutional affiliations. |
© 2022 by the authors. Licensee MDPI, Basel, Switzerland. This article is an open access article distributed under the terms and conditions of the Creative Commons Attribution (CC BY) license (https://creativecommons.org/licenses/by/4.0/).
Share and Cite
Farrell, G.; Gibbons, M.; Persoons, T. Combined Passive/Active Flow Control of Drag and Lift Forces on a Cylinder in Crossflow Using a Synthetic Jet Actuator and Porous Coatings. Actuators 2022, 11, 201. https://doi.org/10.3390/act11070201
Farrell G, Gibbons M, Persoons T. Combined Passive/Active Flow Control of Drag and Lift Forces on a Cylinder in Crossflow Using a Synthetic Jet Actuator and Porous Coatings. Actuators. 2022; 11(7):201. https://doi.org/10.3390/act11070201
Chicago/Turabian StyleFarrell, Gearóid, Michael Gibbons, and Tim Persoons. 2022. "Combined Passive/Active Flow Control of Drag and Lift Forces on a Cylinder in Crossflow Using a Synthetic Jet Actuator and Porous Coatings" Actuators 11, no. 7: 201. https://doi.org/10.3390/act11070201
APA StyleFarrell, G., Gibbons, M., & Persoons, T. (2022). Combined Passive/Active Flow Control of Drag and Lift Forces on a Cylinder in Crossflow Using a Synthetic Jet Actuator and Porous Coatings. Actuators, 11(7), 201. https://doi.org/10.3390/act11070201