Article

Influence of Synthetic Jets on Multiscale Features in Wall-Bounded Turbulence

1
School of Mechanical Engineering, Tianjin University, 135 Yaguan Road, Tianjin 300350, China
2
Tianjin Key Laboratory of Modern Engineering Mechanics, Tianjin University, 135 Yaguan Road, Tianjin 300350, China
*
Author to whom correspondence should be addressed.
Actuators 2022, 11(7), 199; https://doi.org/10.3390/act11070199
Submission received: 4 July 2022 / Revised: 16 July 2022 / Accepted: 17 July 2022 / Published: 18 July 2022
(This article belongs to the Special Issue Active Flow Control: Recent Advances in Fundamentals and Applications)

Abstract

:
This experimental research focuses on the impacts of submerged synthetic jets on a fully-developed turbulent boundary layer (TBL) under a drag reduction working case. Two-dimensional velocity vectors in the flow field are captured with the aid of a particle image velocimetry (PIV) system. Proper orthogonal decomposition (POD) analyses provide evidence that synthetic jets notably attenuate the induction effect of prograde vortex on the low-speed fluid in large-scale fluctuation velocity field, thereby weakening the bursting process of near-wall turbulent events. Furthermore, the introduced perturbance redistributes the turbulent kinetic energy (TKE) and concentrates the TKE onto small-scale coherent structures. Modal time coefficients in various orders of POD are divided into components of multiple frequency bands by virtue of complementary ensemble empirical mode decomposition (CEEMD). It is found that the turbulence signals are shifted from low-frequency to high-frequency bands thanks to synthetic jets, thus revealing the relationship between scales and frequency bands. One further method of scale decomposition is proposed, that is, the large-scale fluctuating flow field will be obtained after removing the high-frequency noise data with the help of continuous mean square error (CMSE) criterion.

1. Introduction

Wall turbulence drag reduction technologies have represented a dramatic topic in aerospace and other engineering applications over the past few decades as a result of the oil crisis in the early 1970s [1]. So far, various control schemes [2] have been put forward with remarkable success and are of great significance in improving the performance of vehicles and saving energy [3]. The consensus is that effective drag reduction is achieved by impairing coherent structures [4] in the turbulent boundary layer (TBL). Generally, passive approaches that only apply to a single design condition are reliable and well-studied. In contrast, active control techniques are too complicated to be attained, which has become a vital research direction to be conquered at present [5]. Among them, the accomplishment of skin friction drag reduction by employing blowing and suction at the wall is a widely studied strategy [6]. Fortunately, the synthetic jet actuator (SJA) has the ability to generate local blowing and suction without additional air supply. This facilitates interaction with vorticity structures in the TBL [7], which has tremendous potential.
Ricco et al. [8] reviewed sundry state-of-the-art techniques oriented toward turbulent drag reduction via spanwise actuation, including wall motion, plasma body forces and synthetic jets, pointing out the preponderance of synthetic jets for resistance reduction control. The interaction experiment of the inclined circular synthetic jets with turbulent channel flow was carried out by Iuso et al. [9]. Reductions in the average surface friction of up to 15% as well as in the turbulence pulsation of up to 12% were realized. Yao et al. [10] imposed a body force in the motion equation to simulate the spanwise motion induced by synthetic jets, successfully achieving an optimal net energy saving rate of 17%. In light of the research of Thomas et al. [11], spanwise synthetic jets generated by a pulsed DC plasma exciter enabled a resistance reduction margin of over 70%, with the drag reduction ratio increasing logarithmically as the number of streaks decrease. Cannata et al. [12] perturbed the TBL through a linear array of synthetic jets orthogonal to the streamwise direction and the coalescence of near-wall structures was observed. This meant a reduction in the number of coherent structures and a suppression of turbulent activity, enabling wall shear stress decreases. By means of direct numerical simulation (DNS), Xie et al. [13] verified that the wall shear stress aggrandized in the suction phase of synthetic jets and declined in the blowing phase, the overall drag reduction phenomenon was attributed to a finite counterflow resulting from the nonlinear interaction between the synthetic jets and mainstream.
Heretofore, the research on turbulent drag reduction control utilizing synthetic jets is primarily concentrated in the aviation industry. In the field of underwater drag reduction, traditional bionic technology is still adopted [14], which poses a huge challenge to researchers. In order to make up for the deficiency in this aspect, some scholars began to conduct studies about submerged synthetic jet drag reduction. The investigation of underwater synthetic jets distributed along the span and oriented in the wall-normal direction to simulate the spanwise force of an oscillating wall indirectly was completed by Segawa et al. [15]. They detected an appreciable drag reduction rate of up to 30% using the fiber Bragg grating (FBG) system. Spinosa et al. [16] adopted an array of round synthetic jets to modify the boundary layer flow field in a water channel. The artificial hairpin vortices of the same scale as that of the coherent structures in the near-wall region were generated by synthetic jets, accordingly, forming a drag reduction region with streamwise velocity deficit.
It is worth noting that a basic property of turbulence is its multiscale features [17], whereas current academia still lacks in-depth analyses on the regulation mechanism of synthetic jets on the scale characteristics of TBL. The present work revolves around how synthetic jets alter the multiscale properties of turbulence under drag reduction state. The snapshot proper orthogonal decomposition (POD) is employed to divide the scale of the flow field before and after the control is handled, then on this basis, a new approach of the scale definition is proposed on the grounds of complementary ensemble empirical mode decomposition (CEEMD). Eventually, the control effect of synthetic jets on turbulent burst events is further explored.

2. Experimental Facilities and Procedure

2.1. Laboratory Equipment

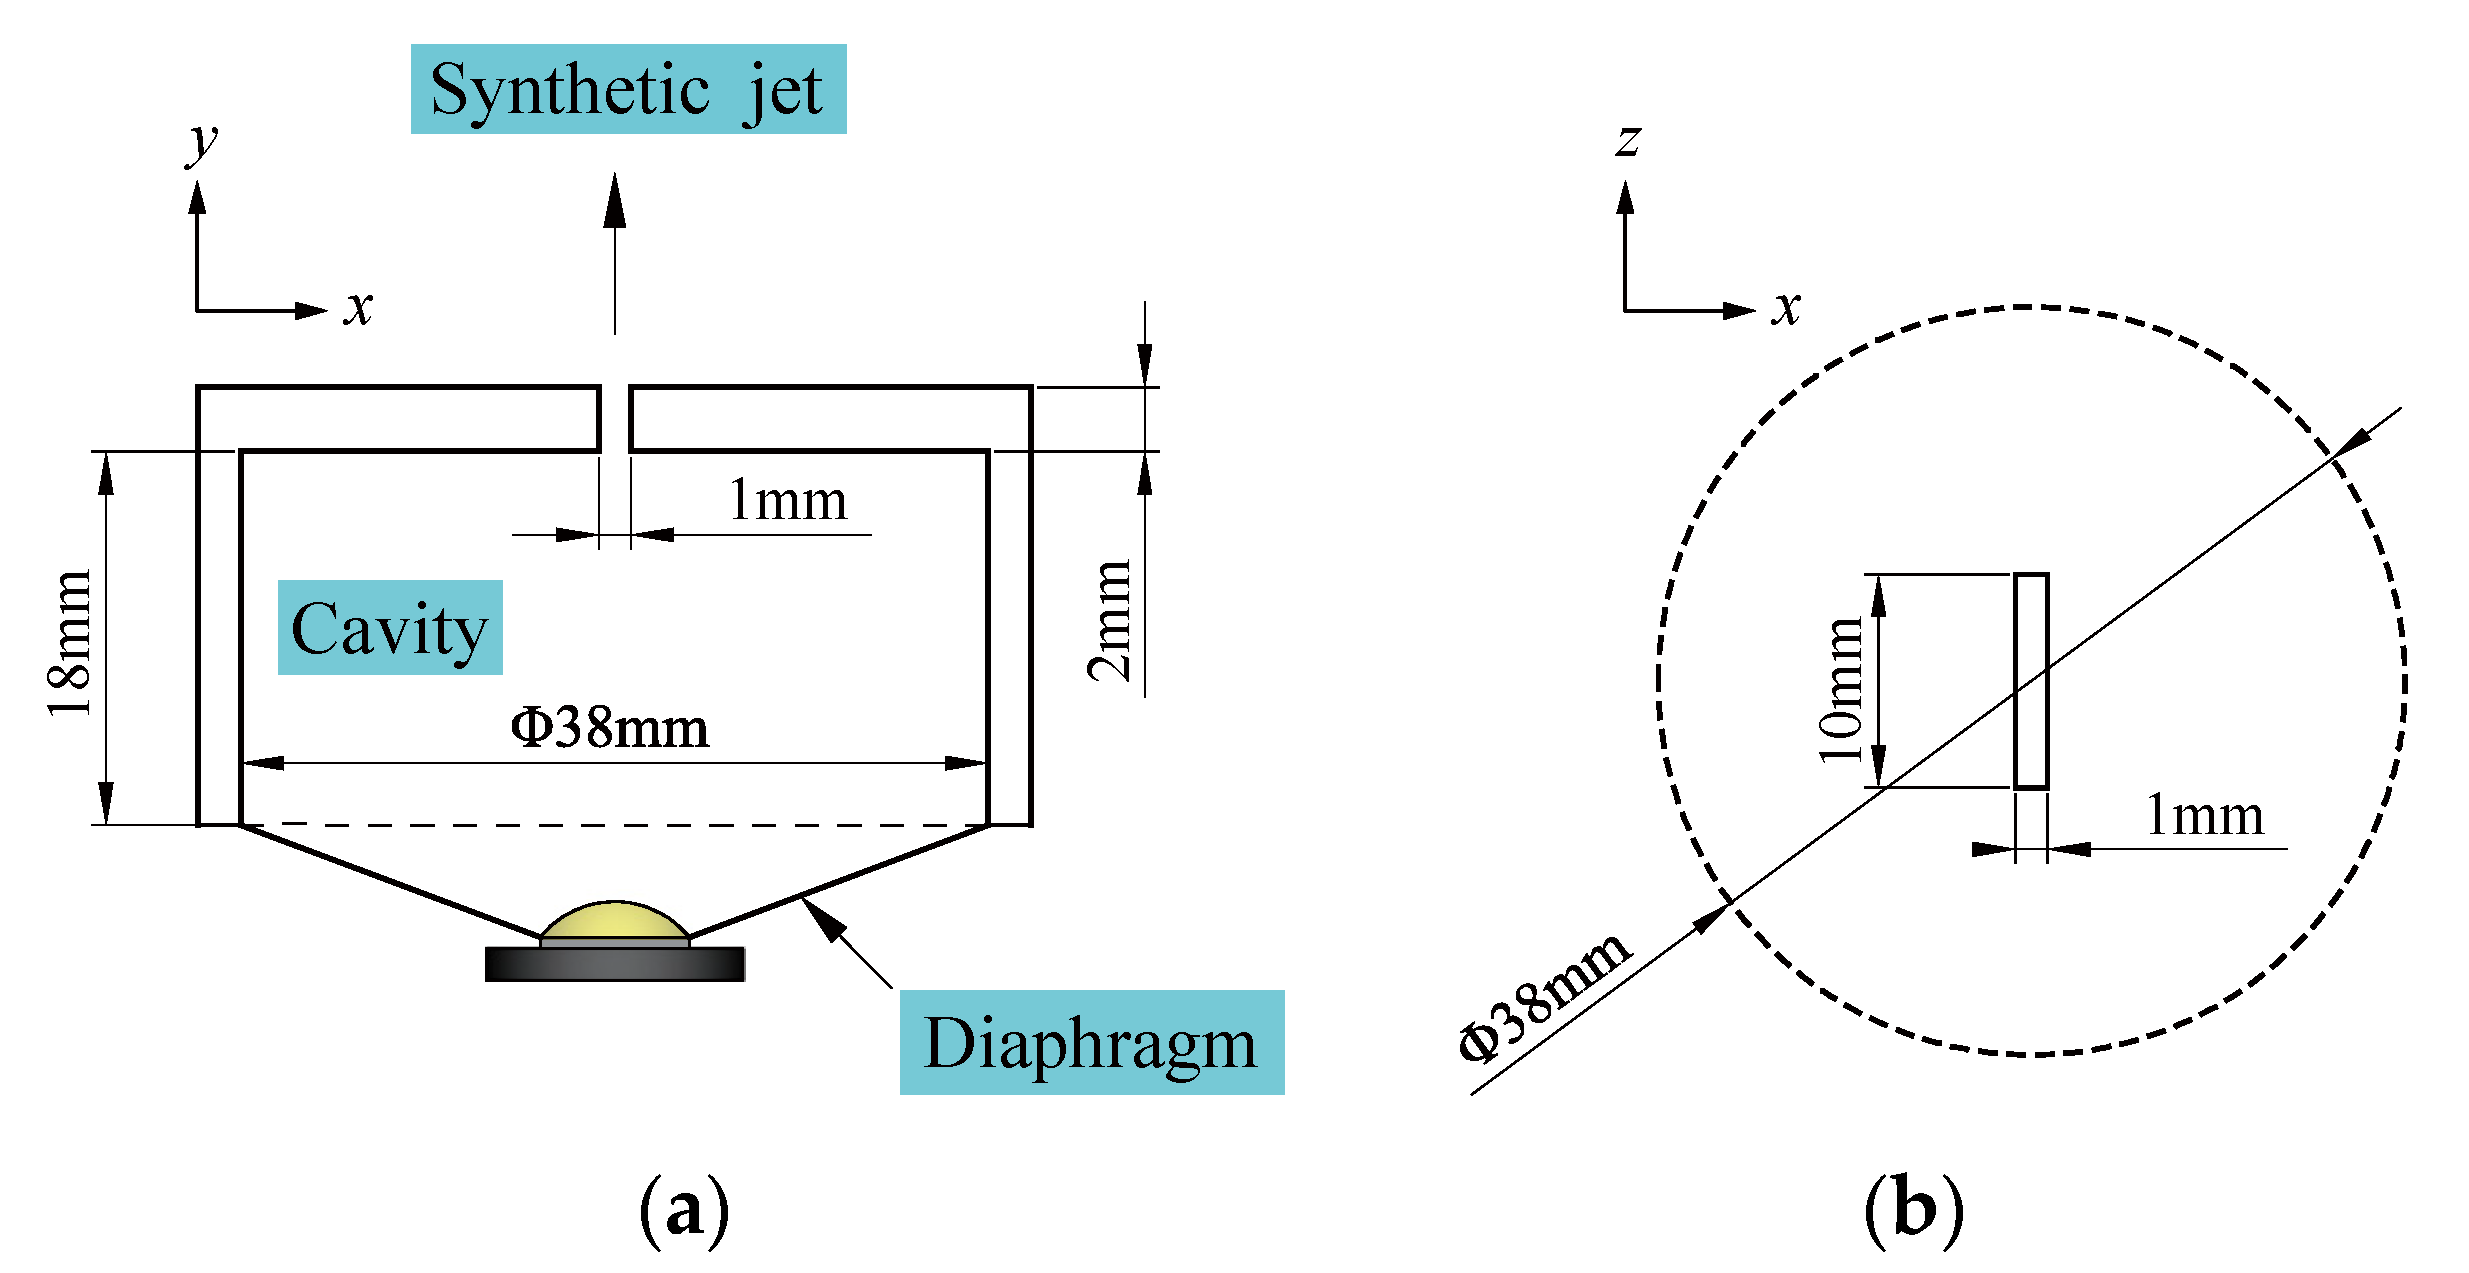
The active control investigations were accomplished at Tianjin University in a low-speed recirculating water flume with a cross section of 6.2 m long, 0.3 m wide and 0.38 m high. The detailed schematic is exhibited in Figure 1. The dimensions of Plexiglas test plate placed horizontally was 2.9 m × 0.294 m × 0.02 m (length × width × thickness), and the front edge was trimmed with an ellipse of 4:1 along the long and short axes to prevent the flow separation. The tripwire, 2 mm in diameter, was mounted 100 mm downstream of the leading edge for accelerating the transition, and a trailing-edge flap at the tail of the platform was used to realize zero-pressure gradient flow. One 1 mm long, 10 mm wide spanwise slit was set at 2450 mm downstream of the central line of the front edge, and the SJA was located in the cavity below it. In the current work, the TBL flow developed at a mainstream velocity u of 0.23 m/s with around 1.5% turbulence intensity, and the friction Reynolds number under the uncontrolled case was R e τ = 532 . The coordinate axes x, y and z refer to the streamwise, wall-normal and spanwise directions, respectively, and u, v and w are the corresponding velocities. For convenience of contrast, the center of the synthetic jet outlet is designated as the origin of streamwise direction.
Figure 2 illustrates an enlarged view of the SJA. The rectangular slit is orientated vertical to the plate. A waterproof loudspeaker was selected as the exciter. It was attached to a cavity whose bottom was 38 mm in diameter and 18 mm deep. In a former study, we found that under the operating parameters of voltage 09 V, frequency 26 Hz and sinusoidal vibration waveform, SJA can produce a maximum drag reduction rate of about 17.27% [18]. Therefore, this working condition is elaborated in-depth below.

2.2. Measurement Process

The velocity vectors in the streamwise-wall-normal plane were acquired via the 2D-TR-PIV system. Note that the tracking of the fluid was realized by polyamide with a diameter of 20 μm and a density of 1.03 g/cm3. The x-y plane was illuminated by a laser with a maximum output power of 10 W and the light thickness of about 1 mm. The Speed Sense 9072 12-bit charge-coupled device (CCD) camera, faced the position of 50 mm downstream of the jet hole, was equipped with a 60 mm Nikon lens for recording, storing and processing particle images. Table 1 lists the parameters for measurement. The total sampling time was more than 68 s, ensuring statistical convergence. The transformation from particle images to velocity vectors was realized by dint of the Dynamic Studio software, and the pseudovector was expected to be less than 1%.

3. Results and Analyses

3.1. Proper Orthogonal Decomposition

For the two-dimensional two-component (2D-2C) velocity field, the snapshot POD [19] could be executed to availably separate the scale feature of flow. The specific idea is that the instantaneous field can be regarded as the superposition of the mean field and the fluctuation field:
x ( t i ) = x ( ξ , t i ) x ¯ ( ξ ) m , i = 1 , 2 , n , n m
where x = ( u , v ) , m and n are space and time series, respectively, and m = 92 × 156 × 2 . Since POD is not sensitive to time resolution [20], and in order to reduce the computational burden, one snapshot is extracted for every five snapshots, so the time series is n = 8215 . In view of this, the time scale equivalent is to be amplified by a factor of 5, and as a result, the value of frequency needs to be reduced by 5 times, accordingly, in the power spectral density (PSD) analysis of the time coefficients in the following. The specific process is as follows:
(1)
The time series (fluctuation velocity) matrix is expressed as:
X = [ x ( t 1 ) , x ( t 2 ) , x ( t 3 ) , , x ( t n 1 ) , x ( t n ) ] m × n
(2)
Solving the eigenvectors Ψ j and eigenvalues λ j of the correlation matrix:
X T X Ψ j = λ j Ψ j ,   Ψ j n
(3)
The basis function for POD mode is written as:
Φ j = X Ψ j X Ψ j m , j = 1 , 2 , , n
(4)
The time coefficient (expansion coefficient) of each mode will be realized as:
a j = Φ j T X
(5)
Reconstructing the fluctuating velocity field:
x ( ξ , t i ) = j = 1 n a j ( t i ) Φ j ( ξ )
(6)
Single-order mode turbulent kinetic energy ratio:
P ( λ ) = λ j Σ λ , j = 1 , 2 , , n
(7)
The proportion of cumulative energy is defined as:
C ( λ ) = Σ j = 1 k λ j Σ λ , 1 k n
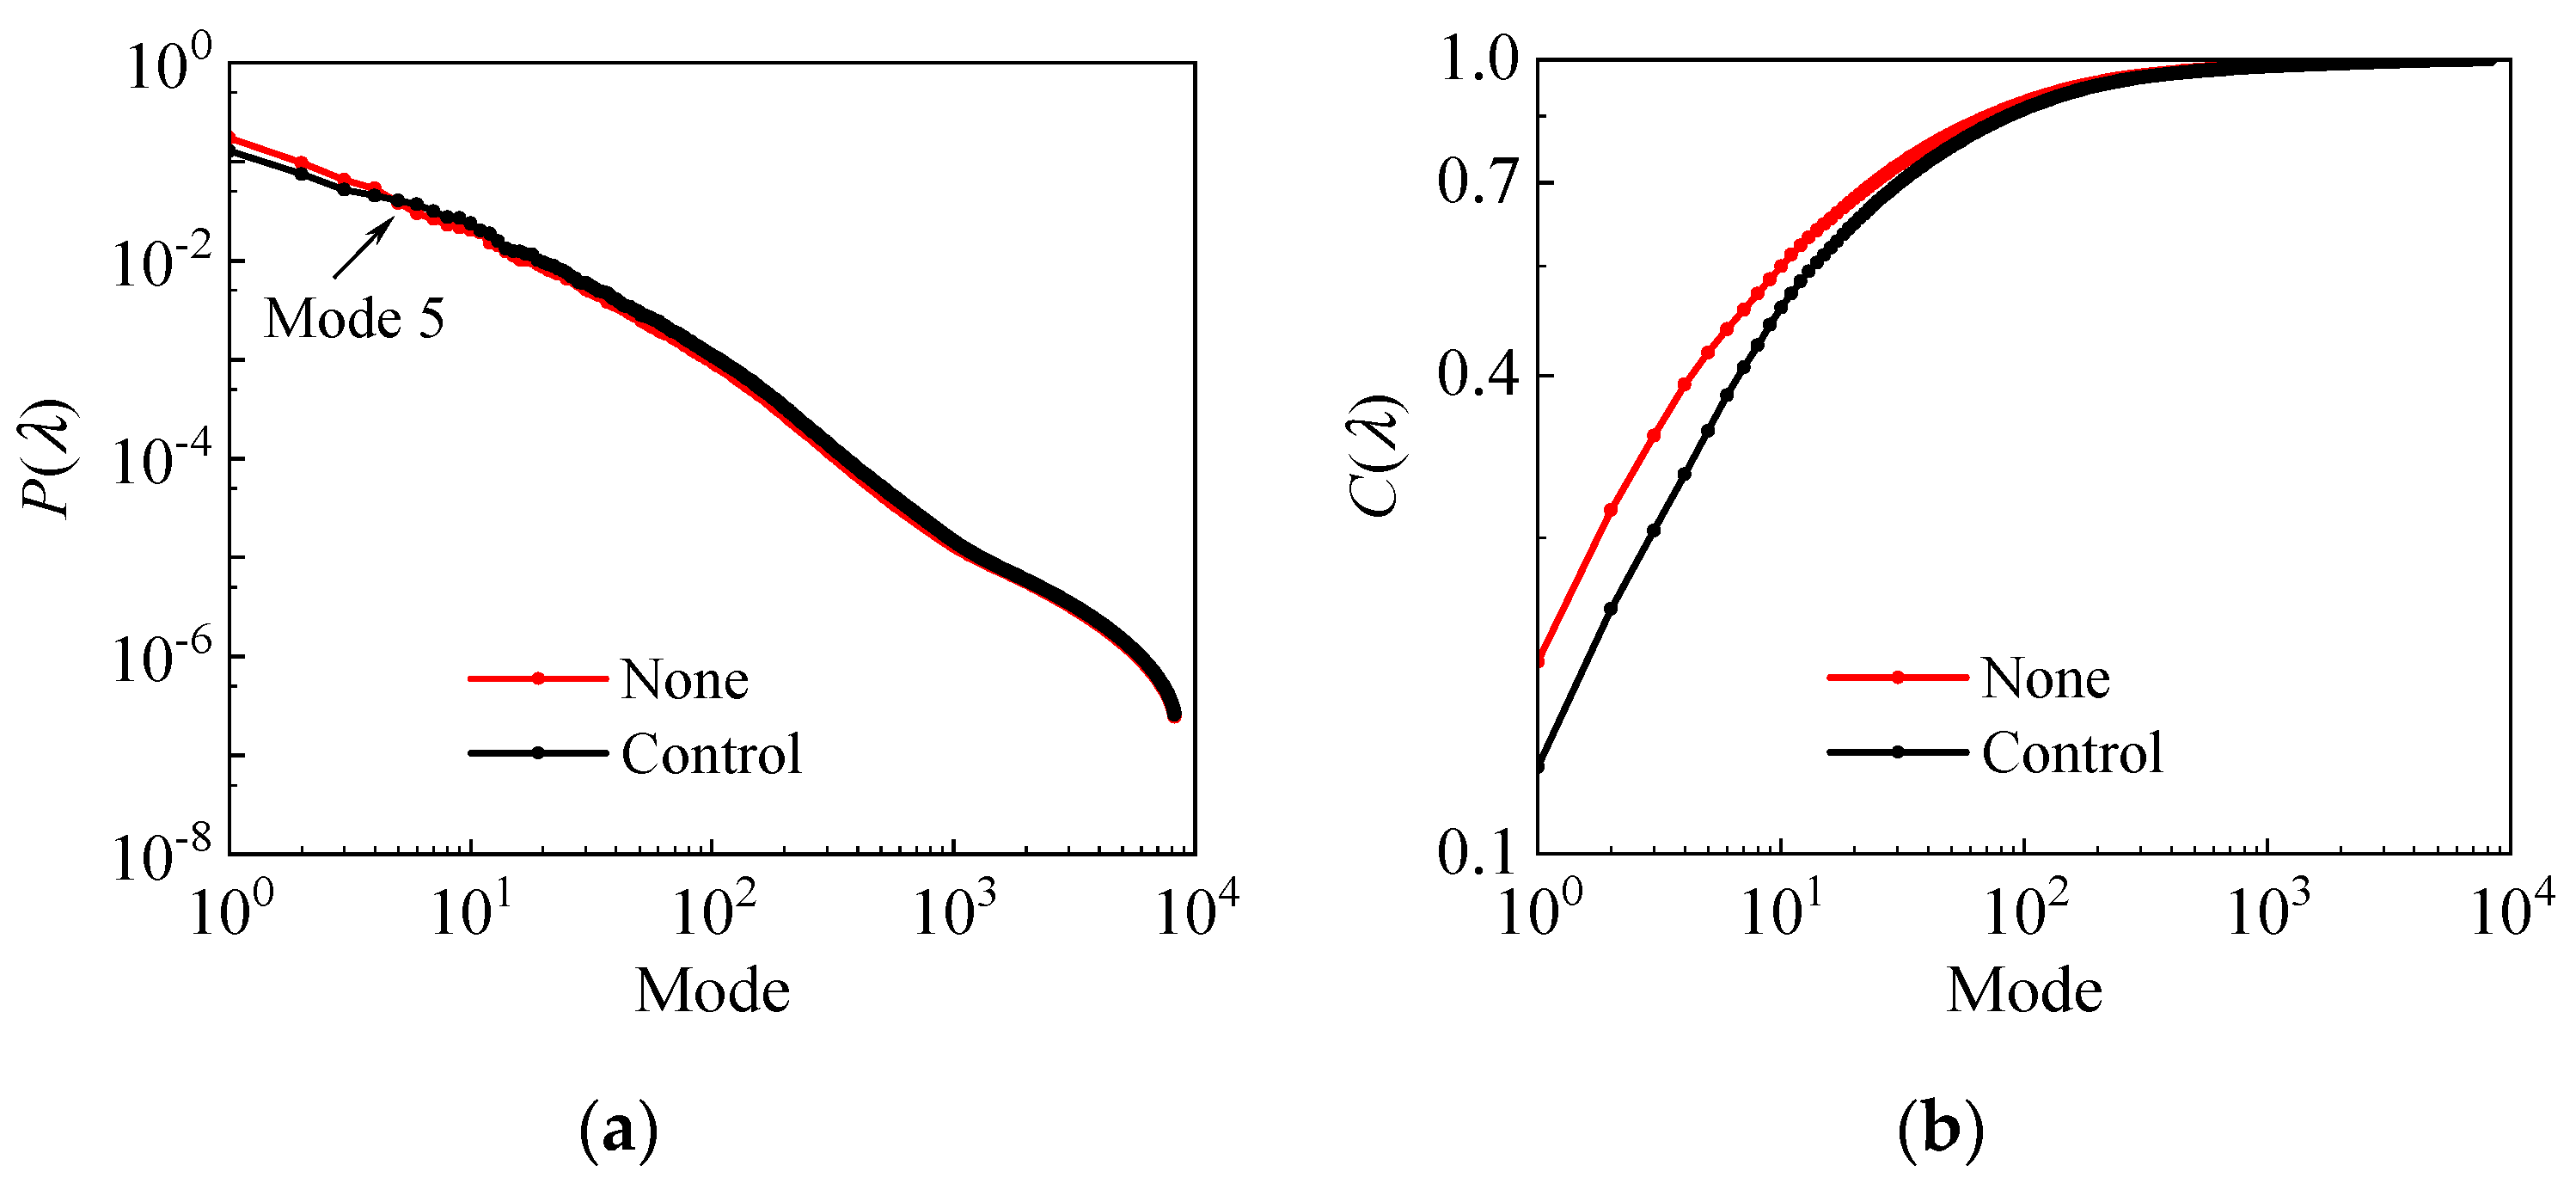
The contribution of each POD mode to total turbulent kinetic energy (TKE) is given in Figure 3a. In the control state, the energy proportion is lower than that without control in the first four modes, and starting with the fifth mode, energy distribution of the two conditions is opposite. Thus, it can be inferred that the synthetic jets restrain the large-scale (low-order) TKE and strengthen the small-scale (high-order) turbulent events. Figure 3b plots the cumulative energy ratio. For the perturbed condition, more modes are required to achieve the same levels of TKE as the uncontrolled flow field, which is because the periodic disturbance generated by synthetic jets accelerates the migration of turbulent energy from large-scale to small-scale.
The levels of TKE of the aforementioned various modes are determined by normalized eigenvalues, so the amount of information of turbulent events contained will be attained by introducing information entropy [21]. The formula is as follows:
H ( λ ) = j = 1 k P ( λ j )   log P ( λ j ) ,   1 k n
where the base of the logarithm is two and the unit is bit. Information entropy is the expectation of information content, as a result, in turbulent events, low-order modes have higher probability, smaller information entropy, less uncertainty and events are ordered; high-order modes have lower probability, larger information entropy, more uncertainty and events are disordered.
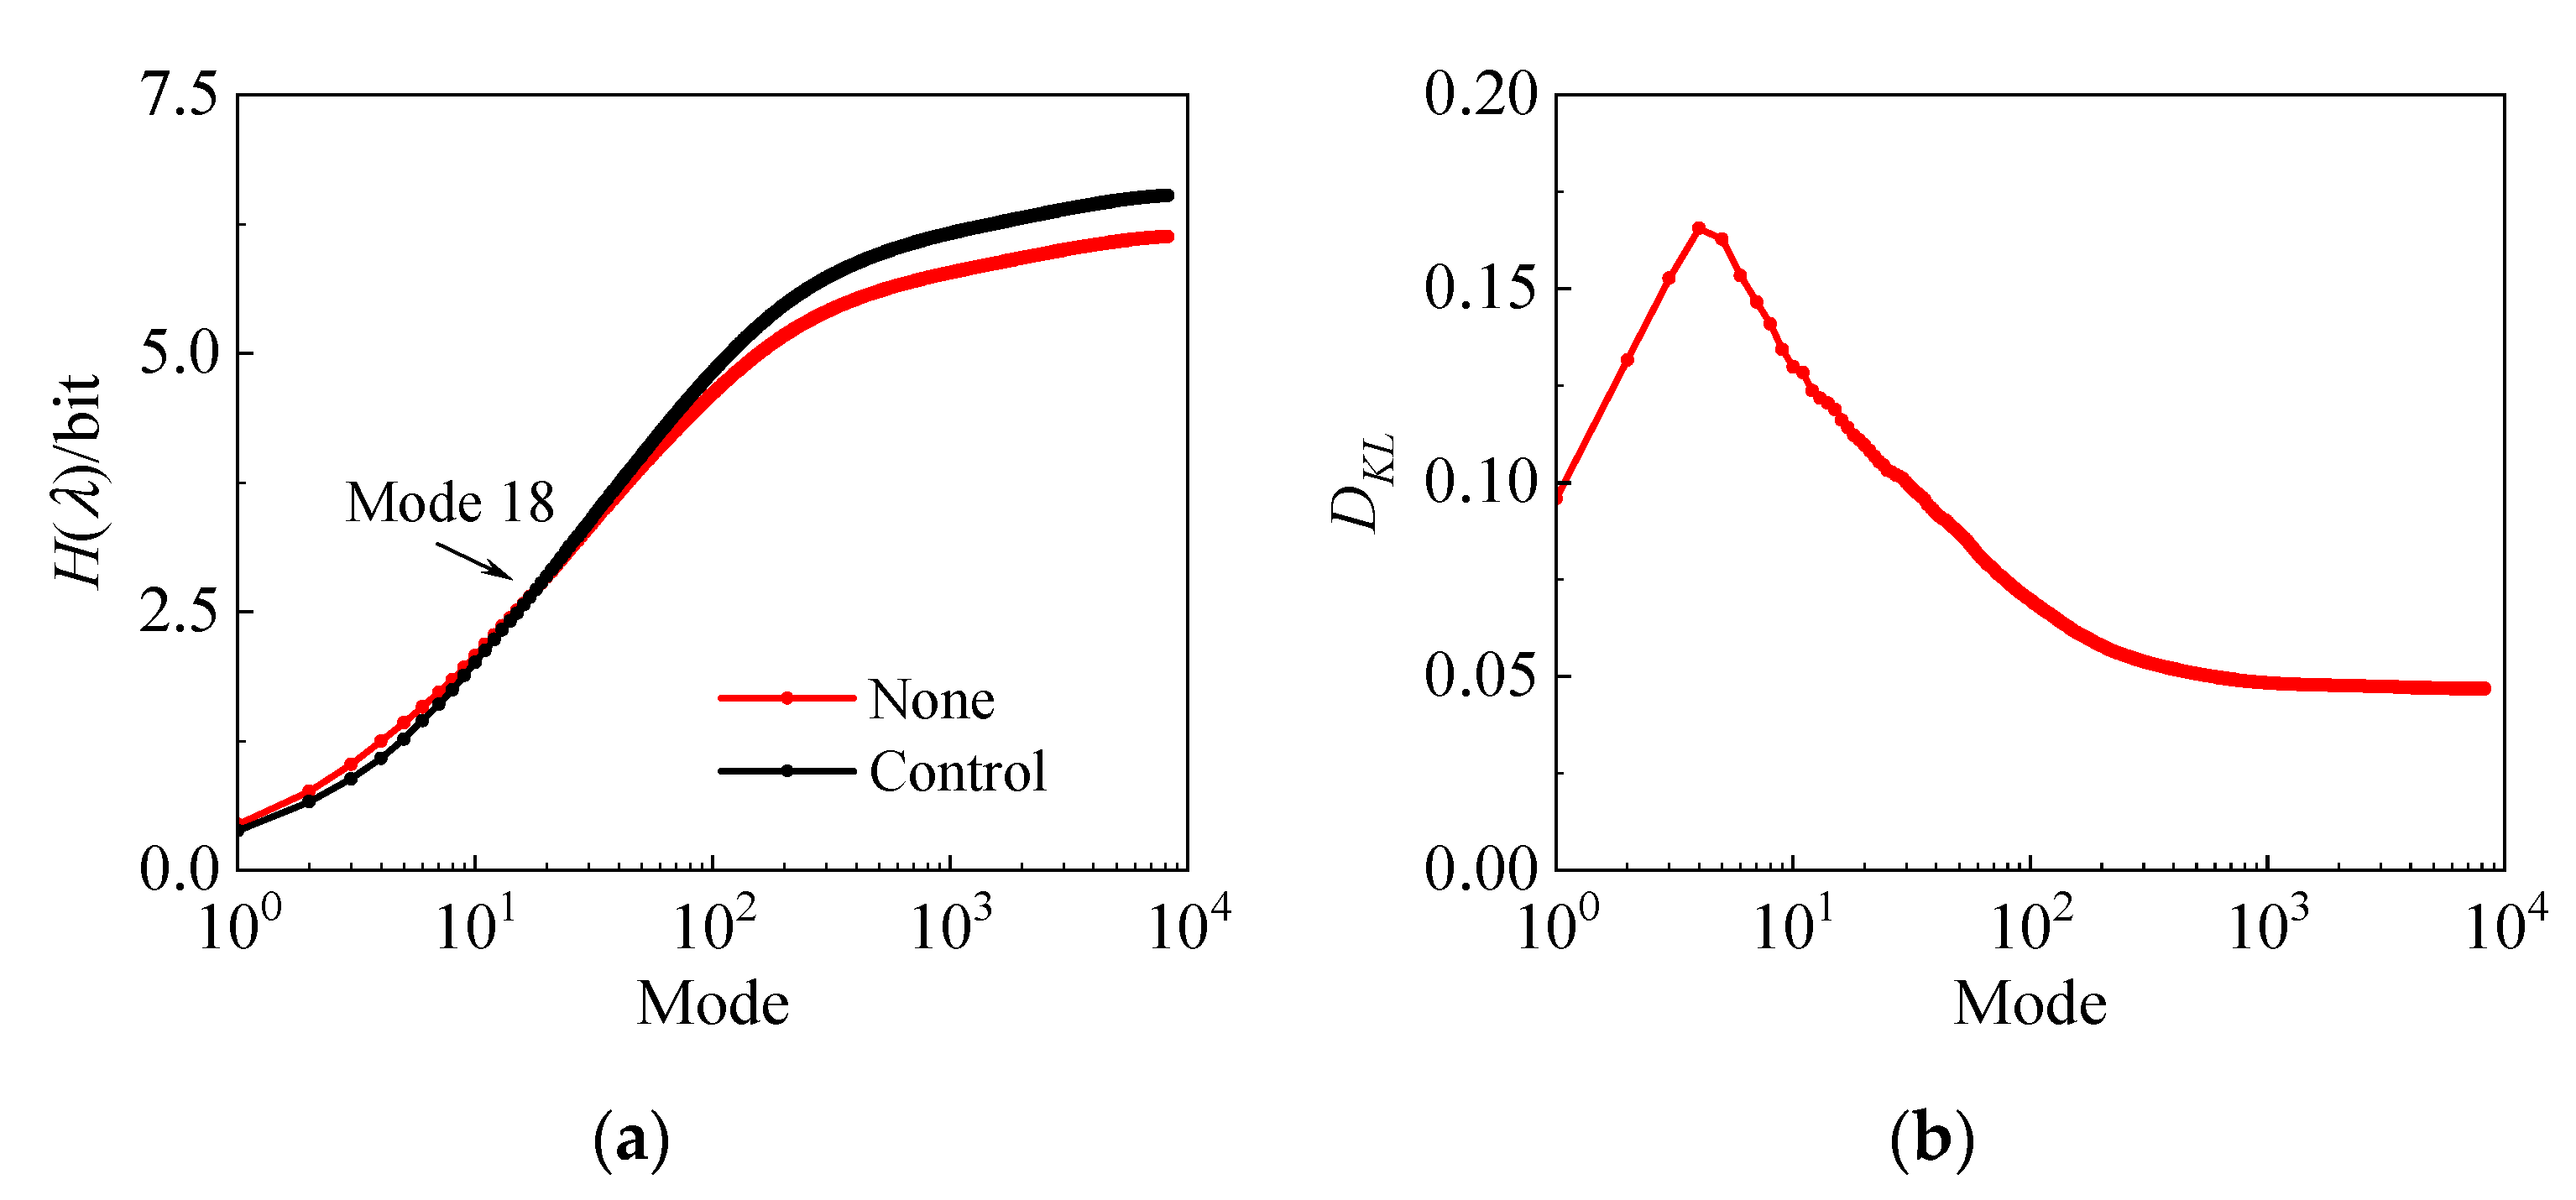
The accumulated curve of information entropy along with modes is reported in Figure 4a. The cumulative H ( λ ) of the first seventeen modes in the forced case is smaller than that of the undisturbed state. Since the eighteenth mode, the H ( λ ) of the former exceeds the latter, and the difference between the two is further expanded as the number of modes increases. On the whole, the H ( λ ) of the flow field before and after the application of control is 6.13 and 6.53, respectively. In other words, the existence of the synthetic jet leads to disordered flow field. However, it should be pointed out that in the low-order modes range (1~17), the uncertainty of the turbulent events contained in the controlled condition is relatively low, and the flow field is more orderly, which is attributed to the perturbation exerting a positive modulation influence on the large-scale coherent structures.
Based on the information entropy, Kullback et al. [22] proposed the concept of relative entropy, which can measure the disparity between two random distributions. The specific expression can be written as:
D K L ( P 0 P 1 ) = j = 1 k P 0 ( λ j ) log P 0 ( λ j ) P 1 ( λ j ) , 1 k n
where P 0 and P 1 represent the energy content of single mode before and after exerting the synthetic jets, singly. Figure 4b displays the curve of relative entropy. The variation trend of the curve increases first and then decreases and reaches the peak at the fourth mode. This means that the synthetic jets cause the difference between the forced flow field and the initial case to aggrandize, and the increase is chiefly concentrated in the lower modes. Although the synthetic jets heighten the small-scale TKE, the D K L gradually diminishes in higher-order modes and infinitely approaches a constant value, hence certifying the dominant status of the large-scale coherent structures in the boundary layer flow field.
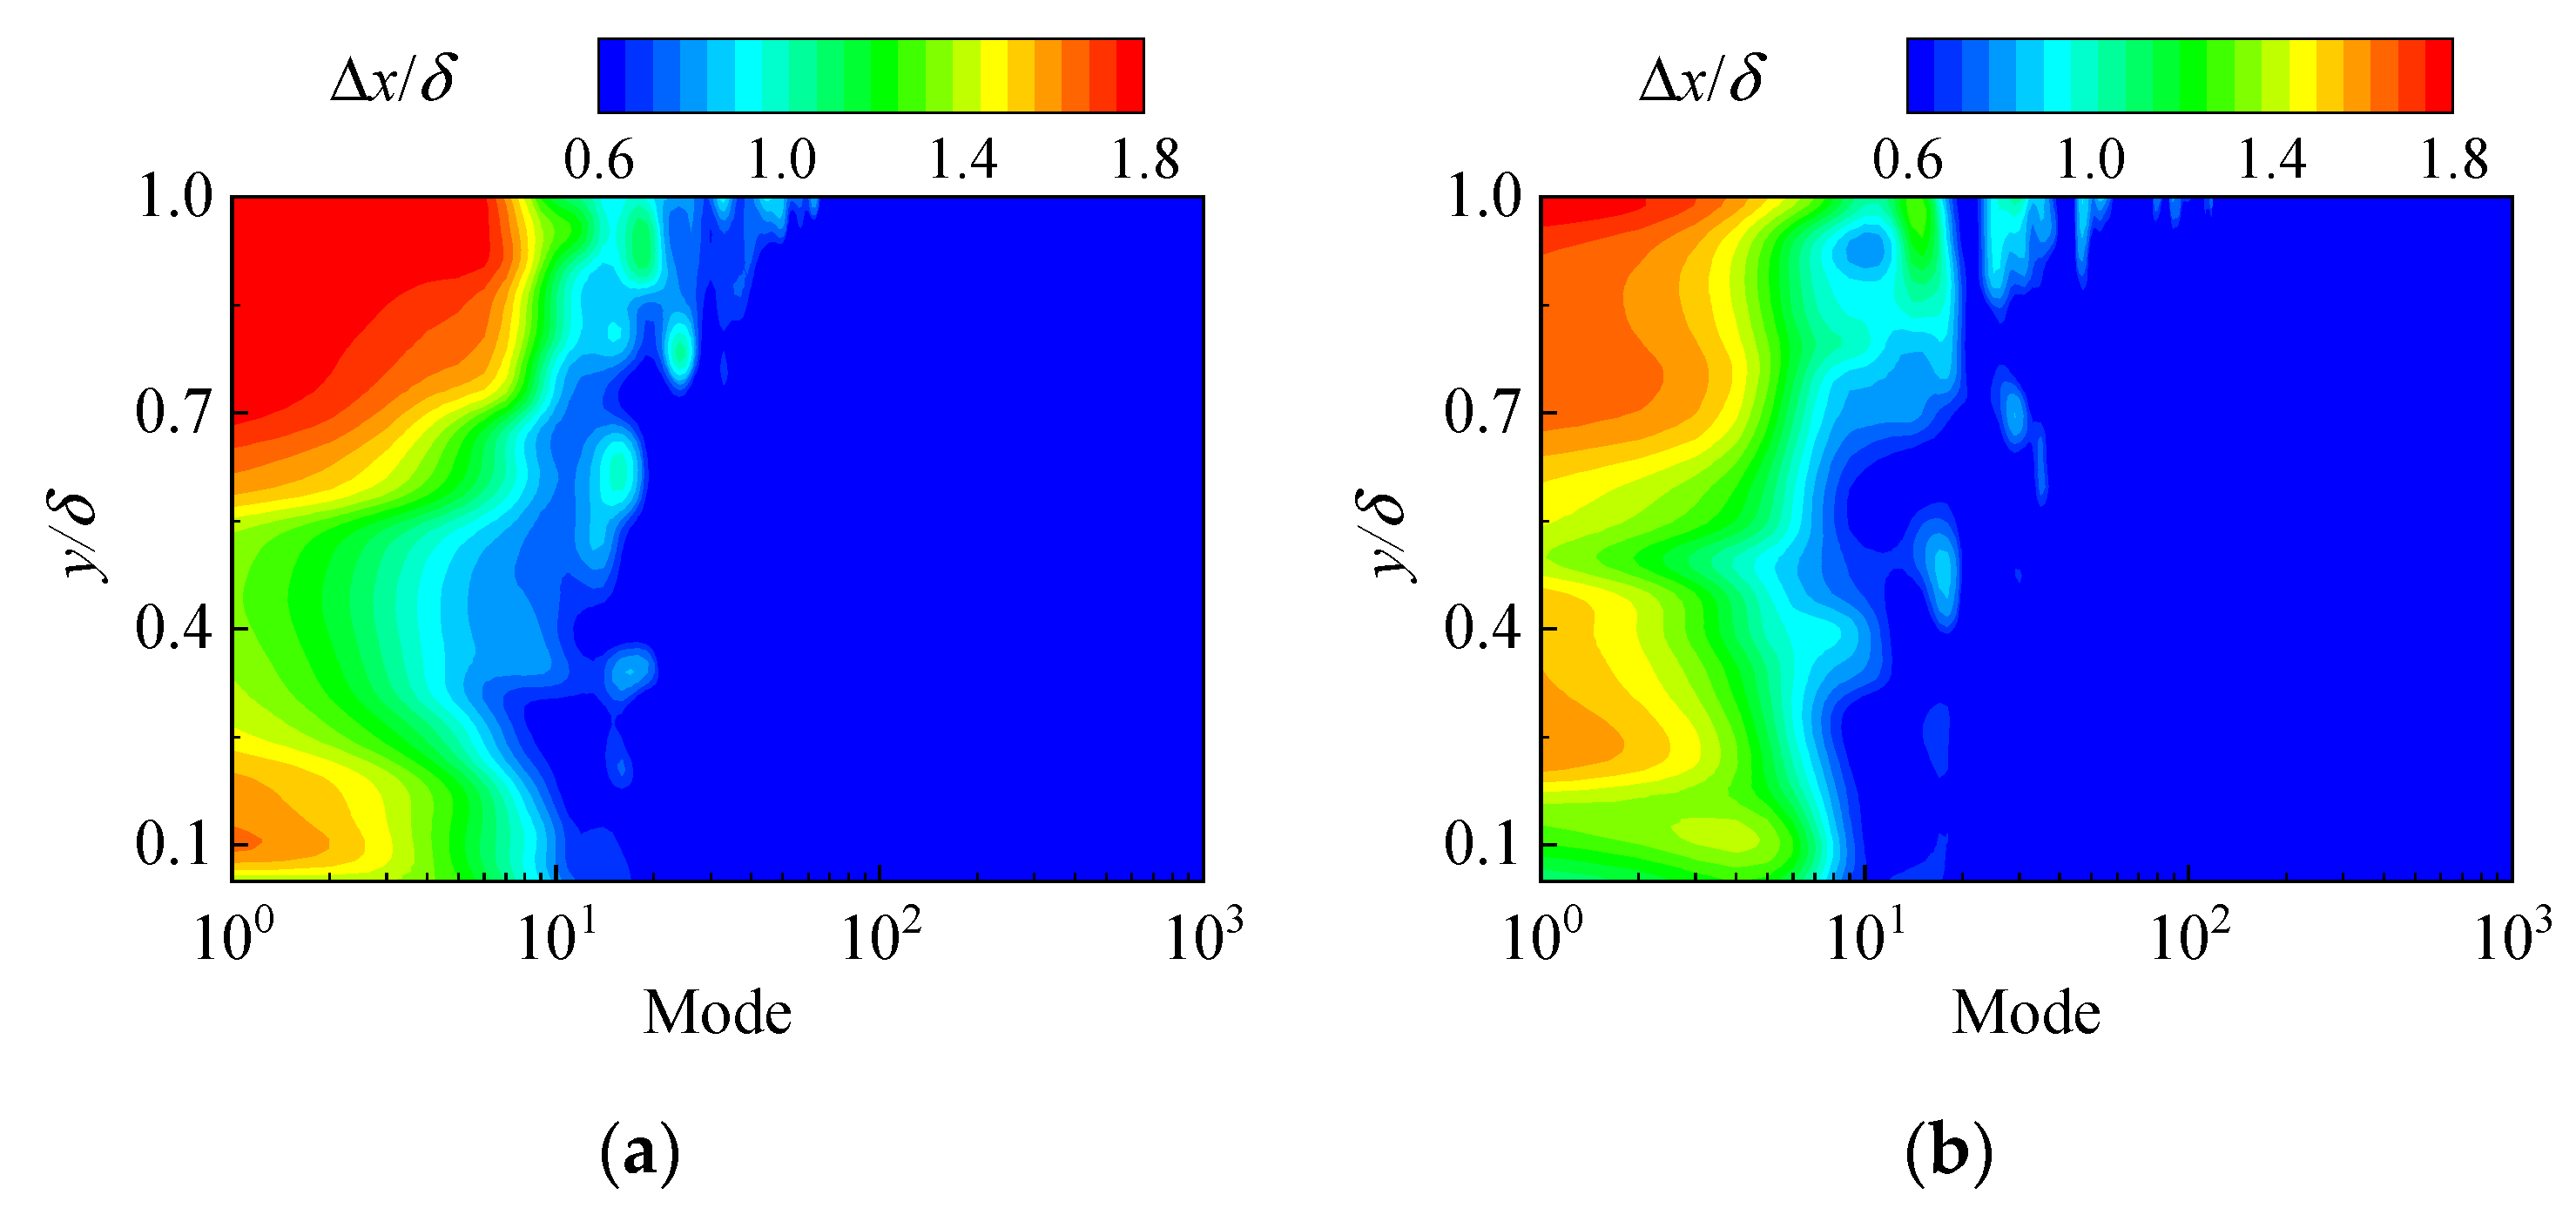
The scale features of each mode could be quantified by the autocorrelation analysis of the streamwise pulsation velocity along the flow direction, the spacing corresponding to the second peak of the correlation function is the streamwise scale. Figure 5 illustrates the spatial scale of the first 1000 modes in diverse wall-normal positions, and δ is the nominal thickness of the boundary layer in the uncontrolled case. In natural flow, the large-scale structures are mainly distributed in the first ten order modes, and some of the scale peaks appear near the wall. Once the synthetic jets were injected into the TBL, the spatial scale corresponding to the low-order modes is deadened to a certain extent at the same height while the status of small-scale structures is improved.
The PSD curves of the time coefficient are plotted in Figure 6. In the first mode, the energy is focused near the low-frequency region, and in the high-frequency region the energy accounts for a small proportion. In the low-frequency range, the PSD of unforced flow field is larger than that of the controlled state, reflecting the inhibition impact of synthetic jets on low-frequency signal. However, the consequence of Figure 6b is just inverse to that of Figure 6a, which is consistent with the conclusion of the energy contribution ratio for the aforementioned single-order mode. Starting from the thirteenth mode, the black curve has a peak at 26 Hz, the effect of external perturbance begins to come out. As for the eighteenth mode, the peak at the excitation frequency becomes larger, verifying that the perturbation introduced by synthetic jets belongs to high-frequency and small-scale.
In terms of the analysis process of Wu et al. [23], taking 50% of the TKE level as the threshold, the large- and small-scale fluctuation fields are reconstructed by Equation (5). For the variation of turbulent pulsation and spanwise vortex structure at different scales, the turbulent fluctuation velocity field can be studied by the conditional phase averaging. In this paper, the prograde vortex ( Λ c i < 0 ) was adopted as the detection condition, the detection function expression is defined as:
u l ( Δ x , y ) = u s ( Δ x , y ) = u l ( x + Δ x , y ) | Λ c i ( x , y r ) < 0 u s ( x + Δ x , y ) | Λ c i ( x , y r ) < 0
where u l and u s stand for the large- and small-scale u , respectively, the wall-normal reference position y r = 0.15 δ , where a complete spanwise vortex structure can be detected. The local swirling strength of the vorticity was identified by λ c i criterion [24], and the sign of local vorticity ω was assigned to λ c i , consequently, Λ c i = λ c i ω / | ω | .
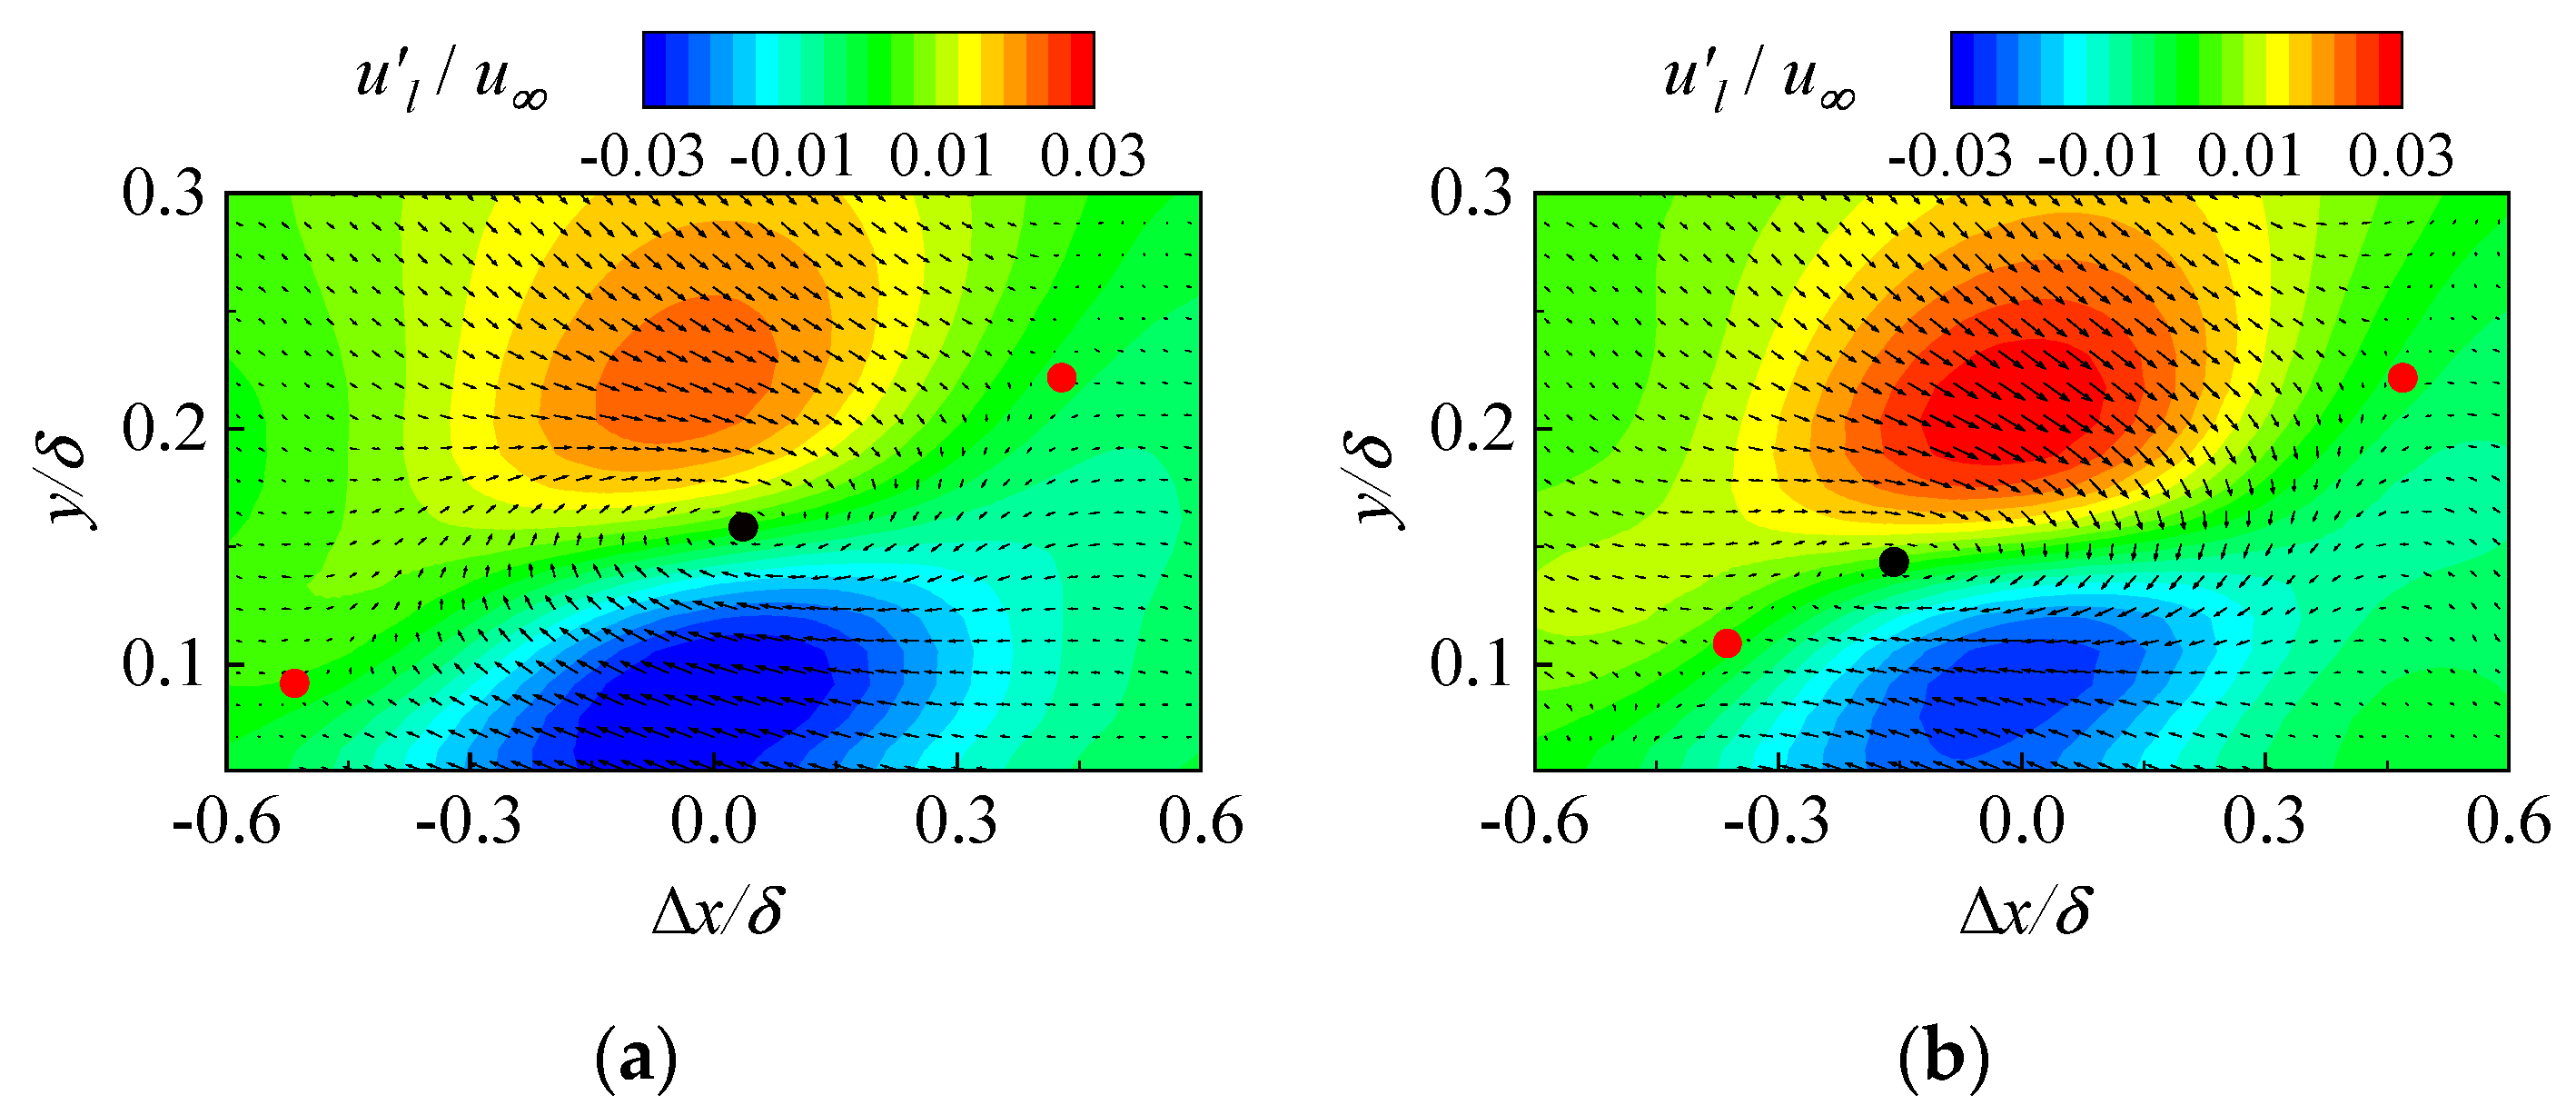
Figure 7 presents the condition average contours of large-scale streamwise fluctuating velocity field. The prograde vortex, whose vortex center is signified by the black dot, contributes great skin friction resistance due to the strong shear with the wall [25]. Compared with the undisturbed case, the large-scale positive fluctuation of the forced state is strengthened while the negative fluctuation is weakened. Moreover, the narrowing of the streamwise direction range in the low-speed region is conducive to cutting down the burst intensity of turbulent events. The red point is the saddle point, where the large-scale high- and low-speed fluids collide with each other, and the motion of the fluid is almost stagnant, contributing to the huge Reynolds shear stress [26]. In the disturbed case, the distance between left saddle point and vortex center becomes smaller and moves towards the far wall-normal direction, extremely lowering the mass, energy and momentum transport caused by the large-scale Reynolds shear stress near the wall.
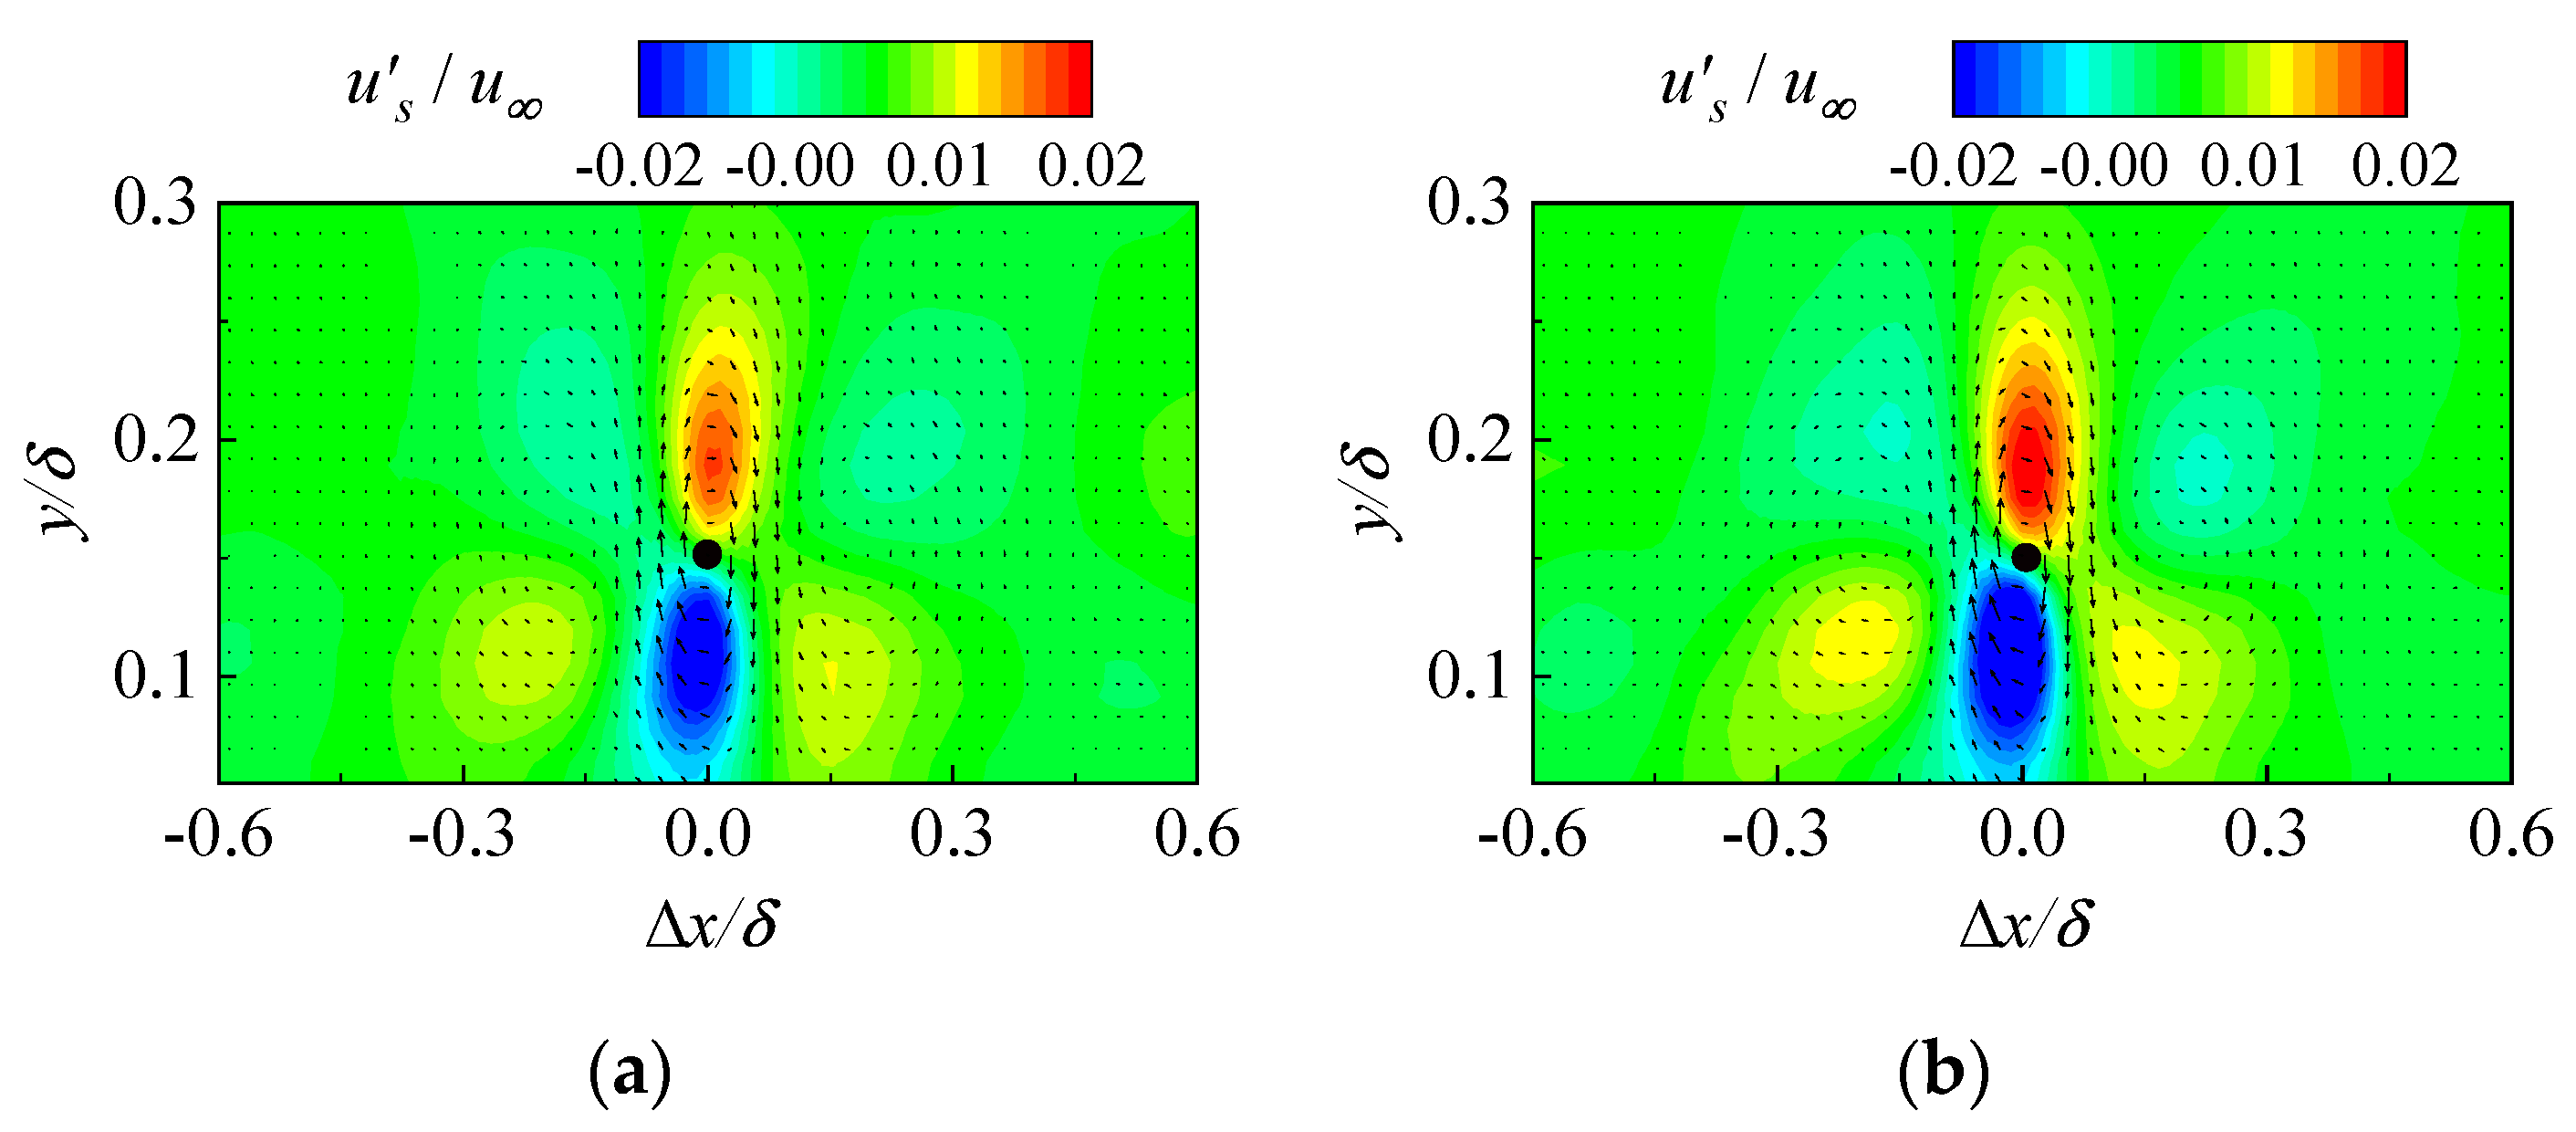
According to the conditional mean contours of the small-scale flow fluctuation velocity field in Figure 8, both positive and negative pulsations in the controlled flow field are enhanced, and the small-scale vortex structure becomes more active. These results can be attributed to two aspects: (1) small-scale perturbance continuously arises from the synthetic jets; (2) the disturbance disrupts the large-scale coherent structures.

3.2. Complementary Ensemble Empirical Mode Decomposition

The time coefficients calculated by POD belong to one-dimensional time series, which can be analyzed and processed by referring to the empirical mode decomposition (EMD) brought forward by Huang et al. [27]. The core idea of EMD is to decompose one complex signal into several intrinsic mode functions (IMFs) and a residual. Each IMF contains the information of different time scales, and the residual denotes the slow change of the signal [28]. Considering the modal aliasing phenomenon in EMD, we adopt an improved approach, namely complementary ensemble empirical mode decomposition (CEEMD) [29]. The procedure is as hereunder mentioned:
(1)
Setting the number of processing times h for the original signal;
(2)
A pair of positive and negative white noises that are opposite to each other are added to h source signals to form a series of new signals;
(3)
Two groups of IMFs will be obtained by performing EMD analysis of the new signals after addition and subtraction of white noise;
(4)
The mean value of the h group IMFs of the corresponding mode can be calculated to complete the decomposition.
The first mode time coefficient of POD is decomposed by CEEMD, and 12 IMFs are obtained, as manifested in Figure 9. These IMFs stand for pulsation information of different frequencies in the flow field and are arranged in order from high-frequency to low-frequency. Residual is not plotted in the graph. Regardless of the high-frequency or low-frequency IMFs, the fluctuation values are commonly concentrated near zero, making a small contribution to the original signal. The IMF amplitudes of the middle-frequency bands are large and show distinct periodicity. In the condition of synthetic jet flow, the amplitudes of high-frequency curves are markedly greater than that of the non-controlled case, and the amplitudes of the middle-frequency bands are attenuated, which implies that more high-frequency constituents are distributed in the perturbed flow field.
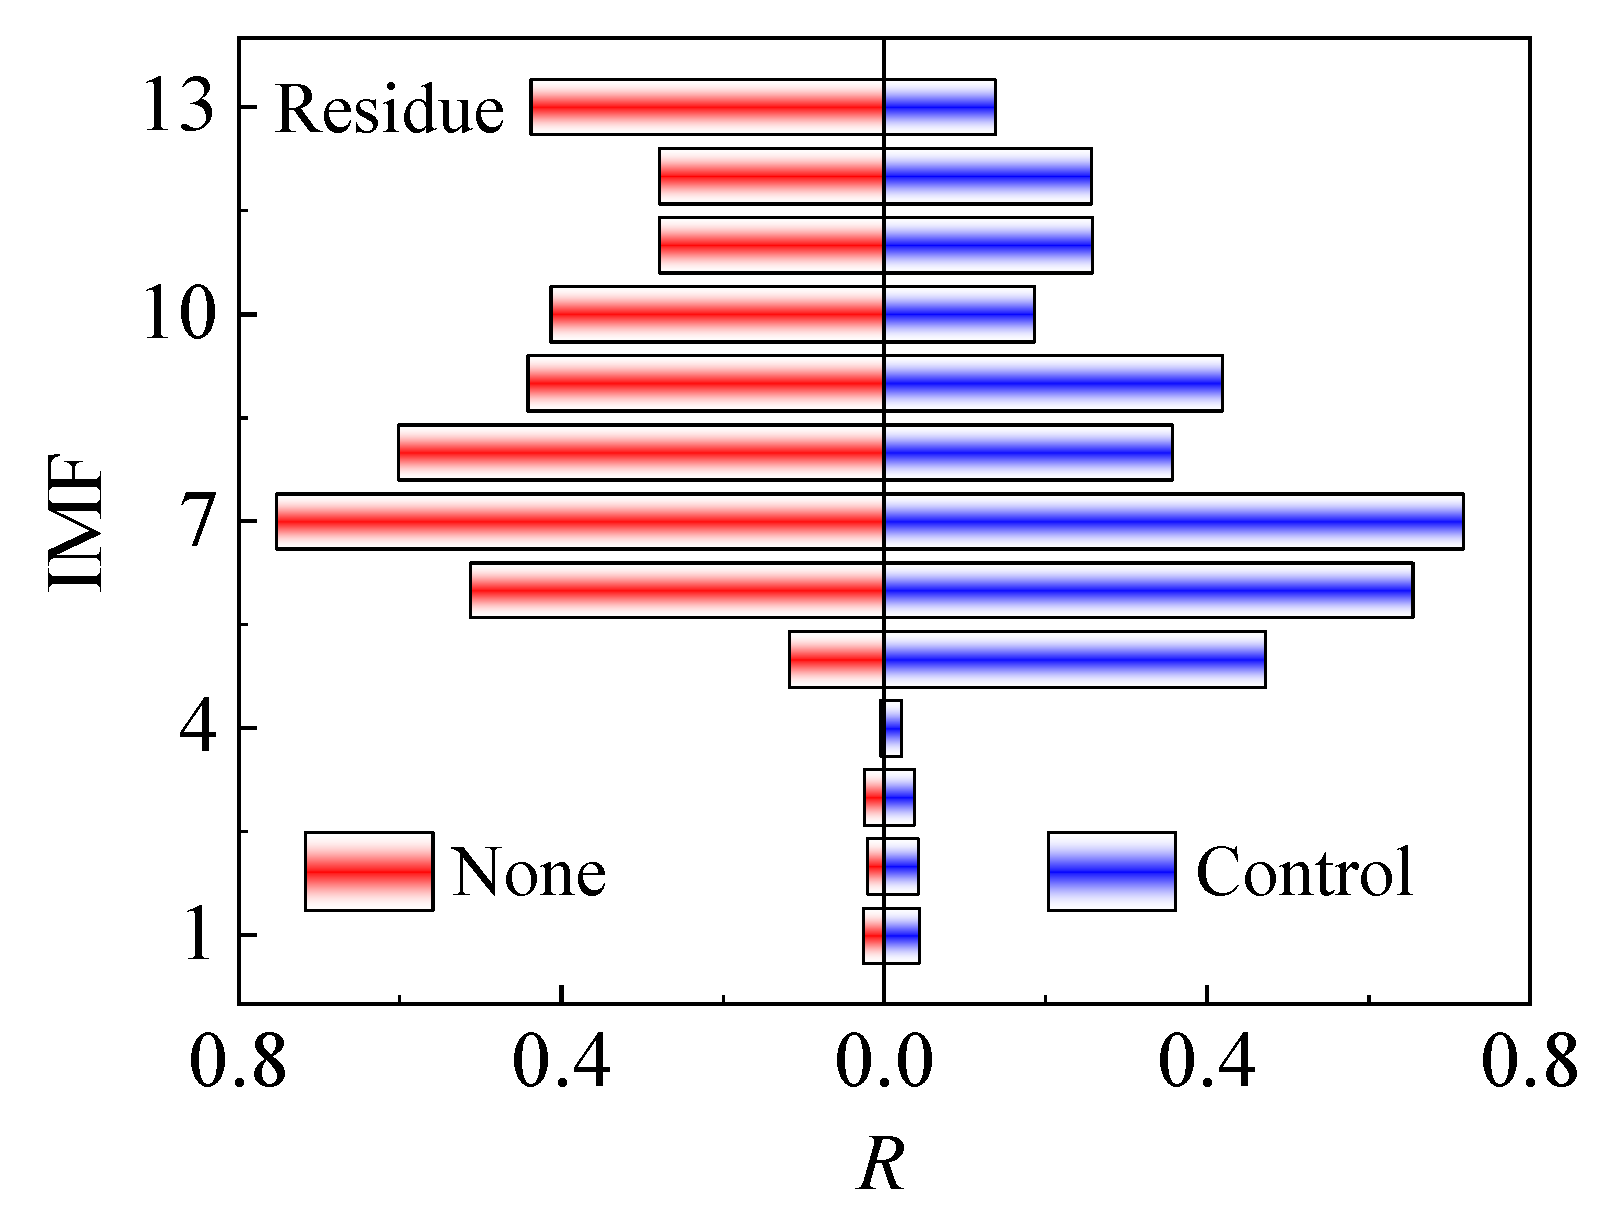
Figure 10 is a bar graph of the Pearson correlation coefficient (PCC) between IMFs and the residual with the original signal. In the natural flow, the contribution of IMFs to the time coefficient is relatively simple and focused in the low-frequency bands. By contrast, in the perturbed condition, the proportion of high-frequency IMFs cannot be ignored. This can be seen from the correlation between the first four IMFs with the initial signal is greater than that before applying control.
Regarding the reconstruction of the signal, the standard deviation of the correlation coefficient is usually taken as the threshold, and the part of the correlation coefficient greater than the standard deviation is retained and superimposed to get a denoised signal.
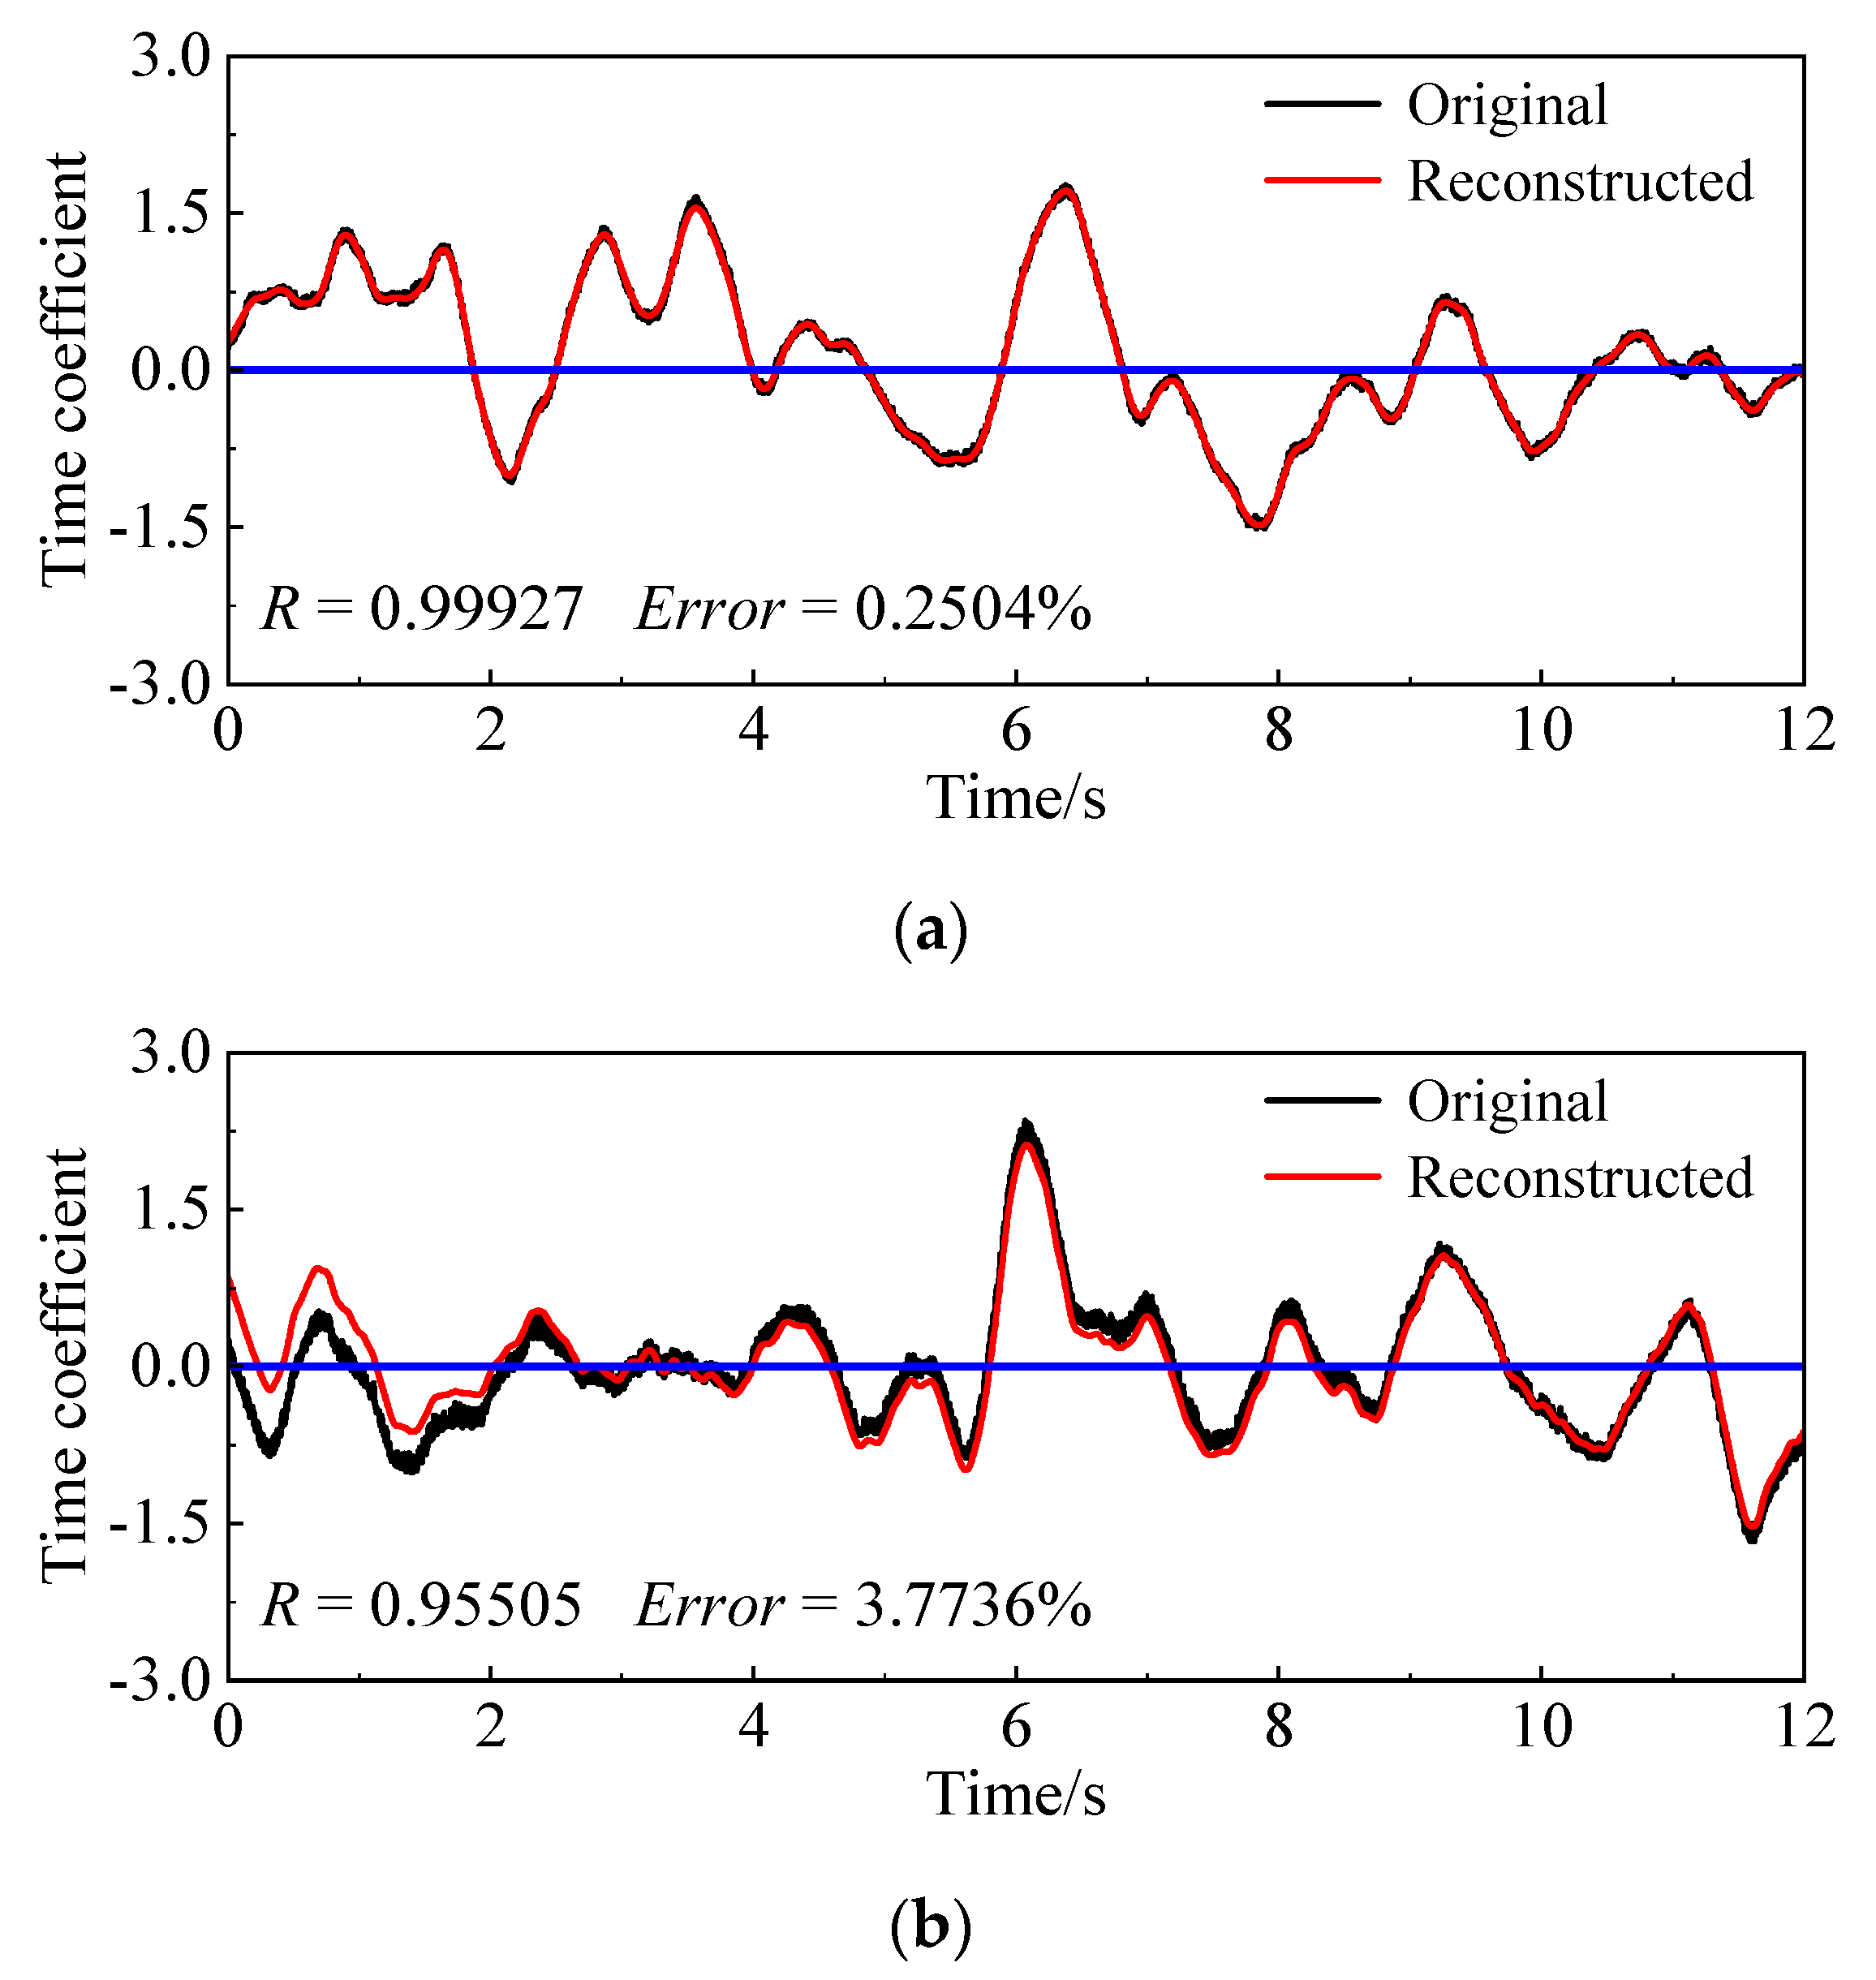
As can be seen from Figure 11, in the case of no control, the time series before and after reconstruction are almost the same, and the error between the two is small. Nevertheless, for the control condition, there is a certain deviation between the original and reconstructed time coefficient, the relative error is much larger than the former, meaning this reconstruction process is not suitable for a situation where high-frequency signals dominate.
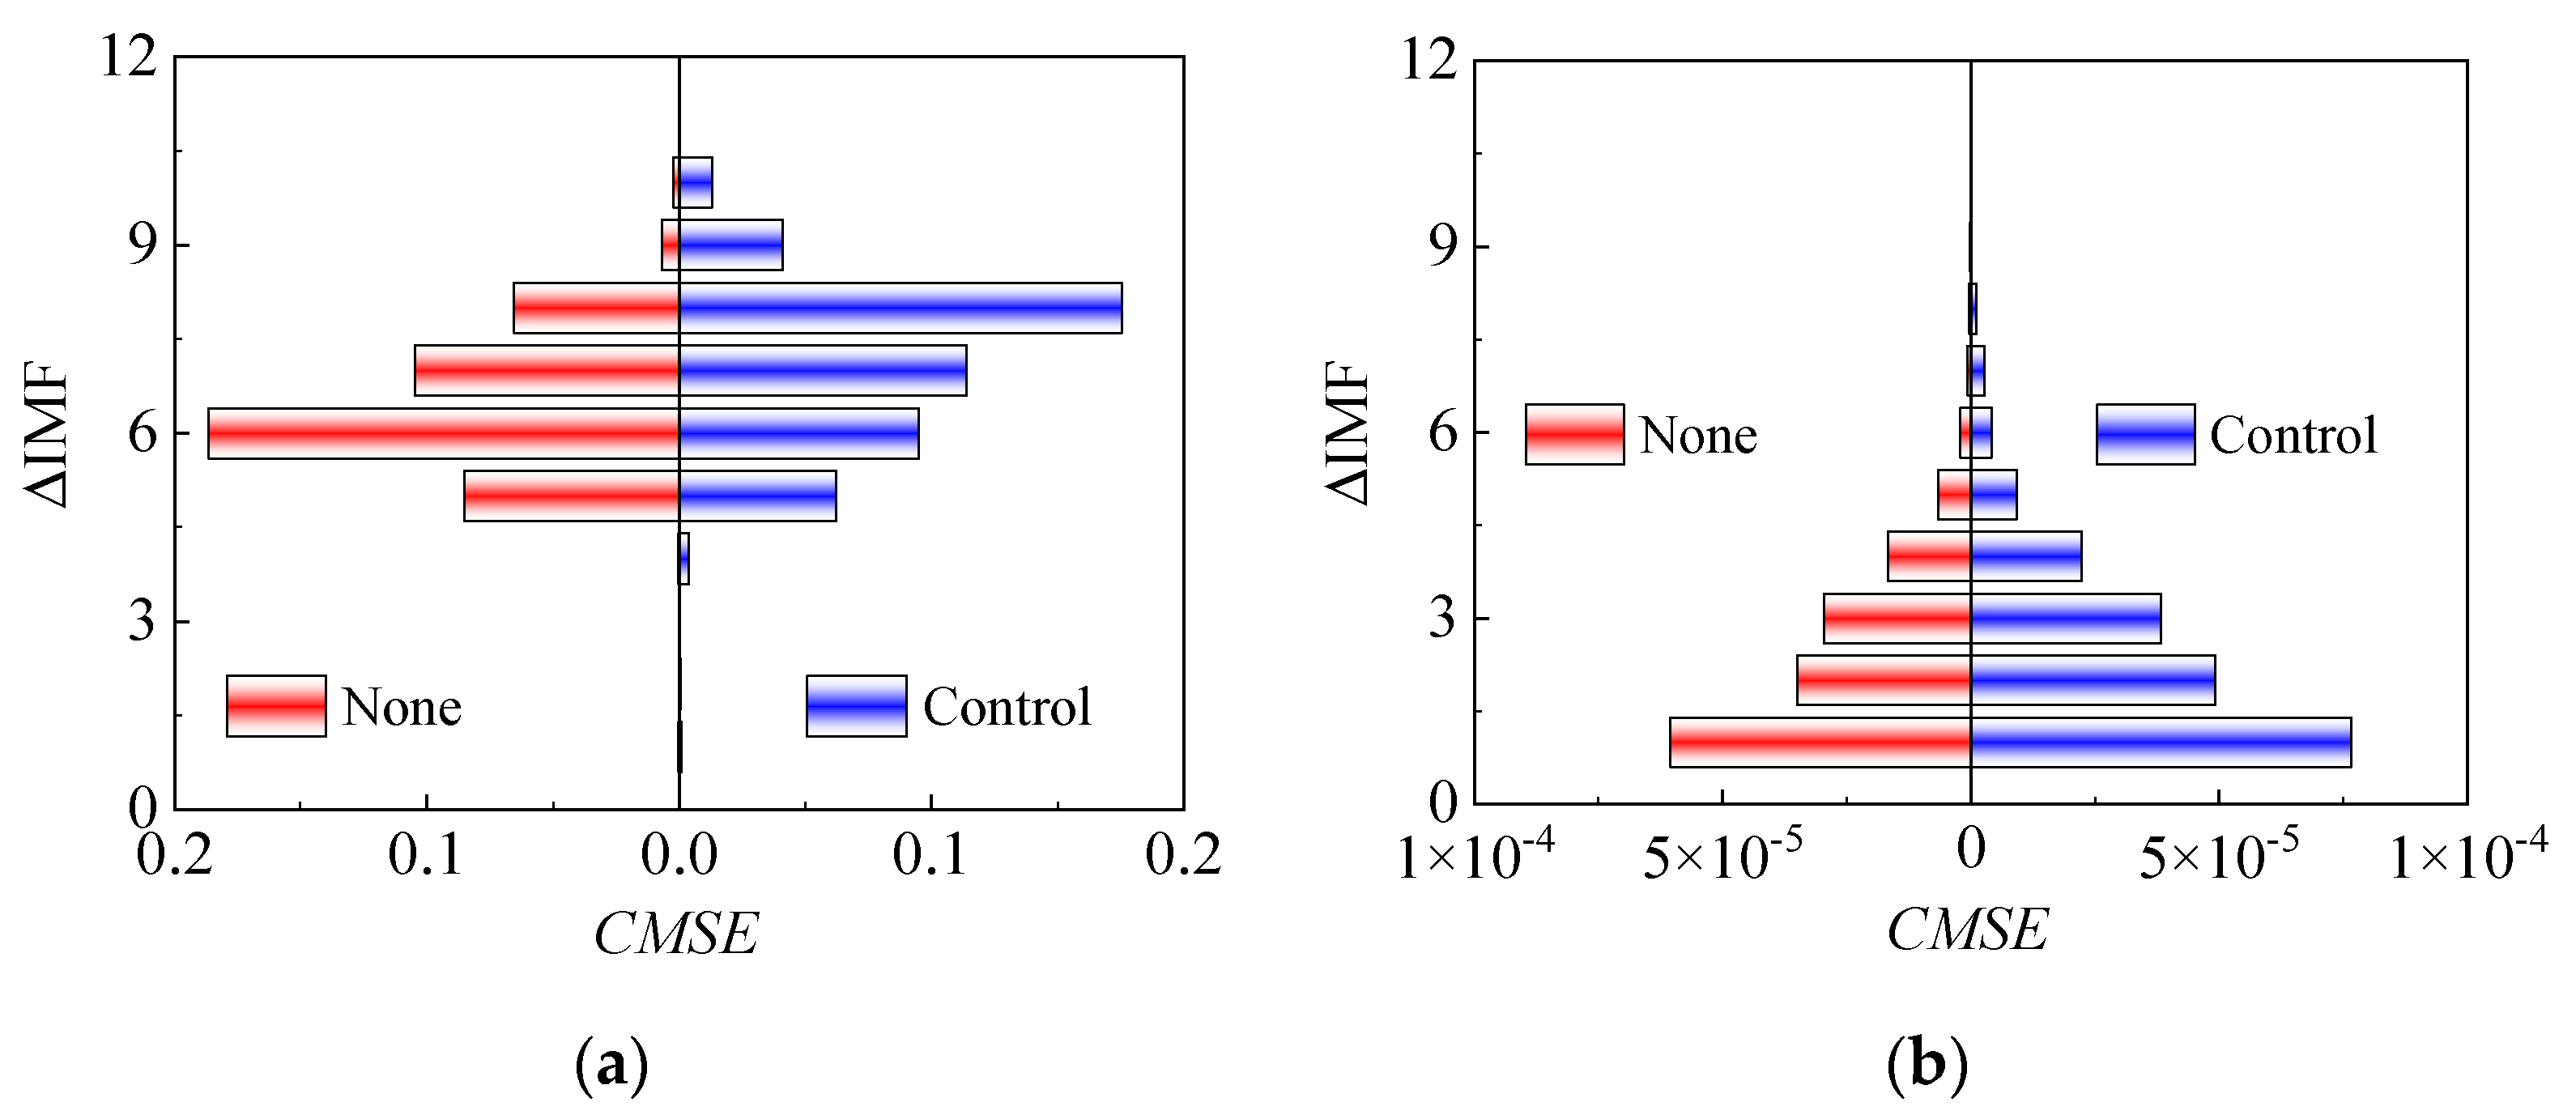
To prevent the useful information in the original sequence from being discarded, the noise data is discriminated by calculating the mean square error of two adjacent IMFs, that is, the continuous mean square error criterion (CMSE) [30]:
C M S E ( c i , c i + 1 ) = 1 n t = 1 n [ c i ( t ) c i + 1 ( t ) ] 2 = 1 n t = 1 n [ Δ IMF i ( t ) ] 2 ,   i = 1 , 2 , , 11
where c ( t ) denotes the IMF. According to formula 12, a certain IMF with abrupt noise energy distribution can be calculated, the reconstructed signal will be acquired by summing up the remaining IMFs and residual quantity after abandoning the previous high-frequency components.
In Figure 12, for the first-order mode, before and after control, the minimum mean square error occurs at the 4th and 3rd IMFs, respectively, therefore, the signal will be reconstructed from the 5th and 4th IMFs. By the way, if the IMF of a certain order modal time coefficient does not have a sudden change in energy density, but shows a step-by-step decreasing trend, such as the 500th order mode shown in Figure 12b, which means that turbulence signal in this mode is dominated by high-frequency components, in consequence, the time series is assigned a value of zero as the reconstructed signal.
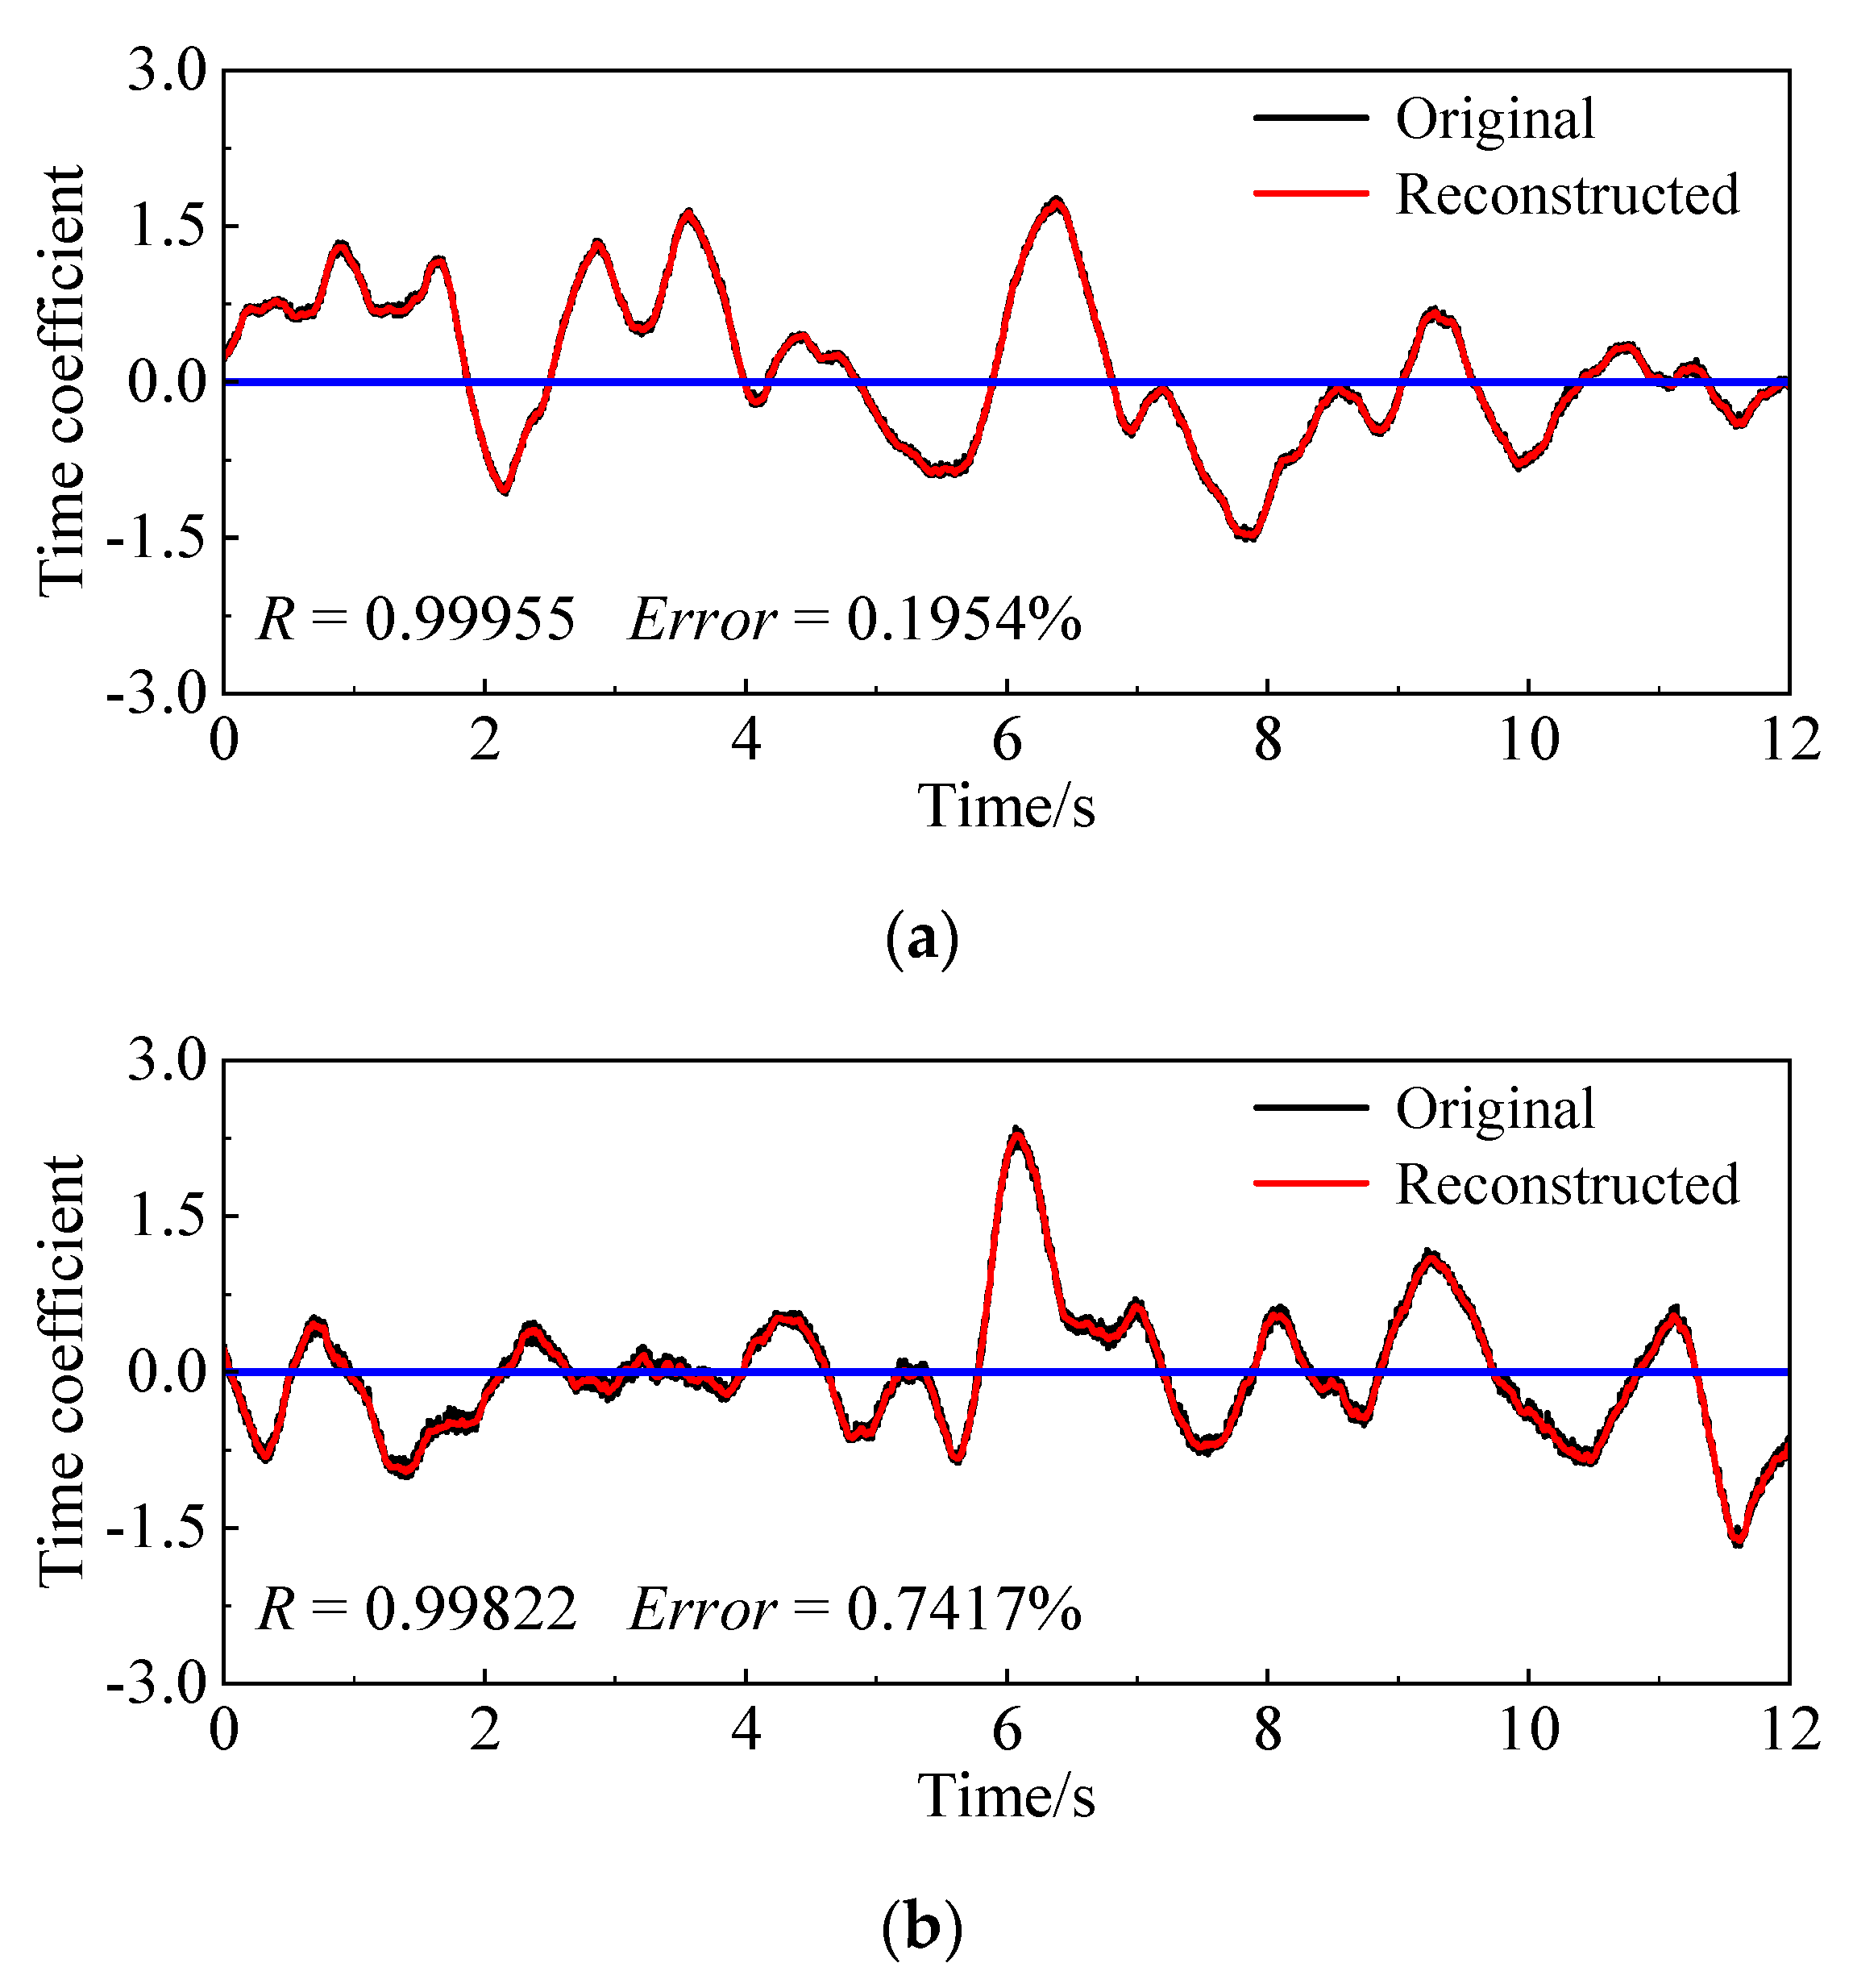
Figure 13 indicates the comparison results of the reconstructed time sequence and the original time coefficient in the first-order mode. No matter what case, the reconstructed series shows a very high degree of coincidence with the original time coefficients. The correlation coefficient is close to one, and the relative error does not exceed 1%, which meets the expected requirements.
Table 2 sums up the number of modes in which the reconstructed time coefficient is zero for different TKE levels. In the same case, the number of corresponding modes of the forced state exceeds that of the unperturbed flow, and the reconstructed signal of the latter does not appear to be zero until the energy ratio reaches 90%. The explanation for this phenomenon is that the periodic perturbation injected into the flow field causes the energy to be redistributed, and the low-frequency components in each order mode transition to the high-frequency components.
Then, the global frequency information of the time series within the sampling period is solved using the Hilbert transform [31], which is defined as the convolution of the signal itself and the reciprocal of the time domain:
y ( t ) = x ( t ) 1 π t
where x ( t ) is the real part of the complex signal, and y ( t ) stands for the imaginary part.
Next, the instantaneous phase θ ( t ) and instantaneous frequency f ( t ) of the analytical signal will be represented by the following equation:
θ ( t ) = arctan y ( t ) x ( t ) , f ( t ) = 1 2 π d θ ( t ) d t
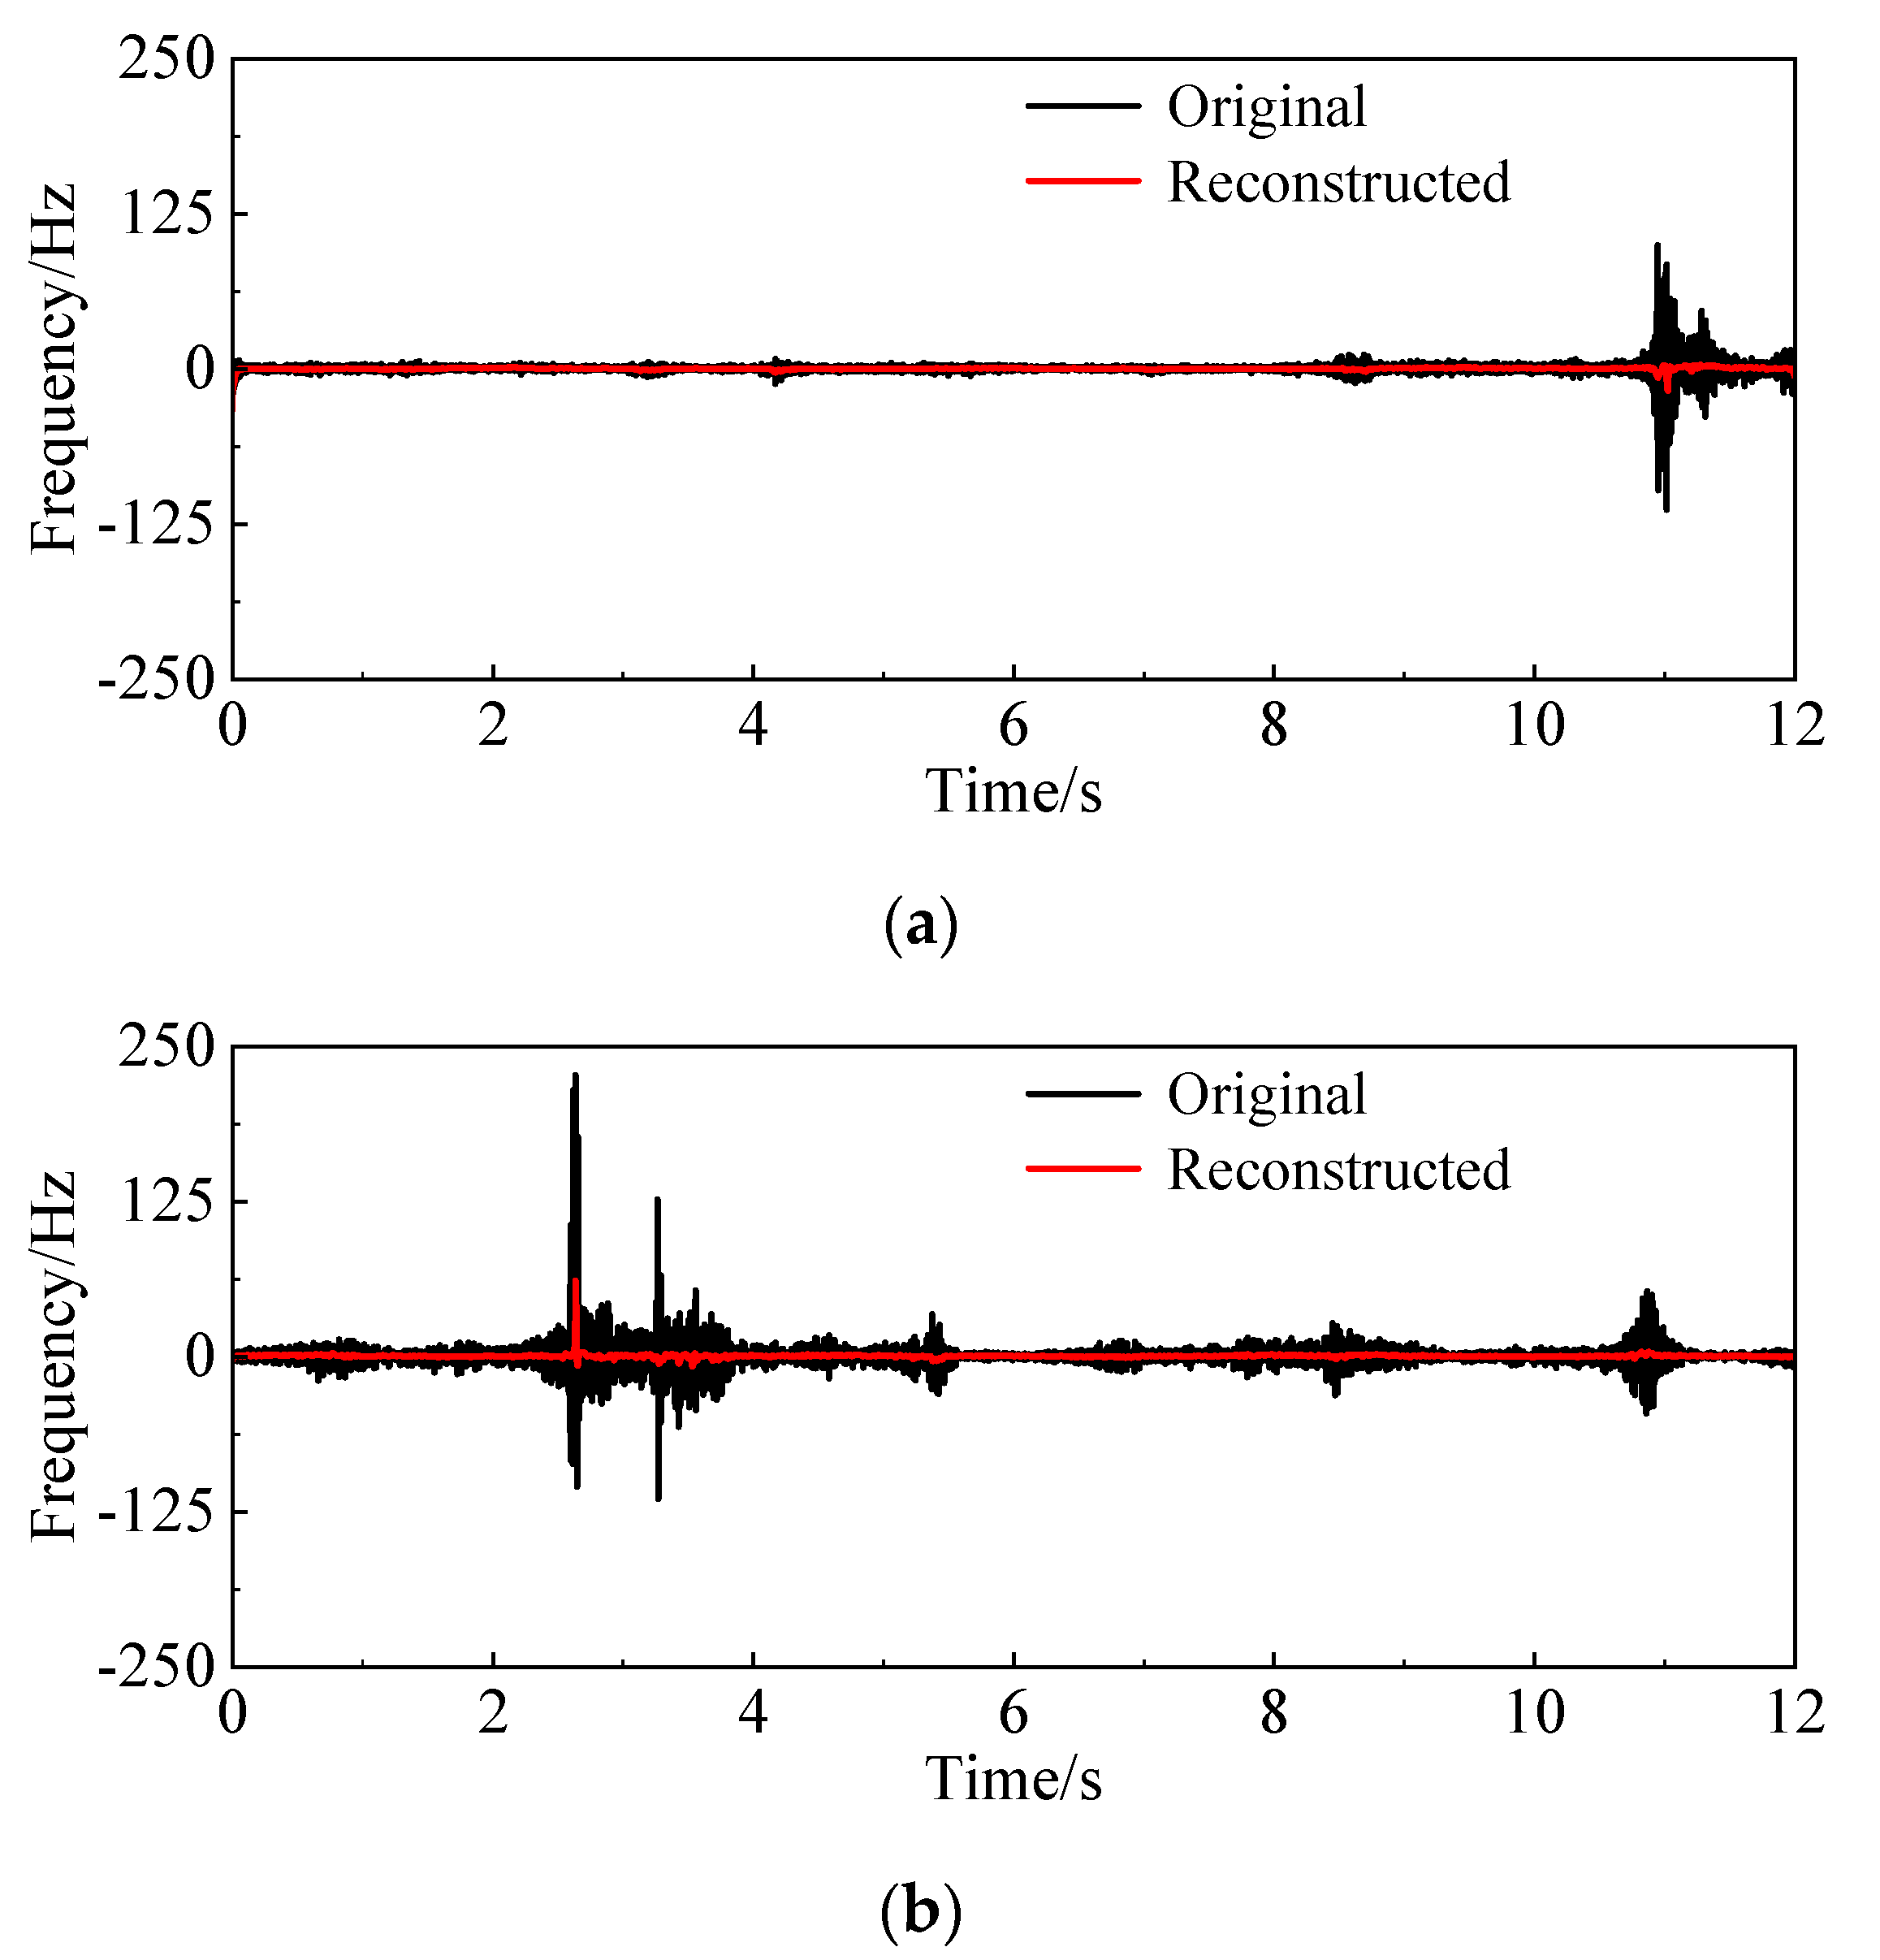
The instantaneous frequencies of the original signal and the reconstructed sequence in the time domain are indicated in Figure 14. The time coefficients of the two working states have abrupt changes in high- and low-frequency components at certain moments, which is a typical feature of non-stationary signals. In the disturbed state, the time proportion of high-frequency bands is much higher than that in the unforced case. In comparison to the original sequence, the instantaneous frequency mutation of the reconstructed signal is immensely shortened because of filtering out high-frequency noise data, and it is maintained at a lower level. Some useful high-frequency constituents are retained in the reconstructed signal of disturbed condition, embodying the characteristics of external disturbances.
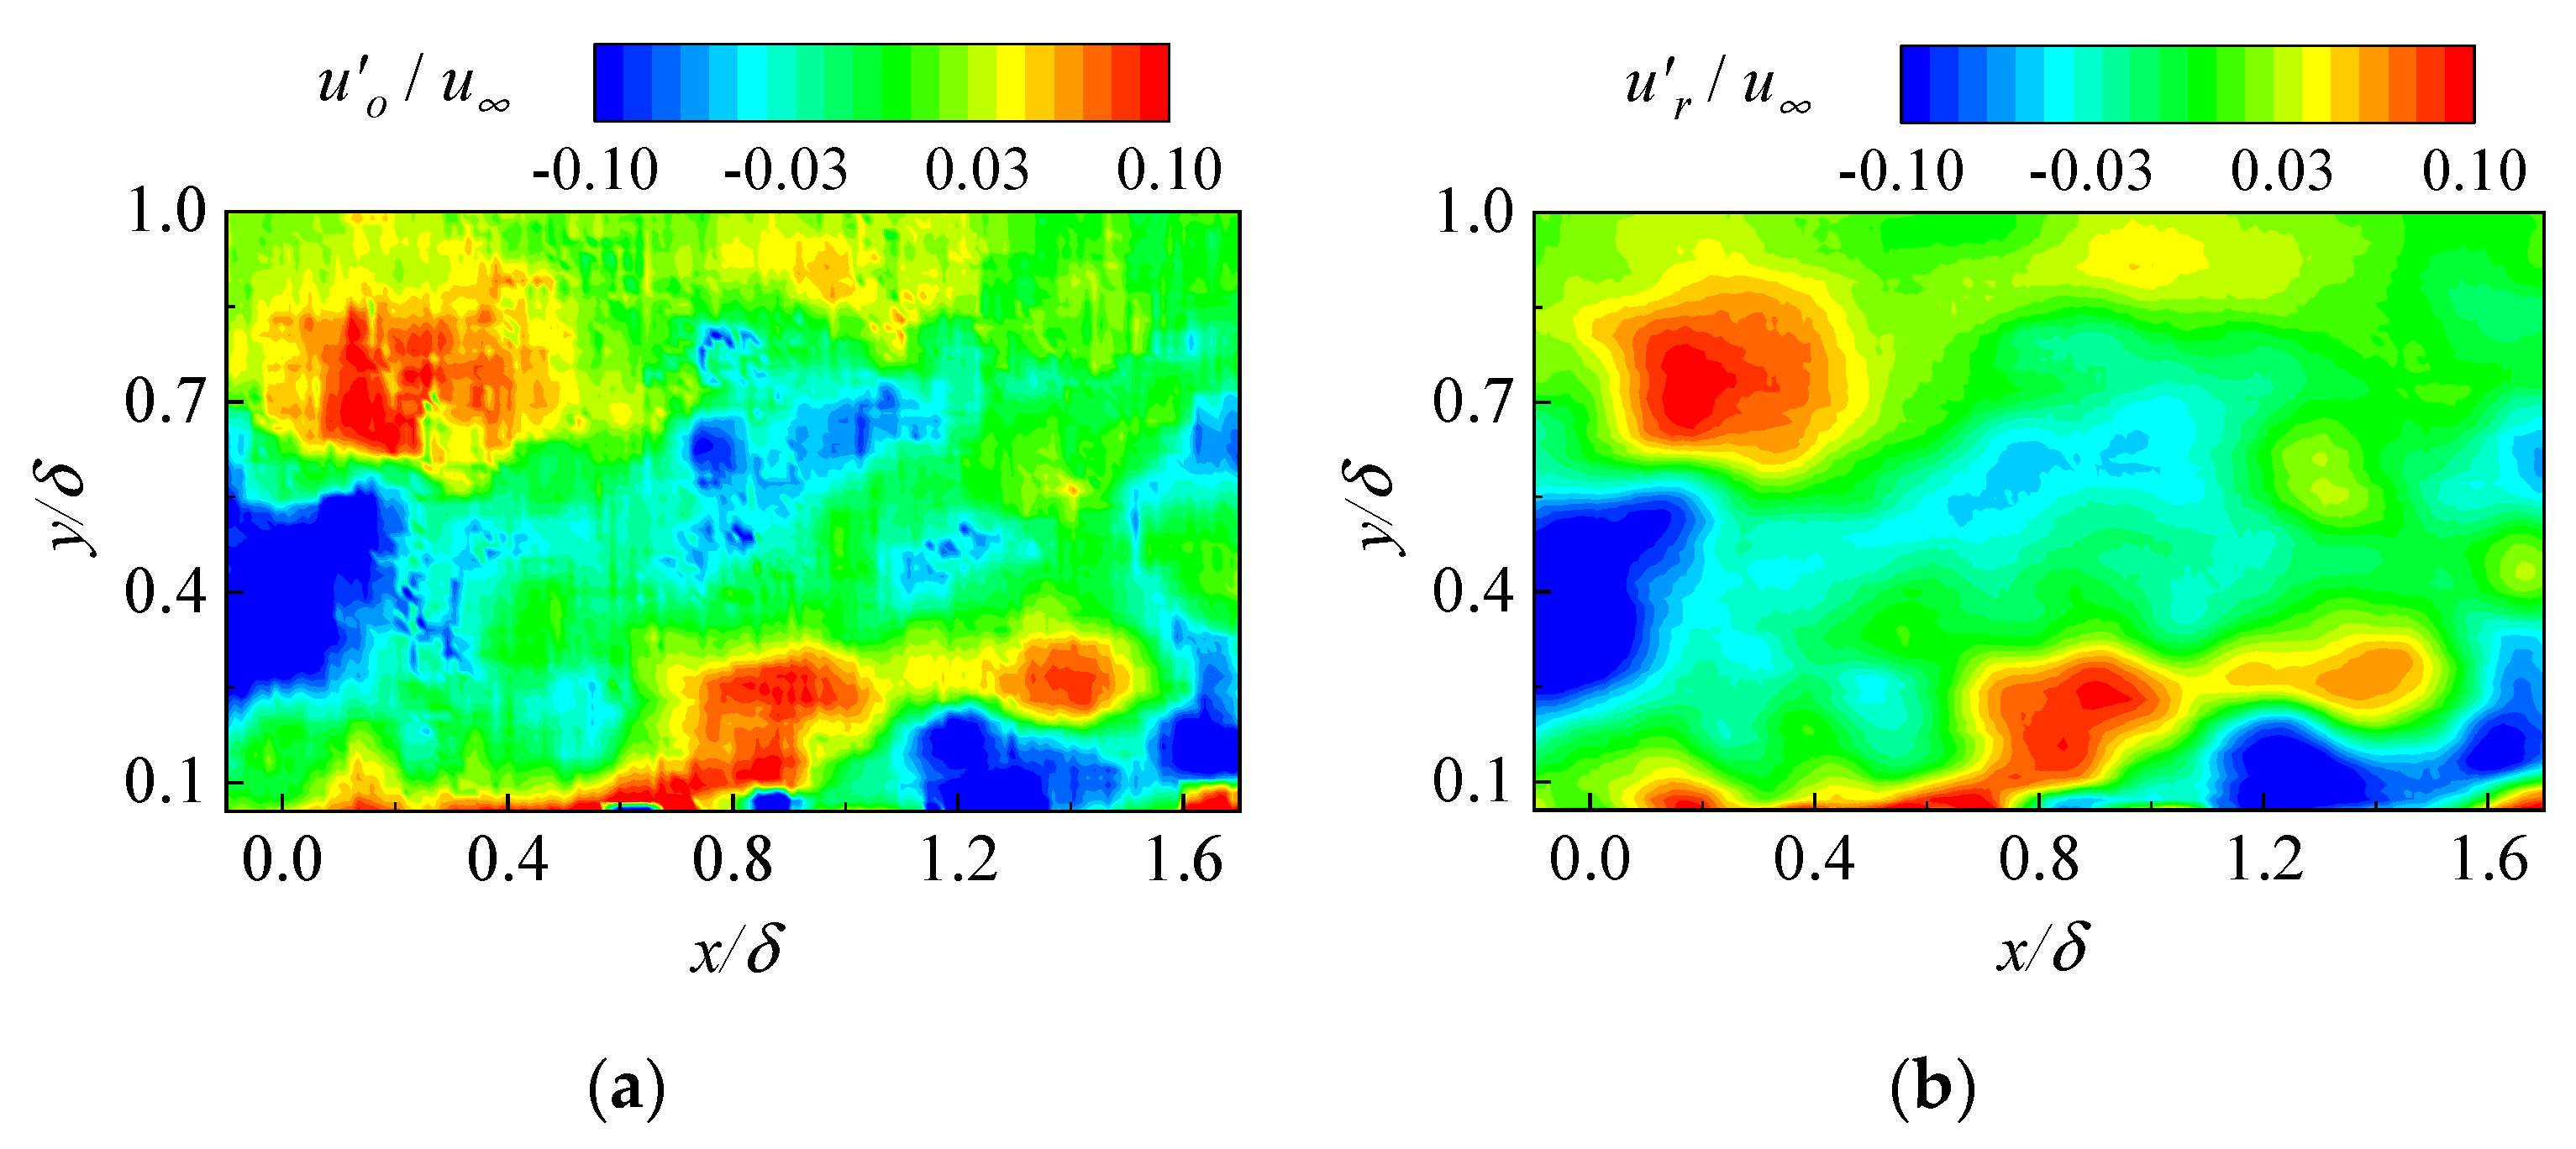
Up to now, the time coefficient of each order is reconstructed, and then the pulsating velocity fields will be determined by formula 5. In this section, the original flow field and the reconstructed flow field at a certain instant are selected for comparative analysis (see Figure 15). In the original flow field, there are large-scale structures of red and blue alternating flow direction, and small-scale pulsations are distributed near the edge. As for the reconstructed flow field, on the basis of retaining the large-scale motion, the small-scale structures are filtered out, and the shape of the flow structures is relatively smooth.
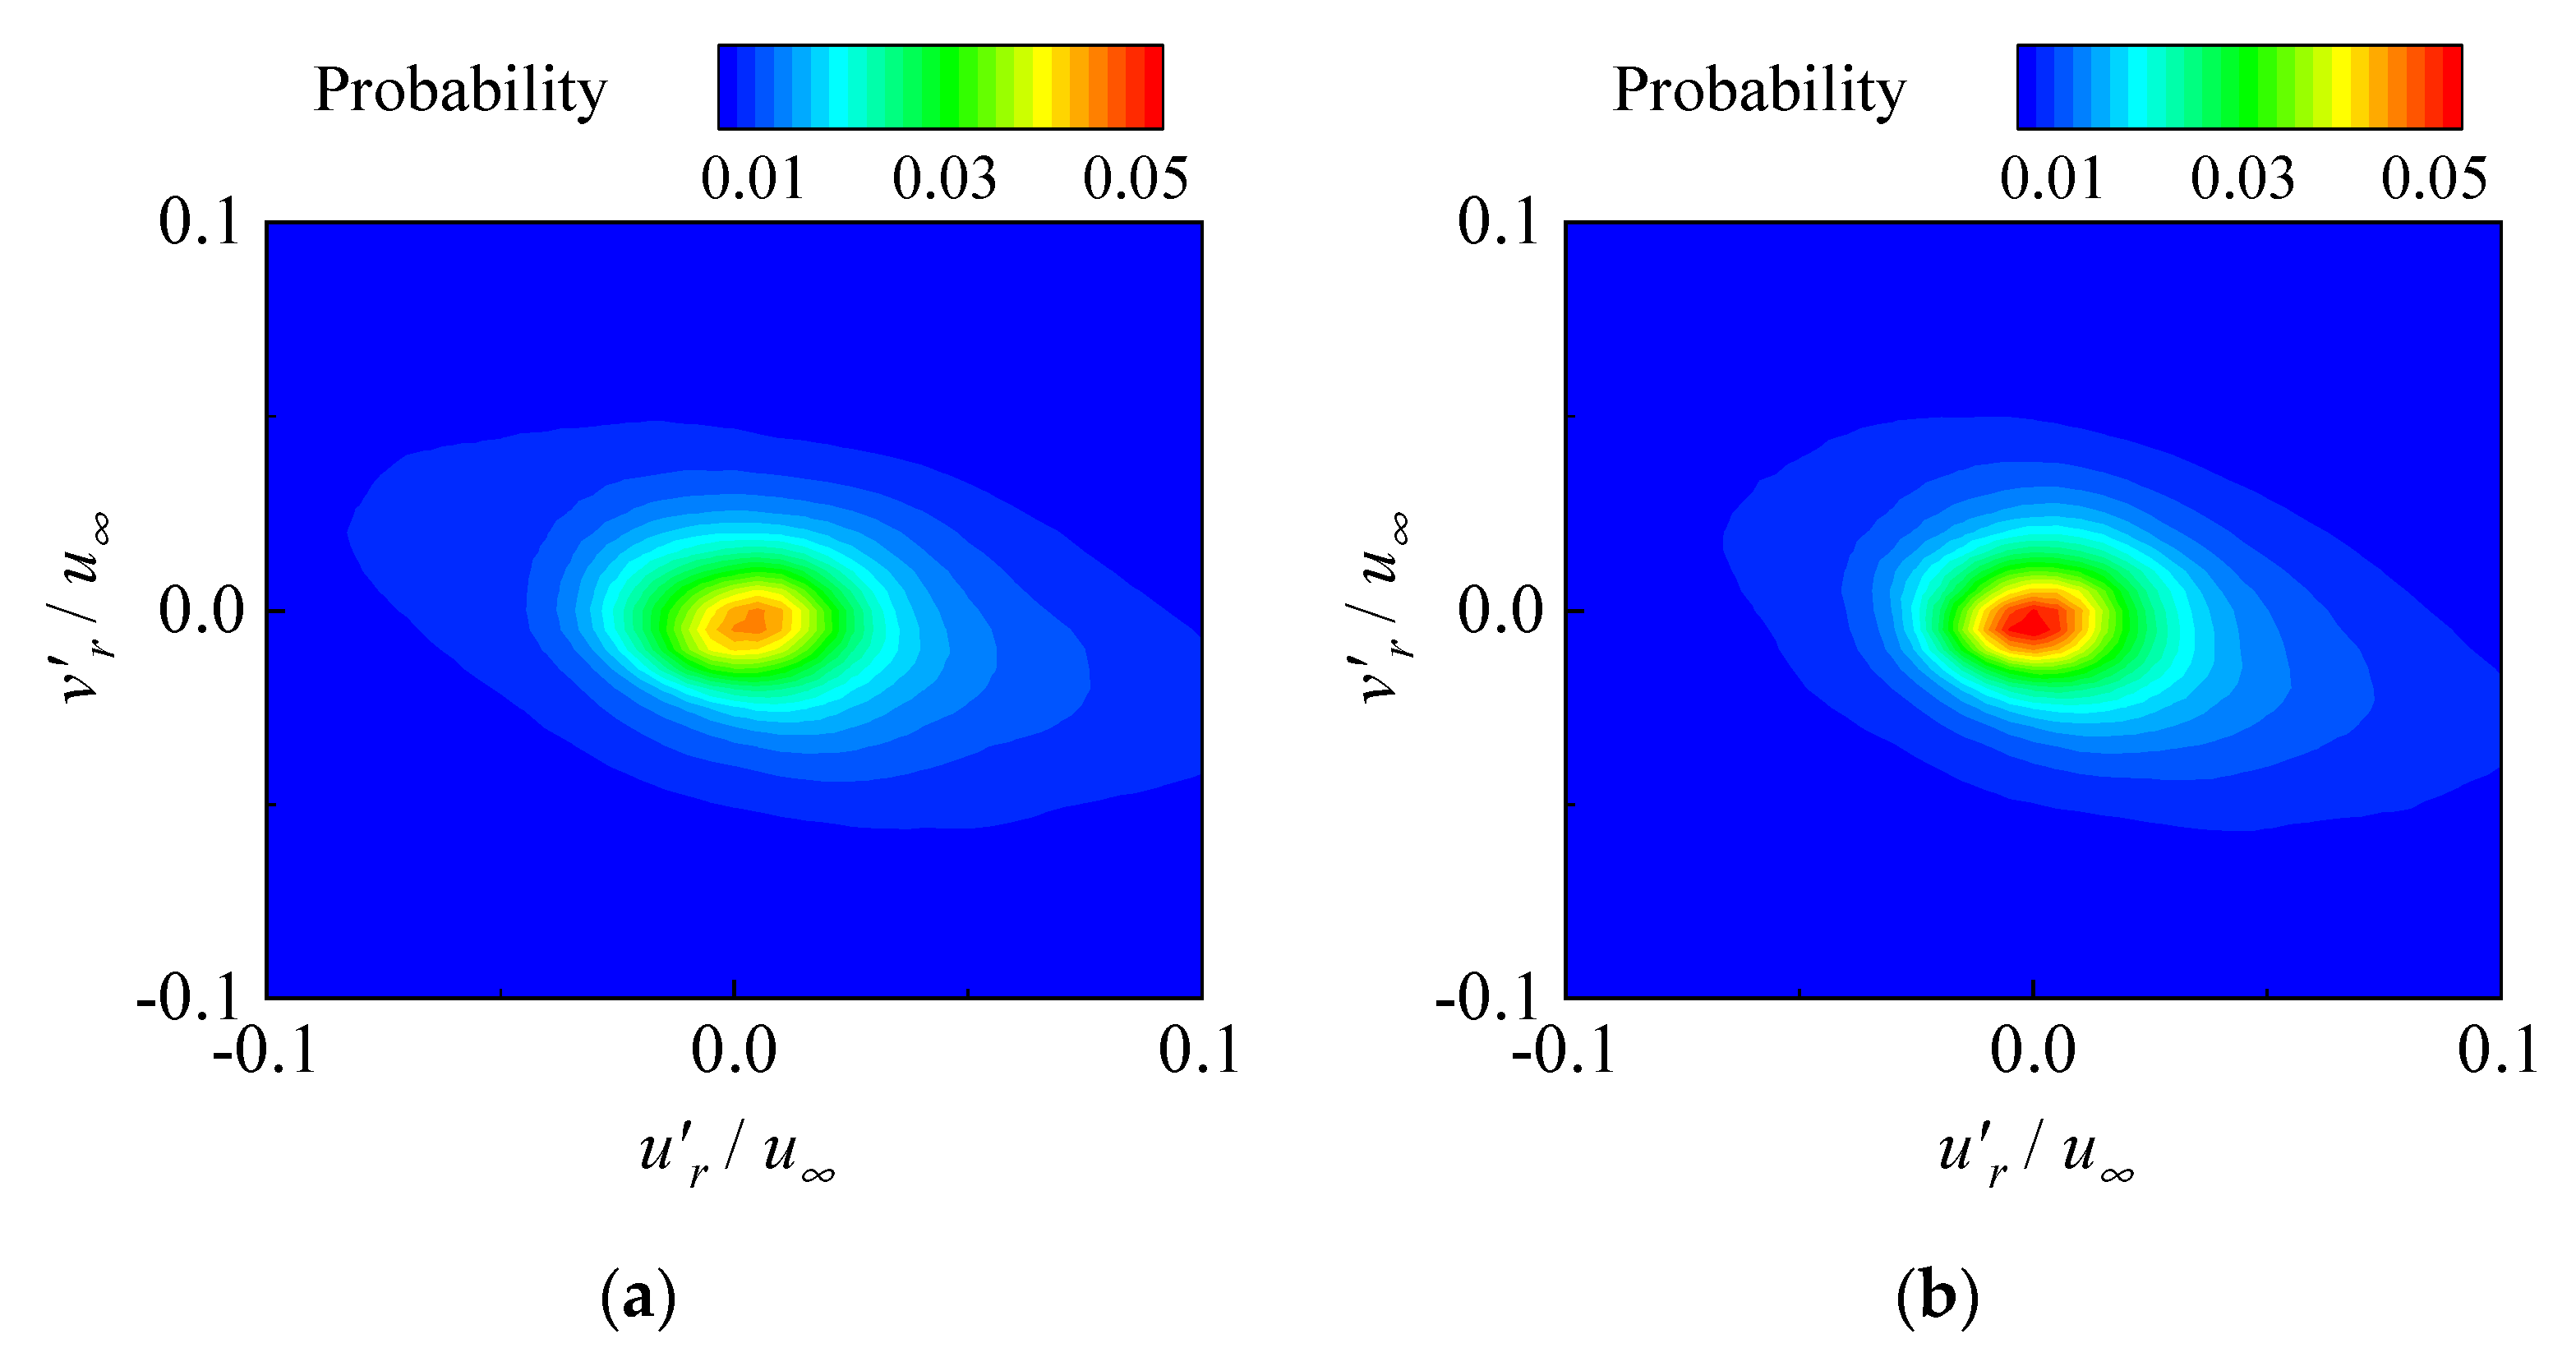
Figure 16 manifests the relative probability statistics of the dimensionless large-scale streamwise and wall-normal pulsation velocities over the whole viewing window. The ejection event in the second quadrant and the sweep event in the fourth quadrant are the main constituents of the turbulent events, and the intensity of the burst events is directly related to the Reynolds shear stress [32]. In contrast, the relative probability of large-scale streamwise direction pulsation in the disturbed flow field decreases, which can be confirmed by the decline in the flow direction length of the contour. The enhancement in the area proportion of the red region indicates that the flow direction and wall-normal fluctuation of the smaller scale are heightened. Because the synthetic jet has a weak impact on the large-scale wall-normal pulsation, the variation of the outermost contour of the cloud image in the wall-normal direction is not prominent.
The detection of burst events can also be implemented with the spatial local average velocity structure function, overcoming the limitation of traditional condition sampling method, which can characterize the relative motion and local deformation of turbulent vortex structure at specific spatial scales. The local mean structure function of the large-scale streamwise pulsation velocity along the flow direction is as follows:
δ u x = u r ( x 0 : x 0 + l x , y 0 ) ¯ u r ( x 0 l x : x 0 , y 0 ) ¯
where l x represents the spatial scale of the streamwise direction. Yang et al. [33] selected four scales for analysis in the experiment, namely, the corresponding length of the four grid points of the flow direction. Since the fluctuation velocity has been filtered above, eight scales are adopted to explore here. The positive and negative values of δ u x signify that the fluid micro clusters are stretched and compressed along the streamwise in a region with a flow direction scale of 2 l x , corresponding to ejection and sweeping events, respectively. In this study, the shear layer is obtained by detecting large-scale burst events, and the detection function is written as [34]:
D ( x 0 , y 0 , l x ) = { Q 2 , Q 4 ,   δ u x < 0 ,   | δ u x | = max | δ u x | δ u x > 0 ,   | δ u x | = max | δ u x |
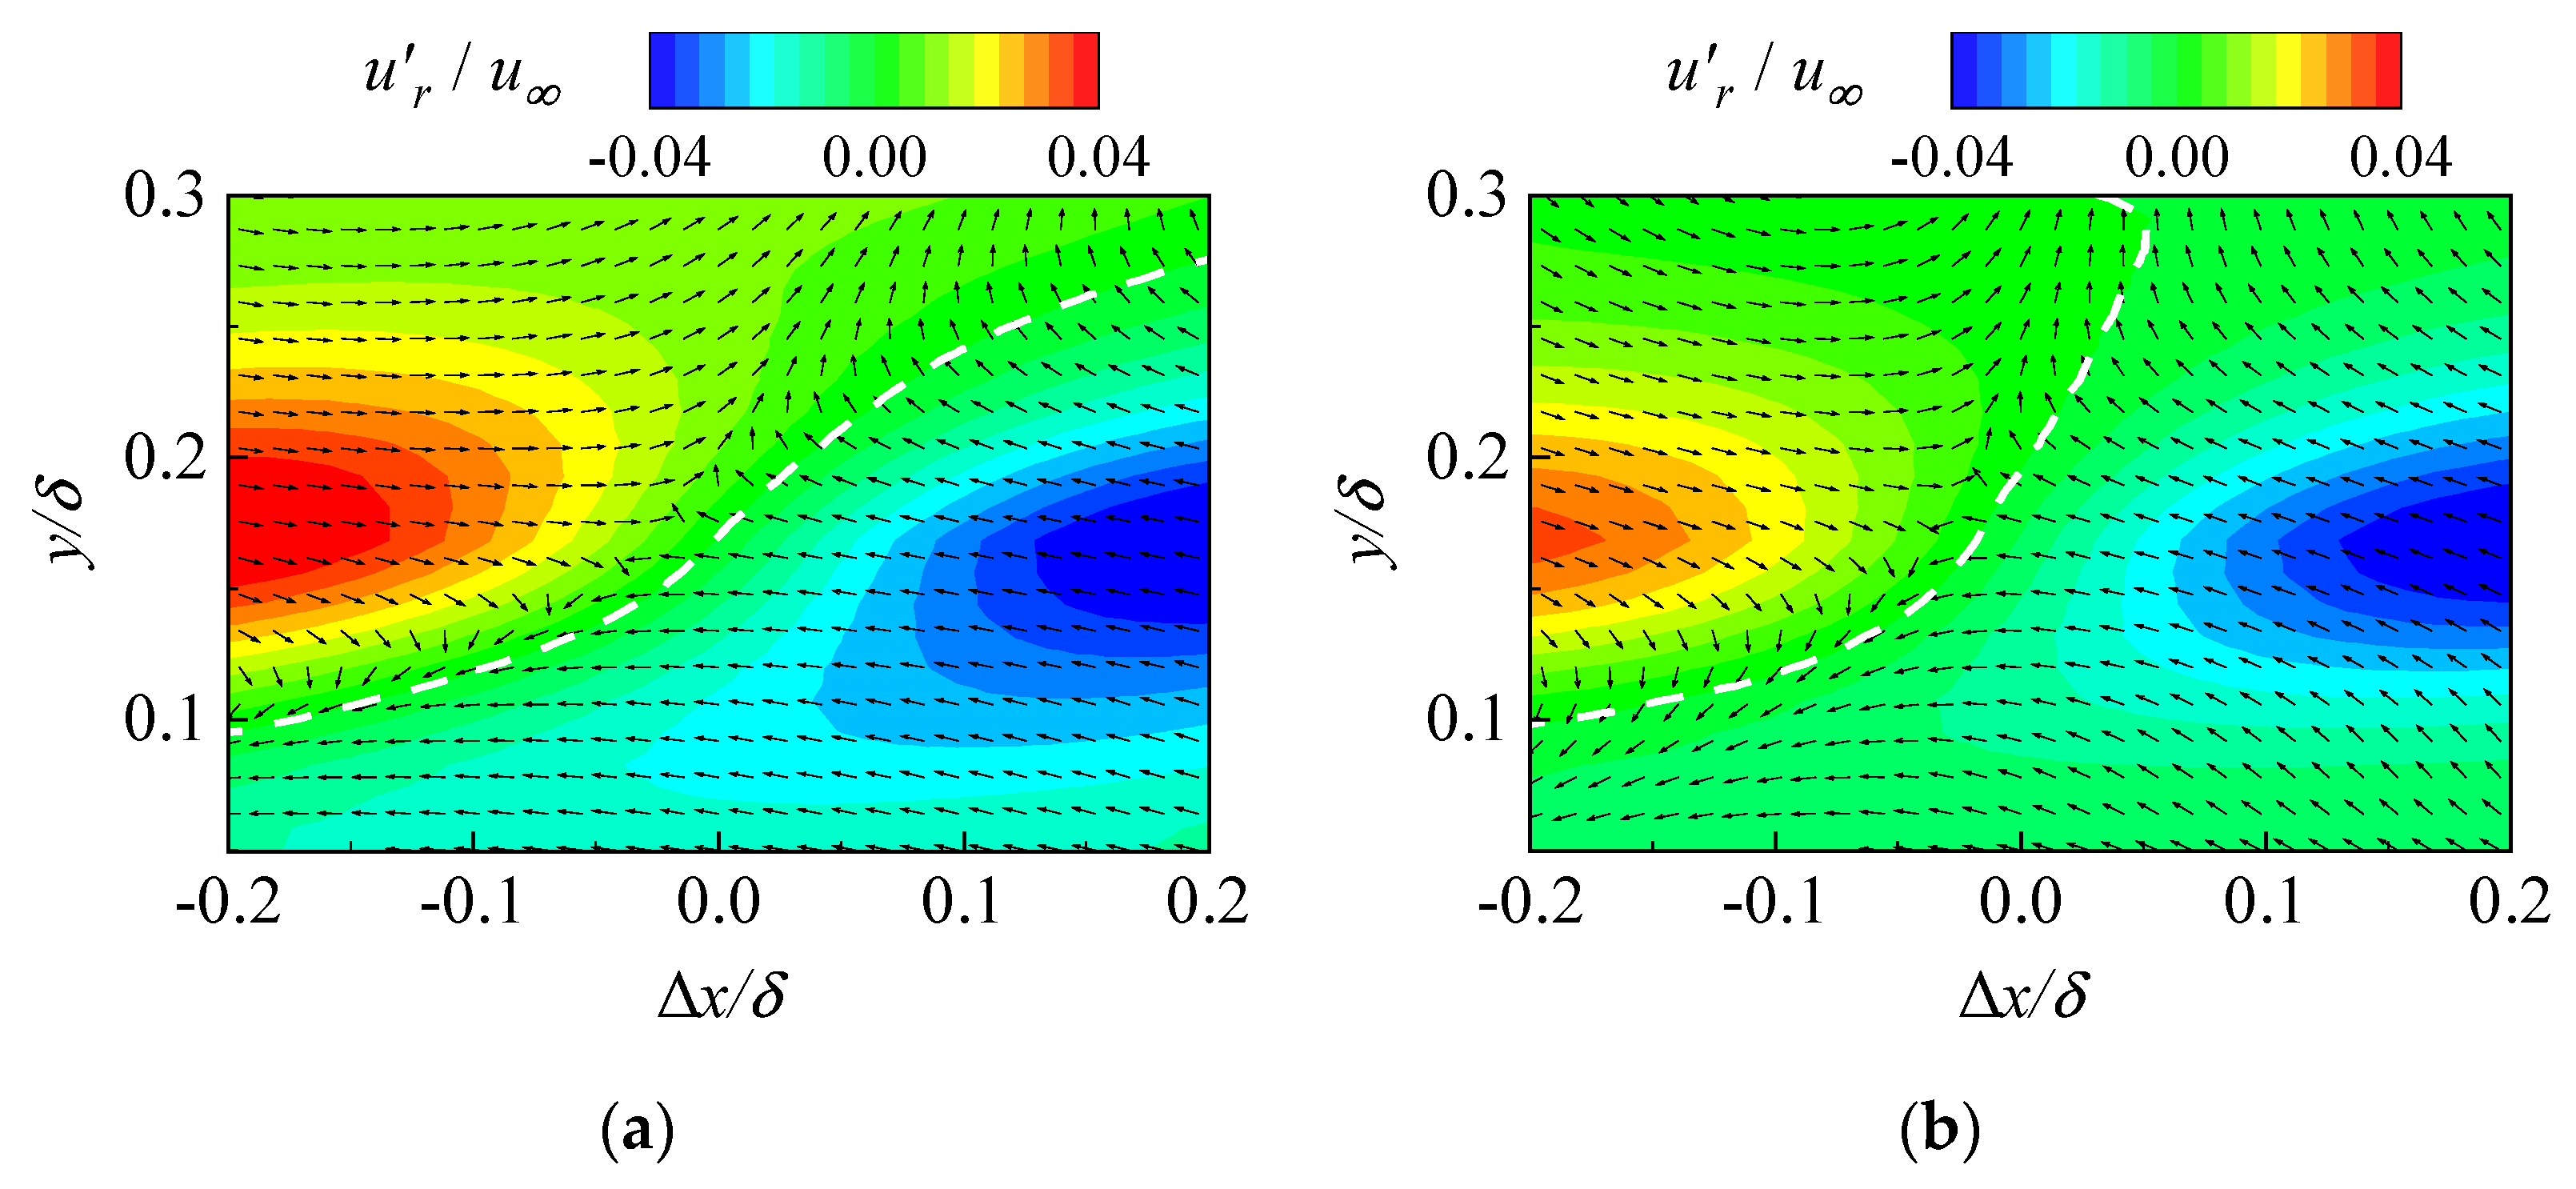
Conditional sampling is still performed at the wall-normal height of 0.15 δ , and large-scale ejection event (blue area), sweep event (red area) and inclined shear layer (white dashed lines) in the near-wall region are identified, as shown in Figure 17. Compared with the undisturbed case, the large-scale fluctuation amplitude of the controlled flow field is reduced, the inclination of the shear layer is strengthened, and the extension length of the streamwise direction is narrowed, demonstrating the radiation range of the collision between high- and low-speed fluids is diminished, and the Reynolds shear stress is extensively weakened.

4. Conclusions

The velocity vector field of the interaction between underwater synthetic jet and TBL was measured utilizing the TR-PIV technology, and the influences of periodic perturbation on the multi-scale features of wall turbulence was analyzed by means of various research methods, and the following main conclusions were drawn:
(1)
Due to the action of the wall-normal blowing of the submerged synthetic jet, the large-scale hairpin vortex is far away from the near-wall region, and its ability to induce the low-speed fluid is highly dropped off, and the probability and intensity of near-wall burst events are suppressed.
(2)
The large-scale coherent structures in the TBL are dominated by low-frequency signals, while the small-scale coherent structures are related to high-frequency signals. The periodic disturbance generated by the synthetic jet accelerates the migration of low-frequency signals to high-frequency signals.
(3)
In the TBL, the probability of low-order modes (large-scale turbulent events) is high, the information entropy is small, and the events are ordered; the probability of high-order modes (small-scale turbulent events) is low, the information entropy is large, and the events are disorderly. The presence of the synthetic jet makes the large-scale turbulent structures become orderly and the small-scale turbulent structures tend to be disordered.
(4)
The time coefficients acquired by POD can be analyzed through CEEMD and then combined with the help of CMSE to identify the energy mutation of high- and low frequency signals. Finally, the large-scale flow field will be reconstructed. The advantage of this scale decomposition method is the fact that it can avoid the interference of artificial threshold setting.

Author Contributions

Conceptualization, B.L; methodology, B.L.; formal analysis, B.L.; investigation, B.L. and J.Z.; data curation, B.L.; writing—original draft preparation, B.L.; writing—review and editing, N.J.; visualization, J.Z.; supervision, N.J.; funding acquisition, N.J. All authors have read and agreed to the published version of the manuscript.

Funding

This work was supported by the National Natural Science Foundation of China (Grant Nos. 11732010, 11972251, 11872272, 11902218, 12172242), Chinesisch-Deutsche Zentrum für Wissenschaftsförderung (Grant No. GZ1575) and the Ministry of Industry and Information Technology (Grant No. (2019)360).

Institutional Review Board Statement

Not applicable.

Informed Consent Statement

Not applicable.

Data Availability Statement

Not applicable.

Conflicts of Interest

The authors declare no conflict of interest.

References

  1. Zhang, L.; Shan, X.; Xie, T. Active control for wall drag reduction: Methods, mechanisms and performance. IEEE Access 2020, 8, 7039–7057. [Google Scholar] [CrossRef]
  2. Perlin, M.; Dowling, D.R.; Ceccio, S.L. Freeman Scholar Review: Passive and Active Skin-Friction Drag Reduction in Turbulent Boundary Layers. J. Fluids Eng. 2016, 138, 091104. [Google Scholar] [CrossRef]
  3. Abbas, A.; Bugeda, G.; Ferrer, E.; Fu, S.; Periaux, J.; Pons-Prats, J.; Valero, E.; Zheng, Y. Drag reduction via turbulent boundary layer flow control. Sci. China Technol. Sci. 2017, 60, 1281–1290. [Google Scholar] [CrossRef] [Green Version]
  4. Yunqing, G.; Tao, L.; Jiegang, M.; Zhengzan, S.; Peijian, Z. Analysis of drag reduction methods and mechanisms of turbulent. Appl. Bionics Biomech. 2017, 2017, 1–8. [Google Scholar] [CrossRef] [PubMed] [Green Version]
  5. Corke, T.C.; Thomas, F.O. Active and passive turbulent boundary-layer drag reduction. AIAA J. 2018, 56, 3835–3847. [Google Scholar] [CrossRef]
  6. Kametani, Y.; Fukagata, K.; Örlü, R.; Schlatter, P. Effect of uniform blowing/suction in a turbulent boundary layer at moderate Reynolds number. Int. J. Heat Fluid Flow. 2015, 55, 132–142. [Google Scholar] [CrossRef]
  7. Murugan, T.; Deyashi, M.; Dey, S.; Rana, S.C.; Chatterjee, P.K. Recent developments on synthetic jets (Review Paper). Def. Sci. J. 2016, 66, 489–498. [Google Scholar] [CrossRef]
  8. Ricco, P.; Skote, M.; Leschziner, M.A. A review of turbulent skin-friction drag reduction by near-wall transverse forcing. Prog. Aerosp. Sci. 2021, 123, 100713. [Google Scholar] [CrossRef]
  9. Iuso, G.; Di Cicca, G.M. Interaction of synthetic jets with a fully developed turbulent channel flow. J. Turbul. 2007, 8, 1–33. [Google Scholar] [CrossRef]
  10. Yao, J.; Chen, X.; Hussain, F. Drag control in wall-bounded turbulent flows via spanwise opposed wall-jet forcing. J. Fluid Mech. 2018, 852, 678–709. [Google Scholar] [CrossRef]
  11. Thomas, F.; Corke, T.; Duong, A.; Midya, S.; Yates, K. Turbulent drag reduction using pulsed-DC plasma actuation. J. Phys. D Appl. Phys. 2019, 52, 434001. [Google Scholar] [CrossRef]
  12. Cannata, M.; Cafiero, G.; Iuso, G. Large-scale forcing of a turbulent channel flow through spanwise synthetic jets. AIAA J. 2020, 58, 2042–2052. [Google Scholar] [CrossRef]
  13. Xie, F.; Pérez-Muñoz, J.D.; Qin, N.; Ricco, P. Drag reduction in wall-bounded turbulence by synthetic jet sheets. J. Fluid Mech. 2022, 941, A63. [Google Scholar] [CrossRef]
  14. Tian, G.Z.; Fan, D.L.; Feng, X.M.; Zhou, H.G. Thriving artificial underwater drag-reduction materials inspired from aquatic animals: Progresses and challenges. RSC Adv. 2021, 11, 3399–3428. [Google Scholar] [CrossRef] [PubMed]
  15. Segawa, T.; Li, F.-C.; Yoshida, H.; Murakami, K.; Mizunuma, H. Spanwise oscillating excitation for turbulence drag reduction using alternative suction and blowing. In Proceedings of the 43rd AIAA Aerospace Sciences Meeting and Exhibit, Reno, NV, USA, 10–13 January 2005. [Google Scholar] [CrossRef]
  16. Spinosa, E.; Zhong, S. Reduction of skin friction drag in a turbulent boundary layer using circular synthetic jets. In Proceedings of the 55th AIAA Aerospace Sciences Meeting, Grapevine, Texas, 9–13 January 2017. [Google Scholar]
  17. Marusic, I.; McKeon, B.J.; Monkewitz, P.A.; Nagib, H.M.; Smits, A.J.; Sreenivasan, K.R. Wall-bounded turbulent flows at high Reynolds numbers: Recent advances and key issues. Phys. Fluids. 2010, 22, 065103. [Google Scholar] [CrossRef]
  18. Li, B.; Zhang, J.; Tian, H.; Ma, X.; Tang, Z.; Jiang, N. Effects of submerged synthetic jet on the coherent structures in turbulent boundary layer. Acta Mech. Sin. 2022, 38, 321590. [Google Scholar] [CrossRef]
  19. Taira, K.; Hemati, M.S.; Brunton, S.L.; Sun, Y.Y.; Duraisamy, K.; Bagheri, S.; Dawson, S.T.M.; Yeh, C.A. Modal Analysis of Fluid Flows: Applications and Outlook. AIAA J. 2020, 58, 998–1022. [Google Scholar] [CrossRef]
  20. Wang, X.; Wang, Y.; Tian, H.; Jiang, N. Effects of the slip wall on the drag and coherent structures of turbulent boundary layer. Acta Mech. Sin. 2021, 37, 1278–1290. [Google Scholar] [CrossRef]
  21. Shannon, C.E. A mathematical theory of communication. Bell Syst. Tech. J. 1948, 27, 623–656. [Google Scholar] [CrossRef]
  22. Kullback, S.; Leibler, R.A. On information and sufficiency. Ann. Math. Stat. 1951, 22, 79–86. [Google Scholar] [CrossRef]
  23. Wu, Y.; Christensen, K.T. Spatial structure of a turbulent boundary layer with irregular surface roughness. J. Fluid Mech. 2010, 655, 380–418. [Google Scholar] [CrossRef]
  24. Zhou, J.; Adrian, R.J.; Balachandar, S.; Kendall, T.M. Mechanisms for generating coherent packets of hairpin vortices in channel flow. J. Fluid Mech. 1999, 387, 353–396. [Google Scholar] [CrossRef]
  25. Fukagata, K.; Iwamoto, K.; Kasagi, N. Contribution of Reynolds stress distribution to the skin friction in wall-bounded flows. Phys. Fluids. 2002, 14, L73–L76. [Google Scholar] [CrossRef] [Green Version]
  26. Yang, S.Q.; Jiang, N. Tomographic TR-PIV measurement of coherent structure spatial topology utilizing an improved quadrant splitting method. Sci. China Phys. Mech. Astron. 2012, 55, 1863–1872. [Google Scholar] [CrossRef] [Green Version]
  27. Huang, N.E.; Shen, Z.; Long, S.R.; Wu, M.C.; Shih, H.H.; Zheng, Q.; Yen, N.C.; Tung, C.C.; Liu, H.H. The empirical mode decomposition and the Hilbert spectrum for nonlinear and non-stationary time series analysis. Proc. Math. Phys. Eng. Sci. 1998, 454, 903–995. [Google Scholar] [CrossRef]
  28. Huang, N.E.; Wu, M.L.; Qu, W.; Long, S.R.; Shen, S.S.P. Applications of Hilbert-Huang transform to non-stationary financial time series analysis. Appl. Stoch. Models Bus. Ind. 2010, 19, 245–268. [Google Scholar] [CrossRef]
  29. Yeh, J.R.; Shieh, J.S.; Huang, N.E. Complementary ensemble empirical mode decomposition: A novel noise enhanced data analysis method. Adv. Adapt. Data Anal. 2010, 2, 135–156. [Google Scholar] [CrossRef]
  30. Wu, H.; Fang, Q.; Peng, Y.; Gong, Z.M.; Kong, X.Z. Hard projectile perforation on the monolithic and segmented RC panels with a rear steel liner. Int. J. Impact Eng. 2015, 76, 232–250. [Google Scholar] [CrossRef]
  31. Huang, N.E.; Shen, Z.; Long, S.R. A new view of nonlinear water waves: The Hilbert spectrum. Annu. Rev. Fluid Mech. 1999, 31, 417–457. [Google Scholar] [CrossRef] [Green Version]
  32. Tang, Z.; Jiang, N.; Schröder, A.; Geisler, R. Tomographic PIV investigation of coherent structures in a turbulent boundary layer flow. Acta Mech. Sin. 2012, 28, 572–582. [Google Scholar] [CrossRef]
  33. Yang, S.; Li, S.; Tian, H.; Wang, Q.; Jiang, N. Coherent spanwise structures in turbulent boundary layer over drag-reducing riblets. Trans. Tianjin Univ. 2015, 21, 317–323. [Google Scholar] [CrossRef]
  34. Tian, H.; Zhang, J.; Wang, E.; Yao, Z.; Jiang, N. Experimental investigation on drag reduction in turbulent boundary layer over superhydrophobic surface by TRPIV. Theor. Appl. Mech. Lett. 2015, 5, 45–49. [Google Scholar] [CrossRef] [Green Version]
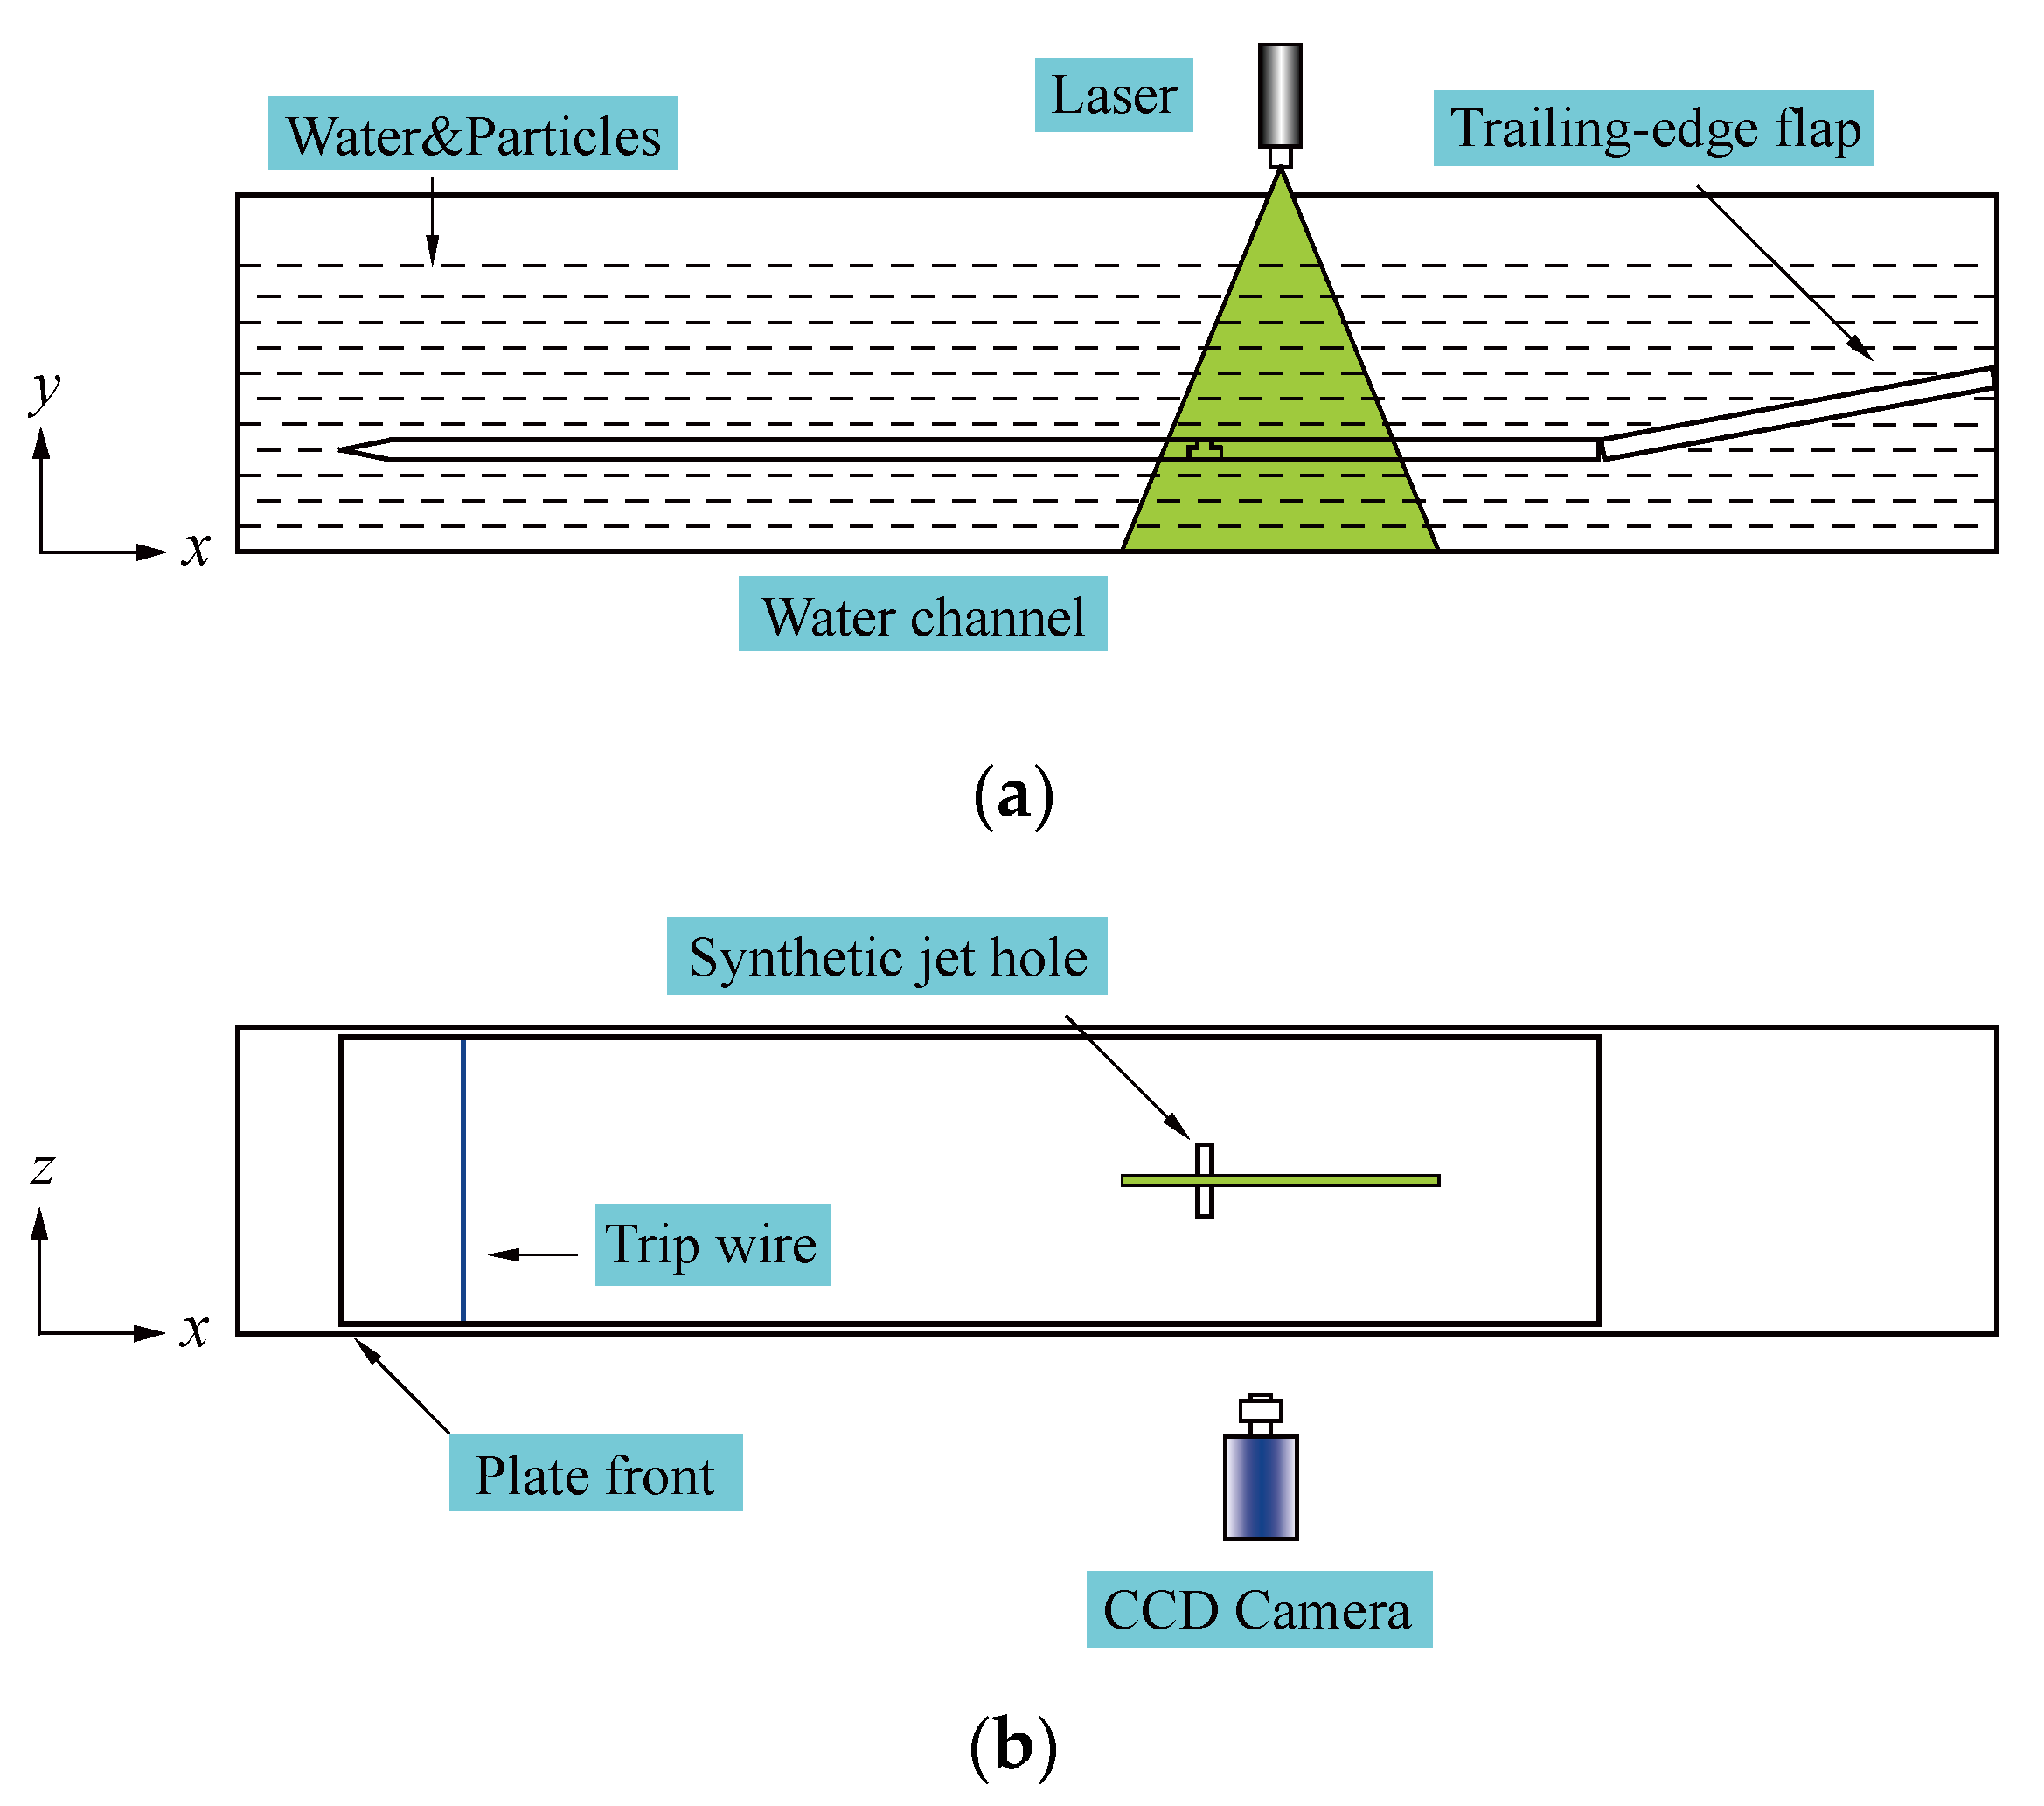
Figure 1. Experimental setup: (a) Front view; (b) Top view.
Actuators 11 00199 g001
Figure 2. The synthetic jet actuator (SJA): (a) Front view; (b) Top view.
Actuators 11 00199 g002
Figure 3. Flow field energy distributions: (a) Single energy; (b) Cumulative energy.
Actuators 11 00199 g003
Figure 4. The profiles of (a) information entropy and (b) relative entropy.
Actuators 11 00199 g004
Figure 5. The spatial scale in flow direction: (a) None; (b) Control.
Actuators 11 00199 g005
Figure 6. Power spectral density: (a) Mode 1; (b) Mode 5; (c) Mode 13; (d) Mode 18.
Actuators 11 00199 g006
Figure 7. Conditional averaging of large-scale flow field: (a) None; (b) Control.
Actuators 11 00199 g007
Figure 8. Conditional averaging of small-scale flow field: (a) None; (b) Control.
Actuators 11 00199 g008
Figure 9. Intrinsic mode function: (a) None; (b) Control.
Actuators 11 00199 g009
Figure 10. Correlation coefficient of each IMF and original signal.
Actuators 11 00199 g010
Figure 11. Correlation coefficient of each IMF and original signal: (a) None; (b) Control.
Actuators 11 00199 g011
Figure 12. The difference between adjacent intrinsic mode function: (a) Mode 1; (b) Mode 500.
Actuators 11 00199 g012
Figure 13. Contrast of reconstructed signal and original signal: (a) None; (b) Control.
Actuators 11 00199 g013
Figure 14. Instantaneous frequency distribution: (a) None; (b) Control.
Actuators 11 00199 g014
Figure 15. Comparison of (a) original and (b) reconstructed fluid field.
Actuators 11 00199 g015
Figure 16. Relative probability of flow and wall-normal fluctuation velocity: (a) None; (b) Control.
Actuators 11 00199 g016
Figure 17. Conditional average results of shear layer: (a) None; (b) Control.
Actuators 11 00199 g017
Table 1. Experimental parameters.
ParameterValue
Field of view99.97 mm × 62.48 mm
Sampling frequency600 Hz
Resolution1280 pixels × 800 pixels
Number of pictures8216 × 5
Scale factor0.0781 mm/pix
Interrogation window32 pixels × 32 pixels, 75% overlap
Vector pitch0.6248 mm
Table 2. The number of modes with zero signal reconstructed at various turbulent energy.
0.50.60.70.80.91.0
None0000287992
Control121120598003
Publisher’s Note: MDPI stays neutral with regard to jurisdictional claims in published maps and institutional affiliations.