1. Introduction
The infrared radiation technique is widely used in the surface temperature measurement of steel billets in steel production [
1,
2]. With the improvement of technology in recent years, more and more steel mills require a smaller temperature uncertainty of the pyrometer to determine whether to start the next process. For example, the temperature of oil quenching of GCr15 bearing steel is 835 ± 5 °C; if the temperature error exceeds 10 °C, the bending strength will be reduced by 3% [
3]. Therefore, reducing the uncertainty of the pyrometer is important for improving the mechanical properties of steels. Emissivity is one of the important parameters for pyrometers [
4,
5,
6]. However, the emissivity is uncertain because it is related to many factors, including temperature, wavelength, angle, and roughness of the billets. The surface oxidation also affects the emissivity with the rolling processing [
7]. Measurement results of the pyrometer will be inaccurate because of the uncertainty in emissivity. There is no complete solution to this problem currently.
For decades, the calculation of emissivity has included many methods. An approximate value for emissivity in single-wavelength radiation thermometry has been assumed [
8]. The surface has been assumed to be a gray body for a two-color pyrometer [
9,
10]. A mathematical model of emissivity has been established using multi-wavelength thermometry [
11,
12,
13,
14]. Because the assumptions and actual conditions are different, the temperature error sometimes even exceeds 20 °C. In addition, some research could measure emissivity with no assumptions. In 2010, Physikalisch-Technische Bundesanstalt (PTB) proposed a method using laser pulses: the temperature of the measured object rose by absorbing laser power, and the emissivity was calculated according to the transient heat conduction equation [
15]. In 2019, Ren used a pyrometer and thermocouple to measure the surface temperature at the same time. By adjusting the emissivity model in the pyrometer, the temperature of the pyrometer gradually approached the thermocouple. When their temperatures were the same, the emissivity model was taken as correct, that is, the surface emissivity was measured [
16]. However, it is difficult to use in situ measurement with these devices because of the complex structure of the devices. Therefore, it is still a difficult problem for pyrometers to not only measure emissivity correctly but also using in situ measurement.
Using a reflector to increase multiple surface reflections is also a common method to calculate the emissivity. This method was first proposed by Drury in 1951 [
17]. In 2001, National Physics Laboratory (NPL) used a concave reflector and two laser beams with different powers to obtain two values of surface temperature rise. The emissivity was calculated by the difference between two values [
18]. In 2014, the National Metrology Institute of the Netherlands (NMI) used a plane mirror to increase surface reflection. Emissivity is calculated by radiation variation when a plane mirror is placed [
19]. By calculating the emissivity, the measurement error of the surface temperature can be reduced to less than 3 °C.
The pyrometer based on a reflector is widely used in in situ measurement due to its simple structure, such as the land surface pyrometer (Land SP). For decades, some shortcomings of the reflector have been gradually exposed. First, it is difficult to eliminate the uncertainty in measurement results. When the reflector and the surface form a closed cavity, the surface emits approximate blackbody radiation. The emissivity is obtained by the ratio of intrinsic radiation to approximate blackbody radiation. However, there are many factors that affect the approximate blackbody radiation, including: reflectivity and shape of the reflector, gap between the reflector and surface, and physical state of the surface [
20]. These uncertainty factors will affect the accuracy of the measurement results. Second, the reflector will damage the surface temperature. The measured surface emits free radiation to the hemispherical space at the beginning. When the reflector covers the surface, the radiation returns to the measured surface, so the surface temperature rises. Therefore, two problems of pyrometers based on the reflector have to be overcome: the uncertainty of approximate blackbody radiation and the damage to surface temperature.
In this paper, we design two apertures on the reflector to measure the intrinsic radiation and approximate blackbody radiation of the billet. The emissivity of the billet is measured by dual-band thermometry. The pyrometer is developed and the damage of the surface temperature is analyzed. The measurement accuracy of emissivity is verified in the laboratory and the rolling production line.
2. Principles for Measuring Emissivity Using a Reflector with Two Apertures
The emissivity of a pyrometer is usually assumed to obtain the surface temperature. For example, in single-wavelength radiation thermometry, the relationship between the intrinsic emissivity
ε and the temperature of the measured surface
T is:
where
Ts is the spectral radiation temperature measured by the pyrometer;
ε is the intrinsic emissivity at wavelength λ;
c2 = 1.4388 × 10
−2 (m·k) is a constant.
In Expression (1), both
T and
ε are unknown in measurement. Two unknown parameters cannot be simultaneously obtained by only one expression. Therefore, we propose the method to calculate emissivity using a reflector with two apertures. The measurement principle is depicted in
Figure 1.
The reflector and the measured billet form a closed system. The billet emits approximate blackbody radiation, and the radiation is received by the circular opening aperture B. A tube is welded to the circular opening aperture A. Its inner wall absorbs but does not reflect light, so the intrinsic radiation of the billet is received. At the same time, dual-band thermometry is used in this paper. The two wavelengths of the detector are λ1 and λ2, and the intrinsic emissivity of the surface is correspondingly ε1 and ε2. The spectra of the two wavelengths are in the near-infrared. The expressions at aperture A and B are as follows:
Aperture B:
where
TA(
λ1) and
TA(
λ2), respectively, are the spectral radiation temperature at aperture A when the wavelengths of the detector are
λ1 and
λ2.
TB(
λ1) and
TB(
λ2) are the spectral radiation temperature measured by the same detector at aperture B.
εa is the effective emissivity of the billet. Because the spectral reflectance of the gold-plated reflector is almost equal in the NIR band, we assume that the reflectivity at the two wavelengths is
ρ1 = ρ2 = ρ [
21]. In addition, the signal error is independent of wavelength, so
εa is the same at the two wavelengths.
Expressions (2)–(5) calculate four unknowns simultaneously—T, ε1, ε2, and εa. The method realizes the real-time measurement of emissivity, and the effective emissivity is solved as a parameter.
The obvious differences between Expressions (2)–(5) and previous studies include: A. The emissivity can be determined with no assumptions, eliminating the uncertainty of emissivity of the measured billet, and the measurement results are more accurate in principle. B. The four equations are established to solve four unknowns simultaneously, and the effective emissivity εa is solved as an unknown.
3. Structure Design of the Pyrometer
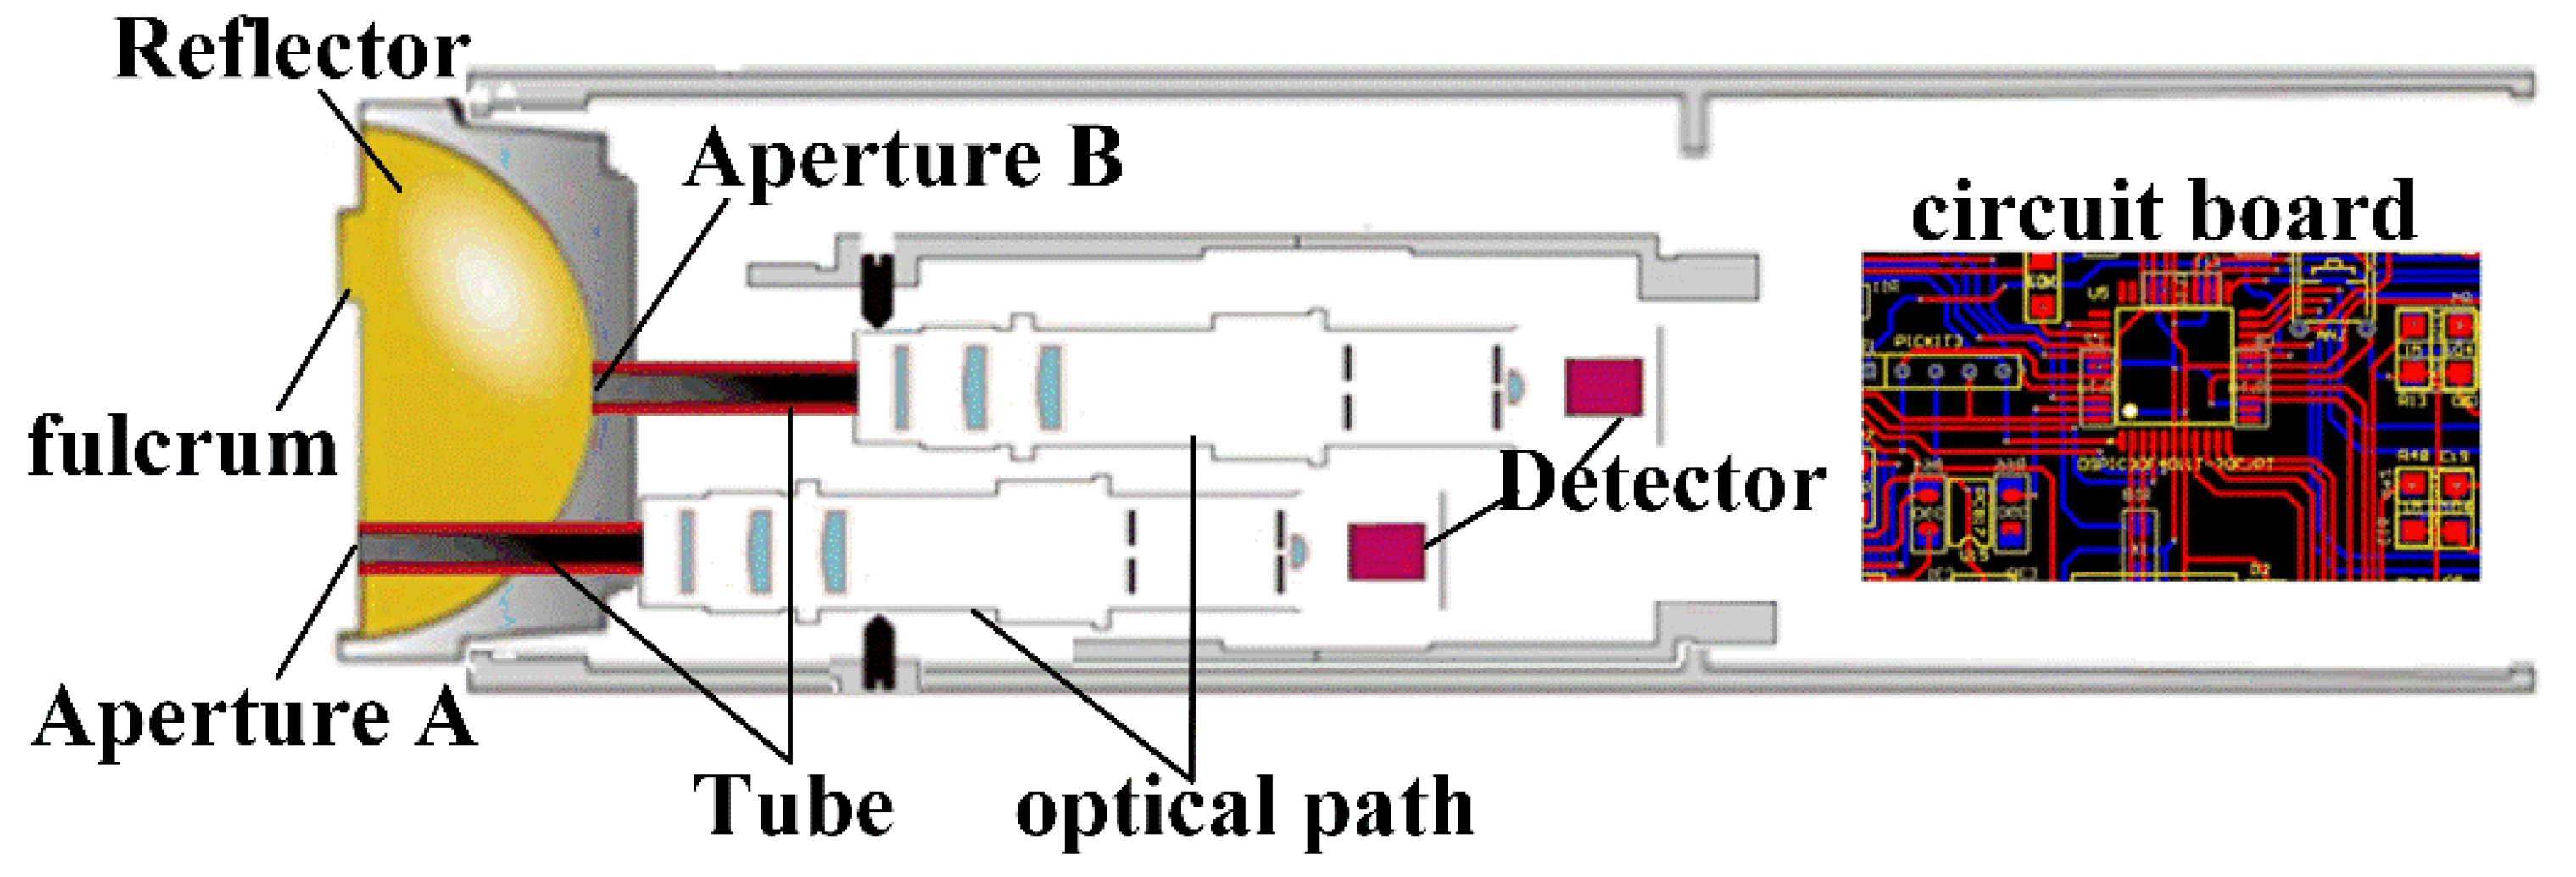
Figure 2 shows the structure of the pyrometer based on the reflector with two apertures. The pyrometer is divided into three parts. Each part is described in detail below.
3.1. Reflector with Two Apertures
The reflector is hemispherical and its inner wall is plated with gold to increase reflectivity. The reflector will be bumped when it touches the moving billet, resulting in a change in output results of the pyrometer. Thus, we design three fulcrums at the edge of the reflector to reduce data volatility of the pyrometer. The two tubes are cylinders with openings at both ends, and their inner wall is coated with a high-absorptivity material. The two apertures have equal diameter.
3.2. Photoelectric Conversion
A photoelectric conversion system is composed of optical paths and detectors. We use two optical paths to collect intrinsic radiation and approximate blackbody radiation of the billet. The detector is composed of Si and InGaAs photodiodes, and two wavelengths range from 0.4 to 1.2 µm and 0.8 to 1.7 µm, respectively. The detectors convert the received radiation into electric current.
3.3. Data Acquisition
A circuit board is used to collect data and its sampling frequency is 25 Hz. The electric current from the detector is amplified and filtered using the circuit board. Then, the circuit board calculates and displays the temperature and emissivity of the billet.
3.4. Calibration
We use a blackbody to calibrate the pyrometer. After the temperature of the blackbody stabilizes, we take the reflector and aim it at the opening of the blackbody furnace. The output of the pyrometer at different temperatures is recorded. Then, the relationship between the blackbody temperature and output signal is established. The calibration results are shown in
Figure 3a,b.
T is the blackbody temperature, °C;
I is the output of electric current, nA.
4. Experiment for Verifying the Accuracy of Emissivity Measurement
4.1. Experimental Setup
We verify the accuracy of emissivity by experiment with oxidized Inconel 600. The surface of Inconel 600 can form a stable oxide layer when it is heated in air, and the emissivity does not change. It is often used as a reference for the accuracy verification of emissivity [
14,
15]. Reference [
22] provides the normal spectral emissivity of standard oxidized Inconel, and we compare the measurement results of emissivity with this reference.
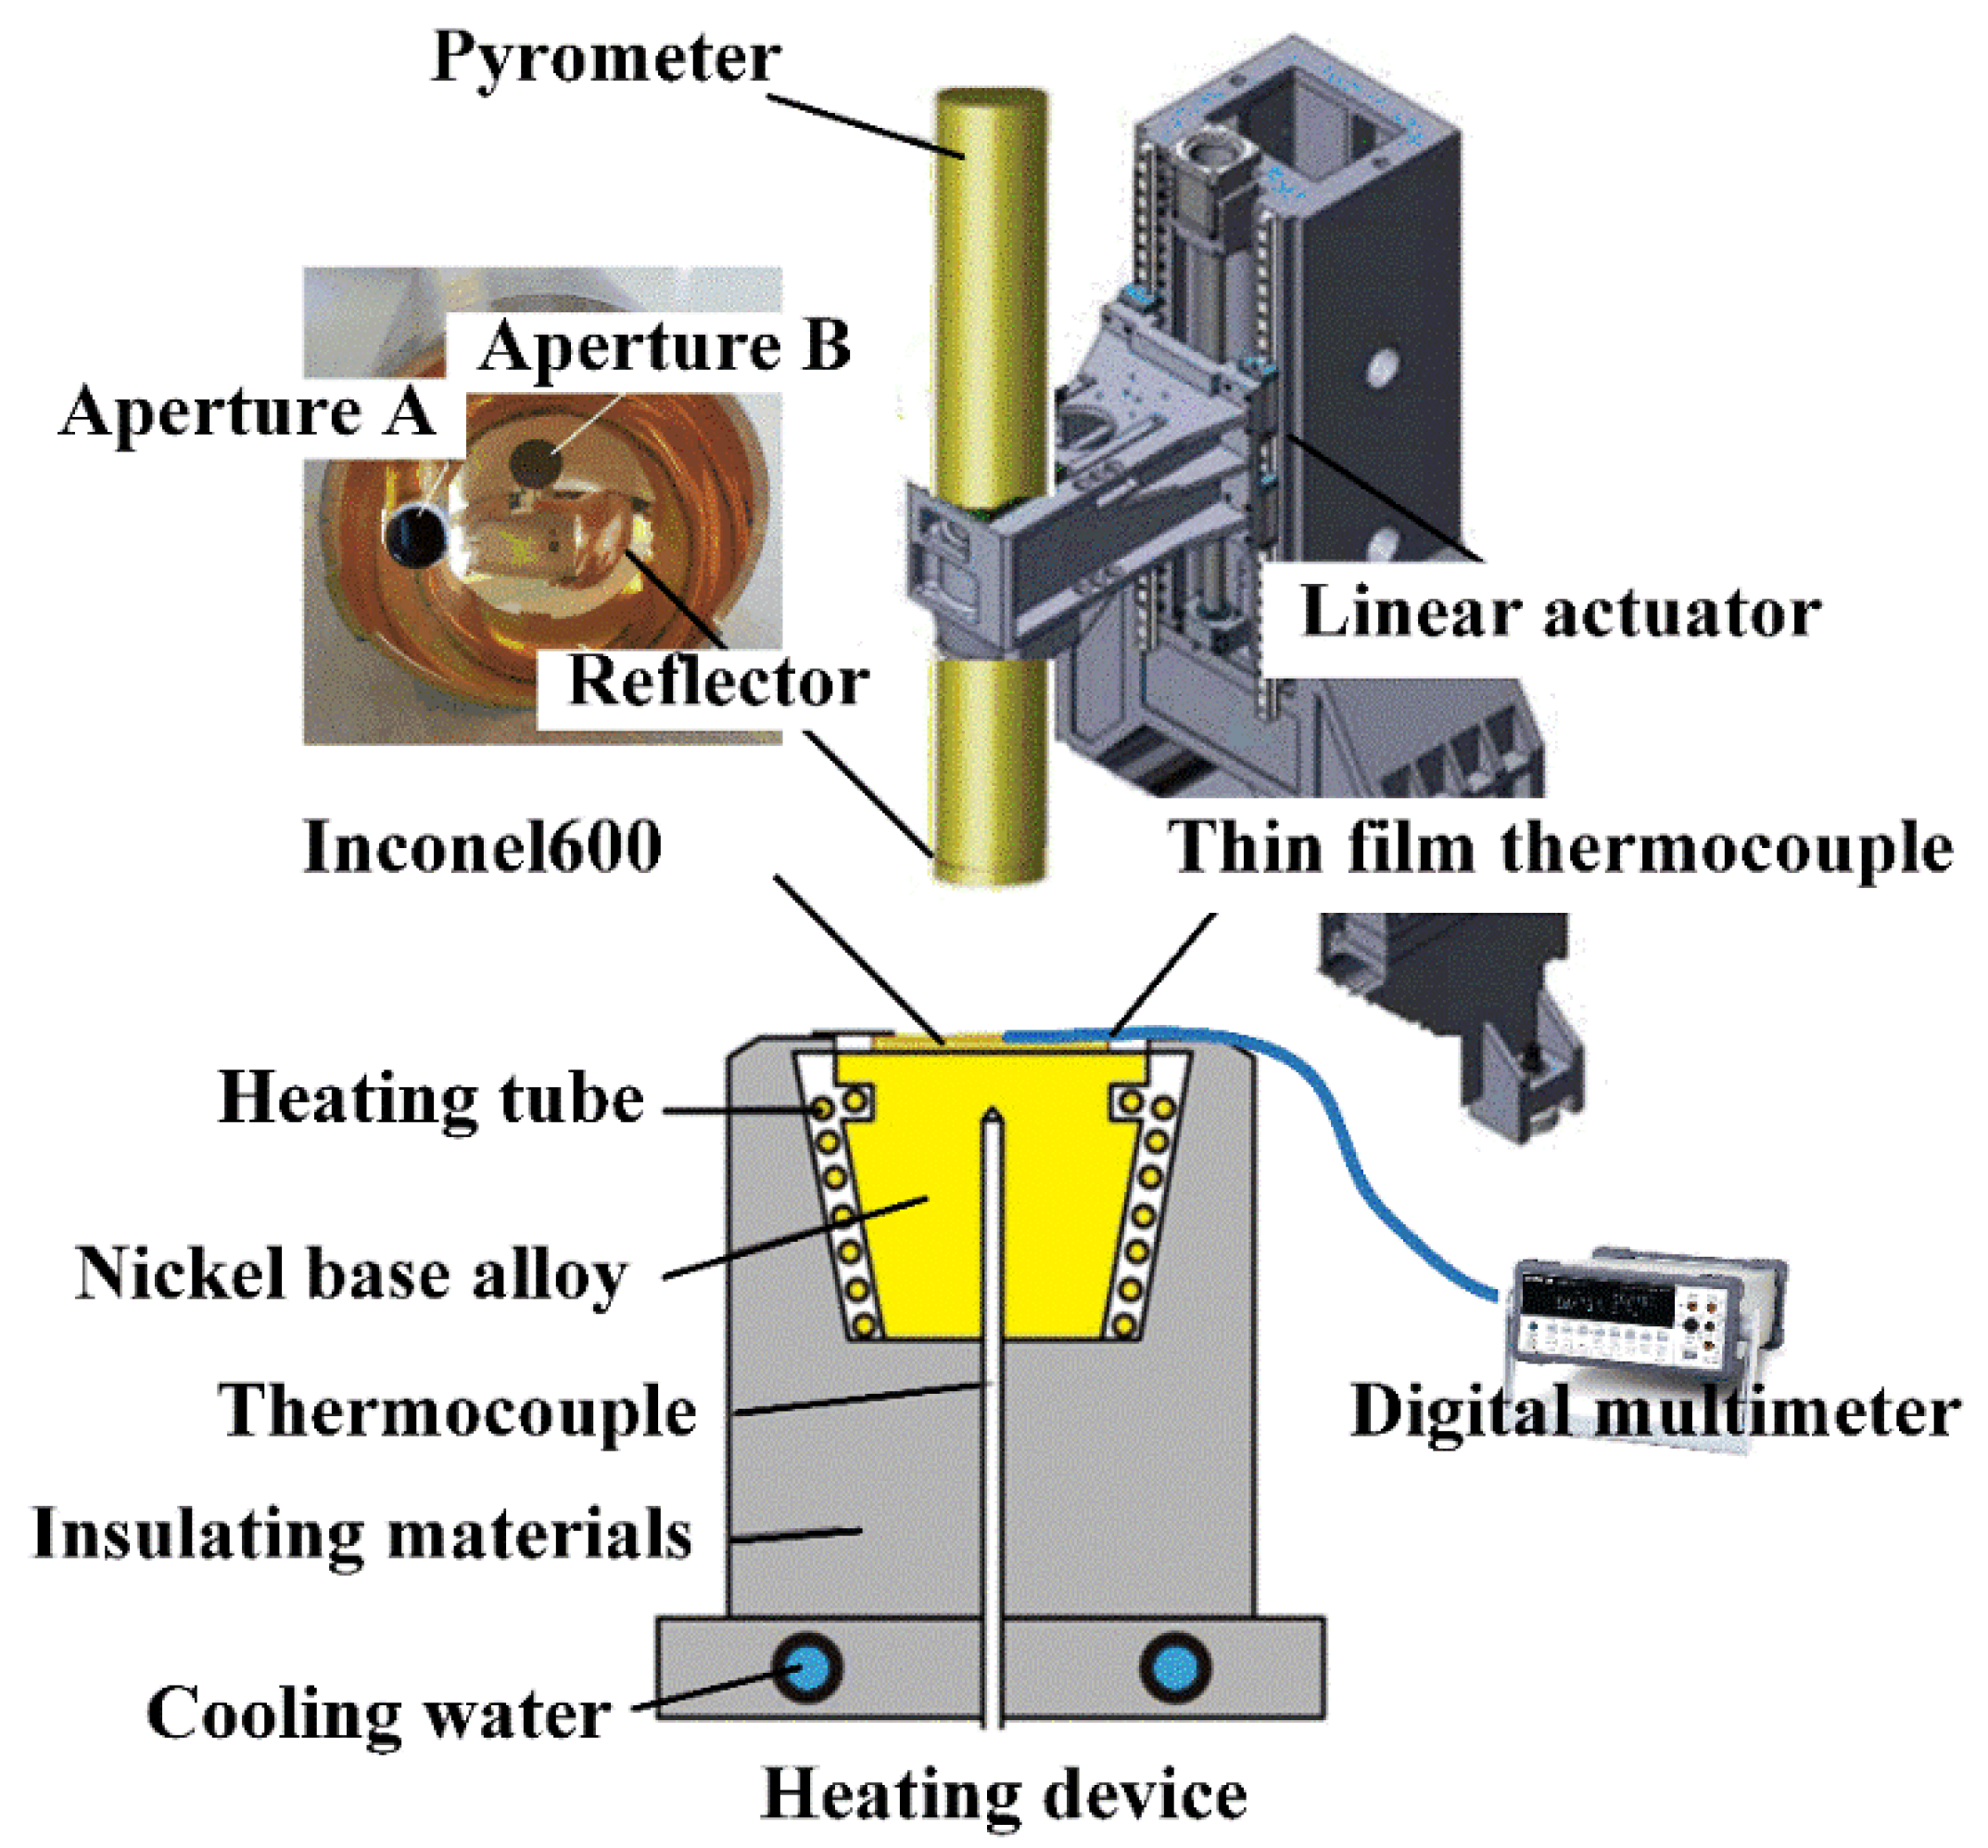
Figure 4 shows the structure of the experimental device. It is made up of five components: pyrometer, linear actuator, heating device, thin-film thermocouple, and digital multimeter. The steps of the experiment are described as follows:
- (1)
The circular Inconel 600 (3 mm thick) is installed on the heating device. The heating device is composed of a nickel base alloy, heating tubes, thermocouple, insulating materials, and cooling water. The nickel base alloy is heated through the heating tube. The temperature of Inconel 600 is increased through heat conduction by the nickel base alloy. A thermocouple is used to display the temperature of the heating device.
- (2)
A thin-film thermocouple is welded on the Inconel 600. We use a digital multimeter to display the output of the thermocouple and take it as the temperature reference.
- (3)
The pyrometer and setting procedure are fixed in the linear actuator. The linear actuator controls the movement of the pyrometer by procedure. As the procedure is executed, the pyrometer falls on the Inconel 600 for measurement and then returns to the original position.
4.2. Experimental Results
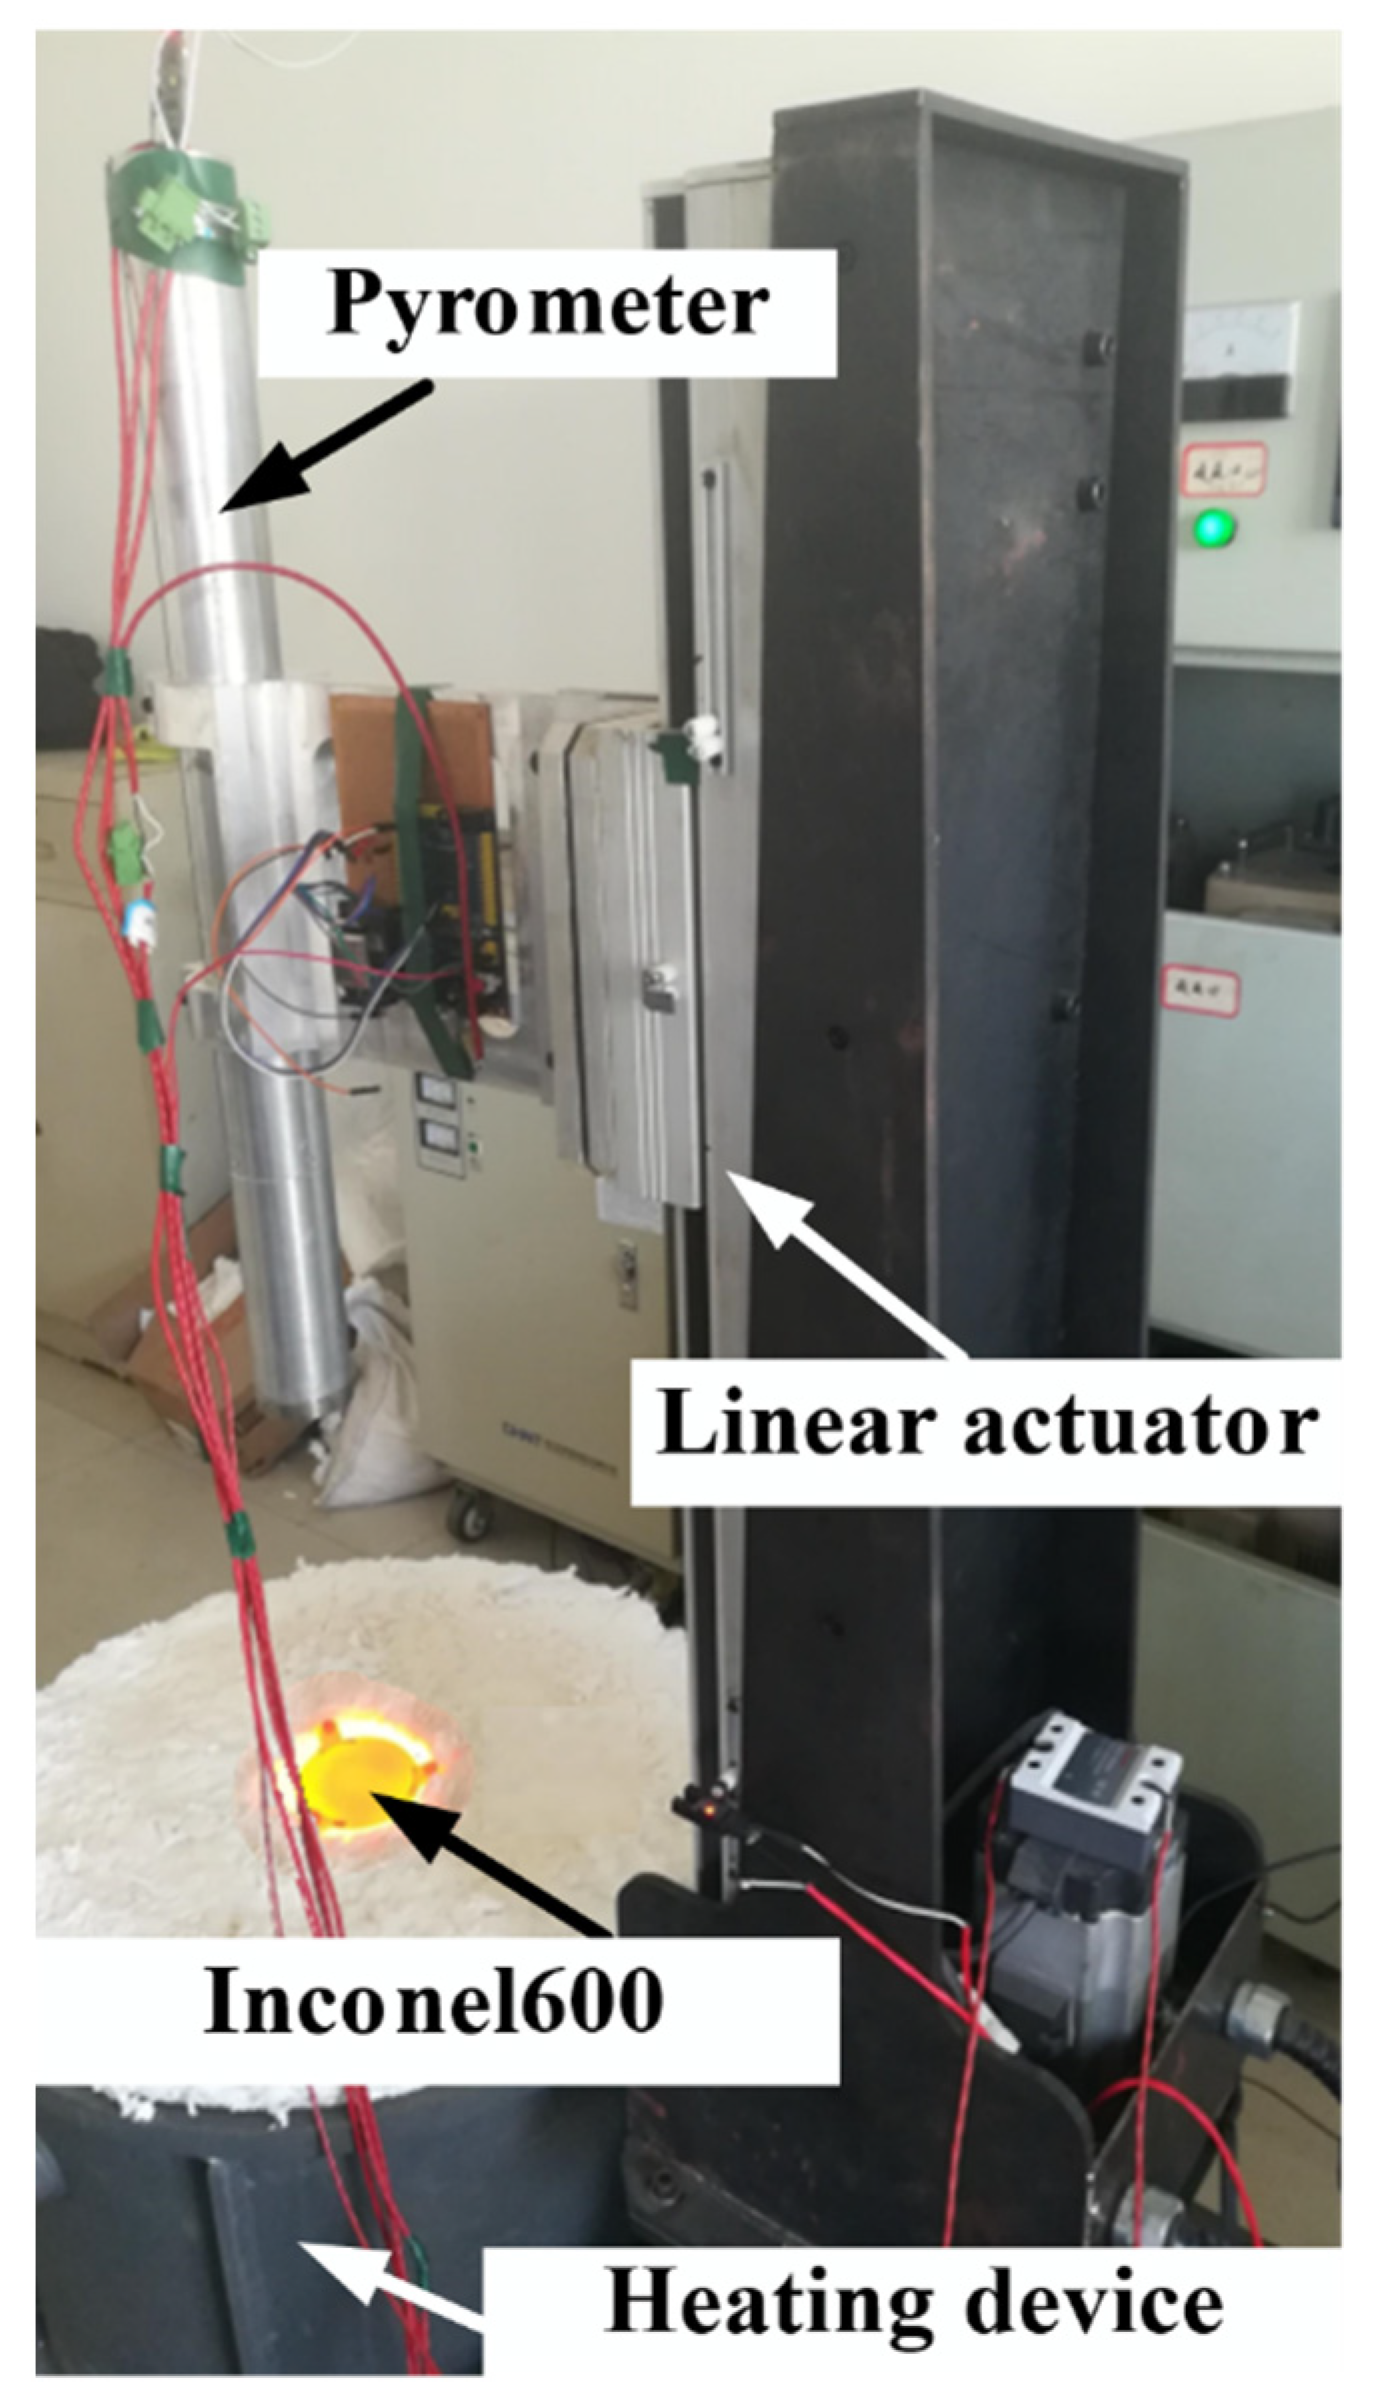
Figure 5 shows a photo of the experiment. We measure the emissivity of Inconel 600 at 600~1000 °C and compare the results with the reference. The movement time of the pyrometer is 2.1 s and the measurement time is 0.79 s.
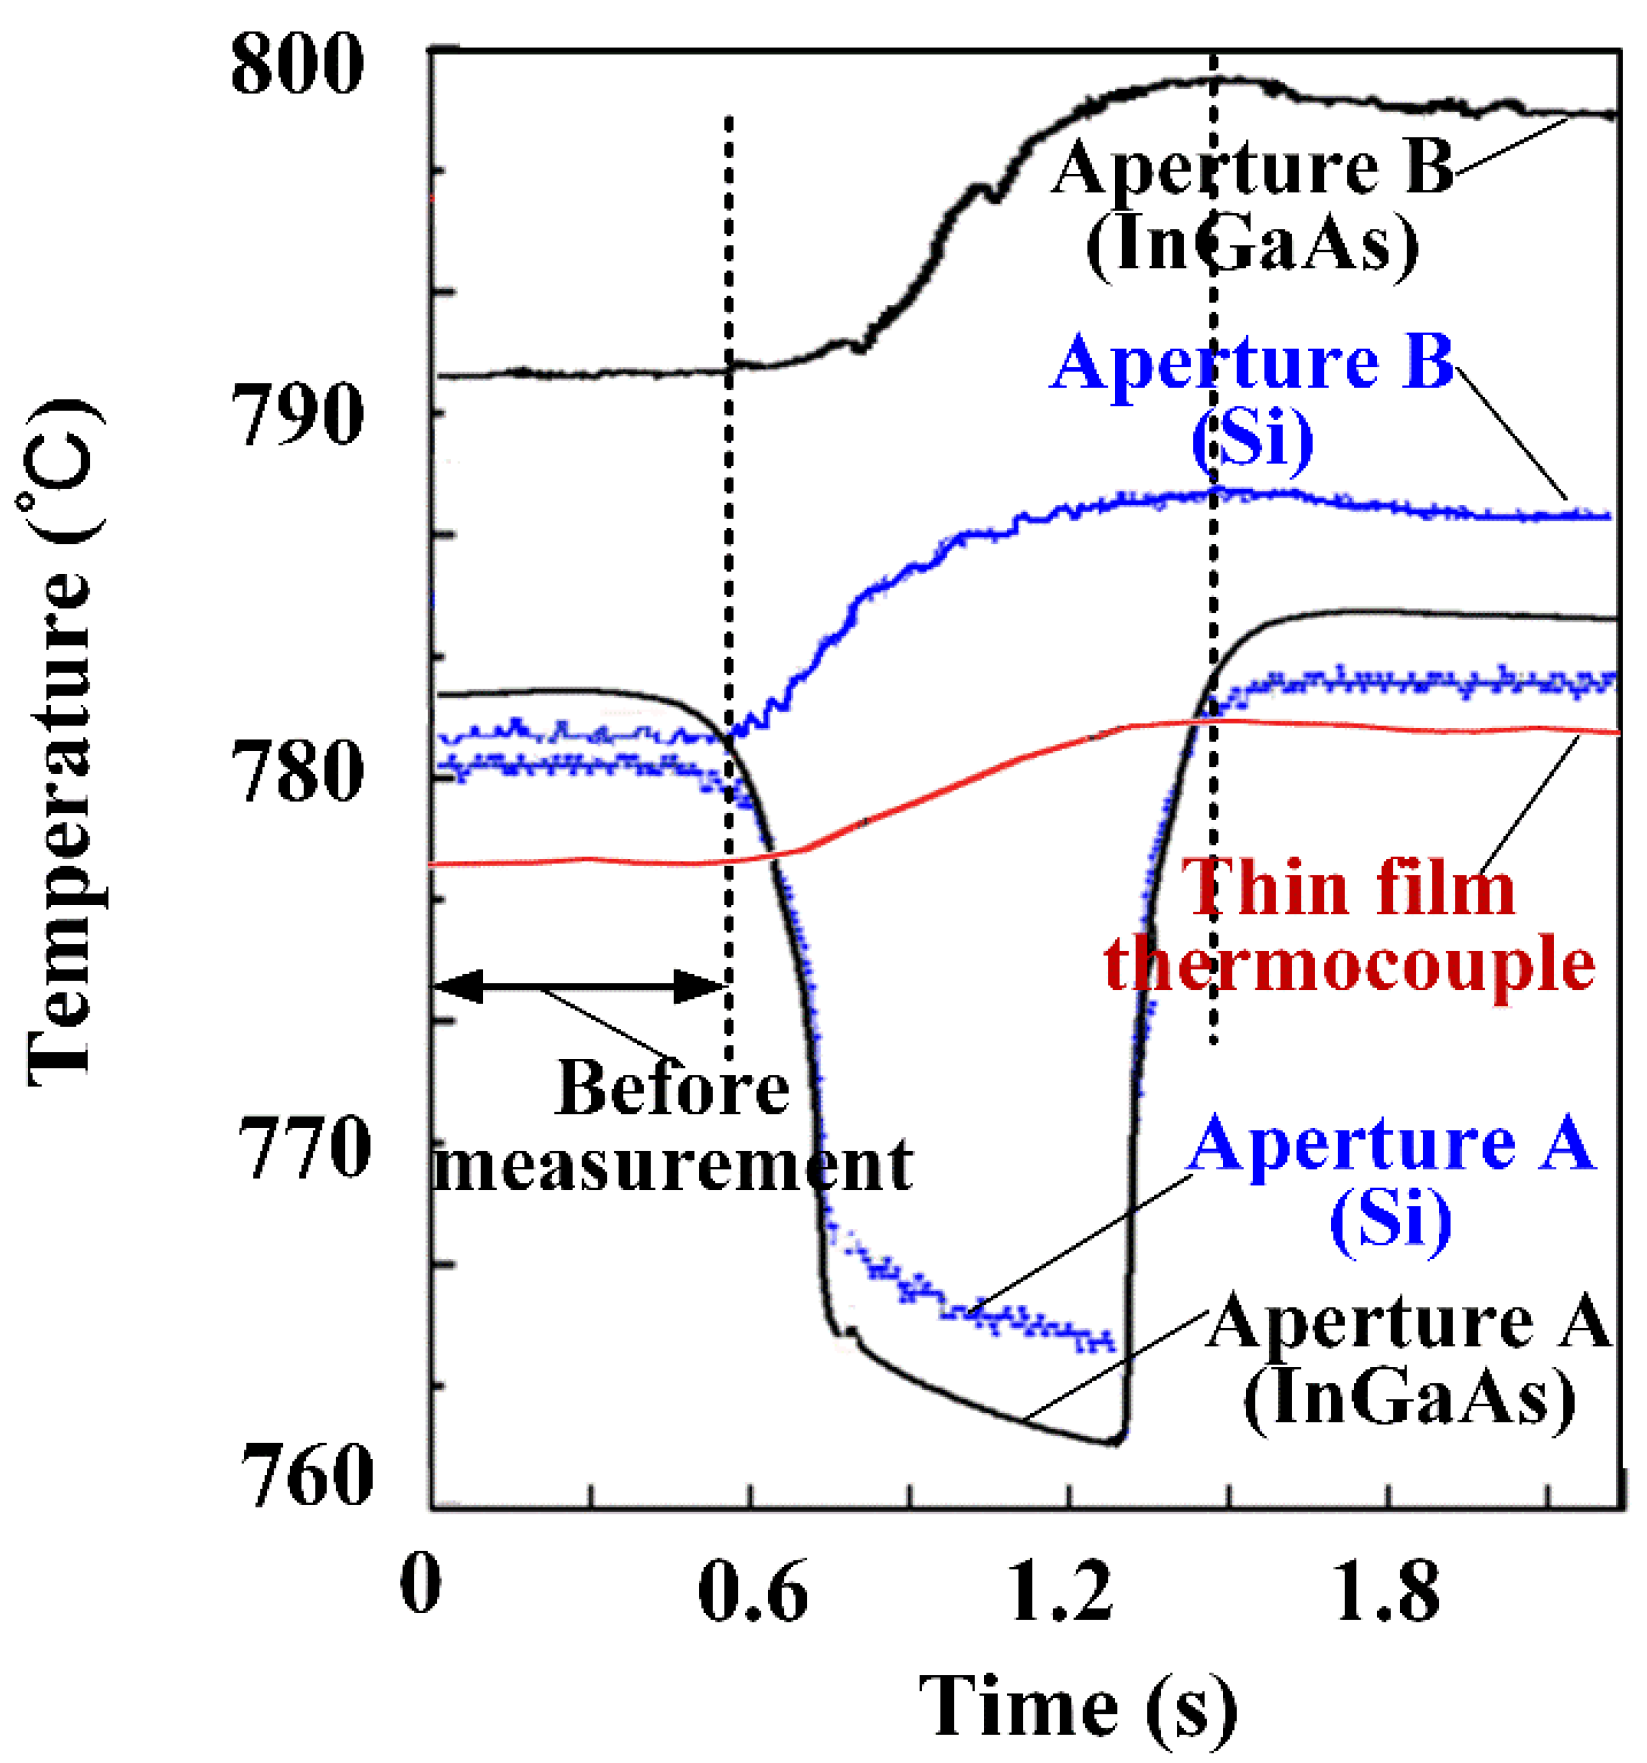
Figure 6 shows the temperature variation in the measurement when Inconel 600 is 768 °C. The red curve is the measurement results of the thin-film thermocouple. As the reflector is nearing the Inconel 600, approximate blackbody radiation is formed on the surface, resulting in the surface temperature rise of Inconel 600. This phenomenon is consistent with the change trend of the red curve in
Figure 6. For aperture A, it receives radiation from the surface before measurement. However, during the measurement, the tube blocks the radiation from other parts of the surface, so the measurement signal is reduced. For aperture B, blackbody radiation is formed during the measurement, so the spectral radiance temperature increases. The measurement result of the pyrometer is 1.42 °C more than that of the thermocouple.
We change the power of the heating device so that the temperature of Inconel 600 is changed in 600–1000 °C. The temperature of the thin-film thermocouple is considered as the true temperature of Inconel 600.
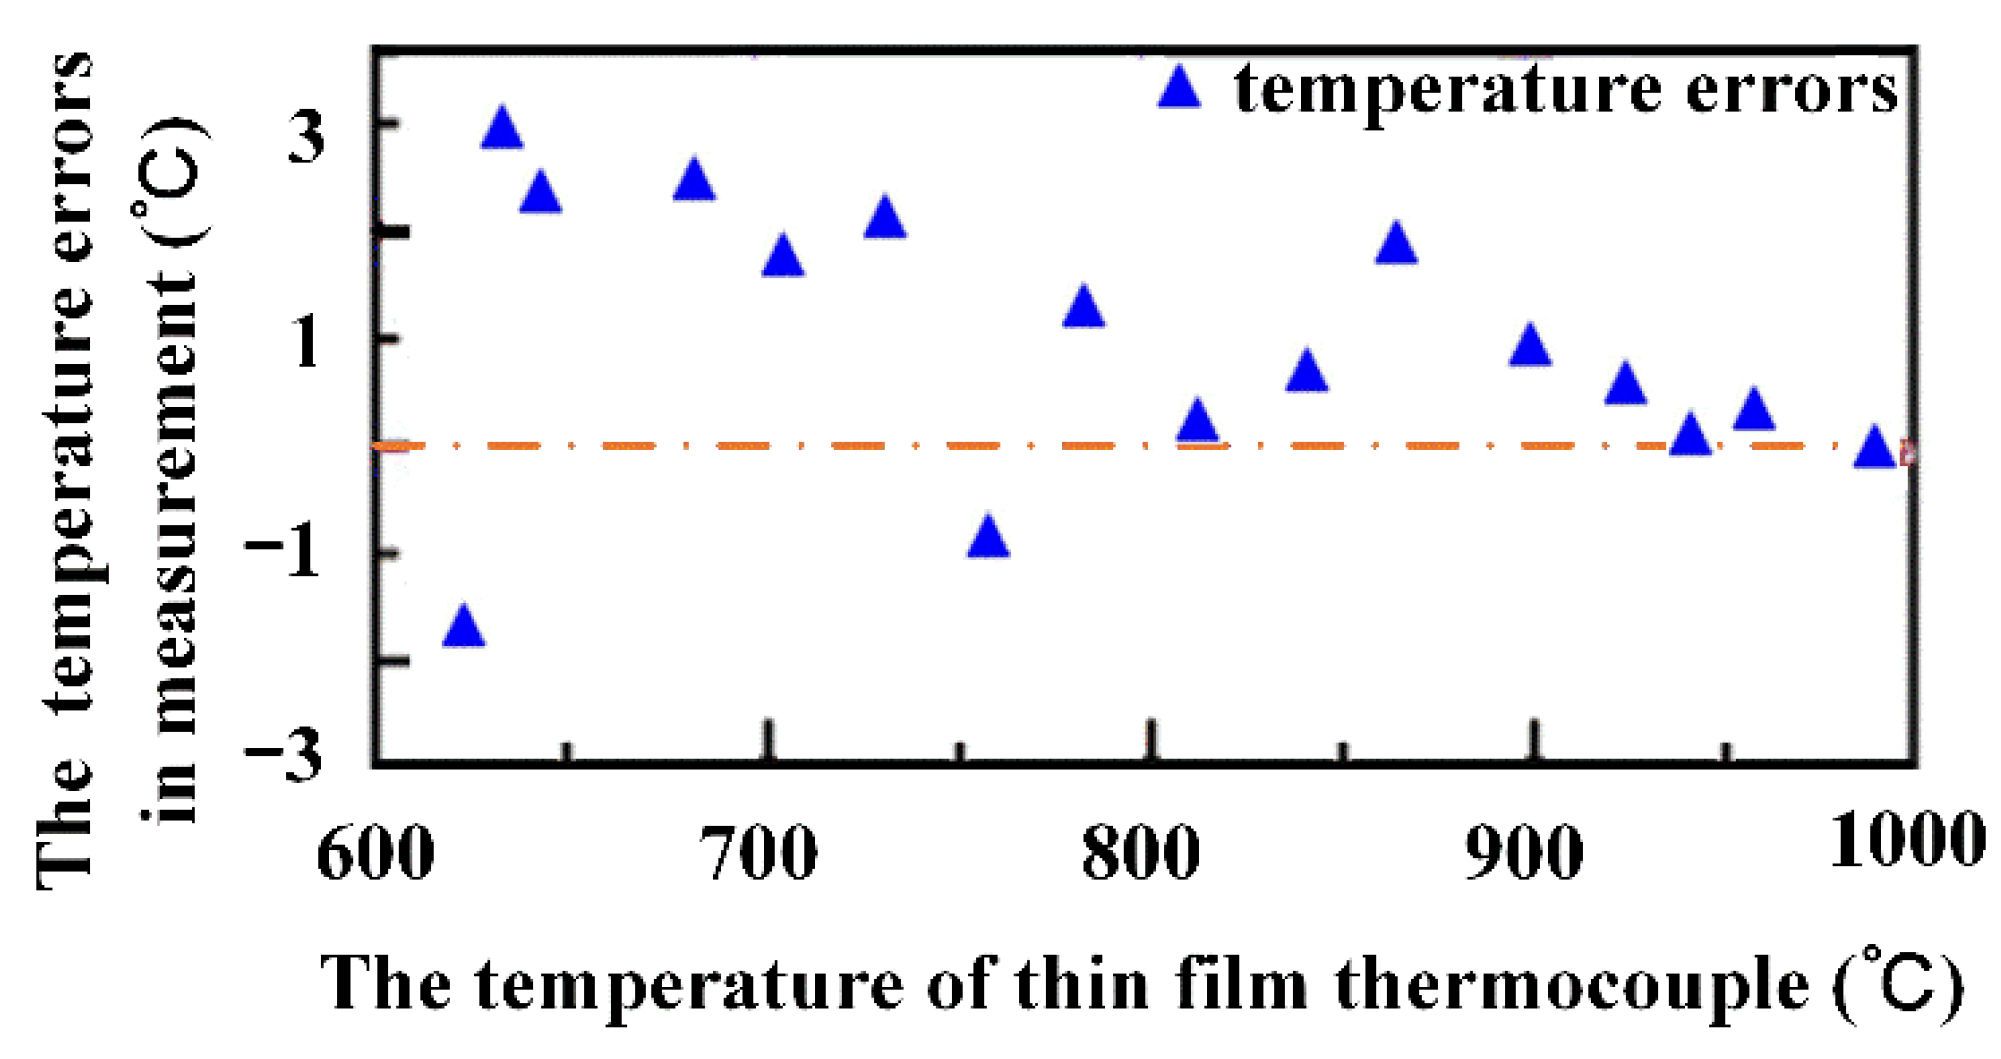
Figure 7 shows the temperature difference between the pyrometer and the thin-film thermocouple. The maximum measurement error is 3 °C when the surface temperature is about 630 °C. Then, with the increase in surface temperature, the measurement error of the pyrometer decreases gradually. The average measurement error is 1.63 °C at 600–1000 °C. The requirements of the high-precision measurement field mentioned in the Introduction section are met. The temperature of the pyrometer is always slightly higher than that of the thermocouple due to the surface temperature rise caused by the reflector. Because the radiation of Inconel 600 is weaker when the temperature is lower, the signal obtained by the detector is weaker and the SNR of the detector is lower, so the measurement error is greater. Therefore, the pyrometer is more suitable for measuring samples above 700 °C.
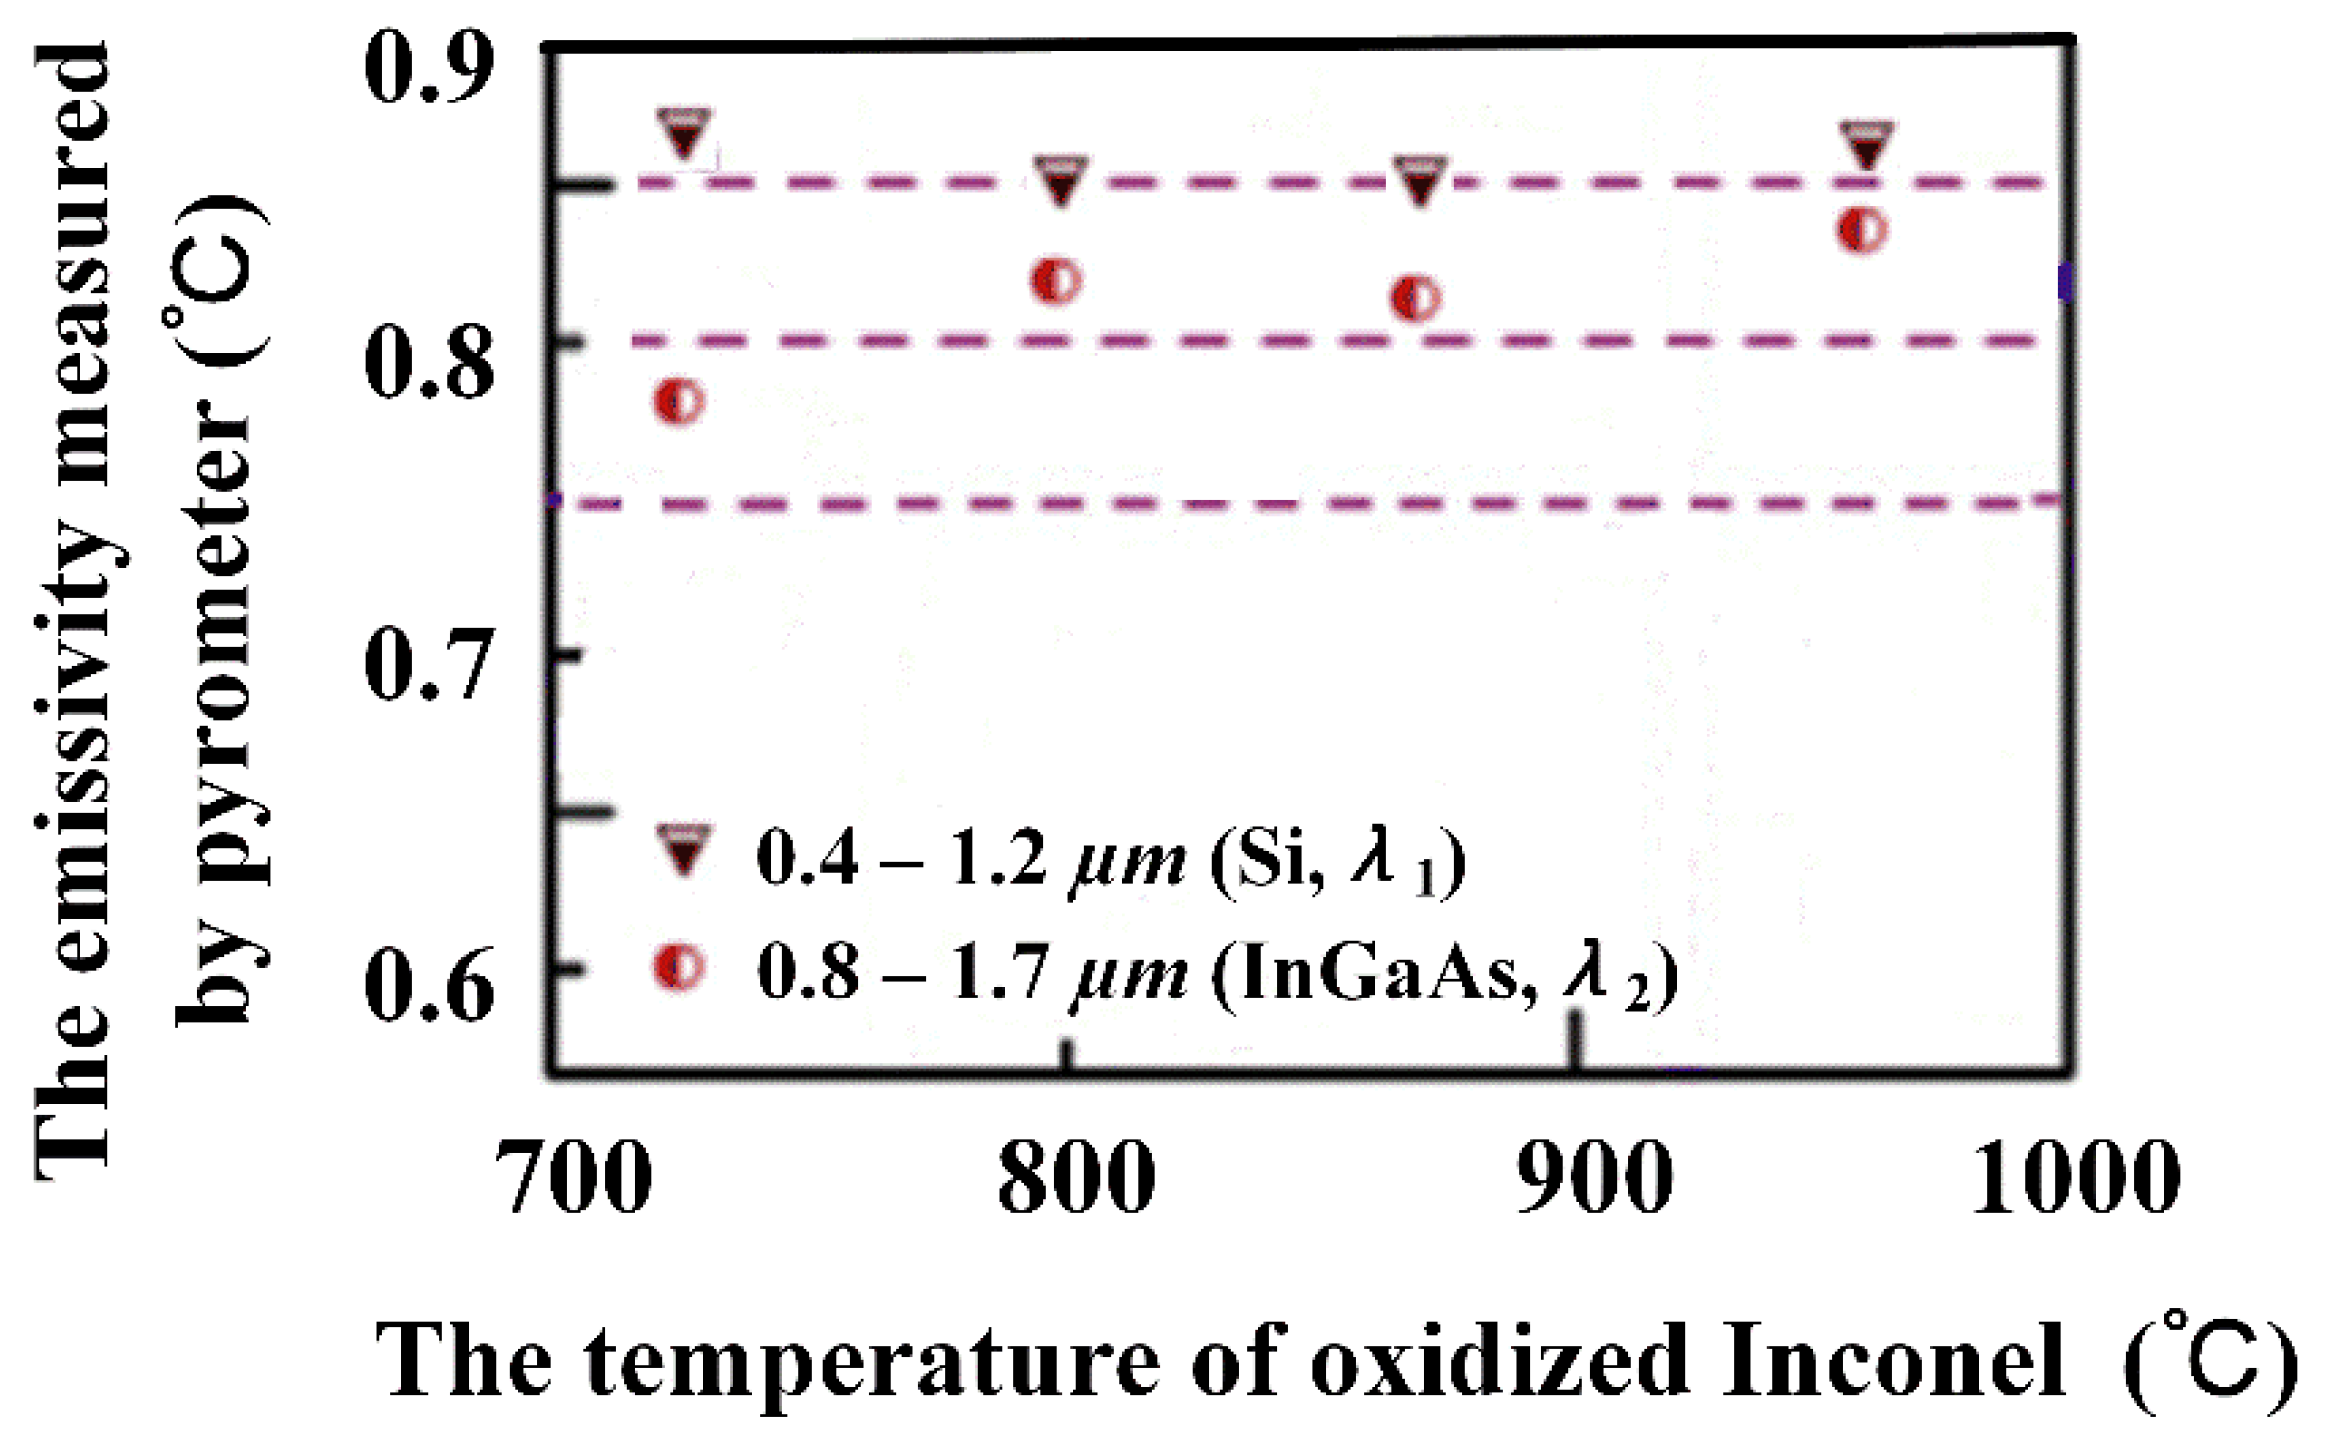
The emissivity of Inconel 600 is measured at 700–1000 °C.
Figure 8 shows the results intuitively. Each point is the average value in three measurements. The emissivity basically does not change with temperature, because the normal spectral emissivity of oxidized Inconel 600 alloy is stable in the near-infrared spectrum. The measurement error near 700 °C is slightly larger than those at other temperatures. Because the temperature is slightly lower, the surface radiation becomes weaker and the SNR of the detector is lower, so the measurement error becomes larger. When the temperature of oxidized Inconel 600 alloy is about 800 °C, the difference in emissivity between the pyrometer and the reference is 0.021 at
λ1 (Si) and 0.005 at
λ2 (InGaAs).
4.3. Solution of Surface Temperature Rise
In
Figure 6, the temperature rise of the thin-film thermocouple indicates that the reflector damages the surface temperature. The temperature rise can be solved using the principle of heat transfer. Because the radius of the circular Inconel 600 (40 mm) is much larger than the thickness (3 mm), and it is embedded in the nickel base alloy, the circular edge has little heat exchange with the outside. Thus, the temperature gradient in the radial direction can be ignored. Therefore, a one-dimensional heat transfer model is established in the thickness direction of Inconel 600, and the heat transfer equation, boundary conditions, and initial conditions are expressed as:
boundary conditions:
initial condition:
where
T(
x,
t) represents the temperature (°C) at position
x and time
t (s).
α = λ/(
Cρ) is the thermal diffusivity of the sample.
l,
T0, and
ε are the thickness, temperature, and intrinsic emissivity of Inconel 600, respectively.
k is thermal conductivity, W/(m·K).
C is specific heat capacity, J/(kg·K).
ρ is density, kg/m
3.
t is the measurement time of the pyrometer.
According to the numerical solution of the equation in reference [
23], we split the solution of the equation as:
T(
x,
t) =
θw(
x,
t) +
θh(
x,
t) +
p(
x,
t).
θw(
x,
t) is the solution of steady-state nonhomogeneous problems,
θh(
x,
t) are nonstationary homogeneous problems, and
p(
x,
t) are special solutions.
Thus, the temperature rise can be expressed as:
where the summation formula (Basel problem) is used:
Equation (11) shows the influence of temperature rise, including
t,
T0, and
ε.
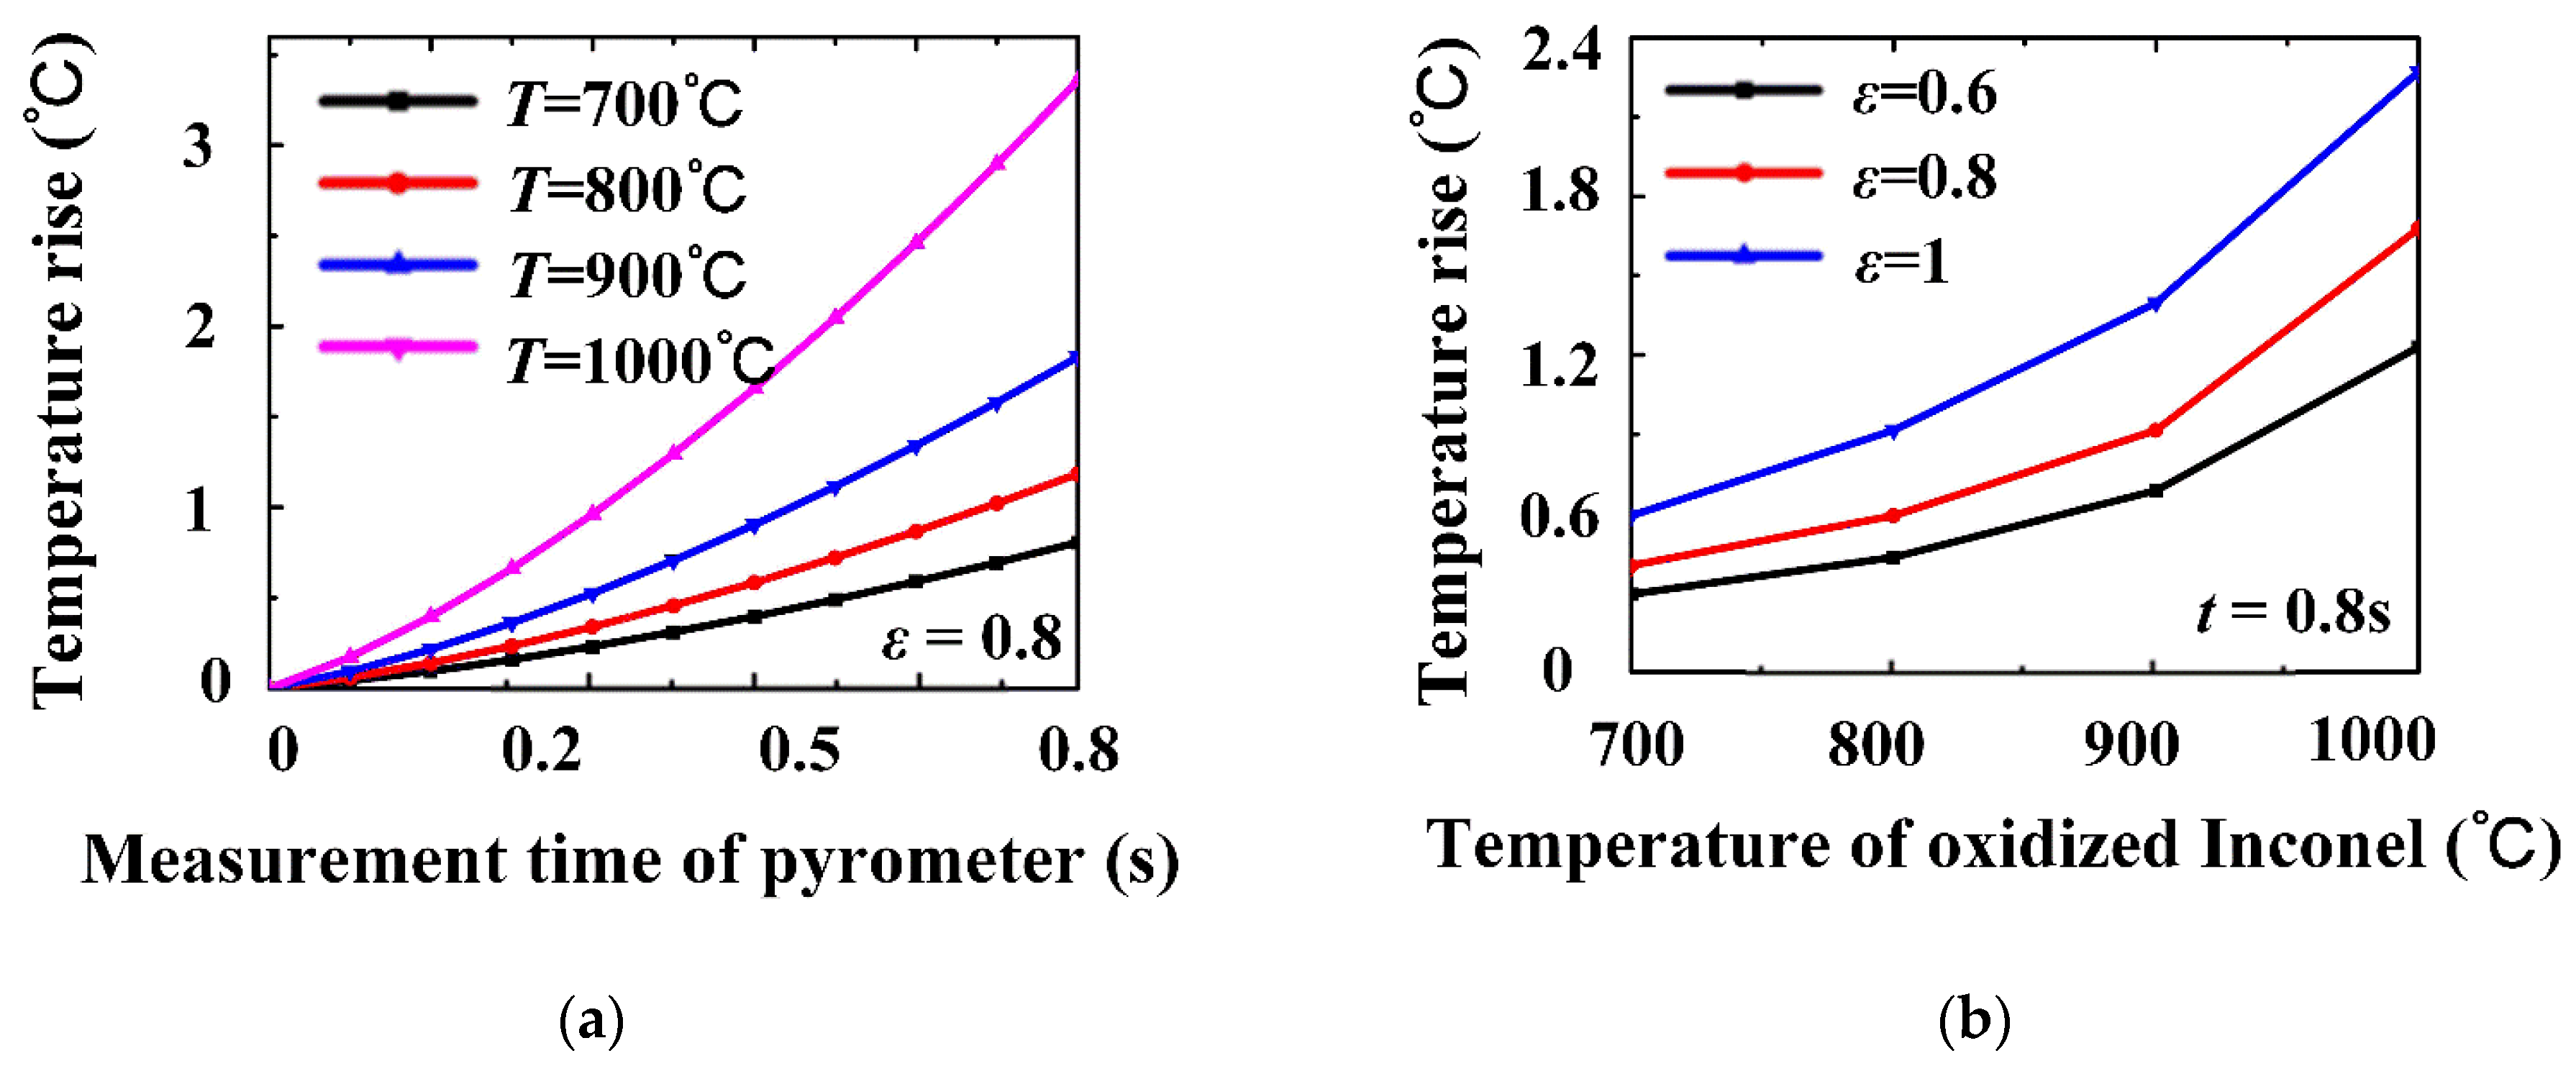
Figure 9 shows the trend of temperature rise caused by these parameters. The temperature rises more quickly with the increase in initial surface temperature. When the pyrometer is used to measure different billets, the higher the intrinsic emissivity of the billets, the greater the temperature rise. Then, we modify the temperature output of the pyrometer according to the temperature rise.
4.4. Analysis of Influencing Factors on Measurement Results
In the Introduction section, the shortcomings of the reflector are mentioned, including the surface temperature rise and the factors that affect the approximate blackbody radiation. Surface temperature rise is analyzed in
Section 4.3. Then, we analyze the factors that affect the approximate blackbody radiation. When the reflector and the billet form a closed system, the effective emissivity of the surface increases and the approximate blackbody radiation is emitted on the surface. The effective emissivity is involved in the calculation of measurement results, as shown in Equations (4) and (5). Therefore, the influence factors of effective emissivity are analyzed to indirectly obtain the influence on the measurement results. When the pyrometer is measuring the moving billet, there will be a gap between the reflector and the billet due to the movement of the billet. The radiation will escape through the gap, resulting in the reduction in effective emissivity. In addition, the reflectivity of the reflector and the intrinsic emissivity of the surface will also affect the effective emissivity.
A ray-tracing algorithm is proposed to solve the effective emissivity in this paper. Then, the influence of the measurement results is analyzed. In the measurement, it is difficult to obtain the analytical solution of effective emissivity because the route of the radiation is complex. The route of rays emitted from the surface is divided into four parts: escaping from aperture B, escaping from aperture B after multiple reflections by reflector, being absorbed by the surface after multiple reflections by the reflector, escaping from aperture A, escaping from aperture A after multiple reflections, and escaping from the gap between the billet and reflector.
The basis of ray-tracing is the Monte Carlo method by generating pseudo-random numbers uniformly distributed over the interval (0, 1]. We use the random function in MATLAB to generate pseudo-random numbers. We assume the energy of each ray is assigned a unit energy, simulating the path of the ray until it is absorbed or escaped. For each ray pointed to the surface after reflection by the reflector, the type of absorption is selected: if the pseudo-random number g < ε0, we consider the ray absorbed, tracing the next ray. If the pseudo-random number g ≥ ε0, we consider the ray reflected, tracing until it escapes.
A few rays escape through the aperture and the gap compared with the total rays. As most of the rays can be absorbed eventually, we count the number of rays escaping from the aperture and the gap to reduce the complexity of the algorithm. According to Kirchhoff’s law, the effective emissivity of the billet can be written:
where
N is the number of rays that emitted from the surface and
Na is the number of rays that escaped through the aperture and the gap.
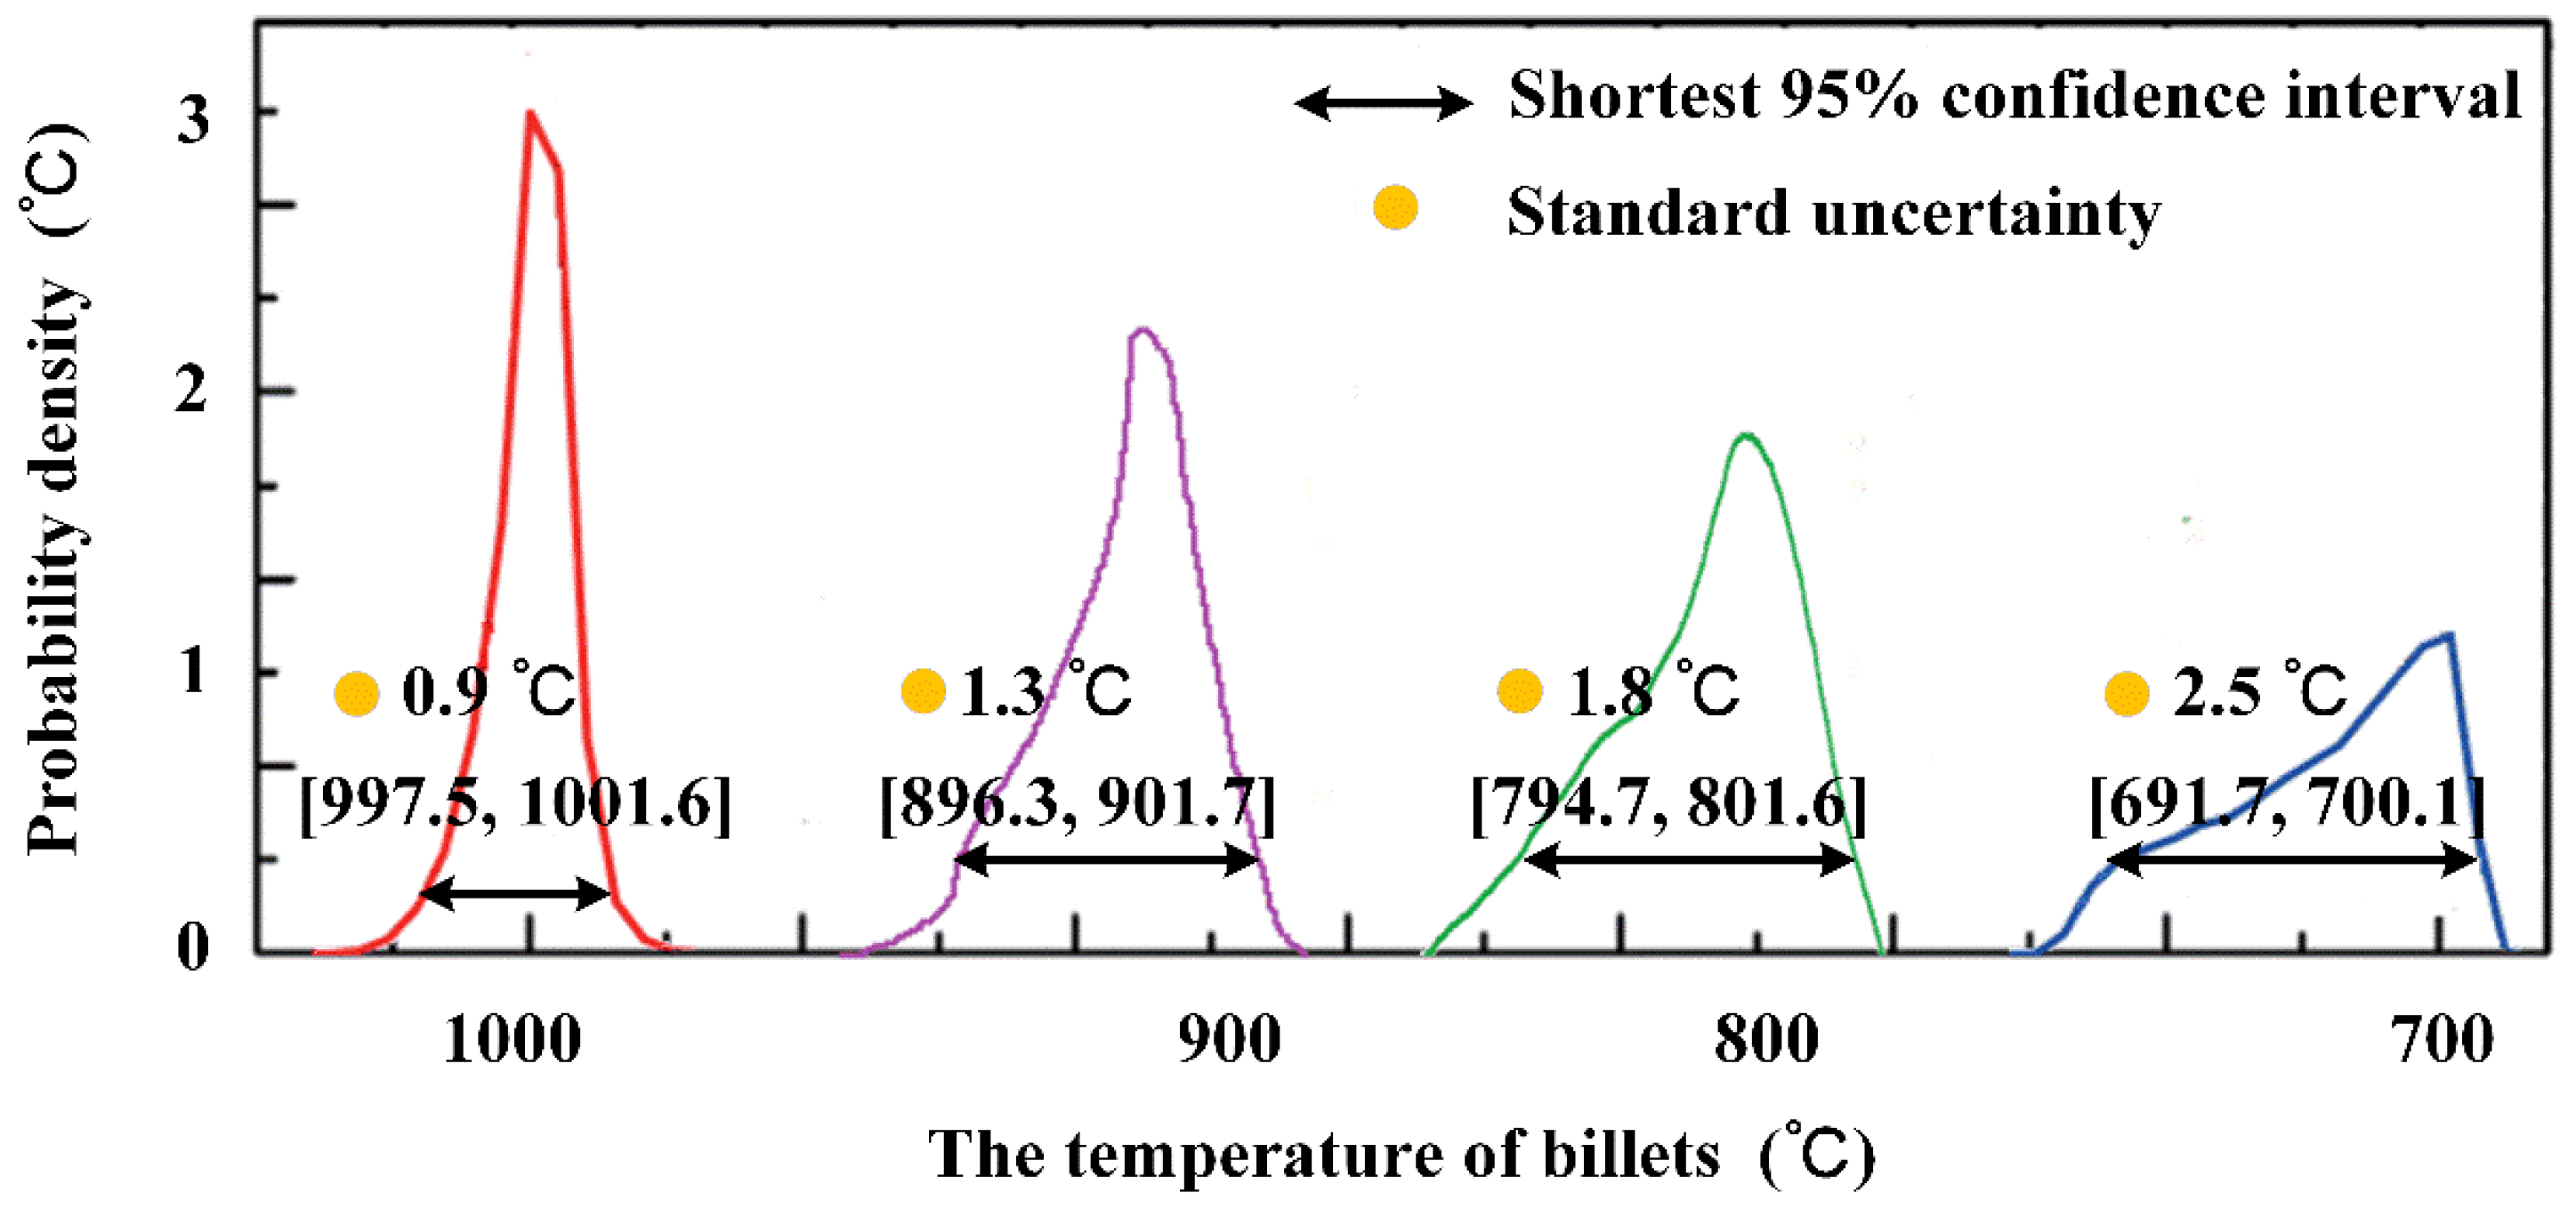
Then, we substitute the calculation results of the effective emissivity into Expressions (2)–(5) to obtain the uncertainty on temperature. In order to meet the needs of different steels, the intrinsic emissivity of the surface (ε1, ε2) is regarded as the uncertainty parameter with a value range of 0.3–1 (rectangular distribution).
Figure 10 shows the probability distribution functions (pdfs) of measurement results by the Monte Carlo method at 700–1000 °C. The standard uncertainty is between 0.9 and 2.5 °C.
5. Application of the Pyrometer in Medium Plate Rolling Process
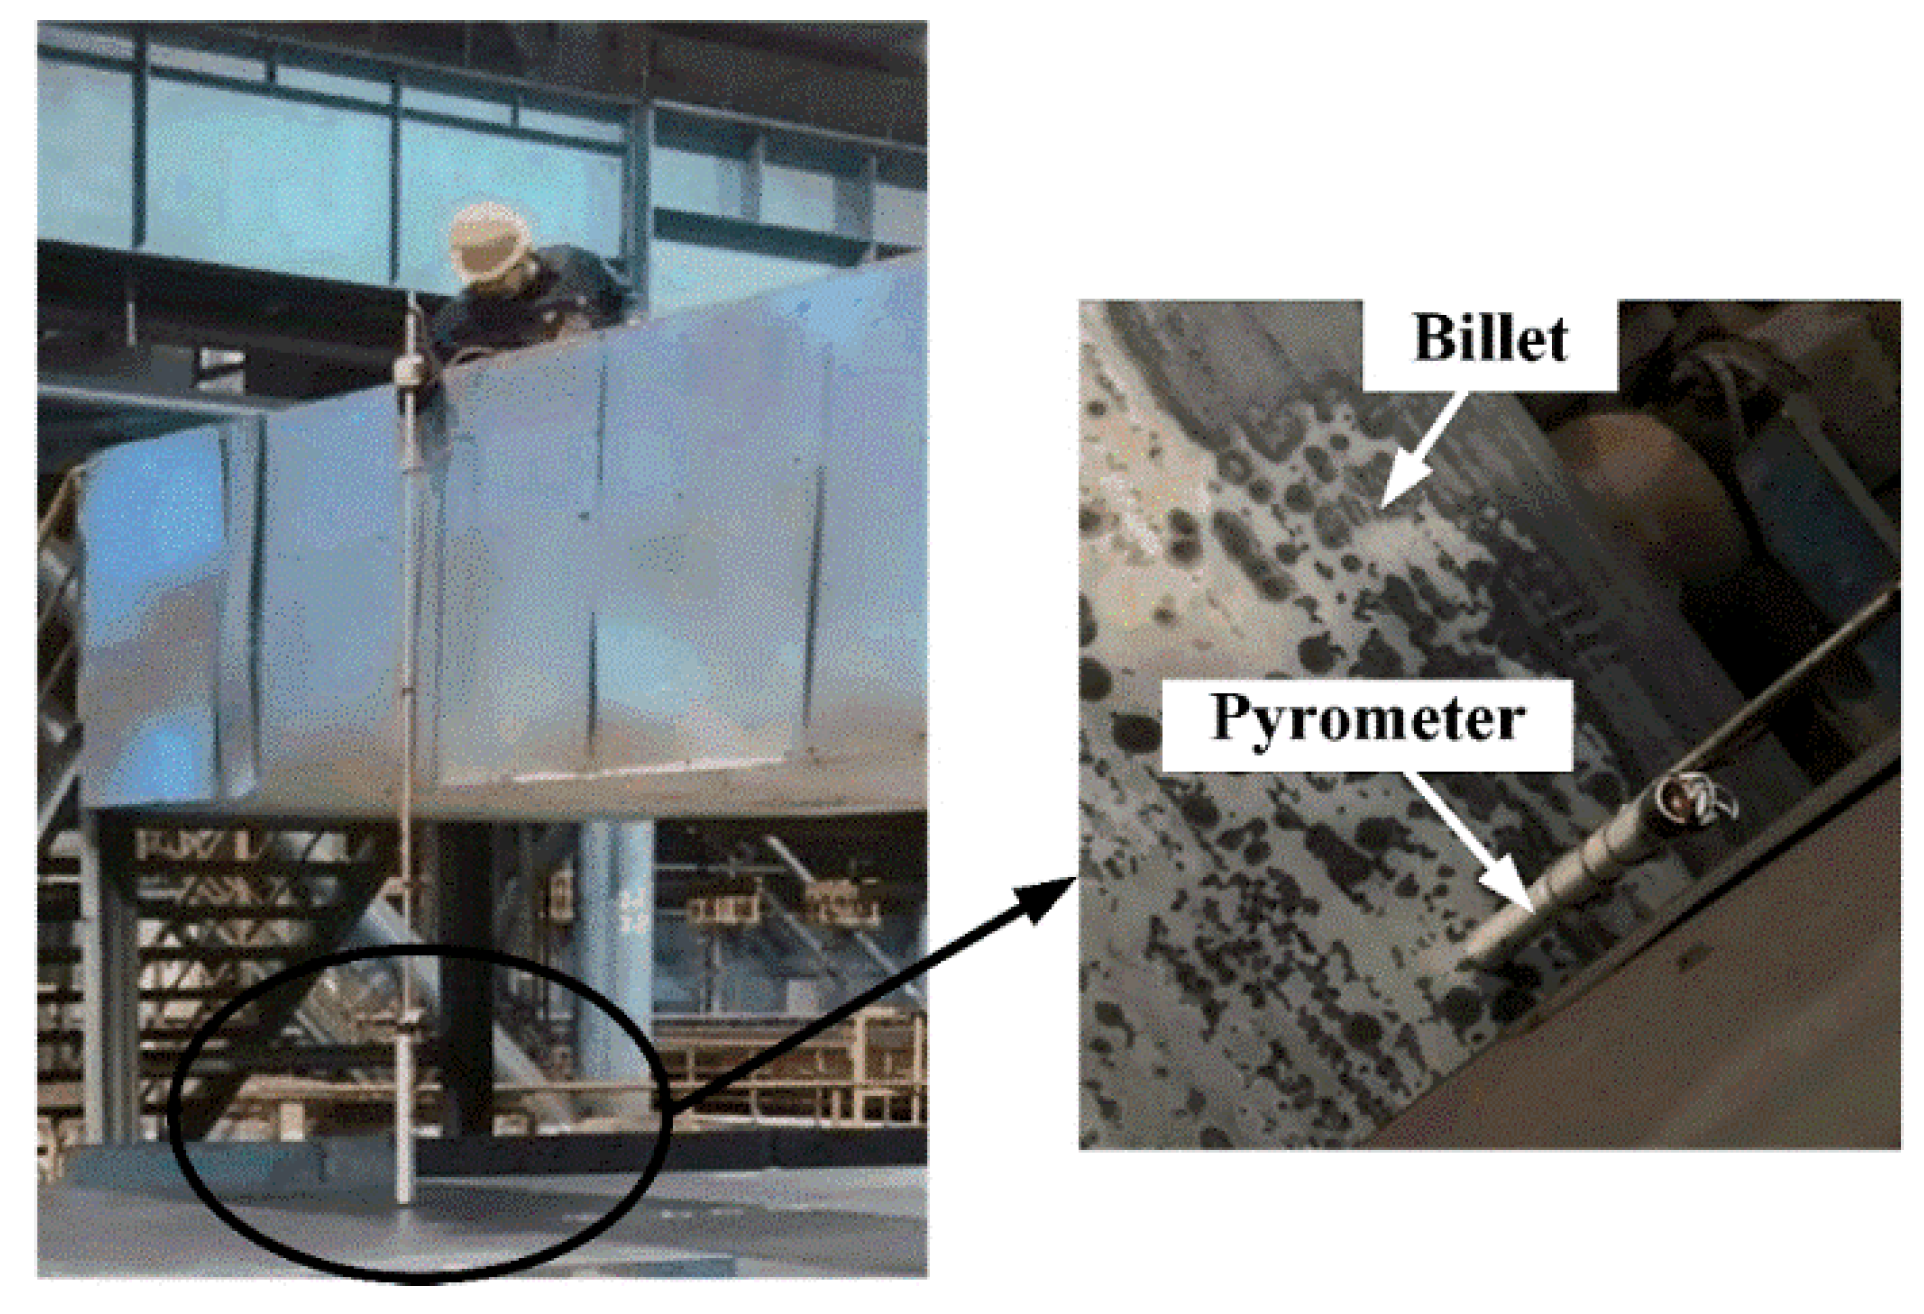
In addition to the experiments carried out in the laboratory, we install the pyrometer for measurement in the medium plate rolling process, as shown in
Figure 11. At the same time, we also use a handheld thermal imager for comparison at the same measurement point. The emissivity of the thermal imager is set to 0.85. In
Figure 11, oxide scales are irregularly distributed on the surface due to the dephosphorization, so the emissivity of each position is also different.
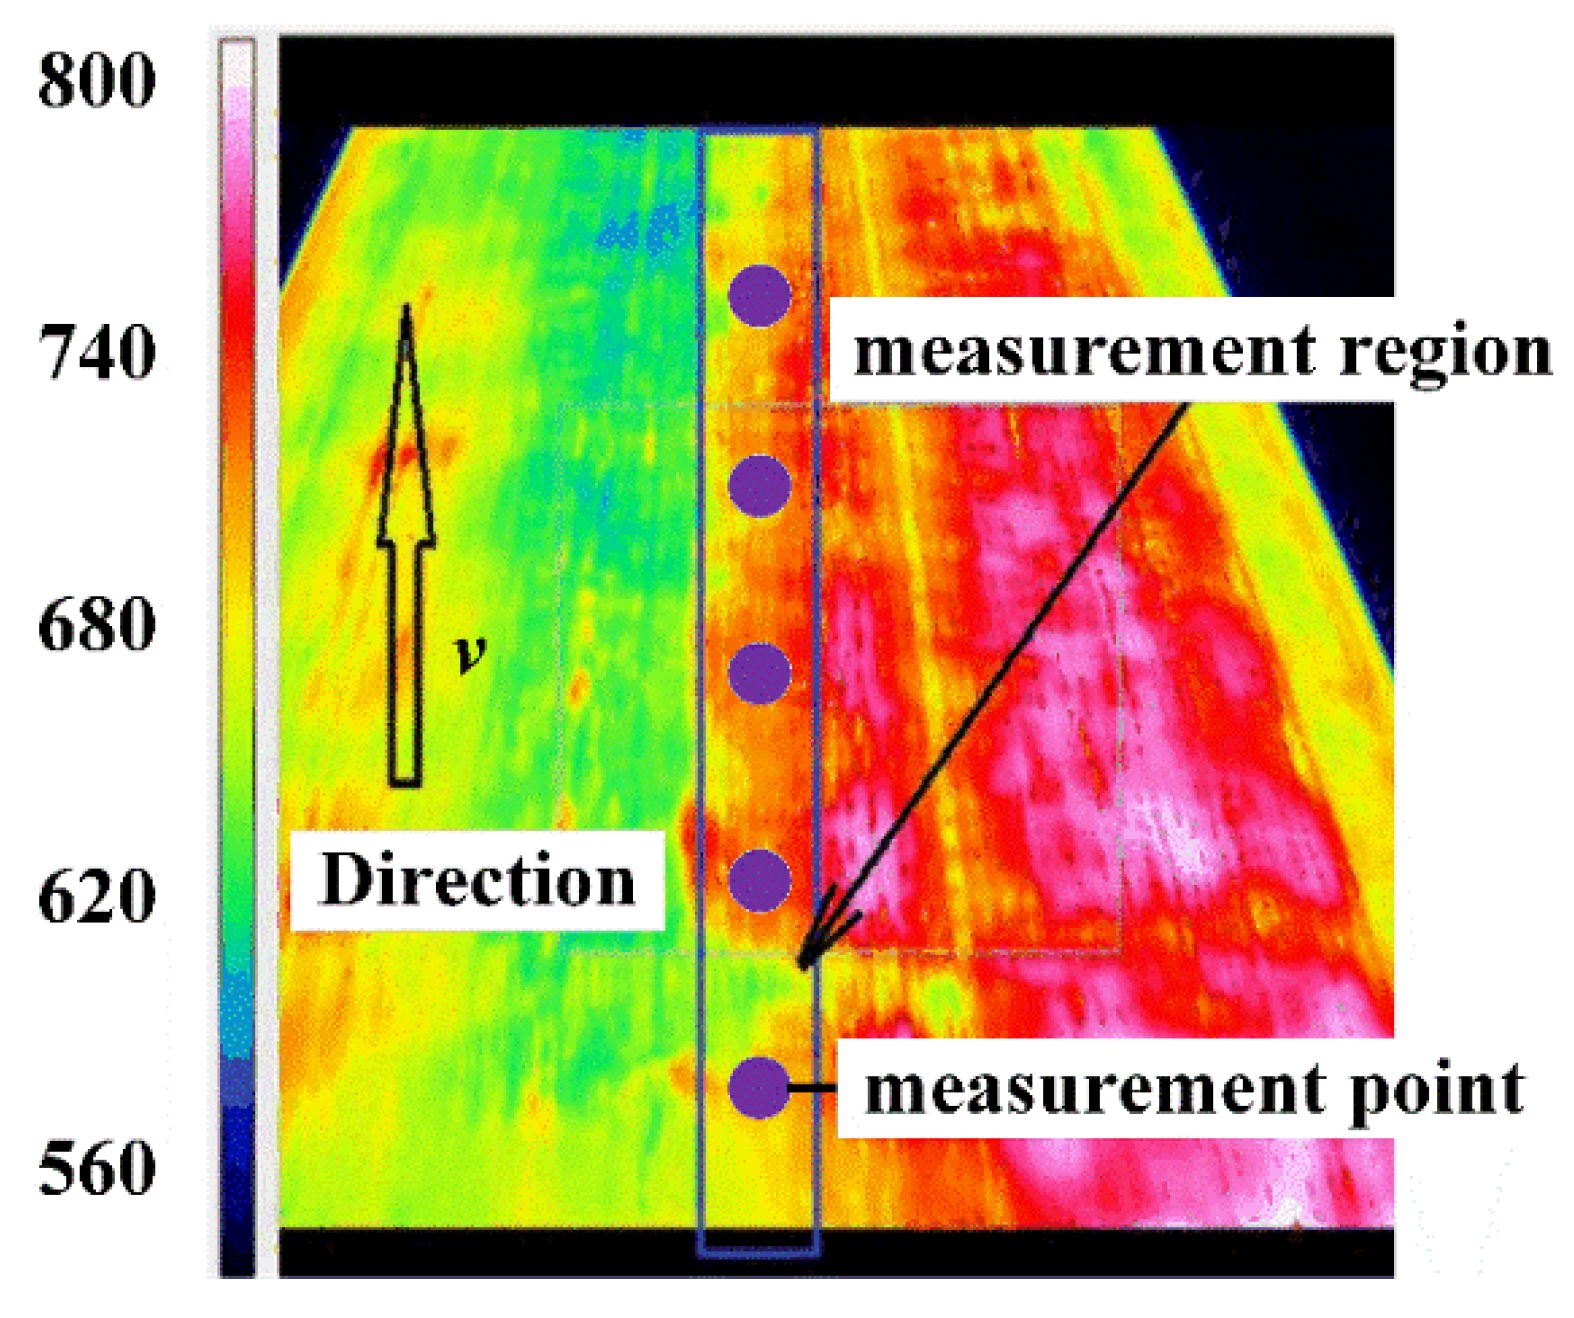
Figure 12 is the temperature distribution measured by the thermal imager. The temperature of the billet is measured by the pyrometer along its moving direction. We fetch the temperature at the measurement point as the results of the thermal imager. We select 5 billets and measure a total of 32 measurement points. Temperature data of the pyrometer and thermal imager are depicted in
Figure 13. Red and blue points with the same abscissa represent the results measured by the pyrometer and thermal imager at the same measurement point, respectively, and the maximum temperature difference between them can reach 20.5 °C (the maximum distance between the blue and red point at the same abscissa).
The oxide scale is unevenly distributed due to the dephosphorization of the billet surface. The emissivity of the surface is between 0.3 and 1. However, the thermal imager always defaults to an emissivity of 0.85. The difference in emissivity leads to a great difference in the measurement results. Because the emissivities of oxide scales and steel are different, the method of setting the emissivity to 0.85 has a greater error. Comparatively, the pyrometer can calculate the real-time emissivity of each point, and the outputs are closer to the actual temperature of the billet. This indicates that the method of emissivity measurement is very effective for reducing the measurement fluctuation and eliminating the influence of emissivity uncertainty on measurement results.

