
Effects of the Installation Location of a Dielectric Barrier Discharge Plasma Actuator on the Active Passage Vortex Control of a Turbine Cascade at Low Reynolds Numbers


Abstract
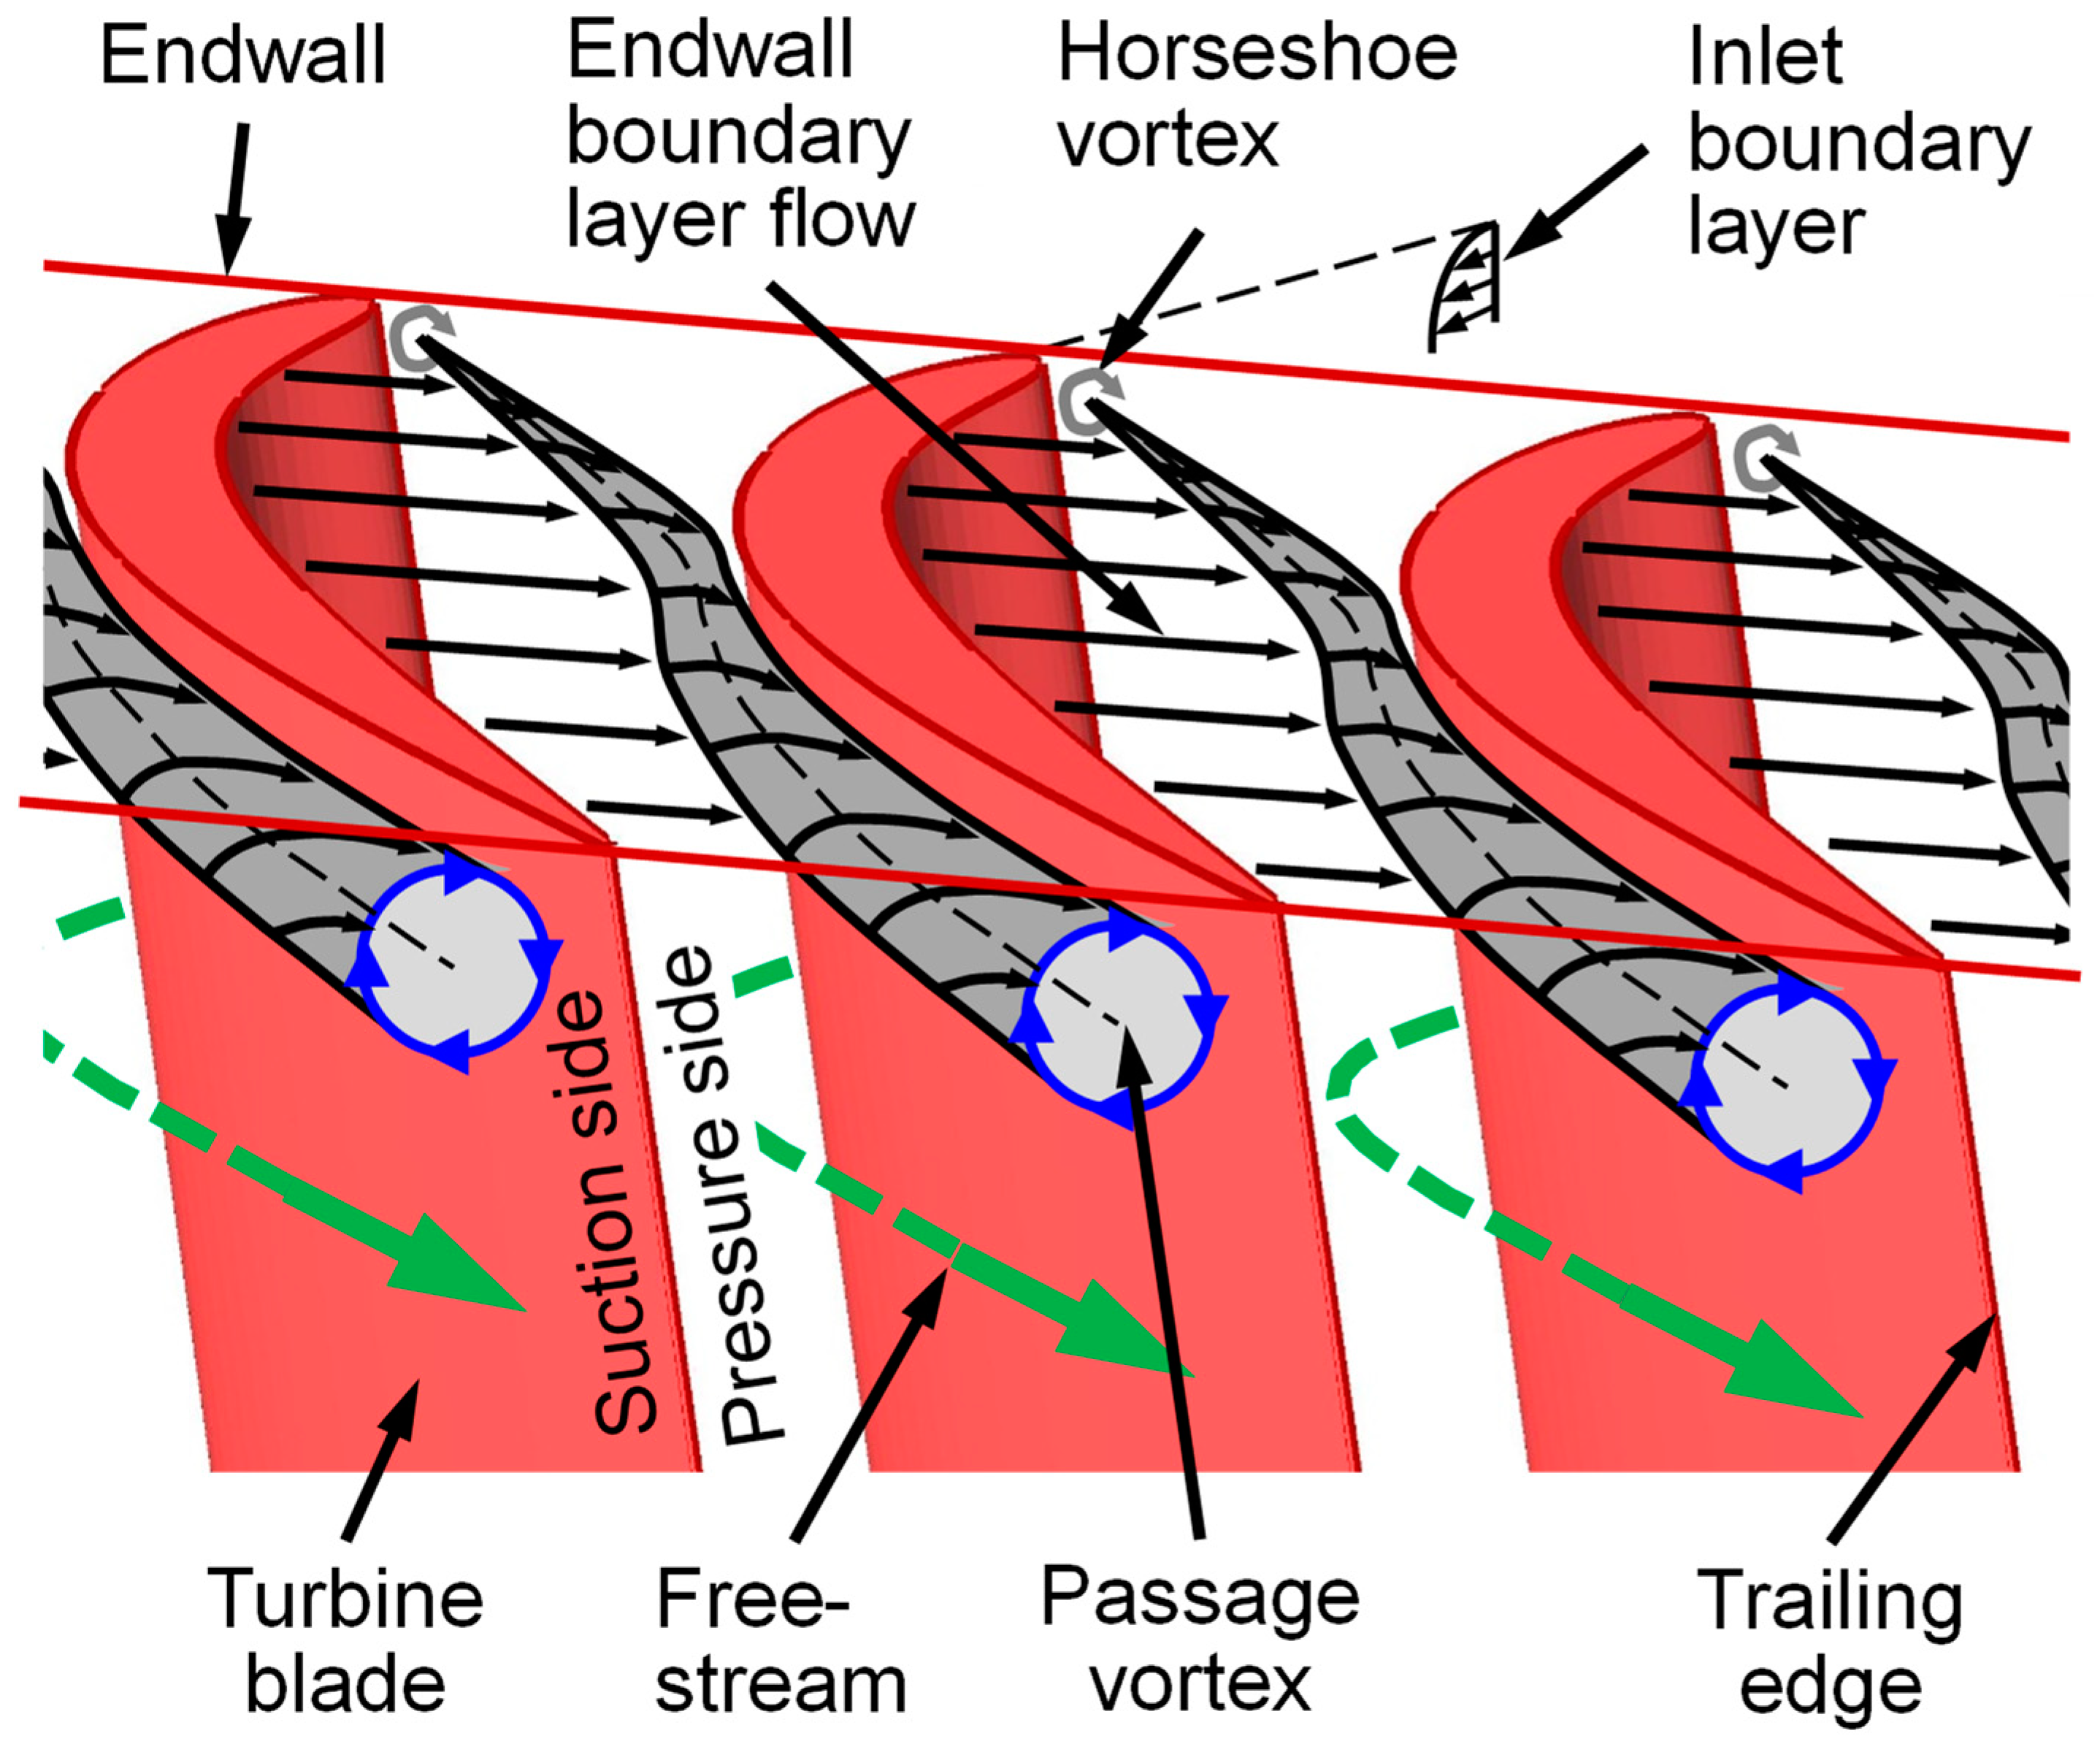
1. Introduction
2. Materials and Methods
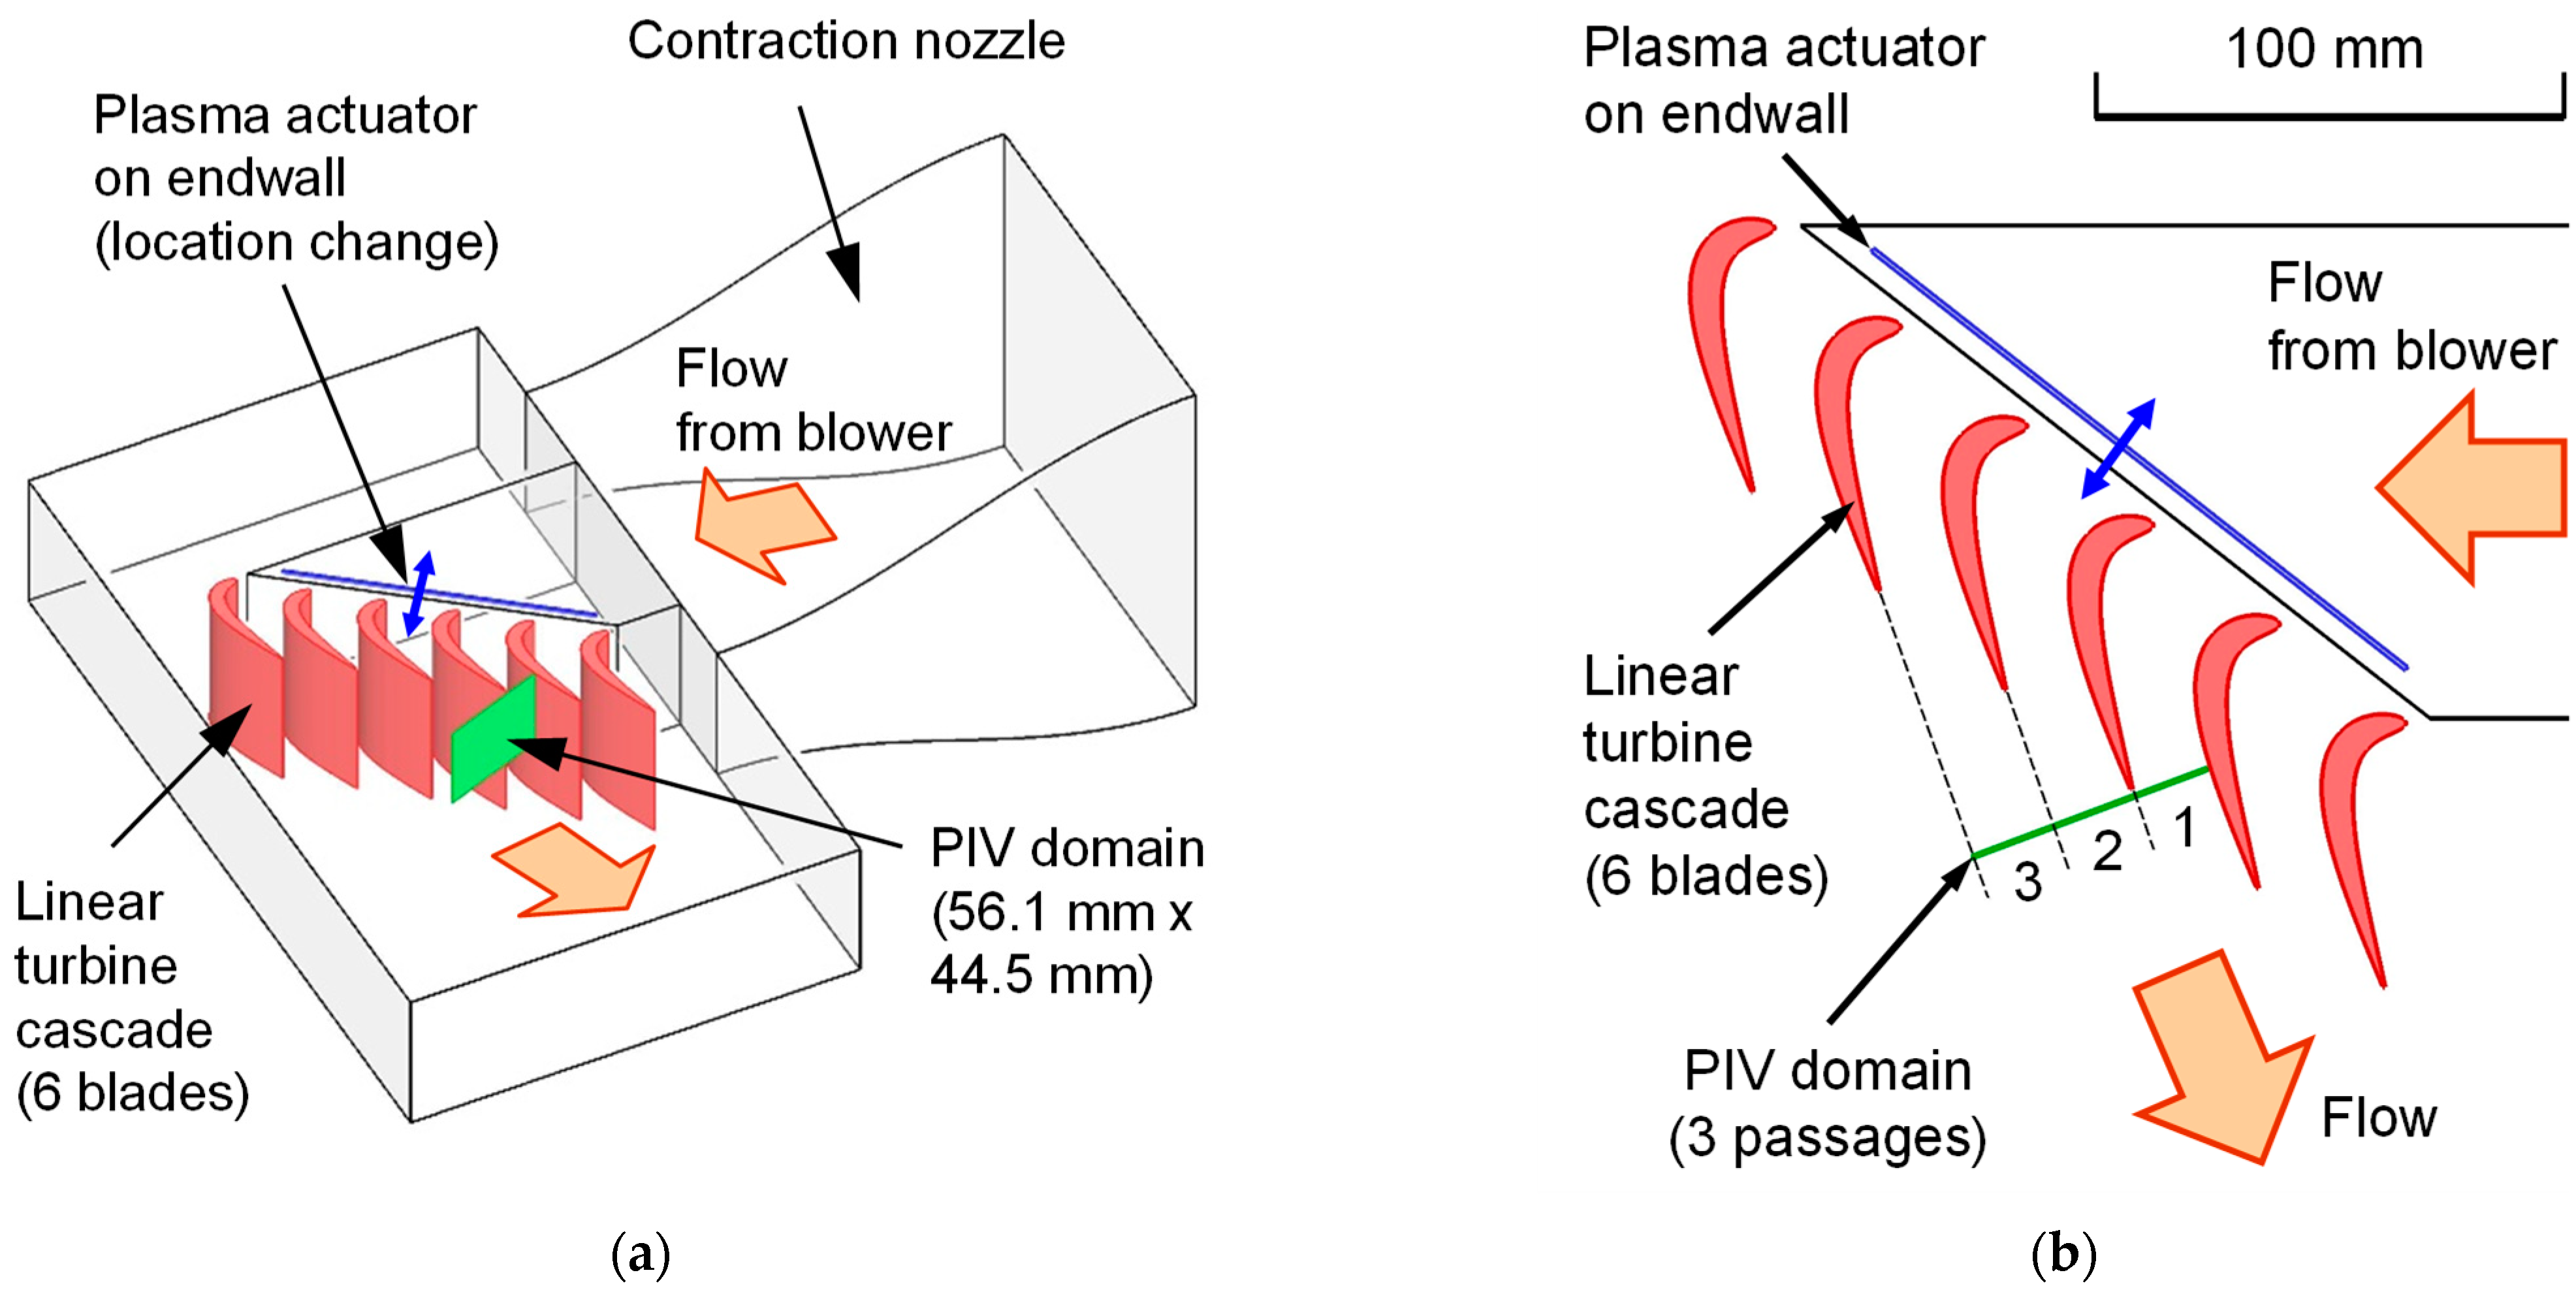
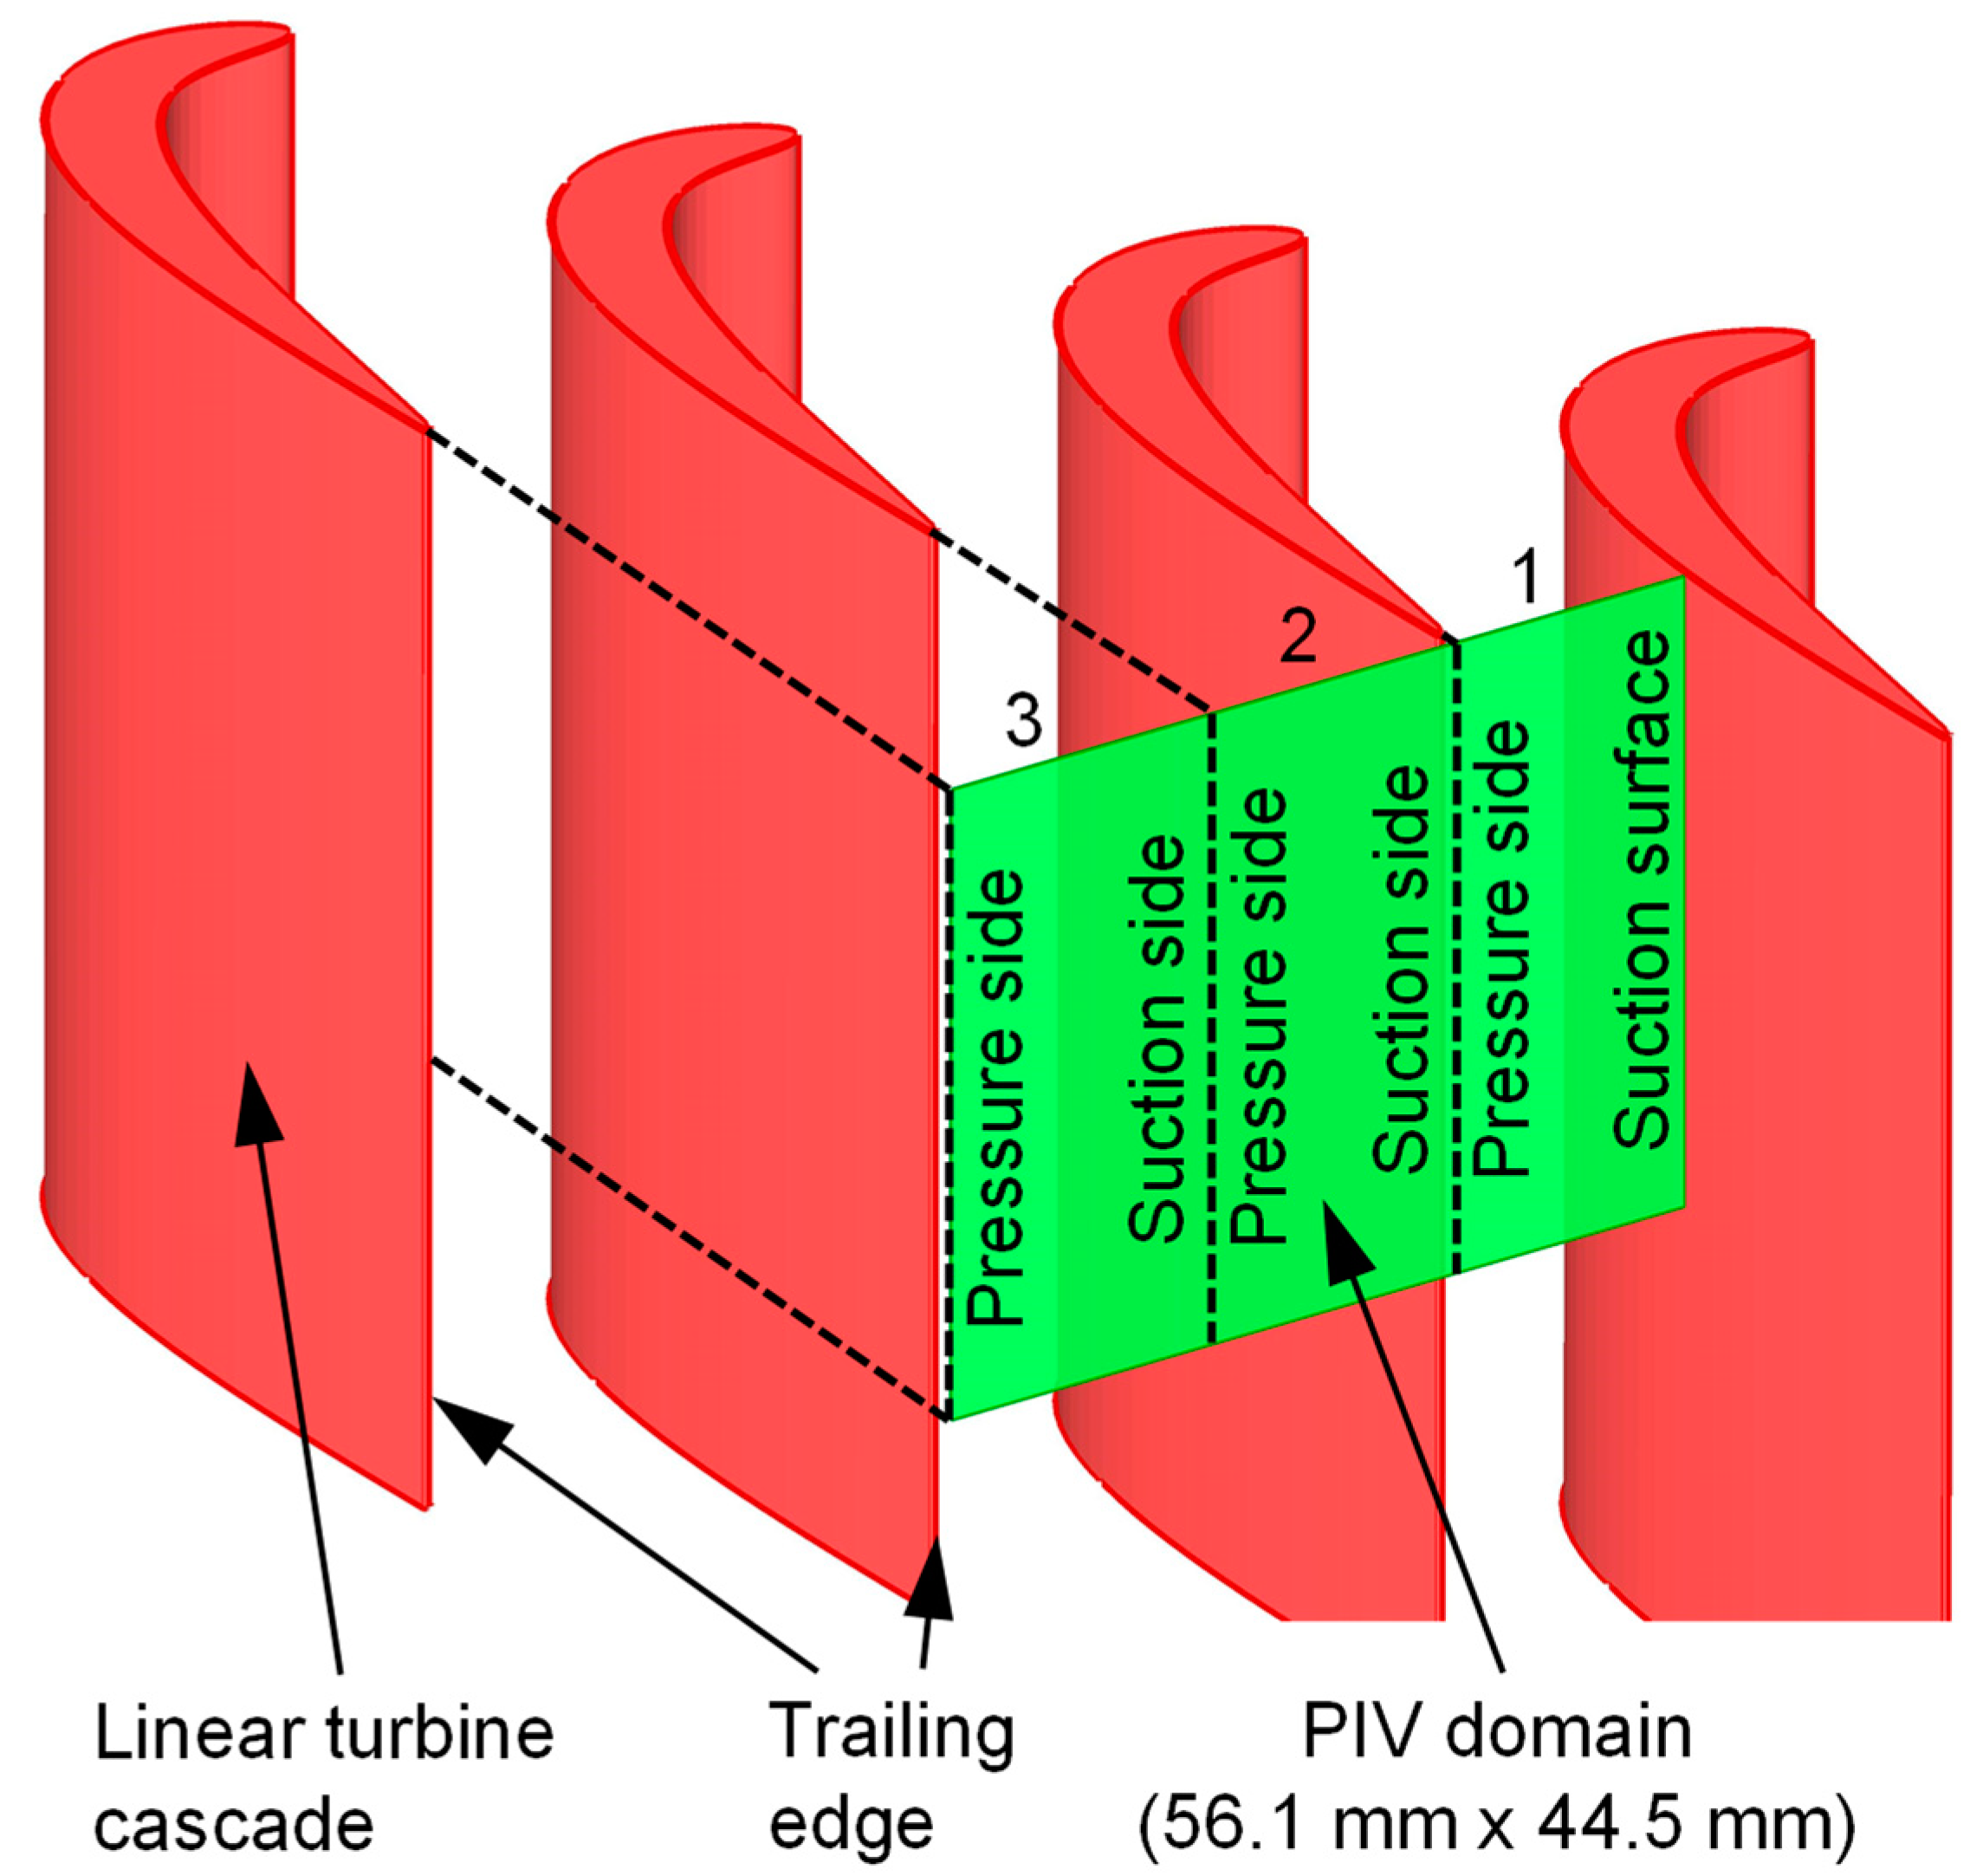
2.1. Wind Tunnel and Linear Turbine Cascade
2.2. Particle Image Velocimetry Measurements and Data Processing
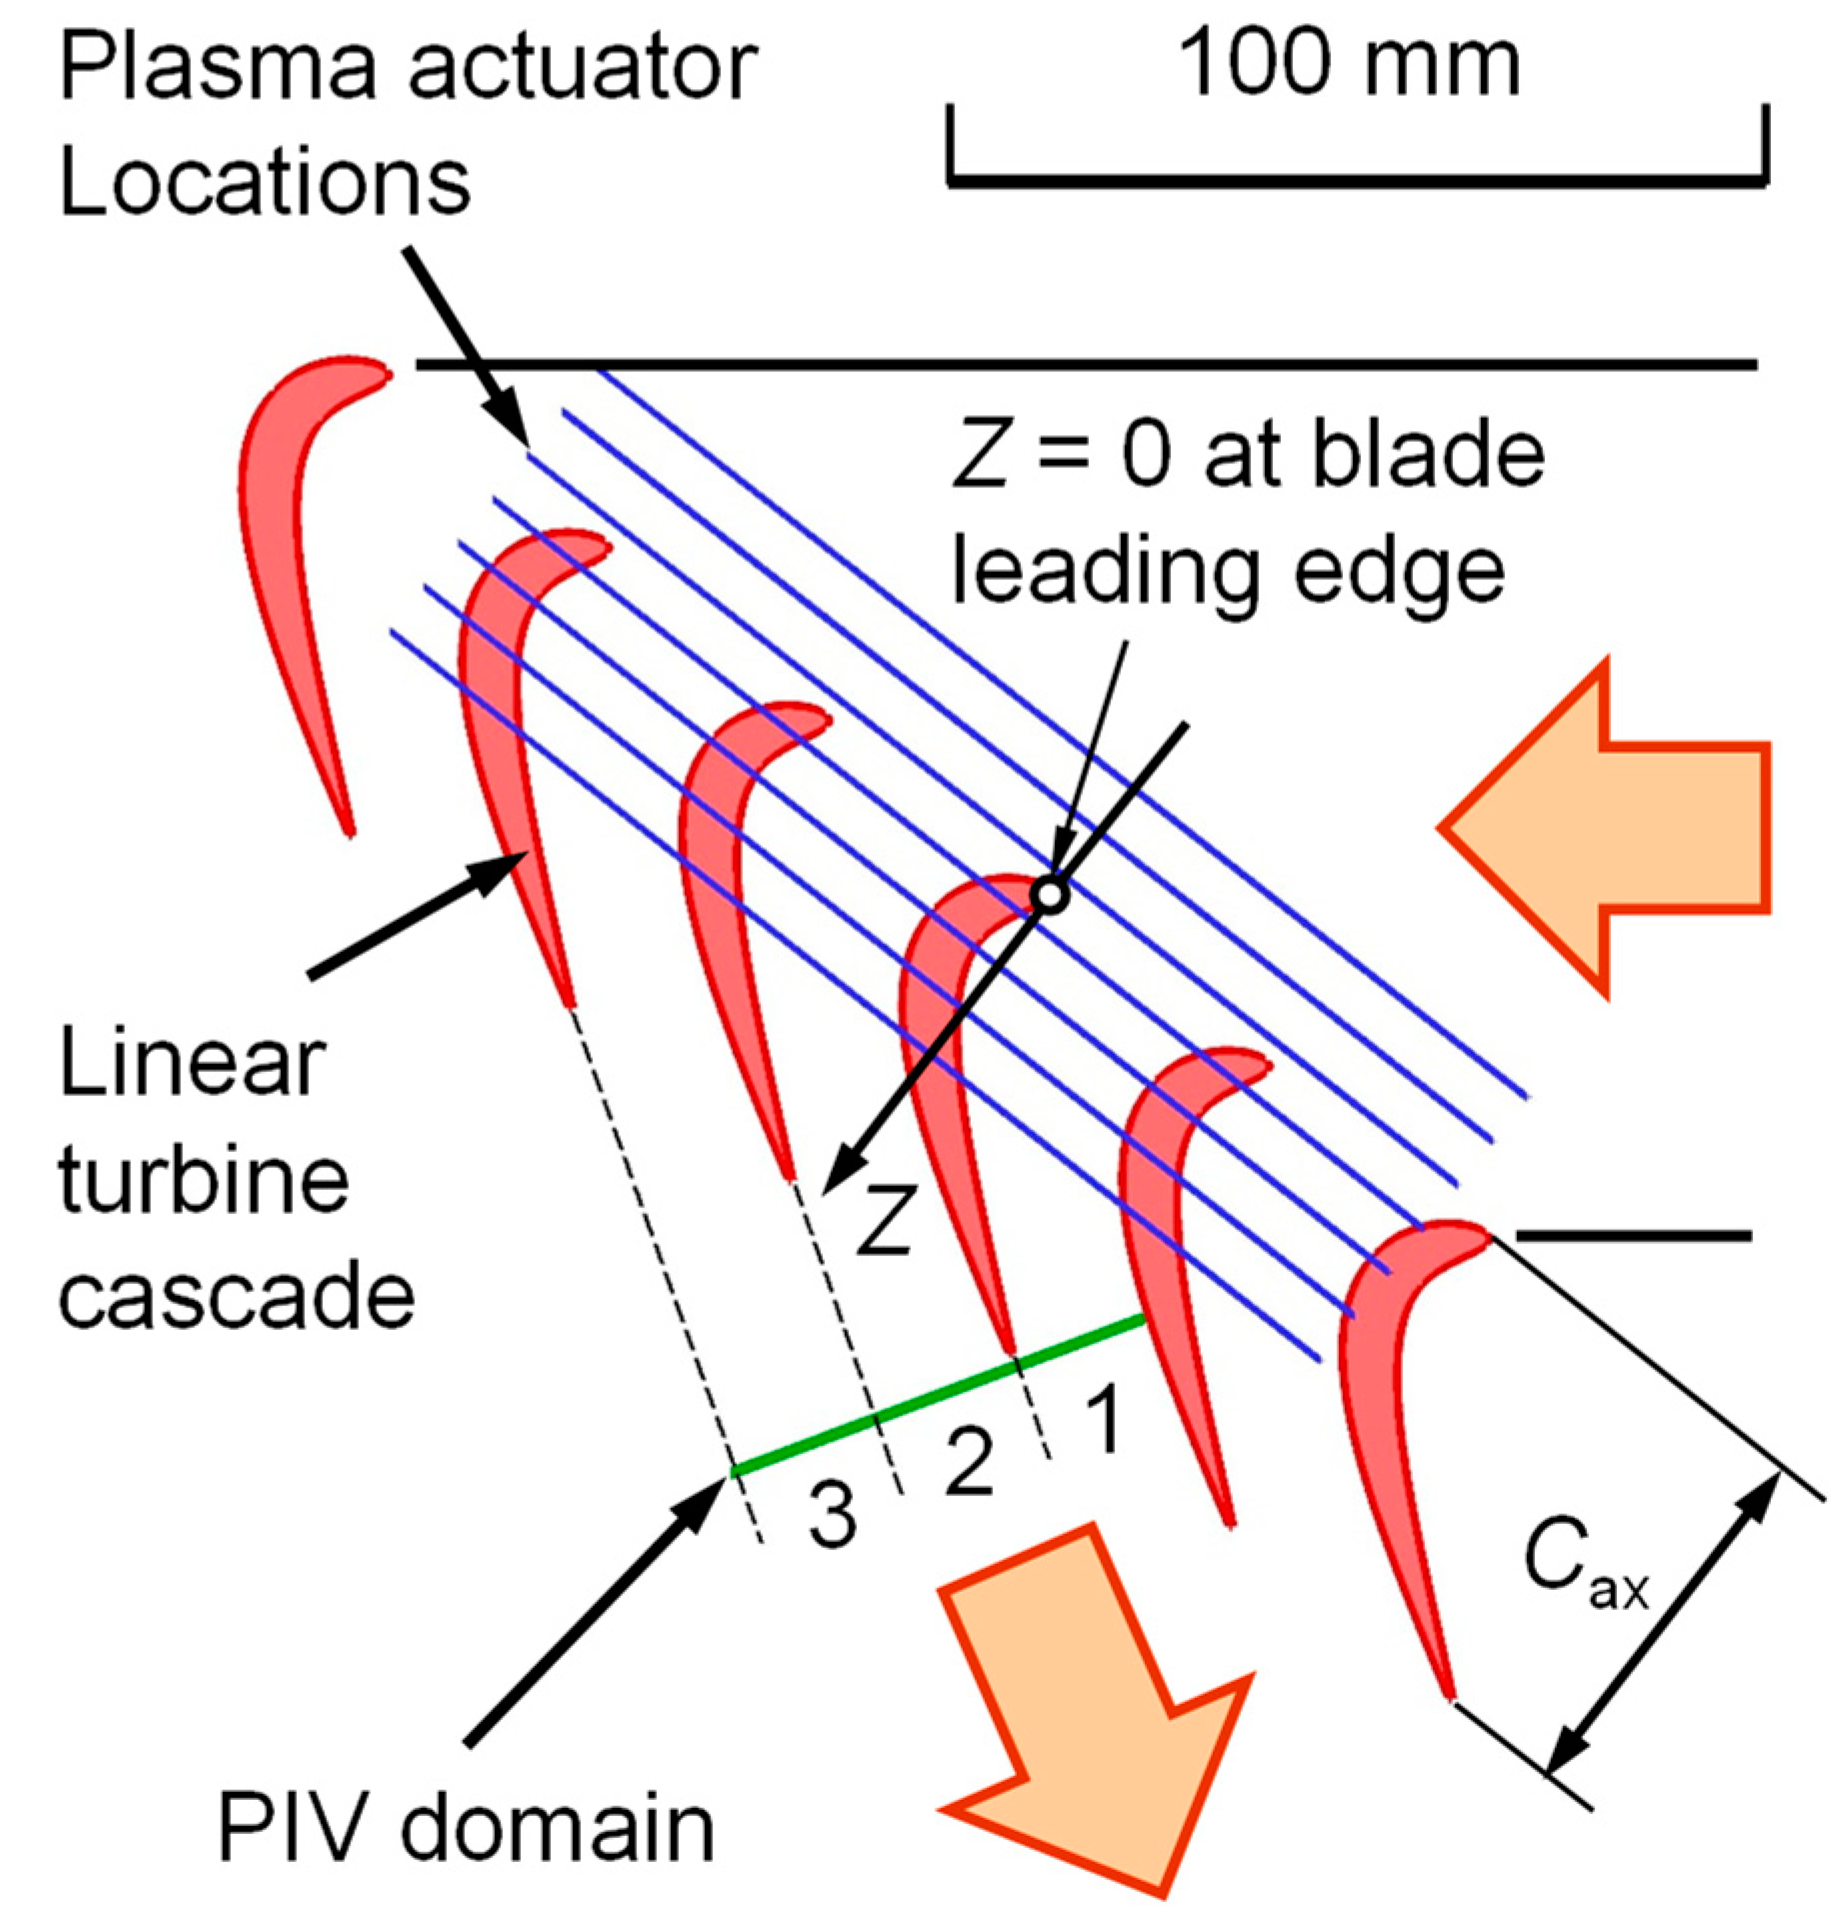
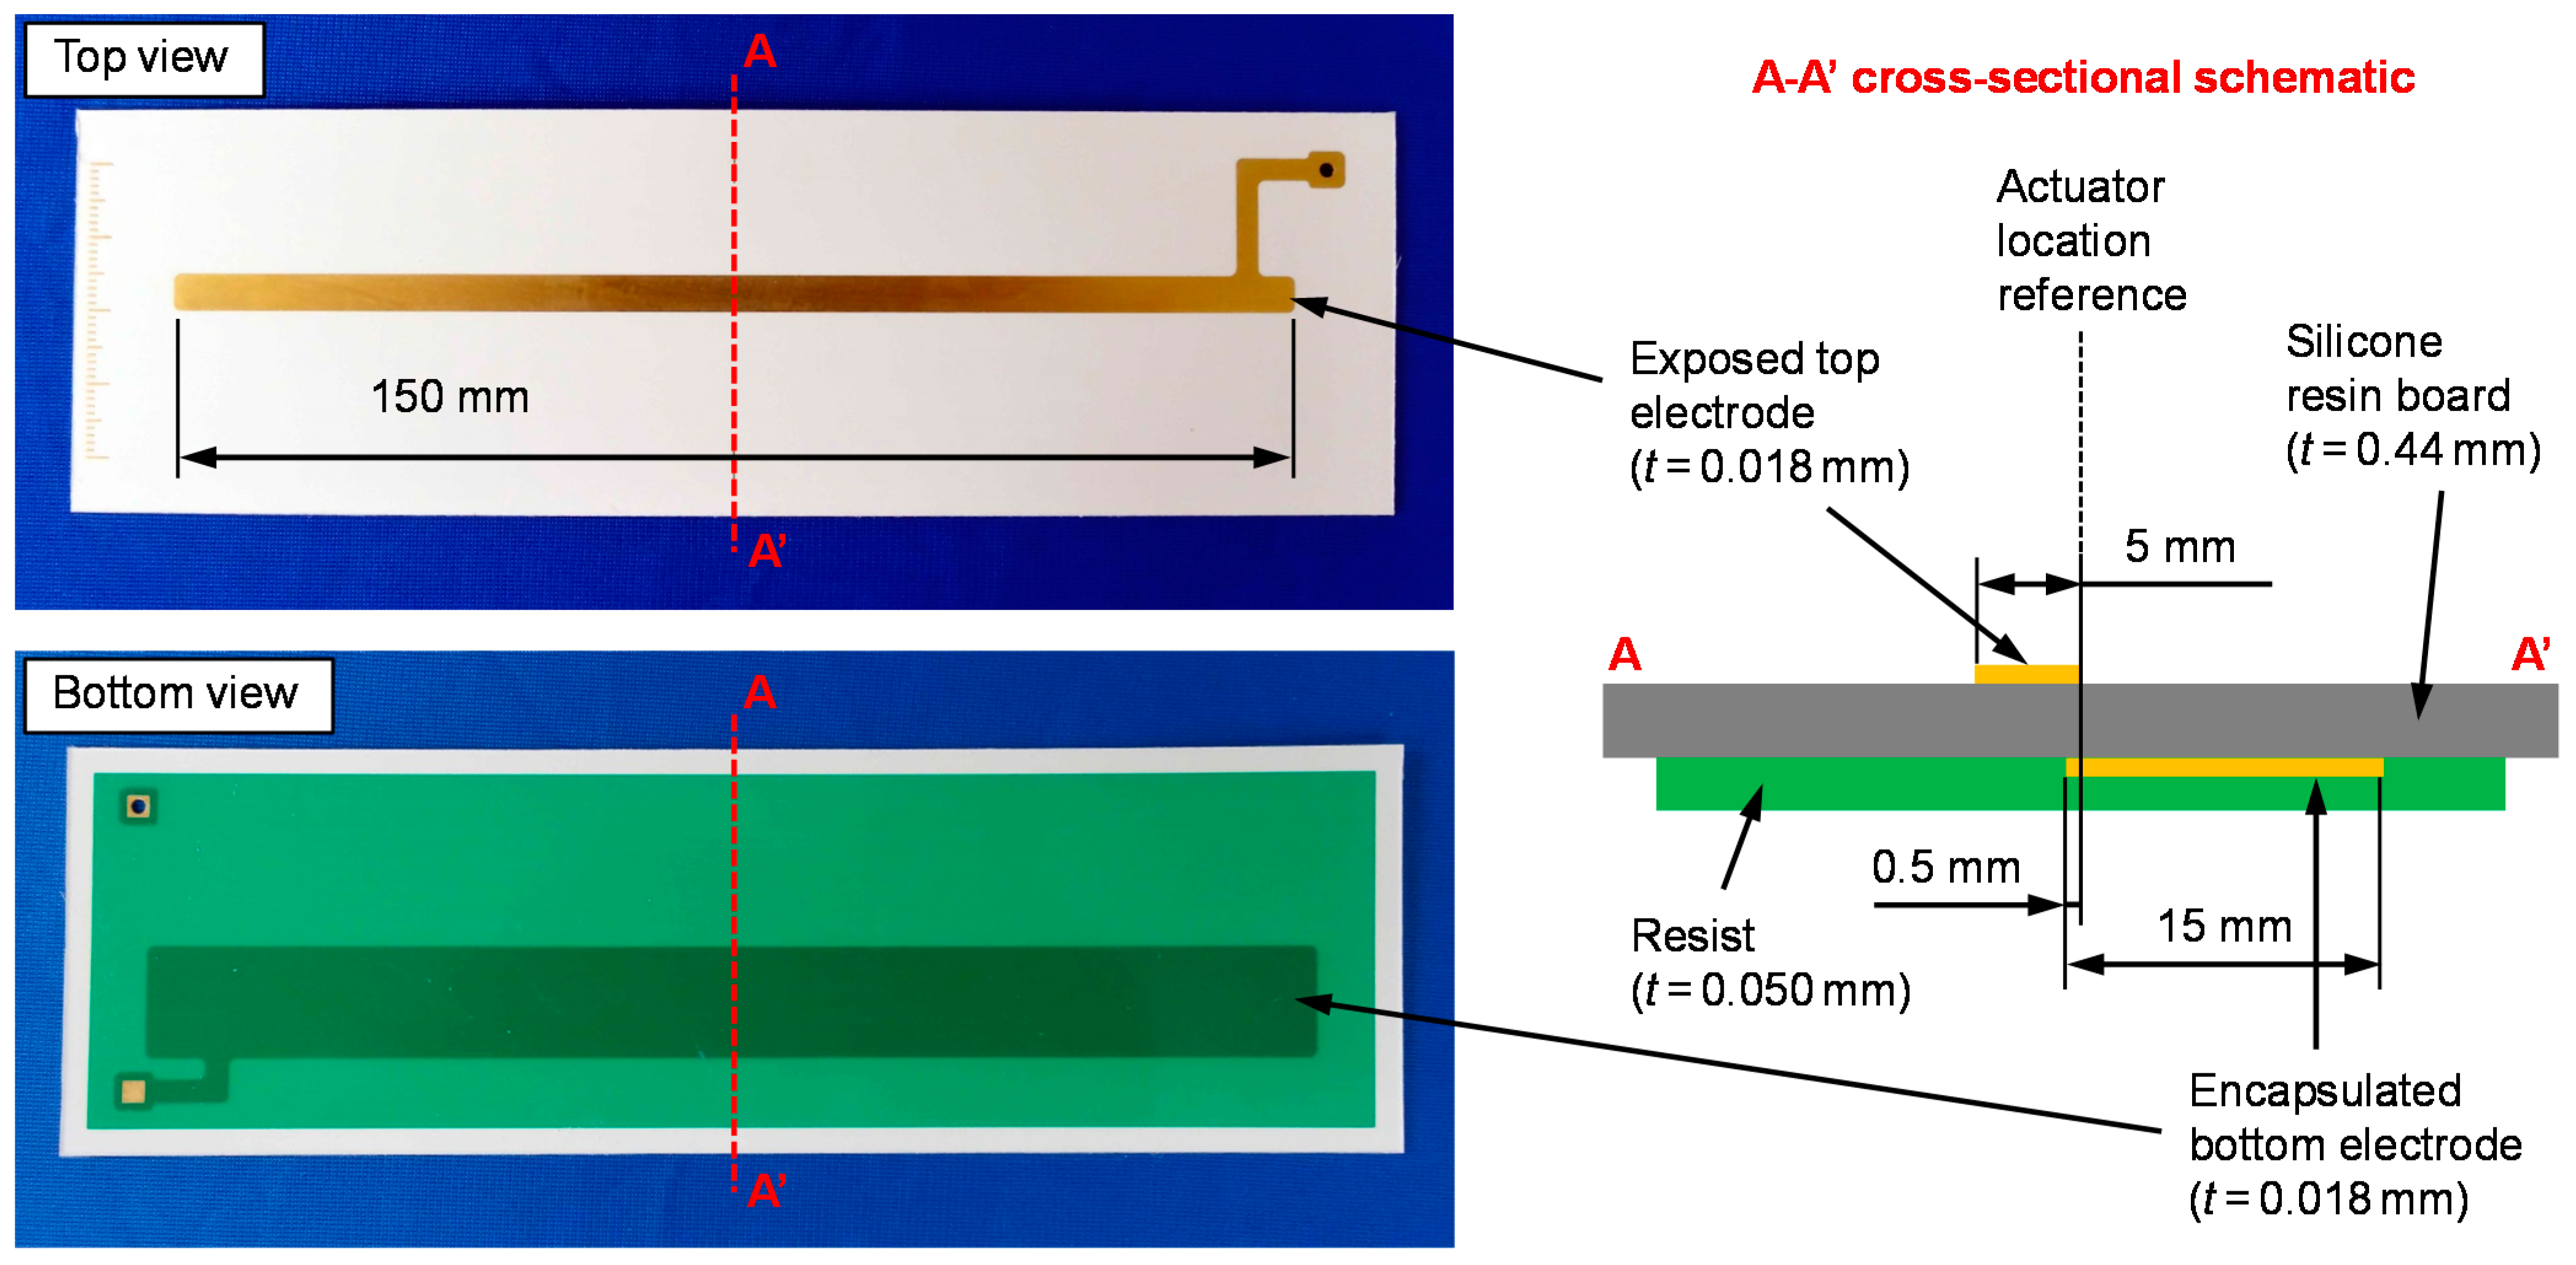
2.3. Plasma Actuator
3. Experimental Results and Discussion
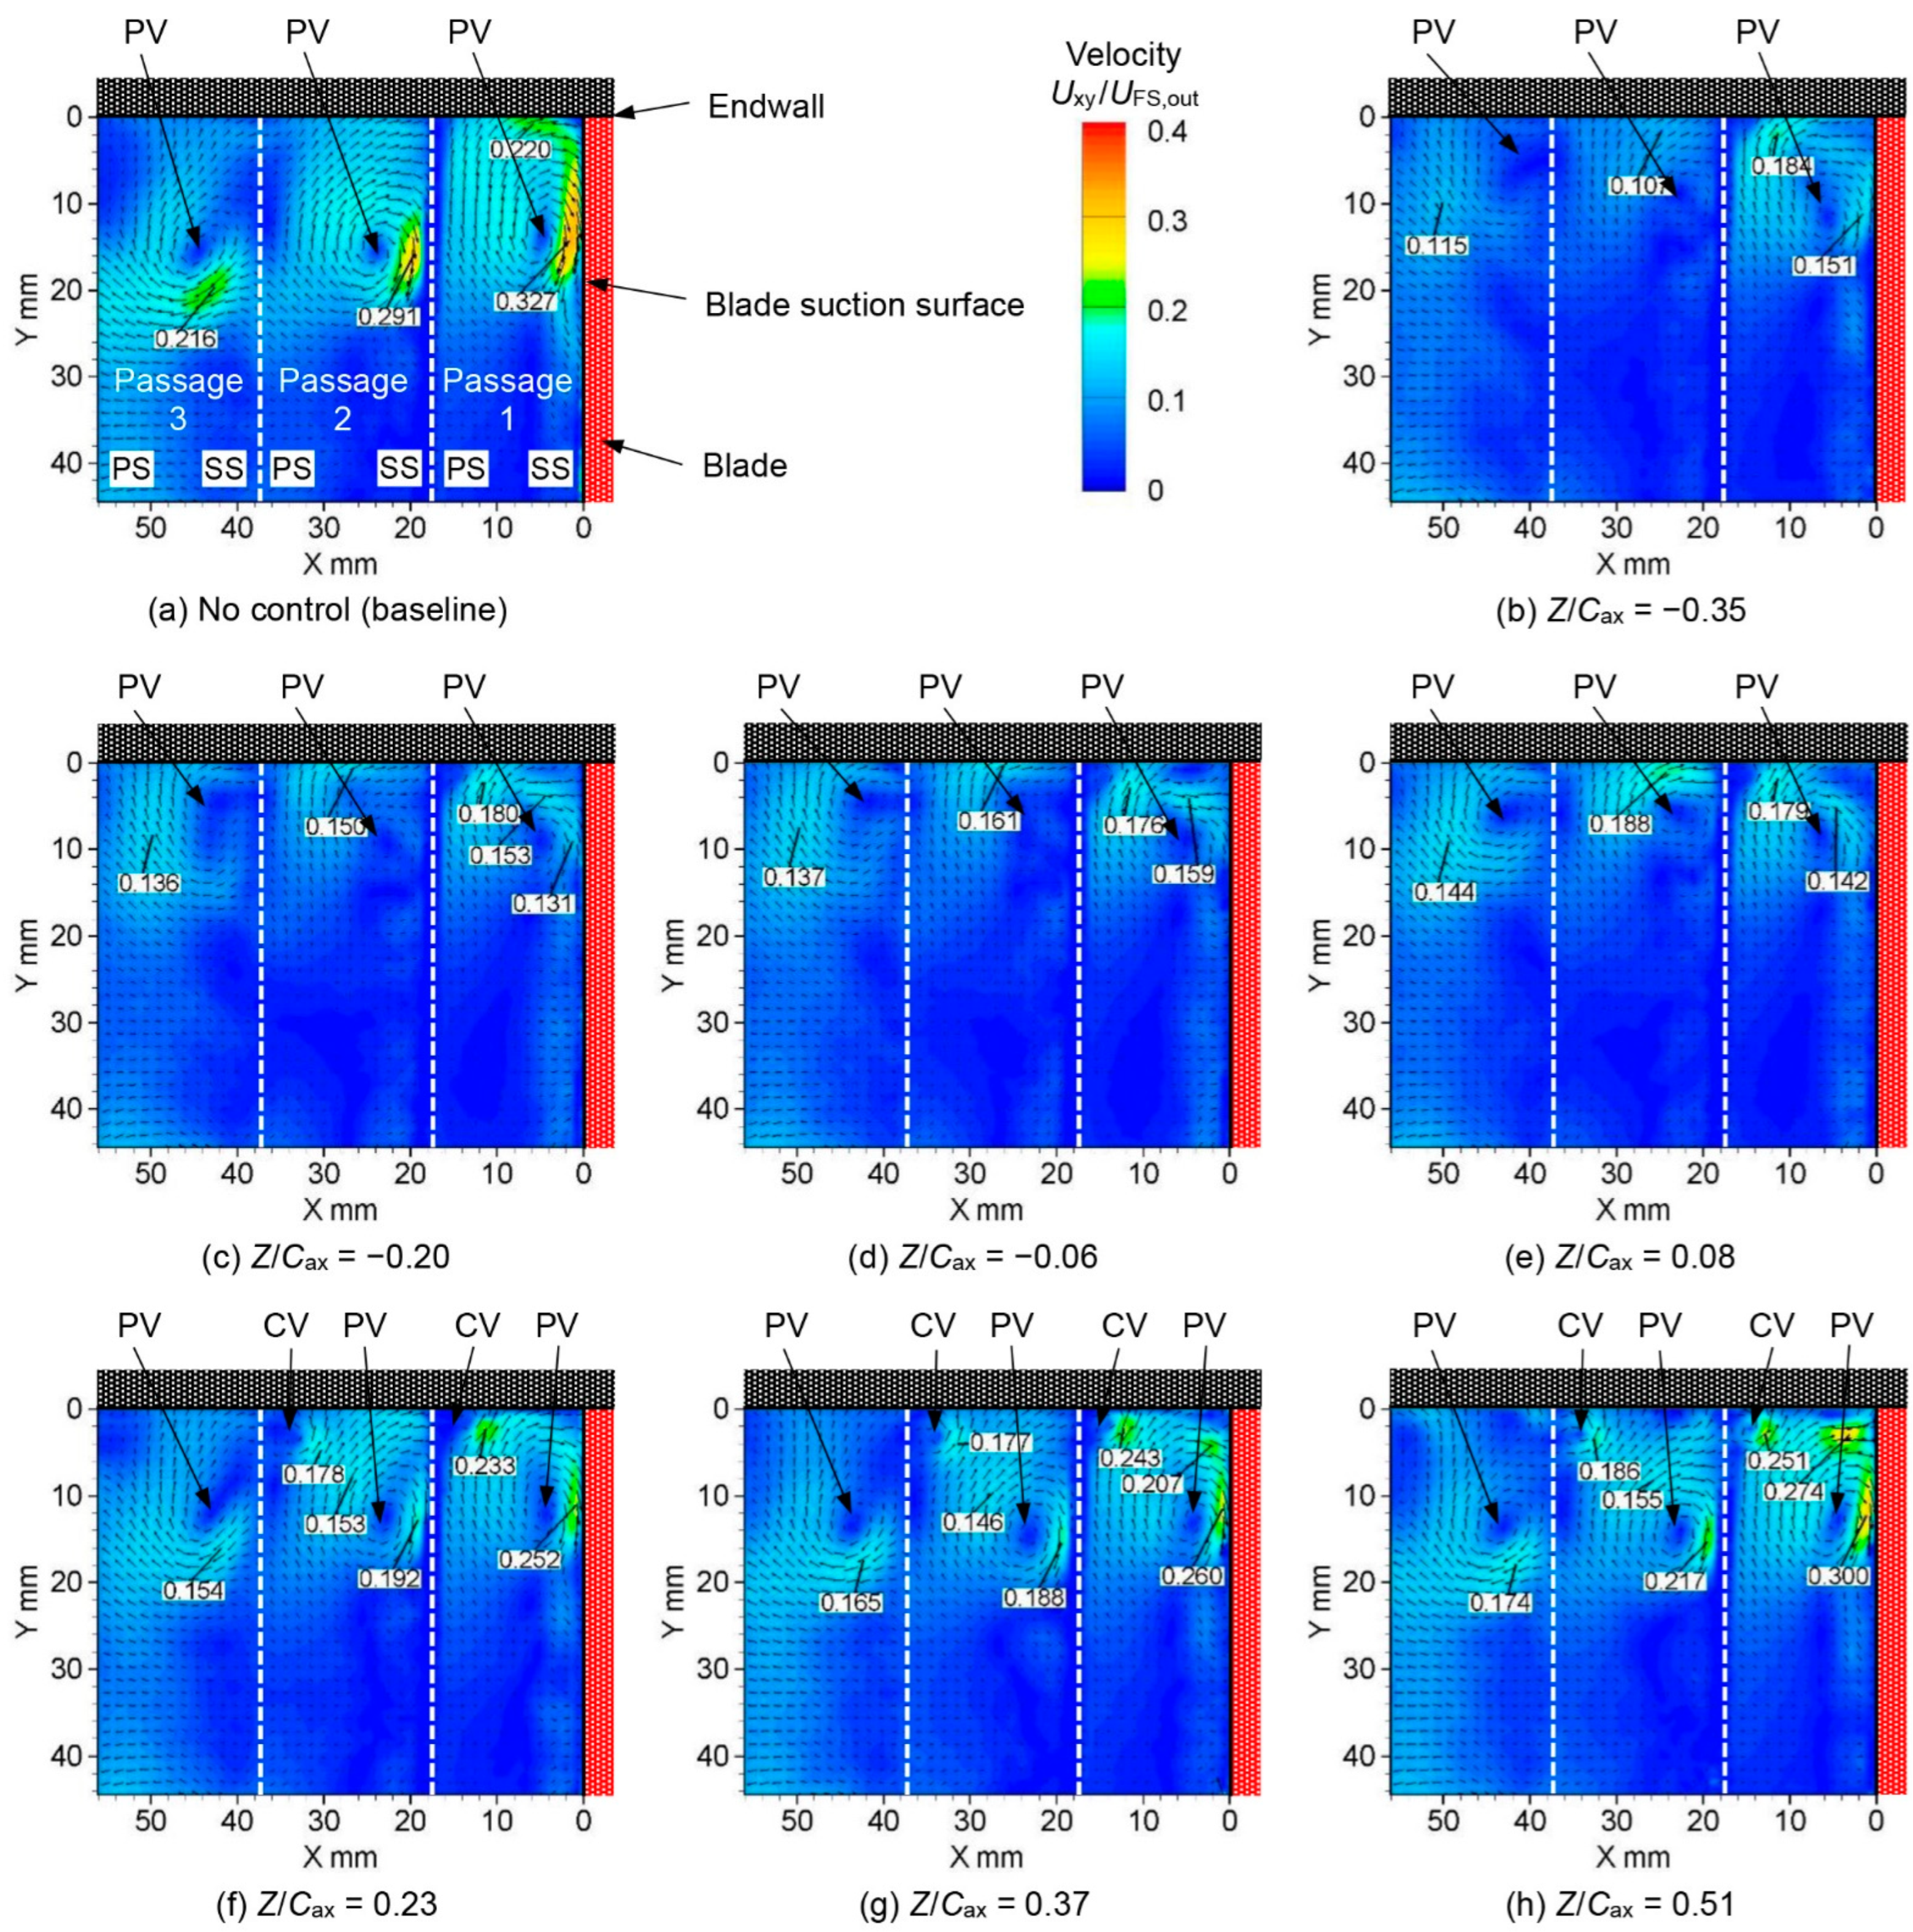
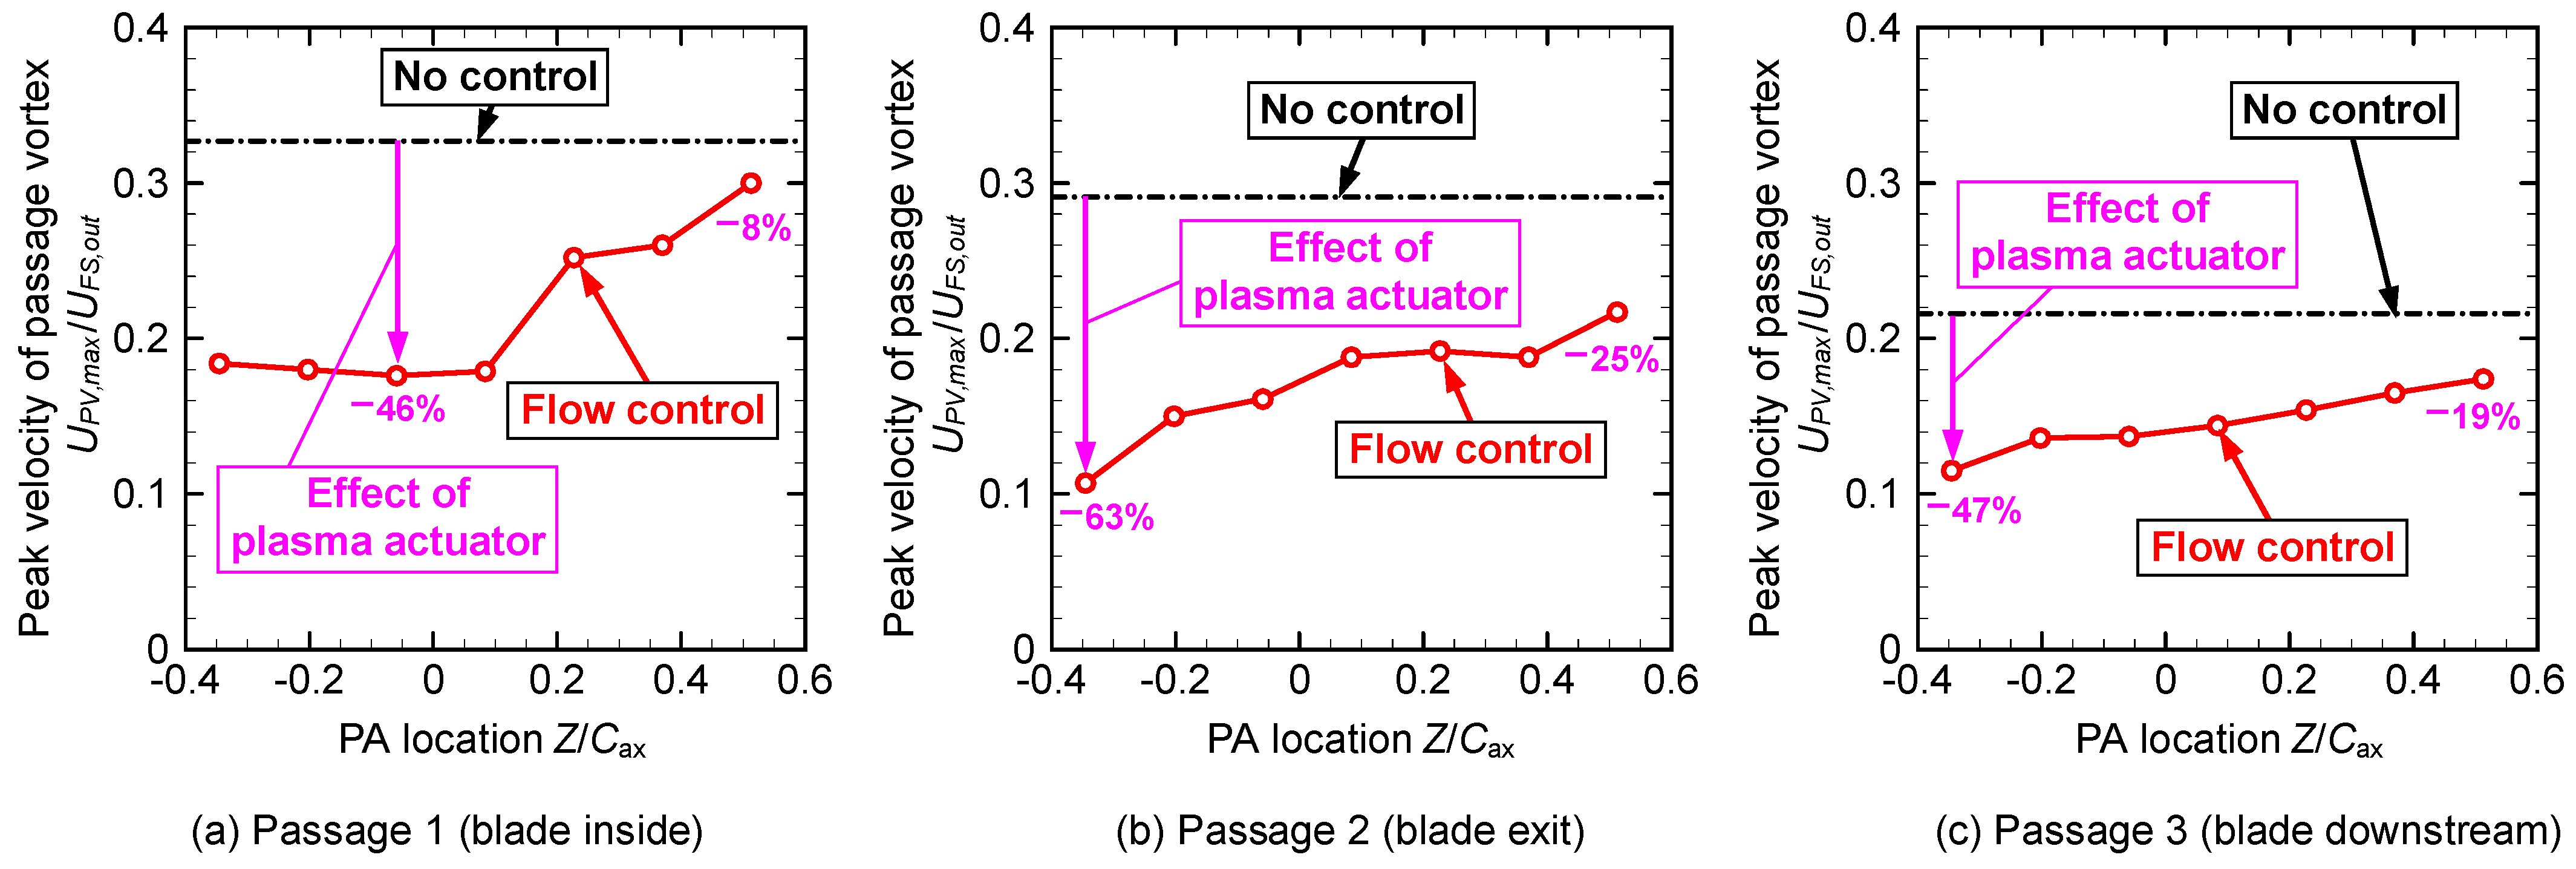
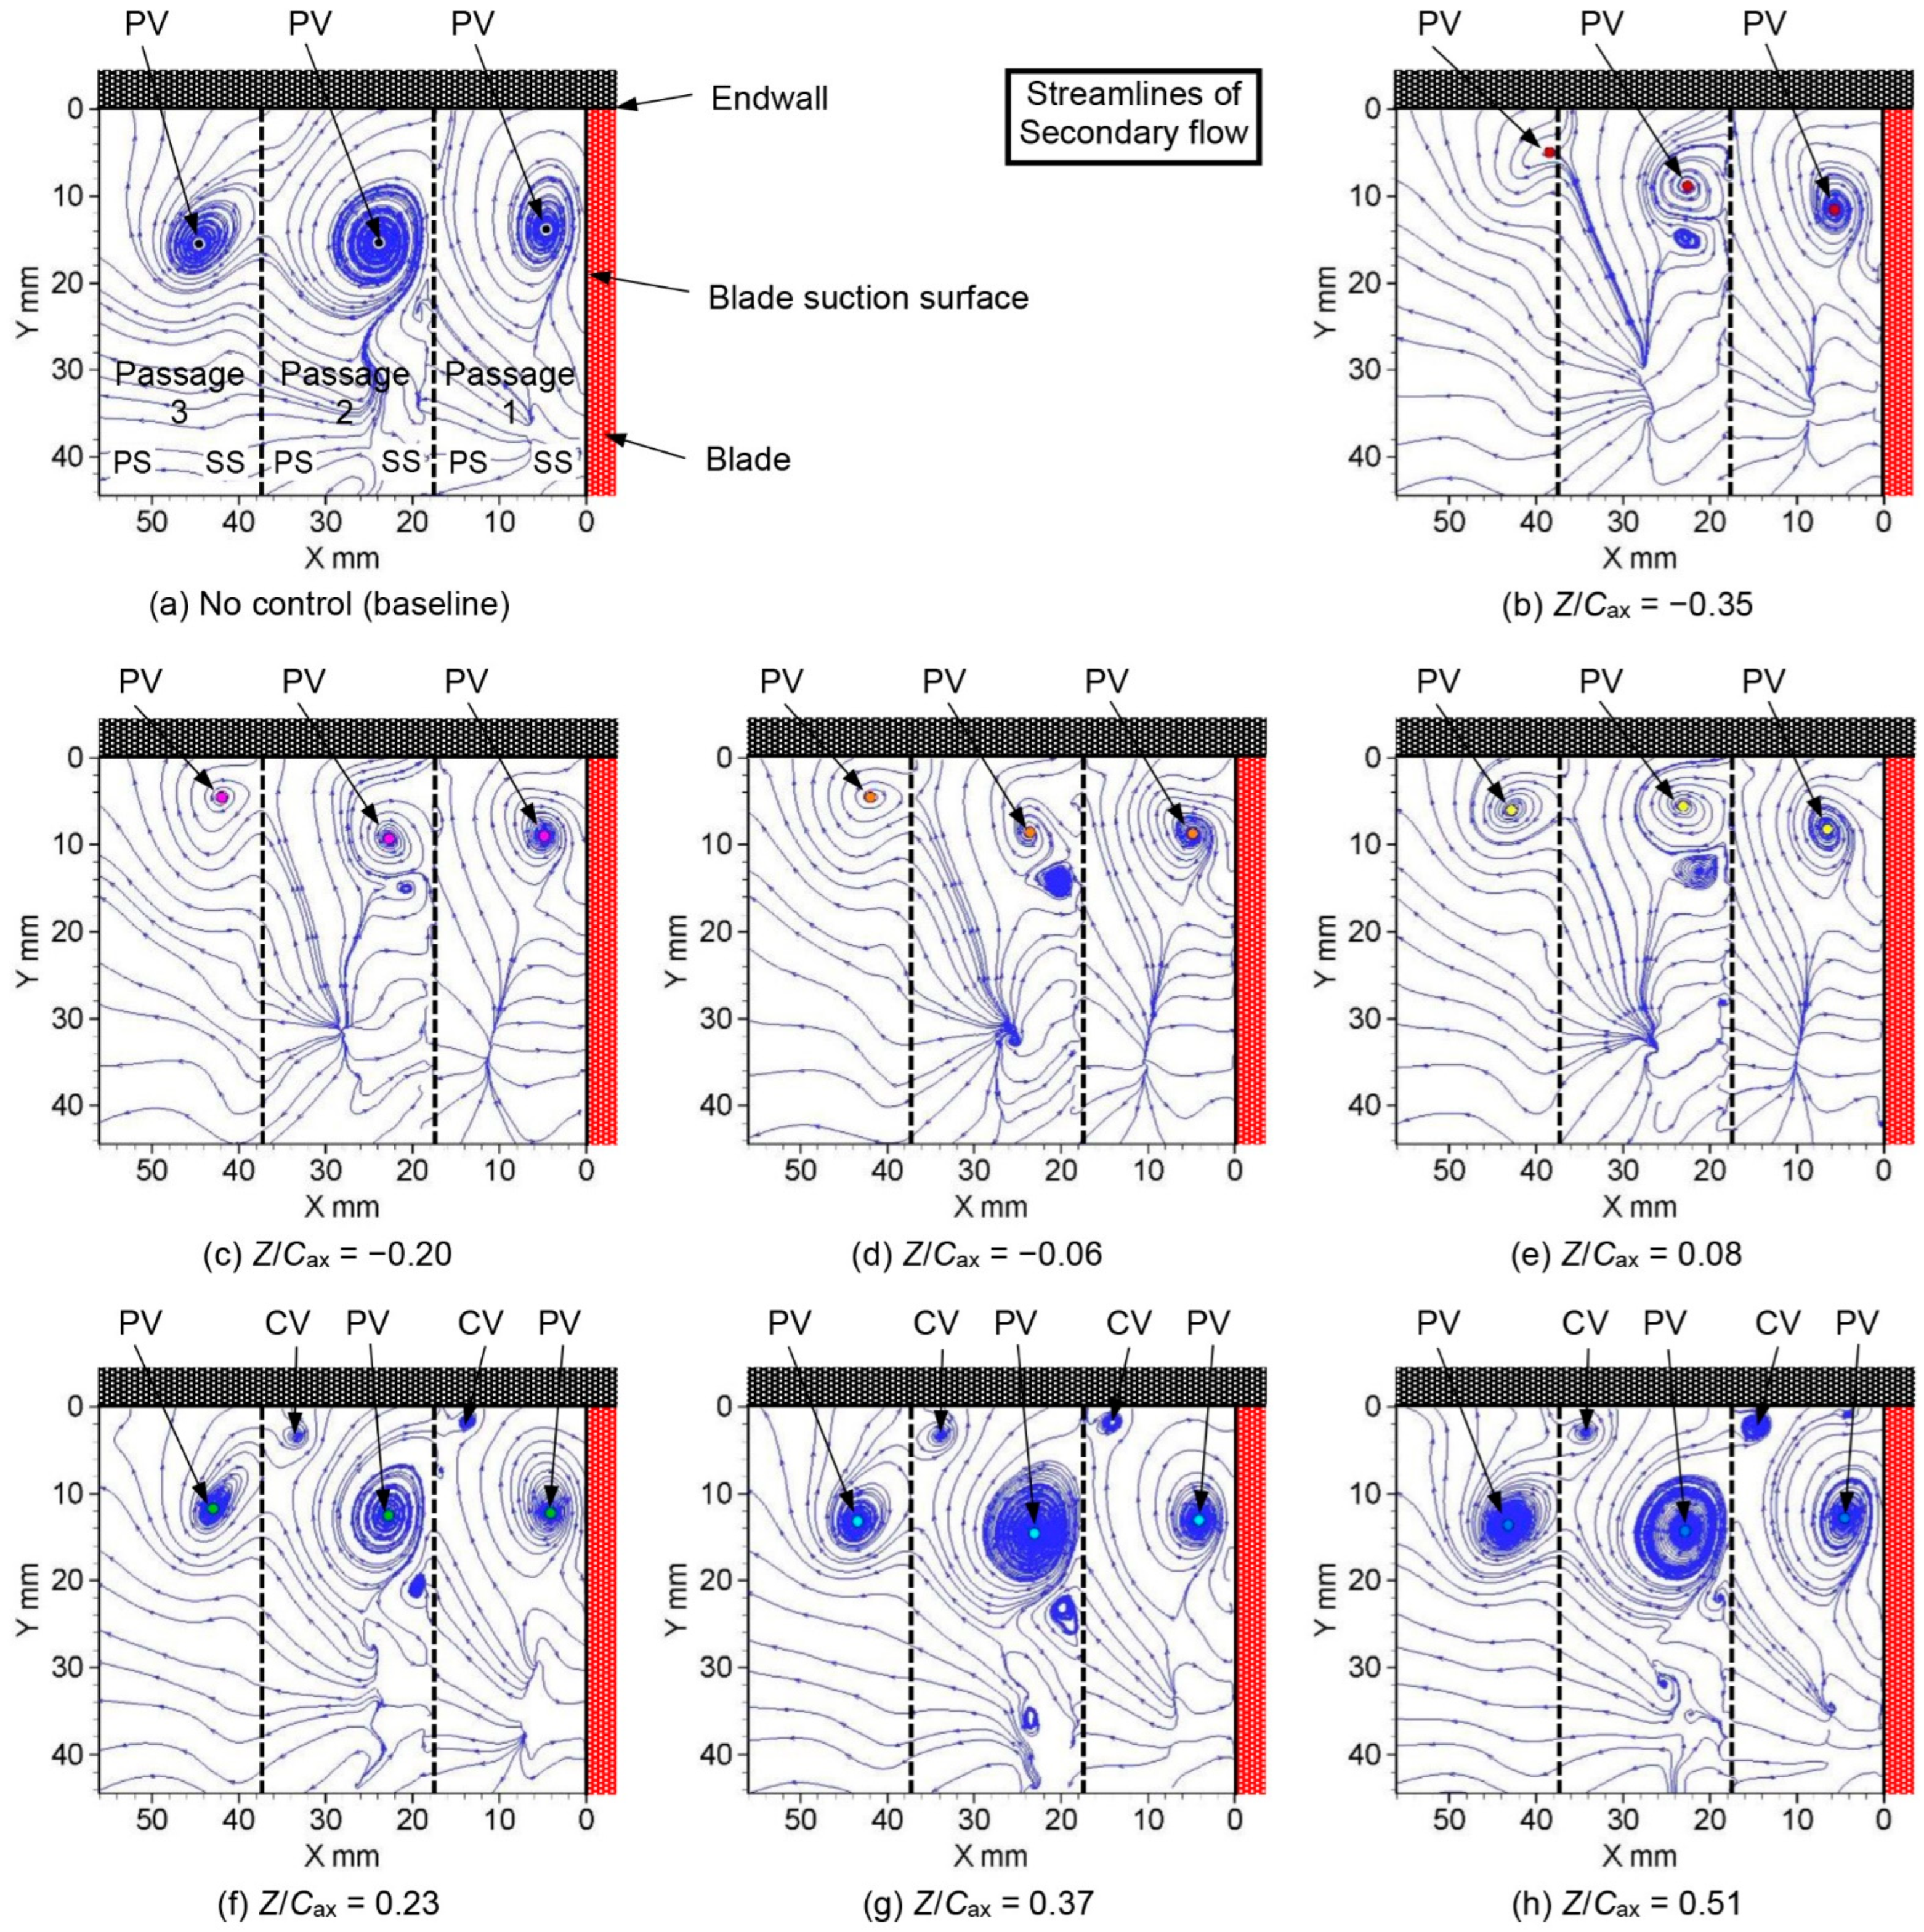
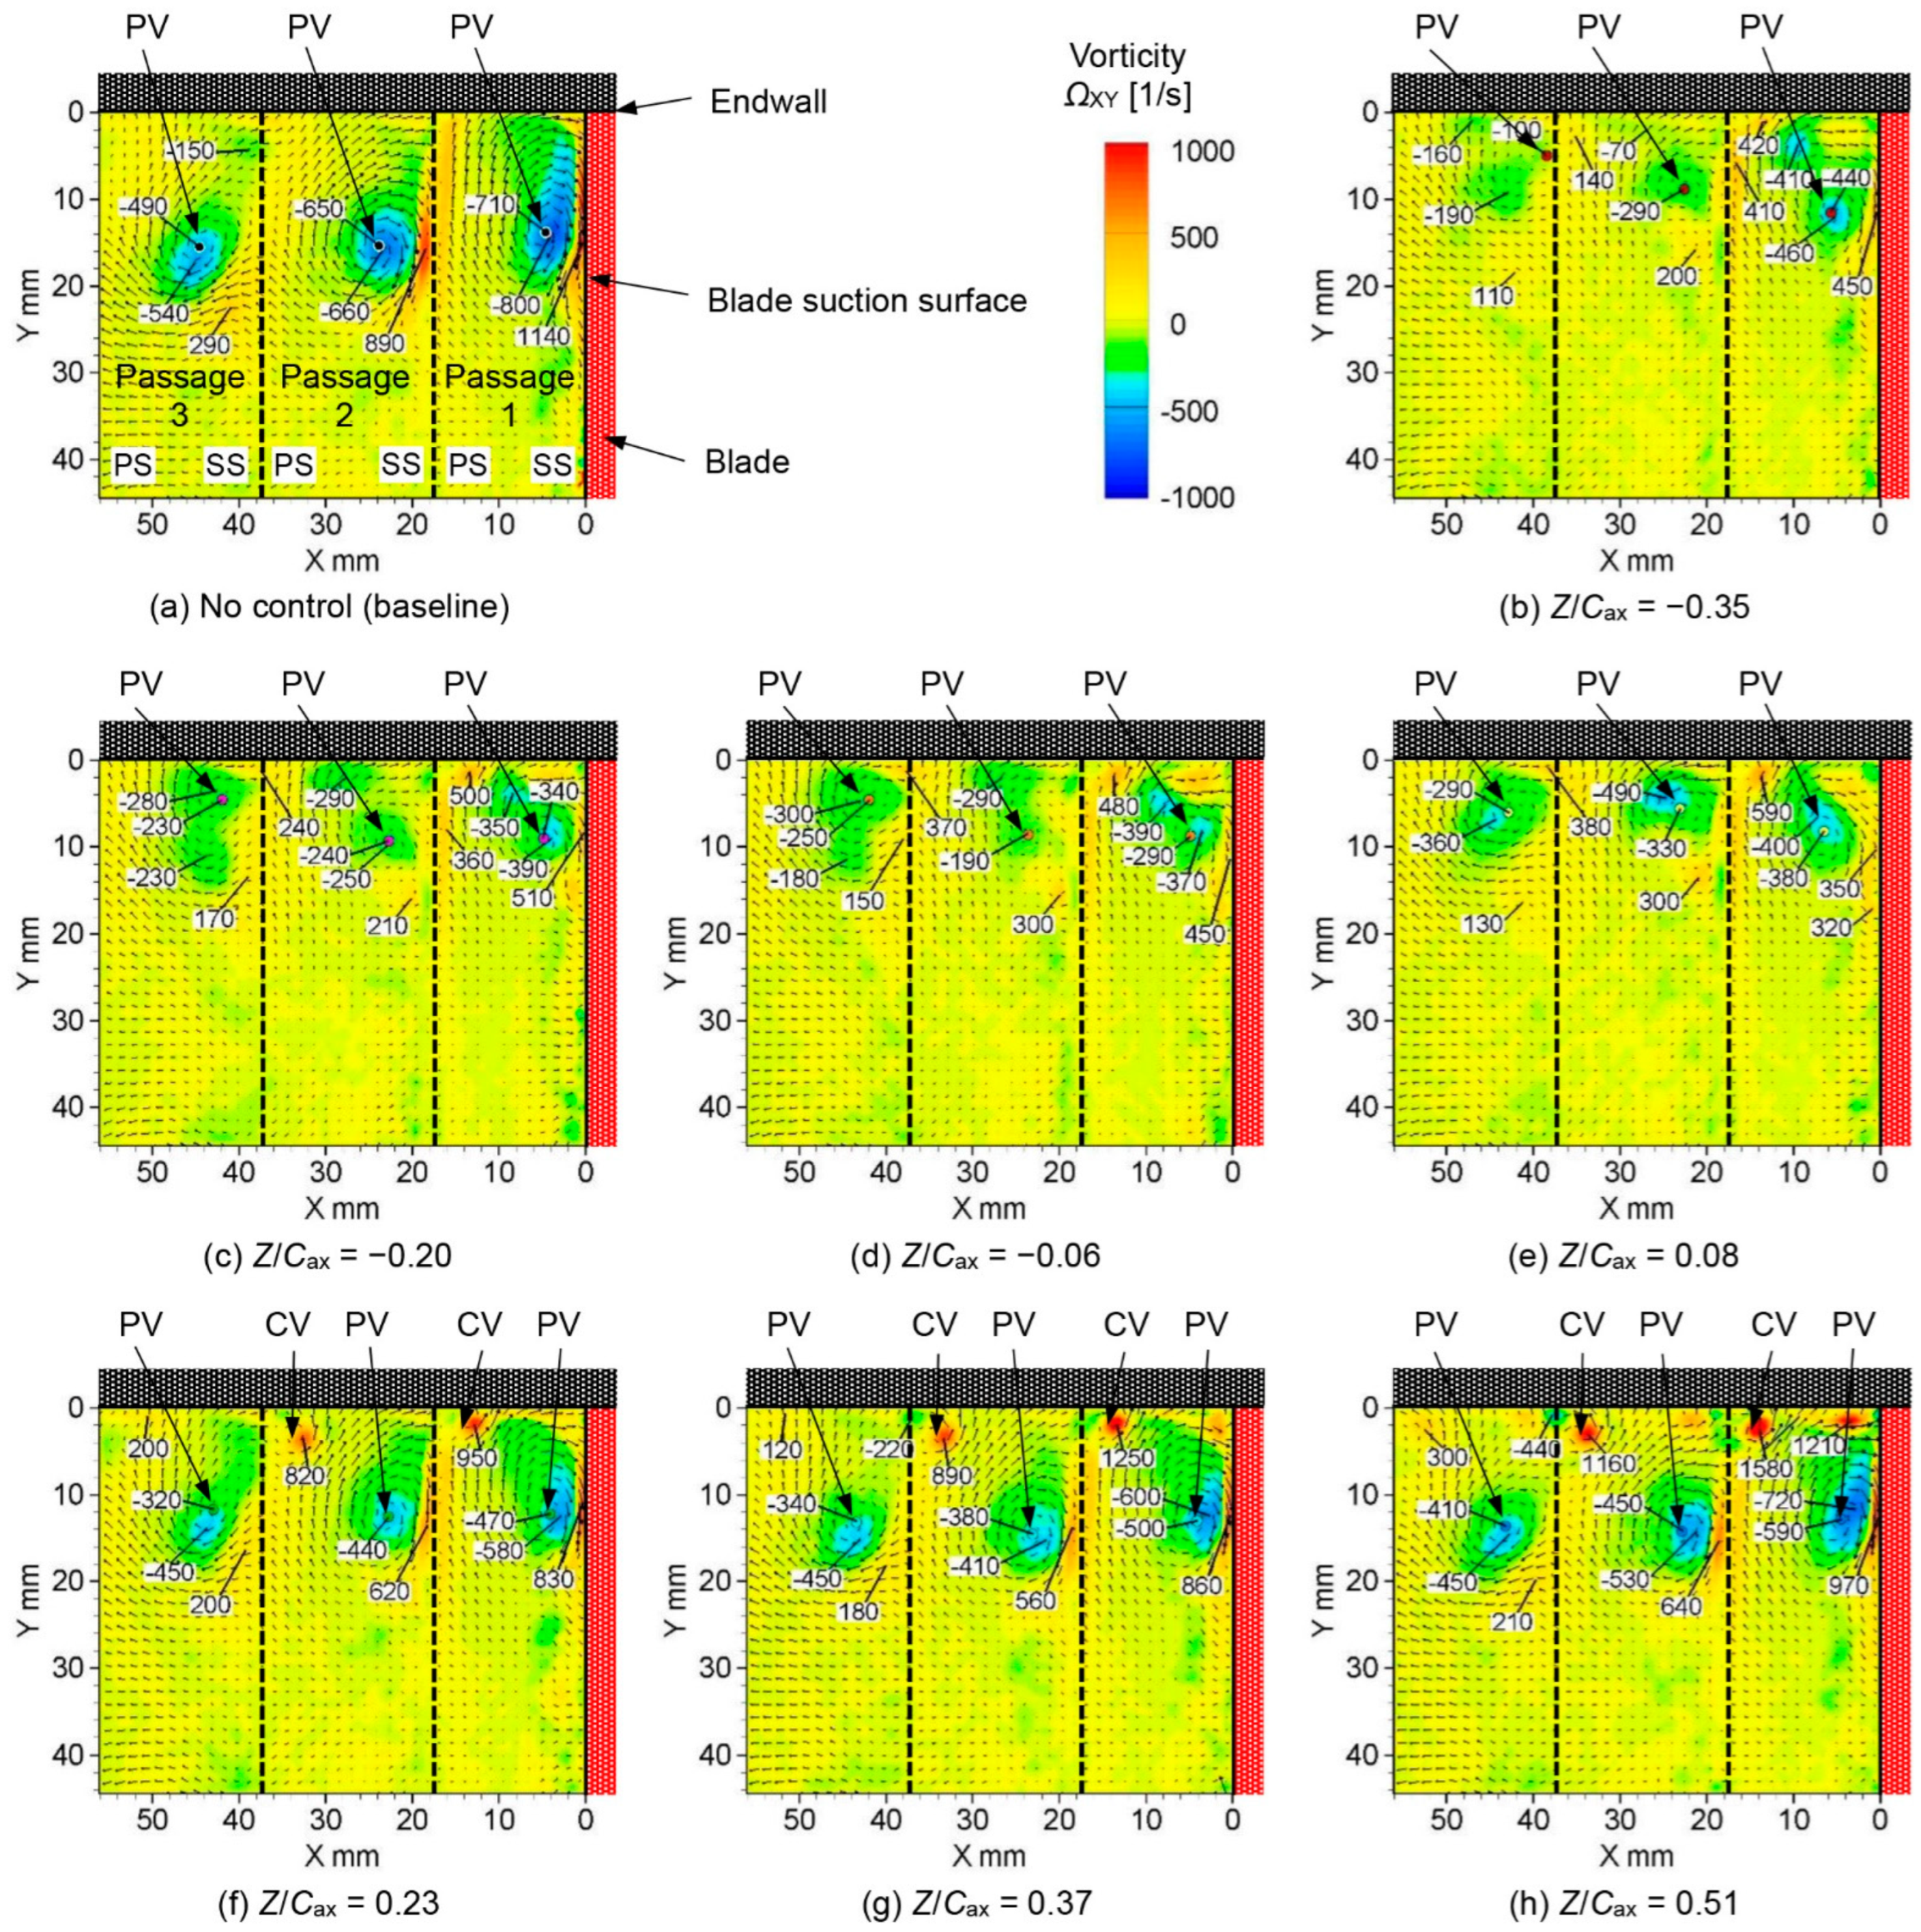
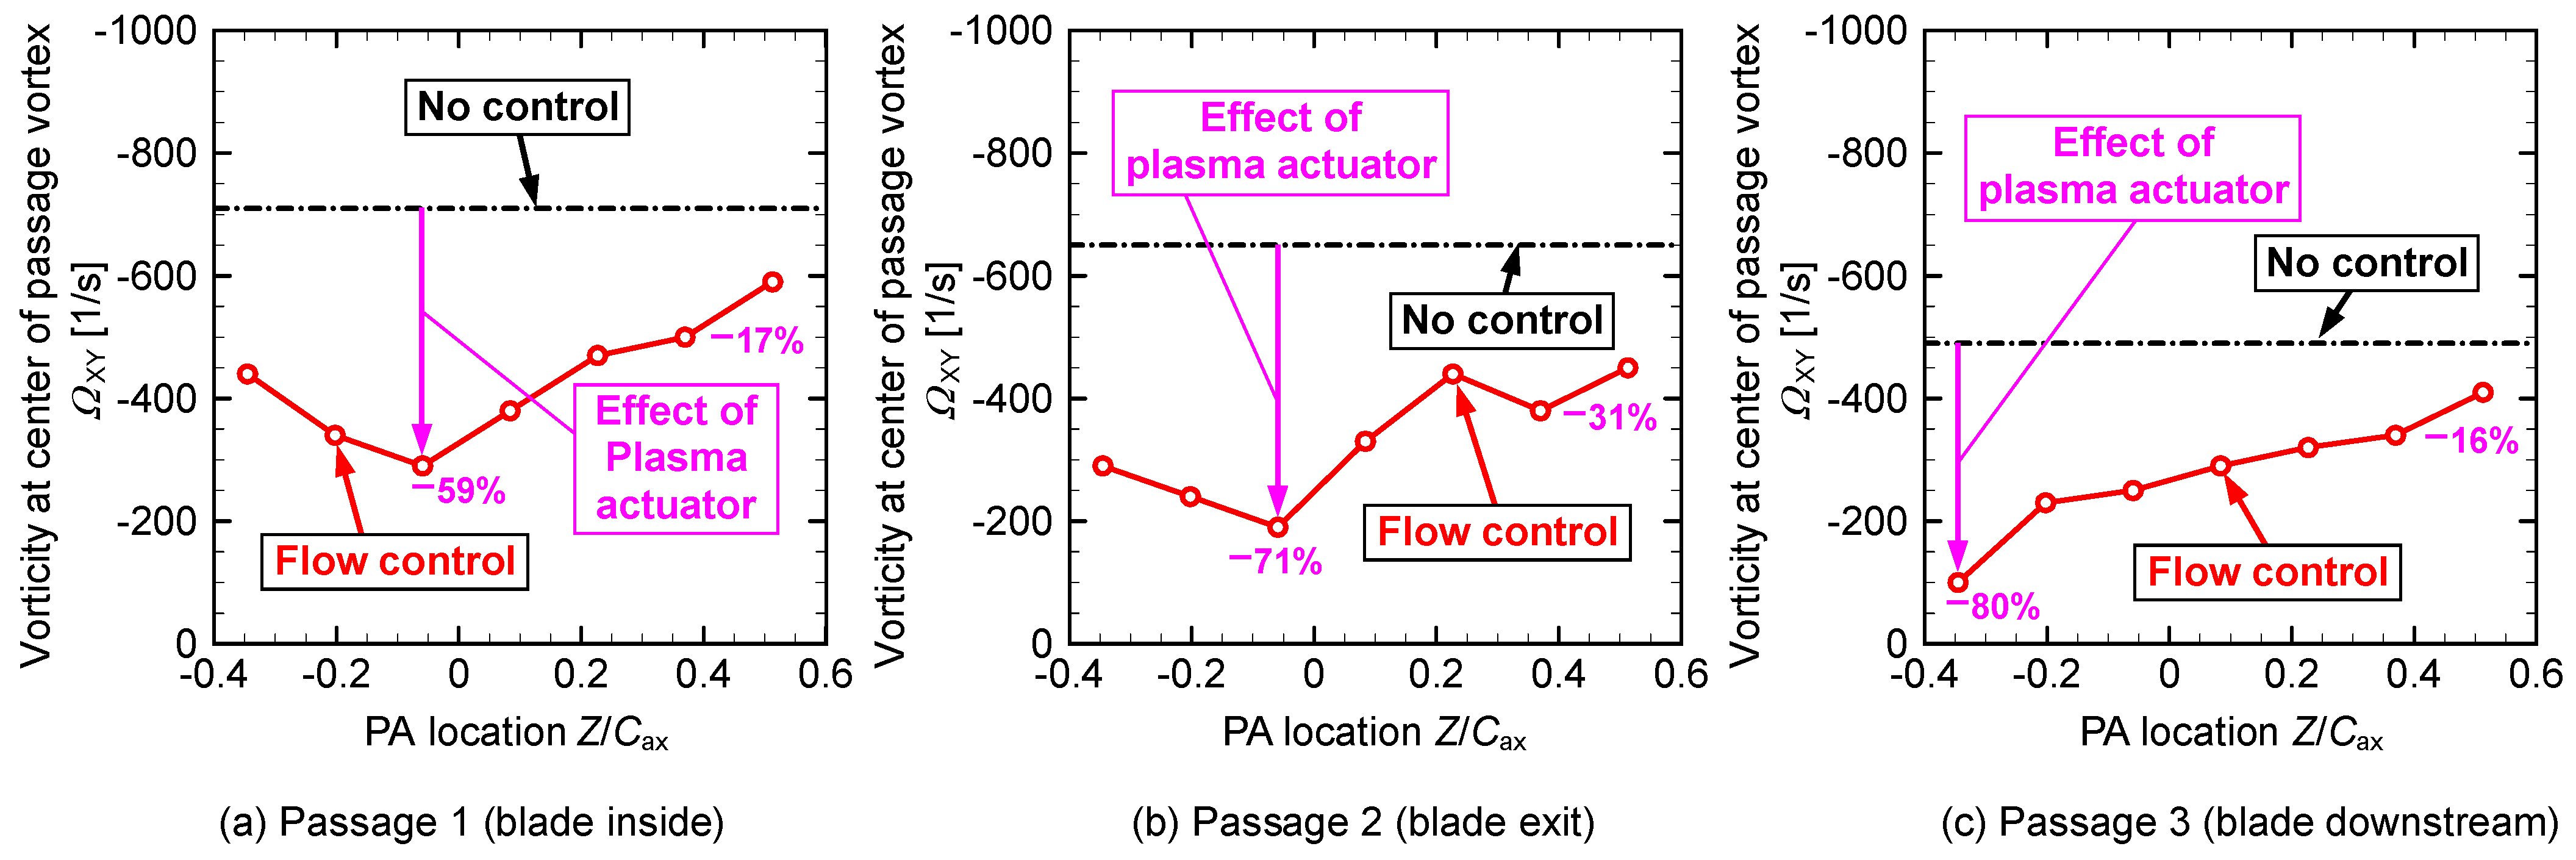
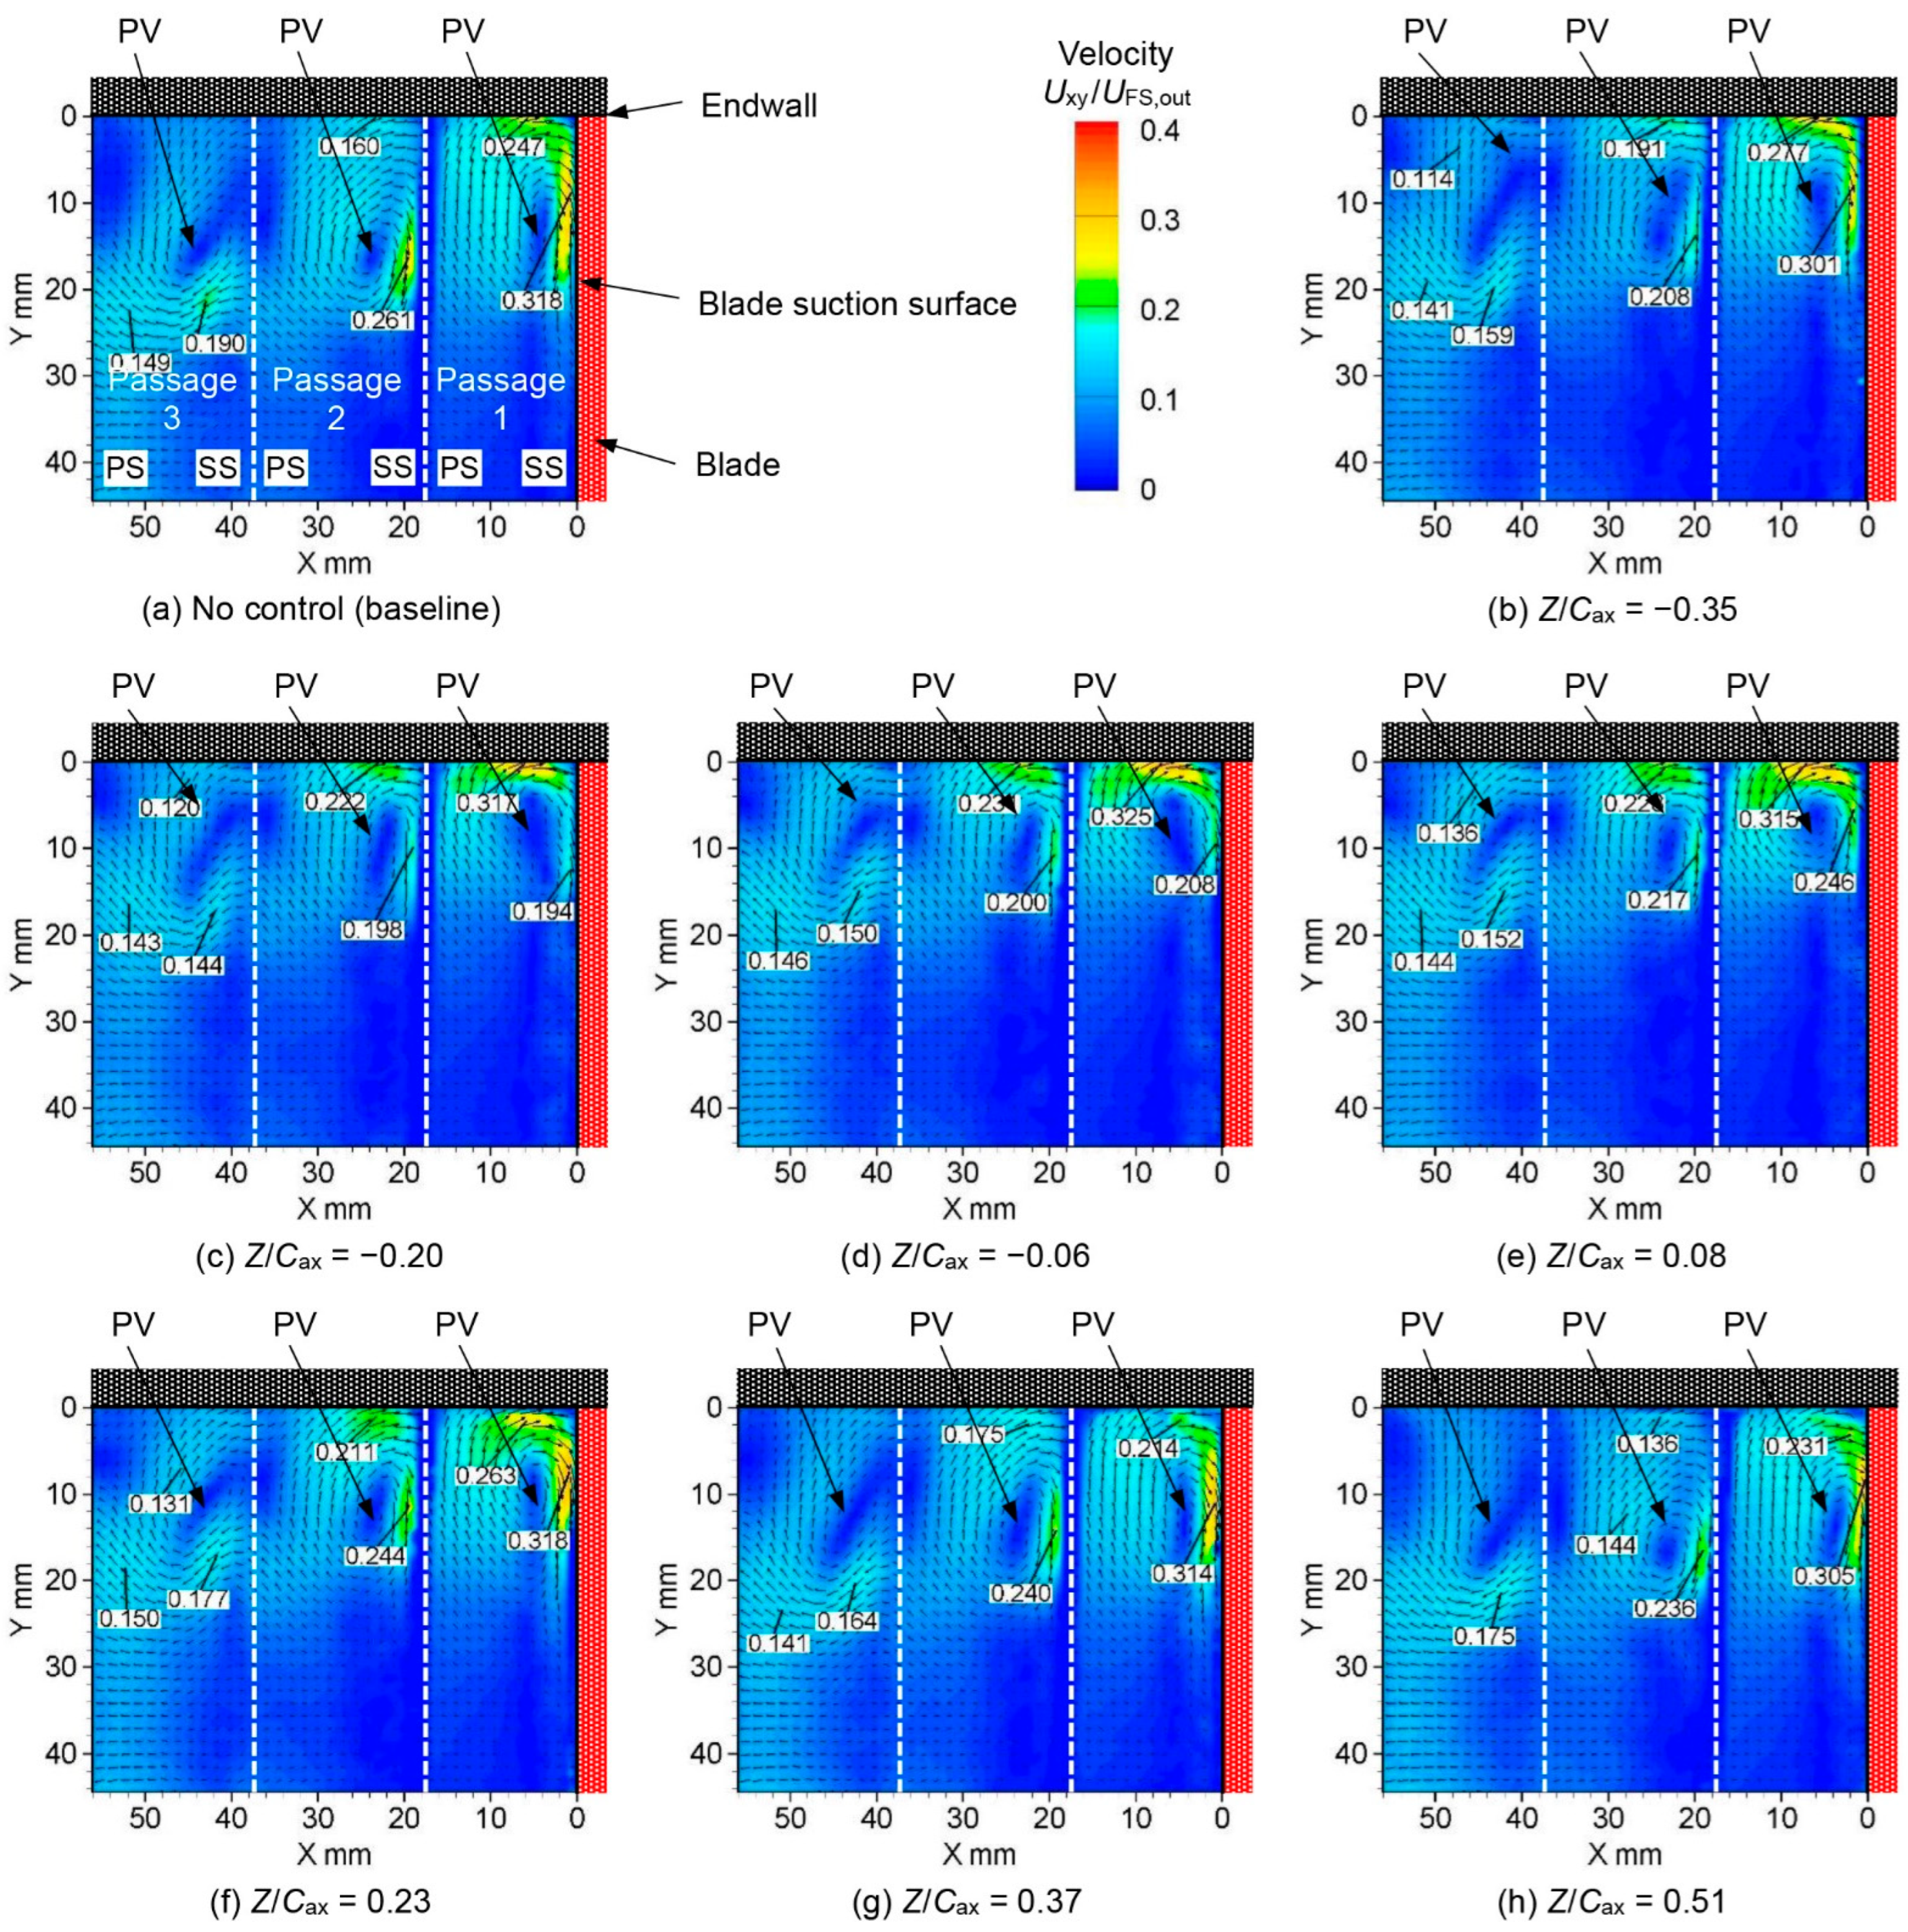
3.1. Reynolds Number, Reout = 1.8 × 10⁴
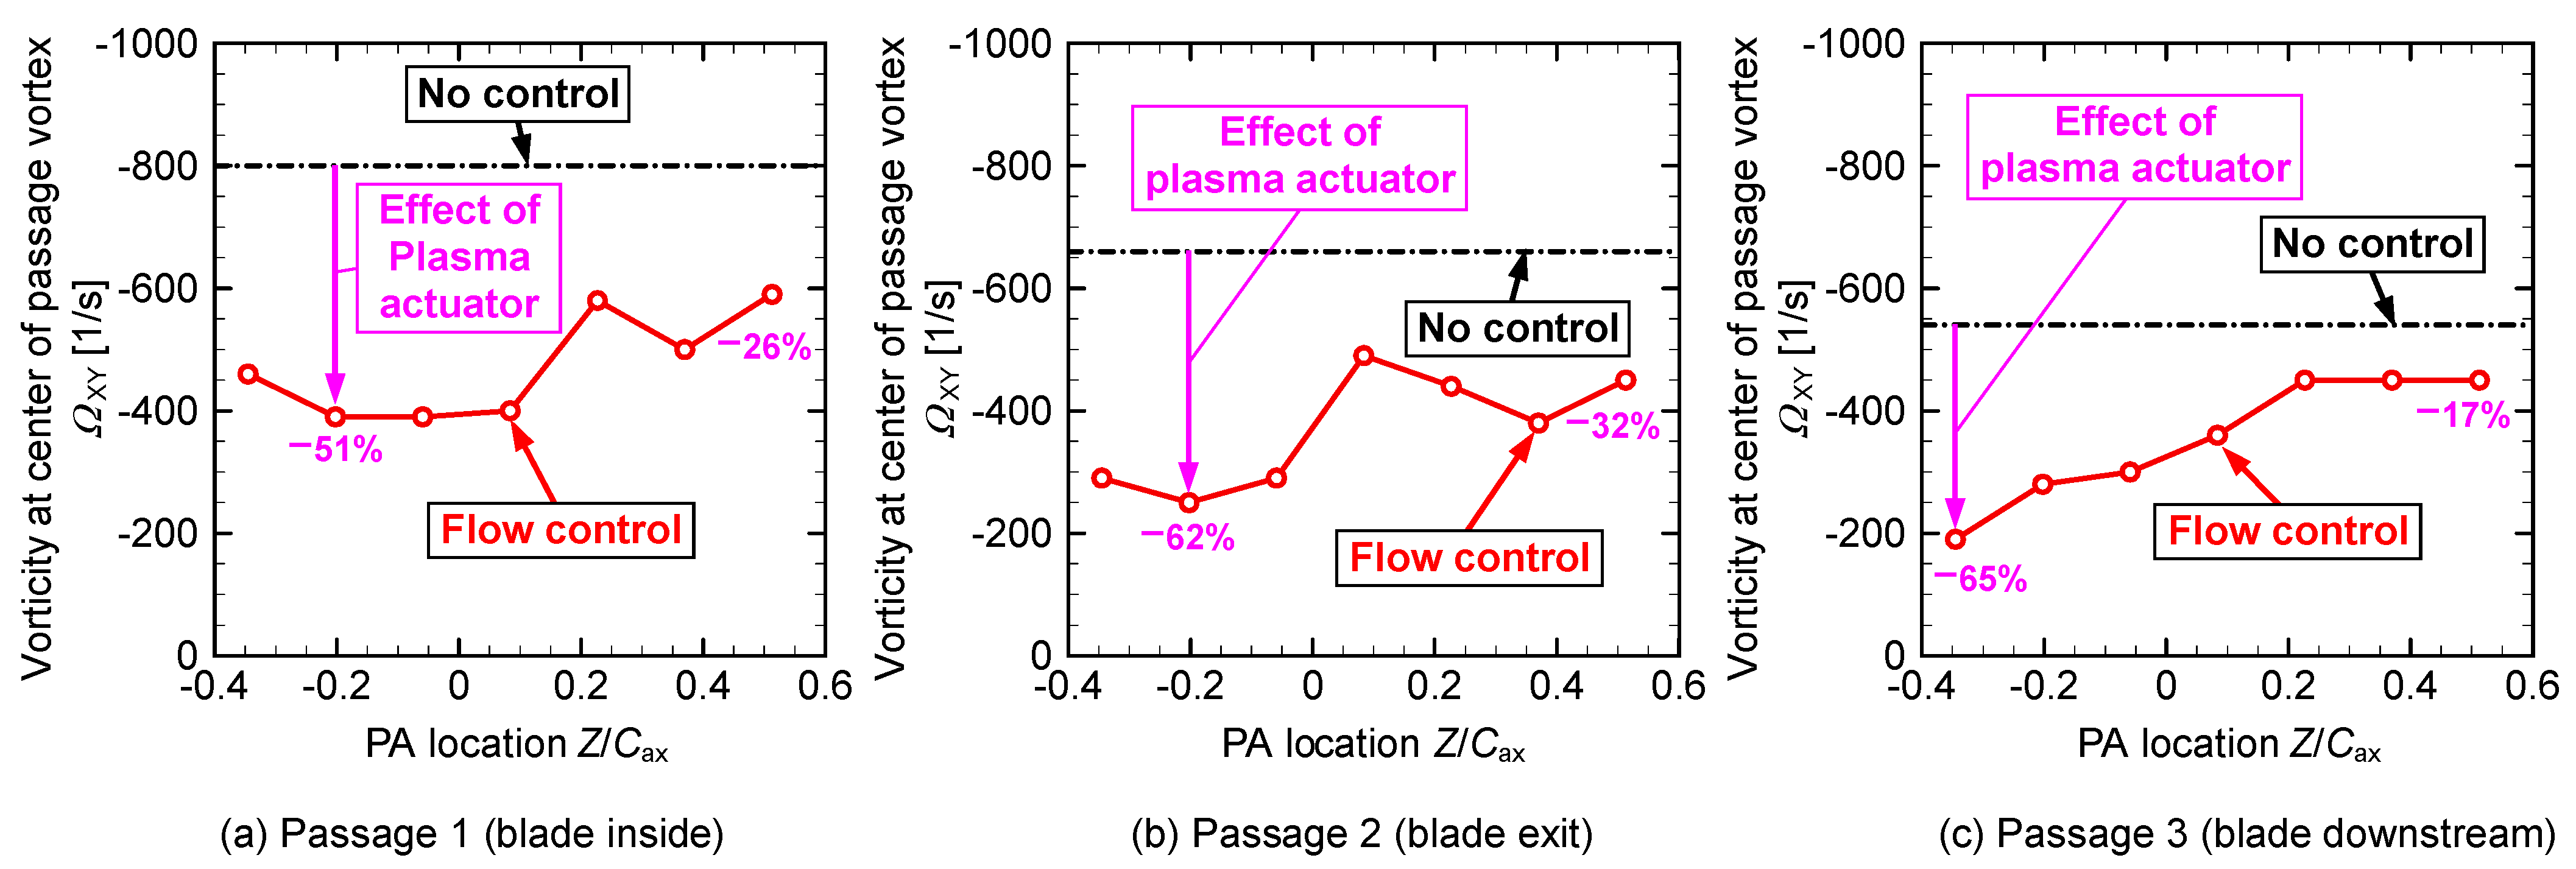
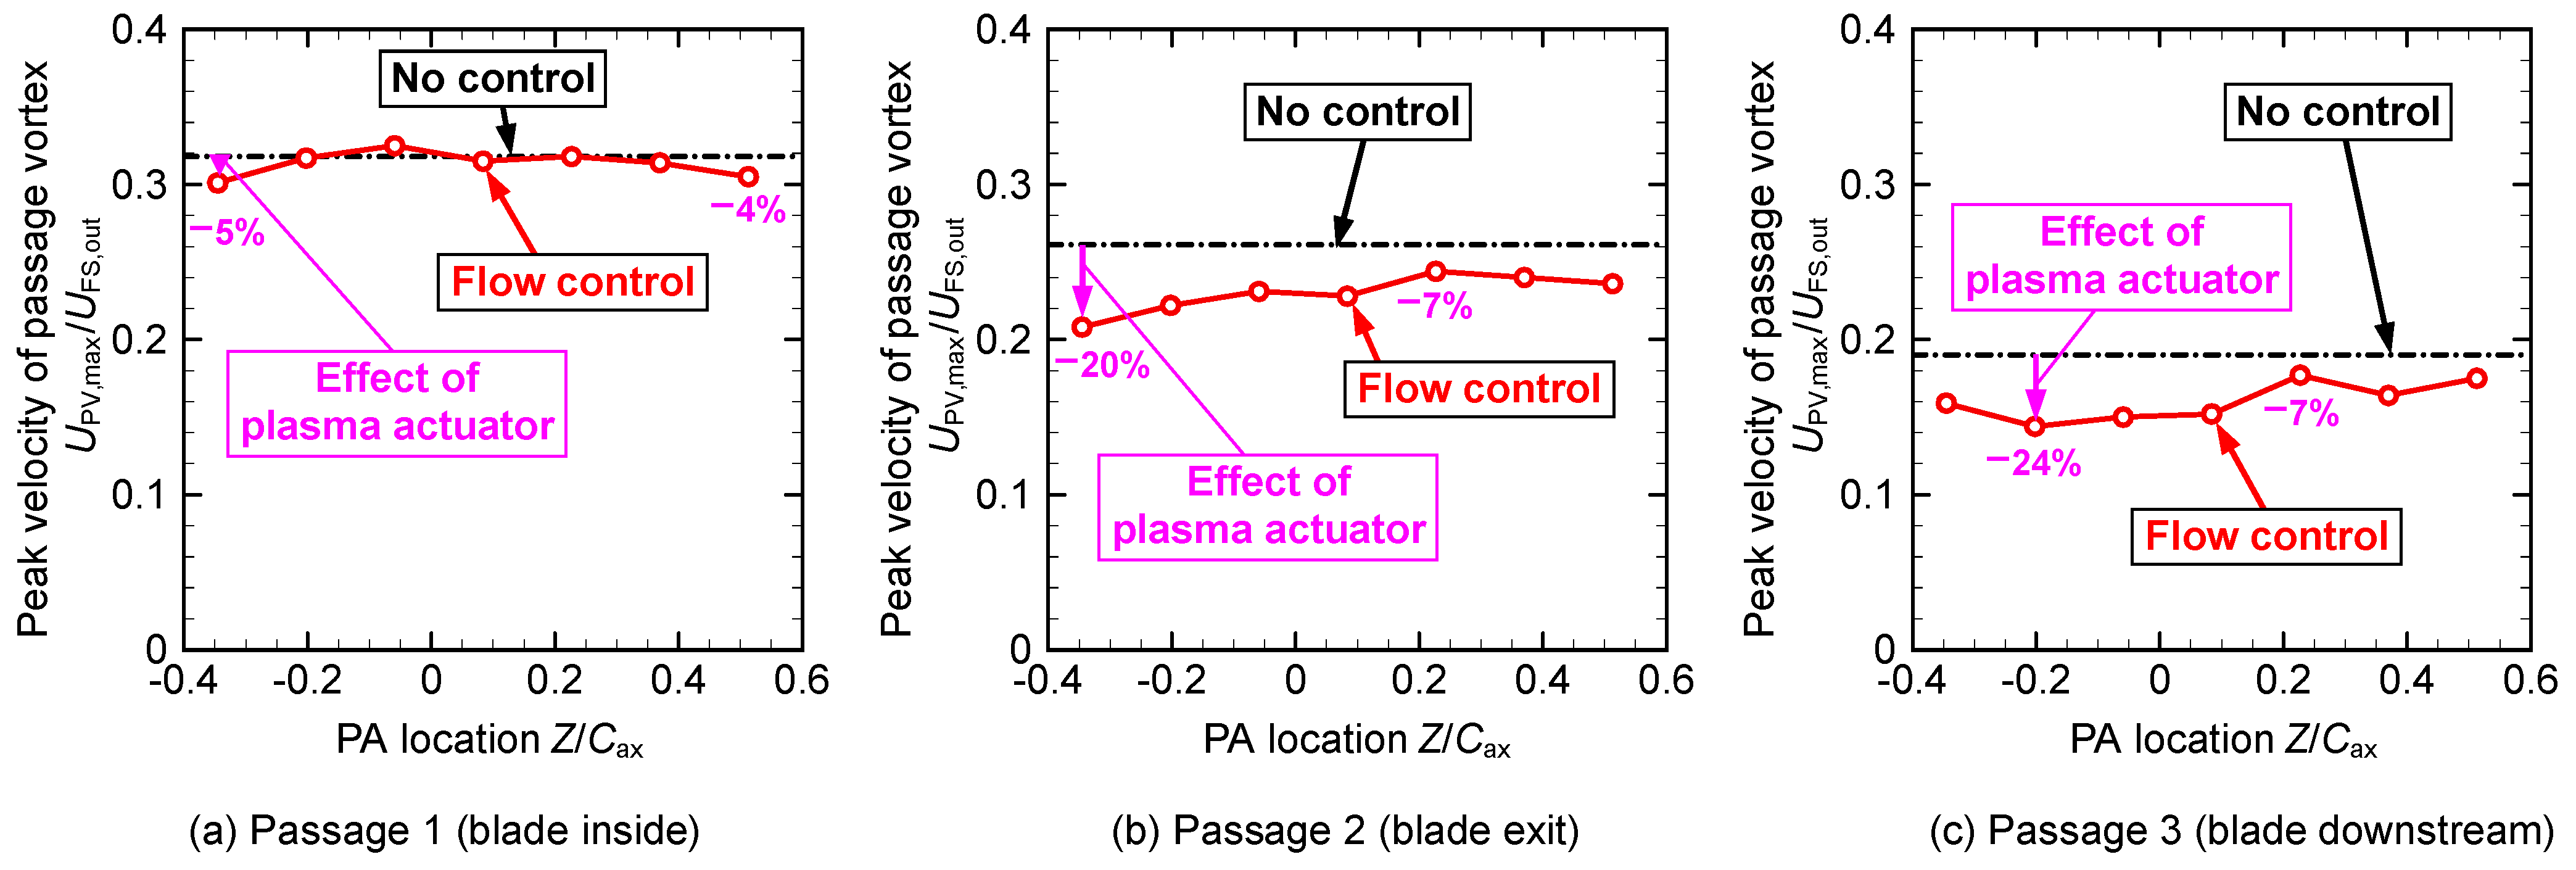
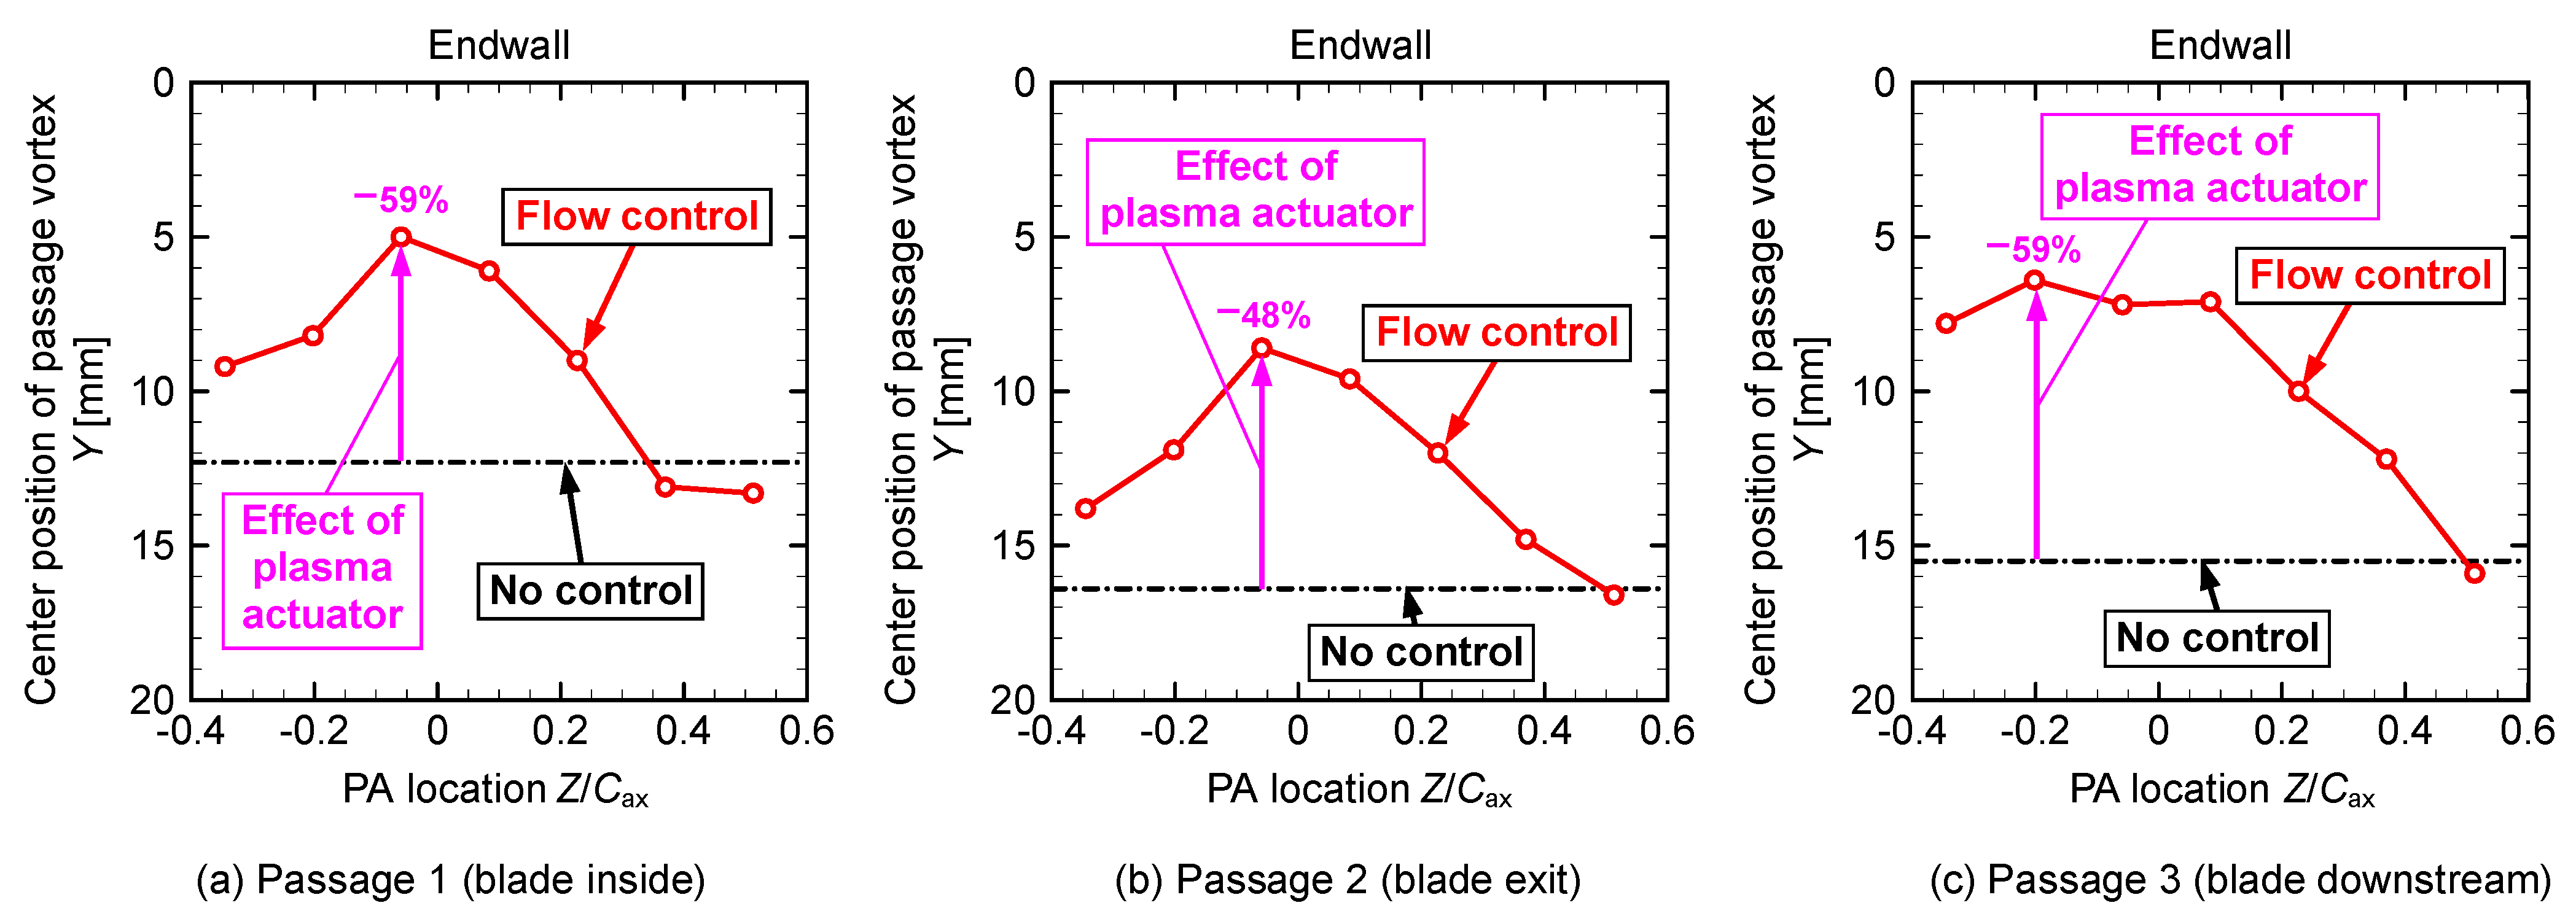
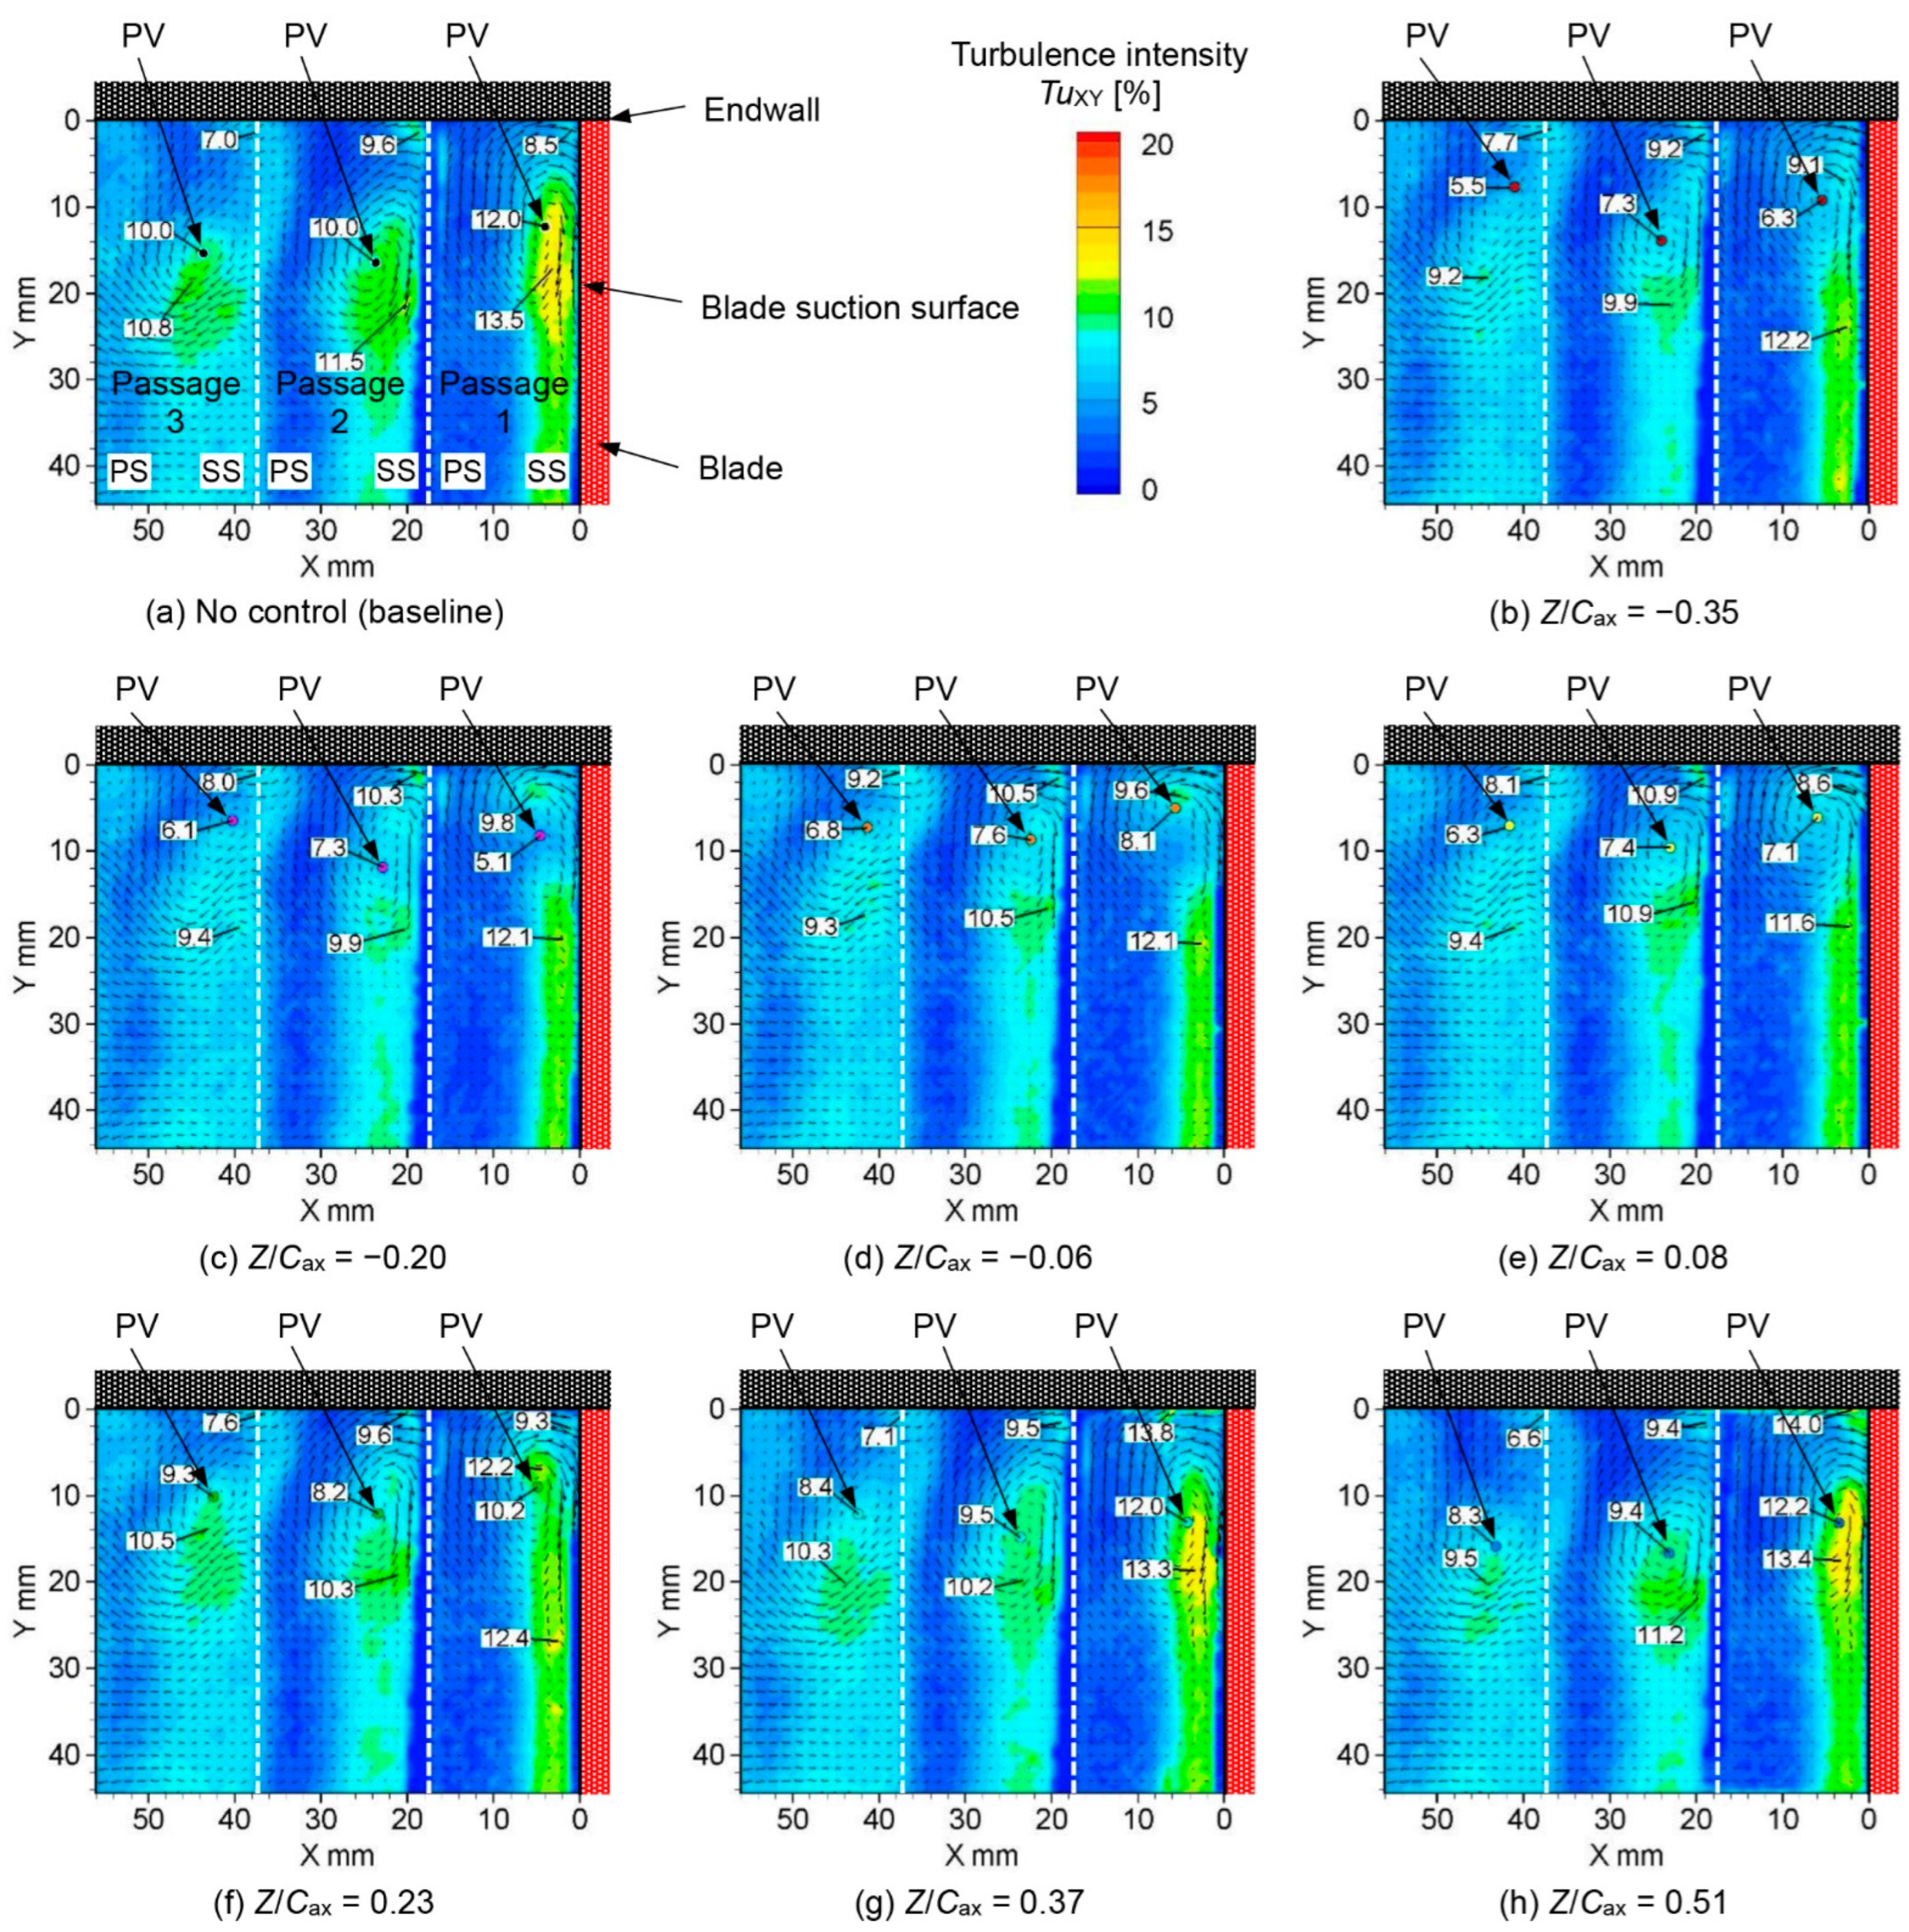
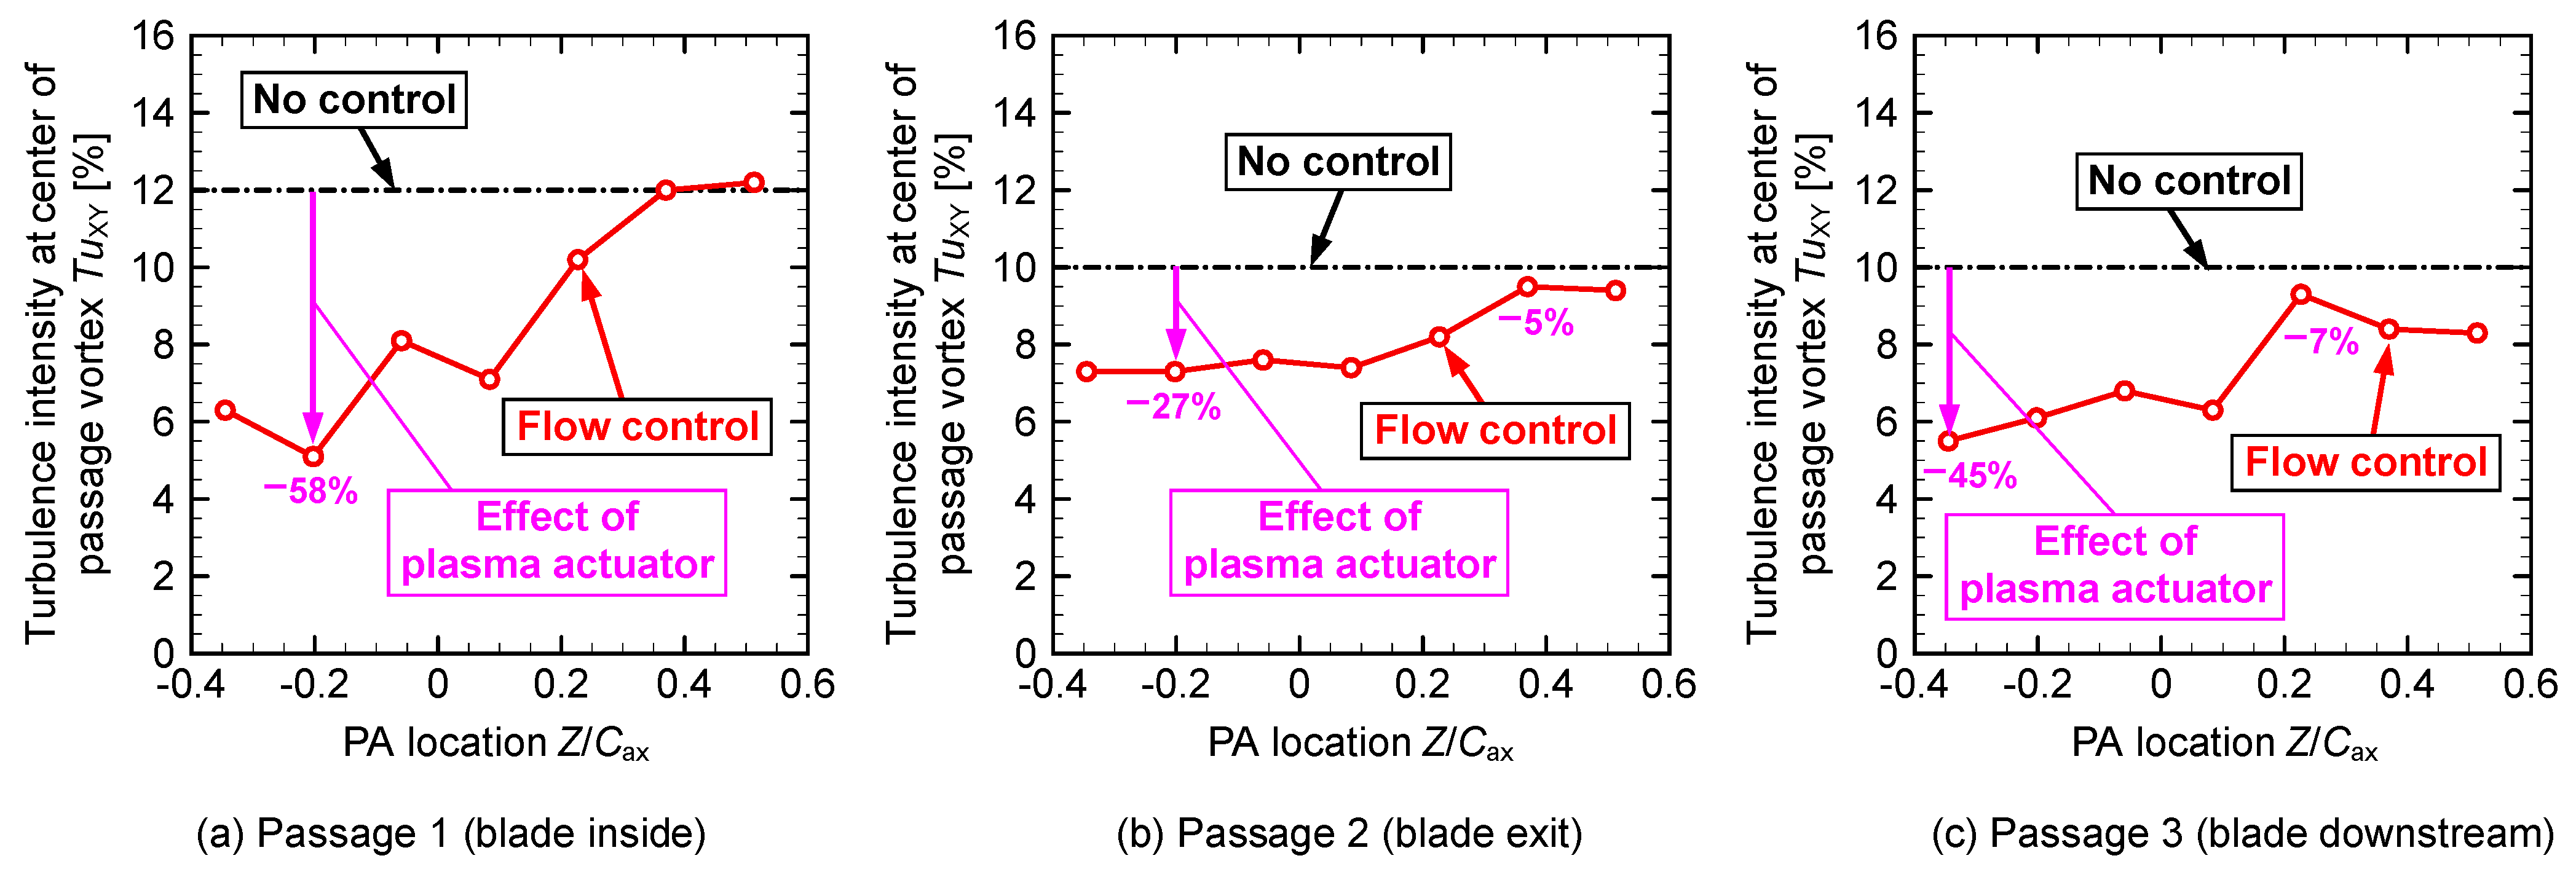
3.2. Reynolds Number, Reout = 3.7 × 10⁴
3.3. Summary of the Location and Percentage of the Maximum Decrease for Each Parameter
4. Concluding Remarks
Funding
Data Availability Statement
Acknowledgments
Conflicts of Interest
Nomenclature
| C | Chord length (mm) |
| CV | Corner vortex |
| DBD | Dielectric barrier discharge |
| H | Blade height (mm) |
| L | spanwise width of electrodes of plasma actuator (mm) |
| N | Number of blades |
| P | Power consumption of plasma actuator |
| PIV | Particle image velocimetry |
| PV | Passage vortex |
| Re | Reynolds number |
| S | Blade pitch (mm) |
| T | Time (s) |
| t | Thickness (mm) |
| Tu | Turbulence intensity (%) |
| U | Velocity (m/s) |
| V | Input voltage (kV) |
| X | Horizontal coordinate of PIV domain (mm) |
| Y | Vertical coordinate of PIV domain (mm) |
| Z | Axial coordinate of turbine cascade (mm) |
| Greek symbols | |
| α | Blade angle (°) |
| Ω | Vorticity component (1/s) |
| ξ | Blade stagger angle (°) |
| Subscripts | |
| ax | Axial |
| in | Inlet flow |
| FS | Freestream |
| out | Outlet flow |
| PA | Plasma actuator |
| p-p | Peak to peak |
| XY | X-Y measurement plane |
References
- Ainley, D.G.; Mathieson, G.C.R. A Method of Performance Estimation for Axial-Flow Turbines; British Aeronautical Research Council: London, UK, 1951. [Google Scholar]
- Sieverding, C.H. Recent progress in the understanding of basic aspects of secondary flows in turbine blade passages. ASME J. Eng. Gas Turbines Power 1985, 107, 248–257. [Google Scholar] [CrossRef]
- Hourmouziadis, J. Aerodynamic Design of Low Pressure Turbines. In Blading Design for Axial Turbomachines; AGARD-LS-167, AGARD Lecture Series No. 167; AGARD: Neue, France, 1989; p. 167. [Google Scholar]
- Denton, J.D. Loss mechanisms in turbomachines. ASME J. Turbomach. 1993, 115, 621–656. [Google Scholar] [CrossRef]
- Van Treuren, K.W.; Simon, T.; von Koller, M.; Byerley, A.R.; Baughn, J.W.; Rivir, R. Measurements in a turbine cascade flow under ultra low Reynolds number conditions. ASME J. Turbomach. 2002, 124, 100–106. [Google Scholar] [CrossRef]
- Bons, J.P.; Sondergaard, R.; Rivir, R.B. The fluid dynamics of LPT blade separation using pulsed jets. ASME J. Turbomach. 2002, 124, 77–85. [Google Scholar] [CrossRef]
- Bernardini, C.; Benton, S.I.; Bons, J.P. The effect of acoustic excitation on boundary layer separation of a highly loaded LPT blade. ASME J. Turbomach. 2013, 135, 051001. [Google Scholar] [CrossRef]
- Hodson, H.P.; Howell, R.J. The role of transition in high-lift low-pressure turbines for aeroengines. Prog. Aerosp. Sci. 2005, 41, 419–454. [Google Scholar] [CrossRef]
- Schobeiri, M.T.; Öztürk, B.; Ashpis, D.E. Effect of Reynolds number and periodic unsteady wake flow condition on boundary layer development, separation, and intermittency behavior along the suction surface of a low pressure turbine blade. ASME J. Turbomach. 2007, 129, 92–107. [Google Scholar] [CrossRef]
- Sanders, D.D.; O’Brien, W.F.; Sondergaard, R.; Polanka, M.D.; Rabe, D.C. Predicting separation and transitional flow in turbine blades at low Reynolds numbers—Part I: Development of prediction methodology. ASME J. Turbomach. 2011, 133, 031011. [Google Scholar] [CrossRef]
- Sanders, D.D.; O’Brien, W.F.; Sondergaard, R.; Polanka, M.D.; Rabe, D.C. Predicting separation and transitional flow in turbine blades at low Reynolds numbers—Part II: The application to a highly separated turbine blade cascade geometry. ASME J. Turbomach. 2011, 133, 031012. [Google Scholar] [CrossRef]
- Wang, X.; Liang, L.; Kang, S. Numerical simulations on flow separation within an axial turbine at very low Reynolds number. In Proceedings of the ASME Turbo Expo 2015: Turbine Technical Conference and Exposition, Montreal, QC, Canada, 15–19 June 2015; ASME Turbo Expo: Montreal, QC, Canada, 12 August 2015. [Google Scholar] [CrossRef]
- Mittal, R.; Venkatasubramanian, S.; Najjar, F. Large-eddy simulation of flow through a low-pressure turbine cascade. In Proceedings of the 15th AIAA Computational Fluid Dynamics Conference, Anaheim, CA, USA, 11–14 June 2001. [Google Scholar] [CrossRef]
- Sharma, O. Impact of Reynolds number on LP turbine performance. In Minnnowbrook II Workshop on Boundary Layer Transition in Turbomachines; NASA/CP-1998-206958; NASA Technical Reports Server: Sunnyvale, CA, USA, 1998; pp. 65–69. Available online: https://ntrs.nasa.gov/citations/19980206205 (accessed on 1 March 2022).
- Rivir, R.B.; Sondergaard, R.; Bons, J.P. Control of Separation in Turbine Boundary Layers. In Proceedings of the 2nd AIAA Flow Control Conference, Oregon, Portland, 28 June–1 July 2004. [Google Scholar] [CrossRef]
- Bons, J.; Benton, S.; Bernardini, C.; Bloxham, M. Active flow control for low-pressure turbines. AIAA J. 2018, 56, 2687–2698. [Google Scholar] [CrossRef]
- Huang, J.; Corke, T.; Thomas, F. Plasma Actuators for separation control of low pressure turbine blades. In Proceedings of the 41st Aerospace Sciences Meeting and Exhibit, Reno, Nevada, 6–9 January 2003. [Google Scholar] [CrossRef]
- Hultgren, L.; Ashpis, D. Demonstration of separation delay with glow discharge plasma actuators. In Proceedings of the 41st Aerospace Sciences Meeting and Exhibit, Reno, Nevada, 6–9 January 2003. [Google Scholar] [CrossRef]
- List, J.; Byerley, A.; McLaughlin, T.; Dyken, R.V. Using a plasma actuator to control laminar separation on a linear cascade turbine blade. In Proceedings of the 41st Aerospace Sciences Meeting and Exhibit, Reno, Nevada, 6–9 January 2003. [Google Scholar] [CrossRef]
- Huang, J. Separation Control over Low Pressure Turbine Blades Using Plasma Actuators. Dissertation, The University of Notre Dame, Notre Dame, IN, USA, 2005; p. 56. Available online: https://www3.nd.edu/~tcorke/Huang_Thesis.pdf?msclkid=53e3f6f1b71611ec8a1240b51436b2b9 (accessed on 1 March 2022).
- Boxx, I.G.; Newcamp, J.M.; Franke, M.E.; Woods, N.M.; Rivir, R.B. A PIV Study of a plasma discharge flow-control actuator on a flat plate in an aggressive pressure induced separation. In Proceedings of the ASME Turbo Expo 2006: Power for Land, Sea, and Air, Barcelona, Spain, 8–11 May 2006; Volume 3, pp. 1231–1242. [Google Scholar] [CrossRef]
- Pescini, E.; Marra, F.; De Giorgi, M.G.; Francioso, L.; Ficarella, A. Investigation of the boundary layer characteristics for assessing the DBD plasma actuator control of the separated flow at low Reynolds numbers. Exp. Therm. Fluid Sci. 2017, 81, 482–498. [Google Scholar] [CrossRef]
- Pescini, E.; De Giorgi, M.G.; Suma, A.; Francioso, L.; Ficarella, A. Separation control by a microfabricated SDBD plasma actuator for small engine turbine applications: Influence of the excitation waveform. Aerosp. Sci. Technol. 2018, 76, 442–454. [Google Scholar] [CrossRef]
- Zhou, C.; Hodson, H.; Tibbott, I.; Stokes, M. Effects of Winglet Geometry on the Aerodynamic Performance of Tip Leakage Flow in a Turbine Cascade. Trans. ASME J. Turbomach. 2013, 135, 051009. [Google Scholar] [CrossRef]
- Coull, J.D.; Atkins, N.R.; Hodson, H.P. High Efficiency Cavity Winglets for High Pressure Turbines. In Proceedings of the ASME Turbo Expo 2014: Turbine Technical Conference and Exposition, Düsseldorf, Germany, 16–20 June 2014. [Google Scholar] [CrossRef]
- Volino, R.J. Control of Tip Leakage in A High Pressure Turbine Cascade Using Tip Blowing. In Proceedings of the ASME Turbo Expo 2016: Turbomachinery Technical Conference and Exposition, Seoul, Korea, 13–17 June 2016. [Google Scholar] [CrossRef]
- Van Ness II, D.K.; Corke, T.C.; Morris, S.C. Turbine Tip Clearance Flow Control Using Plasma Actuator. In Proceedings of the 44th AIAA Aerospace Sciences Meeting and Exhibit, Reno, Nevada, 9–12 January 2006. [Google Scholar] [CrossRef]
- Matsunuma, T.; Segawa, T. Tip leakage flow reduction of a linear turbine cascade using string-type DBD plasma actuators. In Proceedings of the ASME Turbo Expo 2018: Turbomachinery Technical Conference and Exposition, Oslo, Norway, 11–15 June 2018; Volume 2B. [Google Scholar] [CrossRef]
- Yu, J.; Lu, Y.; Wang, Y.; Chen, F.; Song, Y. Experimental study on the plasma actuators for the tip leakage flow control in a turbine cascade. Aerosp. Sci. Technol. 2022, 121, 107195. [Google Scholar] [CrossRef]
- Schmid, J.; Schulz, A.; Bauer, H.J. Influence of a non-axisymmetric endwall on the flow field in a turbine passage—High resolution LDV. In Proceedings of the ASME Turbo Expo 2018, Oslo, Norway, 11–15 June 2018. [Google Scholar] [CrossRef]
- Sangston, K.; Little, J.; Lyall, M.E.; Sondergaard, R. End wall loss reduction of high lift low pressure turbine airfoils using profile contouring—Part 2: Validation. ASME J. Turbomach. 2014, 136, 081006. [Google Scholar] [CrossRef]
- Chung, J.T.; Simon, T.W.; Buddhavarapu, J. Three-dimensional flow near the blade/endwall junction of a gas turbine: Application of a boundary layer fence. In Proceedings of the ASME Turbo Expo 1991, Orland, FL, USA, 3–6 June 1991. [Google Scholar] [CrossRef]
- Shyam, V.; Ameri, A.; Poinsatte, P.; Thurman, D.; Wroblewski, A.; Snyder, C. Application of pinniped vibrissae to aeropropulsion. In Proceedings of the ASME Turbo Expo 2015, Montréal, QC, Canada, 15–19 June 2015. [Google Scholar] [CrossRef]
- Bloxham, M.J.; Bons, J.P. A global approach to turbomachinery flow control: Passage vortex control. Trans. ASME J. Turbomach. 2014, 136, 041003. [Google Scholar] [CrossRef]
- Benton, S.I.; Bons, J.P.; Sondergaard, R. Secondary flow loss reduction through blowing for a high-lift front-loaded low pressure turbine cascade. Trans. ASME J. Turbomach. 2013, 135, 021020. [Google Scholar] [CrossRef]
- Benton, S.I.; Bernardini, C.; Bons, J.P.; Sondergaard, R. Parametric optimization of unsteady end wall blowing on a highly loaded low-pressure turbine. Trans. ASME J. Turbomach. 2014, 136, 071013. [Google Scholar] [CrossRef]
- Matsunuma, T.; Segawa, T. Effects of input voltage and freestream velocity on active flow control of passage vortex in a linear turbine cascade using dielectric barrier discharge plasma actuator. Energies 2020, 13, 764. [Google Scholar] [CrossRef]
- De Giorgi, M.G.; Pescini, E.; Marra, F.; Ficarella, A. Plasma actuator scaling down to improve its energy conversion efficiency for active flow control in modern turbojet engines compressors. Appl. Therm. Eng. 2016, 106, 334–350. [Google Scholar] [CrossRef]
- Zhang, H.; Wu, Y.; Li, Y.; Yu, X.; Liu, B. Control of compressor tip leakage flow using plasma actuation. Aerosp. Sci. Technol. 2019, 86, 244–255. [Google Scholar] [CrossRef]
- Saddoughi, S.; Bennett, G.; Boespflug, M.; Puterbaugh, S.L.; Wadia, A.R. Experimental investigation of tip clearance flow in a transonic compressor with and without plasma actuators. In Proceedings of the ASME Turbo Expo 2014: Turbine Technical Conference and Exposition, Düsseldorf, Germany, 16–20 June 2014; Volume 2A. [Google Scholar] [CrossRef]
- Sharma, O.P.; Butler, T.L. Predictions of endwall losses and secondary flows in axial flow turbine cascades. Trans. ASME J. Turbomach. 1987, 109, 229–236. [Google Scholar] [CrossRef]
- Roth, J.R.; Sherman, D.M.; Wilkinson, S.P. Boundary layer flow control with a one atmosphere uniform grow discharge. In Proceedings of the 36th AIAA Aerospace Sciences Meeting and Exhibit, Reno, NV, USA, 12–15 January 1998. [Google Scholar] [CrossRef]
- Corke, T.C.; Post, M.L.; Orlov, D.M. SDBD plasma enhanced aerodynamics: Concepts, optimization and applications. Prog. Aerosp. Sci. 2007, 43, 193–217. [Google Scholar] [CrossRef]
- Corke, T.C.; Enloe, C.L.; Wilkinson, S.P. Dielectric barrier discharge plasma actuators for flow control. Annu. Rev. Fluid Mech. 2010, 42, 505–529. [Google Scholar] [CrossRef]
- Wang, J.J.; Choi, K.S.; Feng, L.H.; Jukes, T.N.; Whalley, R.D. Recent developments in DBD plasma flow control. Prog. Aerosp. Sci. 2013, 62, 52–78. [Google Scholar] [CrossRef]
- Matsunuma, T. Unsteady flow field of an axial-flow turbine rotor at a low Reynolds number. Trans. ASME J. Turbomach. 2007, 129, 360–371. [Google Scholar] [CrossRef]
- Ashpis, D.E.; Thurman, D.R. DBD Plasma Actuators for Flow Control in Air Vehicles and Jet Engines—Simulation of Flight Conditions in Test Chambers by Density Matching; TM-2011-217006; NASA: Washington, DC, USA, 2011. Available online: https://ntrs.nasa.gov/api/citations/20110008545/downloads/20110008545.pdf (accessed on 1 March 2022).
- Valerioti, J.A.; Corke, T.C. Pressure dependence of dielectric barrier discharge plasma flow actuators. AIAA J. 2012, 50, 1490–1502. [Google Scholar] [CrossRef]


| Parameter | Symbol | Value |
|---|---|---|
| Number of blades | N | 6 |
| Chord length | C | 58.65 mm |
| Axial chord length | Cax | 49.43 mm |
| Blade height | H | 75.00 mm |
| Blade pitch | S | 35.47 mm |
| Inlet flow angle | αin | 51.86° |
| Outlet flow angle | αout | 58.74° |
| Turning angle | αin+ αout | 110.60° |
| Stagger angle | ξ | 33.43° |
| Location No. | Z (mm) | Z/Cax |
|---|---|---|
| 1 | −17.1 | −0.35 |
| 2 | −10.0 | −0.20 |
| 3 | −2.9 | −0.06 |
| 4 | 4.1 | 0.08 |
| 5 | 11.2 | 0.23 |
| 6 | 18.3 | 0.37 |
| 7 | 25.4 | 0.51 |
| Rotating Speed of the Blower (Hz) | Inlet Velocity, UFS,in (m/s) | Outlet Velocity, UFS,out (m/s) | Reynolds Number, Reout |
|---|---|---|---|
| 225 | 3.9 | 4.7 | 1.8 × 10⁴ |
| 450 | 7.9 | 9.4 | 3.7 × 10⁴ |
| Reynolds Number Reout | Figure Number | Various Parameters | Passage 1 (Inside) | Passage 2 (Exit) | Passage 3 (Downstream) | |||
|---|---|---|---|---|---|---|---|---|
| Position Z/Cax | Reduction Ratio | Position Z/Cax | Reduction Ratio | Position Z/Cax | Reduction Ratio | |||
| 1.8 × 10⁴ | Figure 8 | Peak velocity | −0.06 | 46% | −0.35 | 63% | −0.35 | 47% |
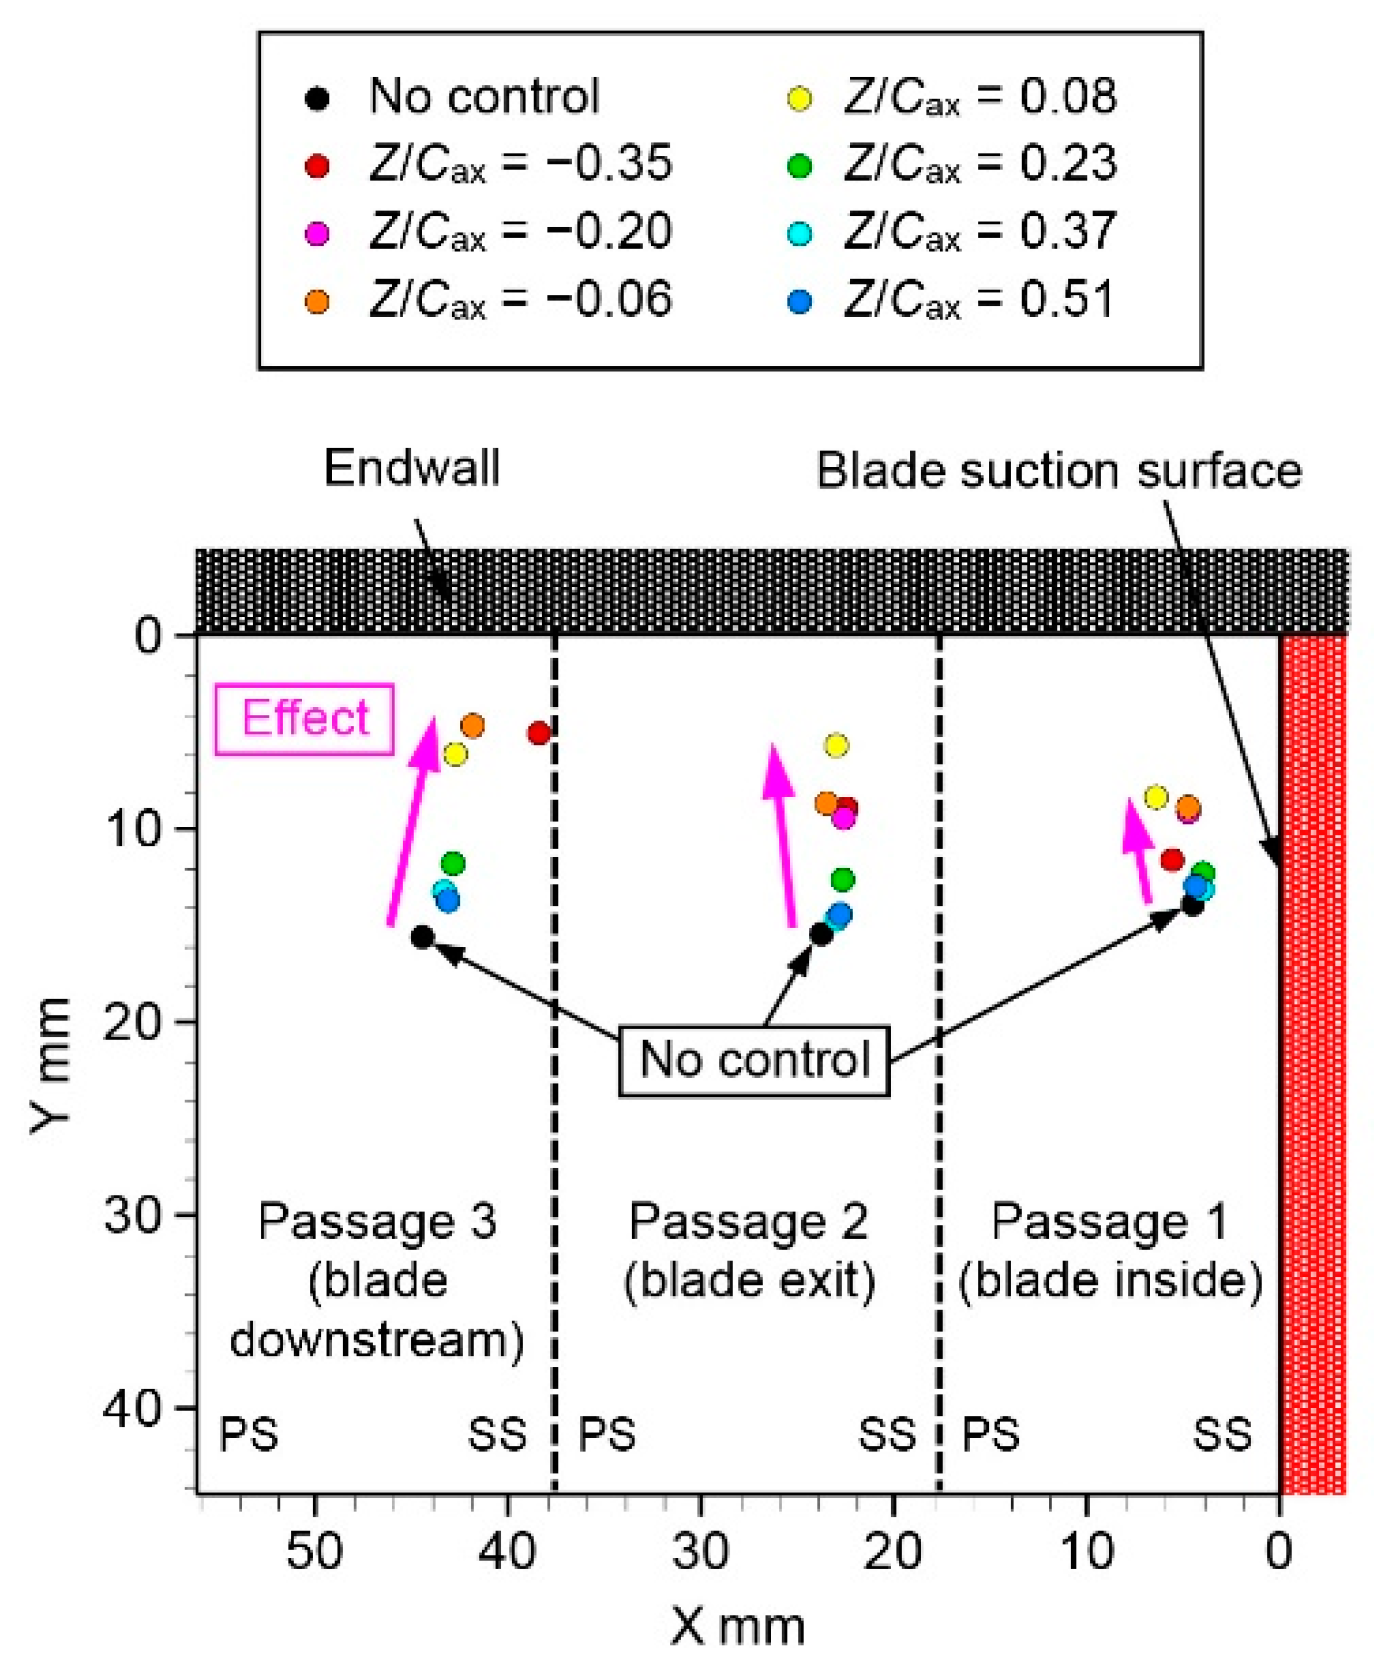
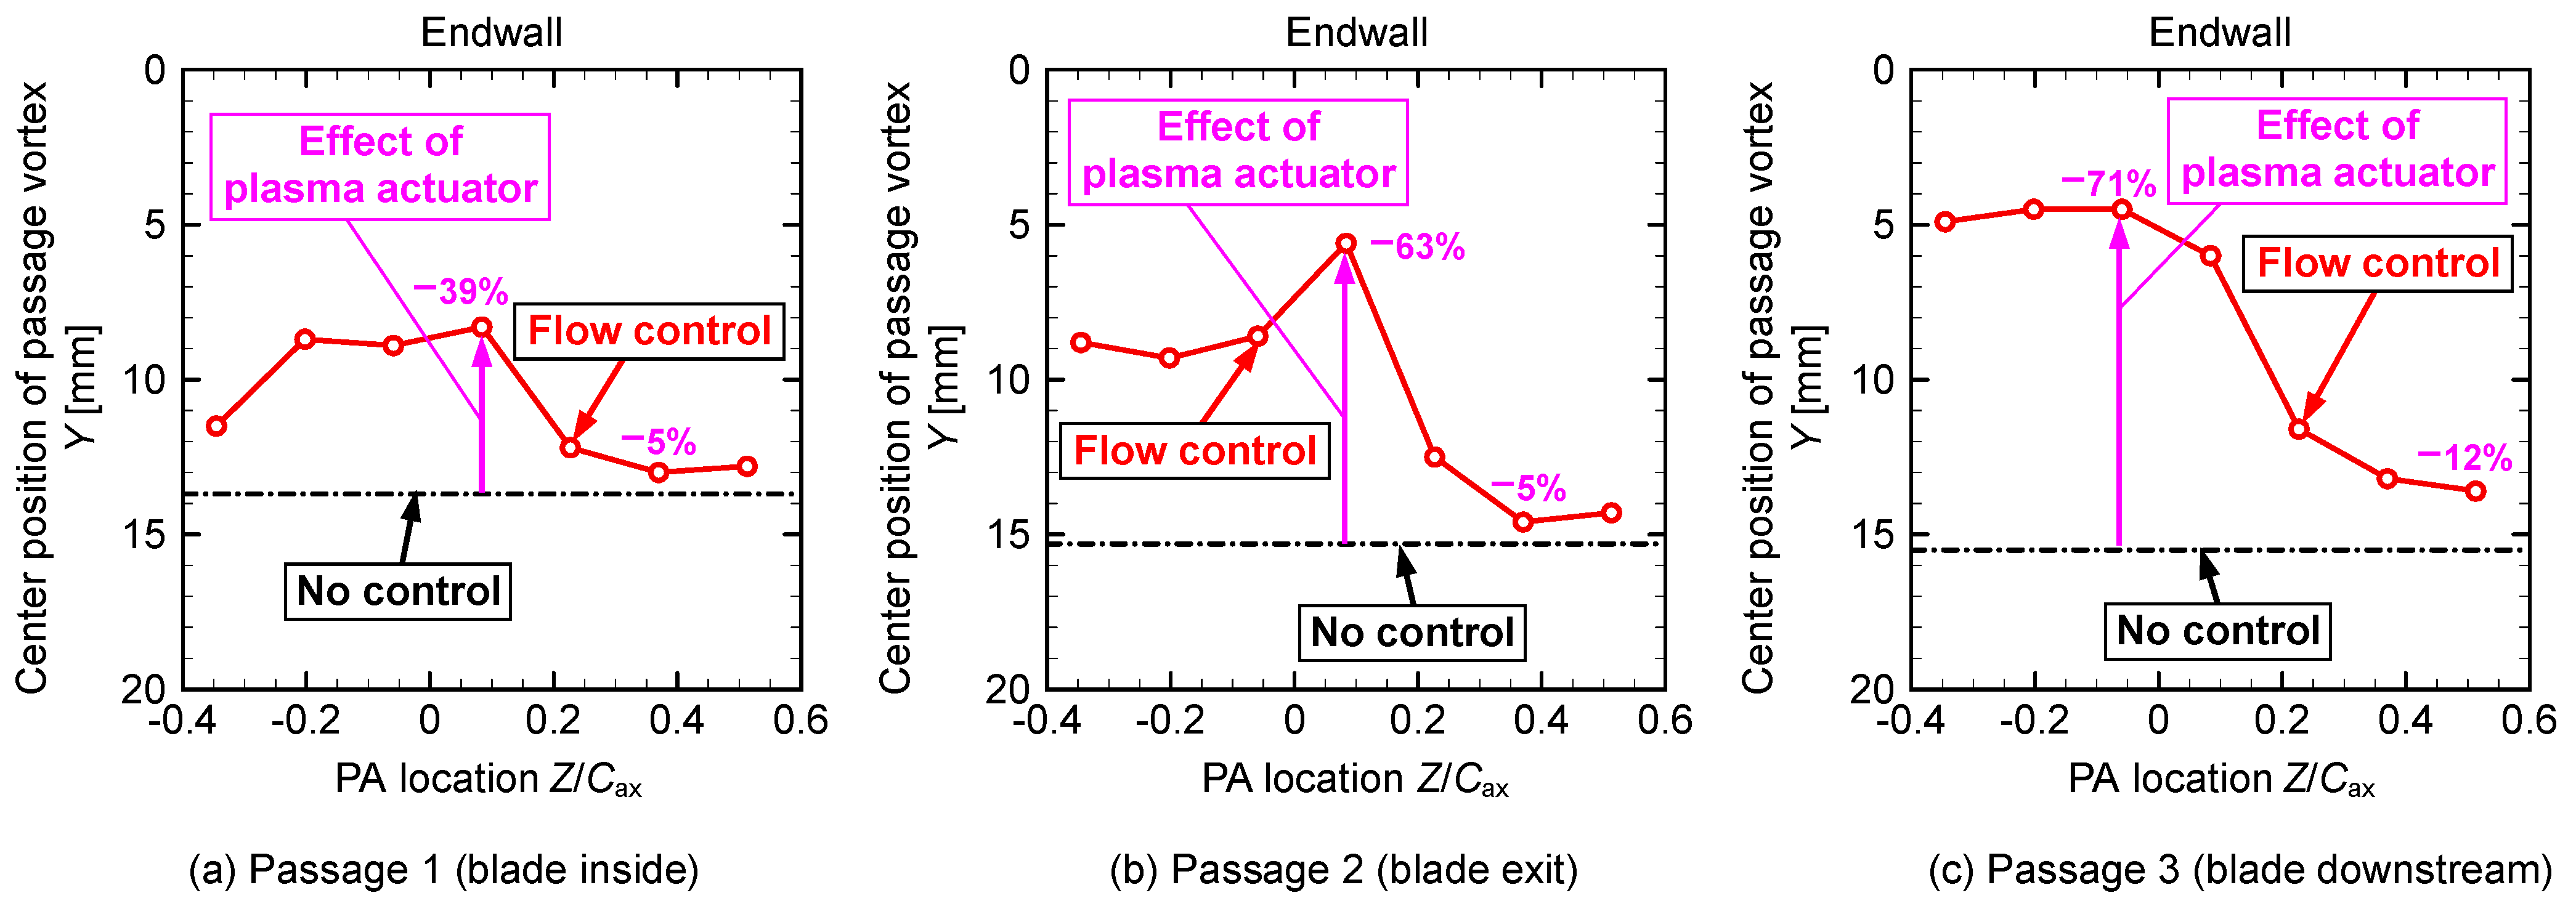
| Figure 11 | PV center position | 0.08 | 39% | 0.08 | 63% | −0.06 | 71% | |
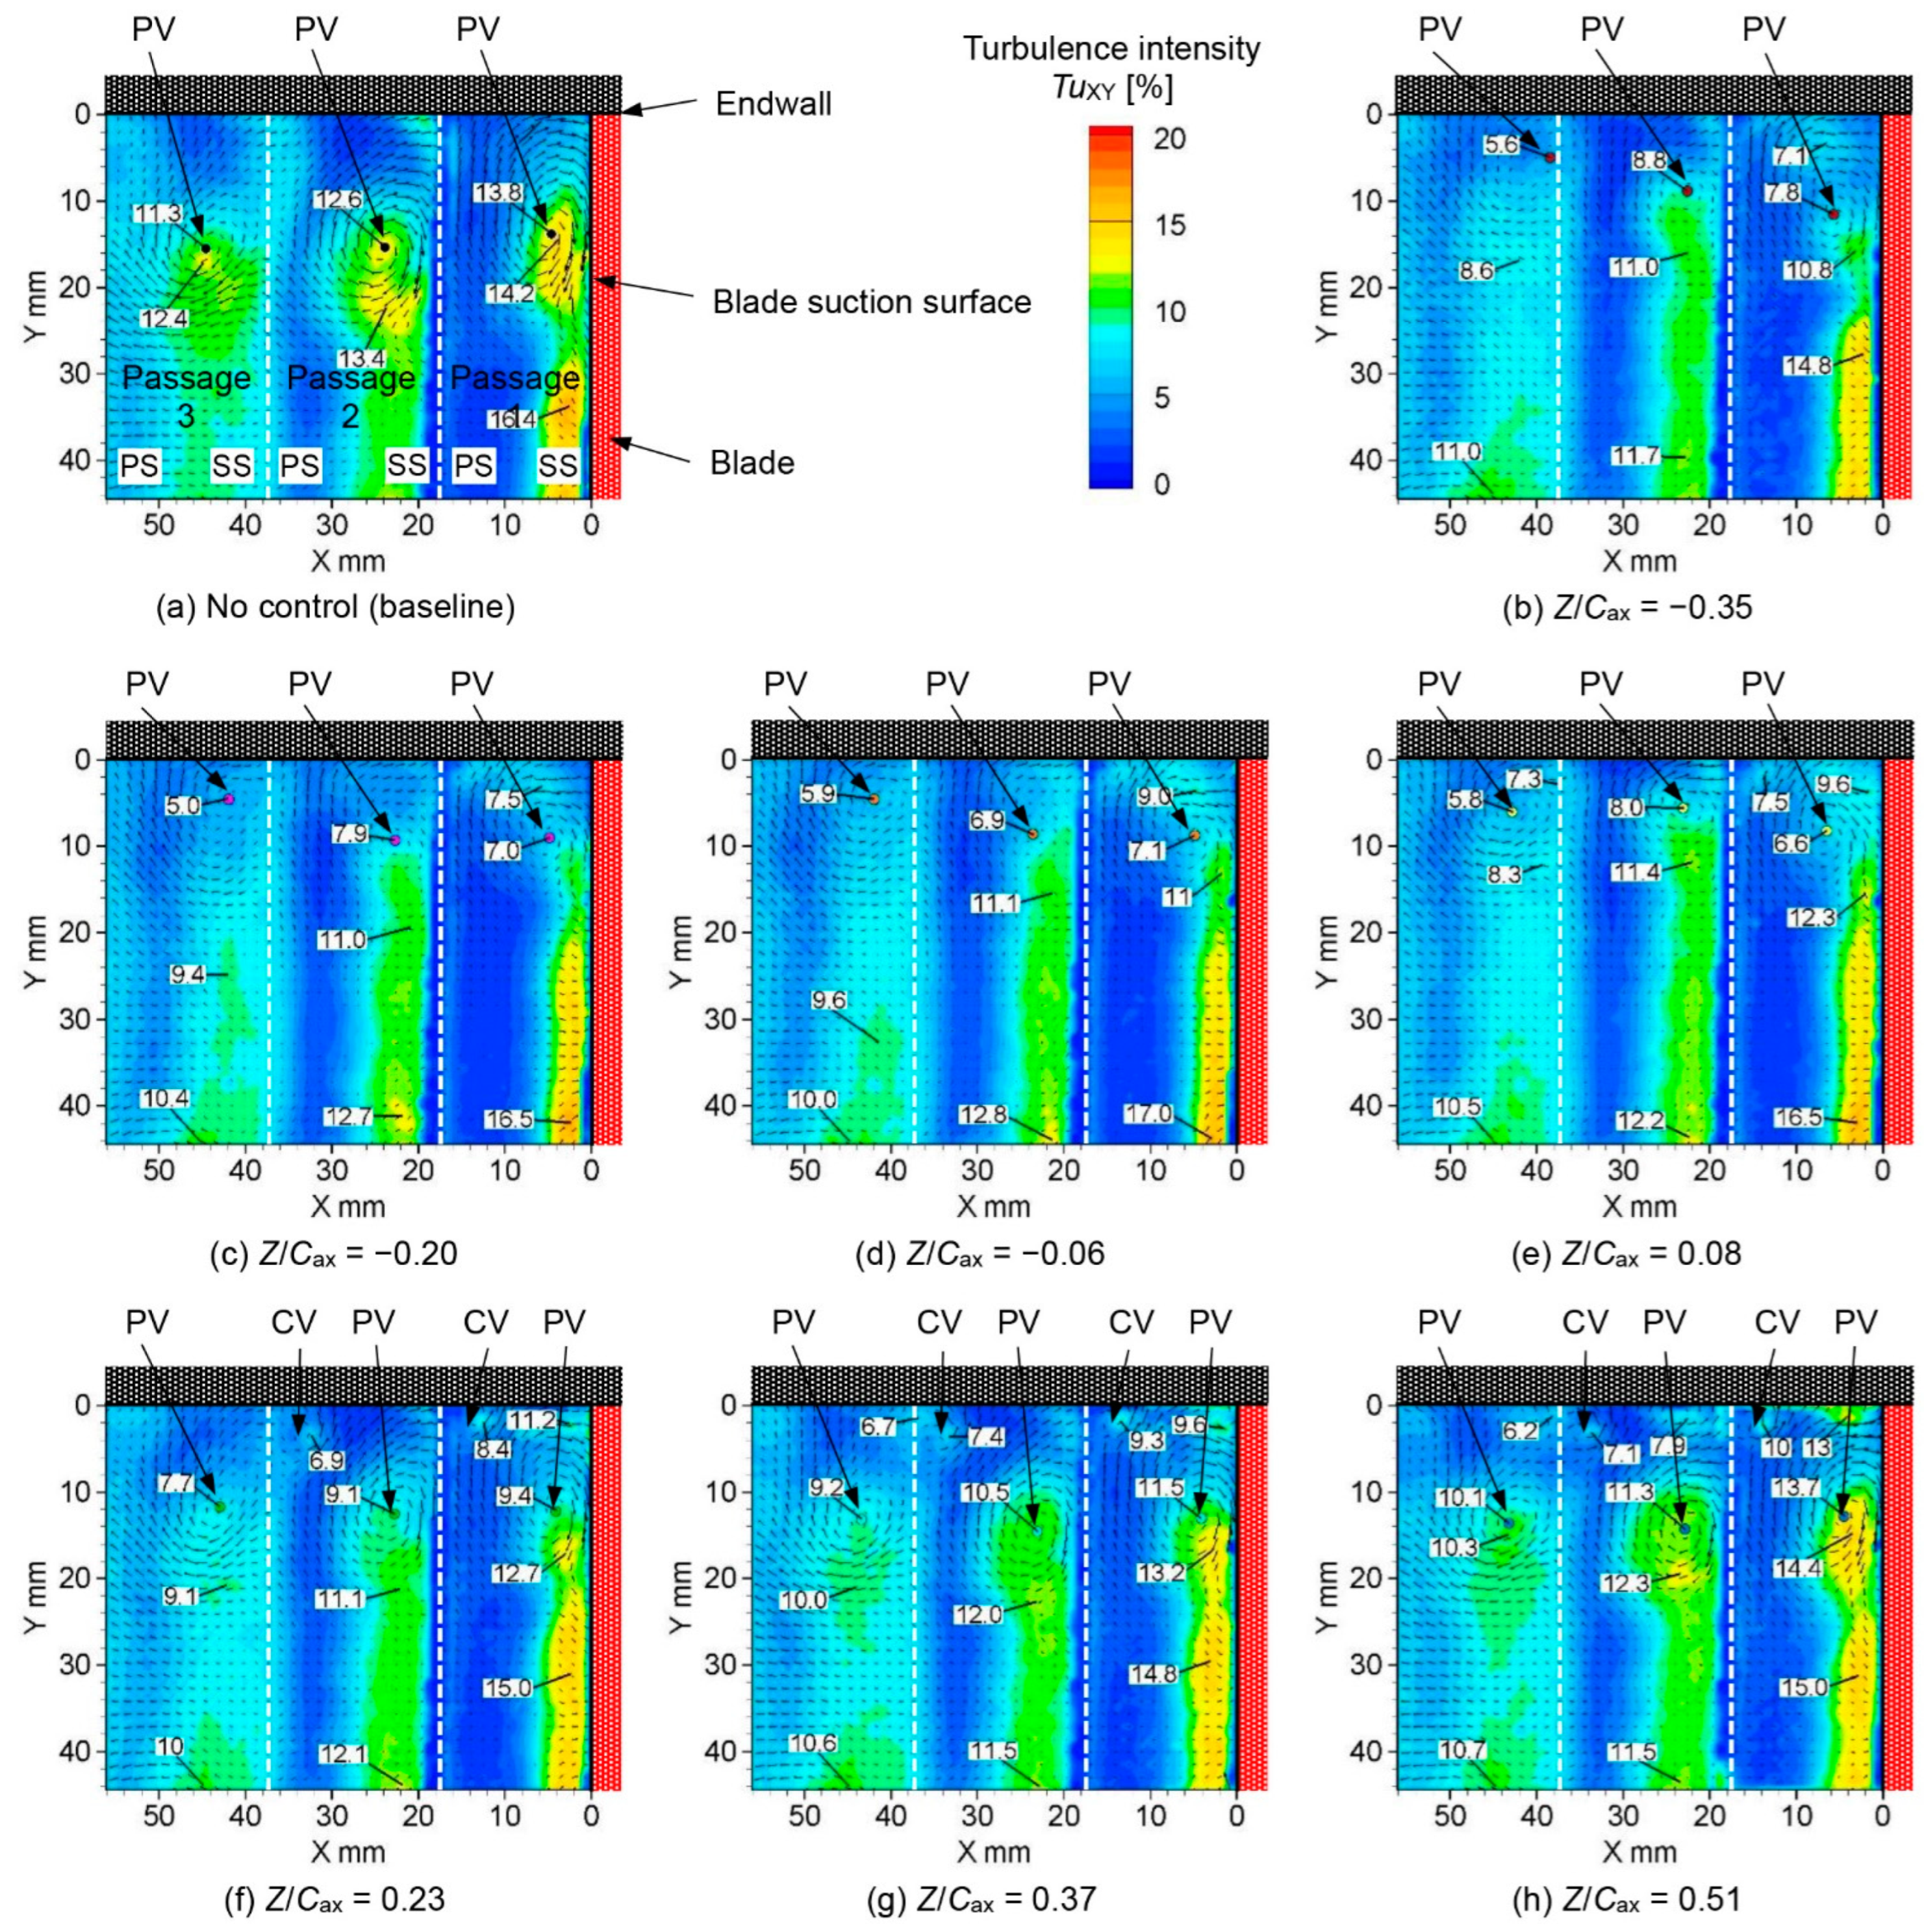
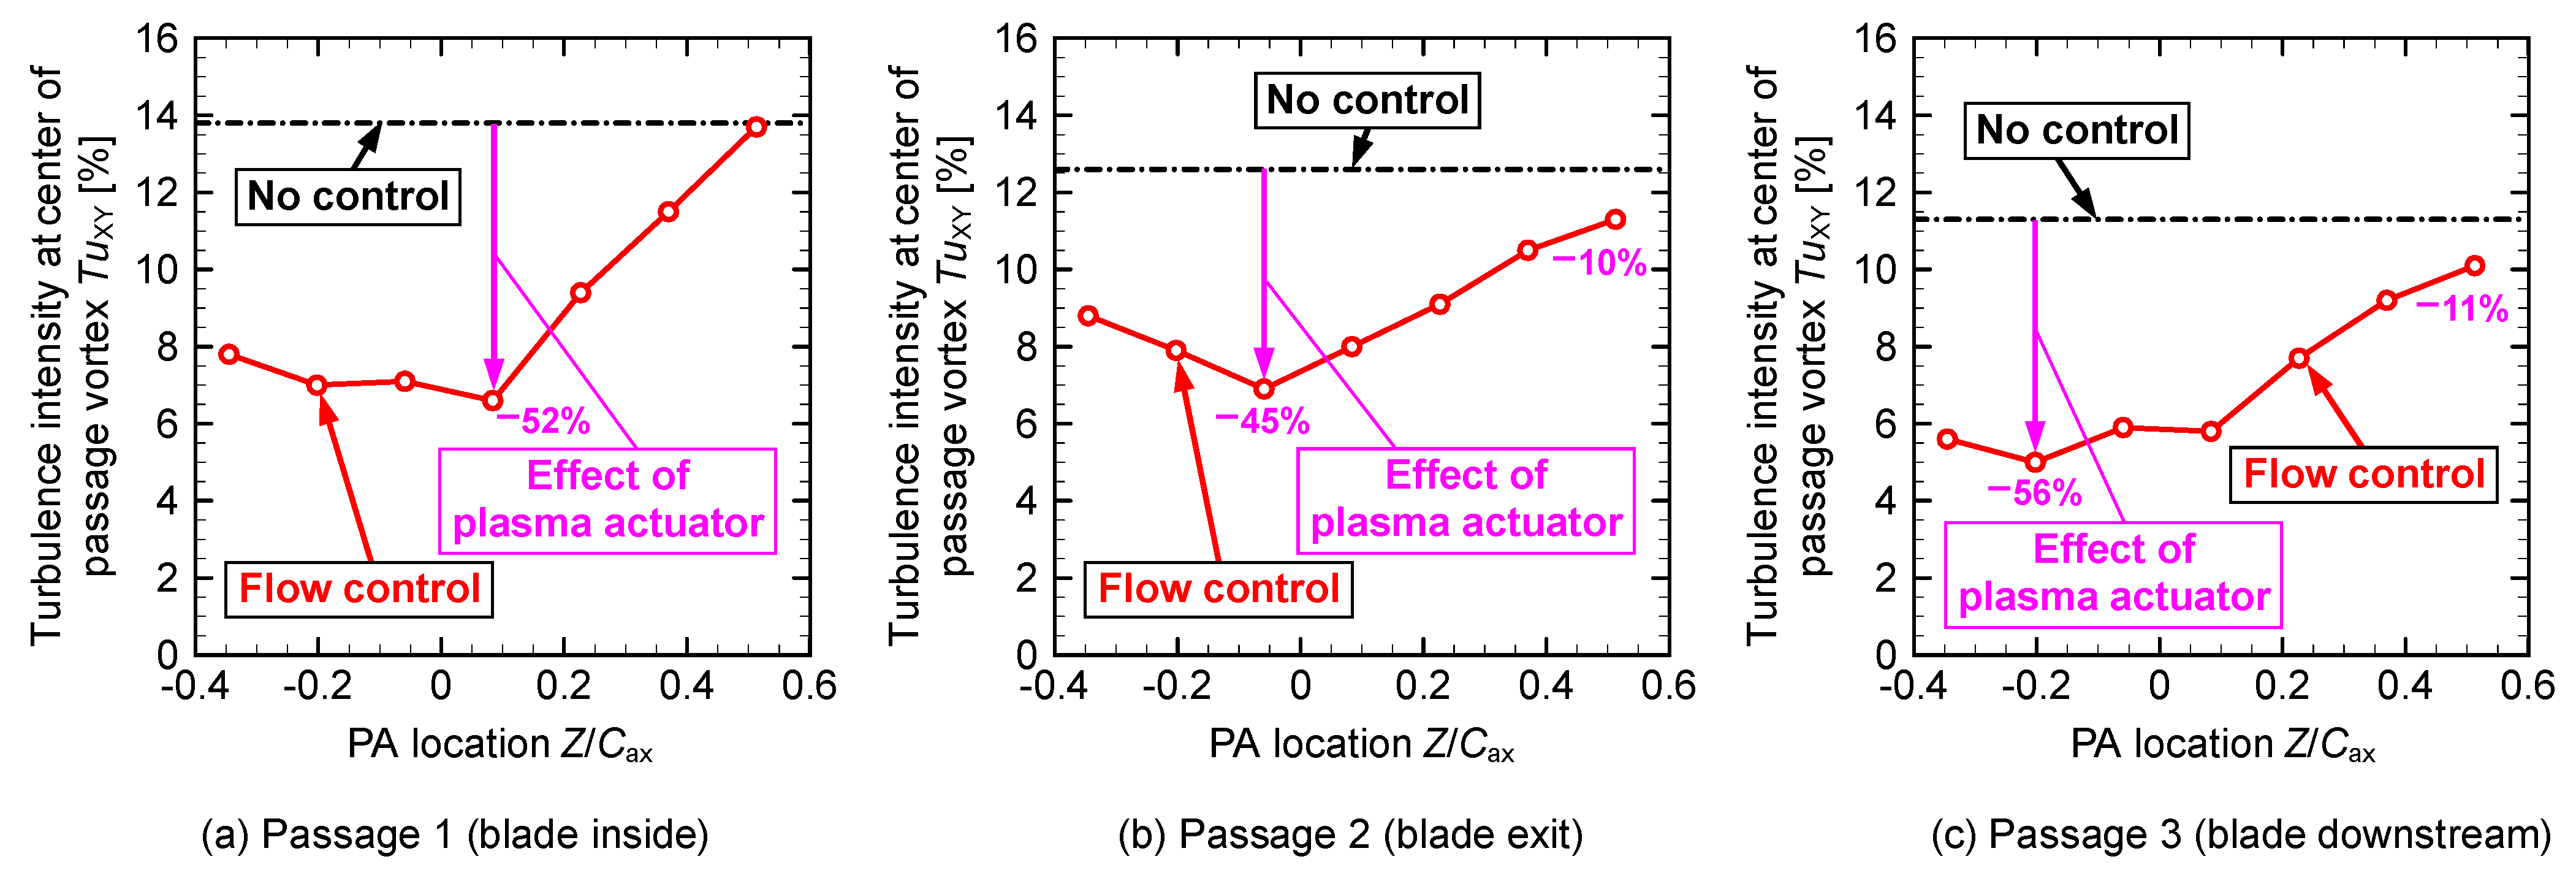
| Figure 13 | Turbulence intensity | 0.08 | 52% | −0.06 | 45% | −0.20 | 56% | |
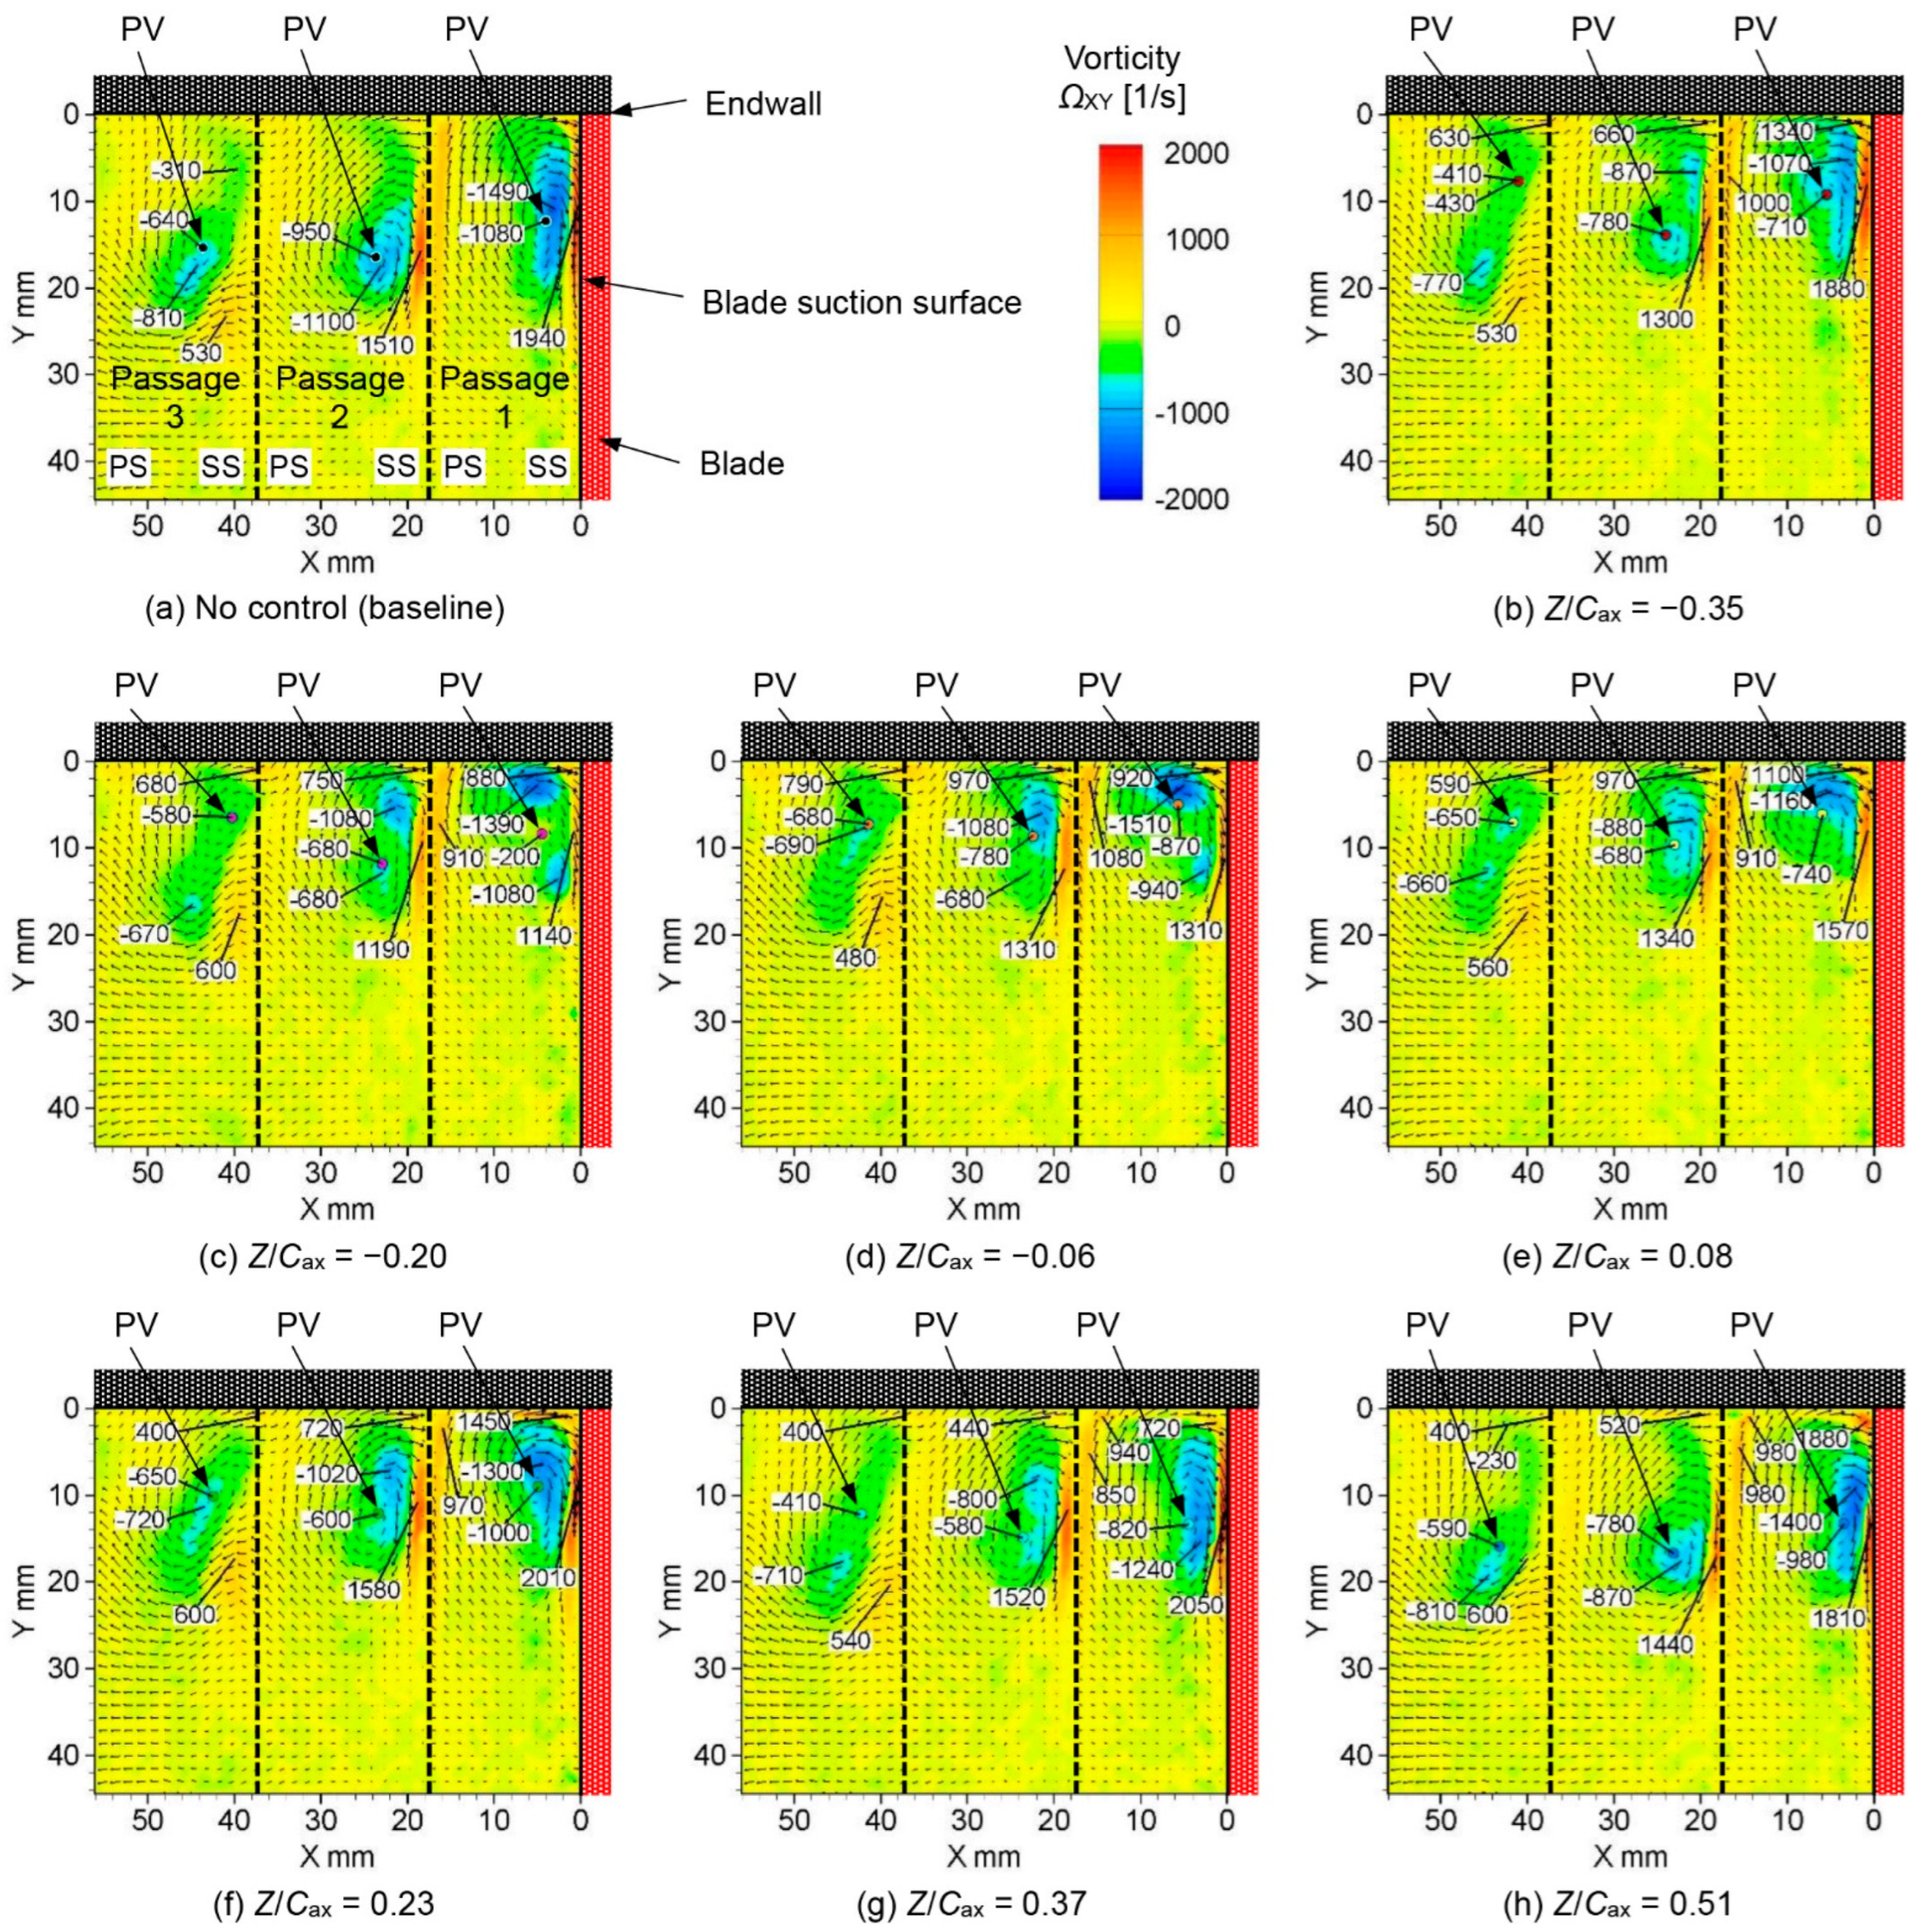
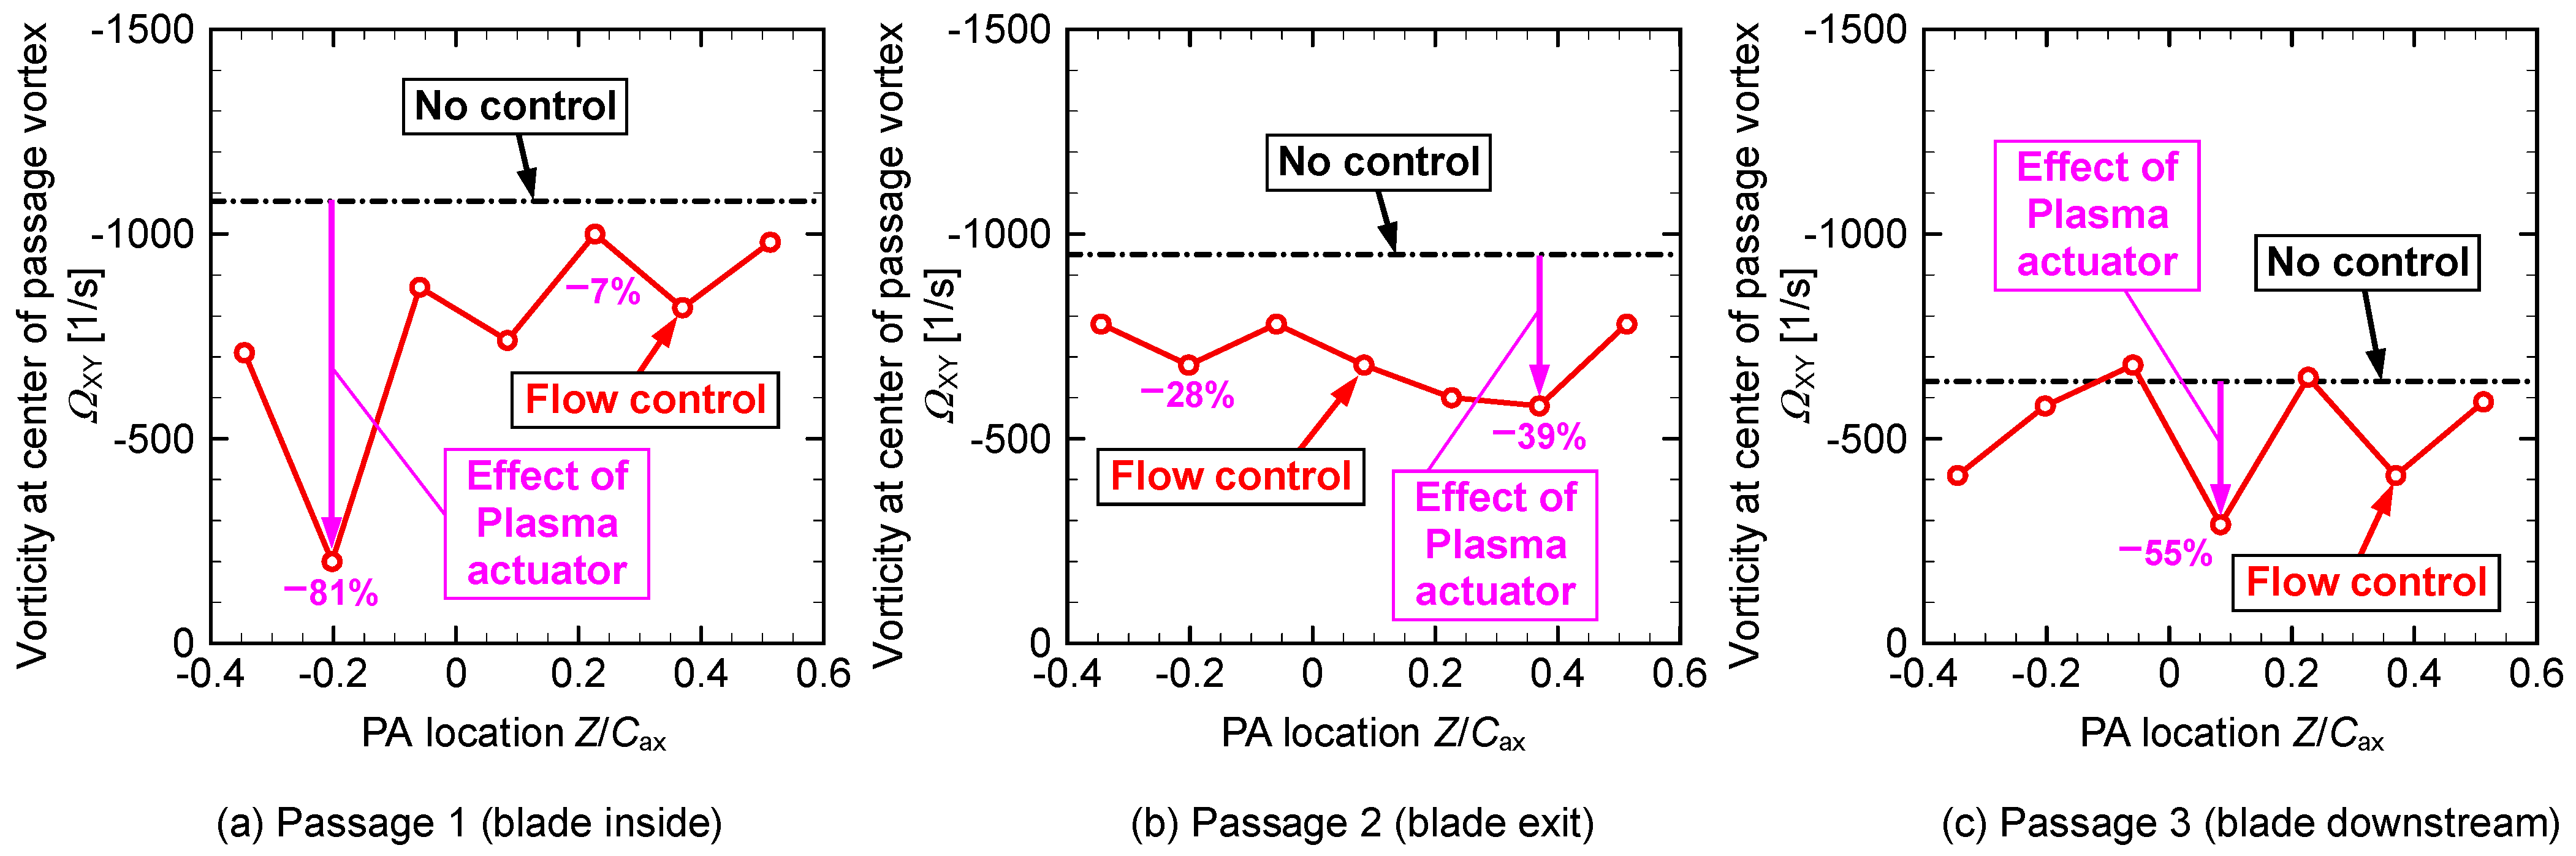
| Figure 15 | Vorticity at PV center | −0.06 | 59% | −0.06 | 71% | −0.35 | 80% | |
| Figure 16 | Peak vorticity | −0.20 | 51% | −0.20 | 62% | −0.35 | 65% | |
| 3.7 × 10⁴ | Figure 18 | Peak velocity | −0.35 | 5% | −0.35 | 20% | −0.20 | 24% |
| Figure 21 | PV center position | −0.06 | 59% | −0.06 | 48% | −0.20 | 59% | |
| Figure 23 | Turbulence intensity | −0.20 | 58% | −0.20 | 27% | −0.35 | 45% | |
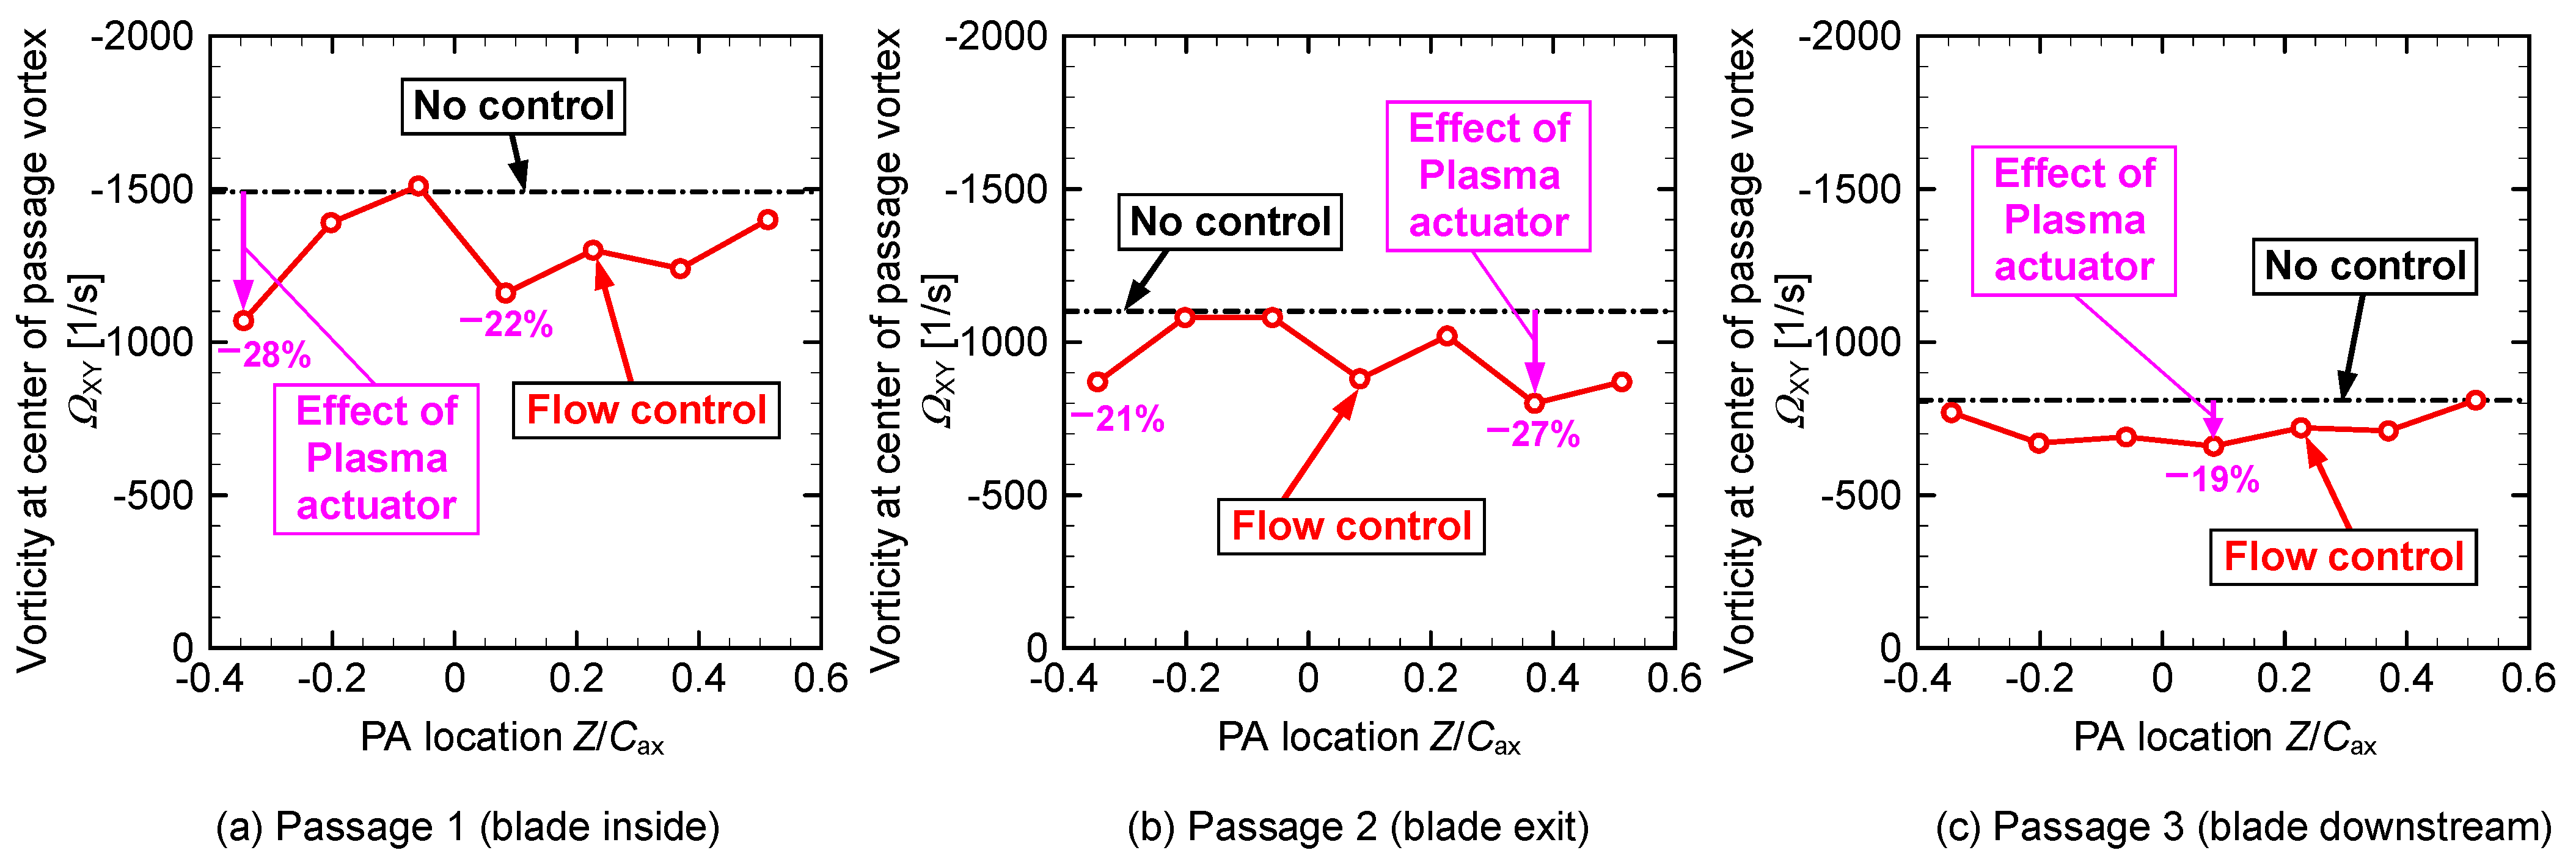
| Figure 25 | Vorticity at PV center | −0.20 | 80% | 0.37 | 39% | 0.08 | 55% | |
| Figure 26 | Peak vorticity | −0.35 | 28% | 0.37 | 27% | 0.08 | 19% | |
Publisher’s Note: MDPI stays neutral with regard to jurisdictional claims in published maps and institutional affiliations. |
© 2022 by the author. Licensee MDPI, Basel, Switzerland. This article is an open access article distributed under the terms and conditions of the Creative Commons Attribution (CC BY) license (https://creativecommons.org/licenses/by/4.0/).
Share and Cite
Matsunuma, T. Effects of the Installation Location of a Dielectric Barrier Discharge Plasma Actuator on the Active Passage Vortex Control of a Turbine Cascade at Low Reynolds Numbers. Actuators 2022, 11, 129. https://doi.org/10.3390/act11050129
Matsunuma T. Effects of the Installation Location of a Dielectric Barrier Discharge Plasma Actuator on the Active Passage Vortex Control of a Turbine Cascade at Low Reynolds Numbers. Actuators. 2022; 11(5):129. https://doi.org/10.3390/act11050129
Chicago/Turabian StyleMatsunuma, Takayuki. 2022. "Effects of the Installation Location of a Dielectric Barrier Discharge Plasma Actuator on the Active Passage Vortex Control of a Turbine Cascade at Low Reynolds Numbers" Actuators 11, no. 5: 129. https://doi.org/10.3390/act11050129
APA StyleMatsunuma, T. (2022). Effects of the Installation Location of a Dielectric Barrier Discharge Plasma Actuator on the Active Passage Vortex Control of a Turbine Cascade at Low Reynolds Numbers. Actuators, 11(5), 129. https://doi.org/10.3390/act11050129