1. Introduction
Structural health monitoring (SHM) is a technique for analyzing the structural integrity and degradation of a component to increase reliability and safety [
1,
2,
3,
4,
5].
For metal or composite laminates, the advantages of ultrasonic guided waves (UGWs) are well known, and the basic theory and applications can be found in [
6,
7].
Currently, the adoption of UGWs is becoming common for damage monitoring of large structures (several square meters) such as aircraft wings, space modules or pipelines [
8,
9,
10].
A challenge for the design of UGW SHM systems is the density of sensors and their connectivity to reduce the burden of cabling. A comparison of different solutions can be found in [
11]. A common solution is the adoption of isotropic piezoelectric wafer active sensors (PWAS) [
12,
13,
14,
15,
16]. The solution of piezoelectric isotropic transducers has the advantage of simple fabrication, but its wideband response (typically up to 1 MHz) complicates the signal interpretation due to multimodal excitation and phase velocity dispersion. Moreover, a high transduction efficiency of a selected UGW mode is necessary to obtain a high detection sensitivity for a type of damage, in which case IDTs with tunable electrode geometry are preferred. The two main Lamb waves guided modes—antisymmetric (A0) and symmetric (S0) modes—are commonly used to detect defects on the surface or within the laminate under test. Some designs of IDT have also explored the shear horizontal (SH) non-dispersive mode selection propagating at the Rayleigh velocity [
17]. For mode selection, there are design models of IDT electrode geometry, with one of the first published by Monkhouse et al. [
18] using a piezopolymer film. More recently, the advantage of transducer design with mechanically flexible piezopolymers (e.g., PVDF) was demonstrated to generate Lamb waves in aerospace SHM systems [
19,
20,
21]. For the sake of completeness, tunability at different frequencies can be achieved by a particular electrode’s geometry being different from IDT, such as the spiral one proposed and validated by De Marchi et al. [
22]. We remind the reader of the importance of mode selection according to the theory of UGW propagation, which determines the operating frequency based on the dispersion curves of phase velocity for a given laminate [
23,
24]. In general IDTs are used in active mode in the pitch and catch configuration for covering large distances with a selected UGW mode. The width of fingers is chosen to reach a natural focusing providing the required narrow beam. In this paper we study the design of the electrode geometry to expand the use of IDTs in a configuration different from pitch and catch. In this view, the papers [
25,
26,
27] provided an extensive review of the technology for tunable IDTs constructed with piezoelectric micro-fiber-composites (MFCs) and a systematic design approach based on finite element modelling (FEM). The following works [
28,
29] introduced the apodization concept for the finger length of IDTs to achieve the regularization of the frequency response and the symmetrical radiation pattern along the IDT axis; it is interesting to note that finger length apodization was first introduced decades ago for surface acoustic wave (SAW) devices [
30] for similar purposes. The adoption of MFC was introduced to overcome the limitation of the piezopolymer films of a low electrical to acoustic piezoelectric conversion and gaining resistance to vibrations and extreme temperatures. However, there are several SHM applications (e.g., ISS habitation modules) where the operative temperature range is below 100 °C and the mechanical stress (vibration, thermal expansion) is large enough that the choice of piezopolymer films becomes adequate. In fact, piezopolymer film production has made important progress recently for automotive applications (e.g., see [
31]).
This paper reports a design method for piezopolymer IDTs based on FEM simulations with a comprehensive analysis of the influence on mode selection and beam pattern. This work shows how the metallization pattern dimensions and shape can be designed to customize the IDT for monitoring complex structures where the simple pitch and catch configuration is not suitable for active monitoring. Both mode selection and beam divergence are the main design parameters that need to be treated with a systematic design approach for optimizing the performance of the IDTs. The authors also showed in previous papers that any electrode geometry can easily be fabricated by laser ablation on piezopolymer films, and it represents a quick and cheap technology [
25]. In addition to some specific design choices related to the adoption of laser ablation, the results presented in this work can be extended to different IDT fabrication technologies based on different piezoelectric materials such as PZT, MFC or sprayed piezoelectric powders [
26].
The paper is organized as follows.
Section 2 reports the analysis of IDT electrode geometry also including the effects of the electrical connections of the fingers.
Section 3 is a detailed description of the solutions for building an IDT FEM. In
Section 4, the results are reported for the analysis of varying all dimensions of the rectangular geometry of a comb type IDT and the advantages of a scaled electrode geometry for achievement of a shaped beam pattern.
Section 5 describes the experimental setup used for the validation of the simulated results for piezopolymer IDTs, and finally the discussion of results with a comparison between simulations and experiments on a laboratory mock-up.
2. Analysis of IDT Geometries
This section first reports the geometrical characteristics of the regular geometry of an interdigital electrode pattern. Later we will show how this basic design approach can be improved by understanding the influence of other dimensional parameters. Citations [
27,
29,
32] are state-of-the-art investigations of the influence of electrode geometry on IDT characteristics. For a comb type IDT, the beam divergence angle
can be designed according to:
where
represents the wavelength of selected UGW and L defines the length of the comb elements. Thus, γ defines the equivalent aperture of the longitudinal beam pattern, centered in the middle of active electrodes.
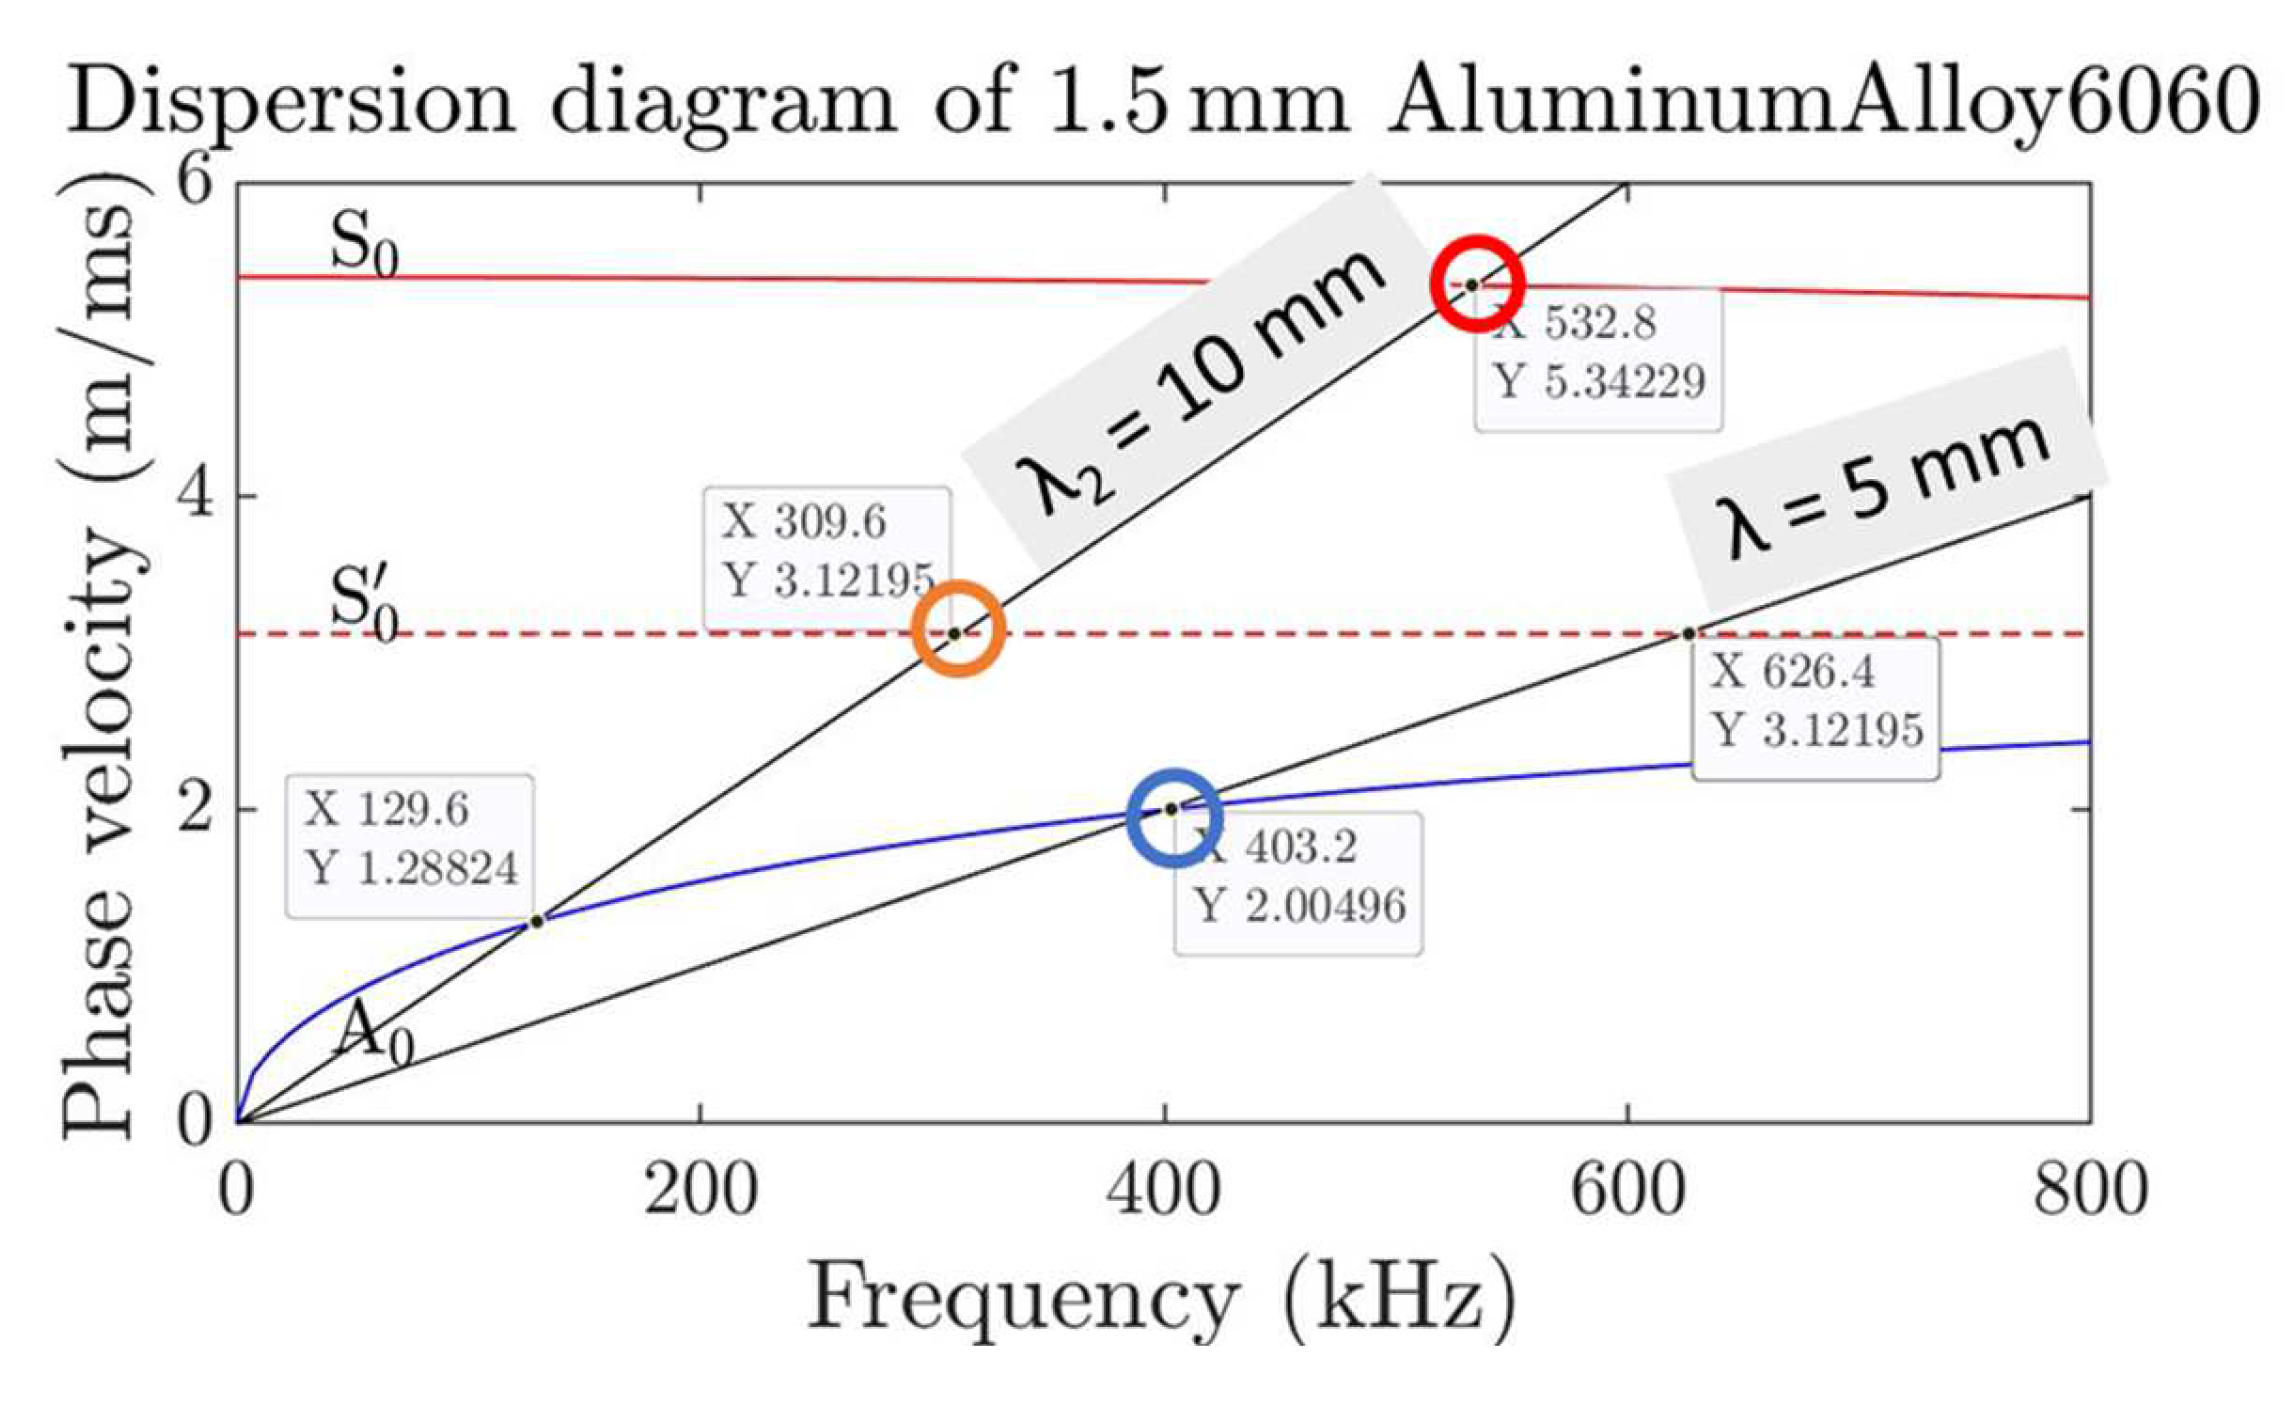
For an IDT mounted on a laminate with thickness d, the propagation mode selection is defined by the intersection between laminate dispersion curves, phase velocity Vp versus frequency–laminate thickness product
, and can be predicted by the following relationship between
, d and Vp:
where
is the transducer operating frequency.
It is well known that Equation (2) defines a straight line in the phase velocity vs
domain, and the intersections with the different dispersion modes define the selection of the desired mode [
33,
34].
As shown in
Figure 1, for an isotropic and homogeneous laminate material, there are many different types of modes that can be excited. It is worth remembering that A
0 and S
0 dispersive modes are typically used for damage detection and monitoring, but the excitation of the
(known as Shear Horizontal or SH mode) is of interest in achieving a quasi-nondispersive (quasi—Rayleigh) mode in the higher range of frequency x thickness product. This could be an advantage when the same transducers are used on a planar structure with different thickness; from the aim of a design of a multimodal IDT, it is also important to analyze and verify the different conversion efficiency of the modes A
0, S
0 and
.
Conversely, modes and , have dispersive characteristics and the selection of a specific mode depends on the project requirements, including the defect type.
The authors of [
18] demonstrated the defect detection capability of an SHM for composite pressure vessels, using a set of piezopolymers (PVDF-TrFE), using signal processing based on a frequency sweep and excitation mode selection by a programmable electronic AFE. The results were encouraging, but also showed some limitations for area coverage with low transducer spatial density and adaptability to the different thickness of the composite pressure vessel. The basic design of an IDT with a regular geometry with comb patterned electrodes designed according to Equations (1) and (2), was determined to be insufficient for optimizing the performance of the whole system.
The authors then deepened the analysis of the UGW generation from an IDT with regular comb geometry, and the main outcomes are reported in the next section.
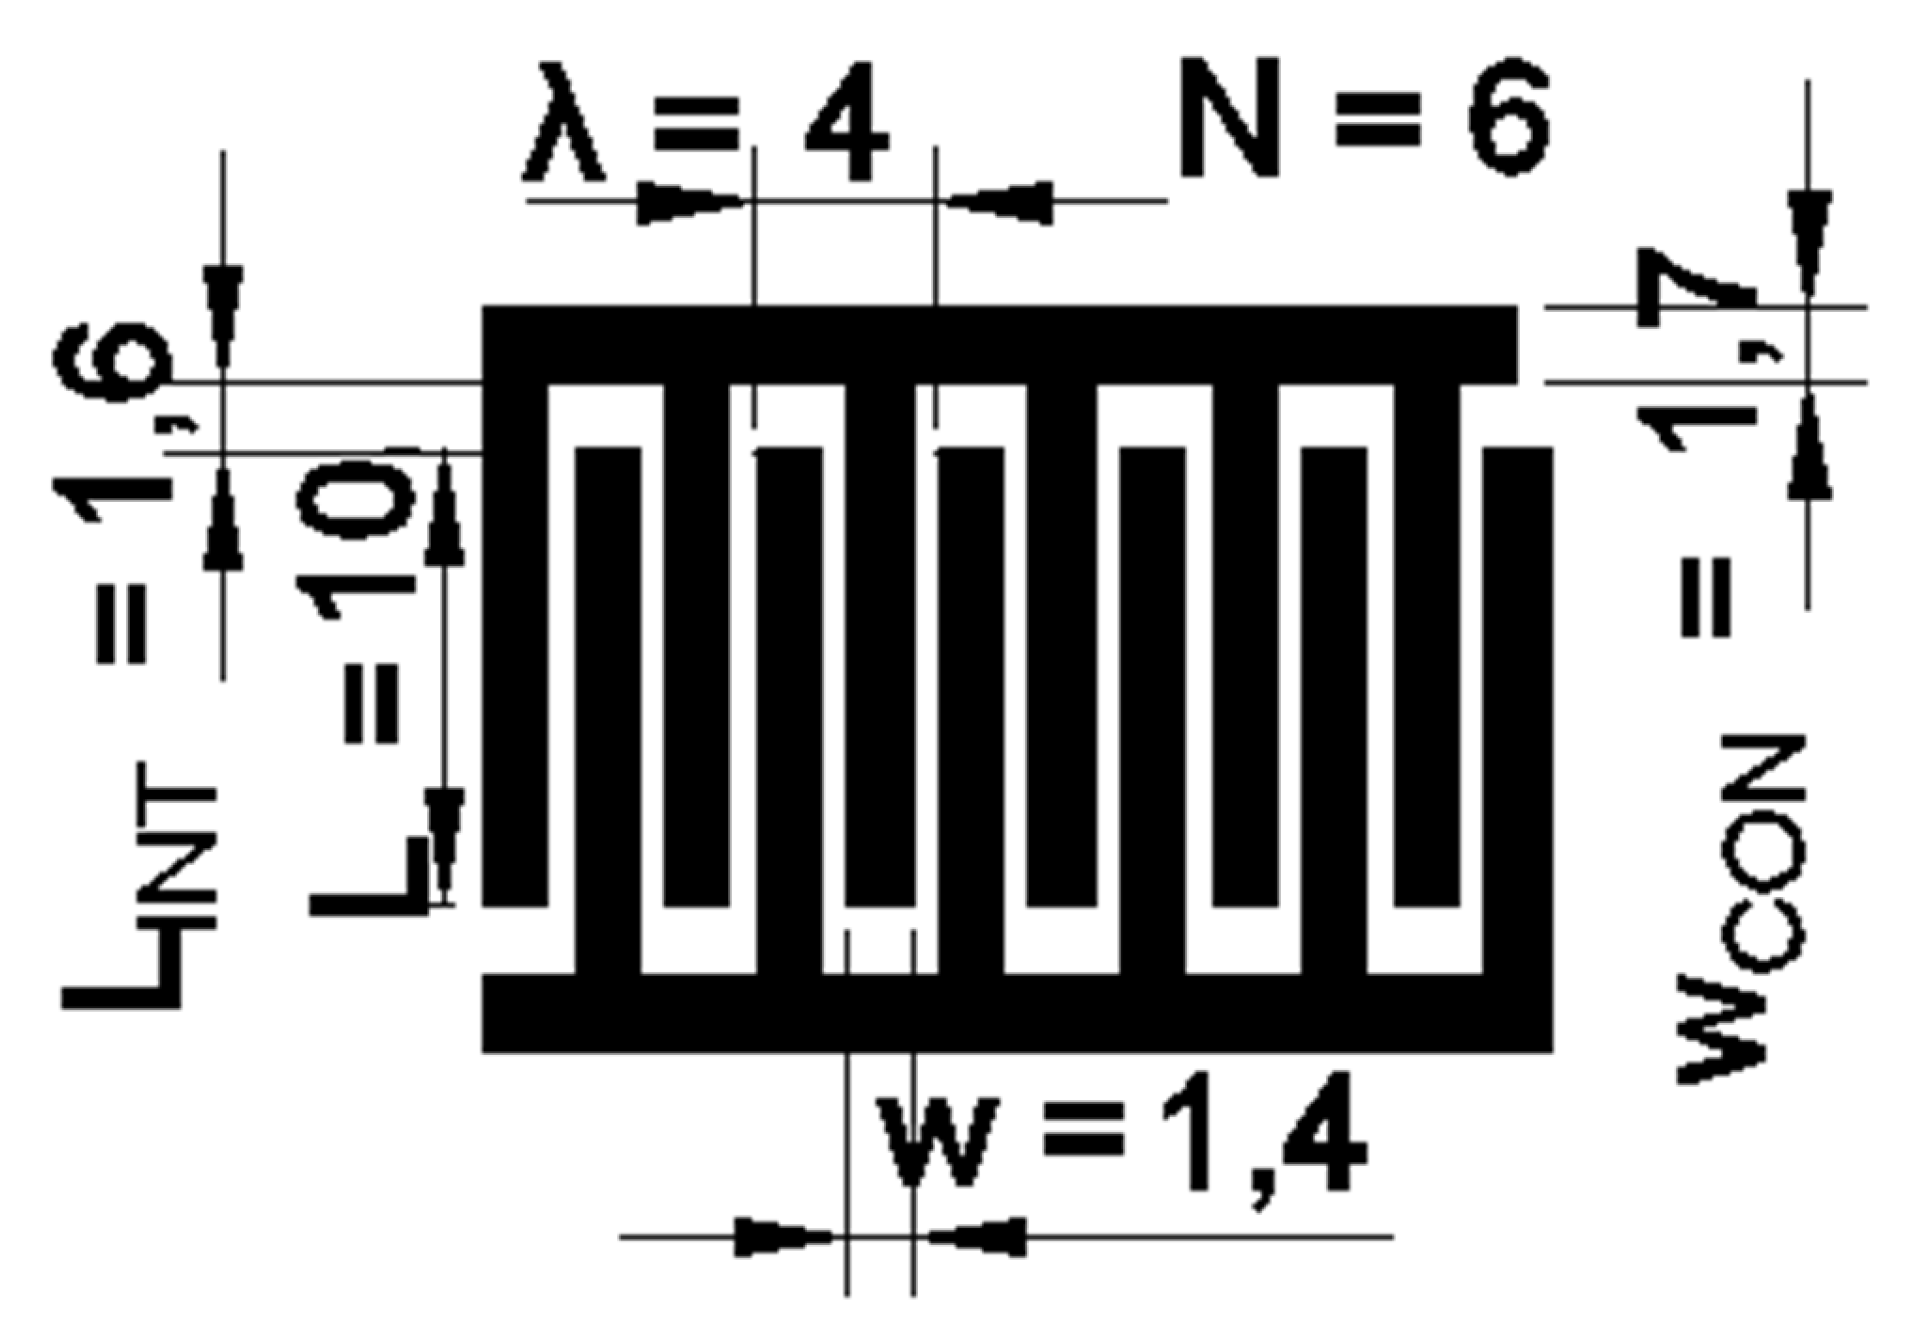
As an example, in
Figure 2 (top), a regular comb pattern design for the IDT electrodes is shown, where the distance between two elements is
, for operating on an aluminium plate with thickness d = 1.5 mm; according to Equations (1) and (2) we obtain gamma and
/d.
Figure 2 also introduces other geometrical parameters that influence the IDT performance and will be studied in
Section 4. These parameters are listed below:
- -
, number of active elements of the same electrode;
- -
, distance between the end of finger electrodes and the bus bars;
- -
width of elements.
All these parameters affect the operation of the transducer. In the case of N, the more elements, the greater the active surface below the electrodes layer. However, too many elements generate spurious phenomena due to coupling between nonadjacent elements. LINT also defines a constructive interference of excitation system between combs. Lastly, a different width element, w, defines a different active area but increases the lambda gap,
, of excitable UGWs.
A consequence of the choice of the dimensions of the above parameters is obviously the dimension of the active area of the IDT which influences the piezoelectric conversion factors. The shape of electrodes is a crucial part of the IDT design and one of the main motivations for a specific modelling process for the shape of the electrodes. An analysis of the influence on the symmetrical beam pattern was published by Wang et al. [
36].
4. Simulation Analysis of Different Electrode Pattern Geometries
Through the study in a simulated environment, numerous wave generation and propagation phenomena have been studied, first the effects introduced by the electrical connections capable of bringing equipotential to the elements of the same comb. In several previous works [
39,
40,
41] they have been considered as N active elements of area
, leading to radiation patterns along the main axis of the transducer.
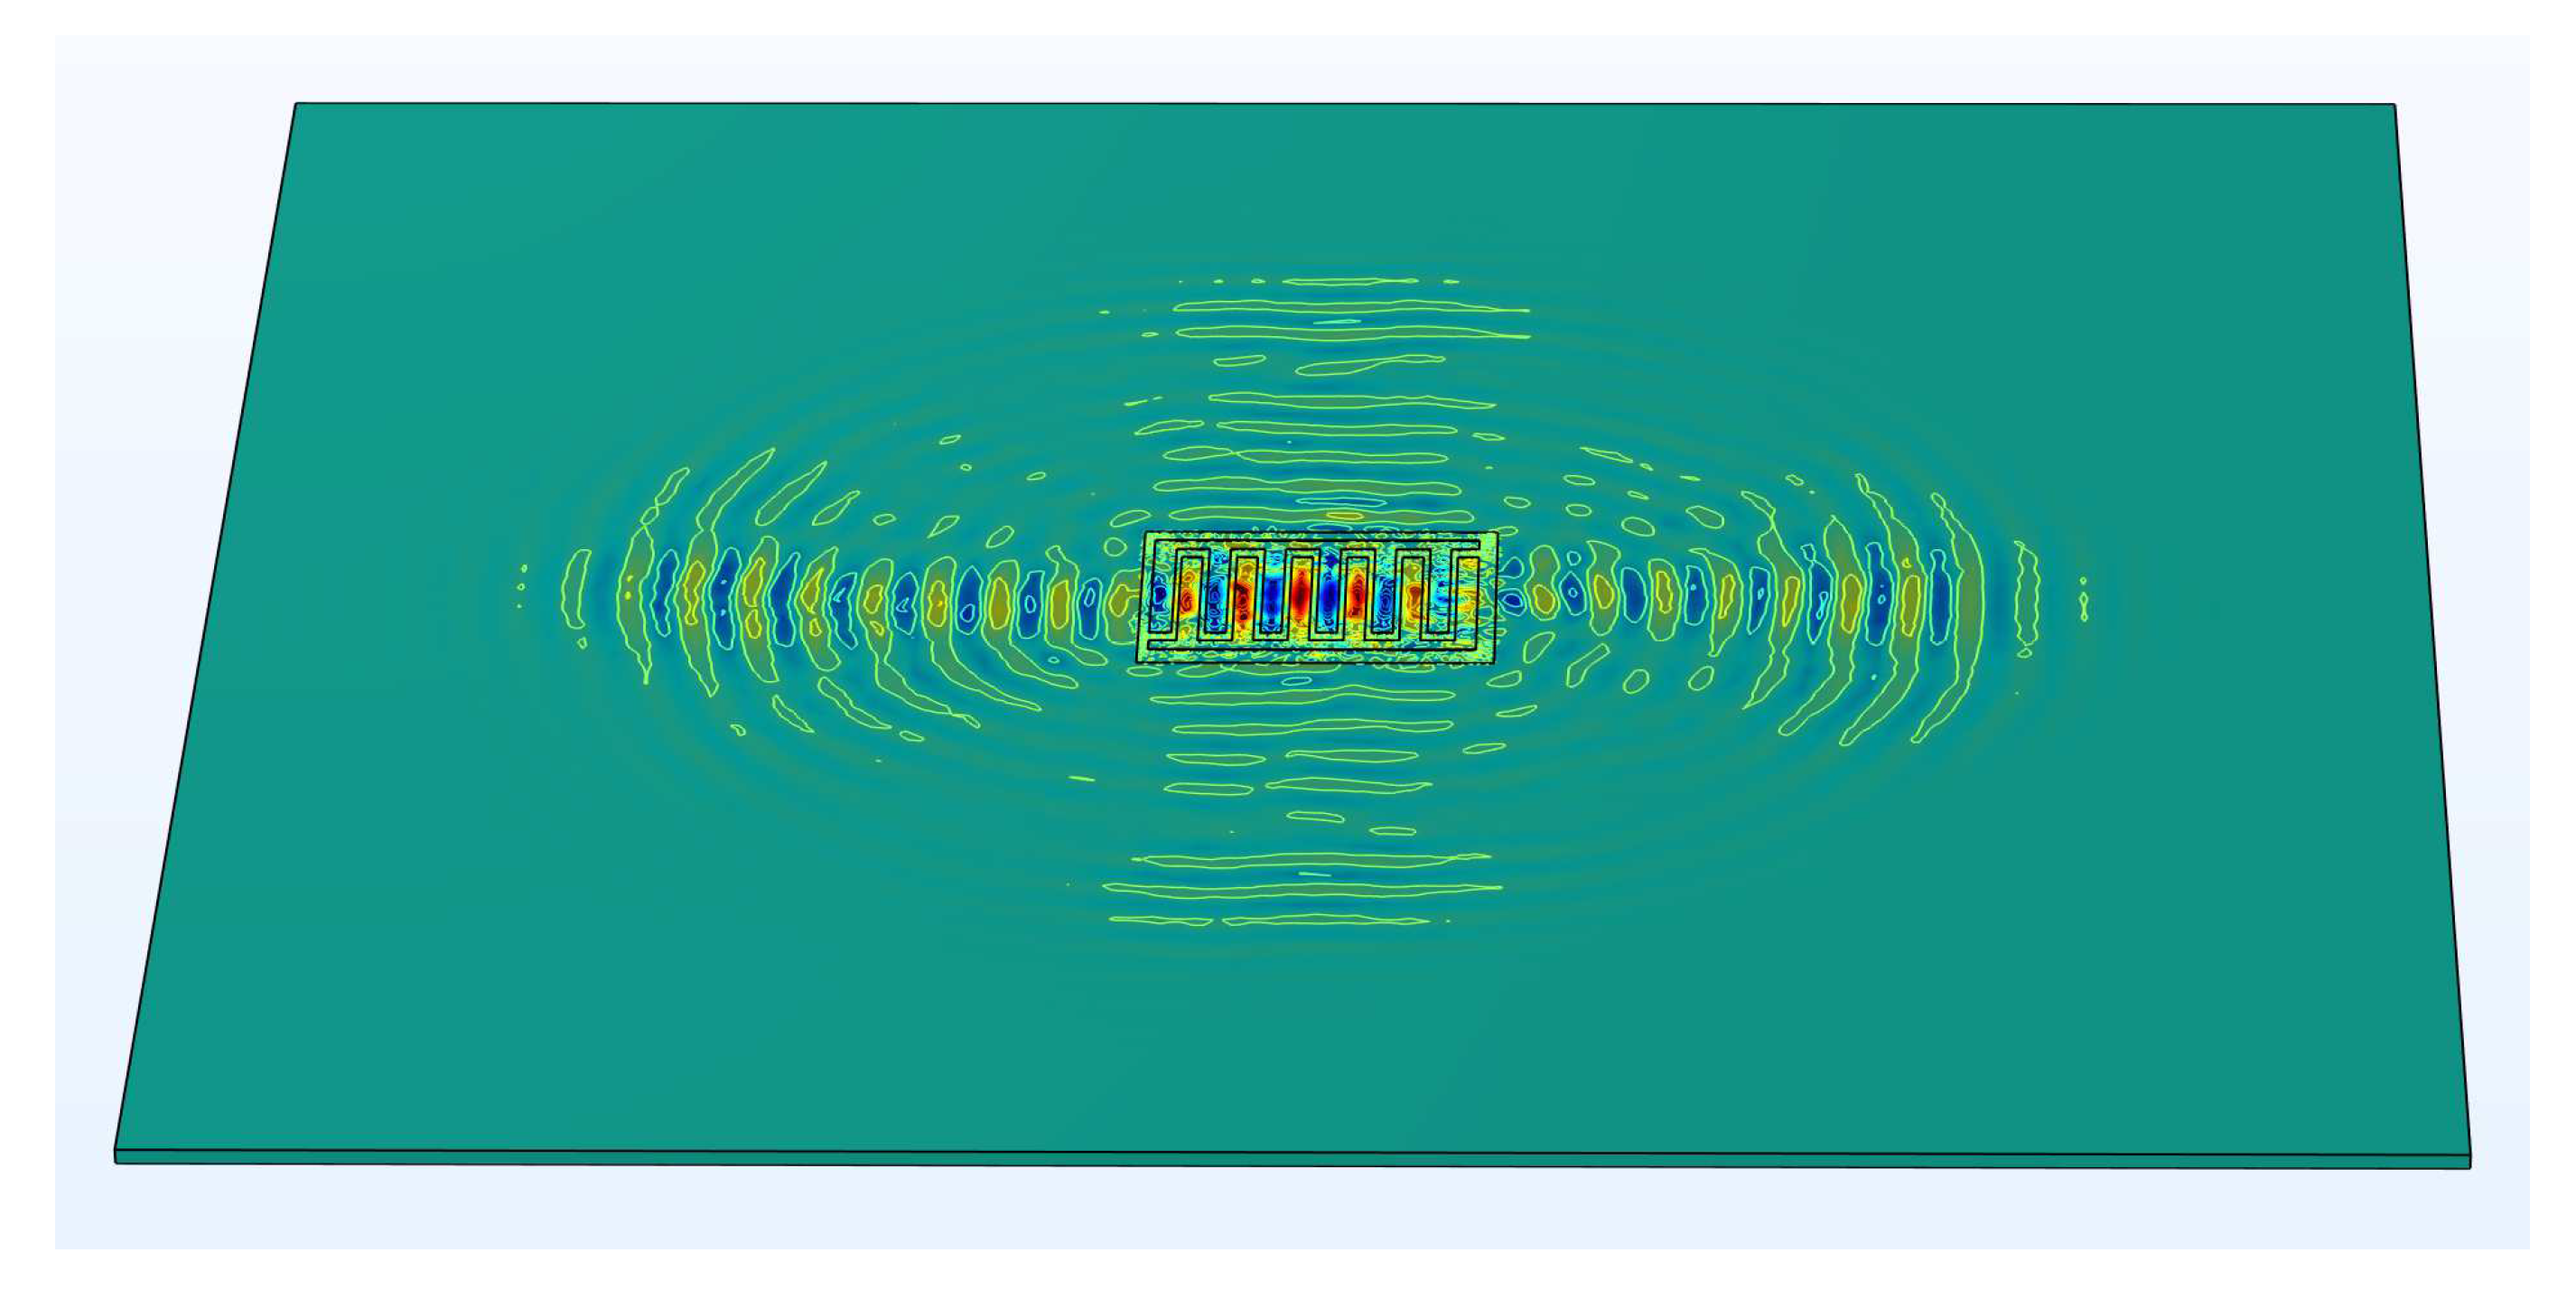
In this analysis, the effects introduced by two additional rectangular elements of width
will be considered. The study of the whole device led to a cross radiation pattern as in
Figure 4, which shows the comparison between the same geometry with and without electrical connections.
The authors had already observed the importance of the transversal propagation of piezopolymer IDTs in a previous experimental study [
42] where a 3D laser–doppler vibrometer was used to map the Lamb wave mode propagation on a 2 mm thick metal laminate with a with an IDT designed to excite the A
0 mode at 450 kHz.
In this experimental condition, in fact, a propagation of the beam along the directions orthogonal to the transducer was highlighted. The explanation of this behavior is important not only for a scientific purpose, but also for fully exploiting the characteristics of an IDT used for SHM applications
As noted in
Figure 4, the transition from an axial to a cross pattern is mainly due to the introduction of the two lateral elements which connect all of N comb elements electrically. This is essential for the correct operation of the piezopolymer IDT obtained with laser beam ablation of the film metallization. Furthermore, the extremely thin layer of gold (about 0.1 µm thick), requires the sizing of the parameter
large enough to ensure a low resistance for conducting current towards the fingers (typically lower than 10 Ohm).
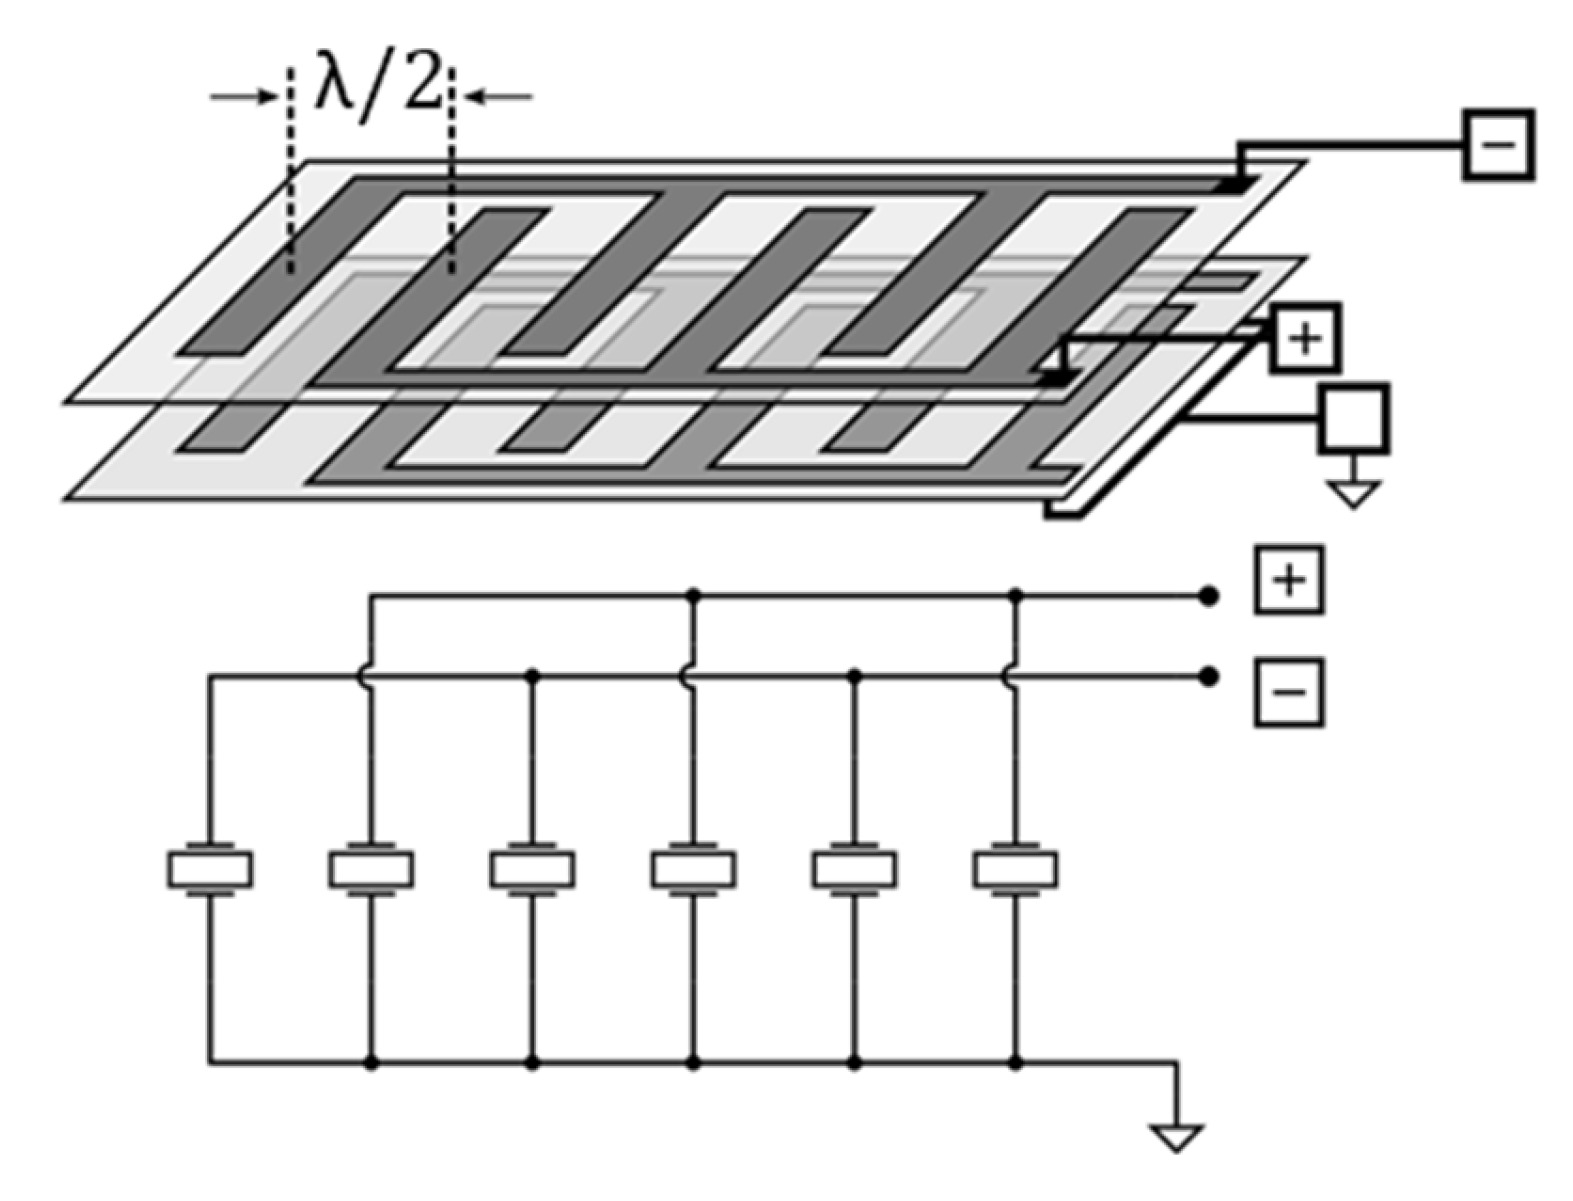
In addition to the importance of the resistance of the finger connections (bus bars), the overall capacitive value is also crucial [
43], both between combs of the same layer, and between comb and the lower ground plane (see
Figure 5).
The ohmic value represents a negligible impedance at the frequency of interest (e.g., 500 kHz) for IDTs with respect to the capacitive reactance of the piezopolymer film [
44]. For example, in our design with 110 µm piezofilm thickness and ε
r_piezopolymer = 10, the impedance module is in the order of kΩ. In this way the two bars with low ohmic resistance have a low voltage drop and guarantee the same electric potential is applied to all the electrodes. We observed that the piezoelectric material under the bars became an active area of the IDT which was not negligible and contributed to the radiation along the angular directions ±90°.
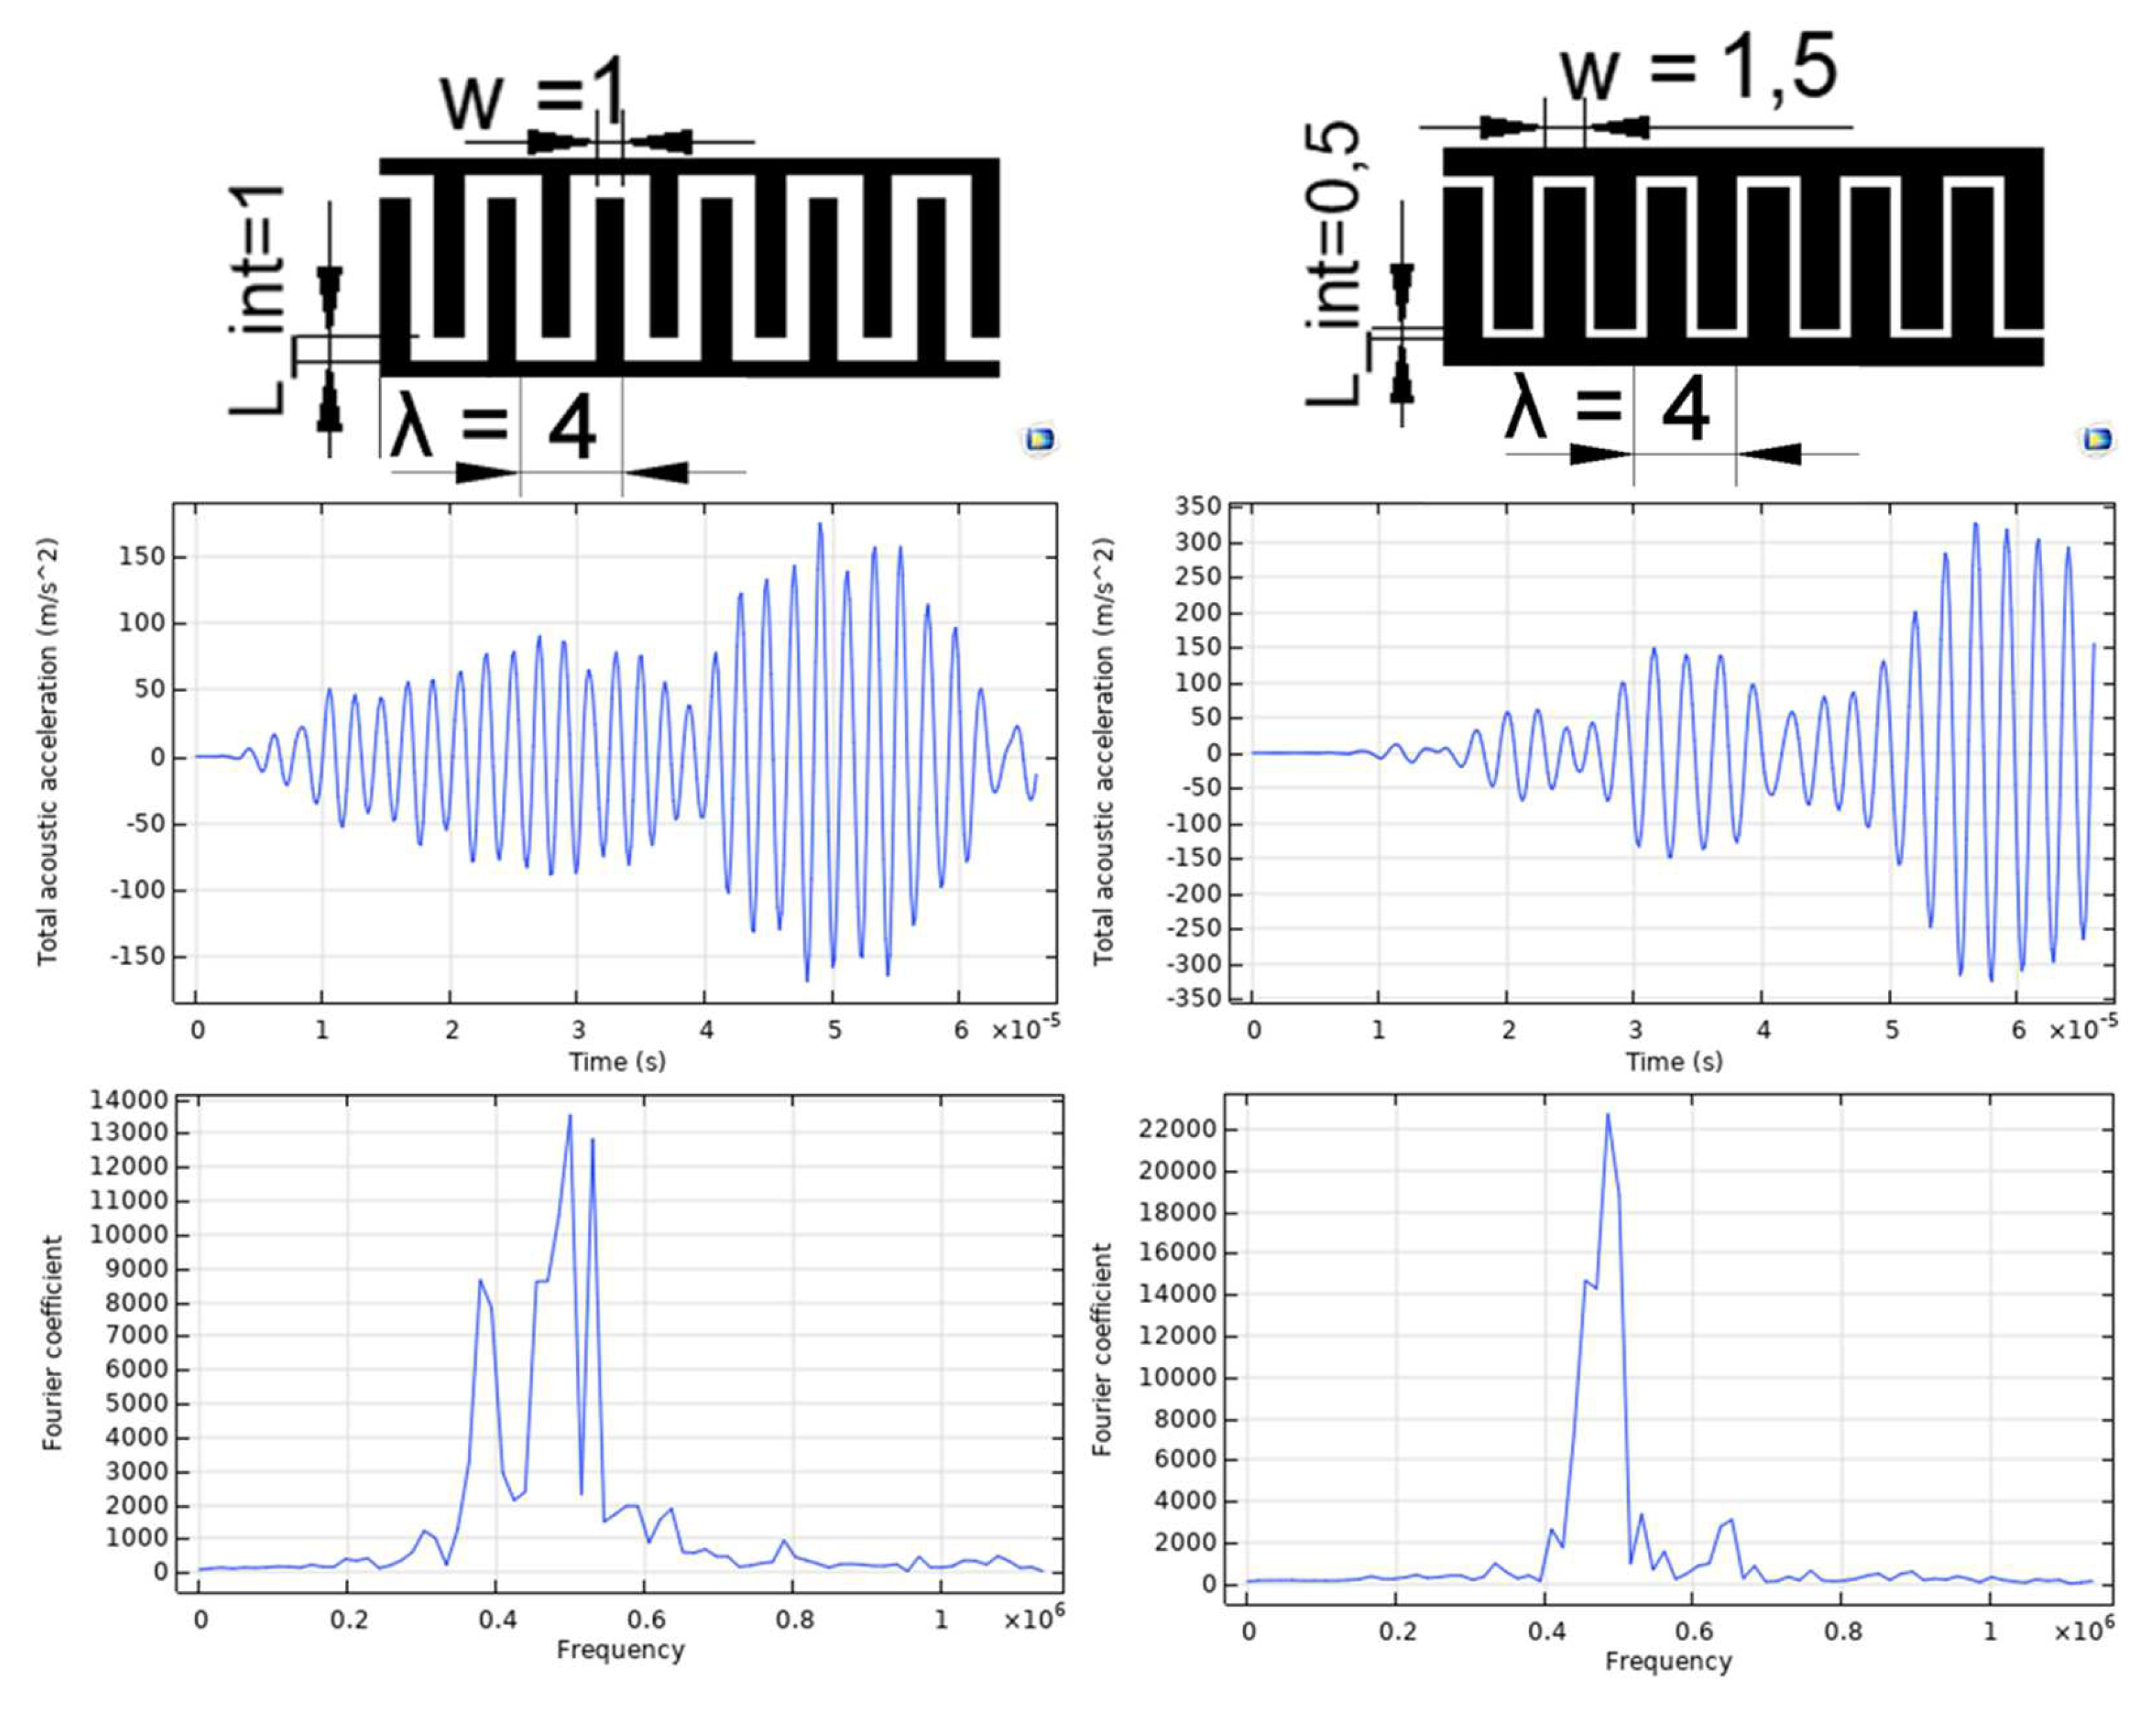
In this study on the analysis of geometries, we focused on understanding the phenomena related to the distances between elements of the same comb and then the distance between combs. Specifically, the parameters
e
, shown in
Figure 2, were varied within 0.5 mm. Such resolution is easily achievable with IDTs fabricated through the laser ablation process [
45], and the minimum value is assumed to guarantee electrical insulation between the combs when the applied differential voltage in the transmission mode can reach up to 100 V. In the simulation, we excited the device with a five-cycle burst signal 90 Vpp to which the Hann window was applied. For probing the acoustic pressure, we set a point probe at 20 cm from the transmitter in both tests. This simplification allowed significant reduction in the computational complexity as it did not require the creation, in a simulated environment, of another IDT capable of converting the mechanical quantity back into an electrical equivalent.
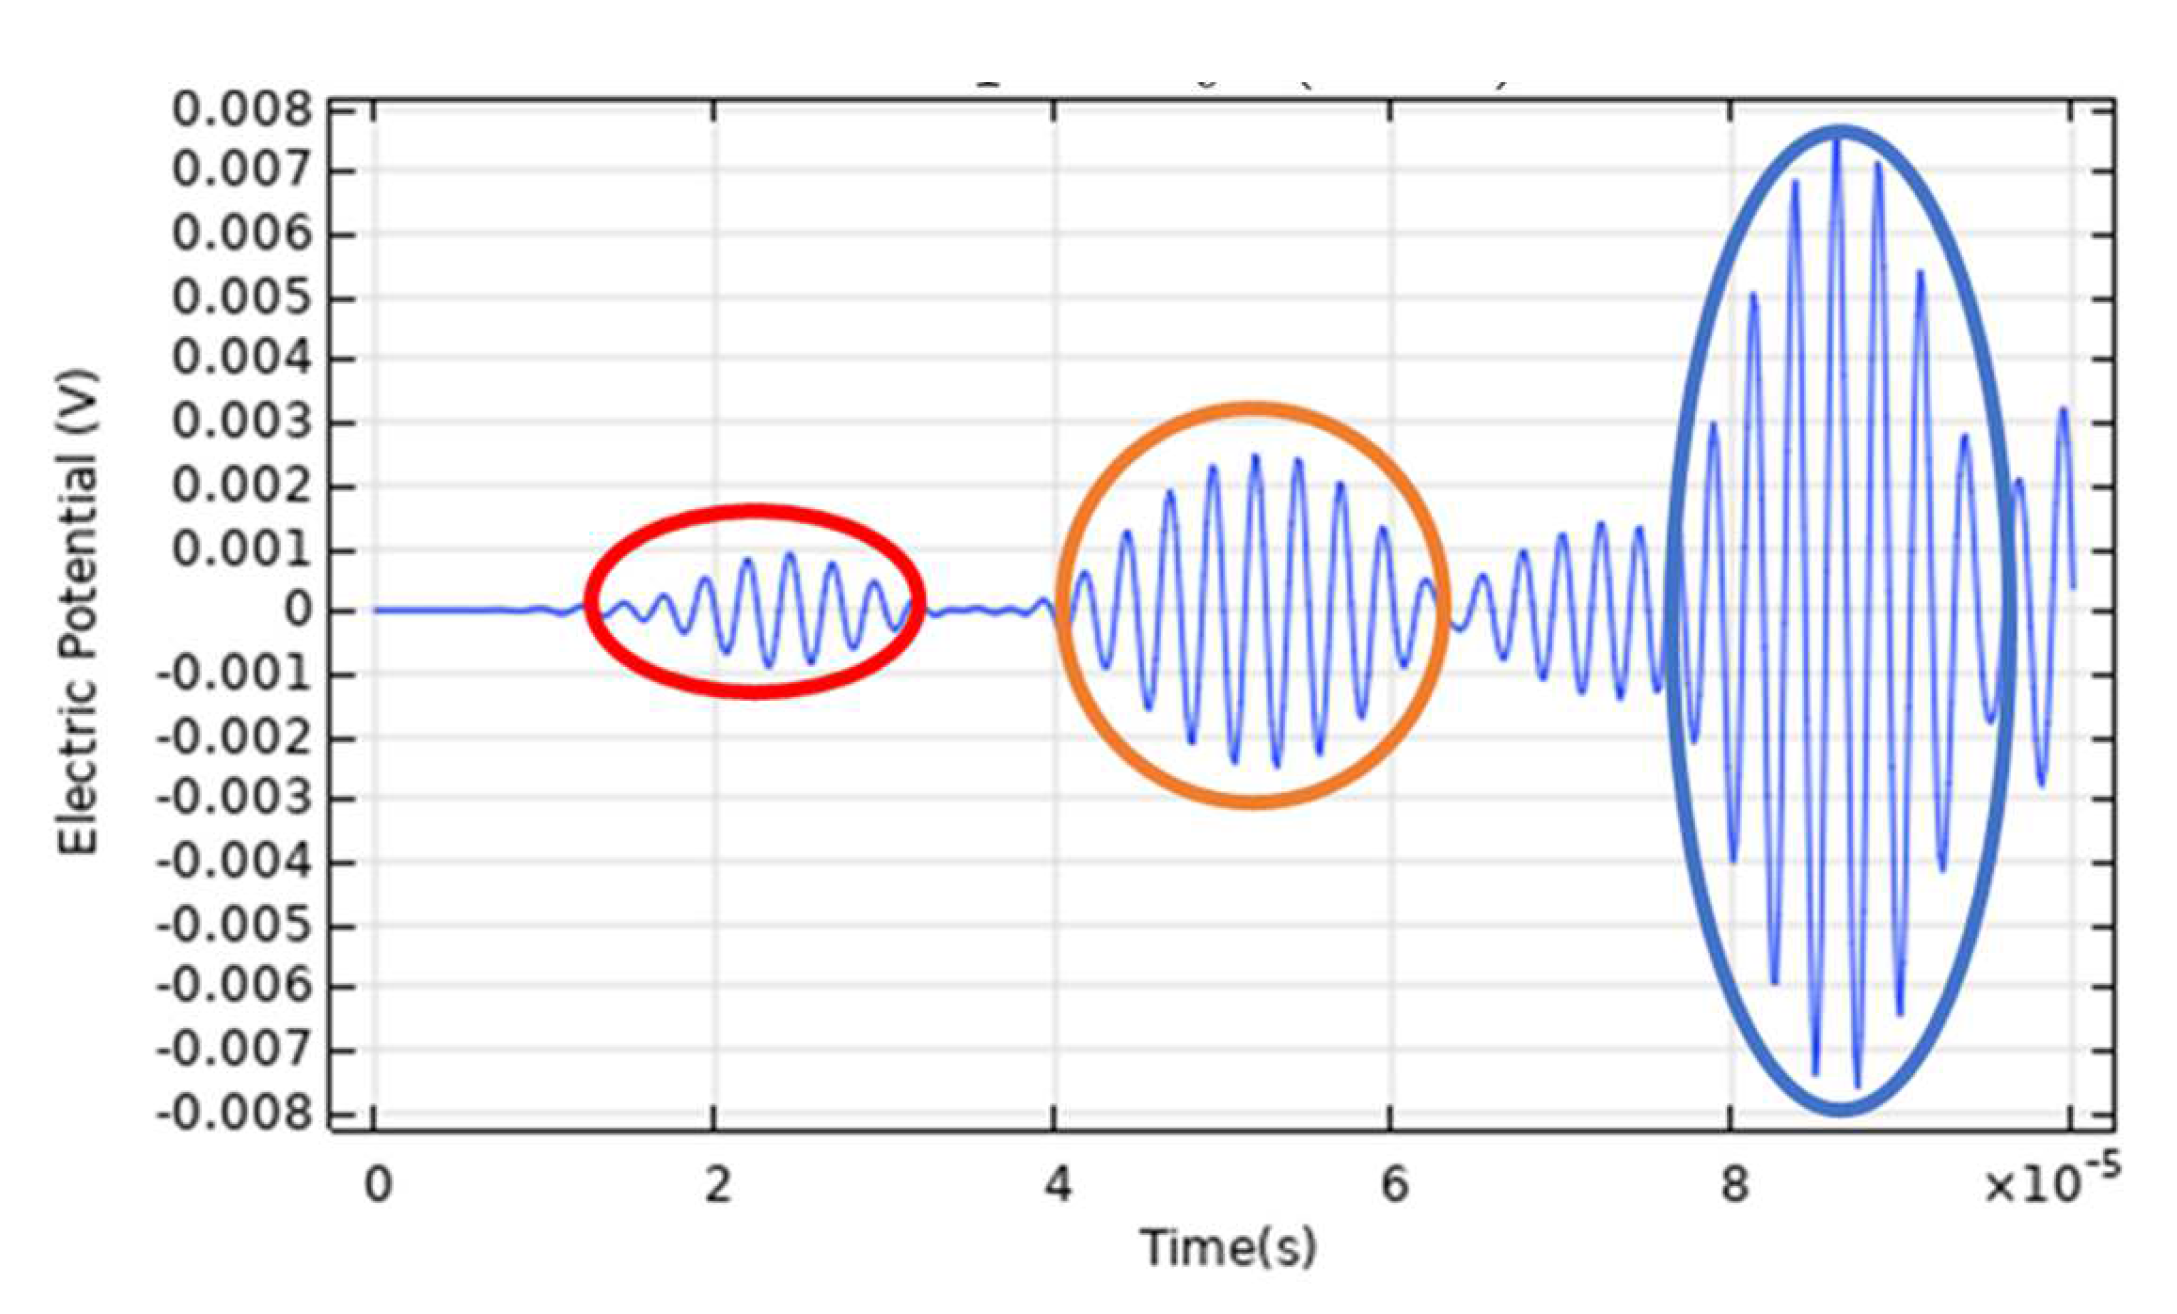
In
Figure 6 on the left of the bottom row, three spectral peaks can clearly be observed, two of which are undesirable. Similarly, as can be seen in the same figure on the right, with a smaller distance between active elements, a better coherence between combs is obtained, managing to generate a more selective ultrasonic front, almost exclusively concentrated in the spectrum of the desired A
0 mode; therefore, greater peaks are obtained in terms of Fourier coefficients, managing to pass from a peak of 20 to 40 units.
Furthermore, we will present simulations with pairs of IDTs, to recreate a pitch–catch configuration. In this way, the same conversion will be performed in reception, allowing detection of the electric potential values directly on the electrodes of the receiver.
To date, we have characterized transducers with lambda 4, however in terms of the dispersion curves, there is a particular closeness between the characteristic line of
and that of its double
. This could be a problem when trying to excite only one mode of Lamb, when searching for mode selectivity. In fact, we considered switching to
to increase the slope of the characteristic lines of λ. Another positive consequence is a relative increase in the aperture of the radiation beam, according to Equation (1). In the case of aluminum of width
it is possible to see the two characteristic lines of
and
, and relative crossing of the Lamb modes. It can be seen in
Figure 7 that the distance between the excitation frequencies of the A
0 and S
0 modes is about 130 kHz, as opposed to the 90 kHz obtained by designing a geometry with λ = 4 mm.
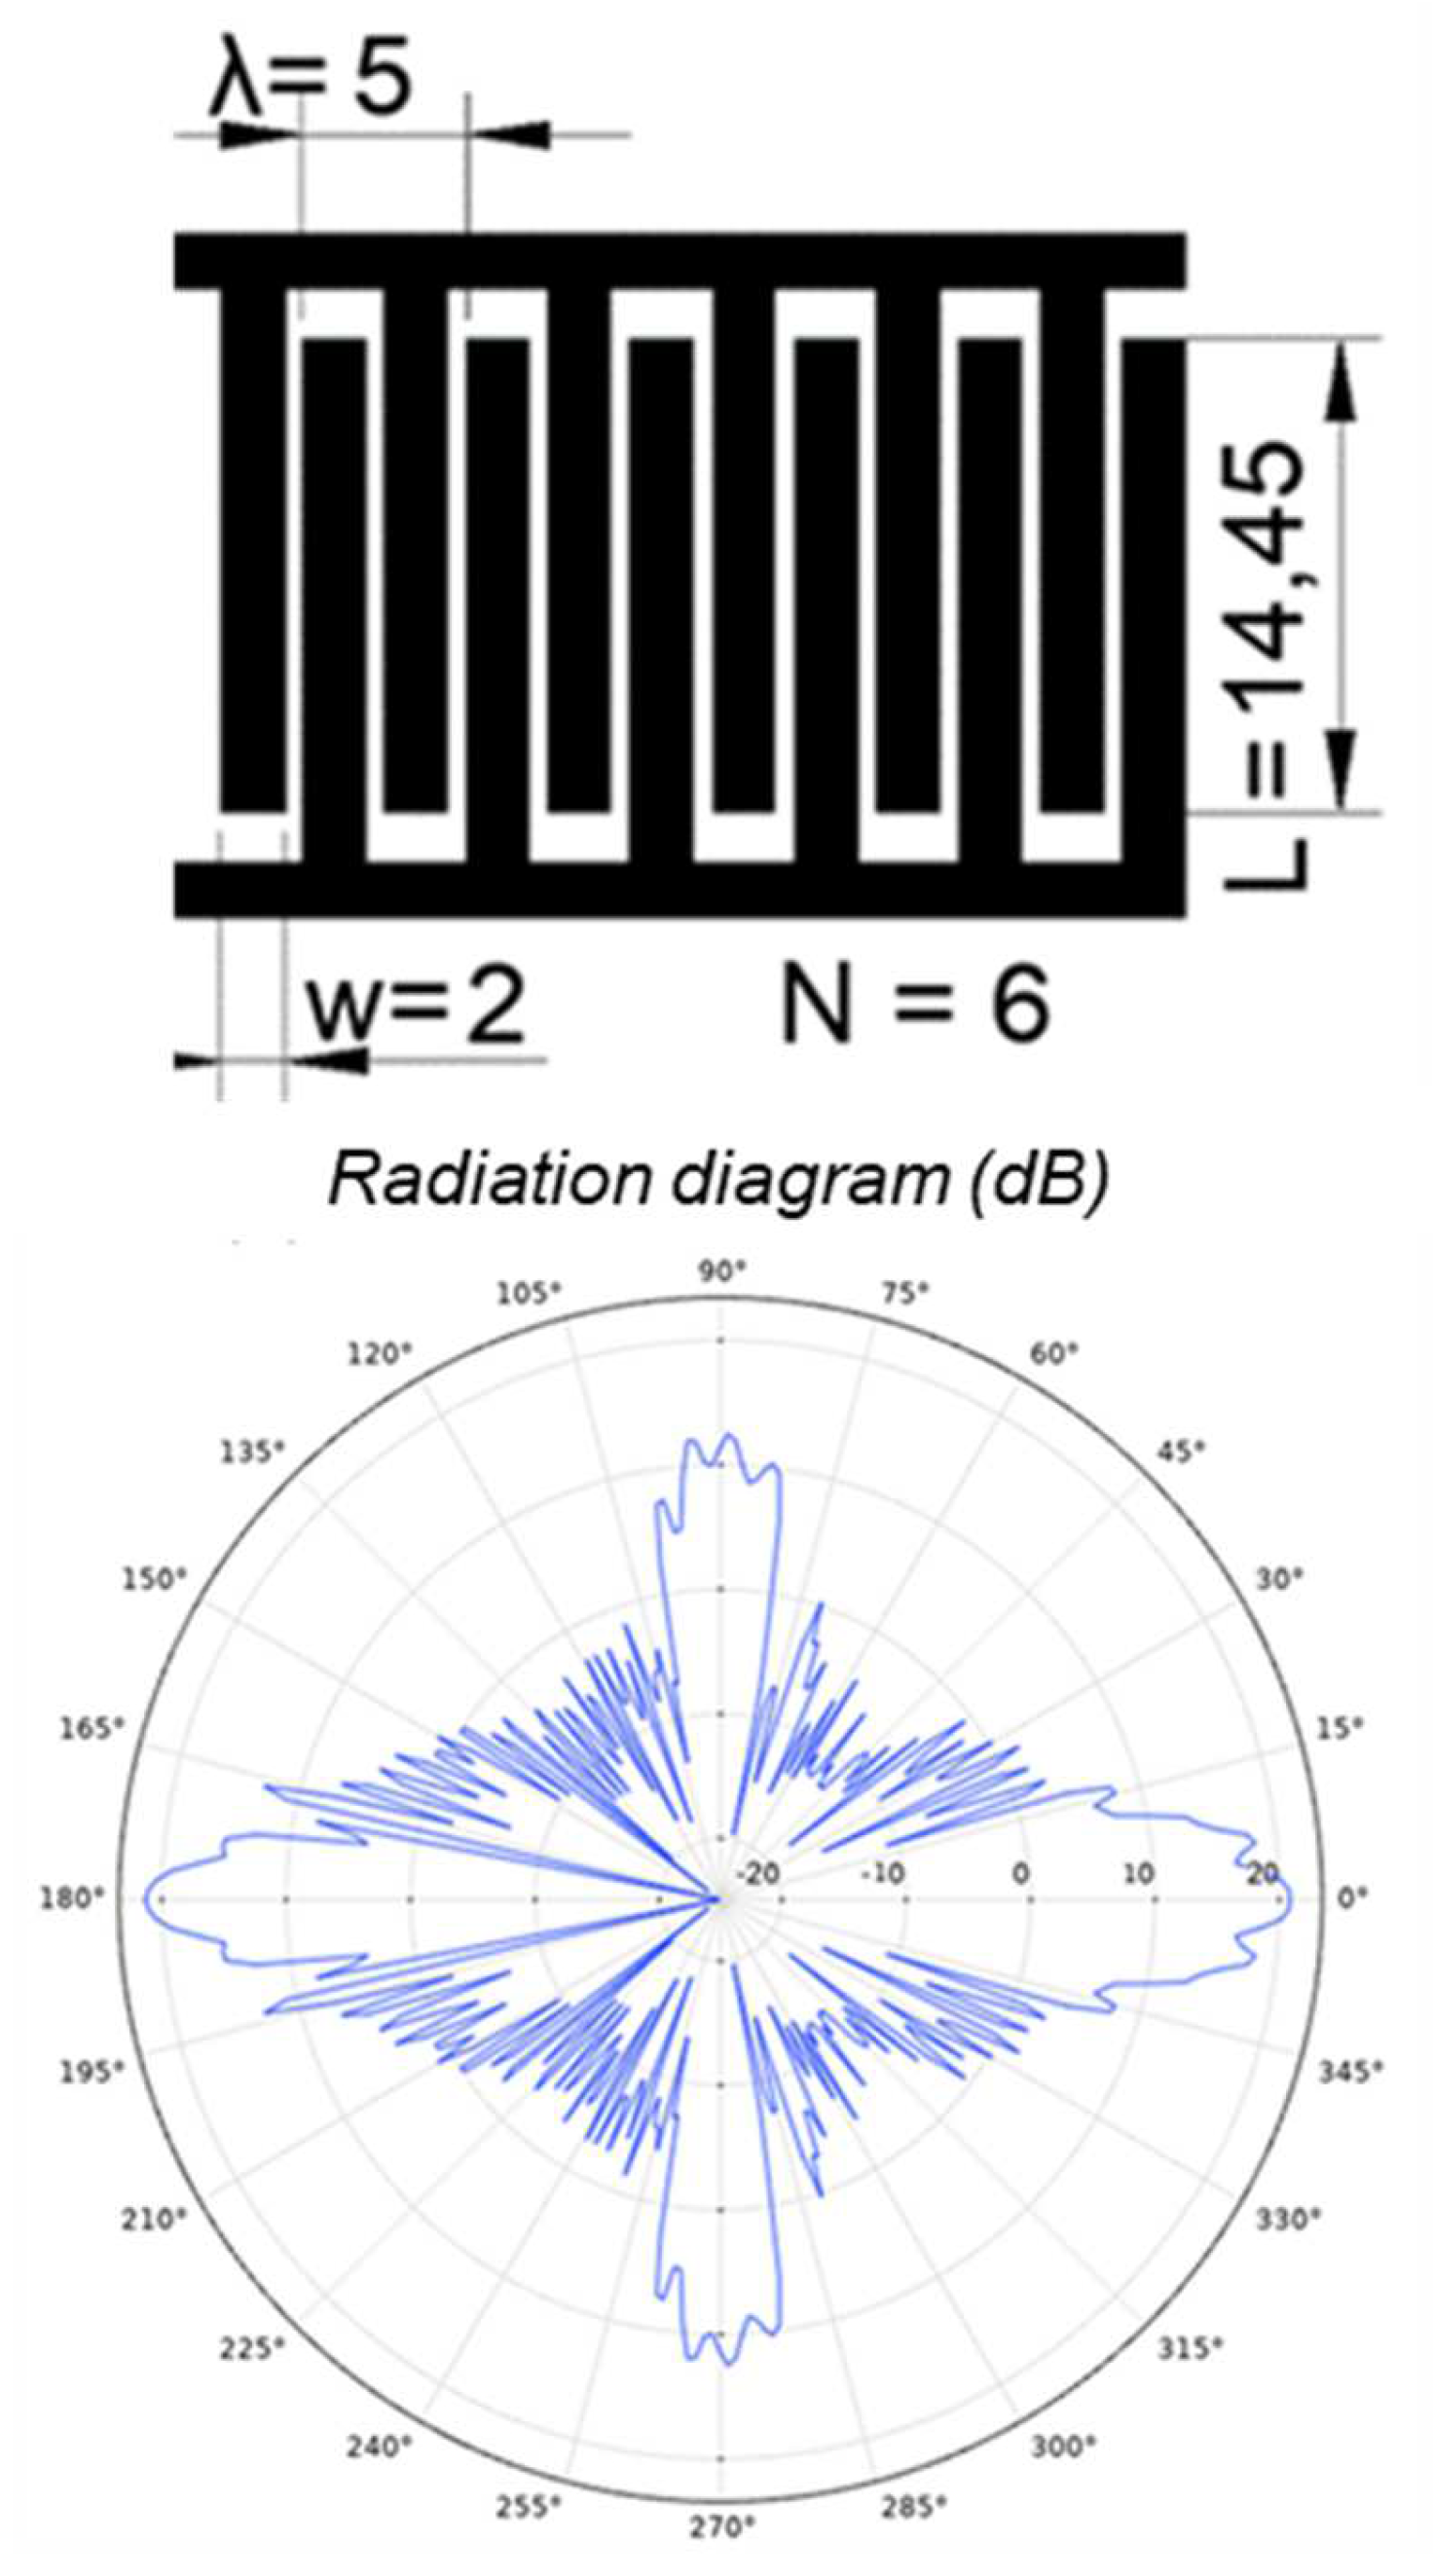
The set of information obtained allowed us to model what is shown in
Figure 8.
FEM Modelling of an Interdigital Transducer with Scaled Electrodes
In general, the beam divergence can be narrowed by increasing the parameter L in agreement with Equation (1), but this increases the overall transducer area. In some SHM systems, the available area for placing the array of transducers is limited and the transducer’s dimension becomes important. An example is reinforced aluminum panels where the transducers are placed inside a rectangular area formed by the reinforcing ribs. Keeping in mind this constraint, we started an investigation of an IDT with scaled length of fingers by 3D FEM modelling. The effects of the finger length apodization was already introduced in [
28] for an MFC IDT, while in this work we exploited the superposition of the effects on beam divergence of each single finger pair in order to achieve a desired beam pattern. While for the pitch and catch configuration, the IDT can provide a symmetrical beam pattern, there are complex structures where the IDT beam pattern needs to be focused on a certain area, while in the other directions it needs to be divergent for obtaining a large area coverage.
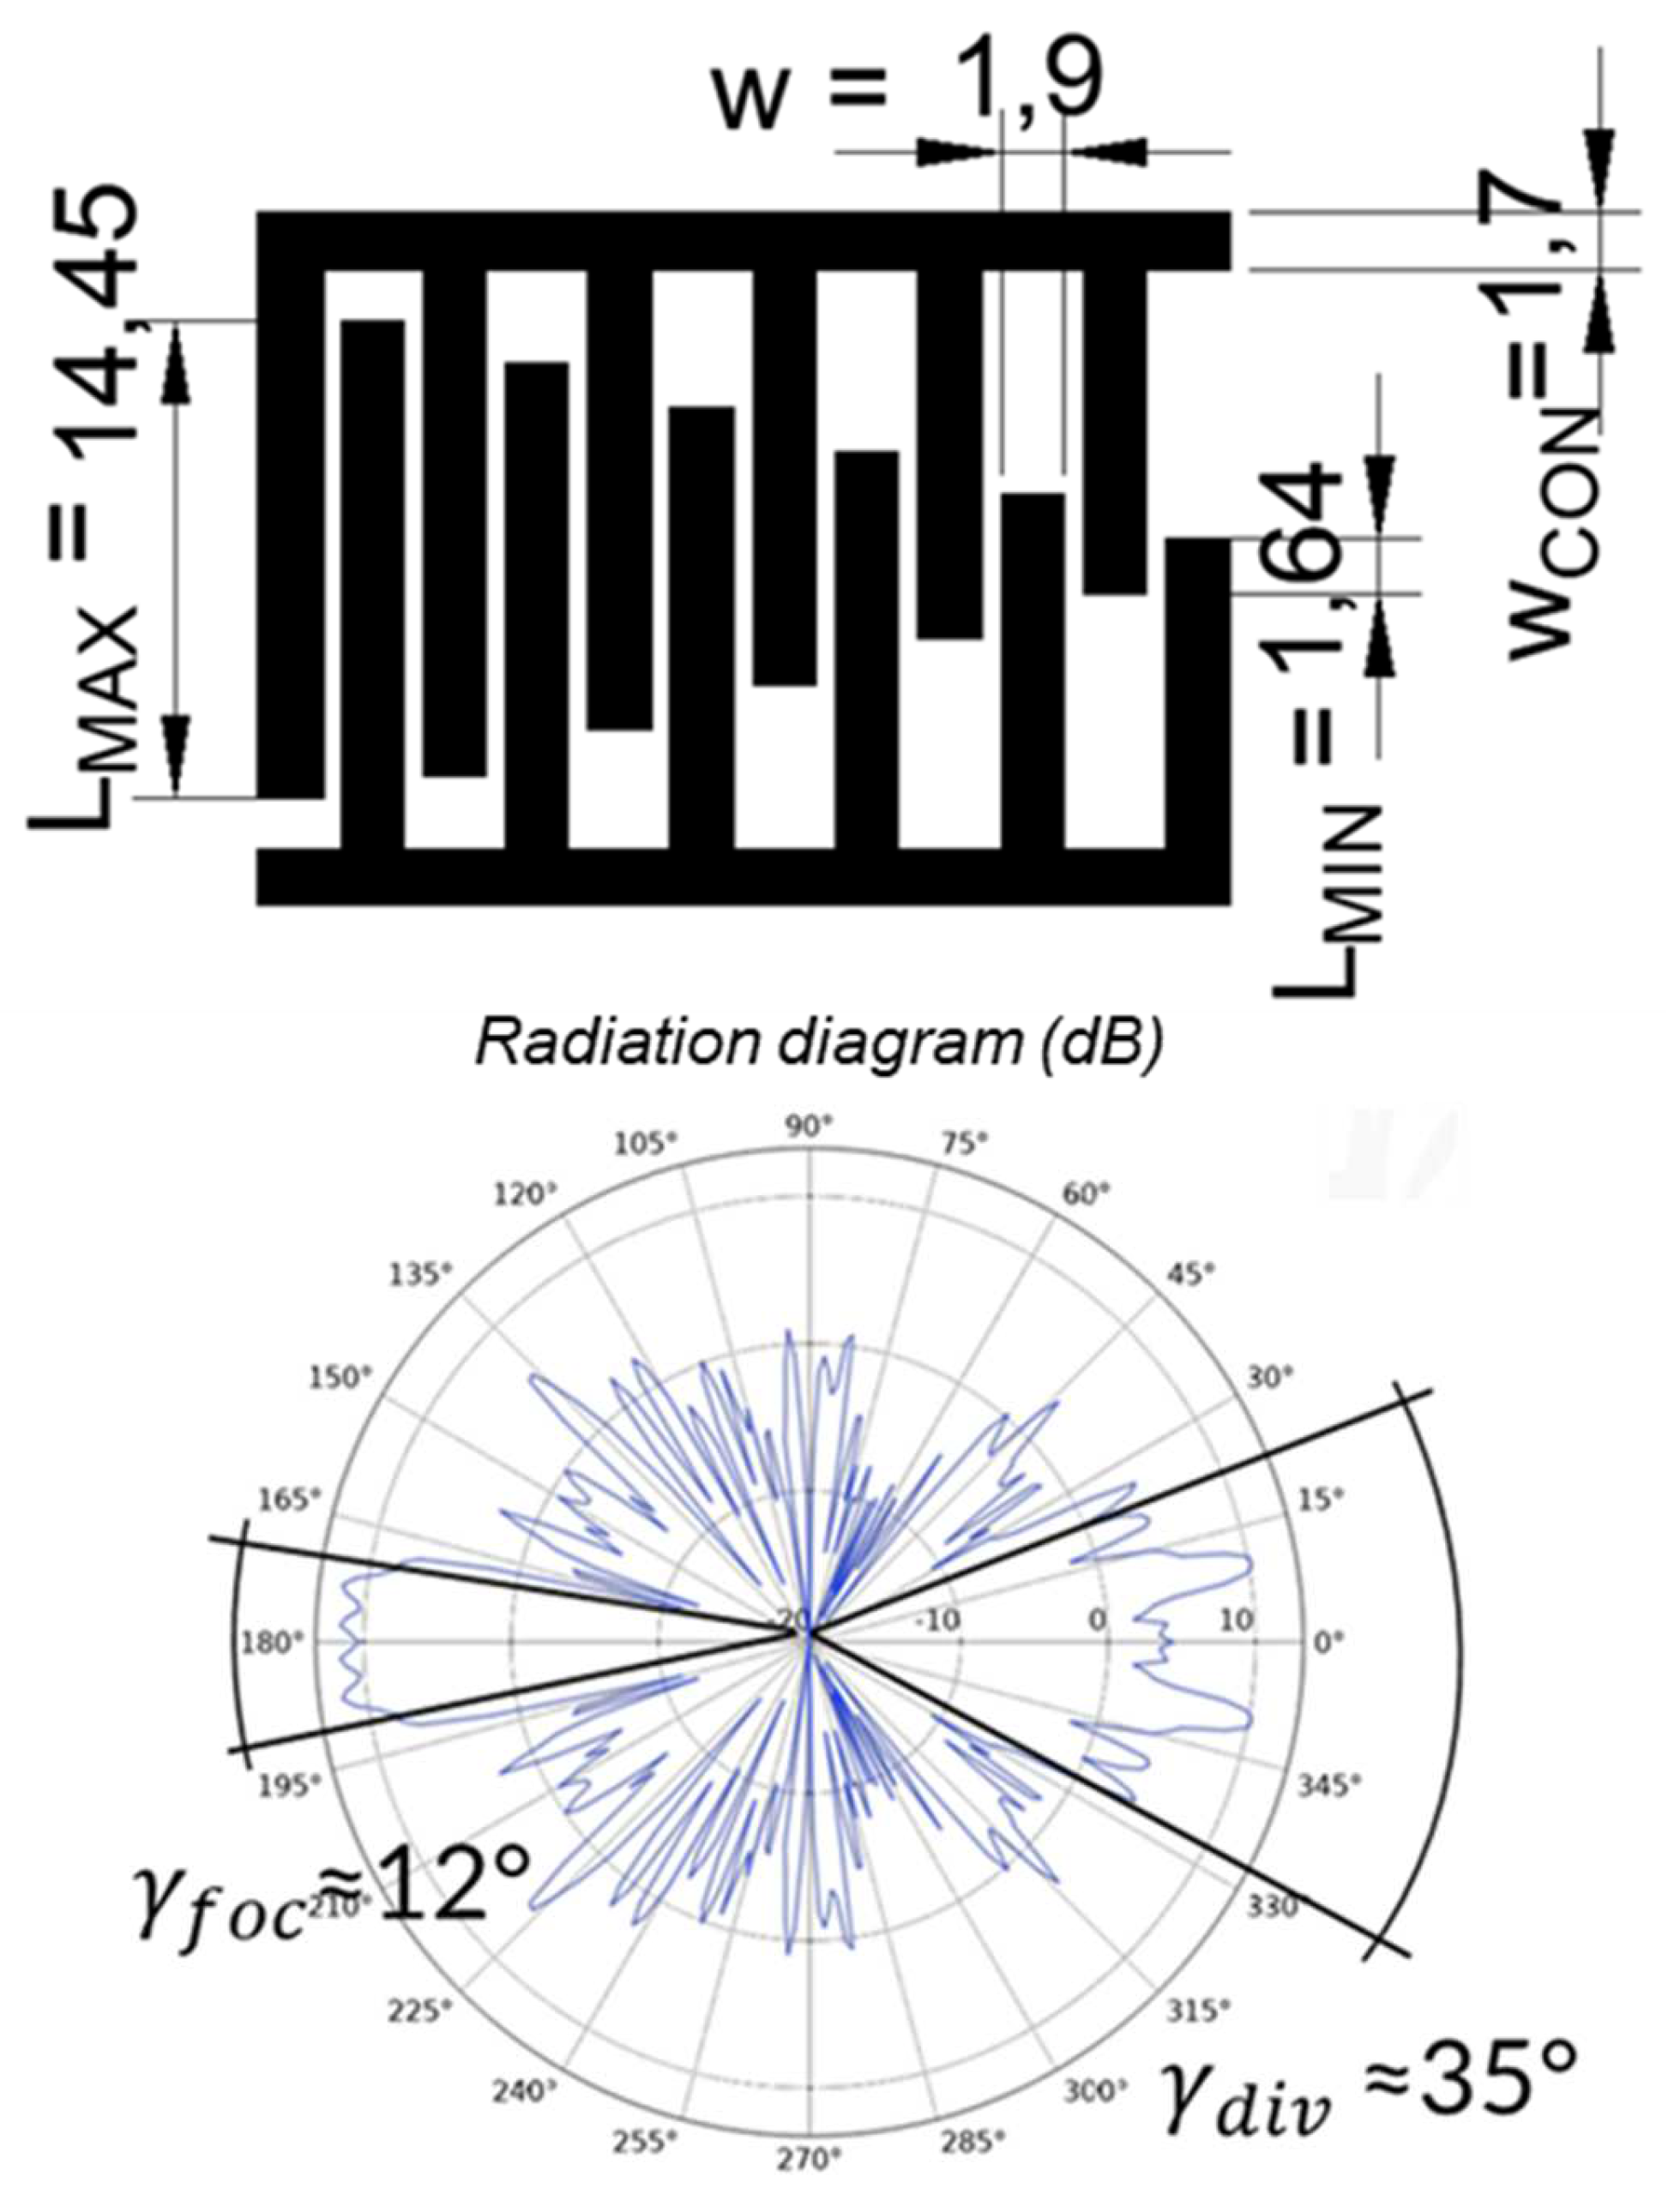
The concept of scaled geometry is shown in
Figure 9, where the parameter
L for each of the finger pairs varies progressively from a maximum of
to a minimum of
. The set of values for the six fingers (N = 6) is
(mm). We can point out that for the largest value of L, according to Equation (1), we obtain a value for
= 20°, while for the smallest value we had a quasi-point-like acoustic source with a very divergent beam. The superposition of these effects provides an asymmetrical beam pattern as expected by the scaled electrode geometry, as shown in
Figure 9 (bottom).
The overall effect in this case study is a remarkable variation of the beam divergence pattern relative to the regular IDT geometry considered in
Figure 8. The asymmetrical behavior provides a divergent beam (on the 0° angular direction of
Figure 8), while in the opposite direction we obtain a focusing effect reaching a value only to
. It is of interest to compare the radiation of the scaled geometry along the angular directions
with the results published in the papers [
39,
46] where the beam patterns of the MFC transducers did not exhibit a significant lateral radiation; the latter characteristics derived from the adoption of macro fiber composite technology that implies a high electric field only along the fiber direction. The design based on scaled electrode geometry implemented based on PVDF piezofilm demonstrated the capability to generate quasi-isotropic beams that are a typical advantage of PWAS for monitoring large areas with a reduced number of elements.
The versatility of the scaled electrode geometry is counterbalanced by a reduction in the active area of the transducer. By the example in
Figure 9, we can estimate that is 43% less than that of a regular IDT. For quantitative analysis of this effect, the FEM modelling allows estimation of the decrease in radiated power in the directions of 0° and 180° corresponding to 4 dB and 12 dB, respectively, while for the case reported in
Figure 8, the calculated values are about 22 dB. The validation of the FEM simulations has been performed experimentally by placing a receiving transducer of the same type as the transmitter, at different angular positions along a circle of radius
and oriented to the transmitting transducer from the focusing side.
Figure 10 shows the time domain signals for three different values of
{0°, 6°, 12°}. The decrease in amplitude relative to 0° remains less than 3 dB.
5. Experimental Results to Validate Different Electrode Pattern Geometries
We adopted a setup consisting of a waveform generator and an amplifier module to provide a four-cycle burst with amplitude of
. More details of this setup are reported in a previous work [
11]. The electronic boards for receiving the ultrasonic signal consist of an amplifier module with gain
and bandwidth
. Removable piezopolymer IDTs have been coupled with the aluminum plate using a bi-adhesive tape, produced by Eurocel—SICAD group, for carrying out multiple tests without spoiling the aluminum plate surface.
The first tests were intended to directly compare transducers designed with different geometries, such as λ = 4 mm, and produced in [
11], and the IDT proposed in
Figure 8 with λ = 5 mm. In this comparison, a voltage signal eight times larger was detected with the same setup using the same laminate.
Nevertheless, for all the reported cases using a double-sided adhesive layer, lower acoustic coupling was observed. Therefore, all the acquisitions present in this document were affected by a loss factor that would be easily observable through the adoption of a rigid attachment using epoxy bonding. The result of this experiment points out a small discrepancy between simulations relative to the value of central frequency used for the transmitting signal: we found an appropriate value of 350 kHz relative to the 400 kHz used for the design of the transducer.
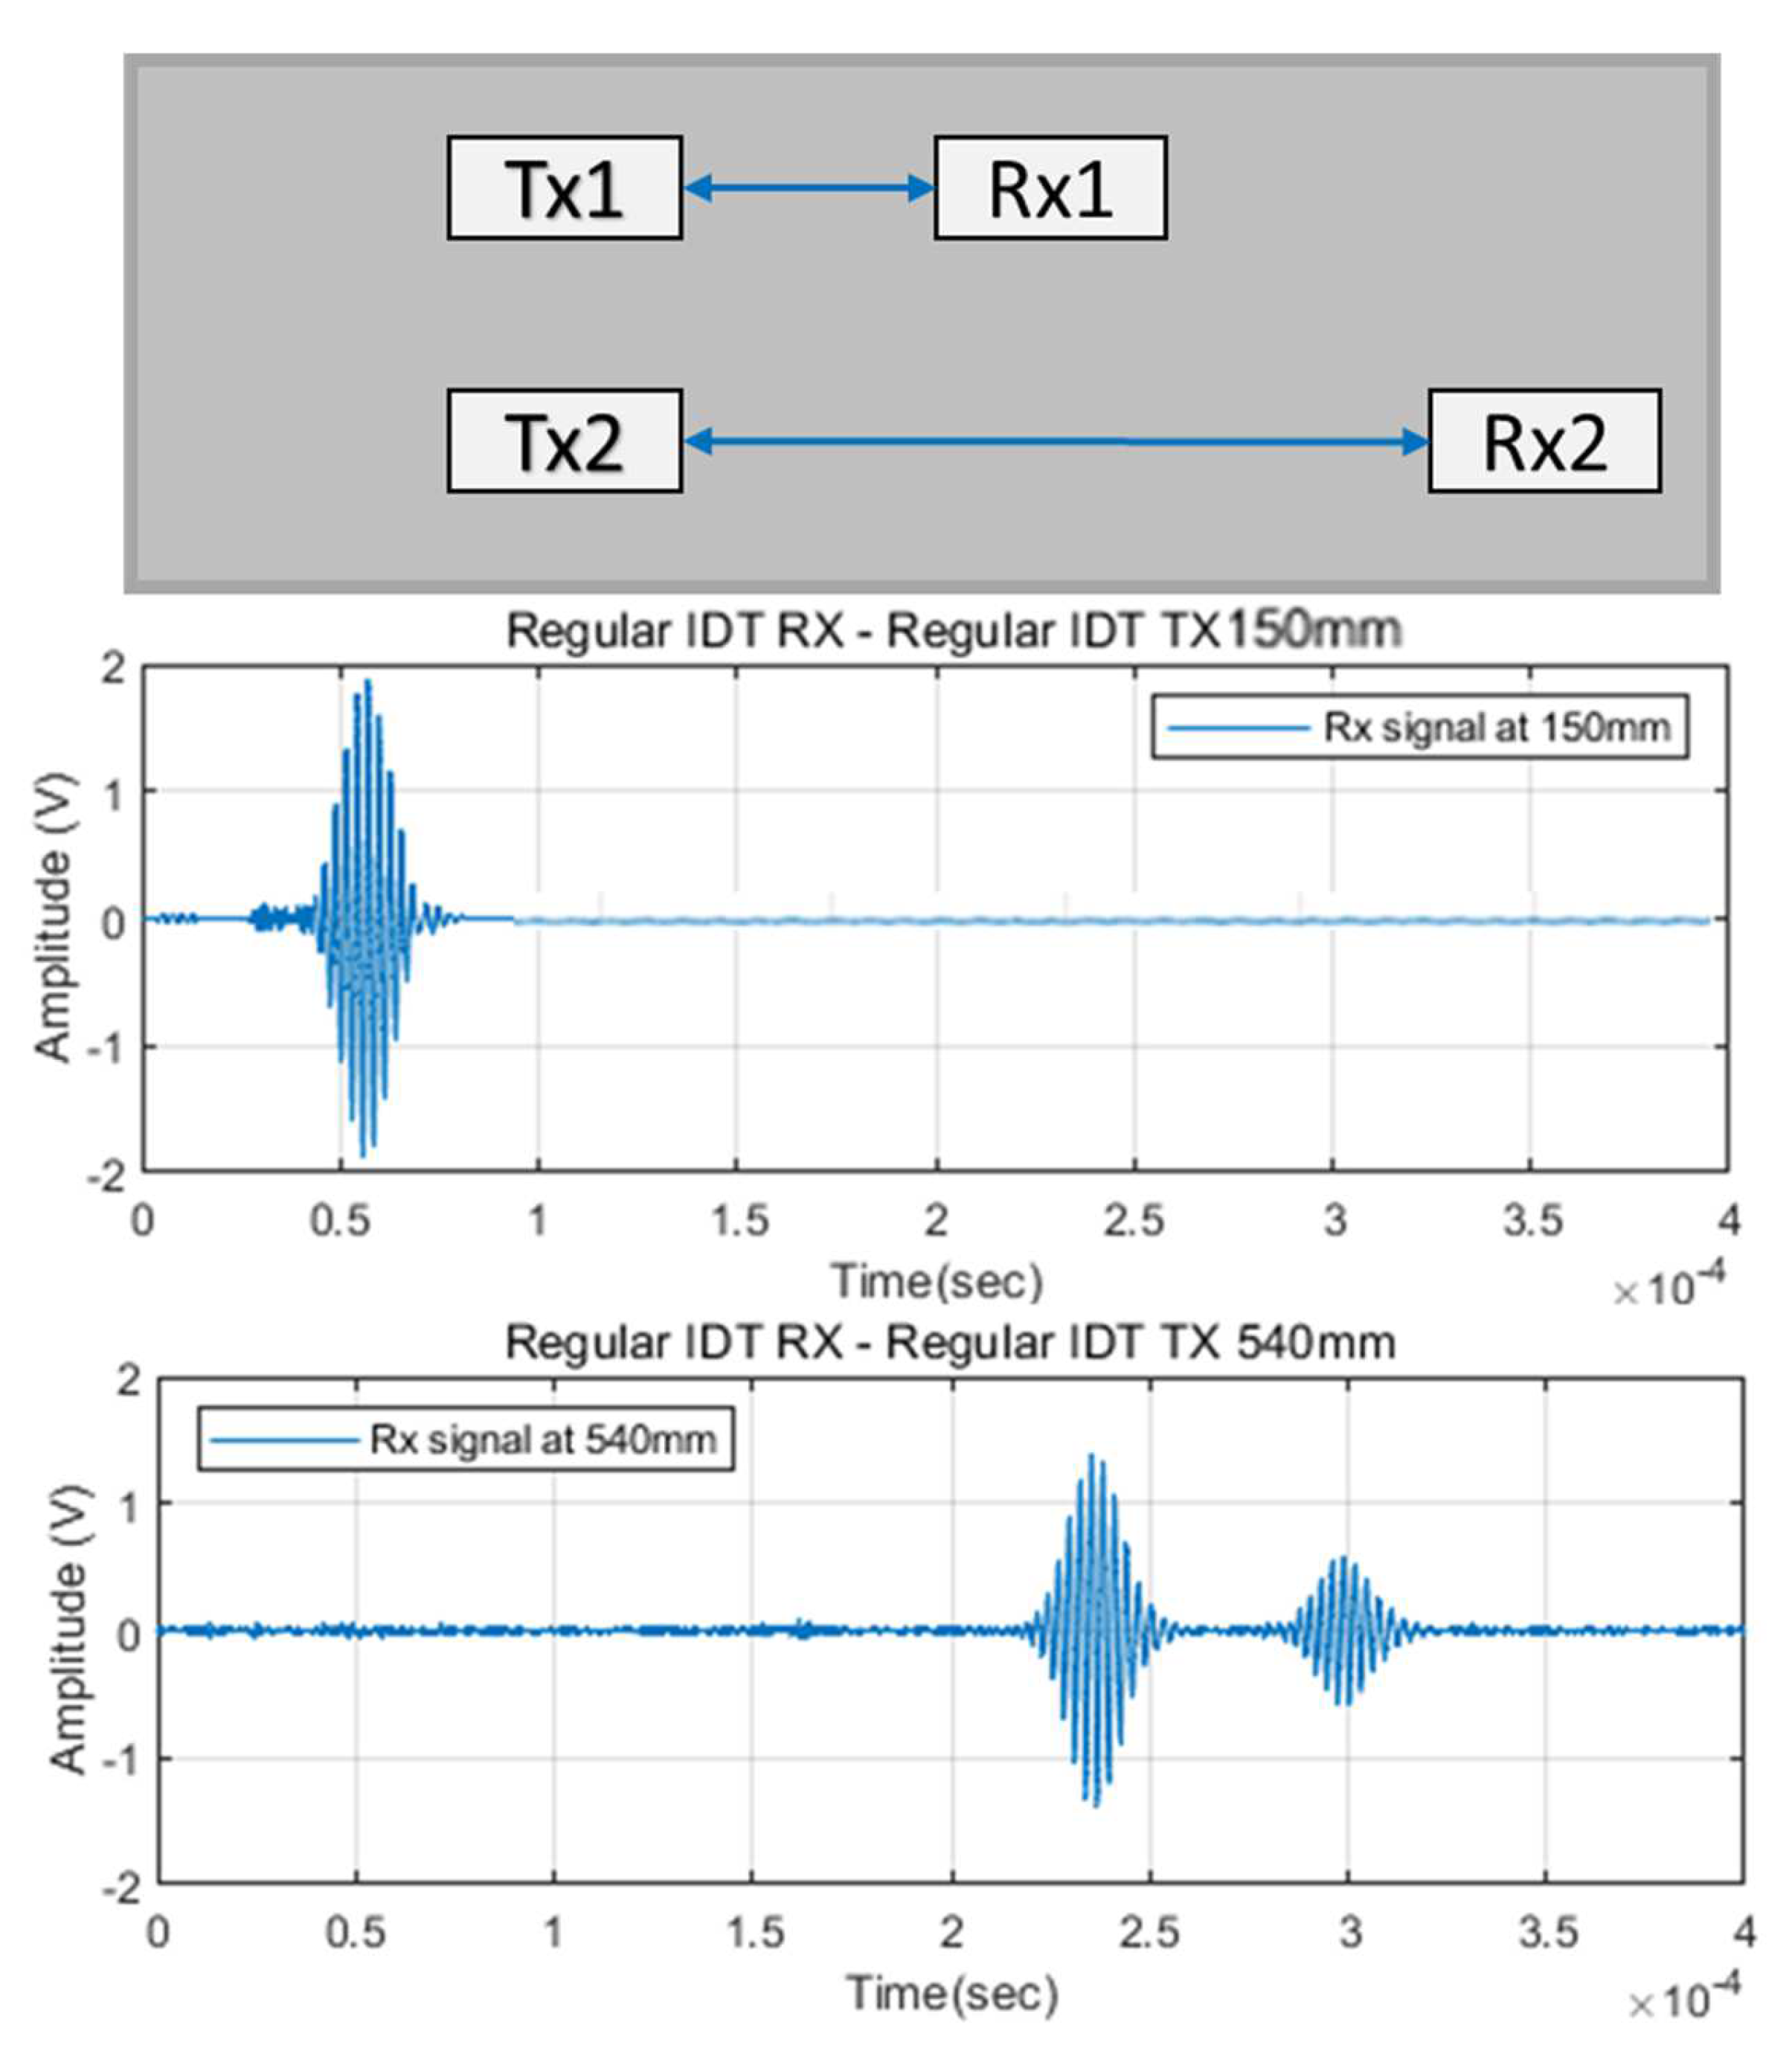
Further tests were carried out to evaluate the attenuation of the ultrasonic signal propagating inside the laminate. In the case of regular geometry (see
Figure 8), we found an attenuation value of
. This result is shown in
Figure 11.
In
Figure 11, we can observe that the receiving transducer
, placed next to the edge of the laminate, acquires both the direct ultrasonic signal from the transmitter and the reflected signal from the edge.
Other tests were carried out to verify the effects of the bus bars reported in
Figure 4. We arranged a setup using two transducers with regular electrode geometry, shown in
Figure 8, in pitch–catch configuration with receiving IDT positioned in two manners: first with electrodes parallel to the transmitting transducer, and second with electrodes perpendicular to the transmitting transducer.
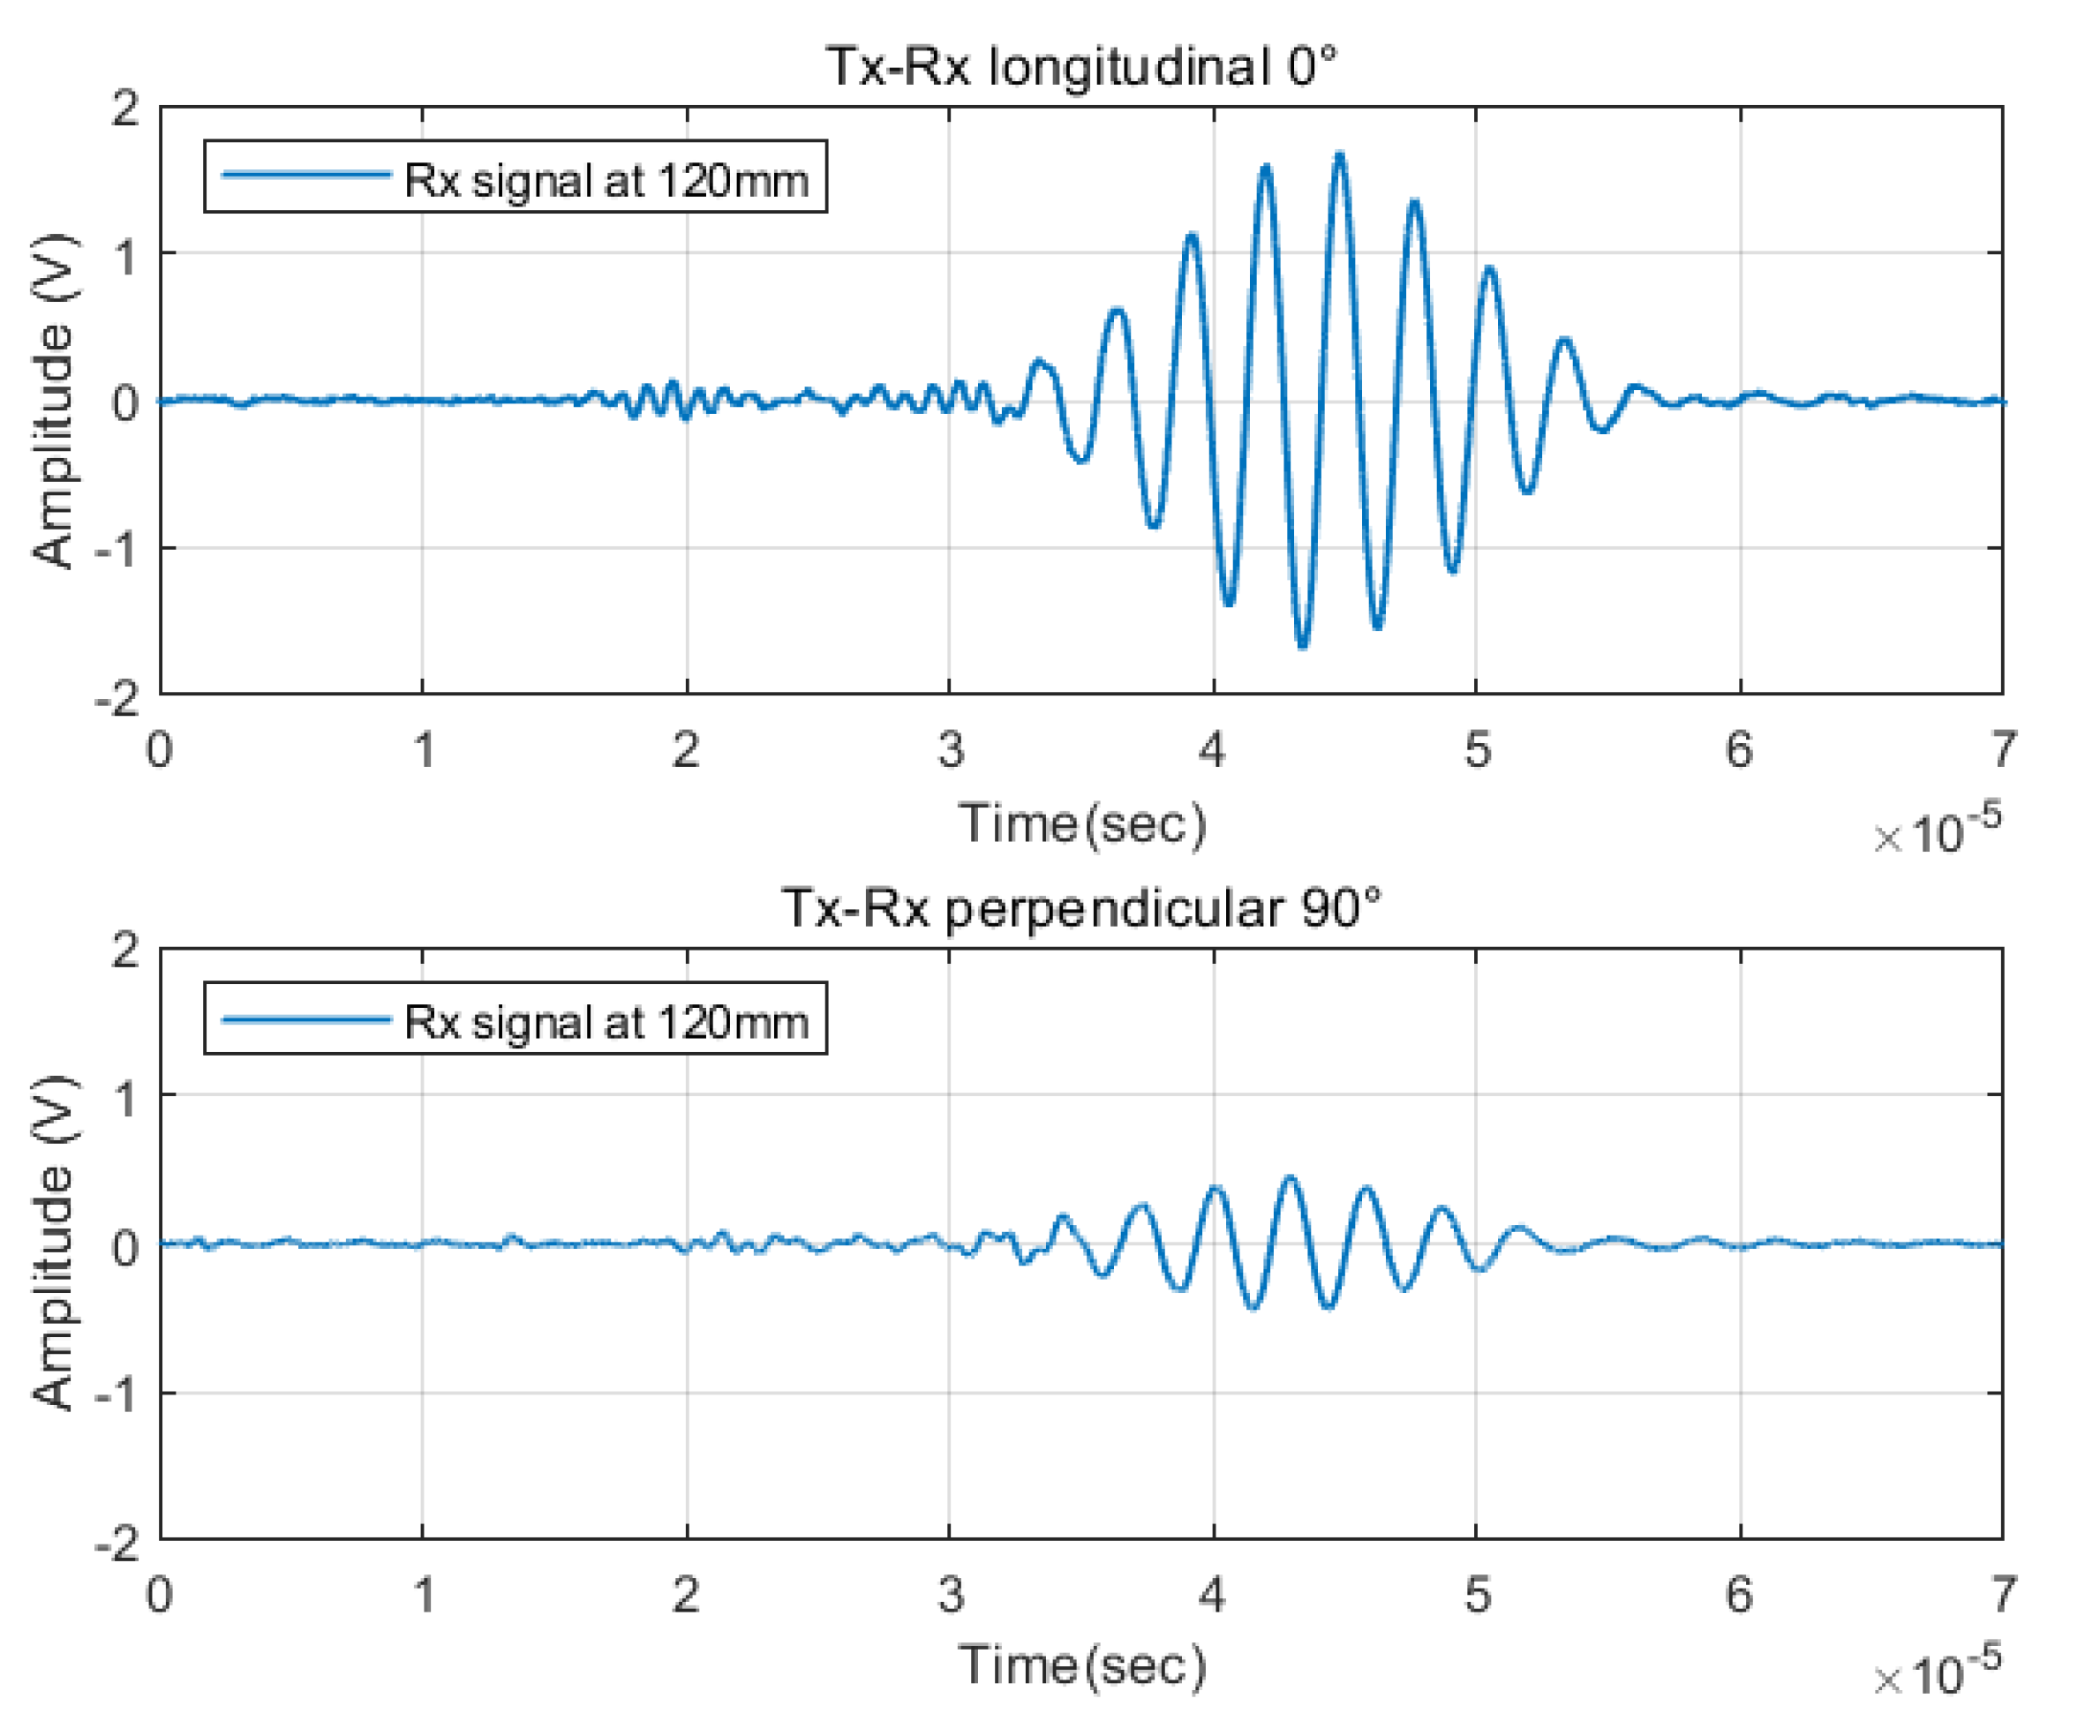
In
Figure 12, a comparison is proposed between acquisitions with IDTs placed at the same distance of 120 mm, but with different rotation. In the first case, we positioned the transducers in an optimal way, i.e., aligned with each other with respect to the main direction of the transducer. In the second case, they were repositioned following a 90-degree rotation in place. In both cases, longitudinal and perpendicular, the transducers were placed at the same distance of
. The amplitude of the acquired signal was
in parallel placement (0°), and about
in perpendicular placement (90°). This result was in good accordance with simulations in terms of the ratio between the parallel arrangement of the IDTs at 0° and the perpendicular one at 90°. The last experiment reported the characterization of the radiation pattern.
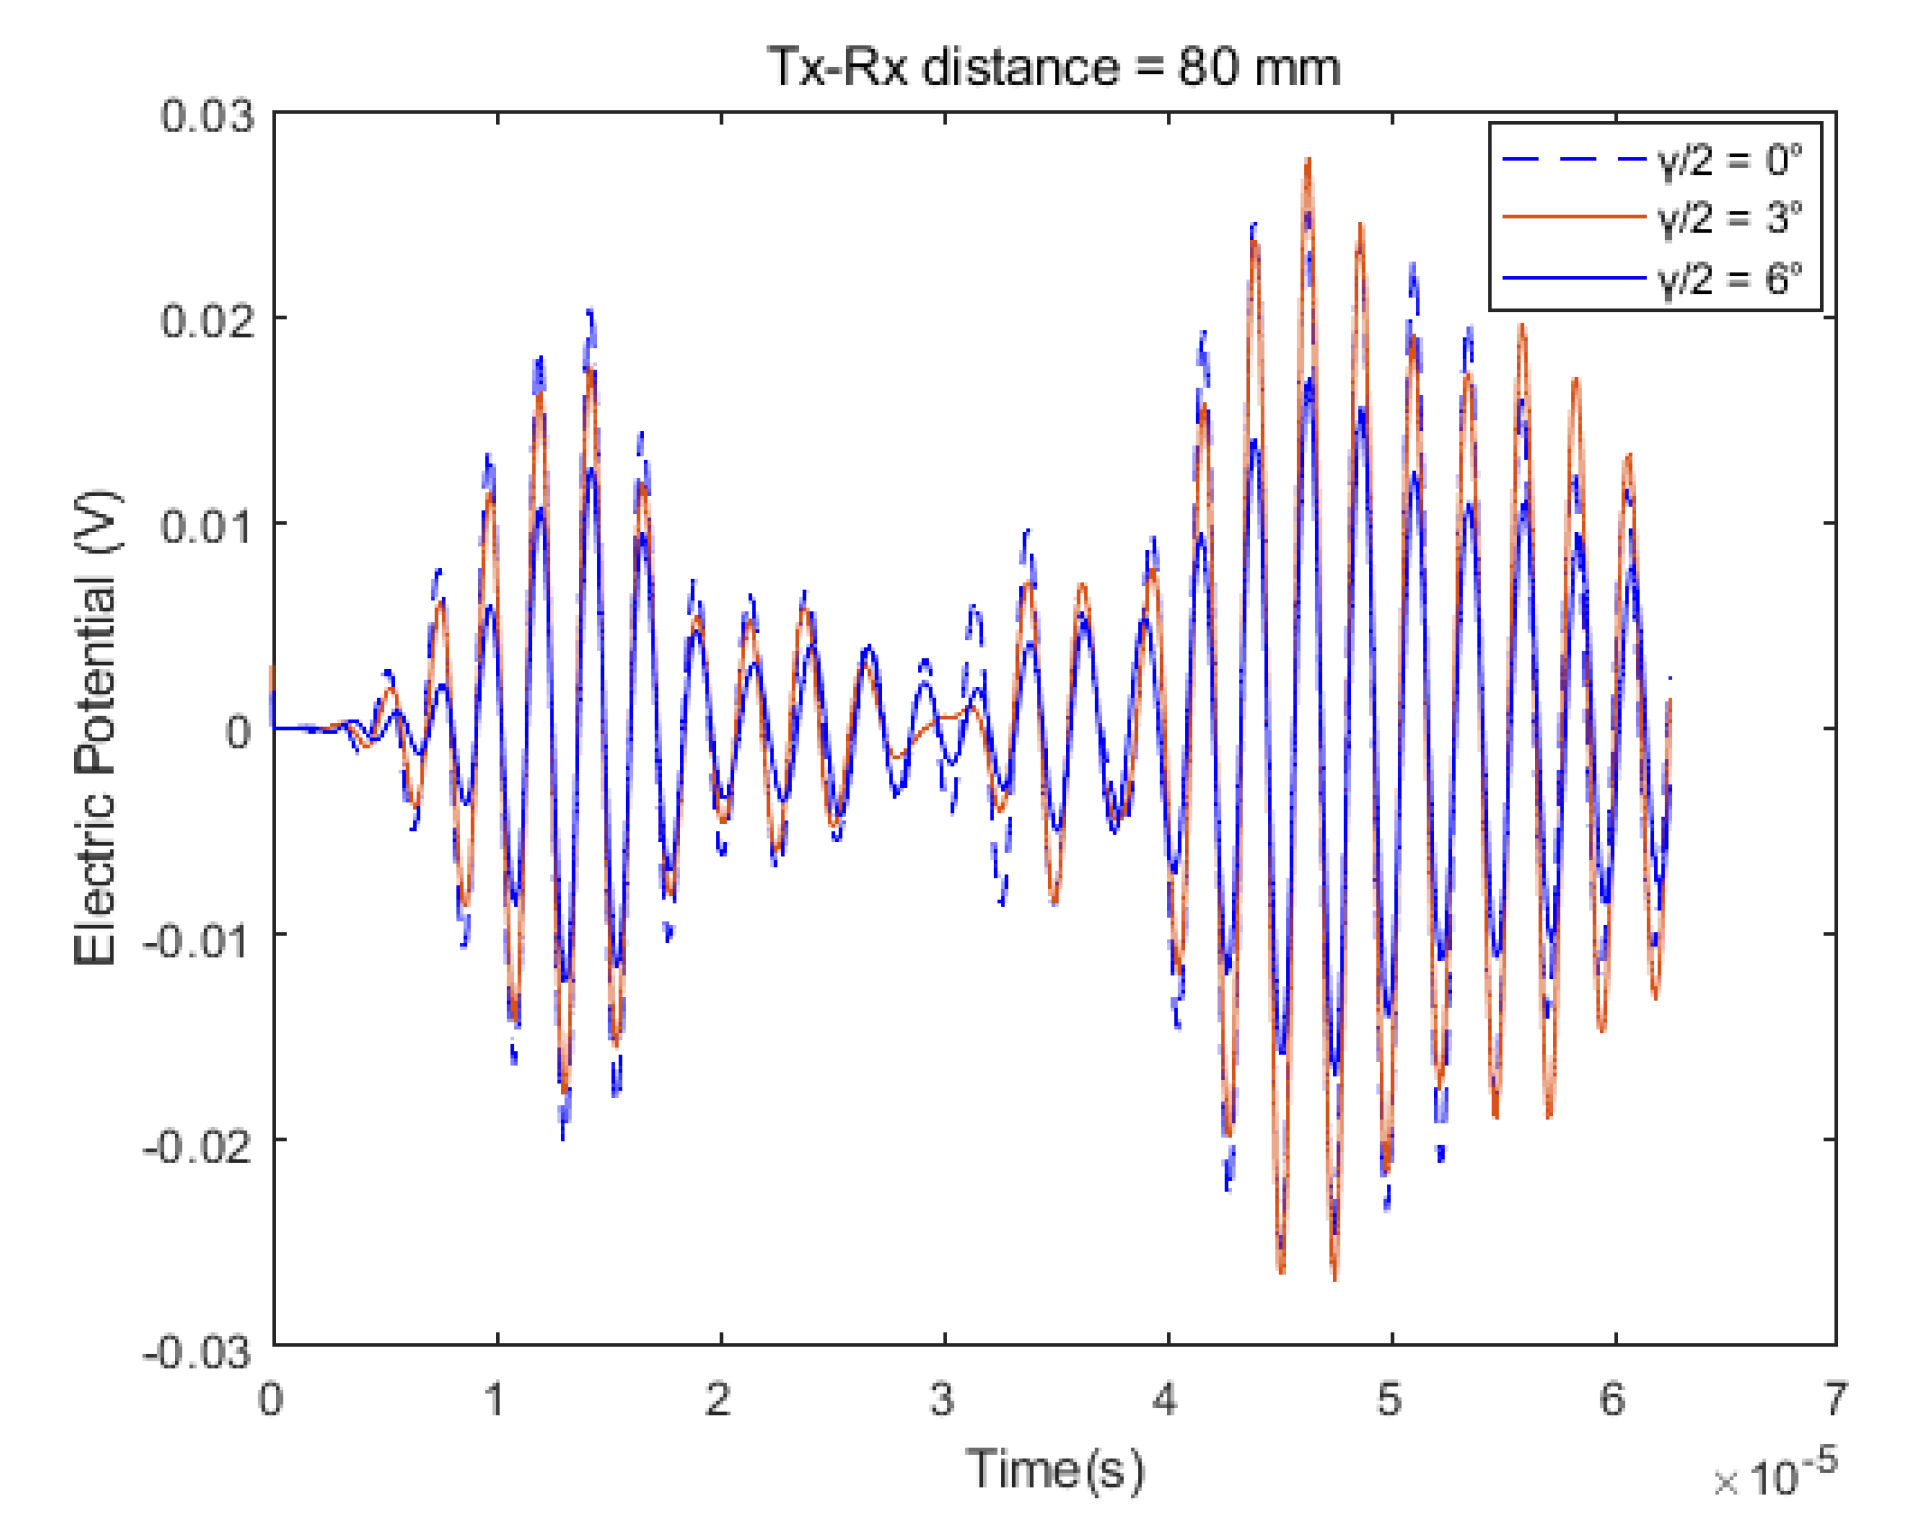
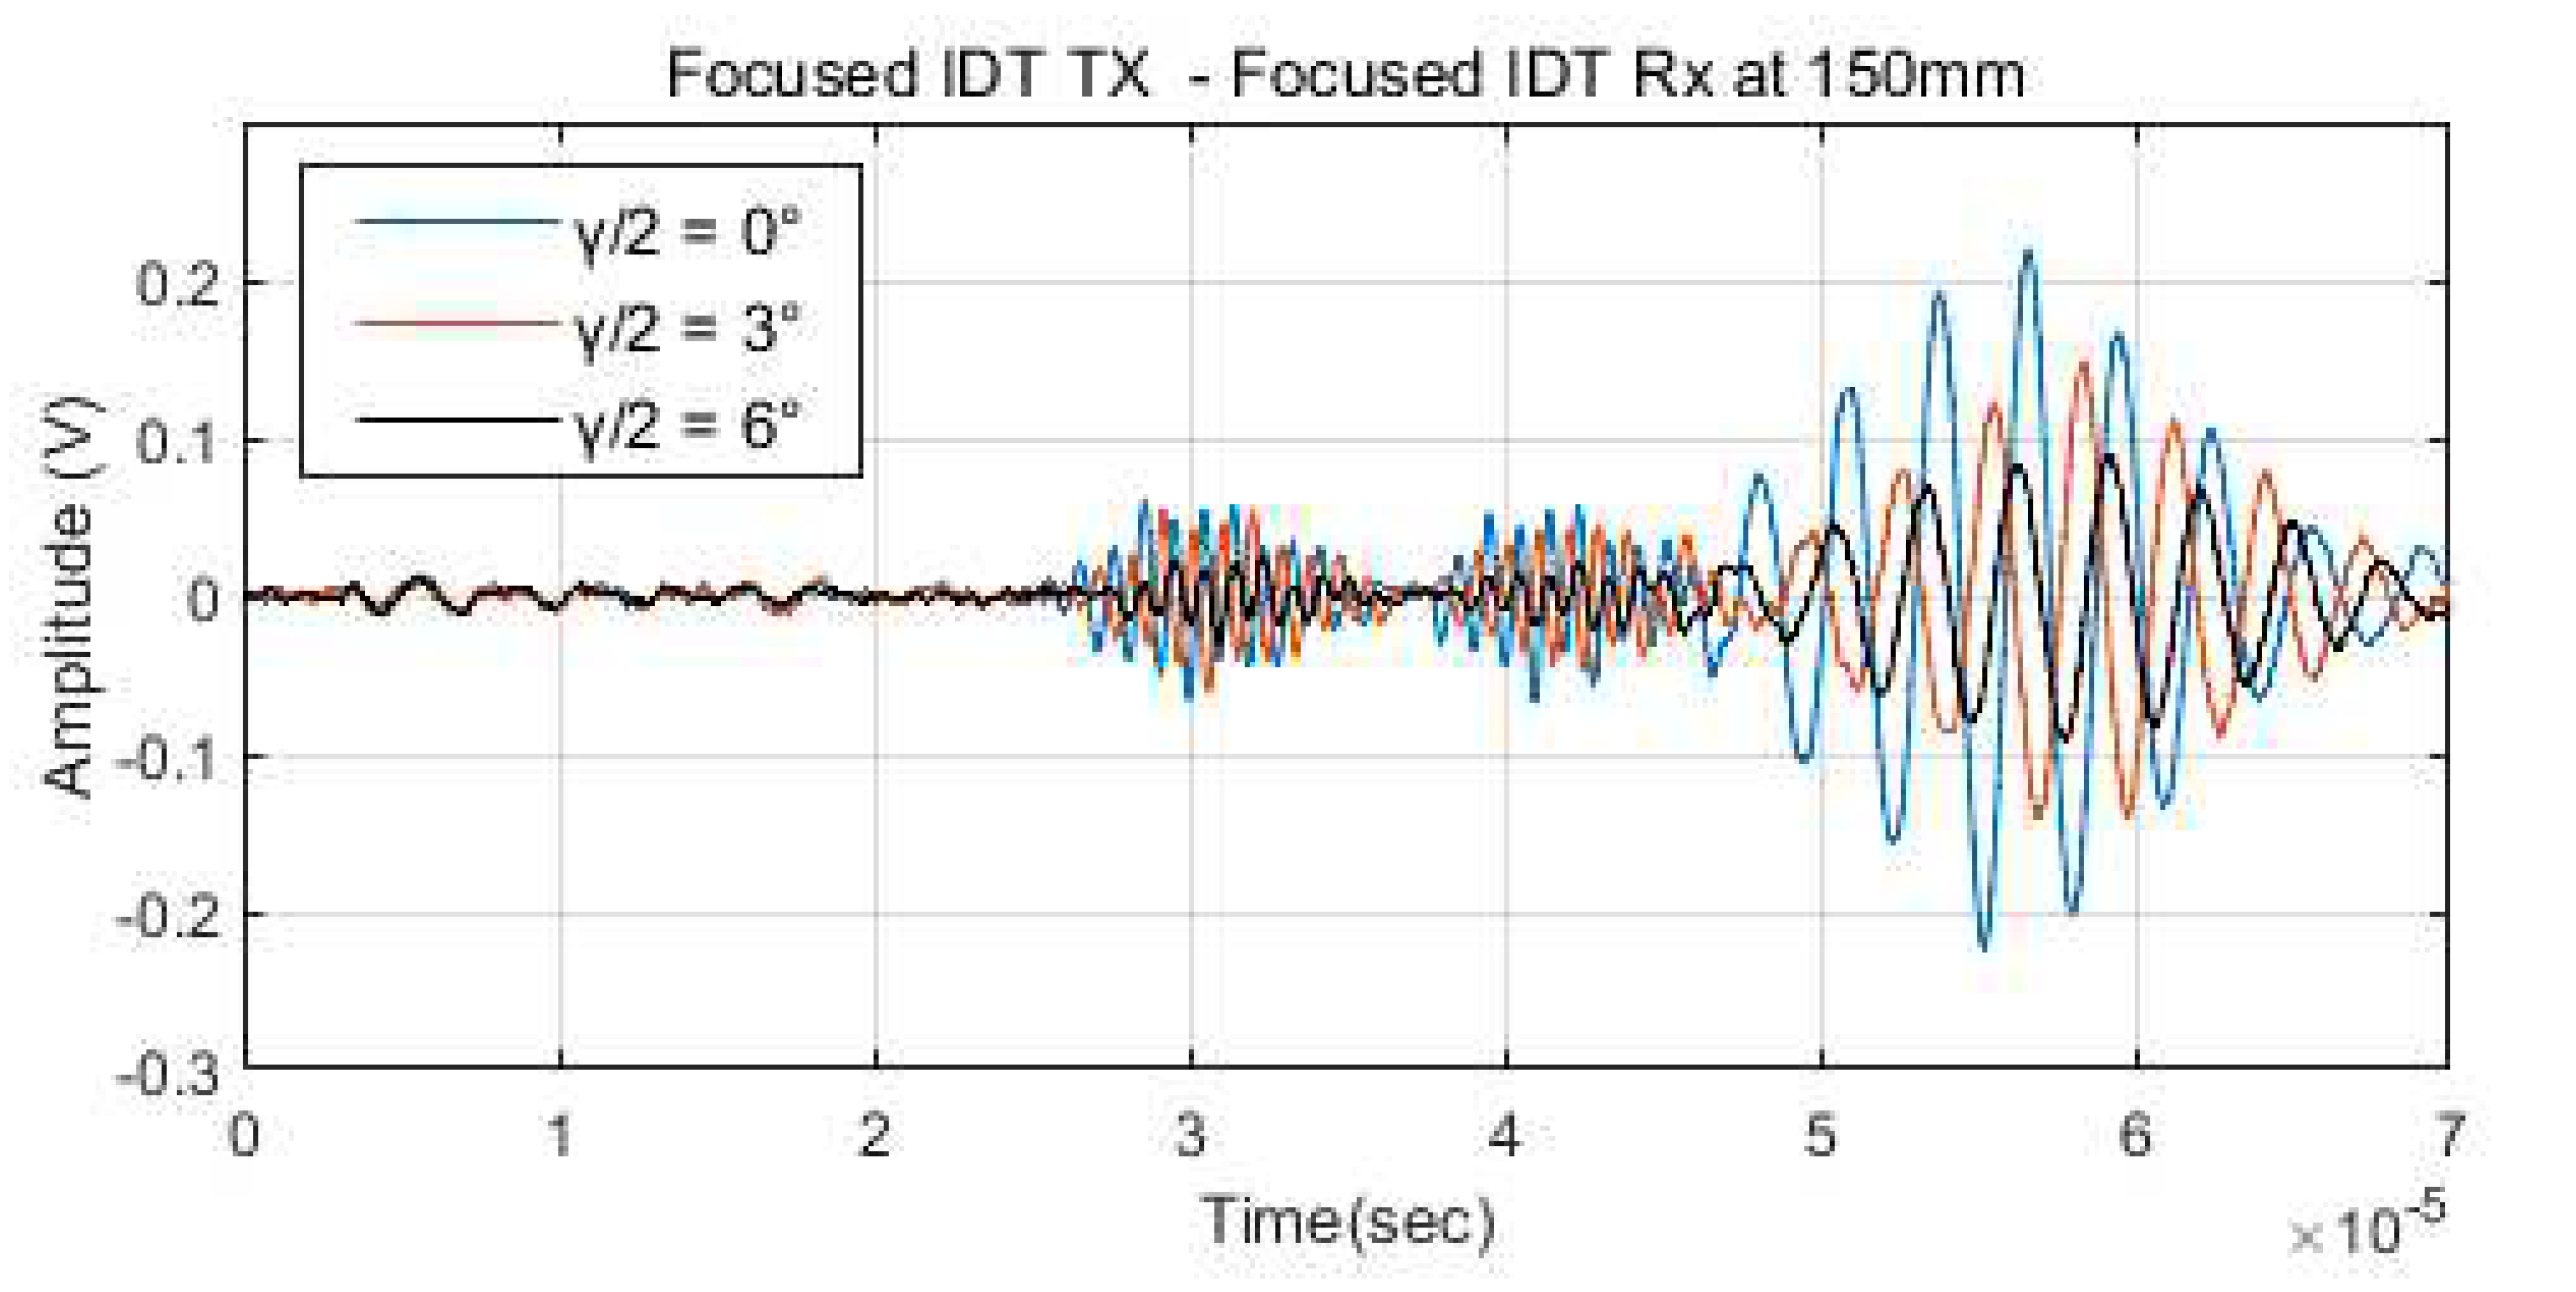
Figure 13 shows the acquired signal at various positioning angles of the receiver IDT with respect to the transmitter. The reference signal (blue color) represents the acquisition at 0°; the other acquisitions correspond to different angles
between the transmitter and receiver placed at a distance of 150 mm. Moreover, in
Figure 13, we validate the radiation pattern of the focused geometry: the attenuation recorded for the focused geometry corresponds to a spread angle of 6° (
), which is the same as reported in
Figure 10.
The results of the investigation of the regular and scaled geometries for IDTs are summarized in
Table 1 and
Table 2: we observed an excellent agreement between simulations and experimental tests that validated the design according to the FEM approach. The only discrepancy occurred for the maximum values of amplitude of the acquired signal which we could explain by the variability of losses introduced by the mechanical coupling of the bi-adhesive tape used for bonding the transducers on the laminate.
6. Conclusions
In this work, a detailed analysis of the geometry and dimensions of the electrodes of interdigital transducers was carried out, and a new design approach for their fabrication was presented. Interesting results were the extension of the application of IDTs in SHM systems where both the propagation mode selection and the beam configuration must be tailored to specific requirements. The study used finite element modeling software and considered a piezopolymer film material; this study highlighted the influence of all the dimensional parameters of the electrode pattern on IDT characteristics.
Finally, the scaled geometry of the electrodes was proposed to obtain an asymmetrical beam pattern able to focus and blur the beam in a given direction, or alternatively, to obtain an almost isotropic radiation pattern. In this regard, IDTs, commonly designed for pitch and catch configuration, become more flexible devices to be used in SHM systems. The FEM-simulated results of piezopolymer IDTs with regular and scaled geometry were compared with IDTs fabricated with laser ablation technology and the results were in good agreement. It was also shown that such transducers were able to generate dispersive (A0 and S0) and non-dispersive (SH) modes of propagation with different transduction efficiency. To complete this experimental work, a theoretical modelling is needed to validate the results of FEM, and once it is performed, it will be possible to optimize the choice of the electrodes scaled geometry and bus bars dimensions for the target application.


