Article

Adhesion State Estimation for Electrostatic Gripper Based on Online Capacitance Measure

1
Department of Industrial Engineering, University of Trento, 38123 Trento, Italy
2
Department of Excellence of Robotics and AI, Institute of Mechanical Intelligence, Scuola Superiore Sant’Anna, 56127 Pisa, Italy
3
Department of Industrial Engineering, University of Bologna, 40126 Bologna, Italy
*
Author to whom correspondence should be addressed.
Actuators 2022, 11(10), 283; https://doi.org/10.3390/act11100283
Submission received: 24 August 2022 / Revised: 16 September 2022 / Accepted: 26 September 2022 / Published: 5 October 2022
(This article belongs to the Special Issue Smart Dielectric Elastomer Actuator and Sensor Systems)

Abstract

:
Electroadhesion is a suitable technology for developing grippers for applications where fragile, compliant or variable shape objects need to be grabbed and where a retention action is typically preferred to a compression force. This article presents a self-sensing technique for electroadhesive devices (EAD) based on the capacitance measure. Specifically, we demonstrate that measuring the variation of the capacitance between electrodes of an EAD during the adhesion can provide useful information to automatically detect the successful grip of an object and the possible loss of adhesion during manipulation. To this aim, a dedicated electronic circuit is developed that is able to measure capacitance variations while the high voltage required for the adhesion is activated. A test bench characterization is presented to evaluate the self-sensing of capacitance during different states: (1) the EAD is far away from the object to be grasped; (2) the EAD is in contact with the object, but the voltage is not active (i.e., no adhesion); and (3) the EAD is activated and attached to the object. Correlation between the applied voltage, object material and shape and capacitance is made. The self-sensing EAD is then demonstrated in a closed-loop robotic application that employs a robot manipulator arm to pick and place objects of different kinds.

1. Introduction

Electroadhesion can be exploited to produce controllable retention forces with delicate interaction without the need of squeezing forces. Specifically, in an electroadhesive device (EAD), forces are generated by attraction between charges on electrical conductors and charges induced on the surface of the object, and prehension is guaranteed by the combination of such electrostatic forces and static friction action on the contact surfaces. EADs excel in applications where softness, compliance to irregular surfaces, and the ability to gently handle fragile objects [1,2,3] are important. Additionally, they are cheap, flexible, lightweight, have low energy consumption and can be effectively exploited for the implementation of grippers [3,4,5], clutches [6,7,8], and conveyors [9], but also in locomotion systems [10,11].
Thanks to their low-cost, EADs are a very promising technology for industrial automation applications, for example, fully automated high throughput assembly lines for products, such as card boxes, food packages, post letters, cloth and many others. For these industrial applications, it would be also desirable to have EADs that are equipped with sensors able to quickly measure/detect the status of adhesion or grasping in order to automatically monitor the process. However, the sensing or detection of electrostatic forces during the operation of EAD is quite difficult due to the intrinsic nature of electrostatic forces combined with the mechanical softness/flexibility that impedes the use of force sensors as in conventional gripping/handling systems [12,13]. Luckily, EAD have an intrinsic variation of capacitance that is associated with the capacitive coupling established between EAD and the adhering object. Its measurement during operation can identify several important adhesion parameters without any additional sensors. Such a variation is dependent upon the material of the adhering object, the surface quality, and the presence of remaining air gaps at the interface. The non-trivial aspect of this measuring system relies on the high-voltage (usually in the range of several kilovolts) required for the operation of EAD.
Such problems have been tackled in several previous works in which capacitive self-sensing was studied for dielectric elastomer actuators (DEA) [13,14,15,16,17,18], i.e., another class of capacitance-based high-voltage electrostatic devices. In these works, capacitance sensing is employed to estimate the state of the deformation of the elastomer dielectric that allows to accurately estimate the position of the actuator. This capacitance measure method is obtained by controlling a high-voltage amplifier (HVA) so as to superimpose a low-voltage sinusoidal signal to the high-voltage output that drives the actuator. This is combined with an accurate reading/acquisition of voltage and current that are fed into online estimation algorithms (that run on an external computational unit) for estimating in real time the capacitance [19,20,21,22,23]. This method is sufficiently accurate and fast to operate in real time; however, it needs high-performance HVAs that feature the large bandwidth and high resolution (to drive the sinusoidal signal), and needs a dedicate external computation.
For EAD, there have been a few attempts to realize sensing systems. In [24], a sensing system was implemented, but it employed additional camera sensors and a complex online image processing system which gives useful information on the size and shape of the gripped object but does not provide any details on the status of the adhesion. Saravia et al. [25] developed an EAD for space applications with integrated strain gauges, which adds to the complexity of the device, while providing only proprioceptive information about the deformation of the EAD itself. Guo et al. [26] integrated a compliant touch sensor in their EAD made of the same materials as the electrodes of the EAD but not part of the gripper main circuitry. In [27], capacitive self-sensing in an EAD was obtained, but it still employed a quite complex electronic driving/measurement system developed for DEA illustrated in [16]. In [28], a hybrid electromagnetic and electrostatic gripper with self-sensing capabilities was described. The authors successfully adapted one of the online estimation algorithms developed by Rizzello et al. [21]. Although they performed accurate capacitance readings, this approach still requires HVA able to provide sinusoidal signals and external computation systems. Furthermore, in this method, the electrical bandwidth seems to be somewhat limited (under 80 Hz), and the system lacks a description of the galvanic insulation measures required to protect the computation system in the likely scenario in which the EAD suffers electrical failure.
Herein, we propose a new method for capacitive sensing in EAD that is based on a custom low-complexity circuit that provides a direct analog output signal proportional to the capacitance value and does not need high bandwidth HVA. The system is based on the injection of a low voltage sinusoidal signal obtained through filtering capacitors combined with a precision rectifier. The proposed measurement system is able to detect the state of adhesion in electroadhesive grippers, such as the interdigited electroadhesive pads presented in [3]. We further demonstrate the system, integrating the gripper in robotic manipulator that is automatically controlled in grasping different objects while detecting the possible release/falling of the object during the handling phases.
Section 2 describes the employed strategy for the online reading of the EAD capacitance. Section 3 shows the capacitance dependency on the material substrate, the shape of the object and the applied voltage. Section 4 presents a closed-loop application in which prehension feedback is given to a robotic arm, tasked with manipulating a few objects.

2. Sensing Strategy

2.1. Capacitive Sensing Circuit

An EAD can be electrically represented as a resistor–capacitor (RC) circuit (see Figure 1). During operation, the circuit can be visualized as having two parts, the EAD itself and the electrical wiring. The former consists of the gripper capacitance C g , electrodes resistance R e , and a leakage resistance [13,17,29] R l , whereas the electrical wiring introduces the resistance R w and the parasite capacitance C p . The parasitic capacitance is often overlooked in the literature, but can be a significant source of error in the case of small C g values.
Capacitance sensing in EAD is particularly interesting, as it can provide information on the adhesion state and on the grasped object. However, since EAD usually operates under high DC voltage (in the range of 1–10 kV), the online measure of capacitance can be non trivial. The most straightforward way to measure the capacitance of the EAD is through the injection of a sine-wave voltage signal and the measurement of the amplitude of the current flowing through the device.
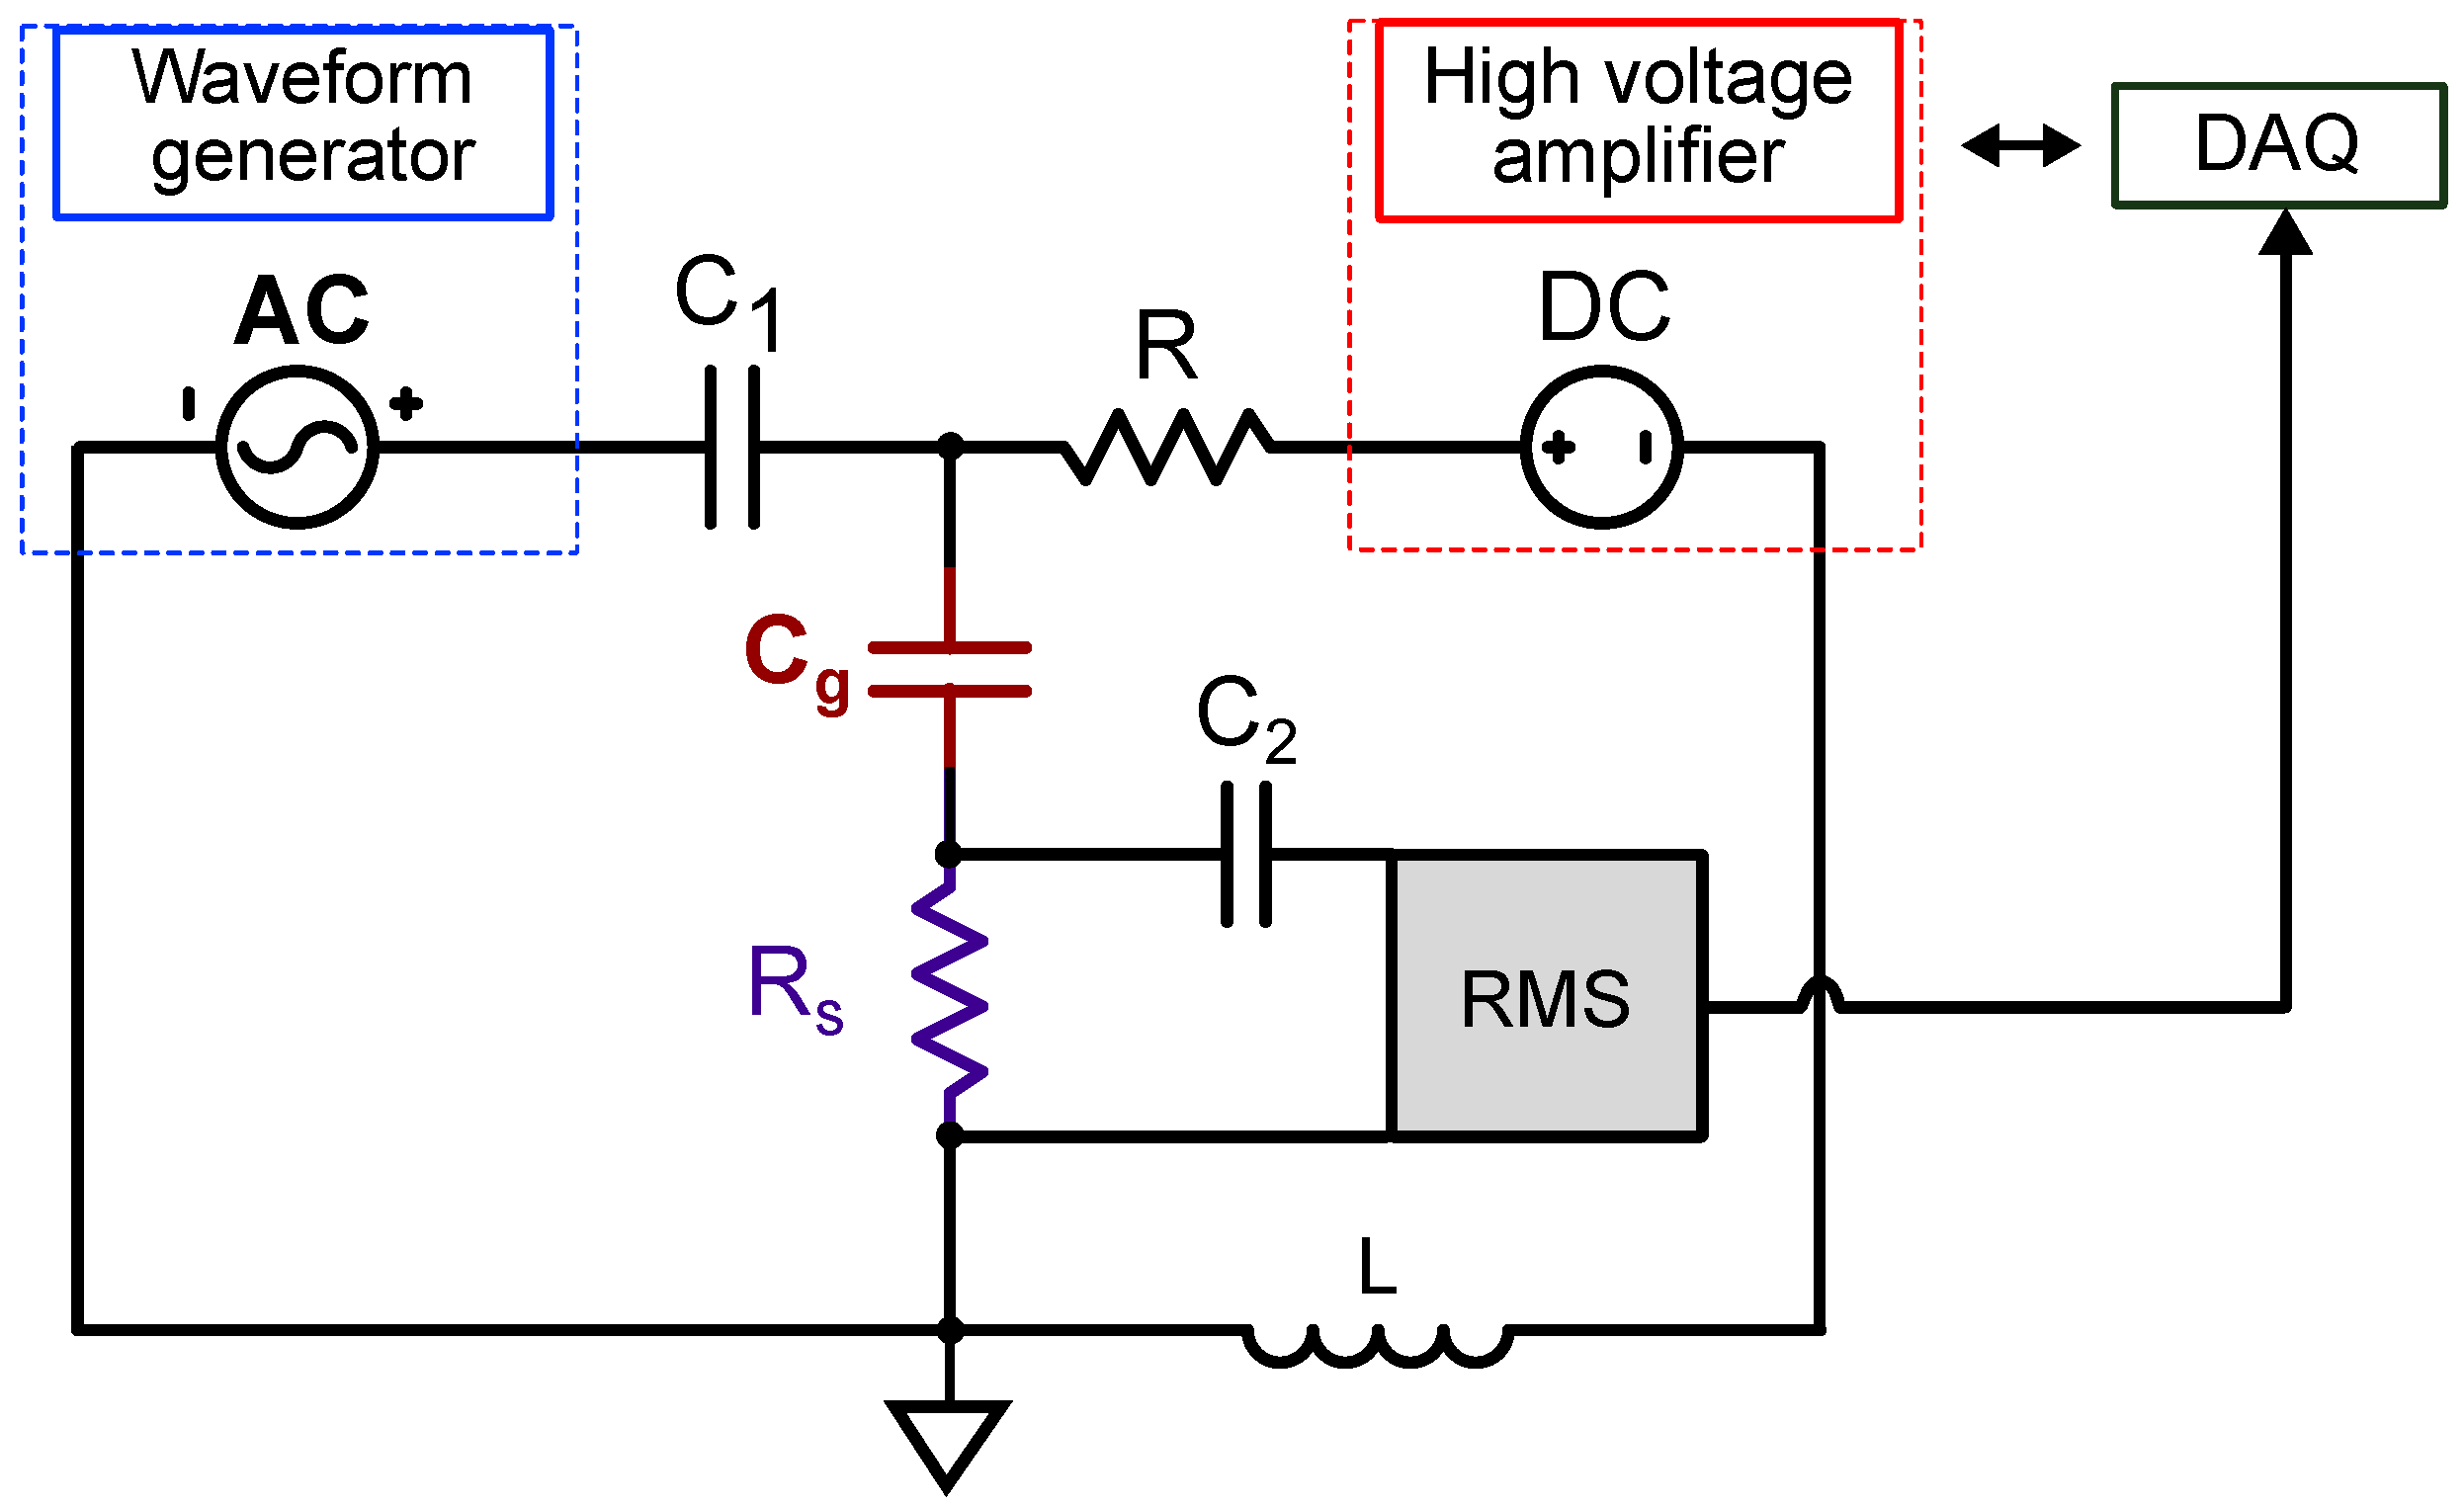
This can be done directly commanding a small amplitude AC voltage that is superimposed to the DC voltage using a large-bandwidth/high-accuracy high voltage amplifier. This was done in [24,27,28], but it requires complex driving electronics. In order to provide an alternative low-complexity solution, we conceived a capacitive sensing circuit (CSC) that combines the high voltage from a DC generator and low DC voltage from a sine-wave generator. Specifically, a low-impedance AC path is used to inject the AC voltage signal V A C and a low-value sensing resistor in series with the EAD can be used to sense the current flowing into the EAD in combination with a RMS detector circuit.
A block diagram of the CSC is shown in Figure 2. The DC bias path used to drive the EAD consists of a HVA in series with an inductor L and a bias resistor R. Although the sensing resistor R s is also part of the bias path, its value is negligible compared to the bias resistor, and thus it does not affect the EAD operation. The sensing path uses an AC waveform generator, AC coupled (but DC isolated) to the EAD through the capacitor C 1 . The AC voltage across R s , proportional to the EAD current, is measured with a RMS detector, AC coupled through C 2 , which transforms the amplitude of the high-frequency AC signal into a low-frequency voltage amplitude that is proportional to the intensity of the high-frequency signal. The output of the RMS detector can then be acquired by a analog-to-digital converter.
The RMS detector circuit, whose schematic is shown in detail in Figure 3, is composed of three parts: a high-frequency amplification stage, which increases the amplitude of the signal across R s , an AC coupled precision rectifier, which produces a half-wave rectified version of the amplified signal and applies an additional voltage gain, and a low-pass filter, providing the average value of the rectified signal as a low-frequency output signal. If the impedance of C 1 , C 2 , and R s is much smaller than the impedance of C g , the current across the sensing loop will be determined by the capacitance of the EAD, and the output voltage V o u t is expected to be approximately proportional to the value of C g through the equation
V o u t = 1 2 2 A 1 A 2 2 π f R s ( C g + C p ) V A C ,
where A 1 is the gain of the amplification stage, A 2 is the gain of the precision rectifier, and f is the frequency of the AC probe signal.
The linear relation is expected to hold if the bandwidth and slew rate of the operational amplifiers are large enough to avoid distortions of the rectified signal and if its amplitude of the amplified signal is below the saturation level. For large values of C g , these phenomena can lead to a non-linearity in the relation between V o u t and C g .
The circuit bandwidth is determined by the low pass filter R 6 C 4 . The cutoff frequency for this filter should be not too large since its function is to suppress the ripple at the probe frequency (500 kHz). In the current implementation, this frequency is set to 720 Hz (given the values R 6 = 10 k Ω and C 4 = 22 nF). To maximize the bandwidth of the circuit while effectively suppressing the ripple of the probe frequency, the passive filter R 6 C 4 could be replaced with a two-pole or a multi-pole filter.
It is worth mentioning that, while the AC signal is provided by a laboratory function generator, the same signal can alternatively be produced with less complex circuitry, such as a direct digital synthesis (DDS) integrated circuit. Similarly, the data acquisition system (DAQ) can be replaced with an inexpensive microcontroller, thus enabling a compact and simple capacitance sensing solution.

2.2. Calibration

The calibration of the capacitance sensing circuit (CSC) was done using an array of constant capacitors, previously measured with an LCR meter (4248A precision LCR meter by Agilent Technologies, Snata Clara, CA, USA) at the same frequency f = 500 kHz used for the inline measurement. The frequency was chosen as a compromise to be sufficiently higher than the electro-mechanical bandwidth of the EAD, but at the same time limiting the requirements of the operational amplifiers in terms of the gain–bandwidth product. The measured relation between the calibration capacitance and the output voltage V o u t of the RMS detector circuit is shown in Figure 4. The curve shows a good linearity for capacitance values lower than 50 pF. Above this value, a non-linearity appears, and a saturation behavior is observed. As mentioned in Section 2.1, this behavior is due to the slew-rate limited distortion in the rectifier stage and, at higher capacitance values, to the saturation of the operational amplifier. However, the non-linear range before the saturation can be used as well in case a dynamic range extension is required, as it is easy to fit it with simple non-linear functions with few variables. The relationship between V o u t and the input capacitance is monotonic, and an excellent repeatability was observed in the measurements. Therefore, using a non-linear calibration, it is still possible to accurately estimate the value of the EAD capacitance well over 50 pF. As an example of calibration, Figure 4 shows a stretched exponential fitting of the type V o u t = A + B exp ( α C g β ) , where A, B, α , β are constants. Other methods we successfully employed are simple polynomial functions, C g = a n V n + + a 2 V 2 + a 1 V + a 0 , where a 0 are constants, and n is the degree of the polynomial. The degree we used is n 5 . It is worth noting that the linear range as well as the full measurement range can be modified by changing the operational amplifier and adjusting the gain of the two amplification stages.
It is worth mentioning that this is just an example of a fitting. The regression function depends on many adjustable components, most importantly on the sensing resistor and the amplitude of the oscillating signal. With the components that we used, we were able to measure accurately the capacitance up to 300 pF. The range, however, can be tuned by changing the gain of the first and second amplifying stages.
To estimate the measurement precision of the circuit, we measured seven constant capacitors with the CSC with values in the range 30–300 pF. These capacitors were accurately measured beforehand with the precision LCR meter, and the obtained reference values are 31.5, 52.6, 101.5, 154.1, 186.5, 230.1, 261.7 pF. Each measurement was repeated four times. The maximum achieved deviation is around 6%, ranging from around 1% for the capacitance values under 100 pF, up to 6% at higher capacitance values. Here, we used a 30 V bias level instead of the usual several kilovolts employed in EAD, due to voltage limitation of the constant capacitors. However, due to the circuit, the DC bias level cannot affect the capacitance reading.

3. Pad-Substrate Capacitance Measurements

3.1. The Electroadhesive Pads

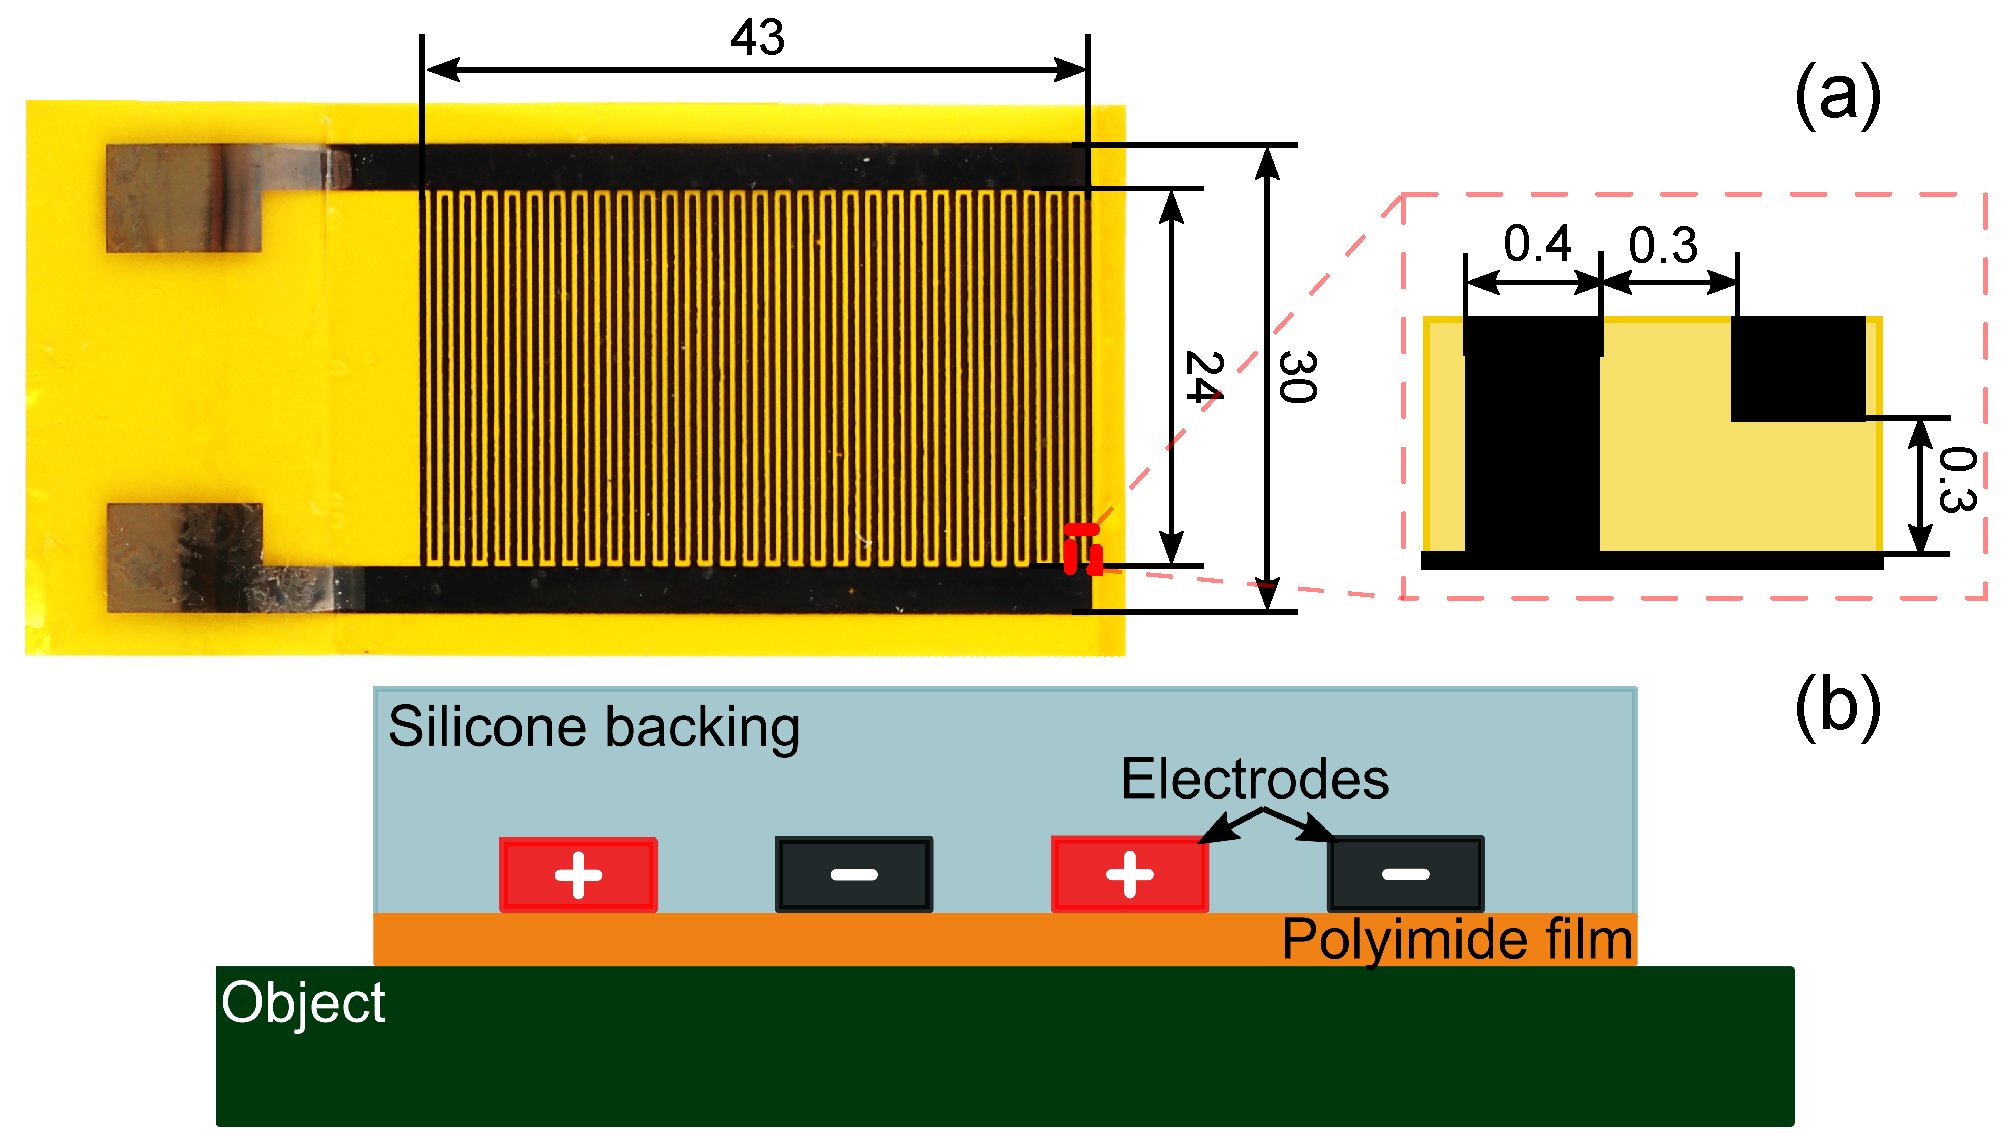
To perform the intended adhesion tests and the subsequent capacitance measurements, we employed the electroadhesive pads described in [3], also shown in Figure 5a. They are thin (∼315 μm) and lightweight (0.7 g) EAD made of three key components: a main dielectric layer, thin interdigitated electrodes, and a backing insulating layer (Figure 5b). The main dielectric layer is a 25 μm polyimide (PIT1N/210 by Caplinq Europe, Assendelft, Netherlands) film. The electrodes follow an interdigitated pattern which spreads across an active area of around 9.6 cm2 and are deposited on the main dielectric with an inkjet printing technique. Inkjet printing allowed for precision in making narrow electrodes (400 μm) with 300 μm of spacing in-between. The backing insulating layer is made of silicone (Silpuran 6000 by Wacker Chemie, Munich, Germany), blade casted on top of the electrode and the main dielectric. The employed materials offer a high degree of flexibility with good electrical performance. These particular pads were selected for their flexibility, dimensions, ease of manufacturing, and electrode design, which shows good adhesion with objects made of insulating materials.
At first, the capacitance of three identical pads was determined in air with the Agilent 4248A precision LCR meter at a frequency of 1 MHz. The pads were consecutively suspended in air and were connected to the input of the LCR meter in the same manner. The measured capacitance values ranged between 28.4 and 30 pF, close to the 28.8 pF capacitance reported in [3], averaged from a pool of seven identically manufactured pads.

3.2. Capacitance of the Pad-Object Contact

It is of interest to determine the capacitance relation to three parameters: the applied biasing voltage, i.e., the high voltage applied to the pads; the material of the object; and the shape of the object to adhere to. To do this, we connected an electroadhesive pad to the CSC described in Section 2, and we measured the capacitance arising from the contact of the pad with various substrate materials. Several substrate materials were employed: a sheet of standard A4 recycled paper—a common material often used in a wide variety of industries; a 25 μ m thick polyimide film (Caplinq PIT1N); a 25 μ m polyimide film doped with carbon particles for increased conductivity (Caplinq PIT1A-ESD-Black/50.8); and a 2 cm thick polished plate of aluminum. In order not to introduce capacitive contributions from the table or other objects due to the small thickness of the films, they were fixed in rigid rectangular clamps and were held horizontally in air throughout the entire experiment duration. At first, the capacitance of the pads was acquired in air and without a biasing voltage to account for the parasitic capacitance introduced by the electrical wiring. The pads where then laid down on the top surface of the films, and the biasing voltage was activated. The latter consists in 250 V steps from 0 to 5 kV with a step duration of 2.5 s. The voltage polarity was switched every step to account for any possible interface charge build-up [30,31], i.e., at the interface between the electroadhesive pads and the object.
The biasing voltage steps were generated by a Speedgoat Baseline real-time target machine and amplified by a factor of 1000 with UltraVolt 10HVA24 high voltage amplifier. The real-time target machine runs a Matlab Simulink 2021A environment and, besides generating the bias, it also acquires the CSC signal. The sensing signal is a 500 kHz sinusoidal waveform with 100 mV amplitude and is provided by an ISO-TECH GFG 2004 function generator. The approximate ambient temperature during the experiments was between 18 and 23 °C, whereas the humidity ranged between 58 and 75%. Although important for general adhesion performance, these parameters are more trivial for the capacitive measurement of the state of adhesion.
The resulting capacitance–voltage dependencies for each material can be seen in Figure 6a,b. Considering the capacitance of the pads being roughly 30 pF, a parasitic capacitance given by the wiring of around 10 pF can be estimated. As expected [32], we achieved the highest capacitance variation in the case of the aluminum slab (∼194 pF). Over 90% of the increase took place at a biasing voltage of up to 1.5 kV. This non-linearity is given, in great part, by the elimination of the air trapped between the pad and the plate at a fairly low voltage. In contrast, the non-conductive materials exhibit a much lower capacitance variation: 4.3 pF for paper, 2.6 pF for the carbon-loaded polyimide and only 0.9 pF for polyimide. The low and very similar variation of capacitance for the insulating materials may make it difficult to distinguish between them based only on the capacitance measurement. However, it is possible to distinguish between the state in which there is adhesion of the pad with a substrate and the state which lacks it. Such a distinction is sufficient for applications in which the material is already known (e.g., in industrial environments) and for which it is important to detect if the intended adhesion has occurred.
For the same capacitance measurements, three common commercial packaging items with different shapes were employed (Figure 6c): one rectangular cardboard box with flat laminated external surfaces; one cylindrical can with a radius of 32.5 mm, covered with a thin paper label; and a high-density polyethylene bottle with convex surfaces and a lower curvature than the can.
In the case of the flat surface of the rectangular box, over 90% of the variation happens at voltages of up to 1.5 kV, in a similar fashion to the metallic plate. However, in the case of the curved surface of the can, sufficient electrostatic force is required for the gripper to overcome its own bending stiffness, and therefore, the main capacitance increase takes place at a higher voltage, over 3 kV, when the pad bends and ¨zipps¨ onto the surface of the can, implementing a grasping movement.
Considering these capacitance measurements as reference values, Figure 7 builds a simple application scenario, where the capacitance measurement provides online feedback on the adhesion/contact state: the contact between the pad and a flat substrate is repeatedly established and broken mechanically with the purpose of proving that the CSC provides responsive and clear information to discriminate whether the pad is attached or detached from the substrate. During this preliminary demonstration, the gripper was activated at 5 kV DC. This short demo shows a capacitance variation of more than 100 pF, indicative of adhesion to a conductive substrate.

4. Self-Sensing Automated Demonstrator

Starting from the on–off contact tests provided in Figure 7, a more complex demonstration was created to show how the sensing system can be integrated in a fully automated robotic pick-and-place system. Specifically, we employed a robot arm made by Franka Emika equipped with a parallel two-jaw gripper of the same manufacturer. Electroadhesive pads were attached to each gripper jaw using small 3D printed plastic mounting brackets and nylon screws. The pads have their active surfaces oriented toward each other and are spaced apart by the aperture of the Franka Emika gripper itself. The main task is for the robot to grasp an object using the pads and perform certain operations based on the adhesion feedback received from the CSC.

4.1. System Description and Control

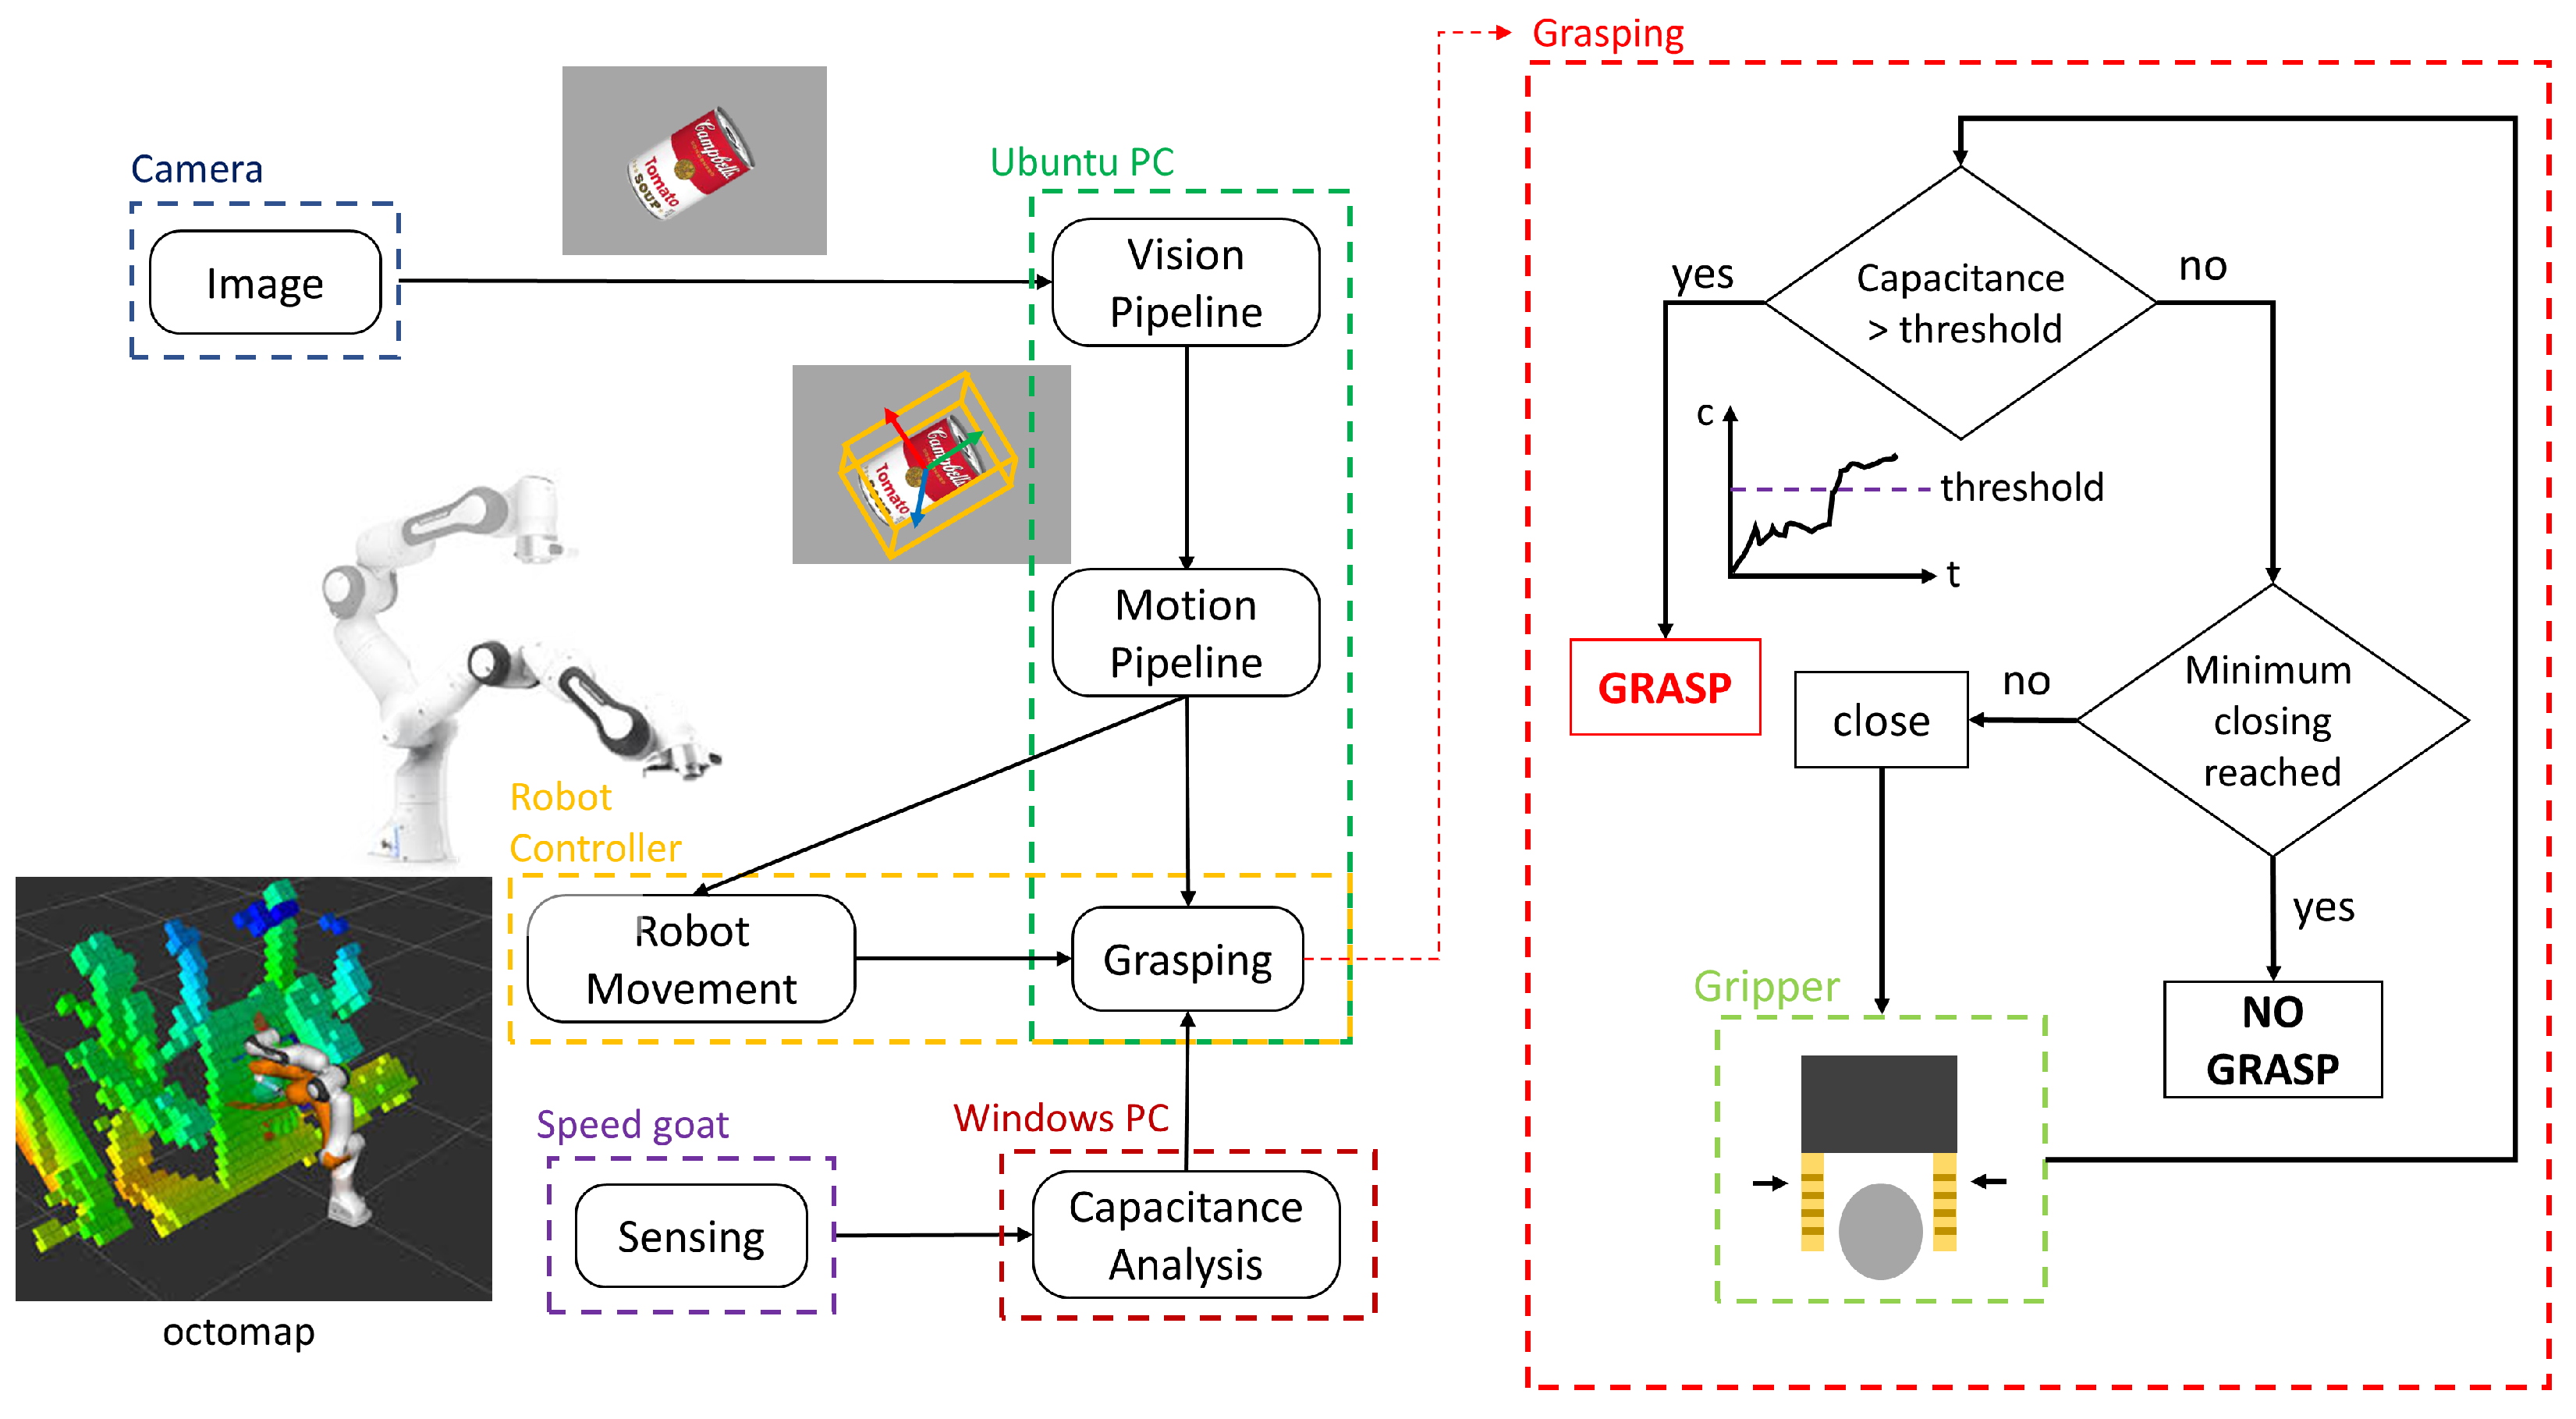
The system was realized as a component-based designed architecture. In particular, the vision and planning pipeline was run in the ROS (robotic operating system) Noetic environment containerized in a docker machine with Ubuntu 20.04 LTS. The gripper controller executes on a Speedgoat Baseline real-time target machine, and the capacitance analysis runs on another PC with Windows and MATLAB Simulink 2021a. All the computing units are interconnected by employing a switch: the Speedgoat talks directly with the Windows PC, which sends the closing information to the main Ubuntu PC via ROS messages from Simulink. Figure 8 depicts a schematic of the complete working pipeline with the necessary connections among the components.
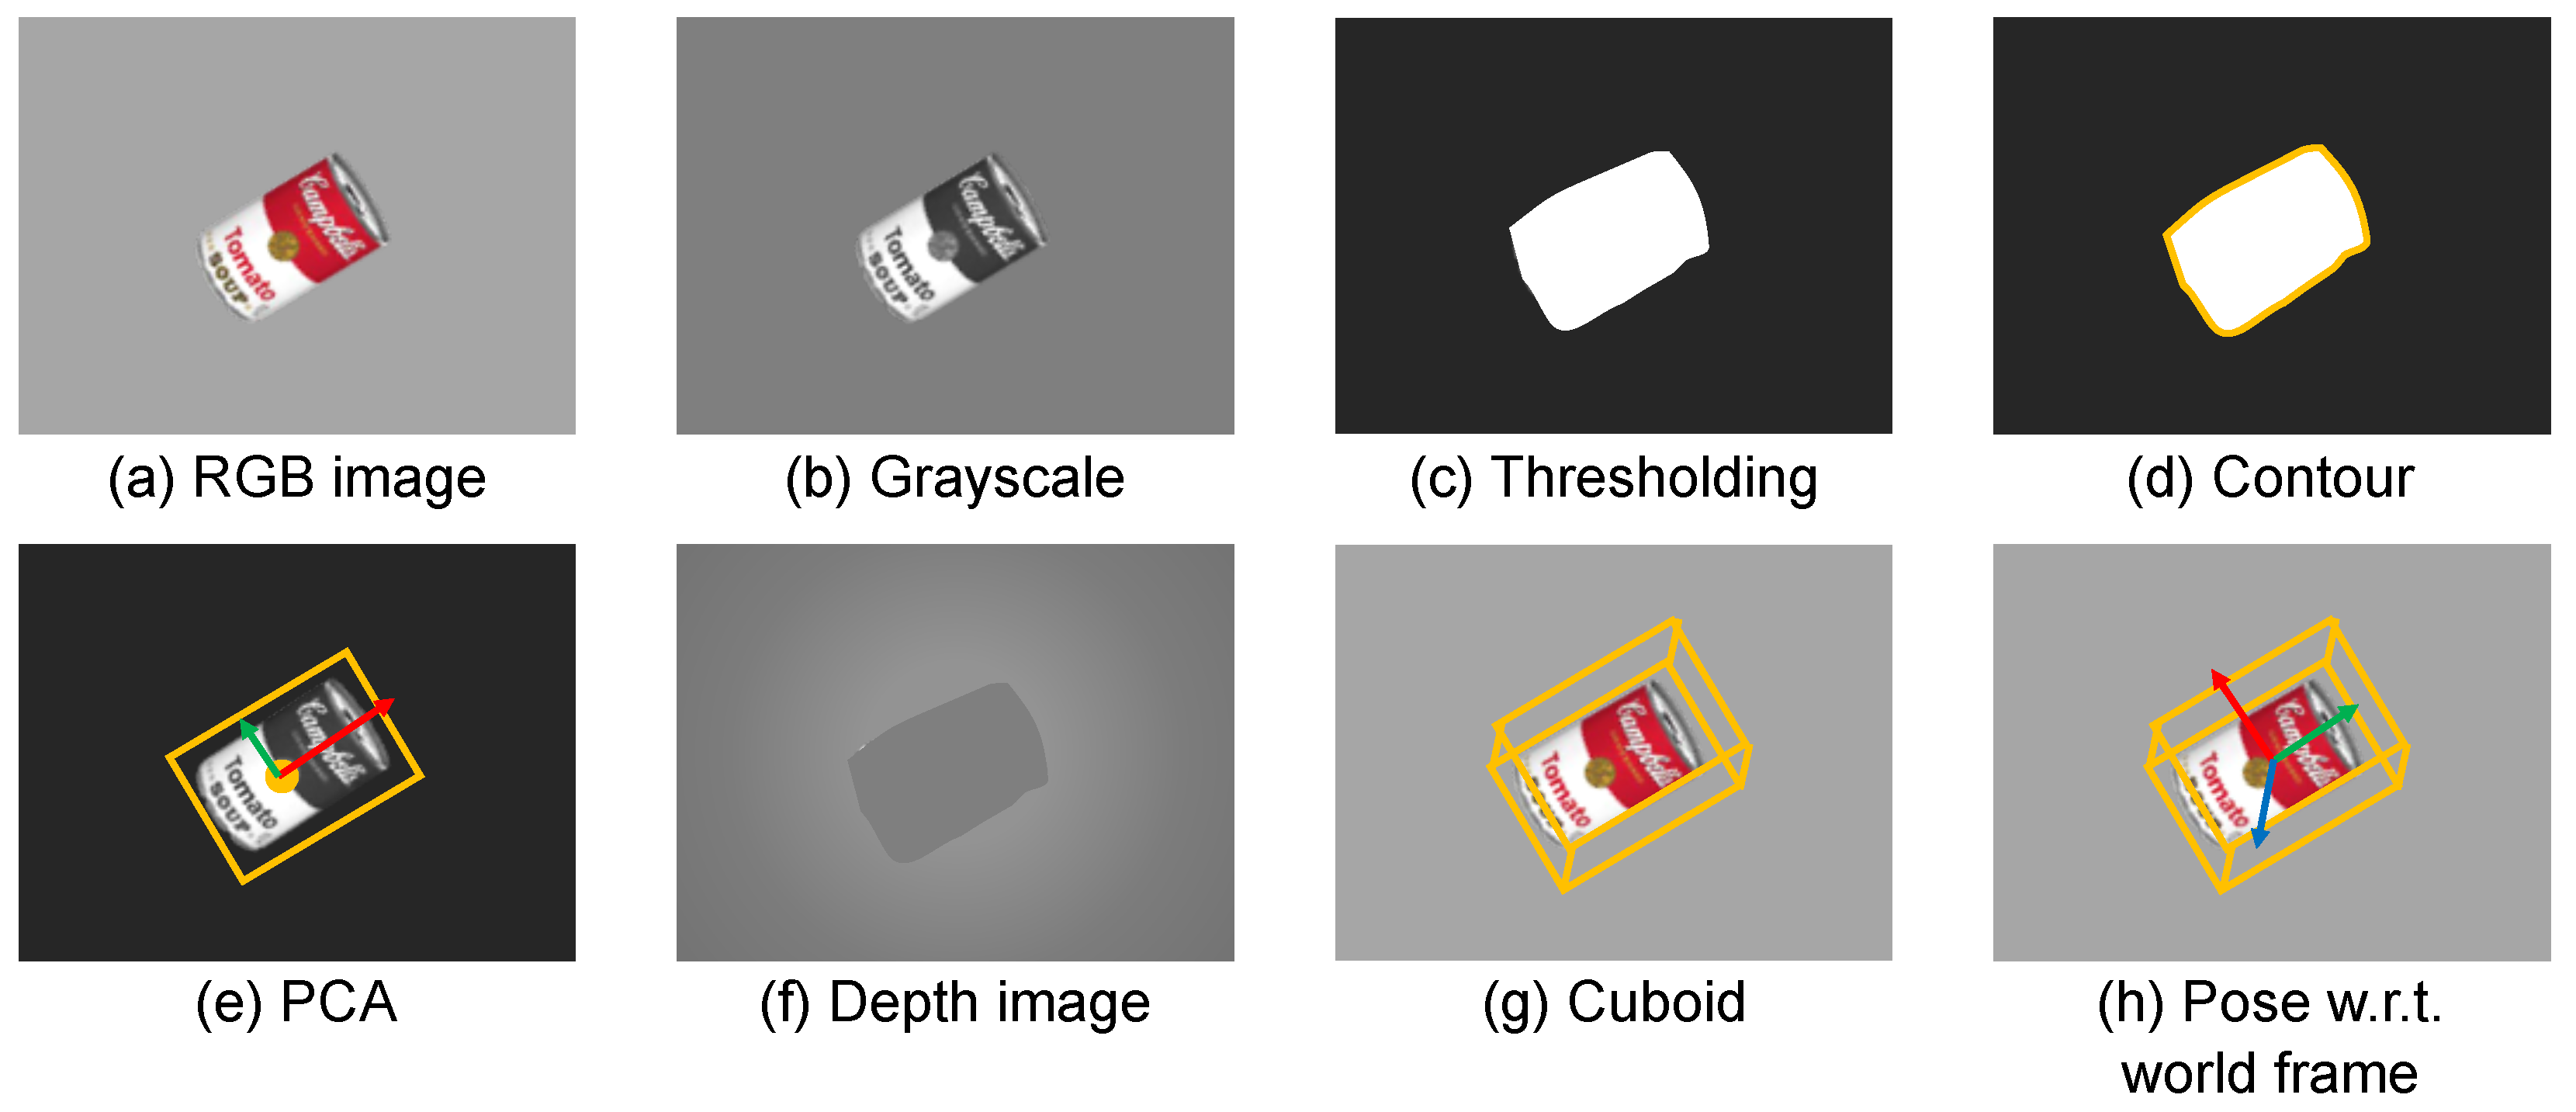
The vision system uses a Realsense D435 RGB-D camera positioned on top of the working table, looking down at the object to be manipulated. In order to show the grasp capabilities of the electroadhesive gripping system and to demonstrate the possibility of recognizing the instant in which electradhesion becomes effective, single-object scenarios are considered. The vision pipeline exploits the registered depth information for segmenting the scene and detecting the pose (location and orientation) of the target [33]. In particular, the algorithm extracts the principal axes, the centroid, and builds the bounding box. As a first step, the RGB image is converted to grayscale to perform a thresholding operation to obtain the mask of the target object. Then, the Suzuki algorithm [34] is used to find the contour, and the principal component analysis (PCA) is applied to that contour. PCA is a statistical procedure that extracts the most important features of a data set and allows for dimensionality reduction by finding the direction along which the data varies the most. Therefore, the PCA on the contour returns the two eigenvectors that represent the principal components of the data and are used to identify the object orientation. The size of each eigenvector is encoded in the corresponding eigenvalue, which indicates how much the data vary along with the principal component or, in other words, it represents the length of the side of the enclosing 2D bounding box. The beginning of the eigenvectors is the center of all points in the data set, i.e., the centroid. Generally speaking, applying PCA to an N-dimensional data set yields N N-dimensional eigenvectors, N eigenvalues, and one N-dimensional center point. The goal is to transform a given data set X of dimension p to an alternative data set Y of smaller dimension L. The problem can be formalized as finding the matrix Y, where Y is the Karhunen–Loève transform ( K L T ) of the matrix X: Y = K L T { X } . To find such a matrix, it is necessary to calculate the empirical mean, compute the deviations from the mean, and find the covariance matrix with its eigenvectors and eigenvalue. Therefore, the result of the PCA provides the centroid of the target ( p = [ m u , m v , 1 ] T ) where m u , m v are pixel coordinates, and the x and y-axis ( f x , f y ) of the object frame with respect to the camera frame. Assuming the object lays horizontally on the working table, the rotation matrix can be built by considering f z pointing inside the working table to be orthonormal to f x and f y that lay on the plane. Being that K is the intrinsic camera matrix and H is the homogeneous extrinsic matrix representing the camera frame in the world coordinate, it is possible to obtain the centroid of the object in world coordinates as follows:
P = H 1 K 1 p d 1 ,
where d represents the distance of the object from the camera. Then, the vision pipeline builds the 3D cuboid of the object deriving the height, width, and depth of the object. In particular, the height and the width can be obtained from the magnitude of the eigenvalues and the depth can be computed by reading the depth information provided by the camera as the difference between the depth value of the centroid and the depth of the working table. Finally, the algorithm searches for the two smallest parallel surfaces that are below the gripper clearance to compute the grasping pose of the robot. Figure 9 gives a graphical overview of the method.
The motion planning was realized with the use of the Moveit! framework. Collision-free trajectories are computed for the pick, holding, and placing phases by creating an octomap of the surrounding environment thanks to the point cloud of the camera. In particular, after the detection of the target pose, the robot moves from a pre-computed home position to a pre-grasp pose that the target pose with an offset along the z-axis. In such a way, the grasping happens with a purely vertical movement, with the gripper opened at its maximum clearance in order to minimize possible causes of errors. The grasping phase is a closed-loop signal procedure. During the grasping, the main Ubuntu PC commands the gripper to close until it receives feedback from the Windows PC that the capacitance has surpassed a threshold which has been calibrated empirically on the used objects. After grasping, the robot lifts the target, returning to the pre-grasp pose.

4.2. Tests and Results

Grasping tests were performed on the three objects described in Section 3, i.e., the rectangular box, the cylindrical can, and the HDPE bottle. Unfortunately, with the HDPE, a sufficient astrictive force could not be generated in order to support the bottle’s own weight. This is in agreement with the extremely low variation in capacitance that is measured in the experiments in Section 3.2.
The main operations performed by the robot can be described as follows:
  • The robot moves the gripper above the object, with the jaws completely open and the pads slightly distanced from the two opposite sides of the box, but not touching them. Voltage is supplied to the pads and the capacitance provided by the CSC is continuously monitored.
  • The gripper is closed and as a consequence, the pads close in to the object. When at least one of the pads is close enough to the surface of the box, it establishes a gradual contact. Increases in contact area correspond to increases in capacitance.
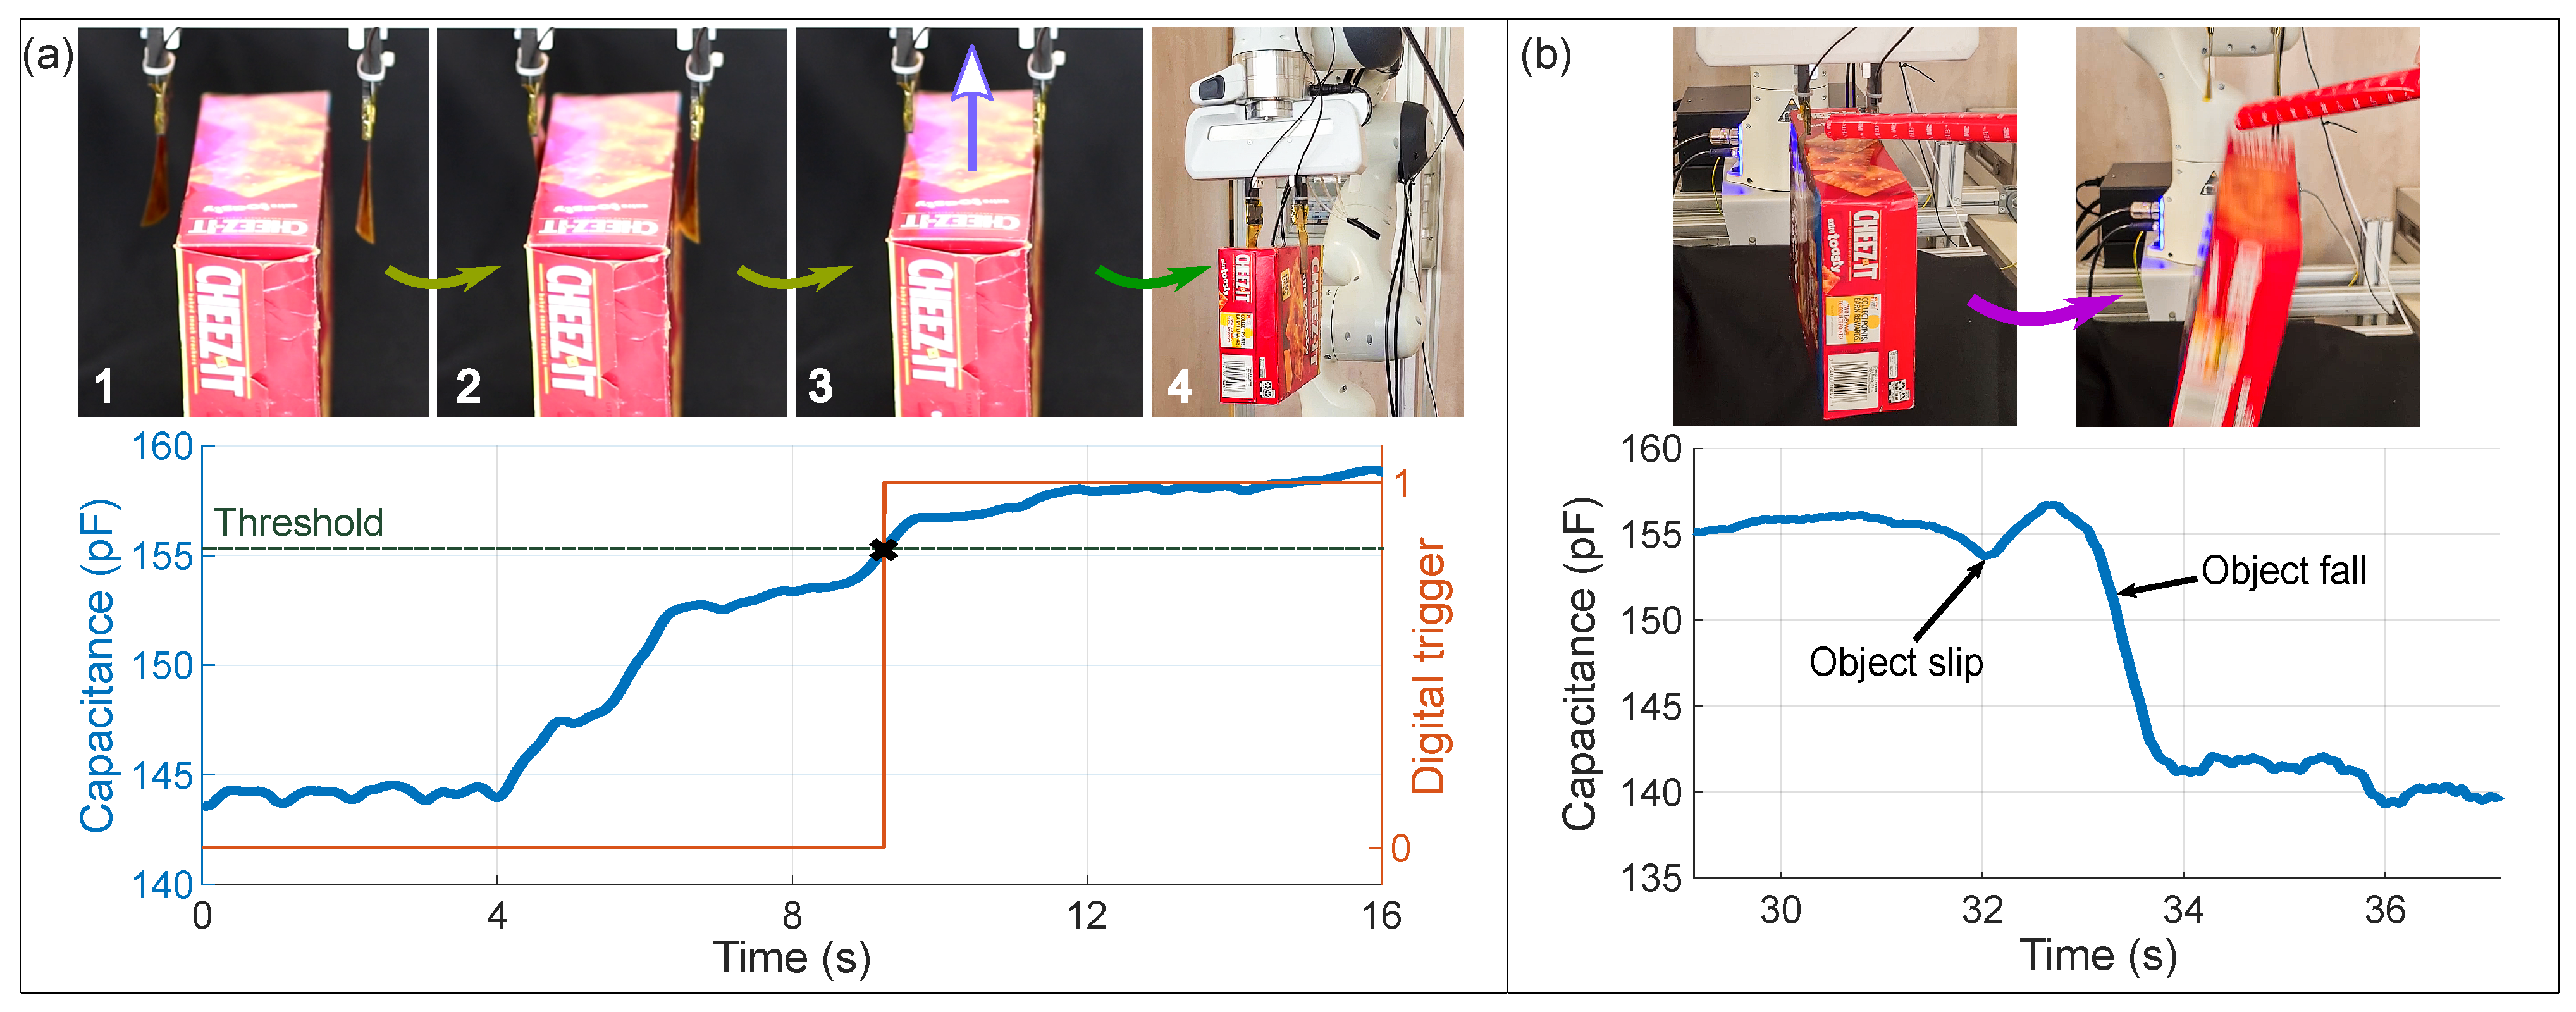
  • The gripper continues closing in until both pads have substantially adhered to the surface of the box. It stops closing in to the object when a trigger is sent to the robot controller (see time plot in Figure 10a). As mentioned in Section 4.1, the trigger is a digital signal generated when a capacitance threshold is surpassed, that is, when most of the pad surface has adhered to the box.
  • The robotic arm elevates the box from the table, while the Speedgoat target continuously monitors the capacitance values.
The adhesion of the pads is stimulated by a 4 kV amplitude, 2 Hz frequency alternating trapezoidal biasing signal with 10 ms rise time. Figure 10a and Video S1 (Supplementary Materials) show the variation of capacitance during the grasping and provide a visual guidance through the steps described above. It is worth noticing that in the same figure, two steps can be identified in the capacitance variation. The first increment is related to the adhesion of the first of the EAD pads (on the left in the picture sequence reported in Figure 10a), and the second is related to the adhesion of the second EAD pad (on the right one in the picture sequence reported in Figure 10a). The value of the threshold that is chosen to identify the successful grip is right below the value of the capacitance measured when both EAD pads are attached. It is important to remark that such a value is highly repeatable when the same object is grasped, but it is highly variable when objects made of different materials are grasped. This means that this sensing strategy is effective when grasping a previously known object. This can be a limitation for some applications, but this can be perfectly tolerable in industrial environments where objects to be handled are mostly known.
An additional feature is also demonstrated, i.e., the CSC system is also able to detect if an object slips out from the grip. Figure 10b and Video S2 show the case in which the object is intentionally forced to fall. Here, we employed the same strategy to grasp the object, with the difference that after it was elevated, we impacted it twice with a plastic tube. The first impact causes a transient slip and wobbling, seen on the capacitance time series as a small dip. The second impact was stronger and caused the object to detach completely and fall, therefore causing a drop in capacitance back to its nominal value in air.
In summary, the CSC can provide a complete awareness on the state of the prehension and can prompt the robot to abort execution or enter a safe mode in case the grasping fails. Even more than that, besides being able to detect full adhesion or no adhesion at all, we were able to detect intermediary states, i.e., when a failure has occurred and one or both pads are not attached completely. If the material and the shape of the object are known in advance, the CSC could indicate faults.
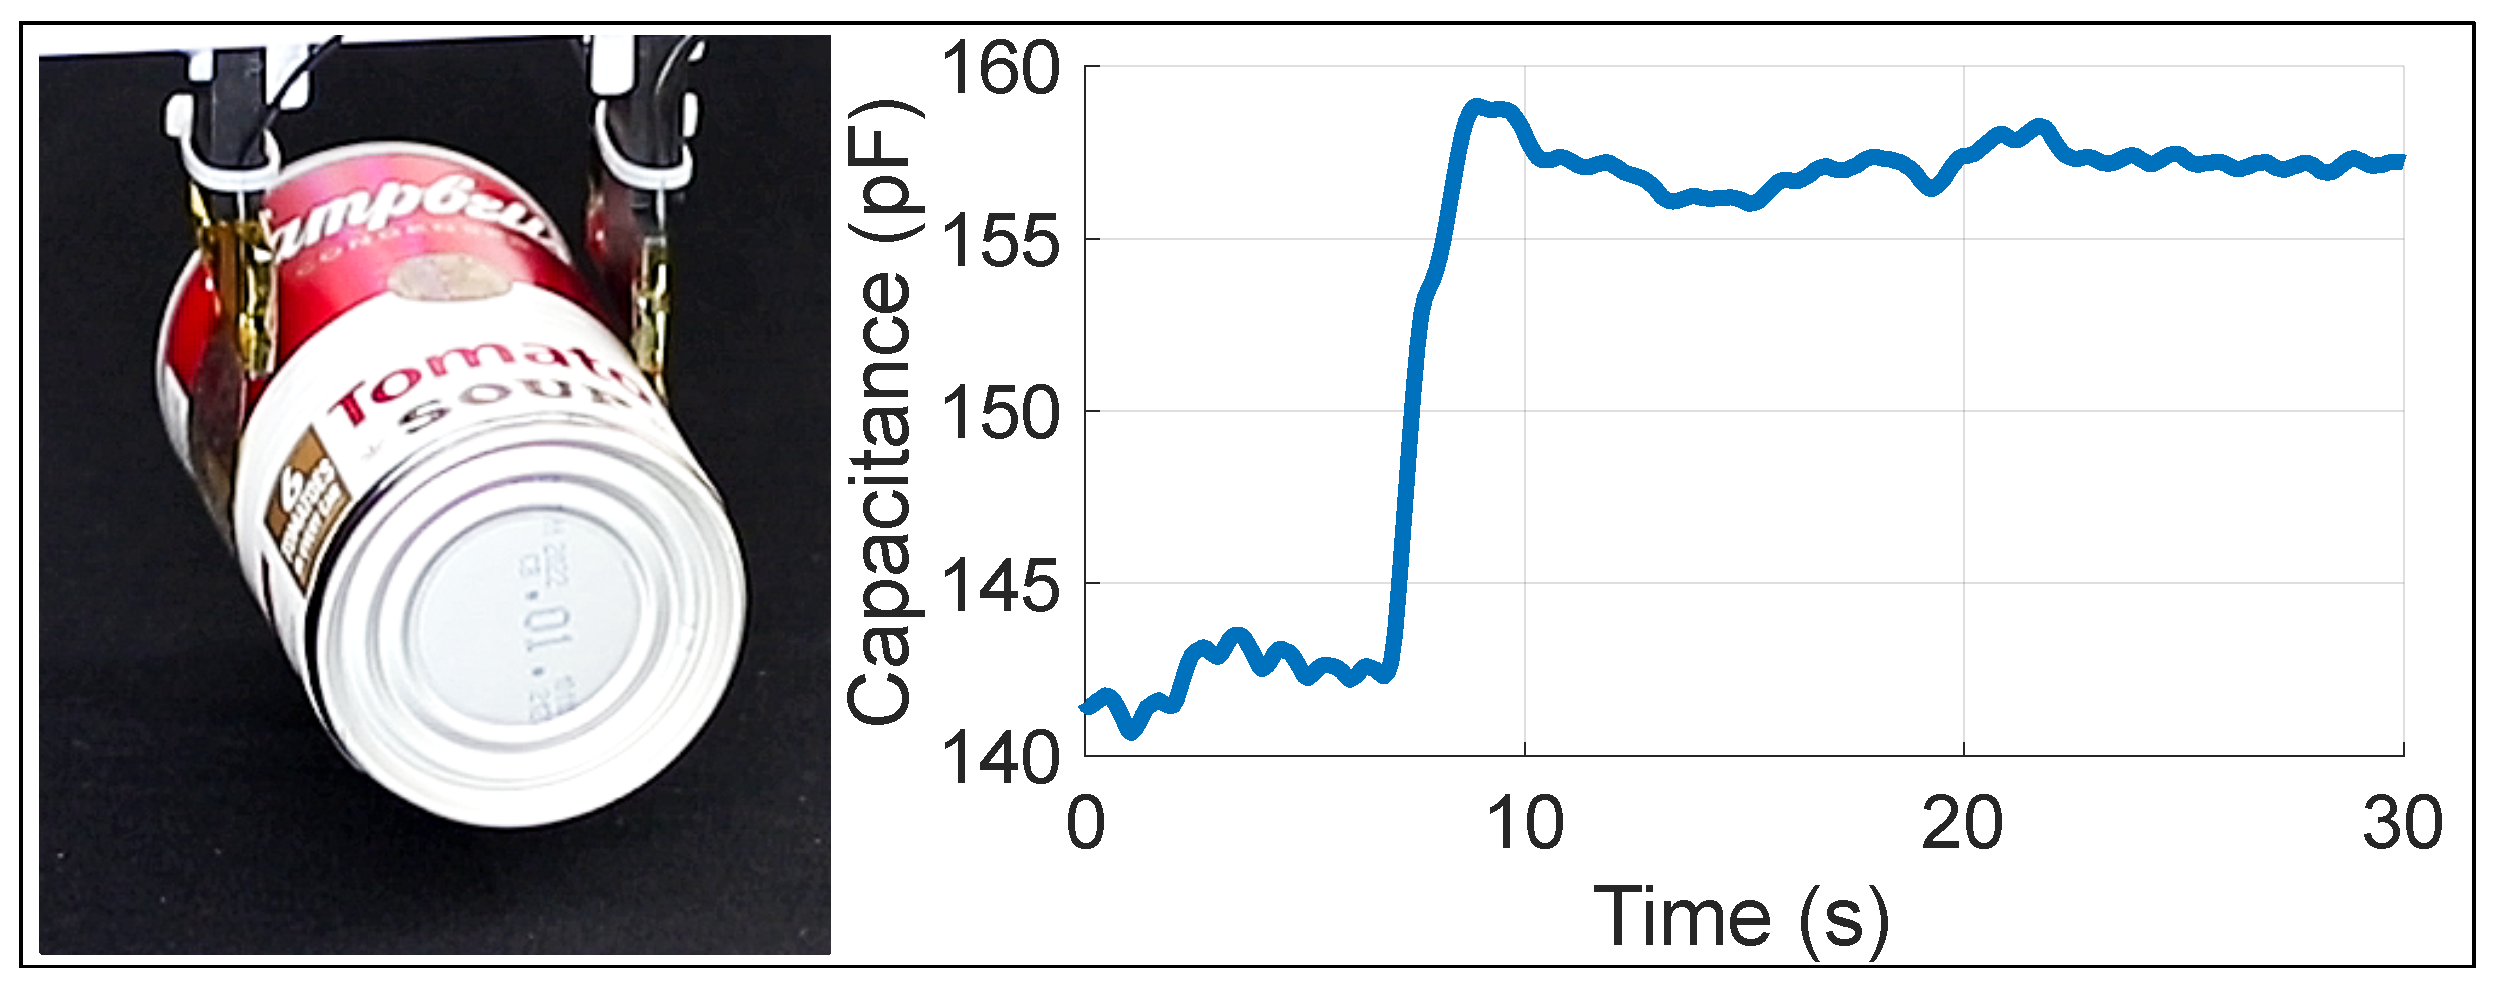
Thanks to the compliance of the electroadhesive pads [3,4], objects with curved or irregular surfaces can be grasped as well. We employed our sensing strategy to monitor the capacitance during the prehension of the cylindrical can (see Figure 11 and Video S3 with the same robotic arm and methodology. The steel can is covered by a thick label made of laminated paper; therefore, the variation in capacitance during the prehension of this object is related to the label material. The achieved outcome was successful adhesion, capacitance feedback and manipulation.

5. Discussion

In this work, a capacitance sensing technique that can be used in high voltage circuits was developed and implemented with the purpose of real-time estimation of the adhesion state in electroadhesive devices (EAD). A low-complexity electronic circuit made of off-the-shelf commercial components was built and integrated in several applications. The circuit works by injecting a low amplitude sinusoidal voltage signal into the EAD and measuring the current through it. The measurement part of the circuit is decoupled from the biasing high voltage using high voltage capacitors. Thus, one of the strong points of the technique is that it does not require any temporary interruption of the high voltage during measurement. Furthermore, there are no superpositioned signals with high frequency components fed to the the HVA; therefore it can be a low-bandwith and low-power amplifier. In other applications, such as the EAP actuation systems [14,16], usually the HVA must be capable of providing modulated voltage signals for a dynamic control of the actuators; therefore complex HVA able to deliver sinusoidal or other modulated signals are unavoidable. In such cases, the impact of our measurement circuit is not different from other proposed solutions for EAD [27,28]. However, applications, such as electroadhesion, generally require a simpler on–off control, to attach or detach the gripper often based on a priori known conditions. The driving circuit can be a low-cost HV power supply able to provide only DC signals. In such cases, the system we present can make a difference in terms of the complexity and overall cost of the system. The circuit is adjustable to any capacitance range and precision, and can be used in a wide-range of electroactive polymer transducers and EAD for real-time self-sensing.
The capacitance of several small (9.6 cm2 active area), flexible EAD pads with interdigitated electrodes was estimated both in air and during adhesion to different objects using the aforementioned capacitance sensing circuit (CSC). These substrates are paper, polyimide films of different resistivities, an aluminum plate, and three packaging items of various shapes. The highest capacitance variation (relative to the capacitance of the EADs in air) was detected when contacting the aluminum plate (∼194 pF), whereas the insulating materials showed a variation of under 10 pF. By providing the ability to estimate the capacitance while high voltage is active, the CSC allowed building dependencies of the state of adhesion on the applied voltage, material electrical properties, and surface shape. Two EAD pads were mounted on a robotic arm that performed manipulation tasks based on the received capacitance feedback. If the pads were attached to the object to be manipulated, the capacitance increased. When full adhesion was achieved (thus capacitance has reached a high level), the robot could initiate picking up the object. Other events, such as the object slipping, partial or complete detachment could also be detected. Here, the CSC was successfully employed in a closed-loop system and provided feedback on the state of adhesion to the robot controller without the use of other sensors.

Supplementary Materials

The following supporting information can be downloaded at: https://www.mdpi.com/article/10.3390/act11100283/s1, Video S1: A video ion-showing the the EAD grasping a cardboard box with synchronous measure of the capacitance Grasping-Box, accessed on 28 September 2022; Video S2: A video showing the EAD grasping a cylindrical can with synchronous measure of the capacitance Grasping-Can, accessed on 28 September 2022; Video S3: A video showing the EAD grasping a cardboard box that is intentionally forced to fall, with synchronous measure of the capacitance Detecting-Fall, accessed on 28 September 2022.

Author Contributions

Conceptualization, M.F. and R.V.; methodology, L.P.; software, S.D. and I.-D.S.; validation, P.T. and L.P; formal analysis, L.P.; investigation, I.-D.S., M.B., F.D. and S.D.; resources, M.F., R.V and L.A.; data curation, I.-D.S., M.B. and L.A.; writing—original draft preparation, I.-D.S. and S.D.; writing—review and editing, M.F. and R.V.; visualization, M.F. and L.P.; supervision, M.F. and P.T.; project administration, M.F.; funding acquisition, M.F. All authors have read and agreed to the published version of the manuscript.

Funding

This work was supported in part by the Department of Excellence program of the Dep. of Industrial Engineering of University of Trento and of the Institute of Mechanical Intelligence of Scuola Superiore Sant’Anna.

Data Availability Statement

Not applicable.

Conflicts of Interest

The authors declare no conflict of interest. The funders had no role in the design of the study; in the collection, analyses, or interpretation of data; in the writing of the manuscript; or in the decision to publish the results.

Abbreviations

The following abbreviations are used in this manuscript:
MDPIMultidisciplinary Digital Publishing Institute
EADElectroadhesive devices
DEADielectric elastomer actuators
CSCCapacitive sensing circuit
DDSDirect digital synthesis
DAQData acquisition
PIPolyimide
ROSRobotic operating system
PCAPrincipal component analysis
KLTKarhunen–Loève transform
HDPEHigh-density polyethylene

References

  1. Rajagopalan, P.; Muthu, M.; Liu, Y.; Luo, J.; Wang, X.; Wan, C. Advancement of Electroadhesion Technology for Intelligent and Self-Reliant Robotic Applications. Adv. Intell. Syst. 2022, 4, 2200064. [Google Scholar] [CrossRef]
  2. Guo, J.; Leng, J.; Rossiter, J. Electroadhesion technologies for robotics: A comprehensive review. IEEE Trans. Robot. 2019, 36, 313–327. [Google Scholar] [CrossRef]
  3. Berdozzi, N.; Chen, Y.; Luzi, L.; Fontana, M.; Fassi, I.; Tosatti, L.M.; Vertechy, R. Rapid fabrication of electro-adhesive devices with inkjet printed electrodes. IEEE Robot. Autom. Lett. 2020, 5, 2770–2776. [Google Scholar] [CrossRef]
  4. Shintake, J.; Cacucciolo, V.; Floreano, D.; Shea, H. Soft robotic grippers. Adv. Mater. 2018, 30, 1707035. [Google Scholar] [CrossRef] [PubMed] [Green Version]
  5. Guo, J.; Bamber, T.; Singh, J.; Manby, D.; Bingham, P.A.; Justham, L.; Petzing, J.; Penders, J.; Jackson, M. Experimental study of a flexible and environmentally stable electroadhesive device. Appl. Phys. Lett. 2017, 111, 251603. [Google Scholar] [CrossRef] [Green Version]
  6. Diller, S.; Majidi, C.; Collins, S.H. A lightweight, low-power electroadhesive clutch and spring for exoskeleton actuation. In Proceedings of the 2016 IEEE International Conference on Robotics and Automation (ICRA), Stockholm, Sweden, 16–21 May 2016; pp. 682–689. [Google Scholar]
  7. Ramachandran, V.; Shintake, J.; Floreano, D. All-Fabric Wearable Electroadhesive Clutch. Adv. Mater. Technol. 2019, 4, 1800313. [Google Scholar] [CrossRef]
  8. Hinchet, R.; Shea, H. High force density textile electrostatic clutch. Adv. Mater. Technol. 2020, 5, 1900895. [Google Scholar] [CrossRef]
  9. Guo, J.; Xiang, C.; Conn, A.; Rossiter, J. All-soft skin-like structures for robotic locomotion and transportation. Soft Robot. 2020, 7, 309–320. [Google Scholar] [CrossRef]
  10. Prahlad, H.; Pelrine, R.; Stanford, S.; Marlow, J.; Kornbluh, R. Electroadhesive robots—Wall climbing robots enabled by a novel, robust, and electrically controllable adhesion technology. In Proceedings of the 2008 IEEE International Conference on Robotics and Automation, Pasadena, CA, USA, 19–23 May 2008; pp. 3028–3033. [Google Scholar]
  11. Gu, G.; Zou, J.; Zhao, R.; Zhao, X.; Zhu, X. Soft wall-climbing robots. Sci. Robot. 2018, 3, eaat2874. [Google Scholar] [CrossRef] [Green Version]
  12. Rus, D.; Tolley, M.T. Design, fabrication and control of soft robots. Nature 2015, 521, 467–475. [Google Scholar] [CrossRef]
  13. Bluett, S.; Helps, T.; Taghavi, M.; Rossiter, J. Self-Sensing Electro-Ribbon Actuators. IEEE Robot. Autom. Lett. 2020, 5, 3931–3936. [Google Scholar] [CrossRef]
  14. Keplinger, C.; Kaltenbrunner, M.; Arnold, N.; Bauer, S. Capacitive extensometry for transient strain analysis of dielectric elastomer actuators. Appl. Phys. Lett. 2008, 92, 192903. [Google Scholar] [CrossRef]
  15. Jung, K.; Kim, K.J.; Choi, H.R. A self-sensing dielectric elastomer actuator. Sens. Actuator A Phys. 2008, 143, 343–351. [Google Scholar] [CrossRef]
  16. Gisby, T.A.; O’Brien, B.M.; Anderson, I.A. Self sensing feedback for dielectric elastomer actuators. Appl. Phys. Lett. 2013, 102, 193703. [Google Scholar] [CrossRef]
  17. Rosset, S.; O’Brien, B.M.; Gisby, T.; Xu, D.; Shea, H.R.; Anderson, I.A. Self-sensing dielectric elastomer actuators in closed-loop operation. Smart Mater. Struct. 2013, 22, 104018. [Google Scholar] [CrossRef] [Green Version]
  18. Ye, Z.; Chen, Z. Self-sensing of dielectric elastomer actuator enhanced by artificial neural network. Smart Mater. Struct. 2017, 26, 095056. [Google Scholar] [CrossRef]
  19. Rizzello, G.; Naso, D.; York, A.; Seelecke, S. Self-sensing in dielectric electro-active polymer actuator using linear-in-parametes online estimation. In Proceedings of the 2015 IEEE International Conference on Mechatronics (ICM), Nagoya, Japan, 6–8 March 2015; pp. 300–306. [Google Scholar]
  20. Rizzello, G.; Naso, D.; York, A.; Seelecke, S. A self-sensing approach for dielectric elastomer actuators based on online estimation algorithms. IEEE/ASME Trans. Mechatron. 2016, 22, 728–738. [Google Scholar] [CrossRef]
  21. Rizzello, G.; Hodgins, M.; Seelecke, S.; Naso, D. Self-sensing at low sampling-to-signal frequency ratio: An improved algorithm for dielectric elastomer actuators. In Proceedings of the 2016 12th IEEE/ASME International Conference on Mechatronic and Embedded Systems and Applications (MESA), Auckland, New Zealand, 29–31 August 2016; pp. 1–6. [Google Scholar]
  22. Rizzello, G.; Ferrante, F.; Naso, D.; Seelecke, S. Robust interaction control of a dielectric elastomer actuator with variable stiffness. IEEE/ASME Trans. Mechatron. 2017, 22, 1705–1716. [Google Scholar] [CrossRef]
  23. Rizzello, G.; Fugaro, F.; Naso, D.; Seelecke, S. Simultaneous self-sensing of displacement and force for soft dielectric elastomer actuators. IEEE Robot. Autom. Lett. 2018, 3, 1230–1236. [Google Scholar] [CrossRef]
  24. Xiang, C.; Guo, J.; Rossiter, J. Soft-smart robotic end effectors with sensing, actuation, and gripping capabilities. Smart Mater. Struct. 2019, 28, 055034. [Google Scholar] [CrossRef]
  25. Saravia, W.; Udrea, B. Highly compliant active clinging mechanism. In Proceedings of the 2016 IEEE Aerospace Conference, Big Sky, MT, USA, 5–12 March 2015; pp. 1–9. [Google Scholar]
  26. Guo, J.; Elgeneidy, K.; Xiang, C.; Lohse, N.; Justham, L.; Rossiter, J. Soft pneumatic grippers embedded with stretchable electroadhesion. Smart Mater. Struct. 2018, 27, 055006. [Google Scholar] [CrossRef]
  27. Guo, J.; Xiang, C.; Rossiter, J. A soft and shape-adaptive electroadhesive composite gripper with proprioceptive and exteroceptive capabilities. Mater. Des. 2018, 156, 586–587. [Google Scholar] [CrossRef]
  28. Guo, J.; Xiang, C.; Zanini, P.; Rossiter, J. Magnetic augmented self-sensing flexible electroadhesive grippers. IEEE Robot. Autom. Lett. 2019, 4, 2364–2369. [Google Scholar] [CrossRef] [Green Version]
  29. Rizzello, G.; Hodgins, M.; Naso, D.; York, A.; Seelecke, S. Modeling of the effects of the electrical dynamics on the electromechanical response of a DEAP circular actuator with a mass–spring load. Smart Mater. Struct. 2015, 24, 094003. [Google Scholar] [CrossRef]
  30. Sîrbu, I.; Moretti, G.; Bortolotti, G.; Bolignari, M.; Diré, S.; Fambri, L.; Vertechy, R.; Fontana, M. Electrostatic bellow muscle actuators and energy harvesters that stack up. Sci. Robot. 2021, 6, eaaz5796. [Google Scholar] [CrossRef]
  31. Kellaris, N.; Gopaluni Venkata, V.; Smith, G.M.; Mitchell, S.K.; Keplinger, C. Peano-HASEL actuators: Muscle-mimetic, electrohydraulic transducers that linearly contract on activation. Sci. Robot. 2018, 3, eaar3276. [Google Scholar] [CrossRef] [Green Version]
  32. Monkman, G.J. An analysis of astrictive prehension. Int. J. Robot. Res. 1997, 16, 1–10. [Google Scholar] [CrossRef]
  33. D’Avella, S.; Fontana, M.; Vertechy, R.; Tripicchio, P. Towards autonomous soft grasping of deformable objects using flexible thin-film electro-adhesive gripper. In Proceedings of the 2022 IEEE 18th International Conference on Automation Science and Engineering, Mexico City, Mexico, 22–24 August 2022; pp. 1298–1303. [Google Scholar]
  34. Suzuki, S. Topological structural analysis of digitized binary images by border following. Comput. Vision Graph. Image Process. 1985, 30, 32–46. [Google Scholar] [CrossRef]
Figure 1. Equivalent circuit of the EAD.
Actuators 11 00283 g001
Figure 2. The capacitive sensing circuit.
Actuators 11 00283 g002
Figure 3. RMS circuit.
Actuators 11 00283 g003
Figure 4. A possible output voltage–capacitance characteristic of the circuit. The green markers represent the voltage output of the RMS circuit corresponding to the constant capacitors used for the calibration; the black dashed line is an exponential regression function; the red line represents circuit output as estimated by the model (1).
Actuators 11 00283 g004
Figure 5. The electroadhesive pads used in the experiments. (a) Top view of the pad with the interdigitated electrode structure. All dimensions are in millimeters. (b) Schematic of the pad.
Actuators 11 00283 g005
Figure 6. Electroadhesive pad voltage–capacitance characteristic with different substrate materials and suspended in air (no voltage applied). (a) V-C dependence of the pad in contact with a polished aluminum plate; (b) V-C dependence in contact with three films: a standard A4 recycled sheet of paper; a 25 μ m sheet of polyimide; and a 25 μ m sheet of polyimide loaded with carbon particles. (c) Voltage–capacitance (V-C) dependence of the pad in contact with three common packaging objects: a laminated rectangular cardboard box; a steel cylindrical can covered in a painted paper label; and a colored high-density polyethylene (HDPE) bottle, partially covered with a colored paper label.
Actuators 11 00283 g006
Figure 7. Adhesion feedback on an aluminum substrate. The pad was manually attached and detached to/from the substrate material, while the capacitance-based self-sensing feature provides online feedback on the contact state.
Actuators 11 00283 g007
Figure 8. Schematic describing the complete pipeline with the connections among the components.
Actuators 11 00283 g008
Figure 9. Graphical overview of the vision pipeline.
Actuators 11 00283 g009
Figure 10. Capacitance variation during manipulation of a cardboard box grasped by two electroadhesive pads mounted on a parallel gripper of a robotic arm. (a) Grasping. The upper part of the figure shows images of the steps performed by the robot, whereas the lower part plots the capacitance variation in time and the trigger that signals successful pad adhesion. The steps can be described as follows: 1. Both pads are distanced from the box, there is no contact established and the capacitance stays constant. 2. One of the pads establishes first contact and gradually adheres to the surface of the box, thus causing the first rise in capacitance. 3. The second pad establishes contact and gradually adheres to the surface of the box, thus causing the second increase in capacitance. An imposed capacitance threshold of sufficient adhesion is surpassed, which causes a trigger to be sent to the robot. The robot stops the gripper and starts pulling the object up. 4. The object is being pulled up, there are no prominent capacitance variations. (b) Induced falling. The upper part shows images of the box being hit twice, first time (upper left) causing only slipping and wobbling, second time (upper right) causing the box to completely detach and fall. The lower part shows the corresponding capacitance variation.
Actuators 11 00283 g010
Figure 11. Capacitance variation during the adhesion of the pads onto a curved surface of a metallic can. (left) Photo of the pads “clinching” the can; (right) plot showing the variation of the capacitance during grasping. The small capacitance dip between 9 and 20 s is given by the pads adjusting to the weight and the inertia of the object when the latter is being manipulated. This is followed by a constant capacitance interval (after 20 s) when the object is being kept hanging still.
Actuators 11 00283 g011
Publisher’s Note: MDPI stays neutral with regard to jurisdictional claims in published maps and institutional affiliations.