Article

Model-Based Design Optimization of Soft Polymeric Domes Used as Nonlinear Biasing Systems for Dielectric Elastomer Actuators

1
Department of Systems Engineering, Department of Materials Science and Engineering, Saarland University, 66123 Saarbrücken, Germany
2
Department of Sensors and Thin Films, University of Applied Sciences of Saarland, Goebenstraße 40, 66117 Saarbrücken, Germany
3
Center for Mechatronics and Automation Technologies (ZeMA) gGmbH, 66121 Saarbrücken, Germany
*
Author to whom correspondence should be addressed.
Actuators 2021, 10(9), 209; https://doi.org/10.3390/act10090209
Submission received: 30 June 2021 / Revised: 29 July 2021 / Accepted: 23 August 2021 / Published: 27 August 2021
(This article belongs to the Special Issue Cooperative Microactuator Systems)

Abstract

:
Due to their unique combination of features such as large deformation, high compliance, lightweight, energy efficiency, and scalability, dielectric elastomer (DE) transducers appear as highly promising for many application fields, such as soft robotics, wearables, as well as micro electro-mechanical systems (MEMS). To generate a stroke, a membrane DE actuator (DEA) must be coupled with a mechanical biasing system. It is well known that nonlinear elements, such as negative-rate biasing springs (NBS), permit a remarkable increase in the DEA stroke in comparison to standard linear springs. Common types of NBS, however, are generally manufactured with rigid components (e.g., steel beams, permanent magnets), thus they appear as unsuitable for the development of compliant actuators for soft robots and wearables. At the same time, rigid NBSs are hard to miniaturize and integrate in DE-based MEMS devices. This work presents a novel type of soft DEA system, in which a large stroke is obtained by using a fully polymeric dome as the NBS element. More specifically, in this paper we propose a model-based design procedure for high-performance DEAs, in which the stroke is maximized by properly optimizing the geometry of the biasing dome. First, a finite element model of the biasing system is introduced, describing how the geometric parameters of the dome affect its mechanical response. After conducting experimental calibration and validation, the model is used to develop a numerical design algorithm which finds the optimal dome geometry for a given DE membrane characteristics. Based on the optimized dome design, a soft DEA prototype is finally assembled and experimentally tested.

1. Introduction

In recent years, dielectric elastomer (DE) transducers have attracted the interest of several researchers due to their unique mix of features [1]. A DE is composed by a thin polymer membrane of acrylics or silicone material [2,3] covered in a sandwich configuration by two compliant electrodes. The application of a high voltage to the electrodes (generally within the range 1–10 kV for a polymeric membrane with thicknesses of 10–100 µm [4]) results in a change in shape, i.e., a reduction of the membrane thickness followed by a subsequent expansion in area due to the incompressibility of the elastomer. Perline et al. explained in [5] that this actuation mechanism is due to a combination of attracting forces between charges of opposite signs on the two electrodes, which lead them closer towards each other, and repulsive forces between charges of the same sign on each electrode, which cause the surface to expand. The combined effect of those forces is usually referred to as Maxwell stress, and represents the main operating principle of DE actuators (DEAs) [6]. Another important feature that makes DEAs particularly attractive is the self-sensing, i.e., the possibility of estimating the DEA deflection during electrical actuation by measuring the membrane electrical capacitance [7,8]. These unique features, combined with other advantages such as large deformations (above 100%) [1], high energy efficiency [9], low cost, and lightweight, make DE transducers attractive for a wide range of application fields, e.g., valves [10], pumps [11,12], loudspeakers [13,14], Braille displays [15], artificial muscles [16,17], and medical systems [18,19]. More recently, the use of DE technology has also been investigated in less conventional application fields such as wearables [20,21] and soft robotics [22], as well as cooperative micro electro-mechanical systems (MEMS) [23]. In these specific cases, compliance and scalability of DE material represent key features for the development of successful applications. As a particular example, soft robotics arises from the need to replace conventional rigid robots with compliant and deformable bio-inspired materials. Soft robots can be integrated more easily in social activities and unstructured environments, while ensuring at the same time a safer interaction with humans [24]. The high flexibility, compliance, and lightweight requirements of these systems can be naturally met by DE transducers, which appear then as ideal candidates for the realization of soft actuators and sensors for soft robots. Some examples of DE-based soft robots prototypes presented in recent literature include bioinspired crawling robots [25], miniature underwater vehicles [26], soft tentacle arms [27], and translucent swimming robots [28].
In all those types of systems, the actuation is made possible by the softening effect that a DE membrane undergoes upon electrical activation, which results in a stroke from the undeformed to the deformed configuration. In particular, the amount of stroke that a DEA undergoes is determined by the type of biasing system which is coupled to the membrane. A comparison between different types of bias elements has been presented by Hodgins et al. in [29,30]. In these works, it is shown that coupling the DE membrane with a negative-rate biasing spring (NBS), designed in such a way its force–displacement curve properly matches the mechanical characteristics of the DE, allowing the achievement of a significantly larger stroke compared to the one obtained with conventional biasing masses and linear springs. A mechanical system exhibiting the features of a NBS can be manufactured in several possible ways (cf. Figure 1), i.e., as a pre-compressed steel cross [31,32], a pre-compressed buckled beam [33], a pair of attracting permanent magnets [34], or via more complex types of mechanisms [35]. Even though currently available NBS elements allow remarkable improvement of the stroke performance of the overall DEA system, they are all fabricated based on rigid materials (e.g., steel) and components (e.g., clamping elements, connectors). Consequently, the resulting actuators end up losing all the flexibility and high compliance advantages of DE technology and, in turn, become unsuitable for application fields such as soft robotics and wearables. In addition, rigid biasing elements turn out to be hard to miniaturize, thus preventing the integration of DE transducers within MEMS technologies. The impossibility of using currently available types of NBS in those application fields unavoidably restricts the high potential of DE technology. To overcome this limitation, innovative NBS elements need to be developed such that, when coupled with a DE membrane, provide large strokes without affecting the compliance and flexibility of the overall actuator system. In addition to that, it would be desirable to understand how to properly optimize the design of such biasing systems (e.g., in terms of geometry) to adapt them to a given DE membrane, in order to maximize the stroke performance of the resulting actuator.
Three-dimensional polymeric domes represent a possible way to overcome the above issue. When properly designed, those domes present the characteristics of a NBS, while keeping an overall compliant and flexible structure. Therefore, they appear as highly suitable to develop soft and large-stroke DEA systems. Although the feasibility and characteristics of those types of domes have been previously proven by Madhukar et al. [36] and Alturki and Burgueño [37], their use as a biasing elements for DE membranes has been proposed only recently [38]. In particular, in [38] we performed a systematic characterization of a dome-like NBS, and used it to develop the first prototype of actuator concept which showcases the feasibility of the design. To properly optimize the stroke of such kind of DEAs, the dome must be designed so that its negative-rate (i.e., stiffness) region matches the positive stiffness of the DEA. If the relationship between the free design parameters of the dome (i.e., its geometry) and the shape of its mechanical characteristics is properly understood, it can be exploited to properly optimize a dome design for a given DE membrane, thus allowing full exploitation of the true potential of compliant DEA systems.
In this paper, we propose a novel approach that allows optimization of the design of the polymeric dome NBS for DEAs. The method relies on a finite element (FE) model of the dome, which allows an accurate description of the relationship between its geometry and the resulting mechanical response. FE tools are selected, as they represent a powerful means to simulate complex structures, to improve their weaknesses, and to understand their behavior in response to different external loading conditions [39,40]. After presenting the model, its experimental calibration and validation are performed, based on a number of pre-defined dome geometries. Then, the model-based design algorithm is discussed, and an example of its application is presented based on a real-life case study. After the ideal geometry of the dome is determined, the optimized DEA prototype is fabricated, assembled, and experimentally characterized. We also remark that this work represents an extended and refined version of the preliminary results presented in [41], by including a detailed discussion of the FE approach with a wider validation range, a different and more effective performance optimization approach, as well as an experimental validation based on an assembled real-life prototype. The obtained results will allow, in a future stage of our research, the development of cooperative arrays of micro-scale actuator arrays composed of layers of novel DEs and polymeric dome NBSs. Each micro-actuator will reach large stroke (due to the novel bias system) and high flexibility without losing conductivity, due to the novel sub-micron metal and carbon thin film electrodes presented by Hubertus et al. [42]. The use of such DEA arrays in wearable smart skins and loudspeakers, haptic gloves, and microconveyors will open a new generation of flexible and compliant, cooperative, and polymer-based micro-actuator devices.
The remainder of this paper is organized as follows. Section 2 presents the operating principle of DEs, and briefly discusses the NBS dome concept. In Section 3, an FE model for the novel biasing dome is presented. Experimental validation of the dome model is discussed in Section 4, while Section 5 illustrates the model-based design algorithm together with its application to develop a functioning DEA prototype. Finally, Section 6 presents concluding remarks and future research directions.

2. DEA Operating Principle

The operating principle of DEAs, as well as the role of the biasing system in determining their performance, are discussed in this section.

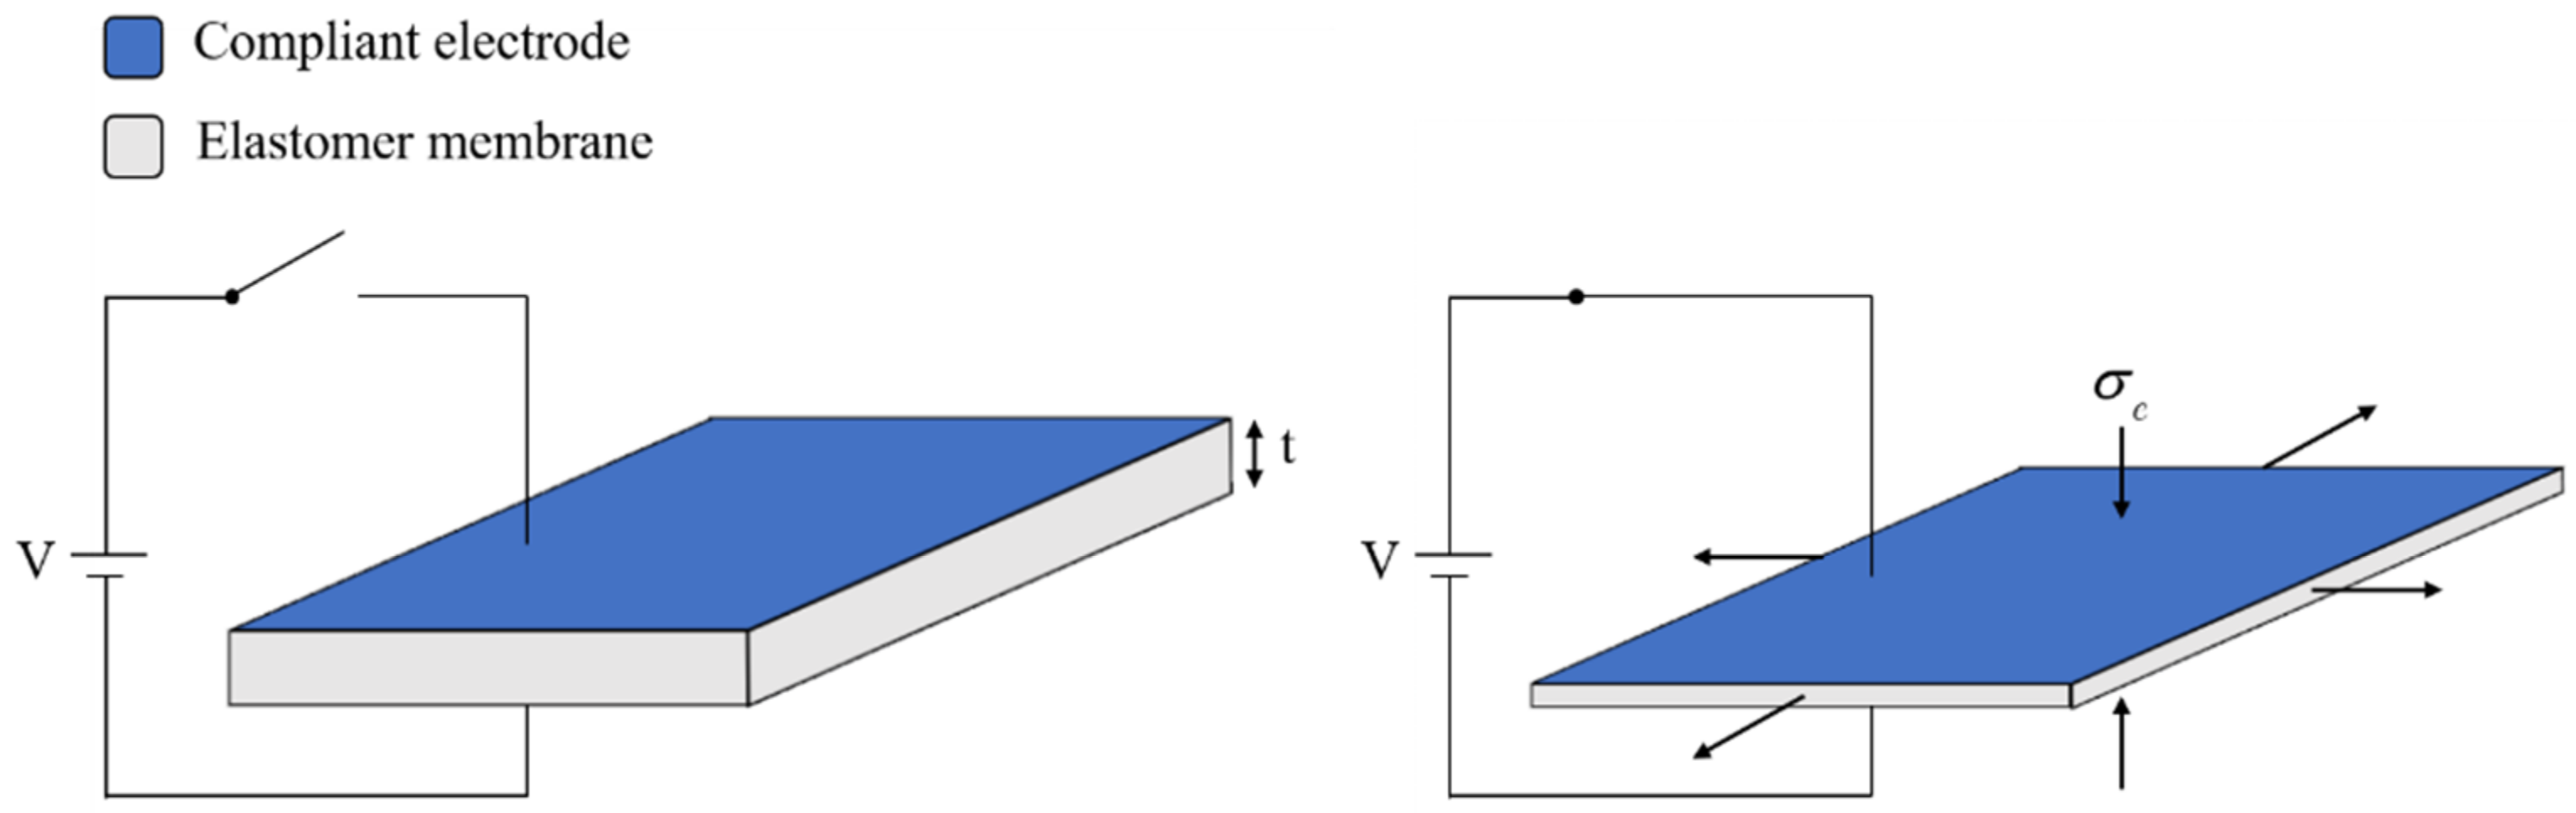
2.1. DEA Operating Principle

As explained above, a DE consists of a dielectric elastomer film sandwiched between two soft electrodes, forming a flexible capacitor. Its principle of operation is based on the shape change undergone due to the electric field applied through the dielectric. Specifically, when a high voltage is applied to the electrodes, a compressive Maxwell stress σe is generated, quantified as follows:
σ e = ϵ r ϵ 0 V t 2 ,
where
  • ϵ0 is the vacuum permittivity;
  • ϵr is the DE relative permittivity;
  • V is the applied voltage;
  • t is the thickness of the dielectric film.
The stress defined by (1) squeezes the dielectric film between the electrodes, resulting in area expansion due to incompressibility of the elastomer (Figure 2).
For the manufacturing of both polymer film and electrodes, several methods and materials are available [43,44]. Silicone and acrylics represent the most typical choices for the elastomer membrane [2,3], while the electrodes are commonly based on carbon black [45]. More recently, a novel type of electrodes has been proposed by Hubertus et al. [42], consisting of thin metal sheets sputtered onto an initially pre-stretched silicone film. The main advantages of this electrode are represented by the negligible impact on the DE stiffness (due to its thickness of only 10 nm), and by the ability of maintaining a high conductivity while being stretched, thus furthering both energy efficiency and speed of the resulting actuator.

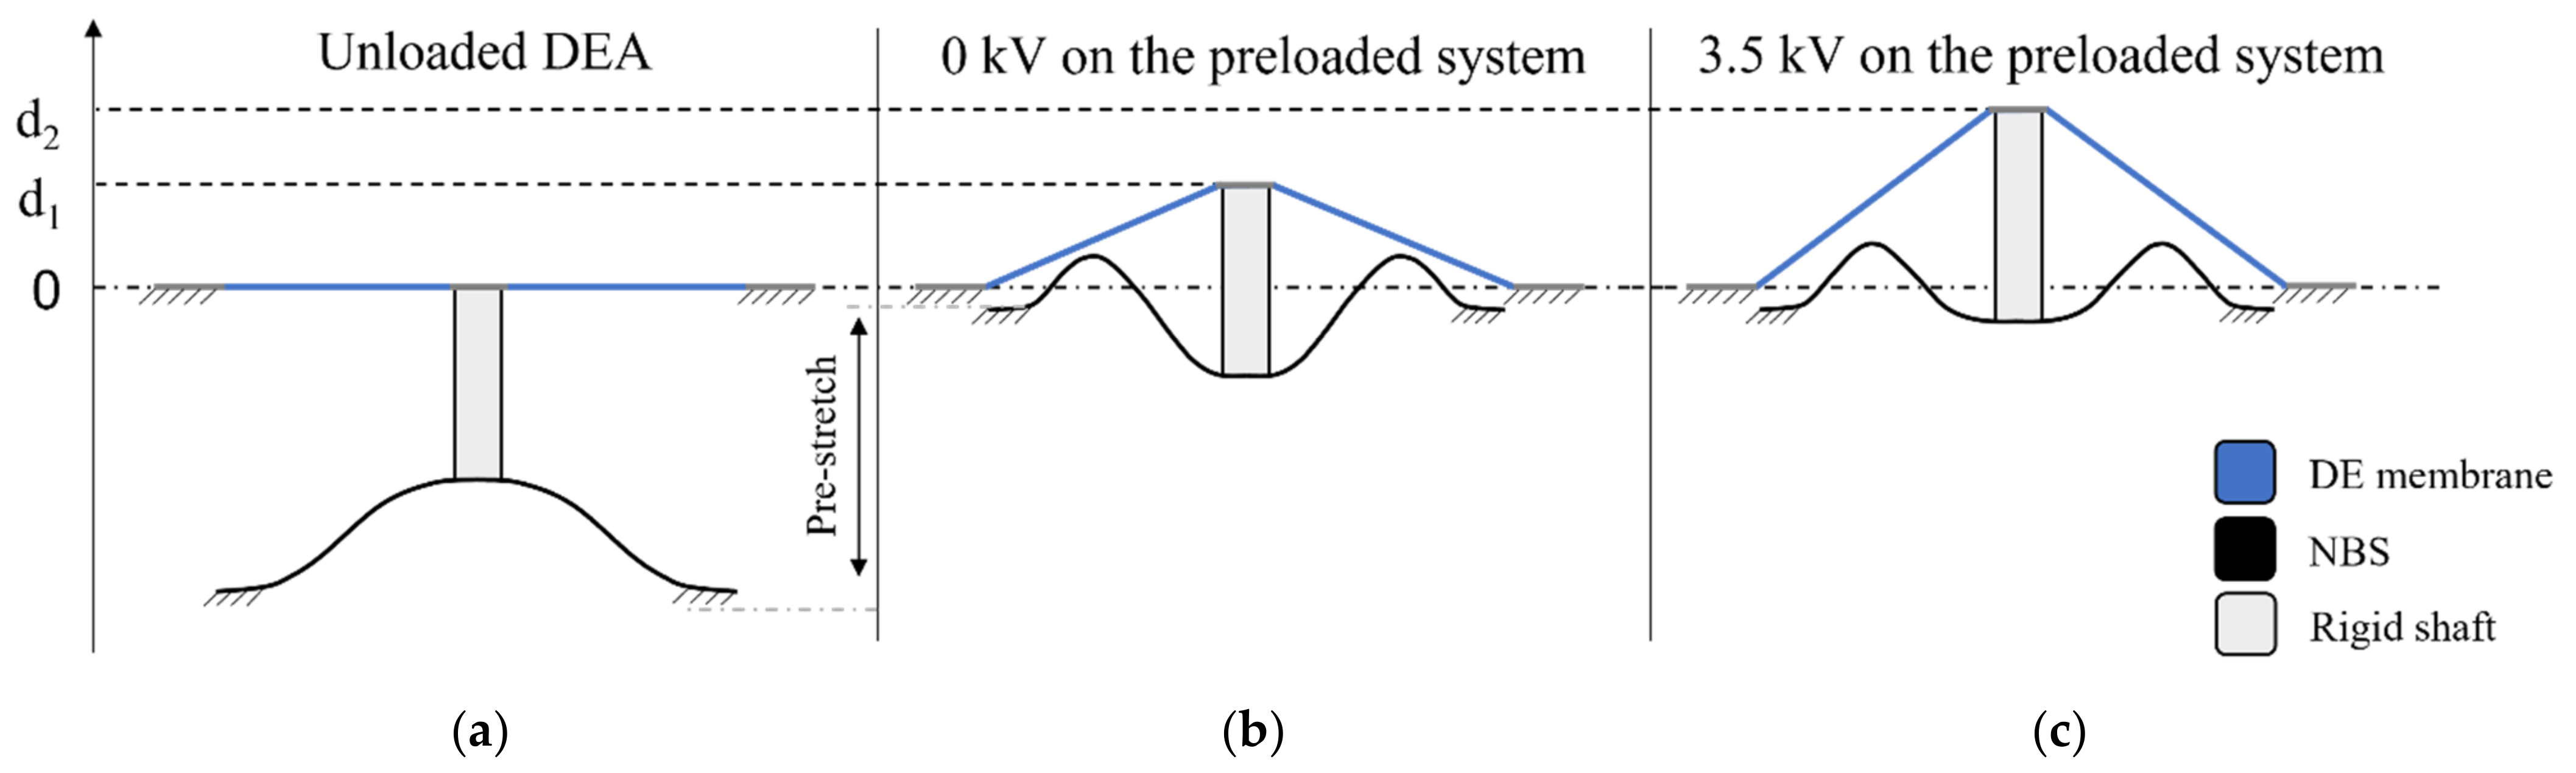
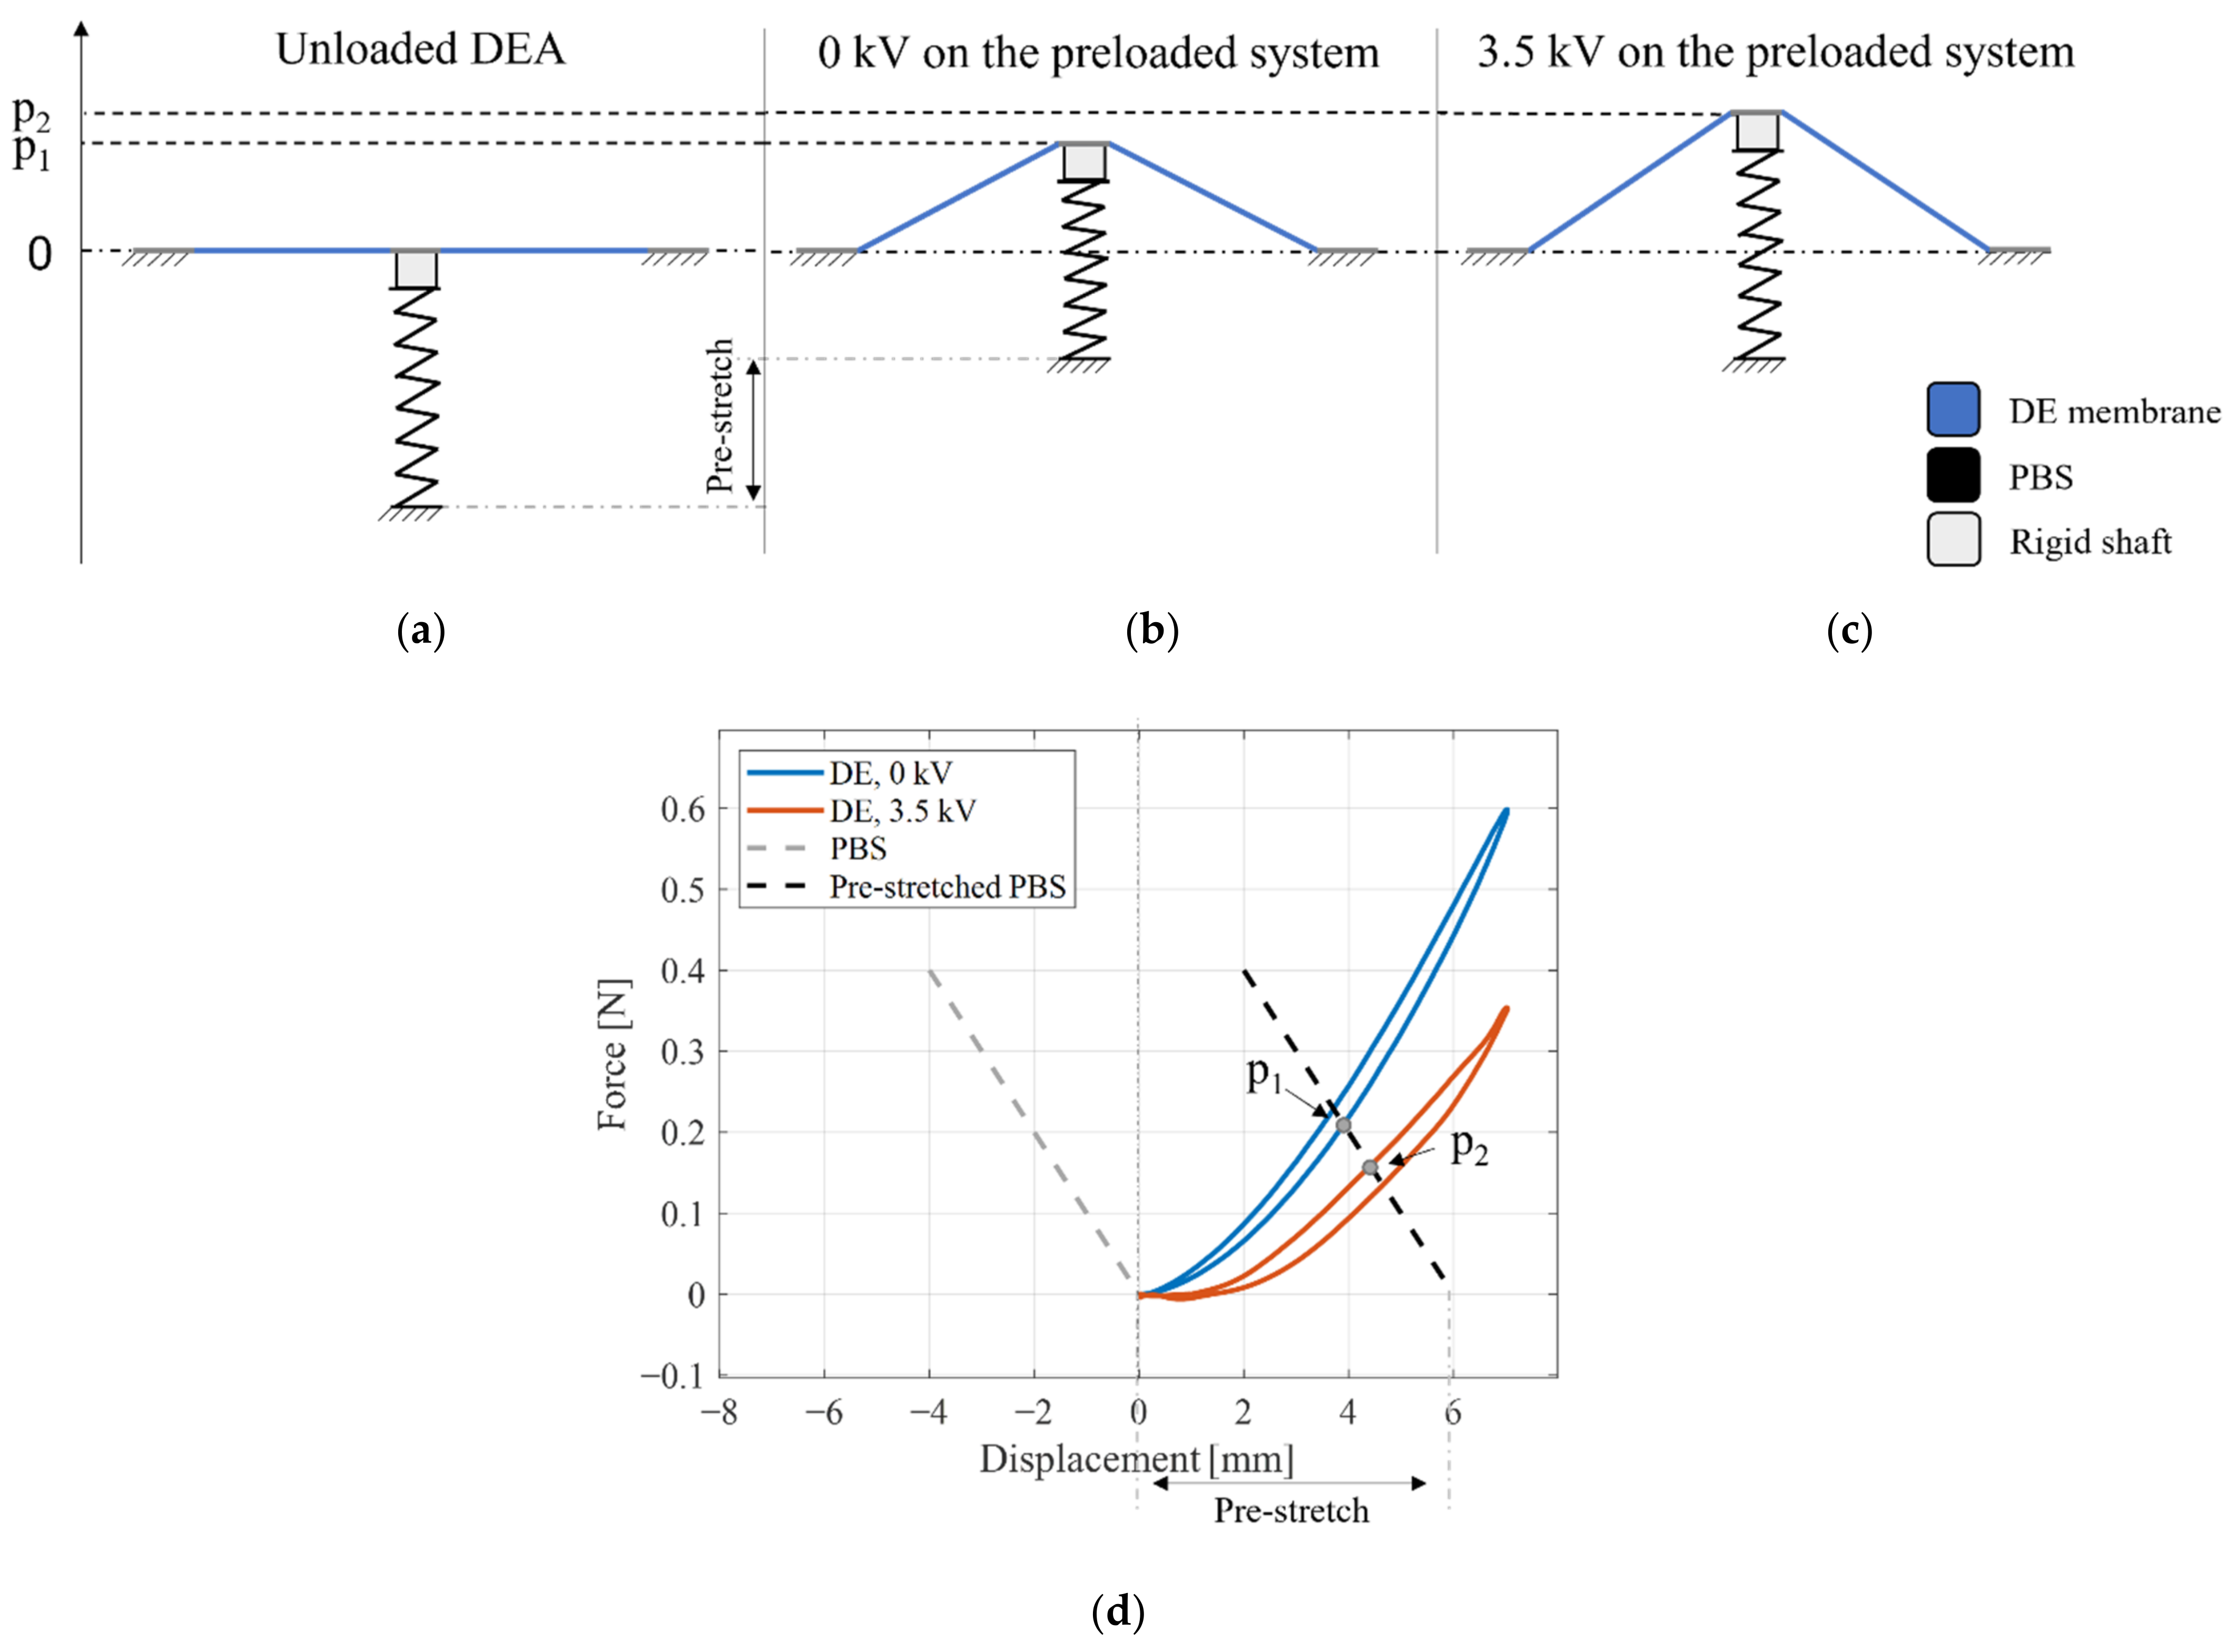
2.2. Bias Elements for DEAs

DEAs allow transformation of electrical inputs into motion by exploiting the Maxwell stress principle discussed in Section 2.1 (cf. (1)). In order to generate a stroke, a membrane DEA must be coupled with a biasing element, such as a mass or a pre-tensioned spring. When the DEA is electrically activated, the resulting Maxwell stress induces an equivalent in-plane softening within the membrane. This causes the biasing system to further pull the DE membrane until a new equilibrium state is achieved, thus resulting into a stroke. The biasing mechanism plays a crucial role for the determination of the system stroke, so its design represents a critical aspect for the performance of a DEA.
In this work we will focus on a specific DEA geometry, namely the circular out-of-plane DEA (COP-DEA) depicted in Figure 3, in both the undeformed (a) and the deformed out-of-plane (b) configurations. The actuators is based on a silicone DE membranes (Elastosil 2030 by Wacker Chemie [46]), with thickness of 50 μm and inner radius equals to 10 mm, in combination with the sputtered metallic electrodes mentioned in Section 2.1. The biasing element is connected to the passive center part of the DE membrane. When a voltage is applied, the center passive part is pushed upwards, thus generating an out-of-plane stroke.
To better clarify the importance of the biasing mechanism, as well as to understand how to quantify the stroke, Figure 4 and Figure 5 show a cross-sectional view of the entire DEA, consisting of a COP-DEA (depicted in blue). The actuator in Figure 4 is coupled with a positive-rate biasing spring (PBS), while the one in Figure 5 is pre-loaded with an NBS (both depicted in black). To compare the strokes obtained with the two types of mechanisms, one shall consider the force–displacement characteristic curves describing the operating range of the system, sketched in the lower parts of Figure 4 and Figure 5. In particular, the blue and red continuous lines show the behavior of the DE without and with the high voltage applied. Note how the electrical activation results in an overall softening of the elastomer membrane. The dashed curves, instead, represents the qualitative behavior of the corresponding biasing element. Note that the spring rate of the PBS appears as negative in Figure 4, while the NBS curve shows a region of quasi-linear and positive stiffness in Figure 5. This apparent change in sign of the expected slope is due to the fact that we are plotting the bias force with respect to the DE membrane displacement. Note also that, by changing the pre-stretch of the biasing element (with respect to the DE), it is possible to shift the corresponding characteristic curve along the x-axis. Notably, the gray curve represents the PBS (cf. Figure 4) and NBS (cf. Figure 5) when the DE membrane is in the undeformed configuration (cf. Figure 4a and Figure 5a), while the black ones describe the biasing elements after that the DE membrane has been preloaded out-of-plane (cf. Figure 4b and Figure 5)). By using a simple force equilibrium argument, it can be concluded that the intersection points between the force–displacement characteristics of the DE and the biasing mechanism determine the equilibrium states the actuator. Note that the equilibrium state explicitly depends on the applied voltage. Therefore, the horizontal distance between low and high voltage equilibrium points defines the DEA stroke. The equilibrium points reached by the whole system before and after electrical activation are called p1, p2 for the PBS and d1, d2 for the NBS, respectively. By comparing those two cases, the performance gain achieved with the NBS can readily be observed.

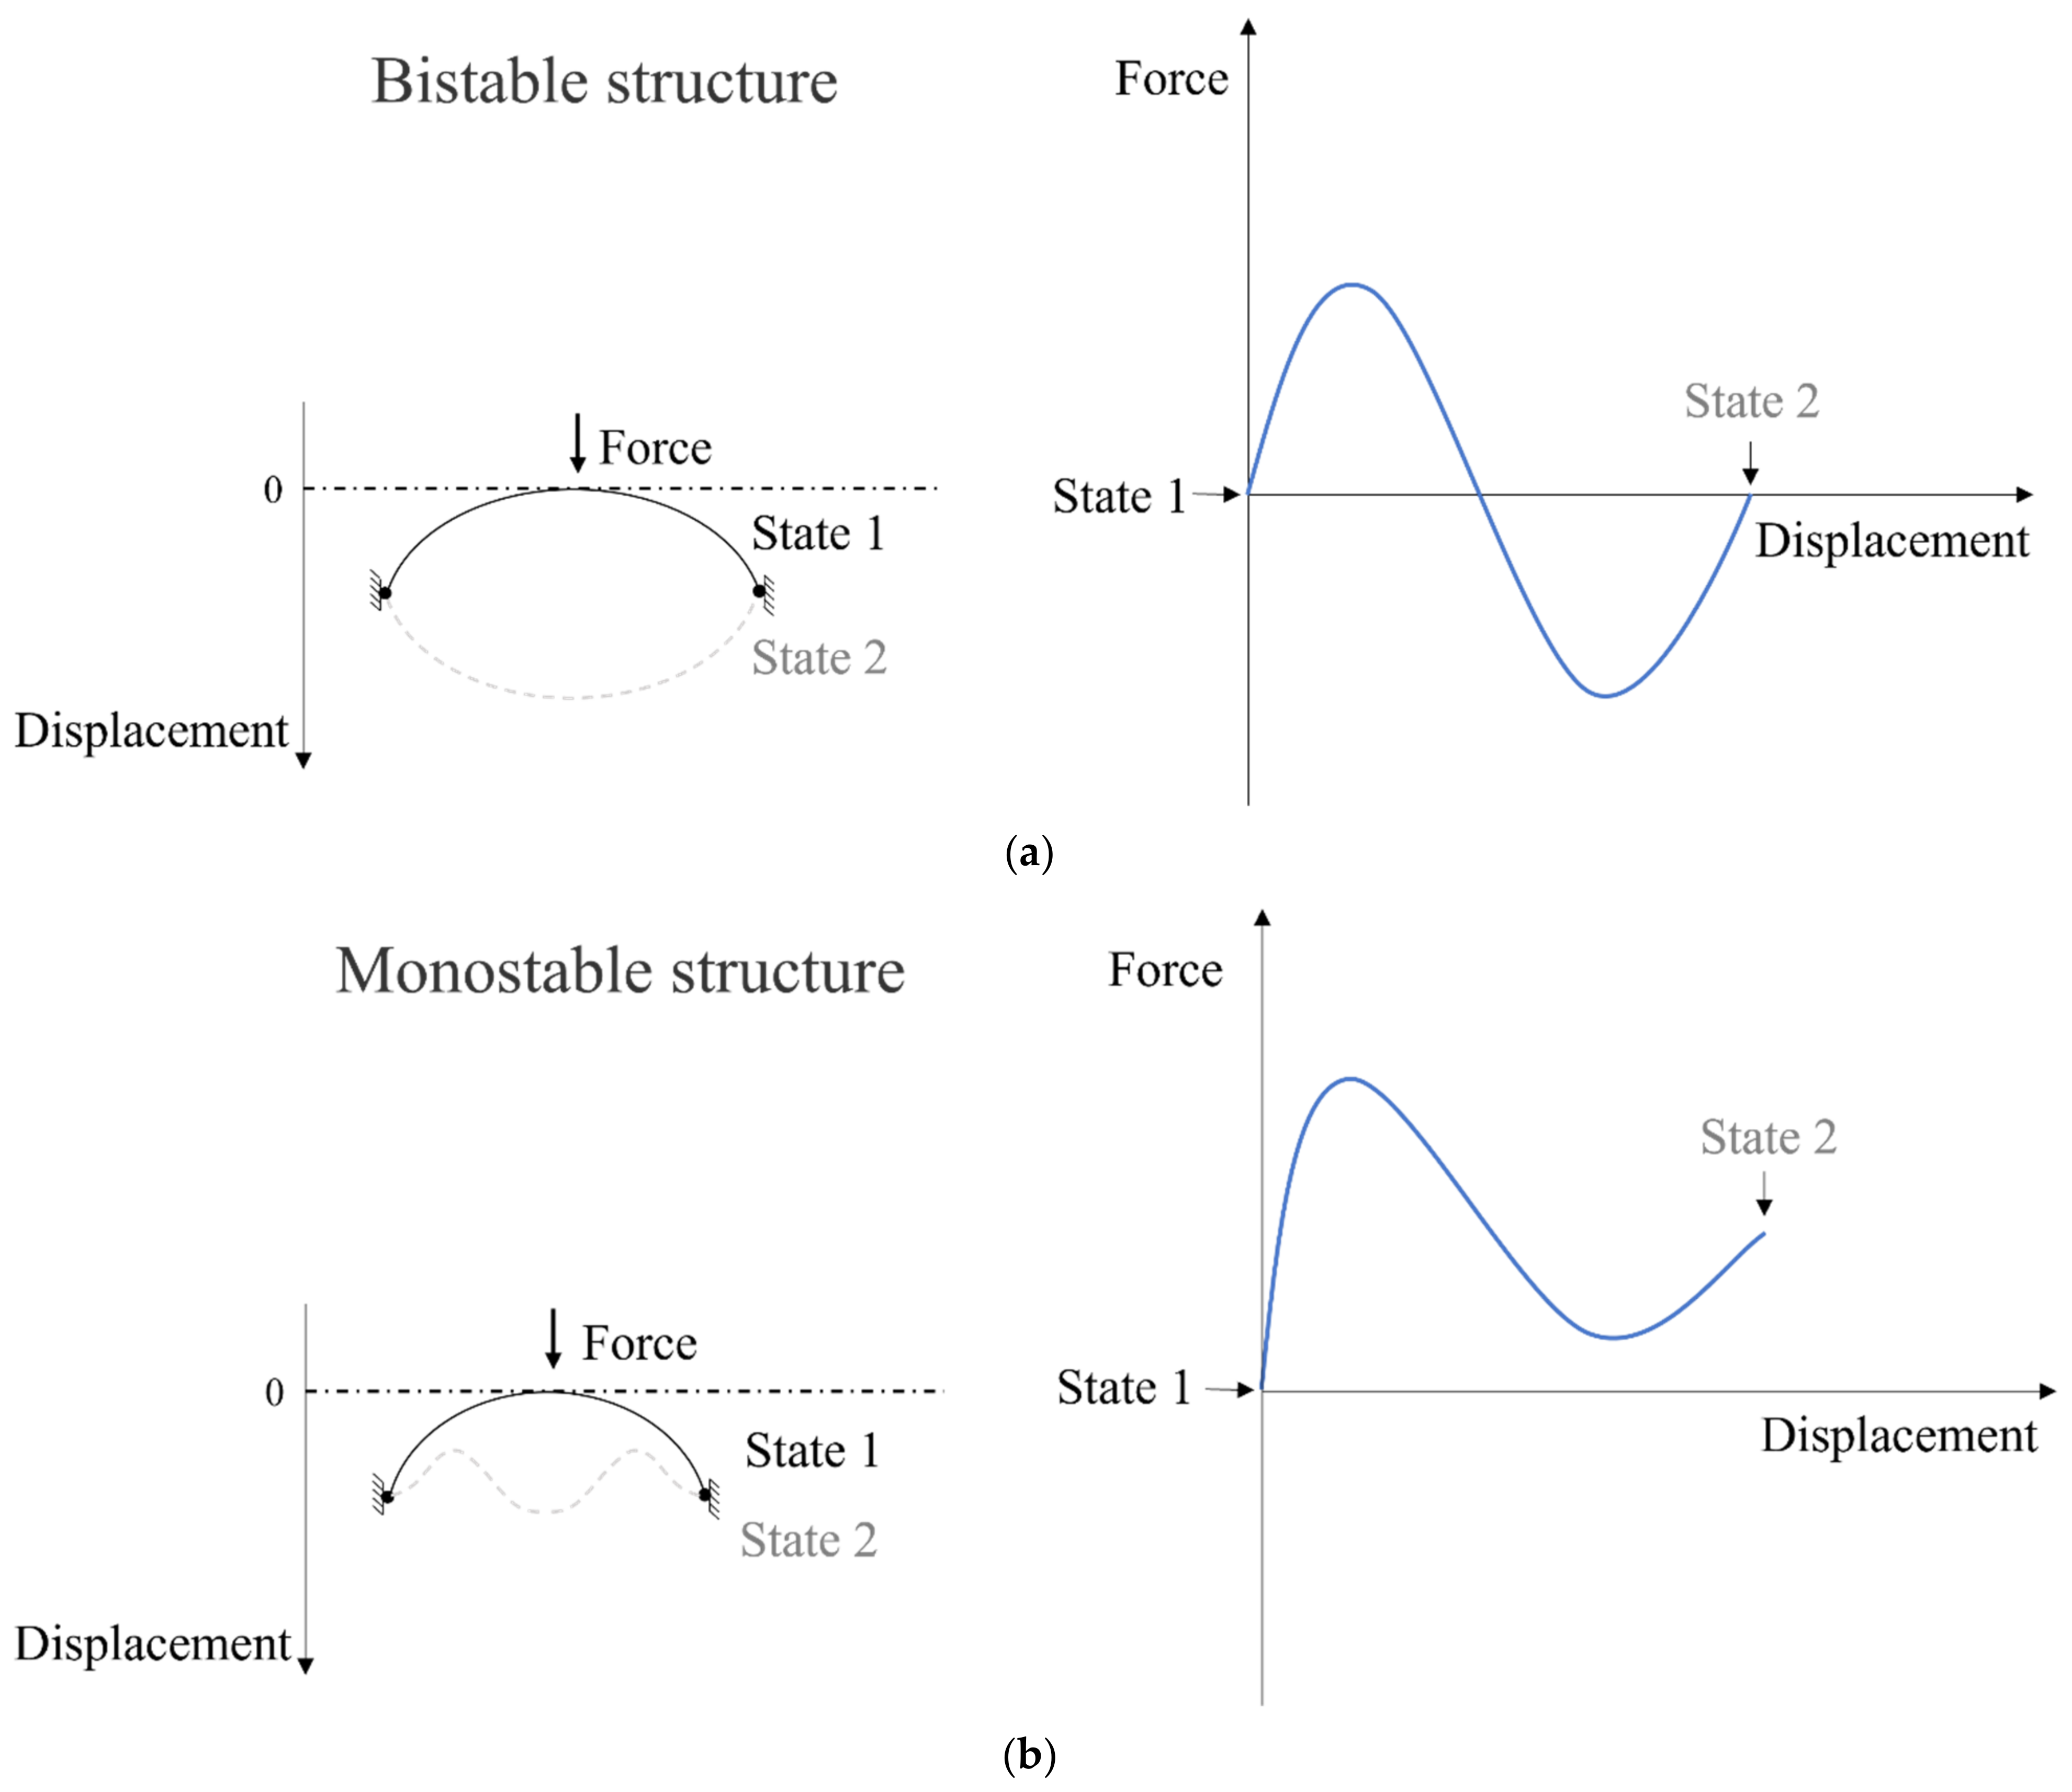
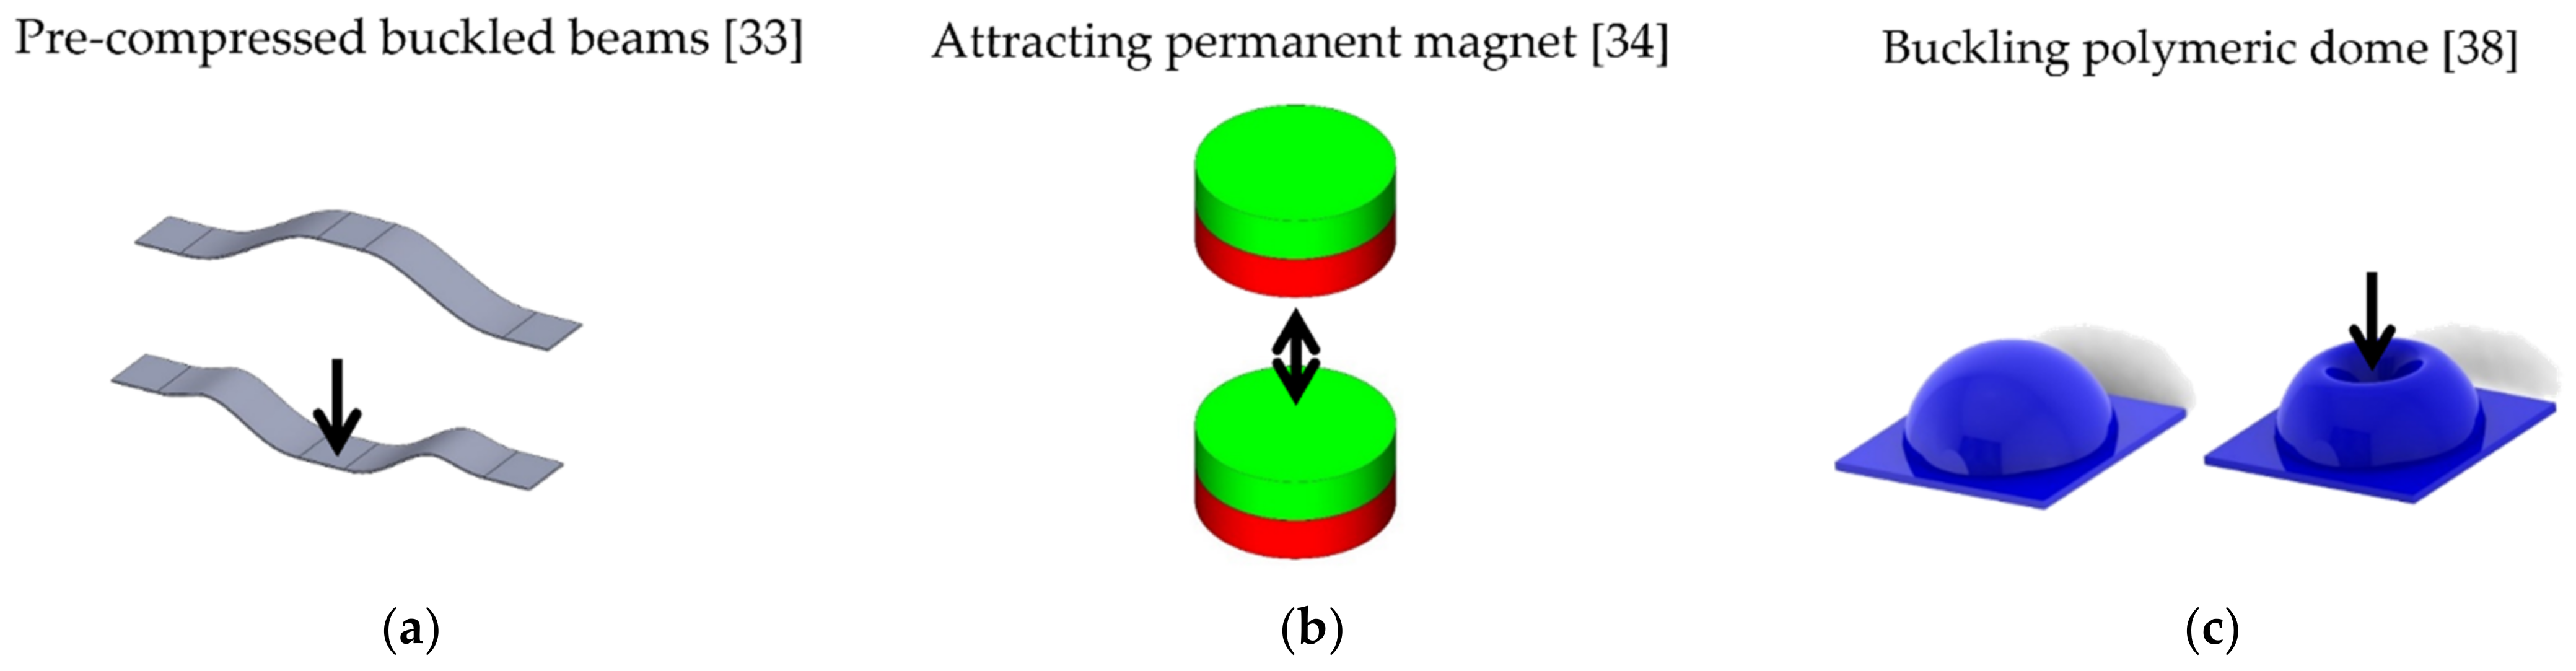
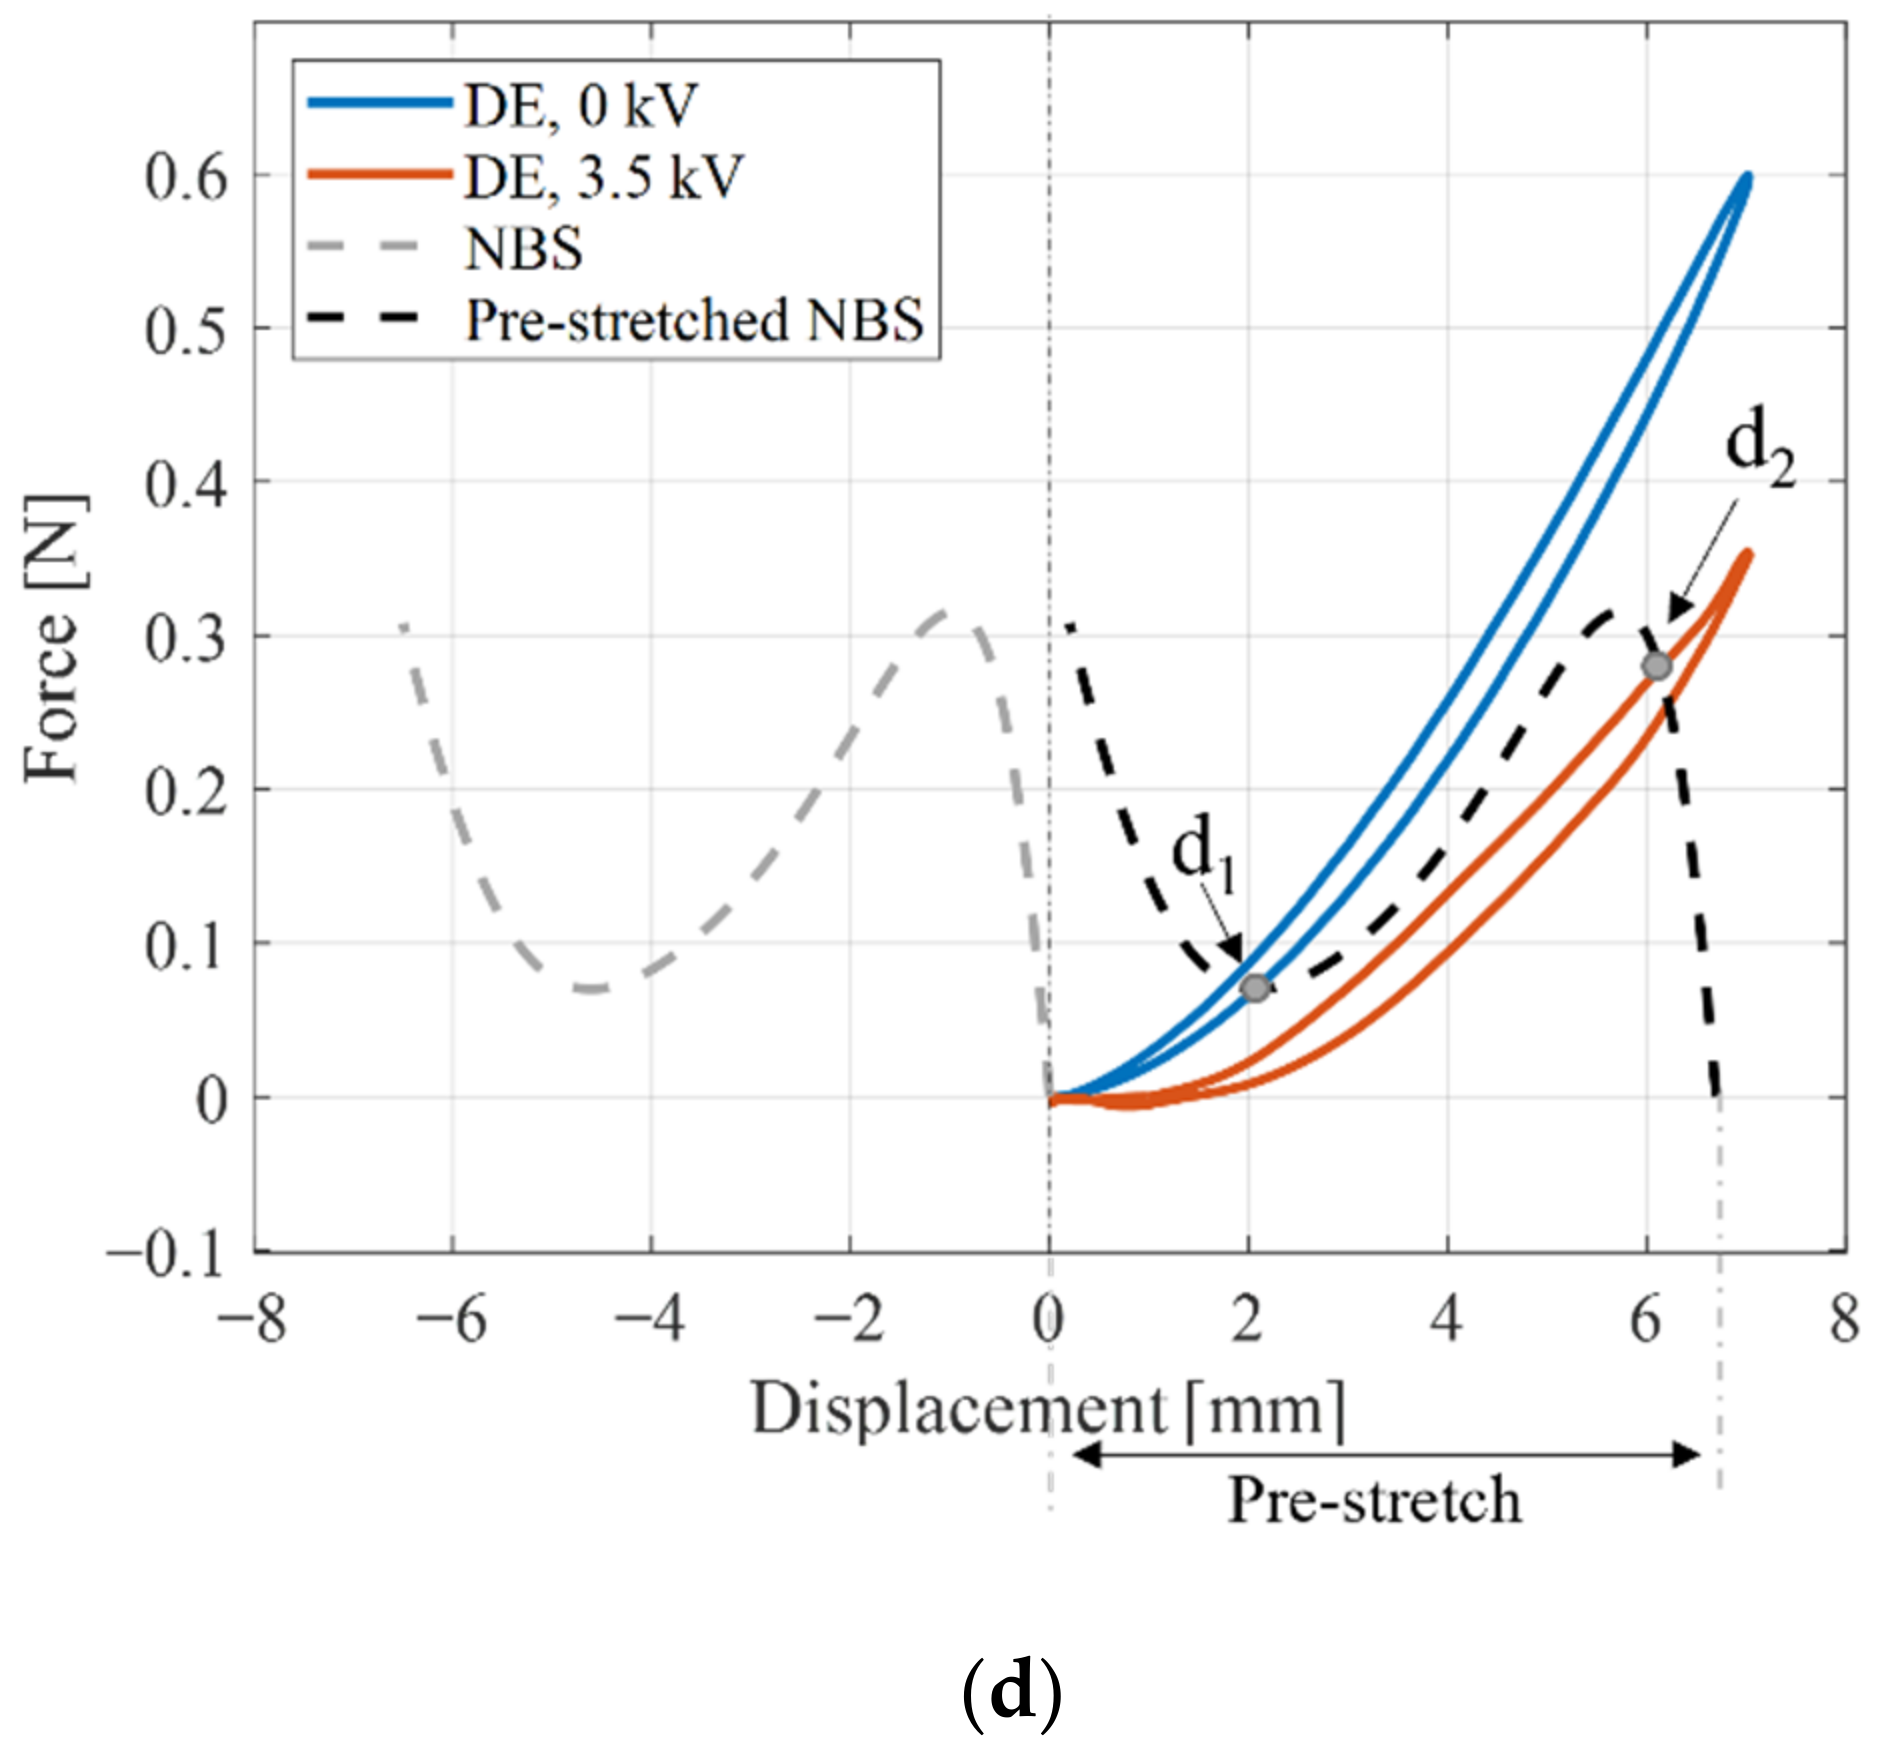
2.3. Bistable and Monostable NBS Elements

The analysis conducted in Section 2.2 is rather general and holds true for any type of biasing element whose mechanical characteristics resemble the one in Figure 5. The most common type of NBSs consist of pre-compressed metal beams, in which the negative stiffness feature is generated by means of a bi-stable behavior [33,47]. An example of this kind of system is depicted in Figure 6a. When an increasing vertical load is applied to the center point, a snap occurs which results into a switch from State 1 to State 2. The corresponding force–displacement characteristic curve is depicted in the left-hand side of Figure 6a, which shows three equilibrium points in correspondence to the null external force case. The first and last ones are stable equilibria, and represent State 1 and State 2 configurations, while the middle one corresponds to an unstable equilibrium point. The key feature which allows use of a NBS as the biasing element for DEs is not the bi-stability itself, but rather the negative stiffness region which surrounds the unstable equilibrium point. A similar negative stiffness behavior can also be obtained by means of a monostable nonlinear structure. The monostable behavior can be achieved by as-fabricated beam designs, by combining a pre-compressed steel cross with linear spring [31], or via three-dimensional buckling polymeric domes [38]. The latter clearly represents the design solution adopted in this manuscript, due to its lack of metal parts and rigid parts. A cross-sectional sketch of this type of system, together with a qualitative example of its mechanical characteristics, is depicted in Figure 6b. Compared to the previous case, the curve intersects the horizontal axis only once, thus resulting in a single stable equilibrium point. Therefore, contrary to the previous case, the configuration State 2 turns out to be unstable, as upon removal of the load a snap back to the initial configuration occurs.

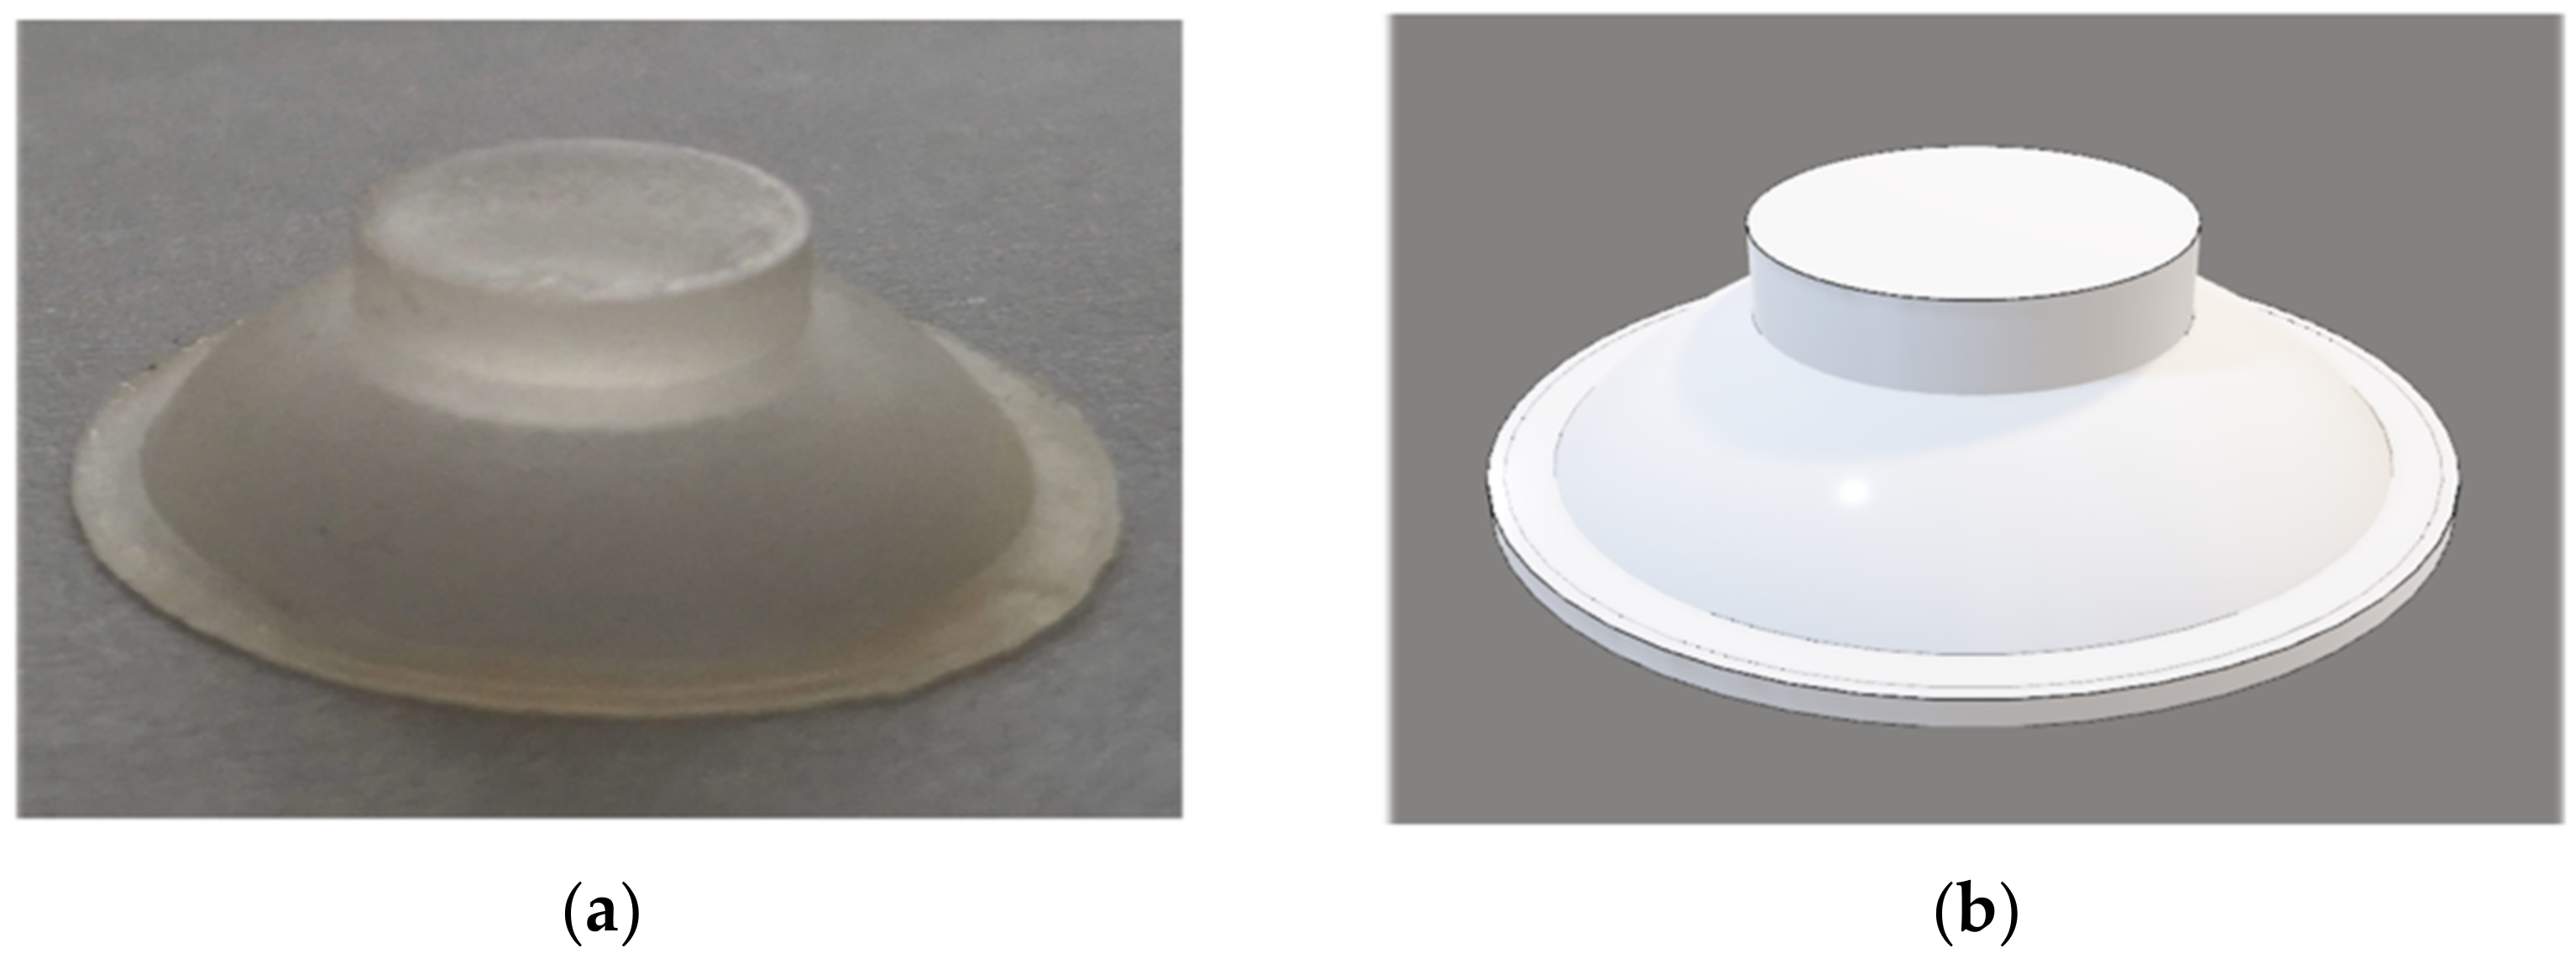
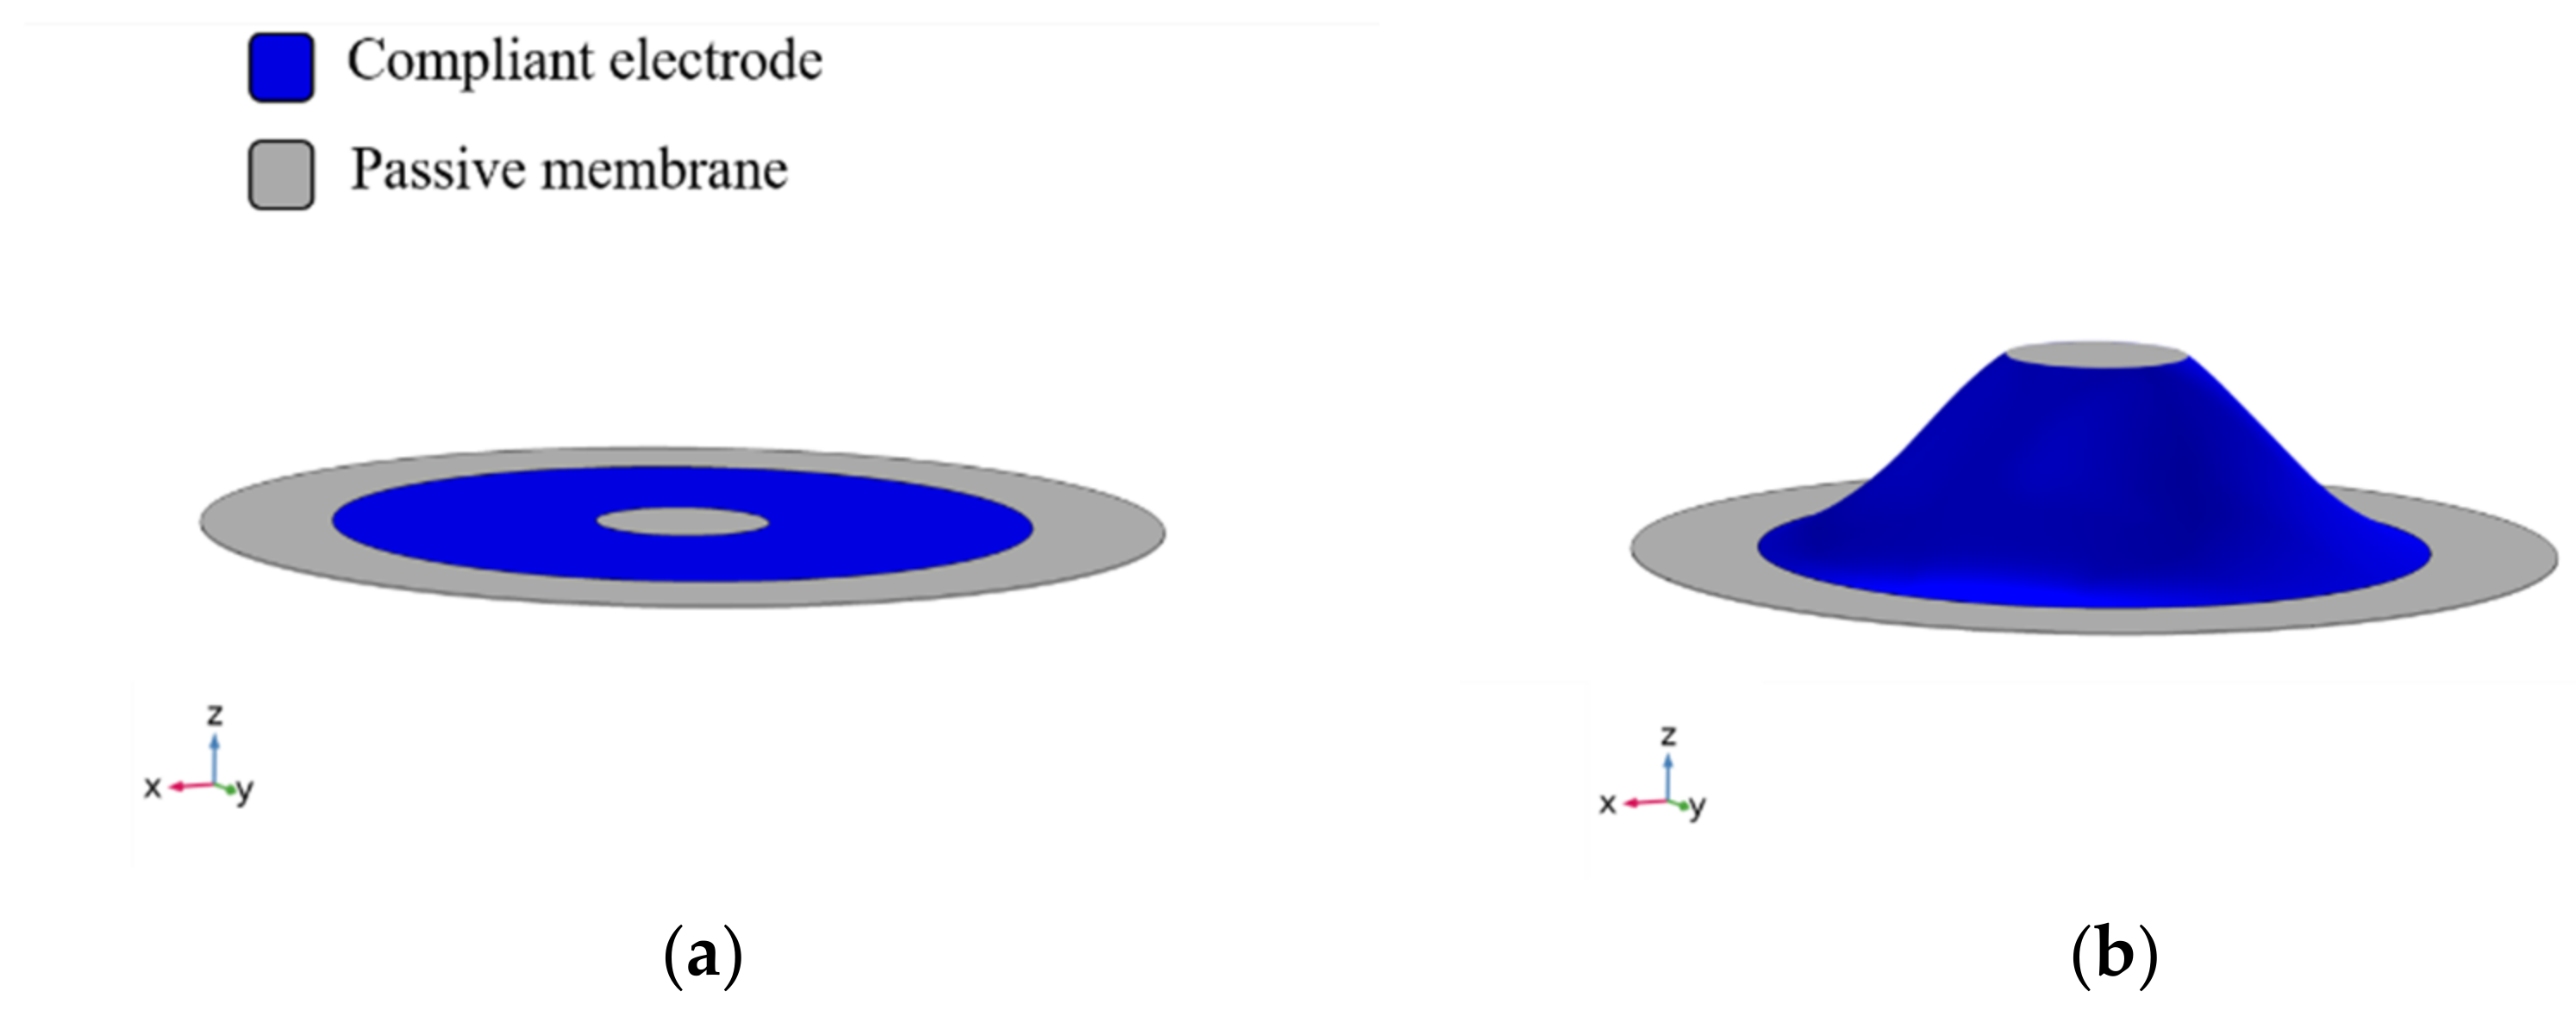
3. Nonlinear Biasing Dome
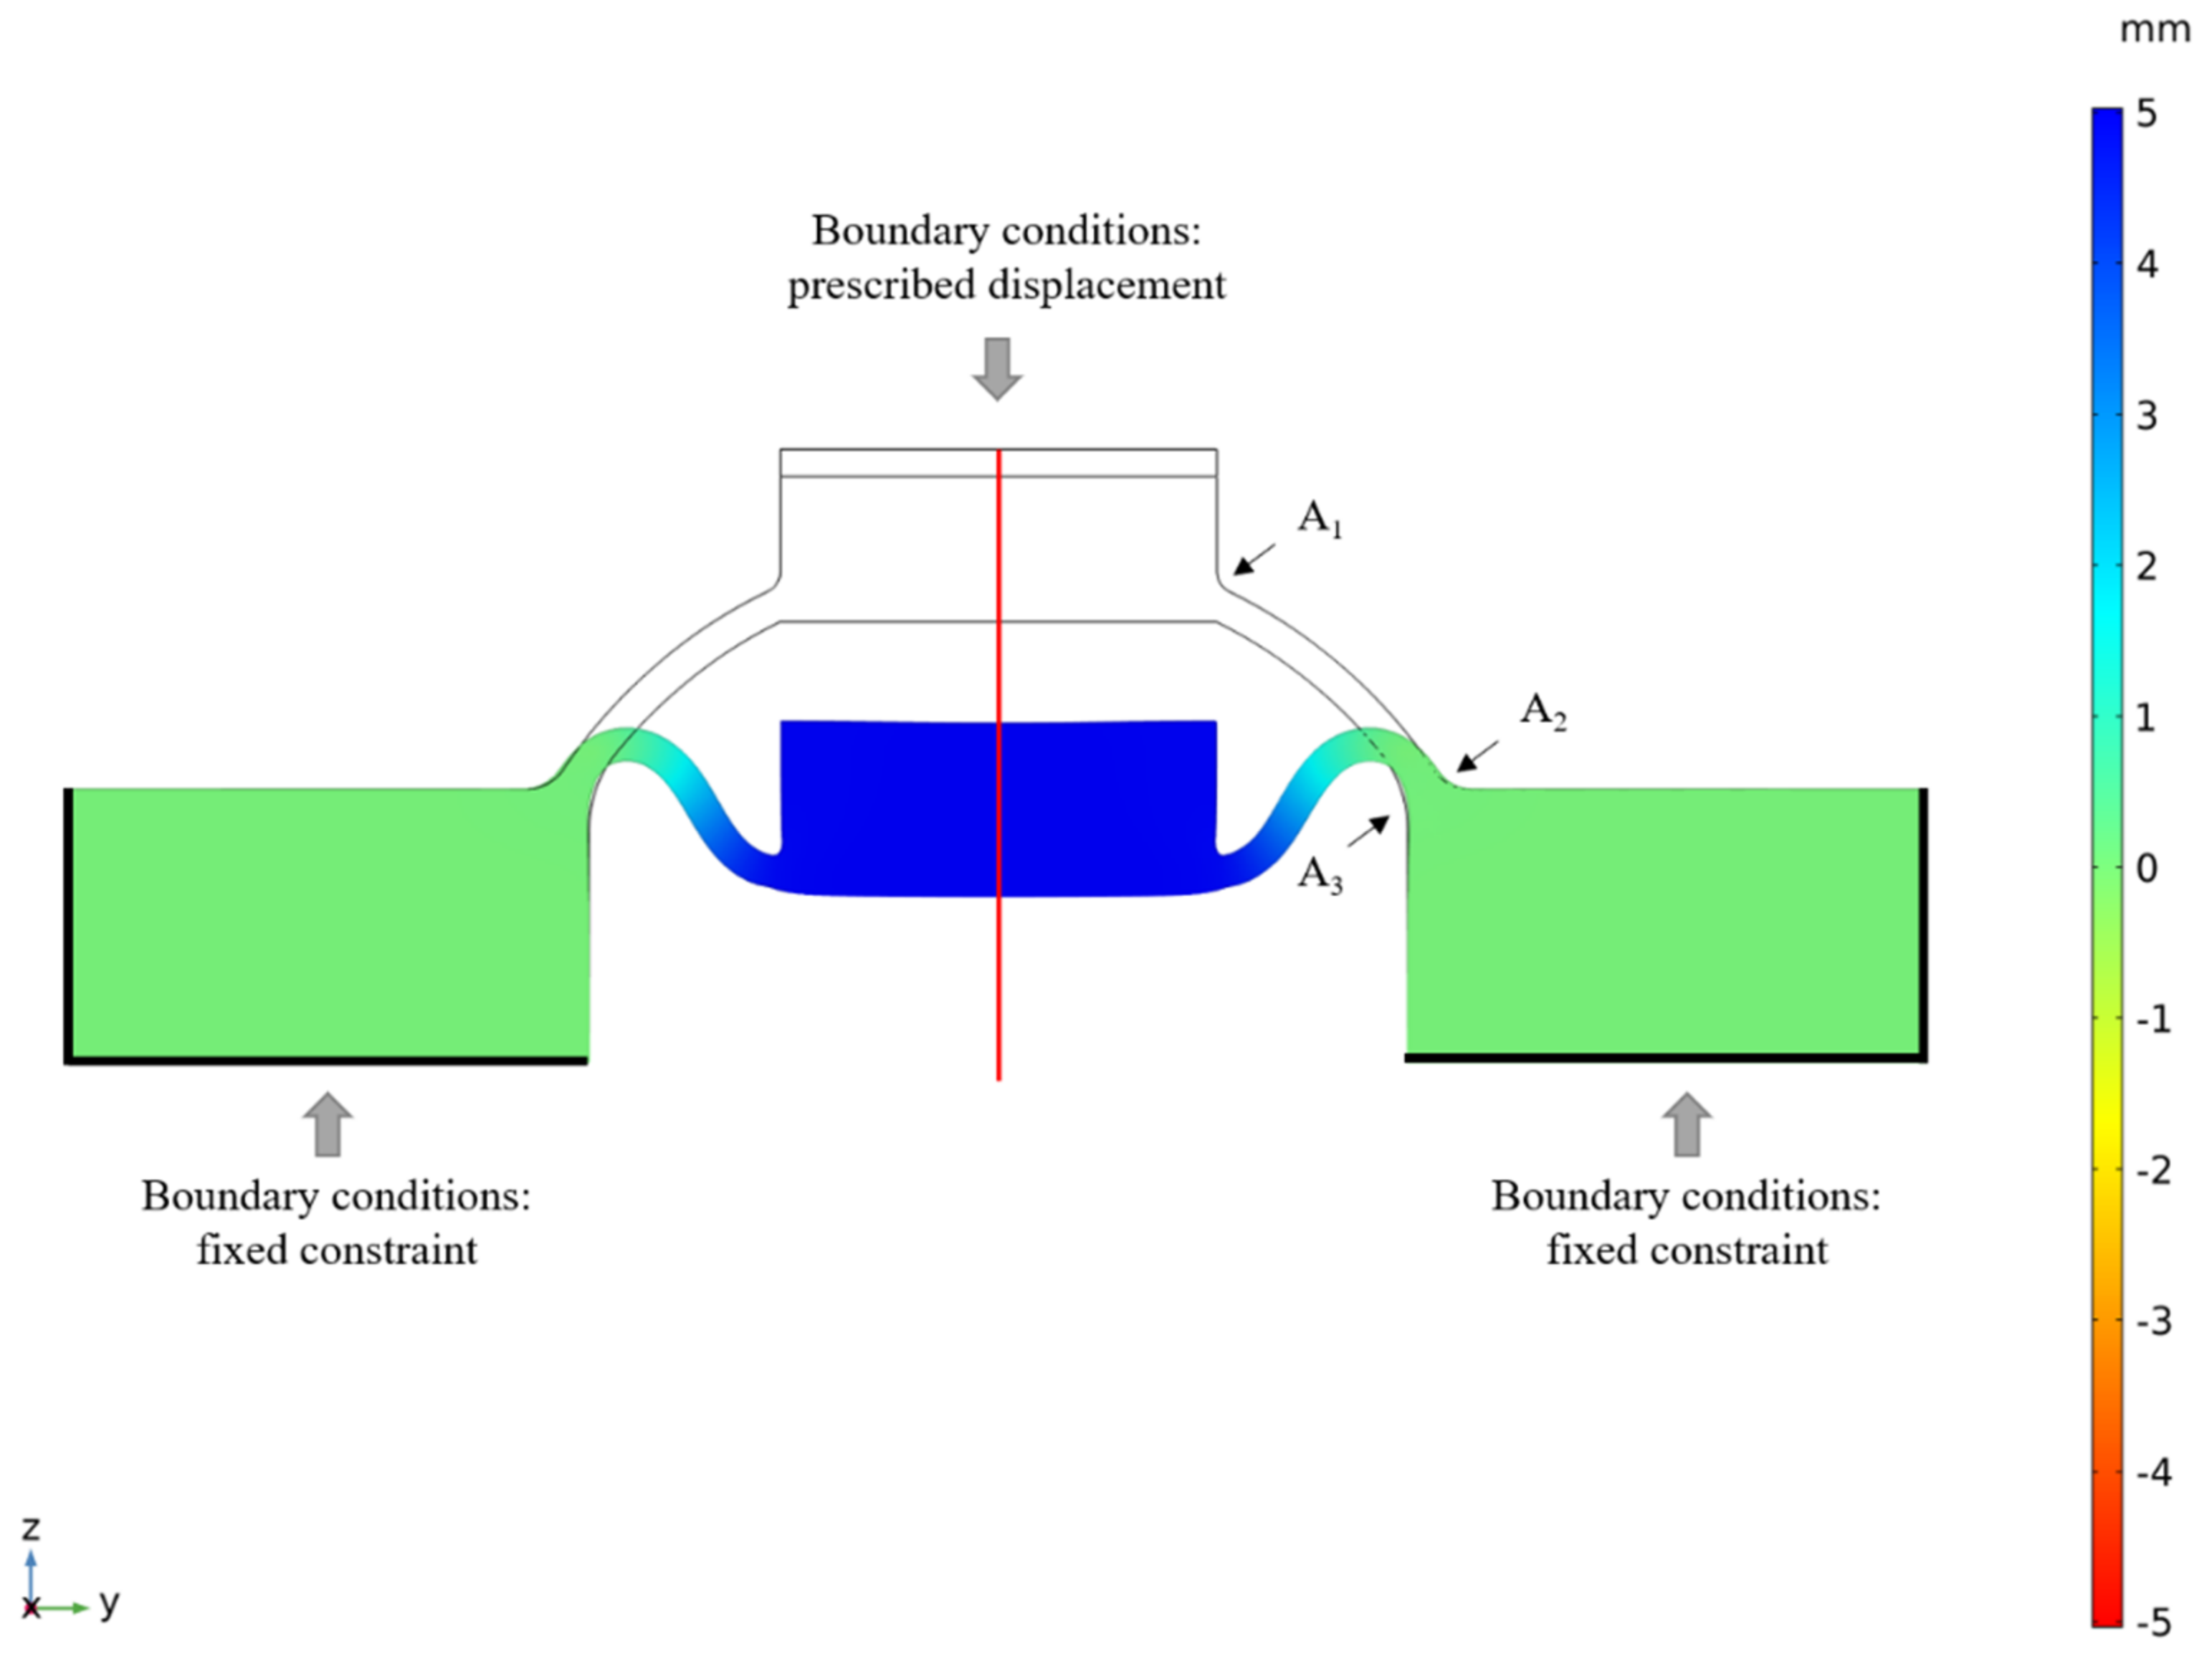
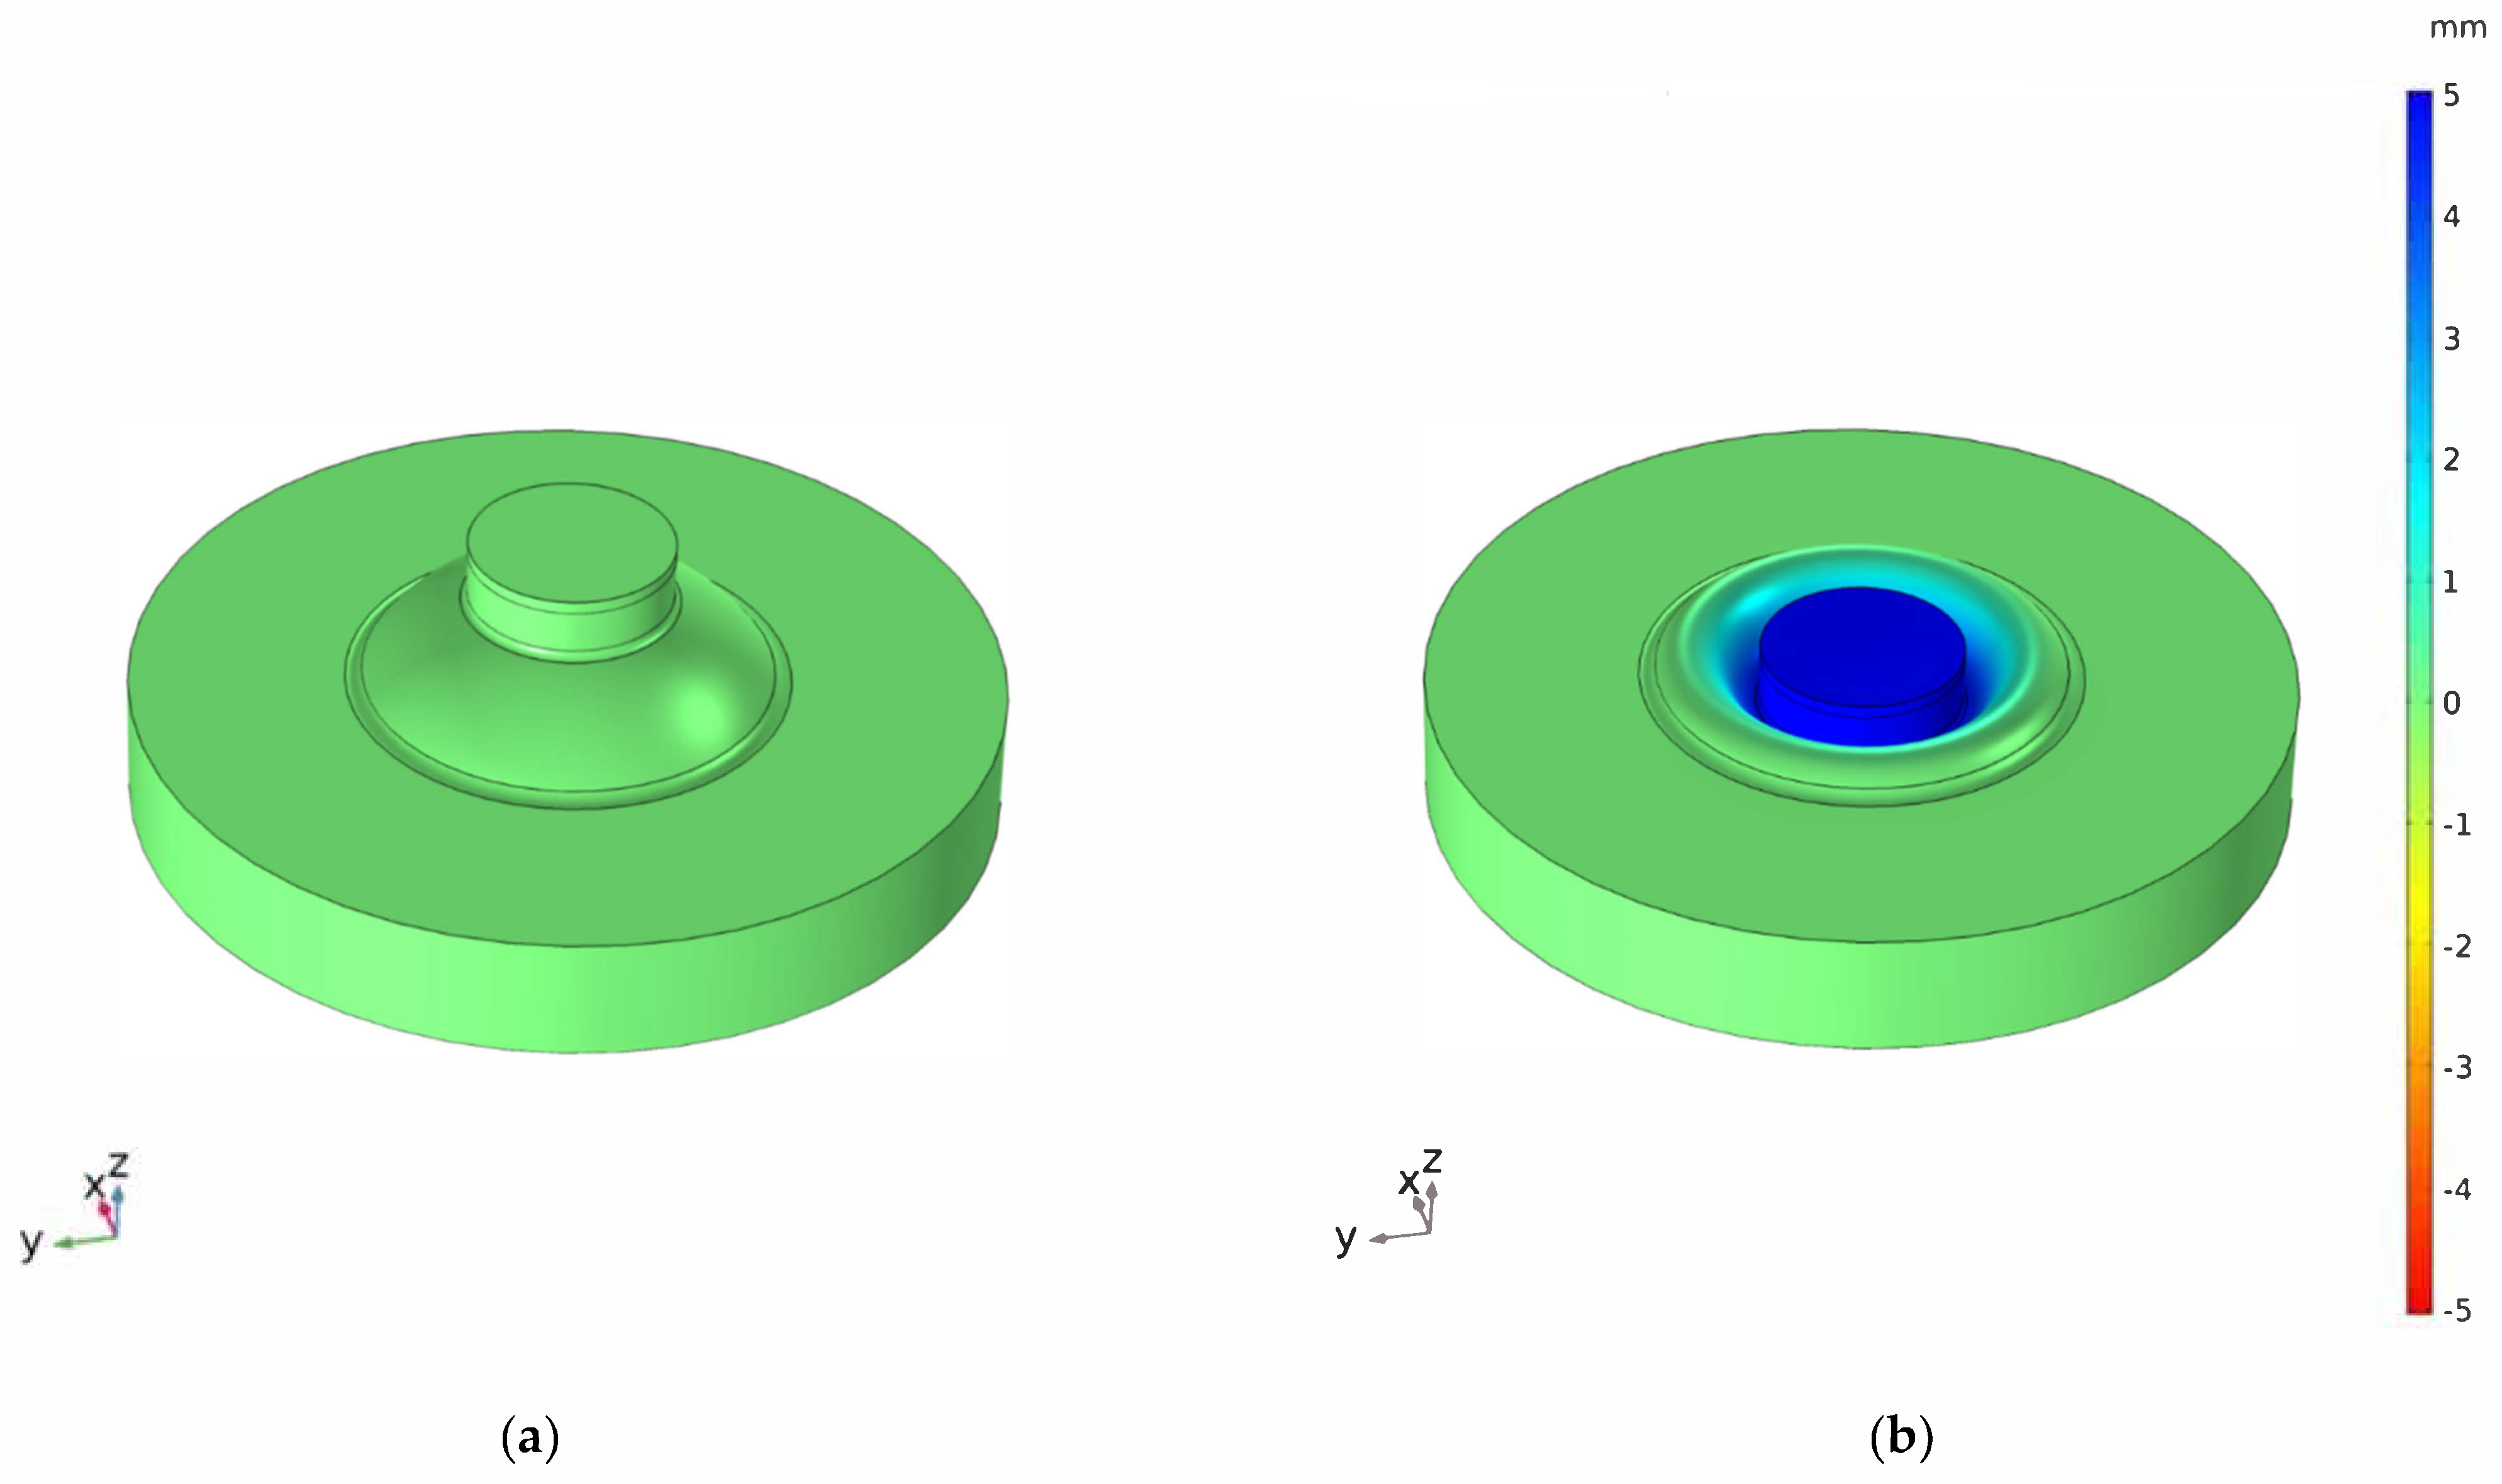
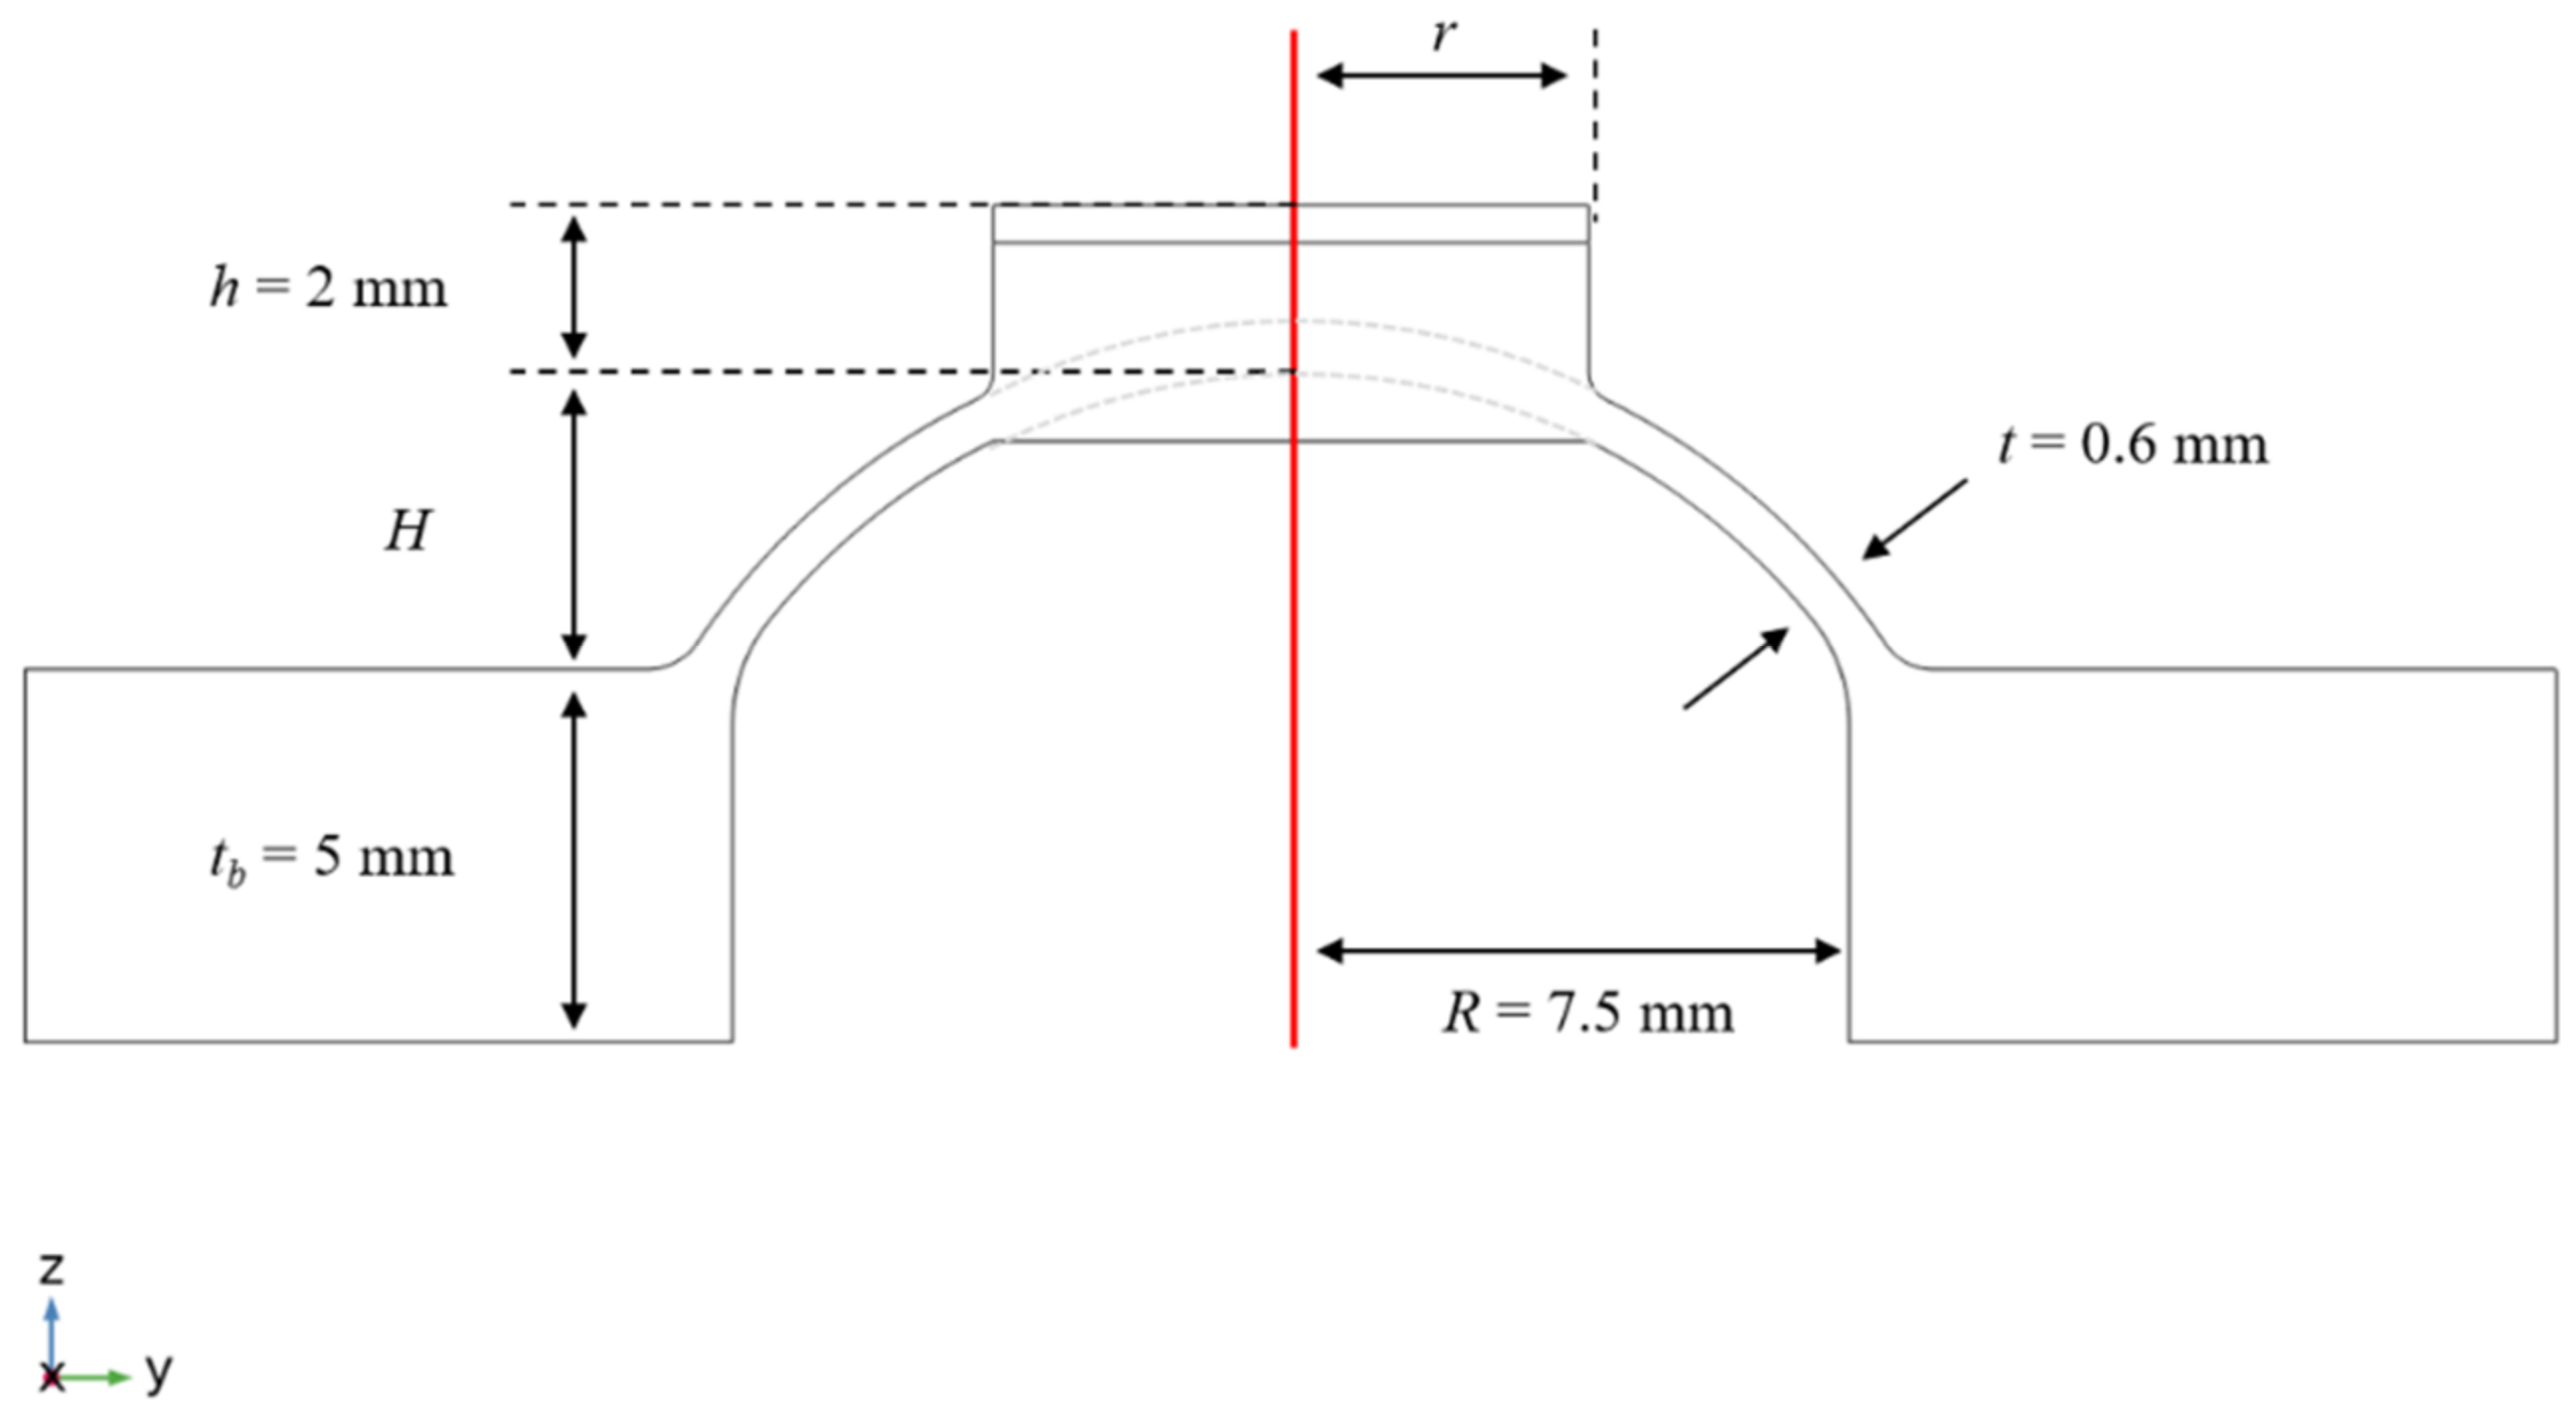
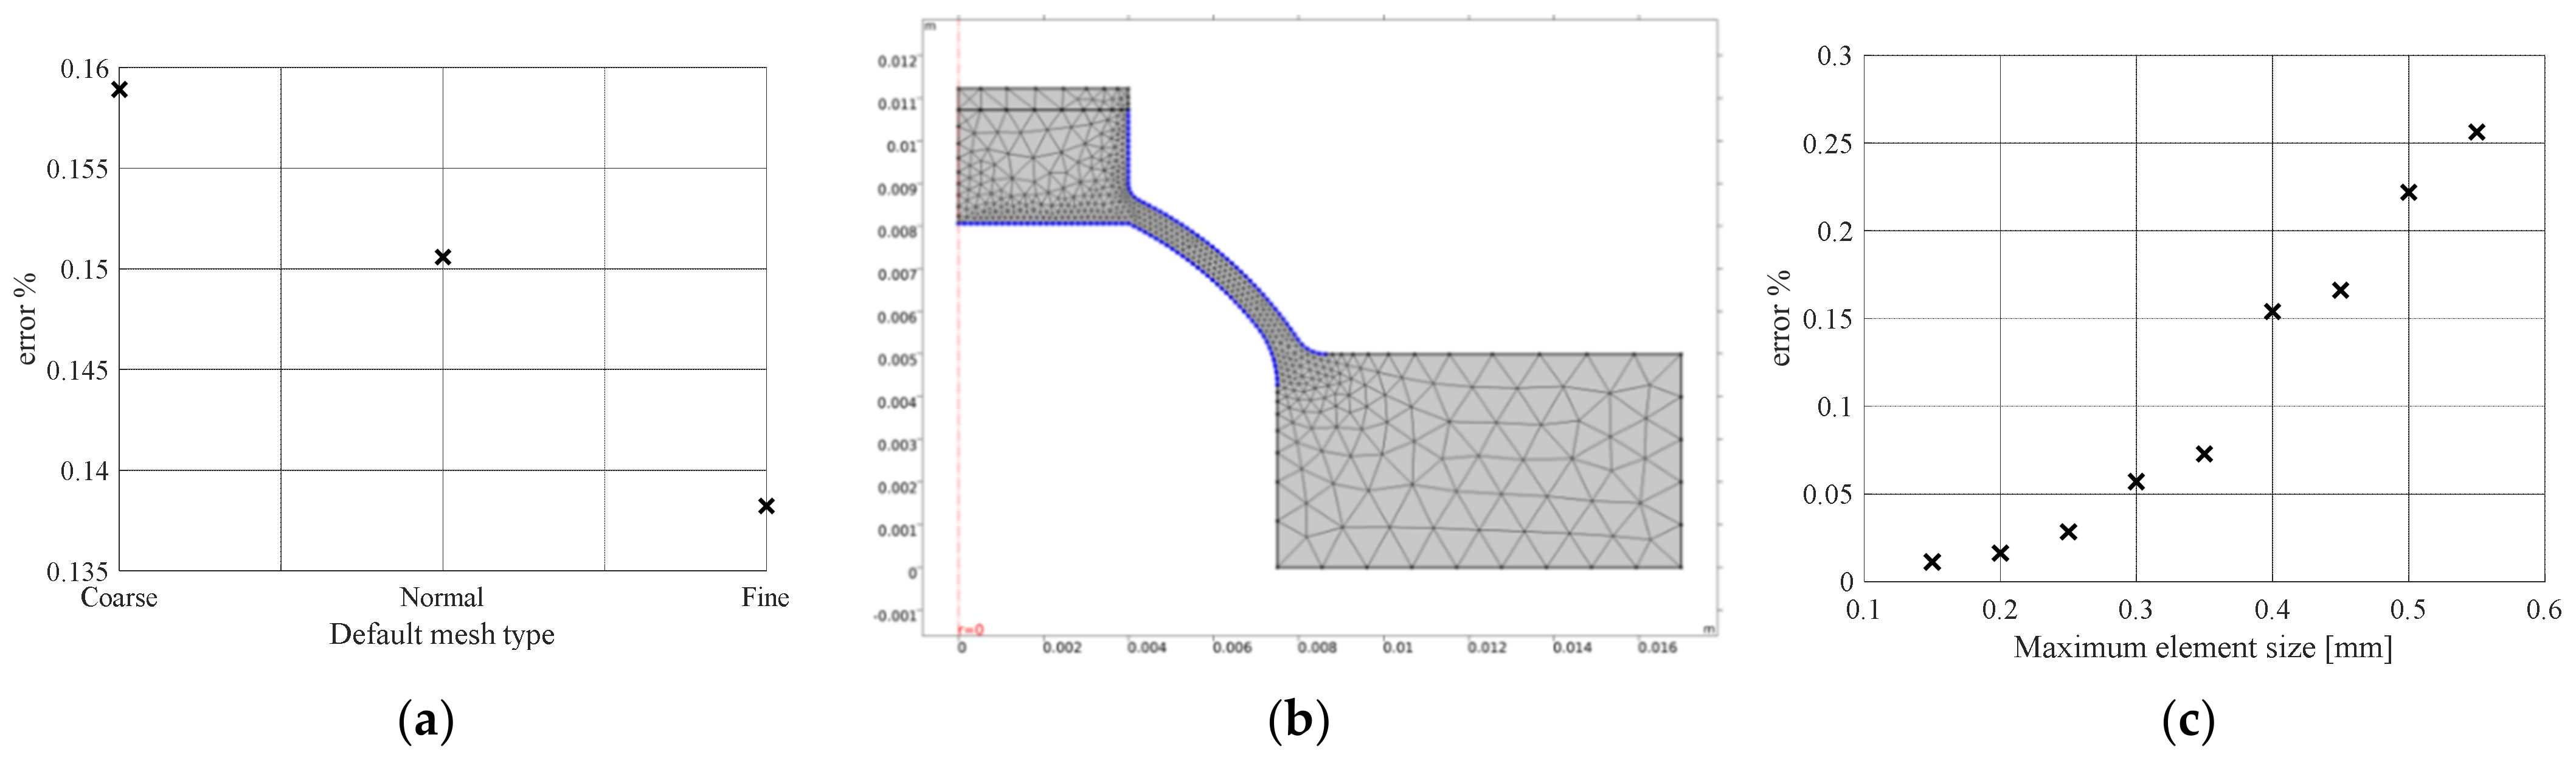
In this section, the FE model development for the three-dimensional fully polymeric dome is presented. The model shall predict how the dome force-deflection characteristic changes for various geometries. The FE simulation study will allow identification and improvement of the weak points of the realized structure, providing a feedback for the experimental fabrication feasibility. Moreover, the model will allow us to understand how the bias element and the DE membrane interact with each other and, in turn, to predict the performance of the coupled system for different dome geometries.

3.1. Dome FE Model

A sketch of a real-life prototype of three-dimensional polymeric dome is shown on the left-hand side of Figure 7 (for more details on the dome material and fabrication process, the reader may refer to [38] as well as to Section 4 of the present manuscript). Using the FE framework, it is possible to recreate a physics-based model of the dome experimental prototype. A 3D rendering of the FE model of the dome, implemented within COMSOL Multiphysics® environment, is shown on the right-hand side of Figure 7.
As the dome exhibits a rotational symmetry along the vertical axis, its behavior can be equivalently described through a simple 2D axisymmetric model, shown in Figure 8. Once the 2D cross-section of the dome is implemented, a revolution around the z-axis permits generation of the complete 3D rendering, as illustrated in Figure 9. Describing the full 3D dome via an equivalent two-dimensional model allows substantial reduction of the computational complexity, without significantly affecting the significance of the result (as in our application we are solely interested in the first radial-symmetric bending mode). Based on the presented model, we will be able to perform large deformation studies by considering several geometrical configurations.
The relevant geometric parameters of the considered dome are highlighted in Figure 10. Starting from a spherical structure with wall thickness t, a flat top part with height h and radius r is added, in order to implement the connection with the DE membrane. During characterization experiments, a displacement is prescribed in the central flat part via a linear motor, and the resulting reaction force is evaluated by means of a load cell. An indenter, having also radius equal to r, is used in the experimental setup, to ensure a homogeneous distribution of the external load force on the top part (see [38] for details). An additional benefit of this design solution is the already available flat base, which offers a further support to connect the DE membrane. With regards to the FE model, the addition of this extra component allows bypassing of the simulation of the structure compressive stress through a prescribed in-point displacement, which is an important prerequisite for a correct post-buckling analysis. Indeed, the knowledge of the surface on which compression occurs facilitates the computation of the resulting force. Furthermore, the selection of a bottom base height of tb permits avoiding taking into account tolerance errors in the dome clamping phase, resulting in more repeatable experimental results.
For concluding this section, we point out that some of the dome geometric parameters, i.e., H and r, will be left free for the optimization, while the remaining ones are fixed by design in agreement with [38]. The corresponding numerical values of the known parameters are shown in Figure 10.

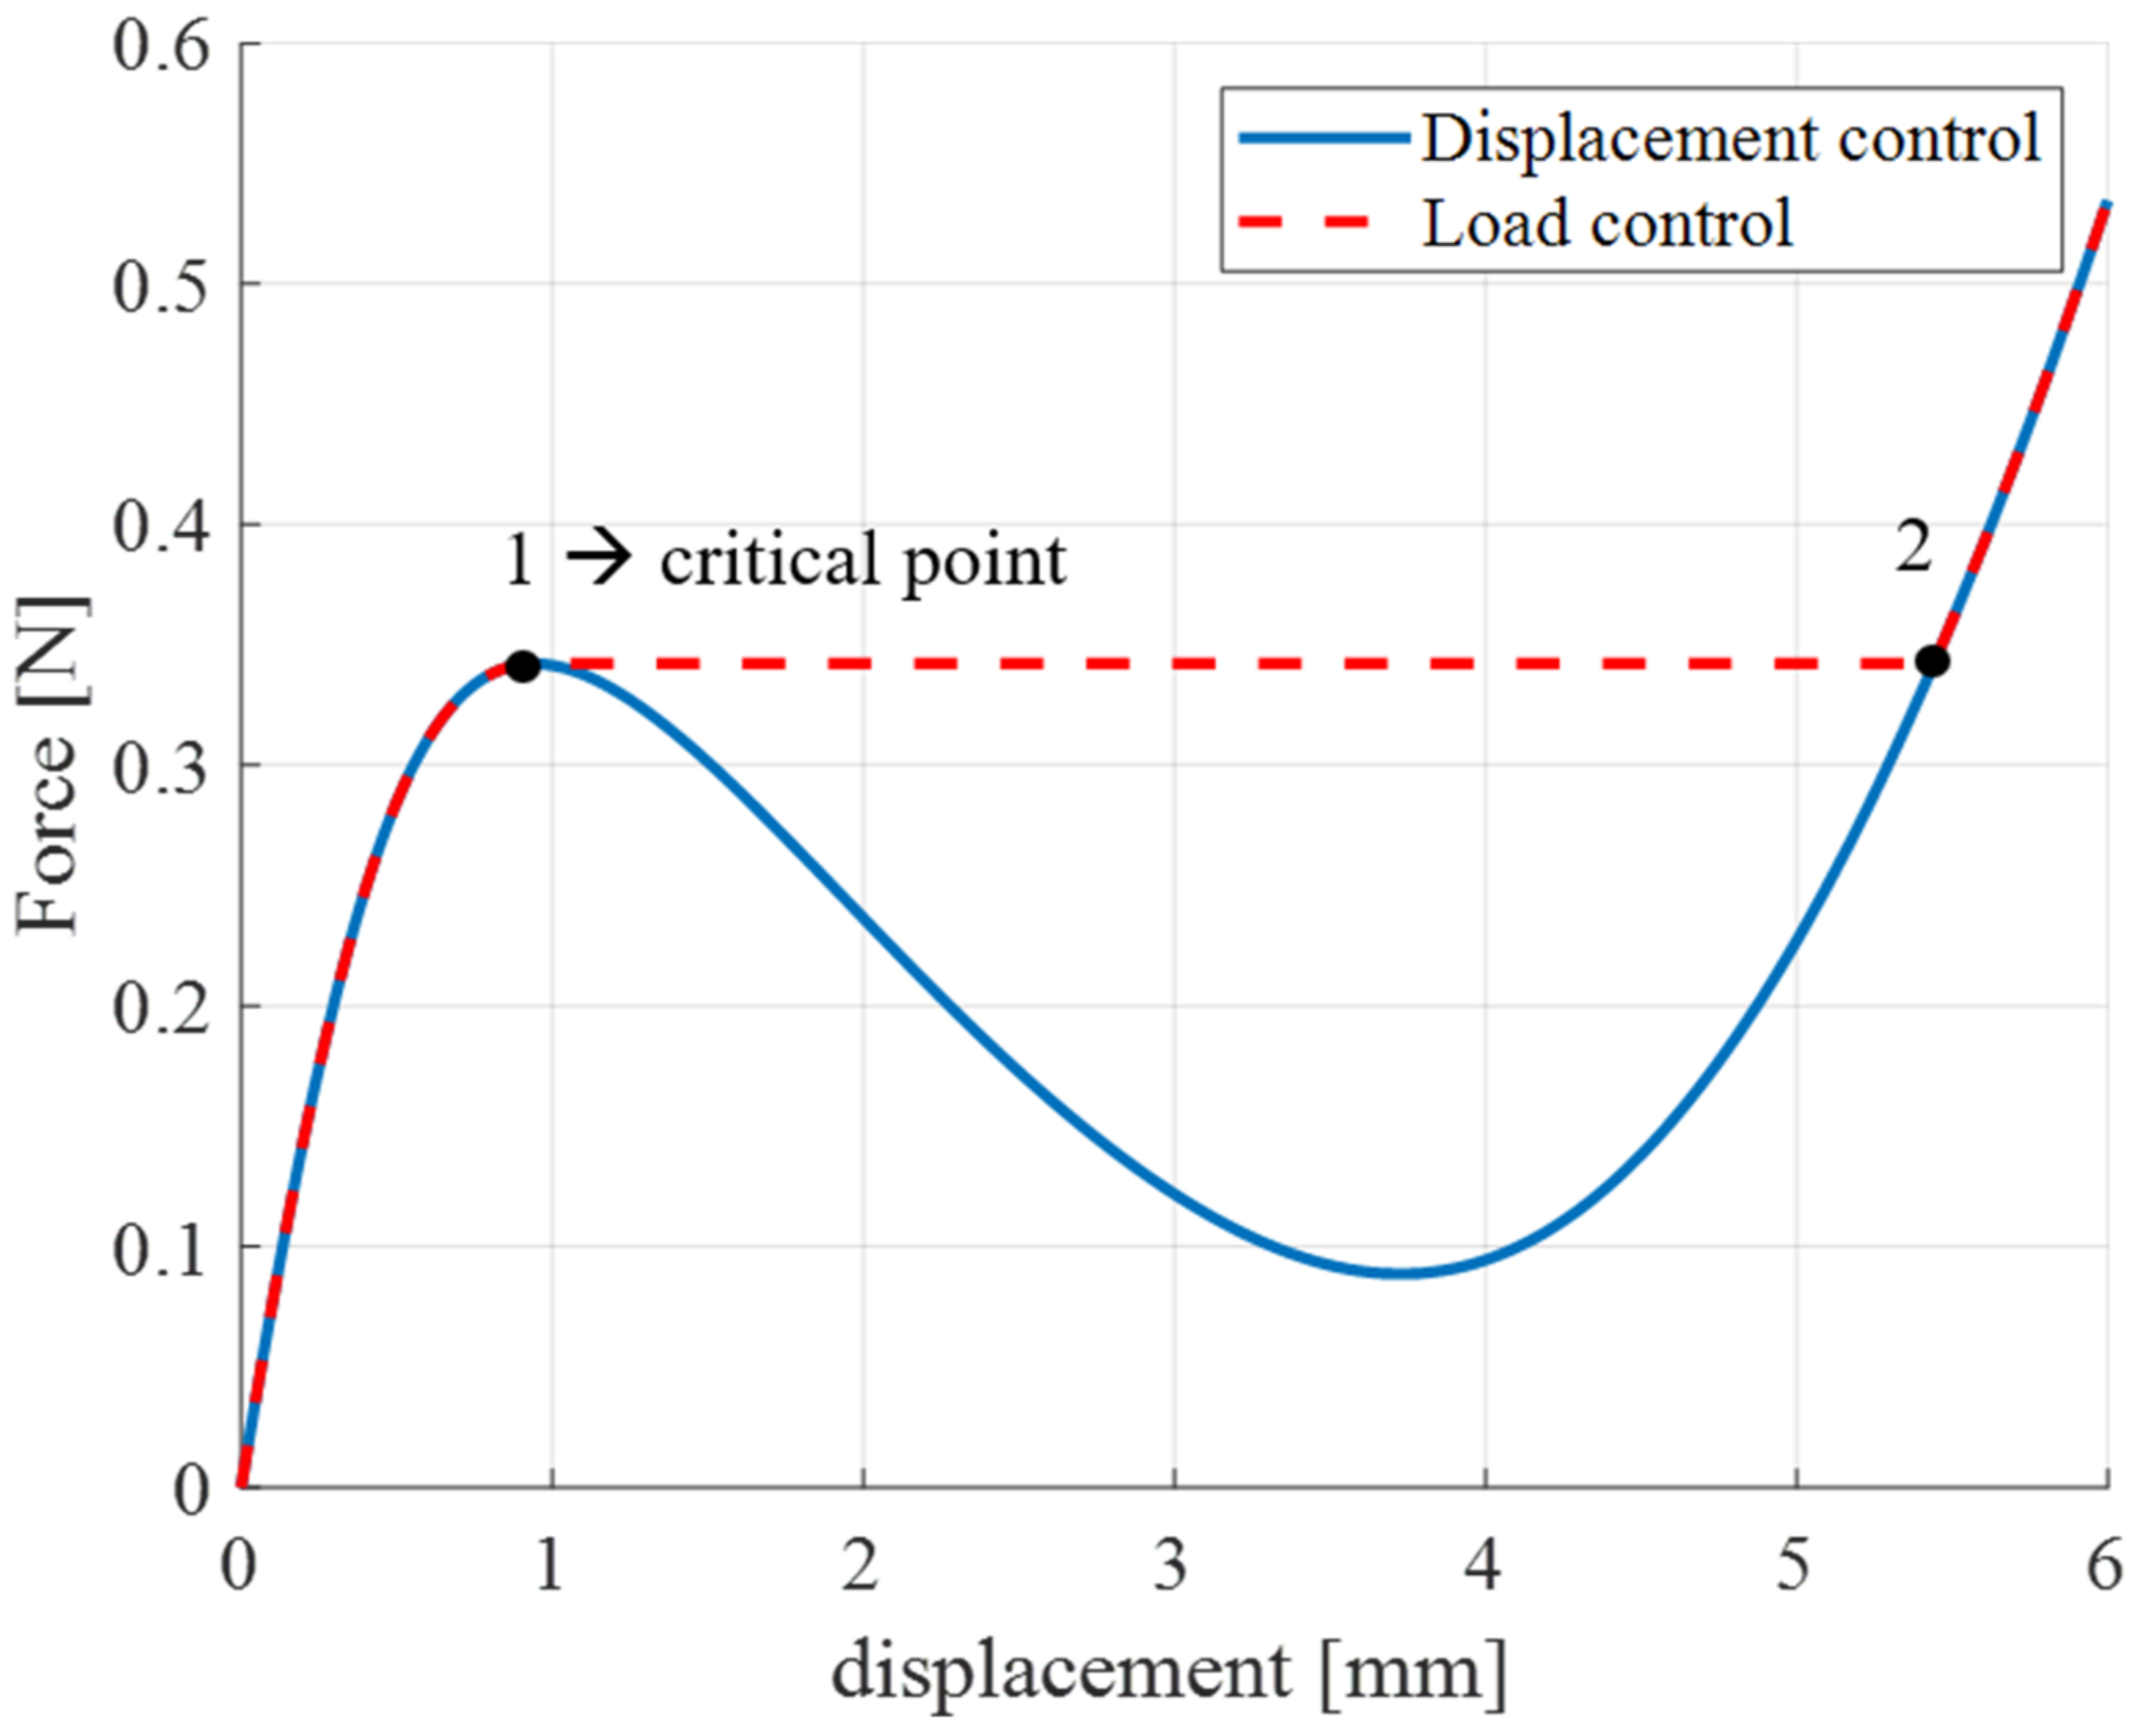
3.2. Post-Buckling Analysis and Numerical Implementation Aspects

To properly simulate the snap-through behavior of the polymeric dome, a post-buckling analysis must be performed. In this way, it is possible to track the behavior of the polymeric dome during the applied solicitation, which will allow us to capture information about applying loads at both the critical buckling value and above. The expected shape of the force–displacement characteristic should exhibit a critical point, followed by a gradual snapping phase with a subsequent increase in stiffness. In order to perform a correct post-instability analysis, appropriate strategies must be adopted to ensure convergence of the solver. The instability represents a bifurcation problem: at the critical load, there is more than one solution. Therefore, the buckling instability will manifest numerically through an ill-conditioned or singular stiffness matrix, that results in numerical instability. On the other hand, the buckling instability represents the main feature which allows us to use polymeric domes as large-stroke biasing elements for DEs (as also discussed in Section 2). Therefore, properly account for it in the numerical simulation is of fundamental importance for DEA performance optimization.
Figure 11 illustrates an example of mechanical characteristic of the dome, based on the results in [38]. Such a curve clearly illustrates the snap-through behavior to be modeled. The critical load point (denoted as 1 in Figure 11) mathematically represents the state when the stiffness matrix becomes singular, while physically it describes the beginning of the “jump” dynamic event of the structure from state 1 to 2. Two different approaches can be adopted in FE modeling to avoid numerical instability, and thus enable solver convergence:
  • Load control mode: the load force must necessarily be prescribed via nonlinear dynamic solver to solve the singularity of the problem, thus performing a time-dependent study. If a time-based analysis is conducted, there is a balance between the applied external load and elastic forces (note that all dynamic forces are neglected in this study). After that, the axial displacement represents the quantity calculated as the output. The final result is equivalent to the dashed red curve depicted in Figure 11, in which the dynamic jump from state 1 to state 2 is clearly visible.
  • Displacement control mode: as the deformation represents the quantity increasing monotonically, it can be used as an input control parameter. In this way, the description of the load softening effect (occurring after the critical point) is derived unambiguously based on the simulation output.
To this end, the axial deformation is prescribed in the nonlinear static solver by setting a range of consecutive and uniformly spaced values. Consequently, the output is represented by the resulting force calculated over the same area. The final result is shown as the solid blue curve in Figure 11. The curve shows that, after the critical point is overcome, the load decreases despite the larger deformation due to a softening effect.
With the aim of fully visualizing the force values within the snap-through range, the preferred choice in our case is represented by the deformation control mode. Therefore, a prescribed displacement boundary condition is applied as input on the flat upper part, considered alongside the other boundary condition describing the fixed dome base (cf. Figure 8). Note that such boundary conditions reproduce the real constraints occurring in the experimental setup. Moreover, as we are mostly interested in the steady performance of the actuator, all the studies are conducted in quasi-static conditions to decrease the computational effort.
For simulation purpose, it is important to further define the mesh type and the size of its elements. In order to make the obtained results insensitive to the latter parameter, a force–displacement curve convergence study is performed for several planned meshes. To this end, an unstructured free triangular mesh is initially set. This type of mesh is the most widely used one for 2D models, as it represents a simple and fast way to conform at the whole geometry with localized resolutions [48]. In particular, three different types of default discretization (coarse, normal, fine) are evaluated, in order to determine the optimal one. The mesh named extremely fine is chosen as a reference solution for evaluation of the other three ones, as, due to its densely meshed design, the FE simulation converges to a tighter solution. The whole system is discretized with quadratic serendipity elements. The constitutive material behavior is modeled as described in the following. The hysteretic behavior of the material, which is observed in the experimental characterization curves, is neglected in our study in order to simplify the material description. In particular, the dome is described via a hyper-elastic material model. To account for large deformations, a nearly-incompressible Yeoh mechanical free-energy density (ψ) is selected in the solid mechanics interface [49], defined as follows:
ψ = i = 1 3 c i 0 λ 1 2 + λ 2 2 + λ 3 2 3 i + κ 2 J 1 2 .
The meaning of all the quantities in (2) is described in the following:
  • Principal stretches λ1, λ2, λ3;
  • Material constitutive parameters ci0, i = 1, 2, 3;
  • Bulk modulus κ, which allows practical accounting of the material incompressibility in a numerically efficient way;
  • Volume ratio J, equal to the determinant of the deformation gradient.
A problem encountered when simulating the considered dome geometry is that stress convergence does not occur nearby sharp corners, due to a local stress singularity in the model. This issue is numerically handled by including rounding parameters for the sharp corners, denoted as A1, A2, A3 in Figure 8. The Comsol integrated direct solver MUMPS (MUltifrontal Massively Parallel Sparse) is selected, with a nonlinear Automatic (Newton) method, to solve the system of equations. The solver parameters are set as follows: maximum number of iterations of 25, initial damping factor of 10-4, and a tolerance factor of 10-2. Representative values of c10 = 0.05 MPa, c20 = 1.52 kPa, c30 = 5.11 kPa, κ = 22 × 106, are chosen for the study.
The average relative percent errors, computed by comparing the reference characteristic curves with the ones obtained with different discretization methods, are depicted in Figure 12a. It is interesting to note that, even with a coarse mesh, the error is always less than 1%. This result suggests that, in future steps in which dynamic studies will be conducted on the full actuator system (i.e., biasing dome coupled with the DE membrane), the choice of a coarser mesh might lead to a good trade-off between accuracy and simulation time. On the other hand, as the extremely fine mesh requires a higher computation time for a steady-state study, we decided to set the default mesh type to normal and to customize it in the areas where the stress is more concentrated (i.e., the blue lines represented in Figure 12b). To this end, an additional element-local size is defined only along the concerned edges, ensuring a higher node density. This solution permits achievement of the same accuracy as the extremely fine mesh defined before, while also requiring less computation time. To implement this feature, we start by setting the maximum element size of the mesh equivalent to the default normal mesh value (about 1.2 mm). This parameter is then gradually decreased, until a value of 0.1 mm is reached. The last size value generates the finest possible mesh, which will be considered as reference. Afterwards, the average percent deviations between the different force–displacement curves and the reference one is quantified and shown in Figure 12c. From this study, it can be seen that the resulting curves tightly match the reference one, thus leading to a very low average percentage error for the different mesh designs. Note that, however, the smaller the maximum size of the mesh elements, the finer the resulting mesh, thus resulting in improved convergence of the relative percent error. Nevertheless, we choose a parameter-dimension value equal to 0.15 mm, as it allow mitigation of the computational time (about 1 min) while maintaining a satisfactory accuracy (percentage error smaller than 0.02%).

4. Dome Calibration Based on the Experimental Characterization Process

Experimental validation of the dome model presented in Section 3 is presented in this section.

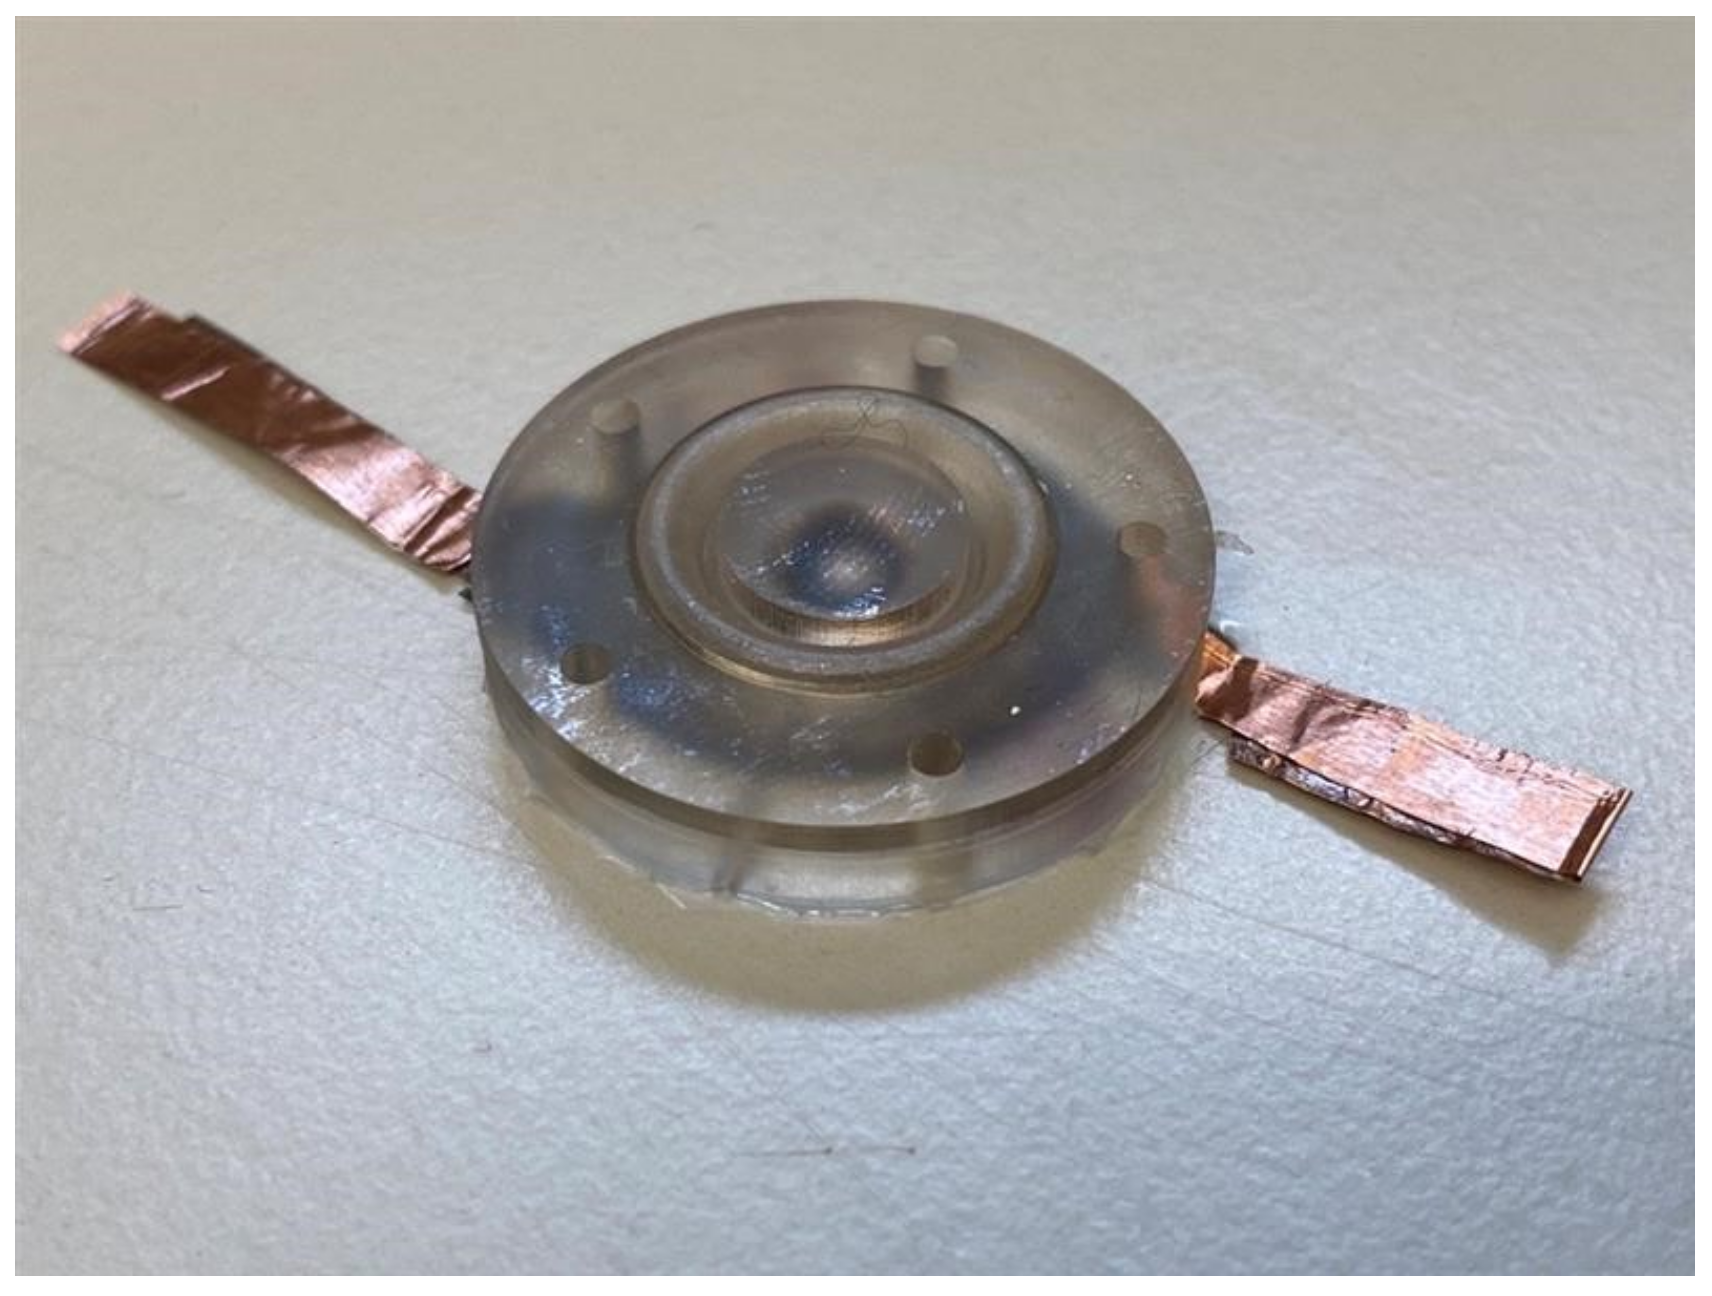
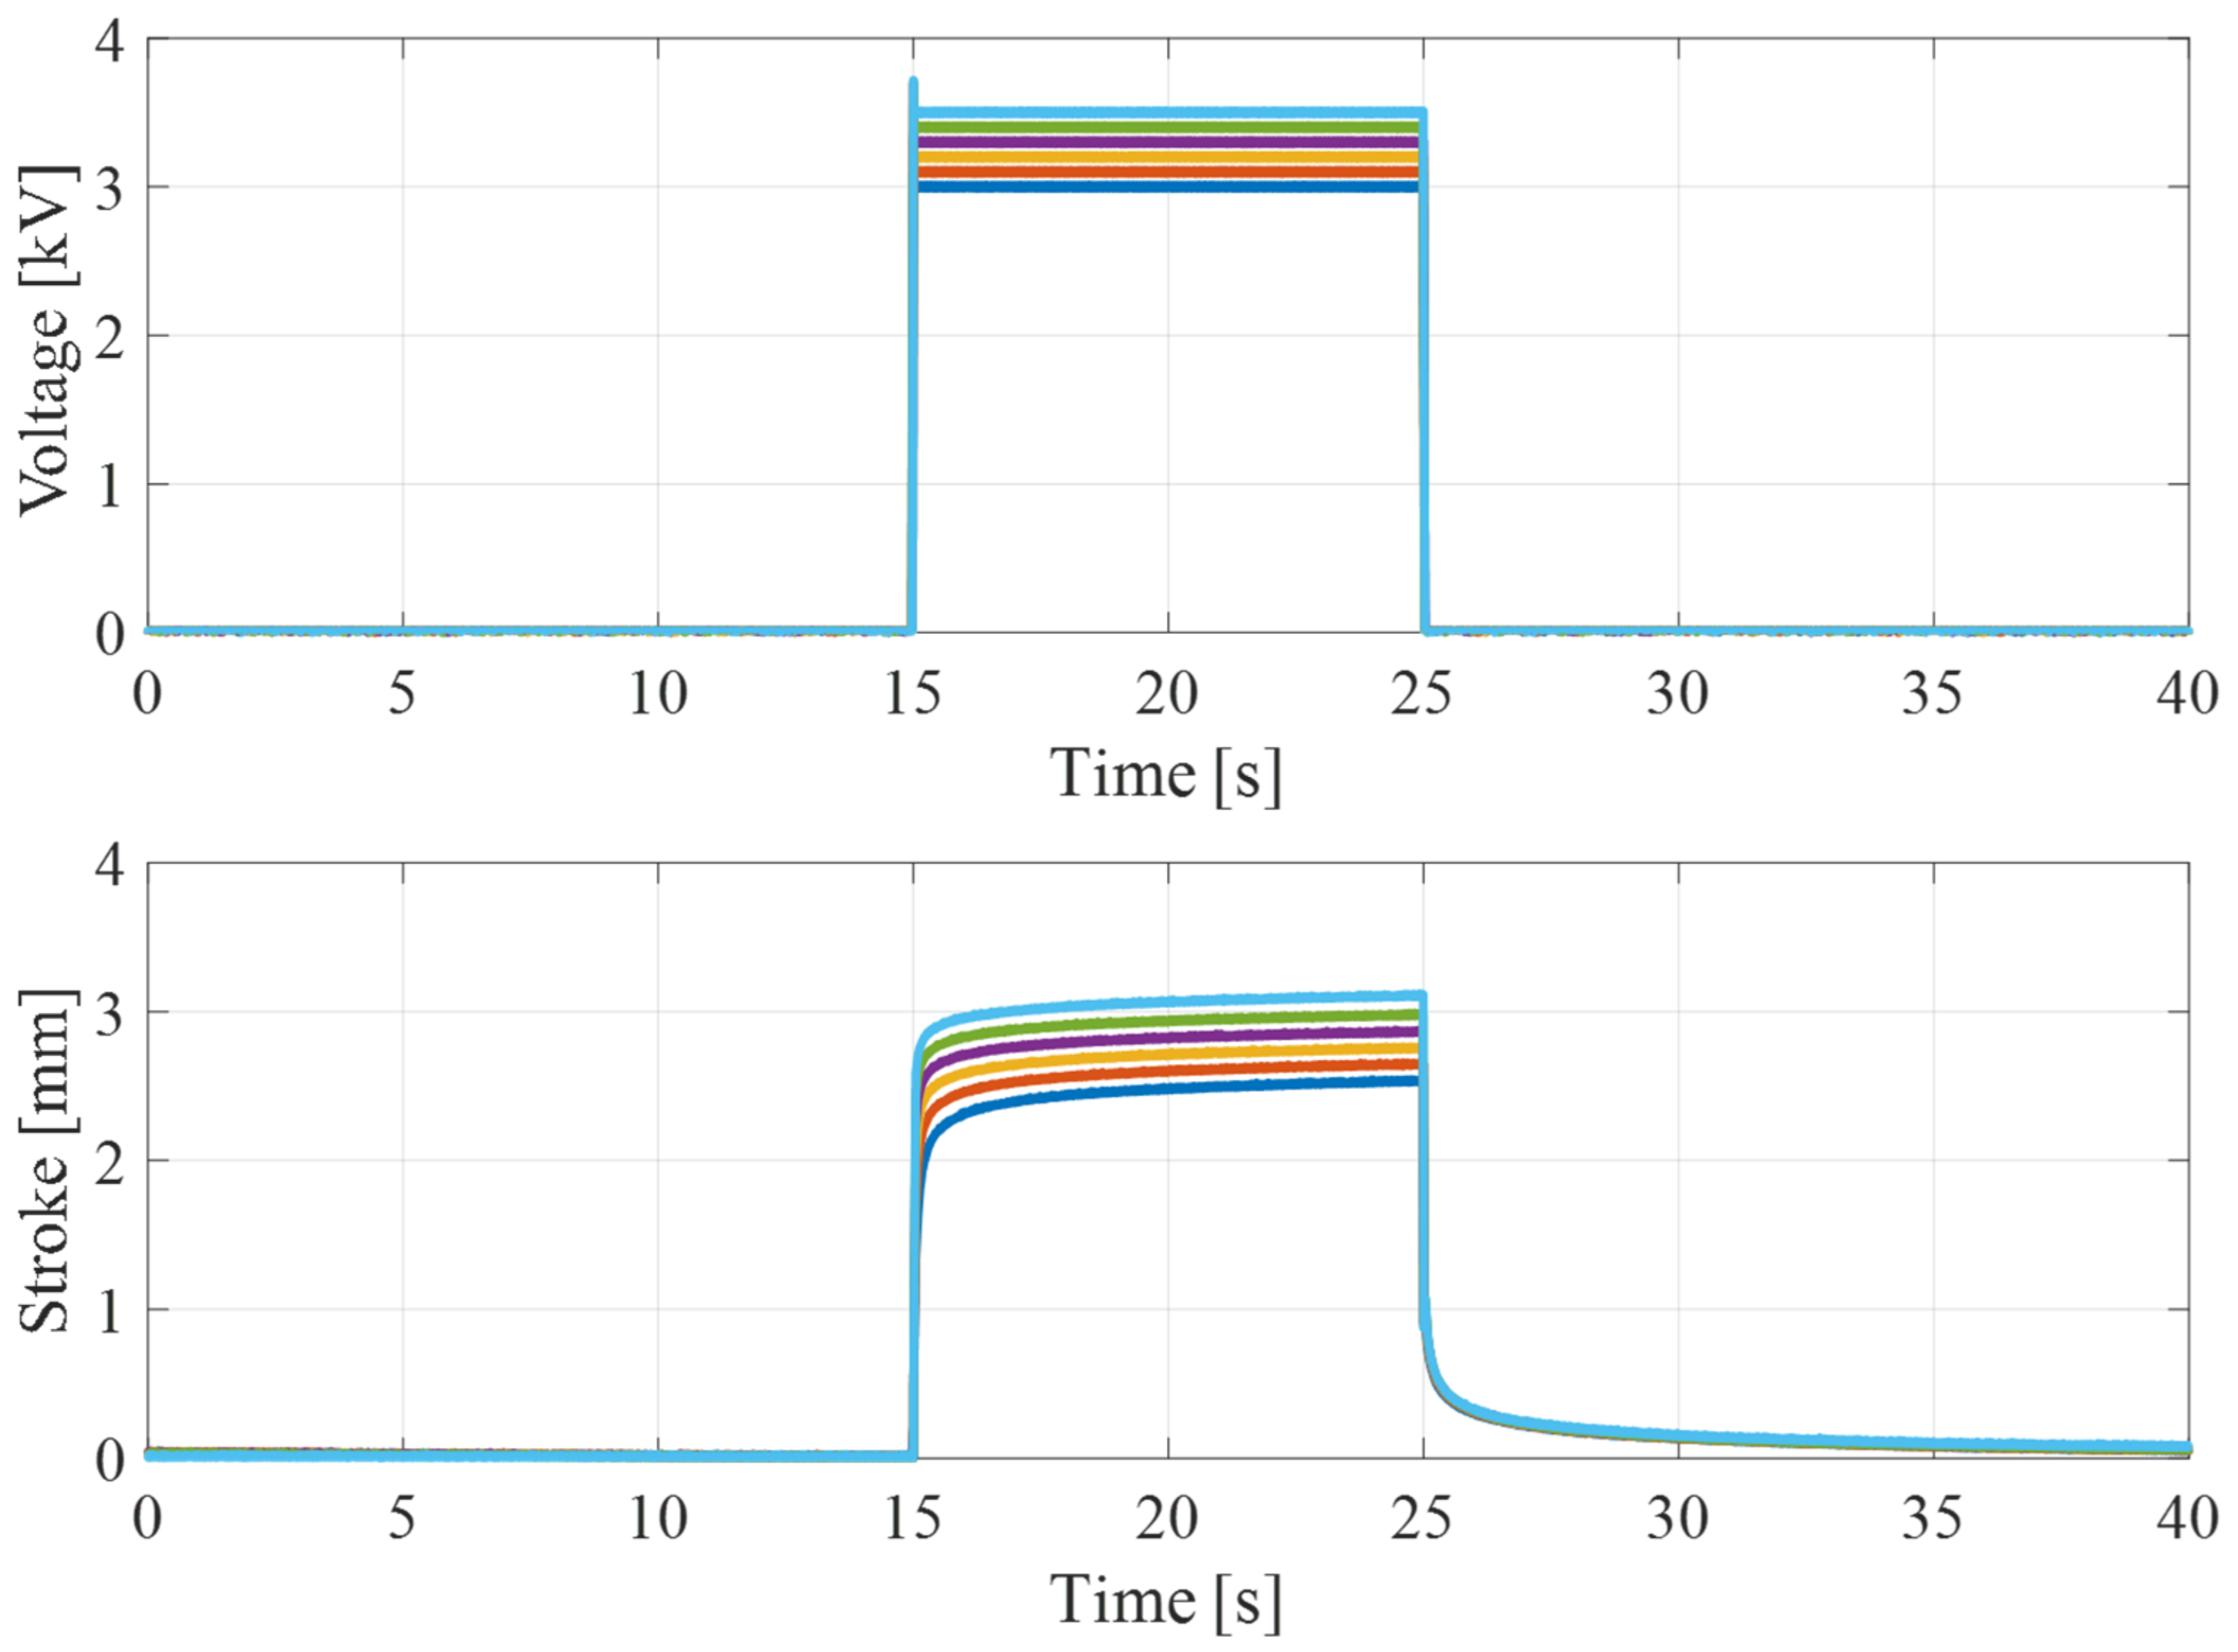
4.1. Dome Experimental Characterization Process

Prior to parameter identification, an experimental characterization process is carried out on the dome, in order to obtain a dataset of repeatable force–displacement measurements. The dome is made with a WACKER SILGel® 612 EH silicone [50], through a process of casting into 3D-printed molds. The experiments are conducted by deforming the flat upper part of the dome with a 0.1 Hz sinusoidal displacement, via an indenter connected to a linear actuator (Aerotech, Inc., Model: ANT-25LA). During the deformation, the force is acquired via a load cell (ME-Meßsysteme GmbH, KD40s). In this way the force–displacement characterization curve of the dome is obtained. Due to the tolerances of the 3D printer for mold manufacture and the manual mixture of the silicone used for the domes, several batches representative of the same geometry but made with different molds are created. In this way, it is possible to quantify the reliability and repeatability of the experimental curves, which will be included in the dataset shown in the next section. For further details regarding the experimental characterization of the dome, please refer to [38].

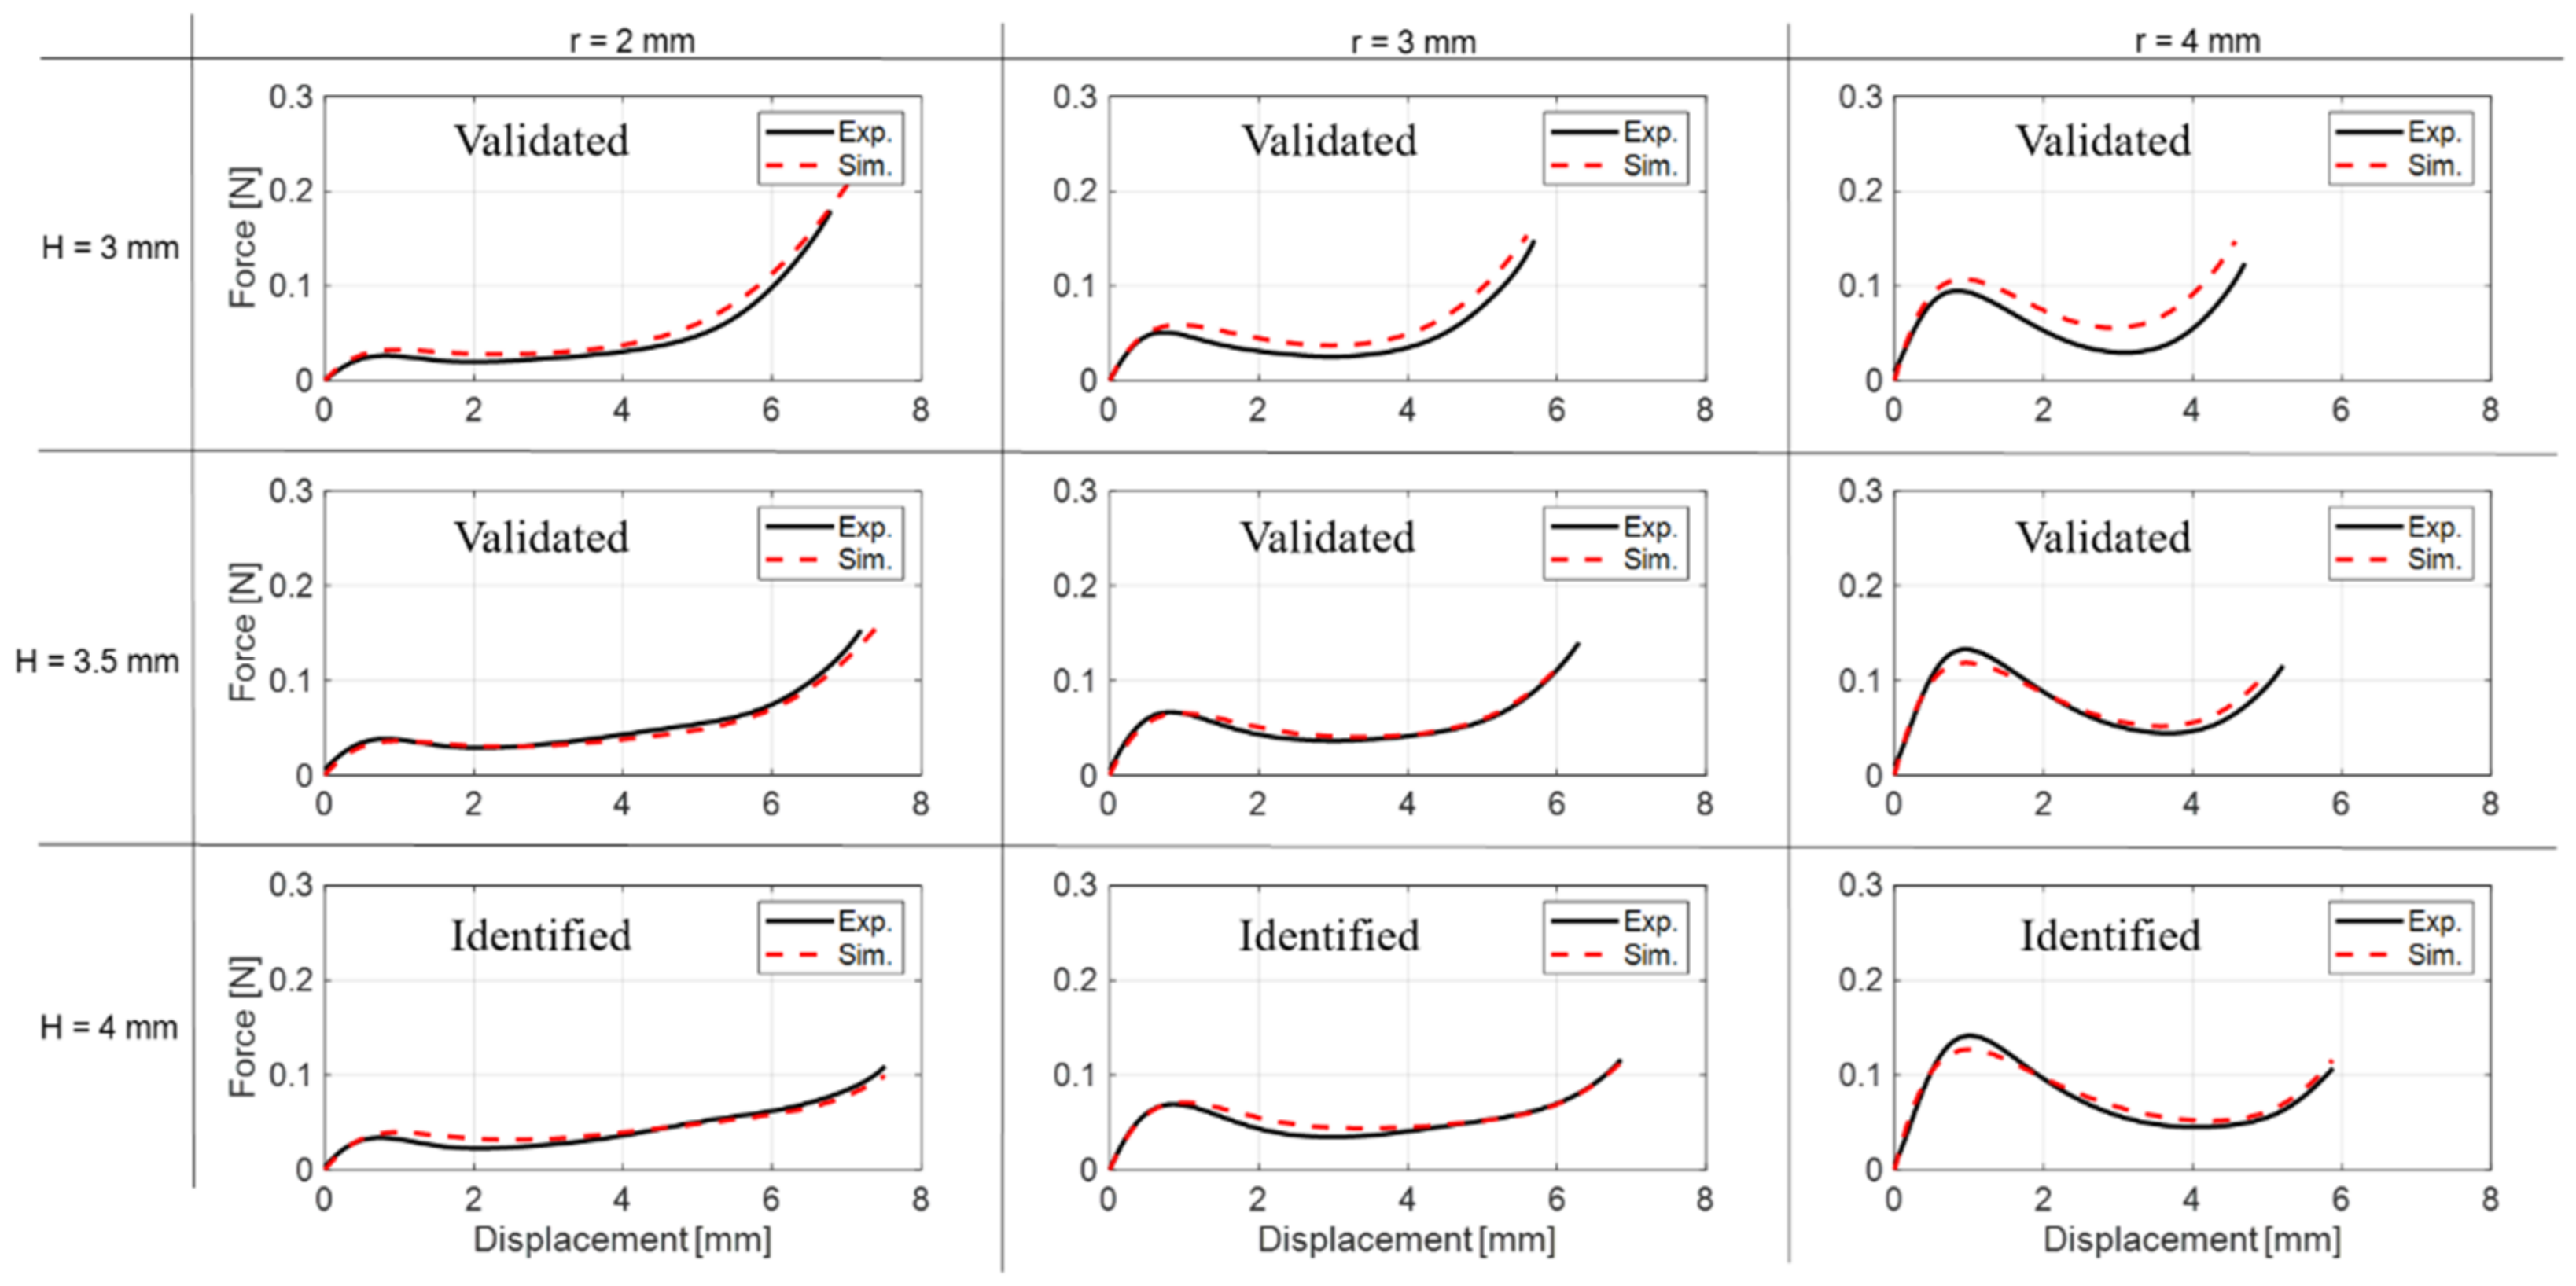
4.2. Dome Identification and Validation

The goal of the experimental identification consists of finding the material parameters which allow reproduction of a selected subset of the experimental results. The unknown parameters are essentially the Yeoh constitutive coefficient ci0, the bulk modulus κ, as well as the rounding parameters A1, A2, A3 introduced for numerical robustness purpose (see Section 3.2 for details). Clearly, the numerical values of those coefficients are chosen identically for each dome geometry. Once the constitutive parameters are known, we can use the model to reproduce the experimental trends obtained for different geometric configurations of the dome structure, in order to make reliable and accurate predictions about its behavior.
Calibration of all parameters is performed based on a repeatable set of experimental data, characterized through a procedure described in the previous section. The considered dataset contains force–displacement characteristic curves for different dome geometric configurations, built through different combinations of H and r values (cf. Figure 10). The measured force–displacement curves exhibit a moderate hysteresis, which is due to the polymeric material viscoelastic behavior. As this paper represents the first attempt at model-based dome optimization for DEA systems, we decided to neglect hysteresis modeling due to its high numerical complexity (as stated in Section 3). Such a hysteresis introduces a continuous range of possible intersections between the DE and bias curves (recall the argument in Section 2.2). Among all those values, the system naturally choses the equilibrium position which minimizes the motion range and, in turn, the actuation stroke. Therefore, we expected that neglecting the hysteresis will produce an overestimation of the true performance. Keeping this aspect in mind, the original dataset is post-processed by replacing the experimental characteristic curves with interpolating polynomial functions. The corresponding experimental curves are shown as solid black lines in Figure 13. Table 1 provides an overview of the considered geometric values, and how the dataset is split for the calibration and validation steps. The different values of H are chosen according to a preliminary investigation carried out by Madhukar et al. [36], thus resulting in a final height of the dome that ensures a monostable behavior. The range for r, instead, is chosen in such a way to match the inner radius of the experimental DE [38]. Note that 3 experiments are used for calibration and 6 for validation, respectively.
Subsequently, the optimization module integrated in COMSOL is used for identifying the structure parameter. The Nelder–Mead optimization method is set internally, i.e., a gradient-free algorithm able to remesh the whole structure as the geometric parameters change, allowing automatic testing of different material parameter values for different model configurations [48]. The output of this step consists of those parameter values that minimize the overall variance between the experimental and simulated curves. The resulting values of the identified optimal parameters are reported in Table 2.
Afterwards, simulations of the entire dataset are performed based on the calibrated material parameters, and the results are shown as dashed black lines Figure 13. Note that a wide variability is observed among the considered experimental curves, especially concerning the shape of the negative stiffness region. Therefore, we conclude that changing both H and r represents a feasible and effective way to arbitrarily shape the characteristic curve of the dome. This fact will be of fundamental importance when optimizing the dome geometry for a given DE, as we will see in the subsequent section. Figure 13 further shows that the model allows reliable prediction of the effects of changes in geometry in each case, as the validation process describes the trend of the curves with remarkable accuracy. In particular, an average error between simulations and experiments of less than 5% is observed. We recall that our model is built upon an axial symmetry assumption. Despite that manufacturing tolerances may induce axial asymmetries in the experimental dome, the high accuracy of our predictions seems to confirm that such effects are indeed negligible. Small deviations (observed, e.g., for the H = 3 mm, r = 4 mm case) are reasonably due to manufacturing tolerances and misalignments. As a result, we conclude that our model represents an effective tool to foresee how the dome geometry affects the shape of the resulting mechanical characteristic curve.

5. Dome Design Optimization and Experimental Validation

This section provides a description of the proposed optimization procedure for the dome geometry. In this way, the stroke-optimal design configuration can be computed without the need of manufacturing several prototypes in a trial-and-error fashion. As discussed in Section 2, the intersection points between the dome force–displacement curve and the DE membrane characteristics determine the stroke of the system. To further illustrate this aspect, we consider the curves shown in Figure 14. The DE curves correspond to the ones of the experimental prototype, while a fictious black line is used to represent the bias. When switching the DE voltage from 0 kV to 3.5 kV, the DE equilibrium position switches between points A and B (cf. Figure 14). Note that the particular shape of the bias in Figure 14 is conveniently chosen in such a way to lead to a large actuation stroke. Therefore, it represents a target behavior for an optimal biasing element. In case of the considered biasing domes, this target biasing line shall be interpreted as an approximation of the overall force–displacement characteristics, more specifically of the unstable branch. The goal of the model-based design consists thus in matching the unstable portion of the dome curve as close as possible to the ideal linear behavior.
In general, an ideal biasing curve can be specified through the location of intersection points A and B, such that the line connecting them results in a large actuation stroke and, at the same time, does not intersect the DE curves multiple times. This target behavior can be described via four independent pieces of information, i.e., the coordinates of points A = (Ax, Ay) and B = (Bx, By). These variables can be uniquely related to the following performance measures, which allow equivalently describe the target biasing curve in Figure 14 in a more intuitive way:
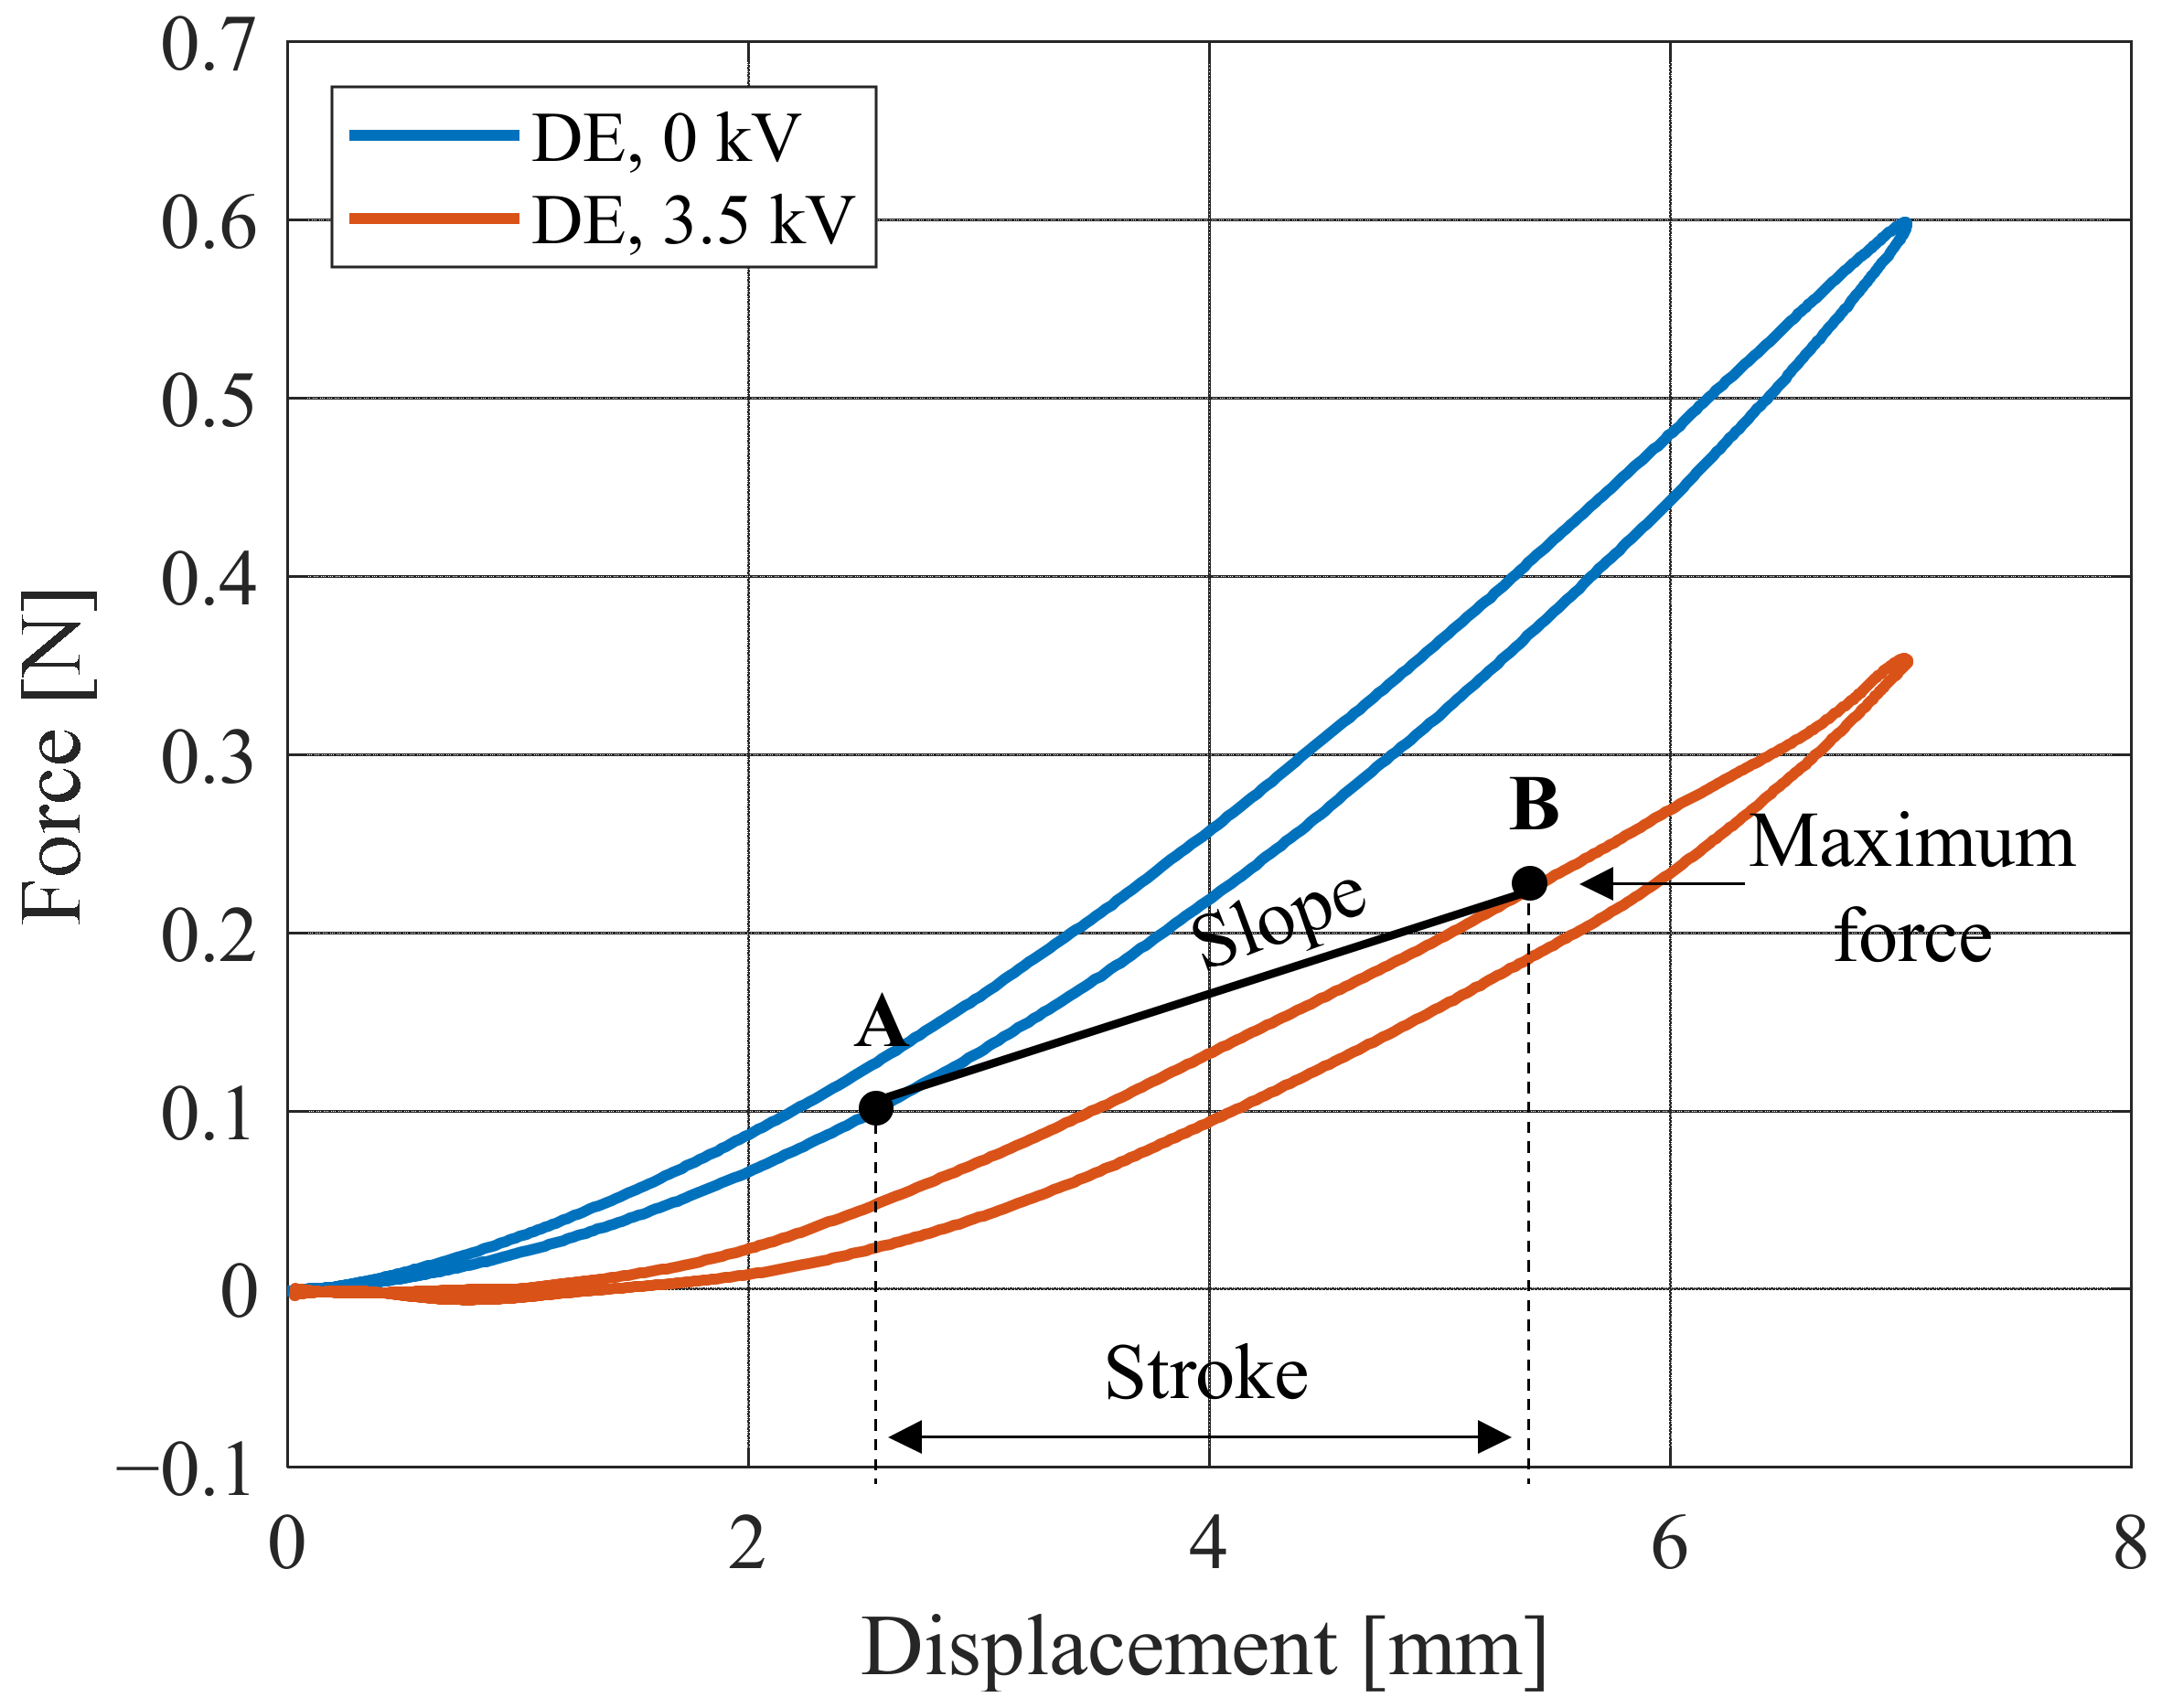
  • Stroke, computed as the distance between states A and B along the x-axis, i.e., Bx − Ax;
  • Slope, defined as the angular coefficient of the line connecting equilibrium points A and B, i.e., (By − Ay)/(Bx − Ax);
  • Maximum force, defined as By;
  • Horizontal shift, defined as a constant offset applied to both Ax and Bx.
Out of these four quantities, the horizontal shift can be easily modified by changing the relative distance between DE and dome, e.g., by connecting them with spacers of different lengths. The remaining three parameters, on the other hand, must be determined by properly designing the dome characteristics through geometry optimization. As a final remark, we recall that the real-life domes are characterized by a small, yet nonzero hysteresis, which is not included in our model. Therefore, for design tolerance purpose, it is convenient not to let the target biasing curve match the DE curves too tightly.

5.1. Optimal Parameter Selection

The aim of this section is to find the optimal dome geometry which, starting from desired stroke, slope, and maximum force values, finds the optimal dome geometry which allows as close as possible approximation of the desired behavior. H, r, and t represent the geometric parameters that mostly affect the dome force–deformation curve (cf. Figure 10), thus they will be considered for the following optimization study.
As a first step, we formally define three functions which, given as input the dome geometry, return the desired performance parameters:
stroke = f 1 ( H , r , t ) slope = f 2 ( H , r , t ) maximum   force = f 3 ( H , r , t )
In principle, to solve (3) one should be able to freely modify all three geometric parameters. While changes in H and r can be predicted accurately by means of our FE model, the reliability for different values of t has not been investigated. This is mainly due to the practical difficulty of designing domes with different values of t, based on our manufacturing process. Therefore, we decide to keep it fixed at t = 0.6 mm (the same value used during identification) and optimize for H and r only. By considering (3) with t = 0.6 mm, and manipulating the equations under the assumption that invertibility conditions formally hold, we obtain the following system:
H = g 1 ( stroke , slope ) r = g 2 ( stroke , slope ) maximum   force = g 3 ( stroke , slope )
Thus, the values of H and r can be obtained based on the target values of stroke and slope only, while the corresponding value of the maximum force is implied by the design. The major drawback of the proposed approach is that we have no complete freedom in freely design stroke, slope, and maximum force, but we must somehow find an approximated solution for the design problem. On the other hand, working with two free parameters allows us to exploit graphical intuition to accomplish the design, as well as to simplify the numerical computation. As we will see in the following, the adopted compromise does not represent a practical issue for the design of our optimal dome geometry.
The steps needed to develop the design optimization algorithm are now summarized in the following:
  • The calibrated FE model (described in the Section 4) is used to realize a dataset of simulated force-strain curves for different dome geometries. For the considered case study, the ranges of H and r are chosen in a physically meaningful way as follows: H ∈ [3, 5], r ∈ [2, 4];
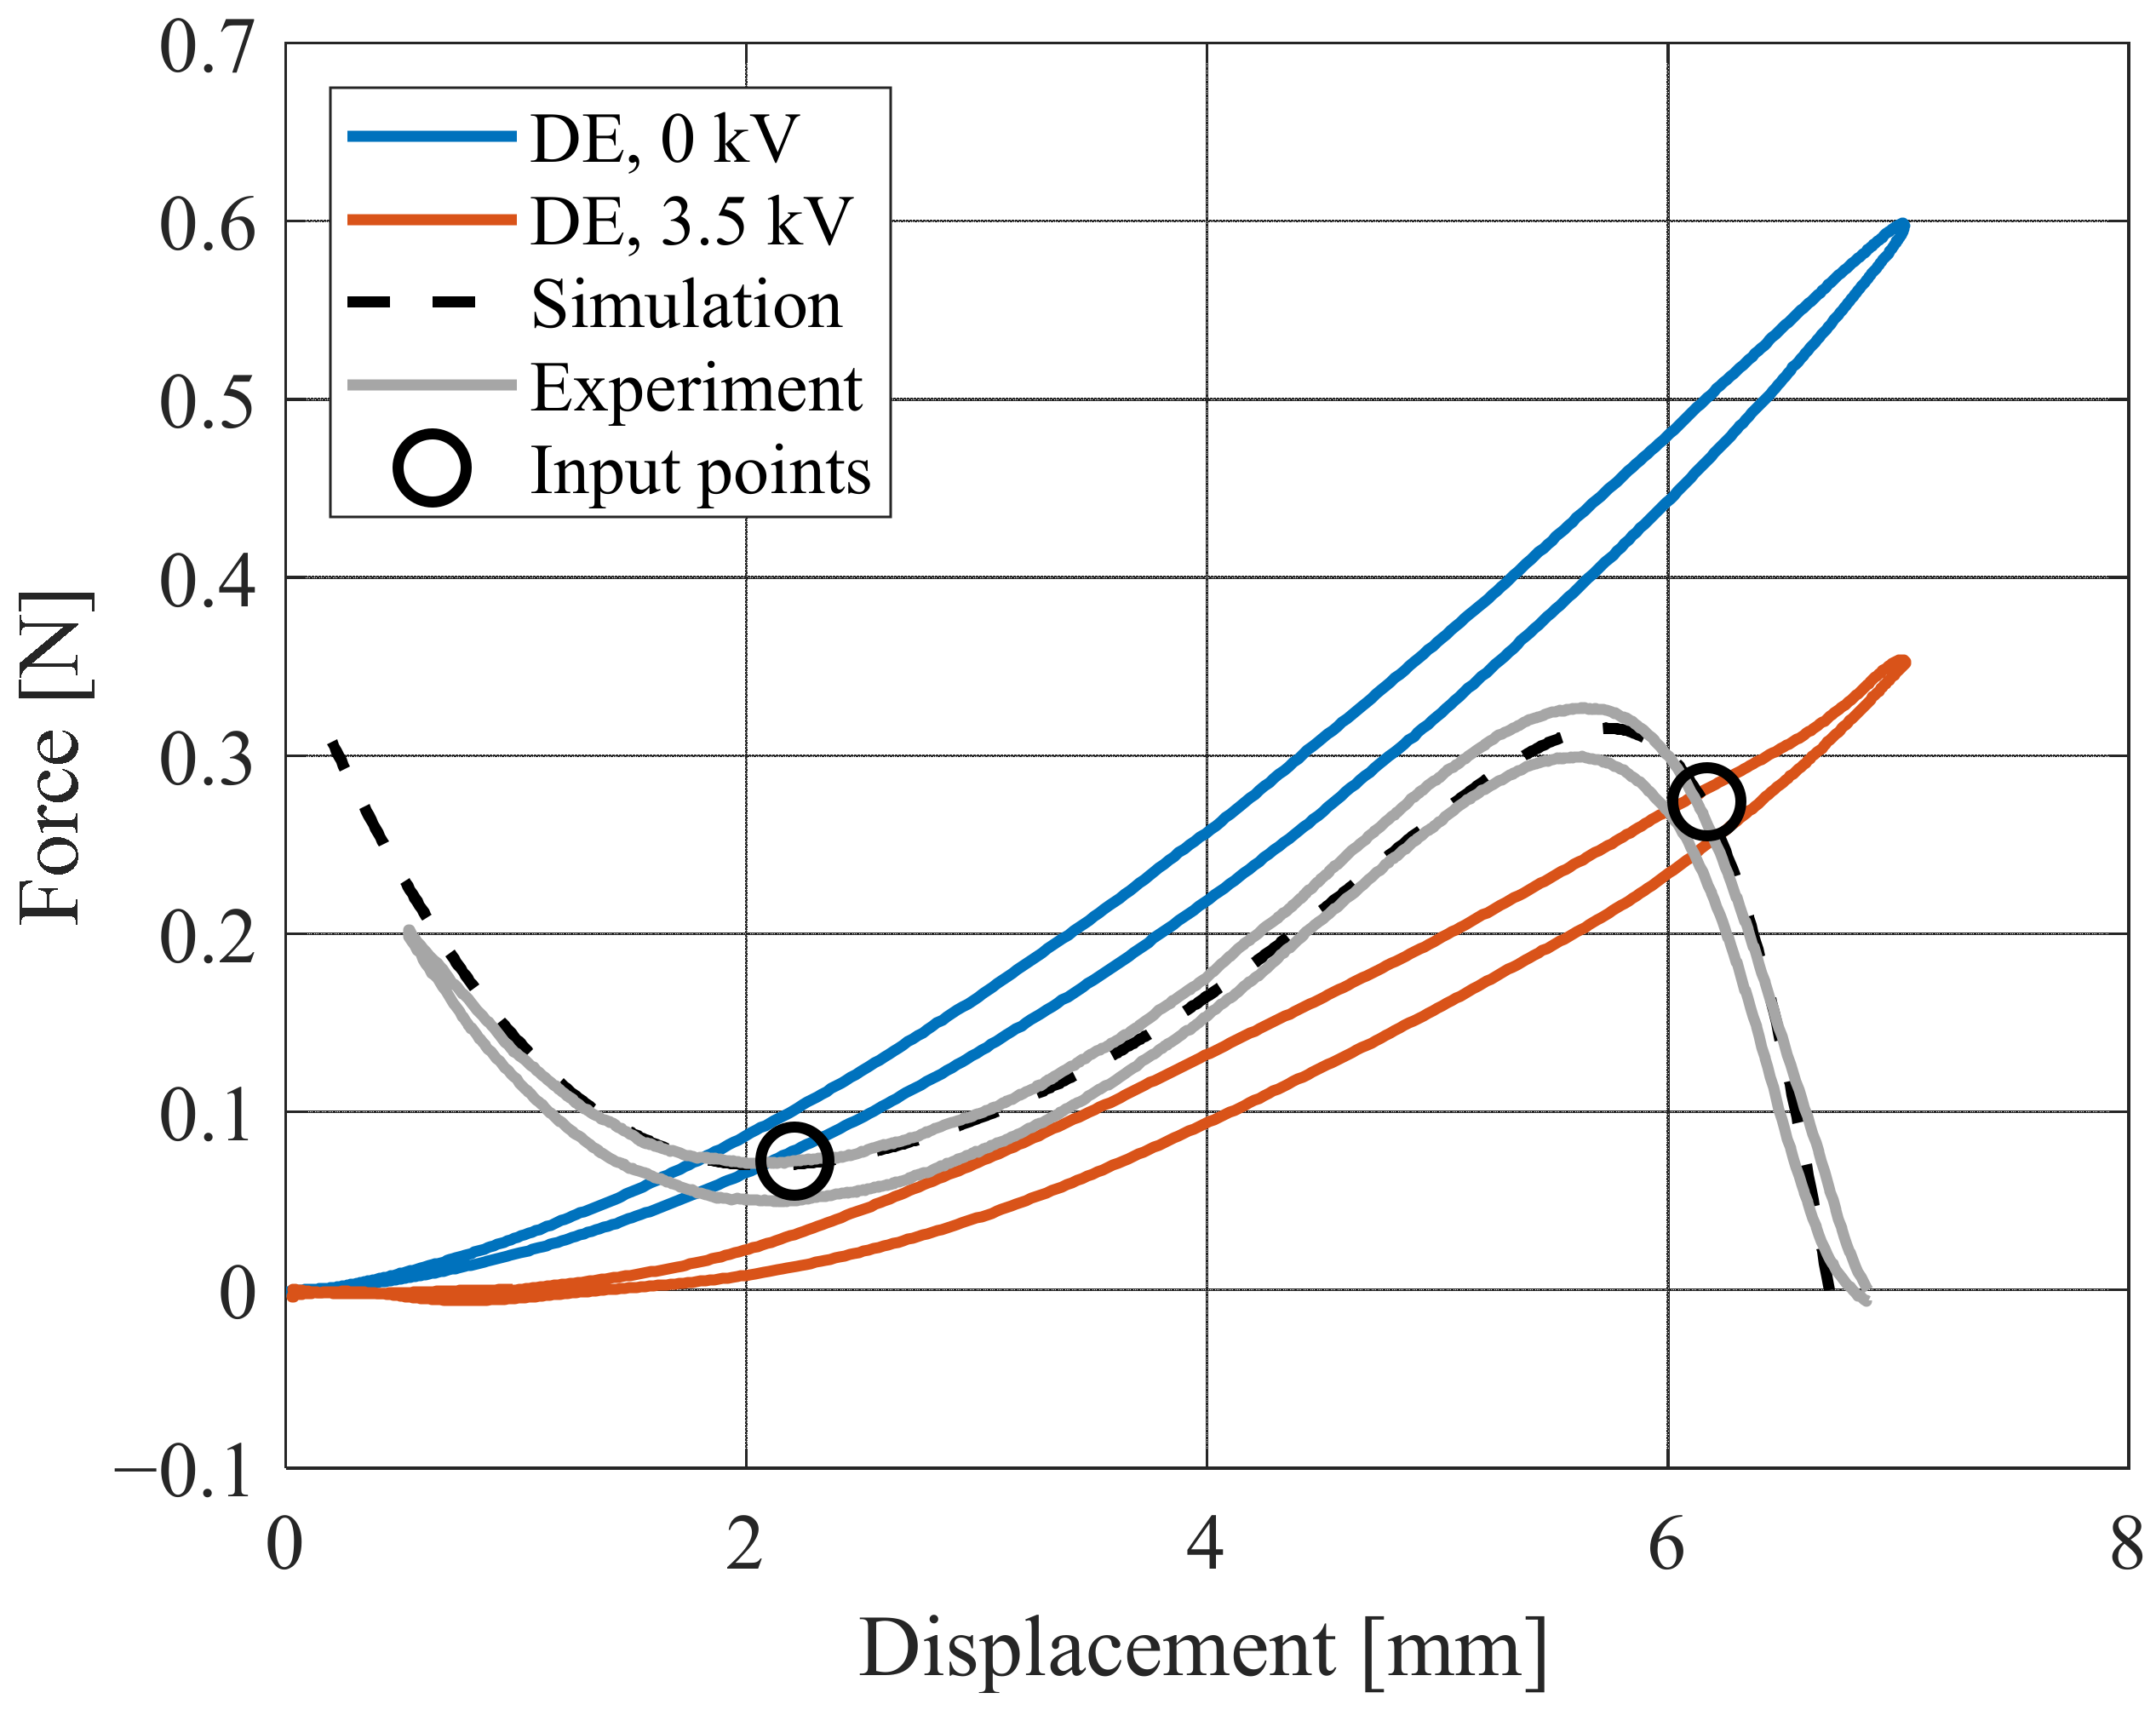
  • The entire design algorithm is implemented in MATLAB®, based on the obtained simulation dataset. For each simulated force-strain curve, the minimum and maximum force points defining the unstable branch of the dome characteristic are calculated and collected, in order to determine corresponding slope, stroke, and maximum force. Those minimum and maximum points are therefore considered as representatives of A and B, where the intersection with the DE characteristic curves occurs;
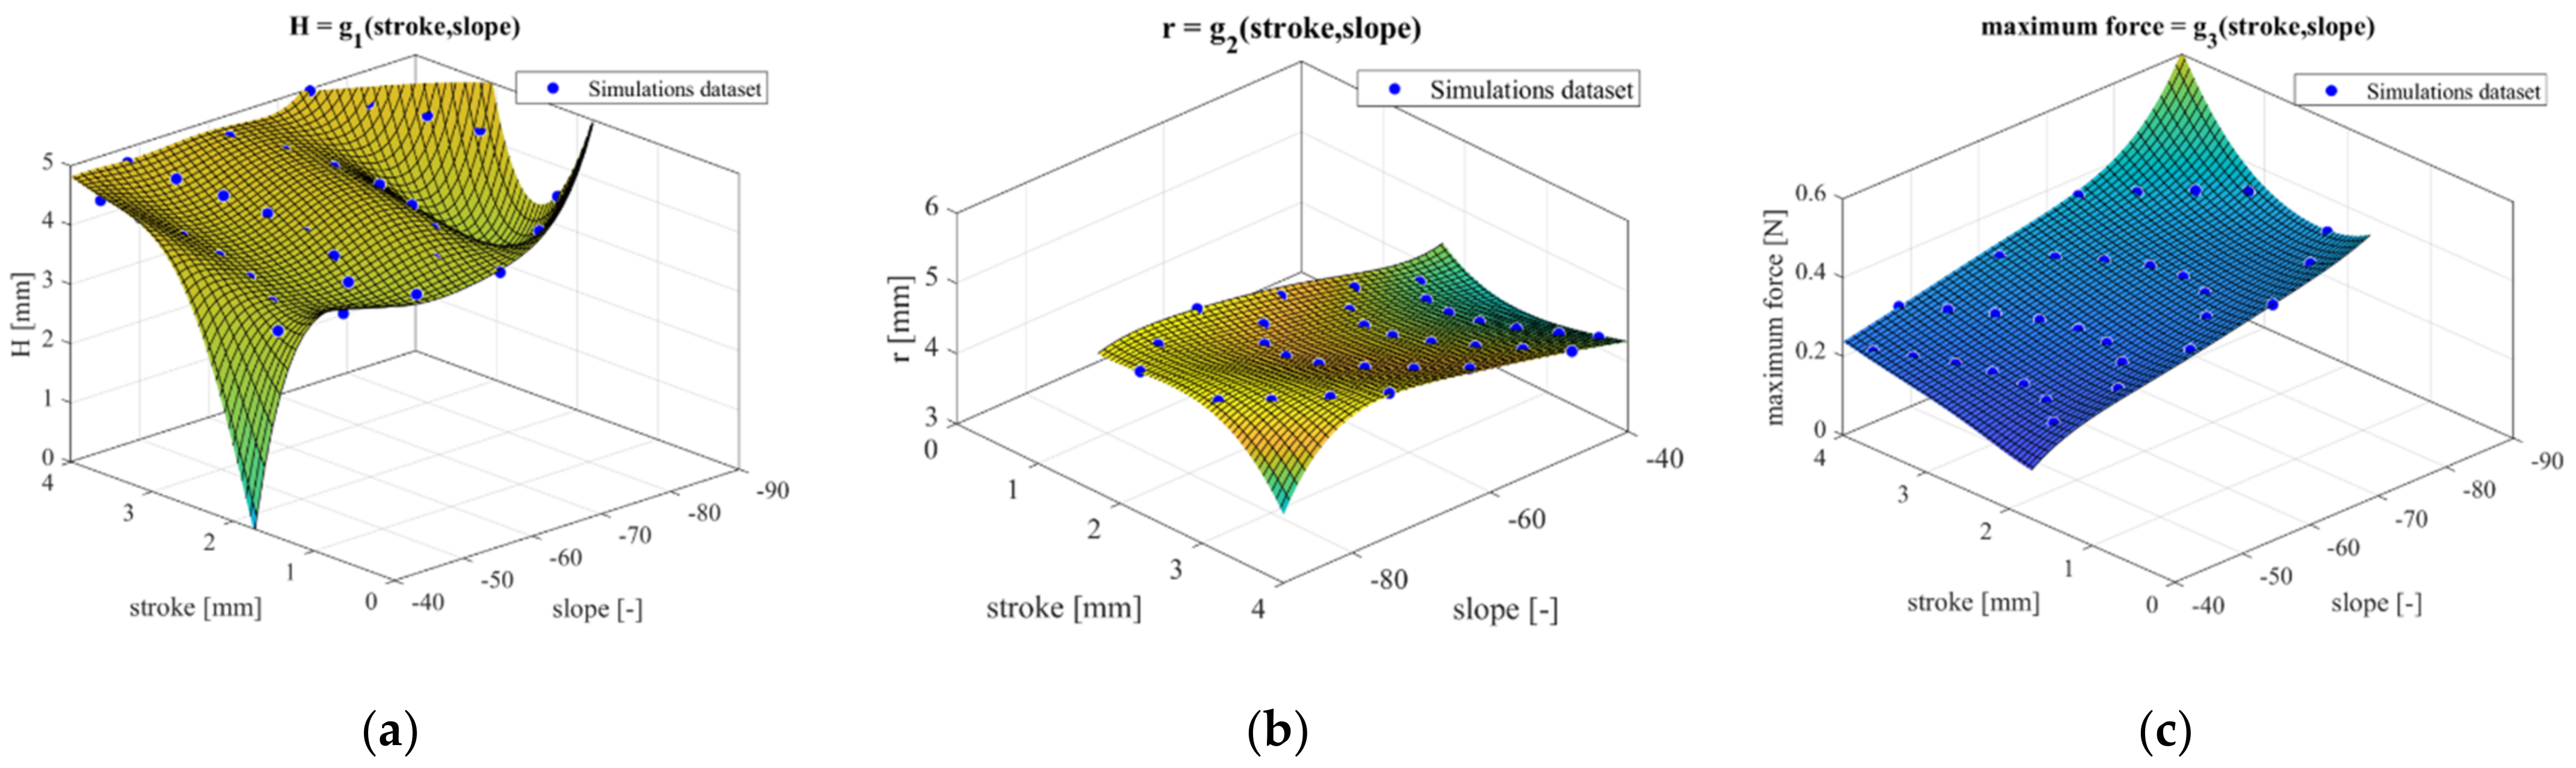
  • Surface fitting functions are generated to express H, r, and maximum force as a function of the stroke and slope, based on the computations performed in the previous step. Resulting functions H = g1(stoke, slope), r = g2(stoke, slope), and maximum force = g3(stoke, slope) are shown in Figure 15. As it can be seen, such surfaces allow unique determination of H, r, and the maximum force, once the target stroke and slope are known.
The choice to create surface fitting functions, rather than multidimensional lookup tables, is motivated by the need of increasing the computational efficiency, in conjunction with the low impact on memory storage of the former over the latter.

5.2. Design Optimization Algorithm

In this section, the steps required to develop an optimized DEA based on the above model-based procedure are reported:
  • Select a target DE membrane, and characterize it experimentally under quasi-static conditions in order to obtain the characteristic curves for minimum and maximum applied voltage;
  • Based on the obtained DE curves, estimate an ideal biasing behavior, and compute the coordinates of the corresponding intersection points A and B (cf. Figure 14);
  • Based on the coordinates of A and B, determine the desired stroke, the slope, and the maximum force values, i.e., the features that must be satisfied by the dome force–displacement curve in order to ensure the desired performance;
  • If the maximum force is not satisfactory, one can eventually start again rom point 2 and try different combinations of stroke and slope values, until an overall desirable behavior is obtained.
The output of the above procedure consists of the optimal values for H and r, which allows reproduction of a dome curve that reflects the target behavior.

5.3. Design Procedure Validation

For a better understanding of the working principle, and to verify the reliability of the design optimization algorithm, a design case study is presented in this section. The considered DE membrane is the same as the one described in Section 2. Starting from the measured COP-DEA characteristic curves (depicted in blue and red for low and high voltage, respectively), we define the desired intersection points (marked with black circles), which lead to a desired stroke of 3.6 mm. These points are then used to generate inputs for the design algorithm, which leads optimal geometry values equal to H = 4.6 mm and r = 4.8 mm. Note that those value fall outside the calibration and validation dataset shown in Figure 13, thus the optimal design relies on an extrapolation performed by our model.
Based on the obtained geometric parameters, the optimal dome characteristic curve is estimated via an FE simulation, which is depicted as a dashed black curve in Figure 16. It can readily be observed that the design goal is successfully achieved, as the simulated dome curve intersects those of the DE in the desired points initially defined. This is true despite only two free parameters have been optimized (instead of three), thus confirming the validity of the proposed approach. Based on the curves in Figure 16, a theoretical stroke of 3.8 mm can be predicted. To quantify the reliability of the design, a dome with the optimal geometry is experimentally assembled and characterized. The result is shown as a solid gray curve in Figure 16. Comparing the experimental force-deflection curves with the simulated one, we conclude that the measured curve tightly matches the simulated, thus confirming the accuracy of our model.
The optimal dome is then coupled with the DE membrane and used to manufacture a complete actuator system. A picture of the assembled DEA device is shown in Figure 17. Manufacturing and assembly are performed similarly to [38]. In particular, before assembly, the electrical connections to the metal electrodes are achieved through a copper tape. Then, a double-sided tape cut with a cutting machine is used to couple the optimal polymer dome with the DE membrane. The assembly is performed through the use of 3D-printed tools, thus avoiding manual positioning and allowing improvement in the accuracy. As the DE is controlled with high voltage, it has been placed underneath the insulating dome in order to operate in total safety.
After completing the actuator manufacturing, an electro-mechanical characterization is performed with the aim of evaluating the stroke achieved for different input voltage signals. The motion of the DEA flat top is measured through a Laser (Keyence, model: LK-G87), while the analog voltage output of the voltage amplifier is monitored through NI LabVIEW module (PXI-7852). A first set of tests is conducted by considering a constant voltage step, which is applied for a total duration of 10 s. Several steps are considered, each one ranging from 0 kV up to a different maximum value ranging from 3 kV to 3.5 kV, with steps of 0.1 kV. The minimum voltage is set to 0 kV, as it corresponds to zero actuation force, while the maximum voltage value is limited by the dielectric breakdown field strength (i.e., EDE = [80–100] V/µm) [46]. The results are shown in Figure 18. For the maximum voltage, a stroke of about 3.1 mm is observed. This quantity is smaller than the theoretical value of 3.8 mm predicted with the graphical method, possibly due to unavoidable tolerances, misalignments, and inaccuracies occurring during the manufacturing process.
Nevertheless, the obtained stroke is still remarkably high, thus confirming the effectiveness of our design approach. Note that, a different amount of stroke is obtained by changing the voltage amplitude, thus confirming the possibility of using the developed DEA as a proportional actuator. Further experiments are conducted by considering sinusoidal voltage waveforms having frequency of 0.1 Hz and different amplitudes, ranging from 3 kV to 3.5 kV with steps of 0.1 kV. The resulting voltage and displacement over time are shown in Figure 19, while the corresponding displacement over voltage curves are reported in Figure 20. A maximum stroke of about 3.1 mm is observed also in this case. Additionally, note that the displacement-voltage curves exhibit a hysteretic behavior, which is mainly caused by the bi-stability of the dome NBS, rather than from polymer viscoelasticity. Such hysteresis is commonly observed in NBS-DEA systems and is a direct consequence of the same mechanism which leads to the large stroke performance.

6. Discussion and Future Developments

A new model-based design procedure for soft and large stroke DEAs has been presented in this work. Specifically, a novel soft actuator design is proposed based on a DE membrane combined with a polymeric biasing dome. The special mechanical characteristics of this type of biasing element allow development of large-stroke DEA systems, without introducing rigid components in the design. First, an FE model of the dome has been described, identified, and experimentally validated. Based on the obtained model, a design optimization algorithm has been developed, which allows finding of the optimal dome geometry that leads to a DEA stroke maximization. The developed procedure has finally been used to manufacture an optimized DEA prototype. The optimal geometry found for the dome allowed us to achieve a stroke of 3.1 mm, which is remarkably high for the considered type of COP-DEA.
In addition, Table 3 provides an overview of the maximum strokes, normalized over the undeformed membrane length, achieved with different bias elements investigated in the literature. The chosen references are the works by Loew et al. [34] and Hodgins et al. [29], which deal with various biasing systems based on PBS, permanent magnets, and NBS + PBS combinations. By comparing the normalized strokes obtained in these works with the value given by our polymeric dome, a remarkably higher performance can be seen. In particular, our dome outperforms the maximum stroke of the NBS + PBS by a factor higher than 1.5, making it the most effective type of NBS so far.
Future developments will involve dynamic studies of the presented model, including identification of hysteresis occurring in the force–deformation characteristic curve, in order to improve the matching between model predictions and the experimental performance.
Moreover, the background work presented in this paper will be extended by coupling micro-layers of polymer domes with micro-layers of flexible DEA membranes, such that a matrix of cooperative actuators able to perform complex tasks can be achieved. The fully polymeric dome will be used for wearables and soft robotics applications, thanks to its low power consumption and performance that remains unchanged even in bending configuration. A new generation of cooperative micro-scale actuators, such as haptic systems, wearable loudspeakers, and microconveyors, will then be developed based one resulting DE-dome systems.

Author Contributions

Conceptualization, methodology, software, validation, formal analysis, investigation, resources, S.C.; data curation, S.C., J.N. and J.H.; writing—original draft preparation, S.C.; writing—review and editing, visualization, supervision, G.R.; project administration, funding acquisition, S.S., G.S. and G.R. All authors have read and agreed to the published version of the manuscript.

Funding

This research was funded by Deutsche Forschungsgemeinschaft (DFG, German Research Foundation), Priority Program SPP 2206 “Cooperative Multistage Multistable Microactuator Systems” (Projects: RI3030/2-1, SCHU1609/7-1, SE704/9-1).

Institutional Review Board Statement

Not applicable.

Informed Consent Statement

Not applicable.

Conflicts of Interest

The authors declare no conflict of interest. The funders had no role in the design of the study; in the collection, analyses, or interpretation of data; in the writing of the manuscript, or in the decision to publish the results.

References

  1. Carpi, F.; de Rossi, D. Dielectric Elastomers as Electromechanical Transducers; Elsevier: Amsterdam, The Netherlands, 2008. [Google Scholar]
  2. Lau, G.K.; La, T.G.; Foong, E.S.W.; Shrestha, M. Stronger multilayer acrylic dielectric elastomer actuators with silicone gel coatings. Smart Mater. Struct. 2016, 25, 125006. [Google Scholar] [CrossRef]
  3. Rosset, S.; Ararom, O.A.; Schlatter, S.R.H. Shea Fabrication process of silicone-based dielectric elastomer actuators. J. Vis. Exp. 2016, 2016, 53423. [Google Scholar] [CrossRef] [Green Version]
  4. York, A.; Dunn, J.; Seelecke, S. Experimental characterization of the hysteretic and rate-dependent electromechanical behavior of dielectric electro-active polymer actuators. Smart Mater. Struct. 2010, 19, 094014. [Google Scholar] [CrossRef]
  5. Pelrine, R.E.; Kornbluh, R.D.; Joseph, J.P. Electrostriction of polymer dielectrics with compliant electrodes as a means of actuation. Sens. Actuators Phys. 1998, 64, 77–85. [Google Scholar] [CrossRef]
  6. Sahu, R.K.; Saini, A.; Ahmad, D.; Patra, K.; Szpunar, J. Estimation and validation of maxwell stress of planar dielectric elastomer actuators. J. Mech. Sci. Technol. 2016, 30, 429–436. [Google Scholar] [CrossRef]
  7. Hoffstadt, T.; Maas, J. Self-Sensing Control for Soft-Material Actuators Based on Dielectric Elastomers. Front. Robot. AI 2019, 6, 133. [Google Scholar] [CrossRef] [Green Version]
  8. Rizzello, G.; Naso, D.; York, A.; Seelecke, S. A Self-Sensing Approach for Dielectric Elastomer Actuators Based on Online Estimation Algorithms. IEEE/ASME Trans. Mechatron. 2017, 22, 728–738. [Google Scholar] [CrossRef]
  9. Kornbluh, R.D.; Pelrine, R.; Prahlad, H.; Wong-Foy, A.; McCoy, B.; Kim, S.; Eckerle, J.; Low, T. Dielectric elastomers: Stretching the capabilities of energy harvesting. MRS Bull. 2012, 37, 246–253. [Google Scholar] [CrossRef]
  10. Hill, M.; Rizzello, G.; Seelecke, S. Development and experimental characterization of a pneumatic valve actuated by a dielectric elastomer membrane. Smart Mater. Struct. 2017, 26, 085023. [Google Scholar] [CrossRef]
  11. Linnebach, P.; Rizzello, G.; Seelecke, S.; Seelecke, S. Design and validation of a dielectric elastomer membrane actuator driven pneumatic pump. Smart Mater. Struct. 2020, 29, 075021. [Google Scholar] [CrossRef]
  12. Ghazali, F.A.M.; Mah, C.K.; AbuZaiter, A.; Chee, P.S.; Ali, M.S.M. Soft dielectric elastomer actuator micropump. Sens. Actuators A Phys. 2017, 263, 276–284. [Google Scholar] [CrossRef]
  13. Hosoya, N.; Masuda, H.; Maeda, S. Balloon dielectric elastomer actuator speaker. Appl. Acoust. 2019, 148, 238–245. [Google Scholar] [CrossRef]
  14. Moretti, G.; Rizzello, G.; Fontana, M.; Seelecke, S. A multi-domain dynamical model for cone-shaped dielectric elastomer loudspeakers. In Proceedings of the Electroactive Polymer Actuators and Devices (EAPAD) XXIII Meeting, Online, 22–26 March 2021; Volume 53. [Google Scholar] [CrossRef]
  15. Qu, X.; Ma, X.; Shi, B.; Li, H.; Zheng, L.; Wang, C.; Liu, Z.; Fan, Y.; Chen, X.; Li, Z.; et al. Refreshable Braille Display System Based on Triboelectric Nanogenerator and Dielectric Elastomer. Adv. Funct. Mater. 2021, 31, 2006612. [Google Scholar] [CrossRef]
  16. Qiu, Y.; Zhang, E.; Plamthottam, R.; Pei, Q. Dielectric Elastomer Artificial Muscle: Materials Innovations and Device Explorations. Acc. Chem. Res. 2019, 52, 316–325. [Google Scholar] [CrossRef] [PubMed]
  17. Sîrbu, D.; Moretti, G.; Bortolotti, G.; Bolignari, M.; Diré, S.; Fambri, L.; Vertechy, R.; Fontana, M. Electrostatic bellow muscle actuators and energy harvesters that stack up. Sci. Robot. 2021, 6, eaaz5796. [Google Scholar] [CrossRef] [PubMed]
  18. Carpi, F.; Frediani, G.; Gerboni, C.; Gemignani, J.; de Rossi, D. Enabling variable-stiffness hand rehabilitation orthoses with dielectric elastomer transducers. Med. Eng. Phys. 2014, 36, 205–211. [Google Scholar] [CrossRef] [PubMed]
  19. Almanza, M.; Clavica, F.; Chavanne, J.; Moser, D.; Obrist, D.; Carrel, T.; Civet, Y.; Perriard, Y. Feasibility of a Dielectric Elastomer Augmented Aorta. Adv. Sci. 2021, 8, 2001974. [Google Scholar] [CrossRef] [PubMed]
  20. Zhao, H.; Hussain, A.M.; Israr, A.; Vogt, D.M.; Duduta, D.M.; Clarke, D.R.; Wood, D.R. A Wearable Soft Haptic Communicator Based on Dielectric Elastomer Actuators. Soft Robot. 2020, 7, 451–461. [Google Scholar] [CrossRef]
  21. Gratz-Kelly, S.; Meyer, A.; Motzki, P.; Nalbach, S.; Rizzello, G.; Seelecke, S.S. Force measurement based on dielectric elastomers for an intelligent glove providing worker assessment in the digital production. In Proceedings of the SPIE Smart Structures + Nondestructive Evaluation, Online, 27 April–9 May 2020. [Google Scholar] [CrossRef]
  22. Gu, G.-Y.; Zhu, J.; Zhu, L.-M.; Zhu, X. A survey on dielectric elastomer actuators for soft robots. Bioinspir. Biomim. 2017, 12, 011003. [Google Scholar] [CrossRef]
  23. Wang, L.; Hayakawa, T.; Ishikawa, M. Dielectric-elastomer-based fabrication method for varifocal microlens array. Opt. Express 2017, 25, 31708. [Google Scholar] [CrossRef]
  24. Schmitt, S.; Haeufle, D. Mechanics and Thermodynamics of Biological Muscle—A Simple Model Approach; Springer: Berlin/Heidelberg, Germany, 2015. [Google Scholar]
  25. Ghazali, F.A.M.; Jie, W.Y.; Fuaad, M.R.A.; Ali, M.S.M. Soft dielectric elastomer microactuator for robot locomotion. Bull. Electr. Eng. Inform. 2020, 9, 2286–2293. [Google Scholar] [CrossRef]
  26. Berlinger, F.; Duduta, M.; Gloria, H.; Clarke, D.; Nagpal, R.; Wood, R. A Modular Dielectric Elastomer Actuator to Drive Miniature Autonomous Underwater Vehicles. In Proceedings of the 2018 IEEE International Conference on Robotics and Automation (ICRA) 2018, Brisbane, QLD, Australia, 21–25 May 2018; pp. 3429–3435. [Google Scholar] [CrossRef]
  27. Prechtl, J.; Kunze, J.; Nalbach, S.; Seelecke, S.S.; Rizzello, G. Soft robotic module actuated by silicone-based rolled dielectric elastomer actuators: Modeling and simulation. In Proceedings of the ACTUATOR; International Conference and Exhibition on New Actuator Systems and Applications 2021, Online, 17–19 February 2021. [Google Scholar] [CrossRef]
  28. Christianson, N.N.; Goldberg, D.D.; Deheyn, S.; Cai, M.; Tolley, T. Translucent soft robots driven by frameless fluid electrode dielectric elastomer actuators. Sci. Robot. 2018, 3, eaat1893. [Google Scholar] [CrossRef] [Green Version]
  29. Hodgins, M.; York, A.; Seelecke, S. Experimental comparison of bias elements for out-of-plane DEAP actuator system. Smart Mater. Struct. 2013, 22, 094016. [Google Scholar] [CrossRef]
  30. Hodgins, M.; York, A.; Seelecke, S. Modeling and experimental validation of a bi-stable out-of-plane DEAP actuator system. Smart Mater. Struct. 2011, 20, 094012. [Google Scholar] [CrossRef]
  31. Hau, S.; Bruch, D.; Rizzello, G.; Motzki, P.; Seelecke, S. Silicone based dielectric elastomer strip actuators coupled with nonlinear biasing elements for large actuation strains. Smart Mater. Struct. 2018, 27, 074003. [Google Scholar] [CrossRef]
  32. Follador, M.; Cianchetti, M.; Mazzolai, B. Design of a compact bistable mechanism based on dielectric elastomer actuators. Meccanica 2015, 50, 2741–2749. [Google Scholar] [CrossRef]
  33. Bruch, P.; Loew, S.; Hau, G.; Rizzello, S.S. Fast model-based design of large stroke dielectric elastomer membrane actuators biased with pre-stressed buckled beams. In Proceedings of the SPIE Smart Structures and Materials + Nondestructive Evaluation and Health Monitoring, Denver, CO, USA, 4–8 March 2018. [Google Scholar] [CrossRef]
  34. Loew, P.; Rizzello, G.; Seelecke, S. Permanent magnets as biasing mechanism for improving the performance of circular dielectric elastomer out-of-plane actuators. In Proceedings of the Electroactive Polymer Actuators Devices 2017, Portland, OR, USA, 25–29 March 2017; p. 10163. [Google Scholar] [CrossRef]
  35. Berselli, G.; Vertechy, R.; Vassura, G.; Parenti-Castelli, V. Optimal synthesis of conically shaped dielectric elastomer linear actuators: Design methodology and experimental validation. IEEE/ASME Trans. Mechatron. 2011, 16, 67–79. [Google Scholar] [CrossRef]
  36. Madhukar, D.; Perlitz, M.; Grigola, D.; Gai, K.J. Hsia Bistable characteristics of thick-walled axisymmetric domes. Int. J. Solids Struct. 2014, 51, 2590–2597. [Google Scholar] [CrossRef] [Green Version]
  37. Alturki, M.; Burgueño, R. Multistable cosine-curved dome system for elastic energy dissipation. J. Appl. Mech. Trans. ASME 2019, 86, 091002. [Google Scholar] [CrossRef]
  38. Neu, J.; Hubertus, J.; Croce, S.; Schultes, G.; Seelecke, S.; Rizzello, G. Fully Polymeric Domes as High-Stroke Biasing System for Soft Dielectric Elastomer Actuators. Front. Robot. AI 2021, 8, 695918. [Google Scholar] [CrossRef]
  39. Jia, K.; Wang, M.; Lu, T.; Wang, T. Linear control of multi-electrode dielectric elastomer actuator with a finite element model. Int. J. Mech. Sci. 2019, 159, 441–449. [Google Scholar] [CrossRef]
  40. Simone, F.; Linnebach, P.; Rizzello, G.; Seelecke, S. A finite element model of rigid body structures actuated by dielectric elastomer actuators. Smart Mater. Struct. 2018, 27, 065001. [Google Scholar] [CrossRef]
  41. Croce, S.; Neu, J.; Hubertus, J.; Rizzello, G.; Seelecke, S.; Schultes, G. Modeling and simulation of compliant biasing systems for dielectric elastomer membranes based on polymeric domes. In Proceedings of the ACTUATOR; International Conference and Exhibition on New Actuator Systems and Applications 2021, Online, 17–19 February 2021; pp. 3–6. [Google Scholar]
  42. Hubertus, J.; Croce, S.; Neu, J.; Rizzello, G.; Seelecke, S.; Schultes, G. Electromechanical characterization and laser structuring of Ni-based sputtered metallic compliant electrodes for DE applications. In Proceedings of the ACTUATOR; International Conference and Exhibition on New Actuator Systems and Applications 2021, Online, 17–19 February 2021; pp. 1–4. [Google Scholar]
  43. Fasolt, B.; Hodgins, M.; Rizzello, G.; Seelecke, S. Effect of screen printing parameters on sensor and actuator performance of dielectric elastomer (DE) membranes. Sens. Actuators A Phys. 2017, 265, 10–19. [Google Scholar] [CrossRef]
  44. Rosset, S.; Shea, H.R. Flexible and stretchable electrodes for dielectric elastomer actuators. Appl. Phys. A Mater. Sci. Process. 2013, 110, 281–307. [Google Scholar] [CrossRef] [Green Version]
  45. Schlatter, S.; Rosset, S.; Shea, H. Inkjet printing of carbon black electrodes for dielectric elastomer actuators. Electroact. Polym. Actuators Devices 2017, 1016311. [Google Scholar] [CrossRef] [Green Version]
  46. Wacker Chemie AG ELASTOSIL Film 2030. 2013, pp. 1–4. Available online: https://www.wacker.com/h/en-us/silicone-rubber/silicone-films/elastosil-film-2030/p/000038005 (accessed on 1 July 2021).
  47. Qiu, J.; Lang, J.H.; Slocum, A.H. A curved-beam bistable mechanism. J. Microelectromech. Syst. 2004, 13, 137–146. [Google Scholar] [CrossRef]
  48. COMSOL. Multiphysics Optimization Module. User’s Guide; COMSOL: Burlington, MA, USA, 2015. [Google Scholar]
  49. Martins, P.A.L.S.; Jorge, R.M.N.; Ferreira, A.J.M. A comparative study of several material models for prediction of hyperelastic properties: Application to silicone-rubber and soft tissues. Strain 2006, 42, 135–147. [Google Scholar] [CrossRef]
  50. Wacker Chemie AG WACKER SilGel 612 EH A/B. 2021, pp. 2–4. Available online: https://www.wacker.com/h/de-de/siliconkautschuk/silicongele/wacker-silgel-612-ab/p/000007546 (accessed on 2 December 2020).
Figure 1. Examples of NBS elements: (a) pre-compressed buckled beam; (b) attracting permanent magnet; (c) buckling polymeric dome.
Actuators 10 00209 g001
Figure 2. DE working principle: undeformed configuration on the left-hand side, deformed one due to electrical actuation on the right-hand side. Due to the combination of Maxwell stress σe and incompressibility of the elastomer, the reduction in thickness results in an expansion of the area.
Actuators 10 00209 g002
Figure 3. Three-dimensional (3D) rendering of a DEA: (a) undeformed flat configuration; (b) deformed out-of-the plane configuration.
Actuators 10 00209 g003
Figure 4. (ac) Sketch of the DEA actuator composed by a DE membrane coupled with a PBS element, for three different configurations. (d) Actuator force equilibrium analysis, intersection points p1 and p2 represents the equilibrium states obtained by switching the voltage.
Actuators 10 00209 g004
Figure 5. (ac) Sketch of the DEA actuator composed by a DE membrane coupled with a NBS element, for three different configurations. (d) Actuator force equilibrium analysis, intersection points d1 and d2 represents the equilibrium states obtained by switching the voltage.
Actuators 10 00209 g005aActuators 10 00209 g005b
Figure 6. A sketch of (a) the bi-stable NBS and (b) the monostable structure is presented on the left-hand side, while the corresponding mechanical characteristics are shown on the right-hand side, respectively.
Actuators 10 00209 g006
Figure 7. Fully polymeric dome: (a) real-life prototype; (b) 3D rendering implemented in COMSOL Multiphysics®.
Actuators 10 00209 g007
Figure 8. Two-dimensional (2D) FE model of the dome. Boundary conditions are explicitly reported as black solid lines. The non-colored image indicates the undeformed configuration, while the colored one shows the dome deformation through the colormap on the right-hand side. Note: due to radial symmetry, only the part of the dome which is located at positive y-coordinates is actually modeled.
Actuators 10 00209 g008
Figure 9. Three-dimensional (3D) FE of the dome, obtained from a rotation of the 2D model in Figure 8 along the z axis: (a) Undeformed configuration; (b) Deformed configuration.
Actuators 10 00209 g009
Figure 10. Two-dimensional (2D) sketch of the dome, containing the set geometric parameters.
Actuators 10 00209 g010
Figure 11. Experimental force–displacement curve of polymeric dome. The red and blue lines are derived by applying the load and displacement control methods, respectively. Points 1 and 2 indicate the dynamic jump occurring under load control mode, from state 1 to 2.
Actuators 10 00209 g011
Figure 12. Mesh convergence study: (a) quantifies the average percentage error between the curve obtained by setting the mesh extremely fine (considered as reference) and the other default types listed on the x-axis; (b) 2D FEM, with mesh defined as normal and customized along the blue edges. (c) quantifies the average percentage error between the characteristics curves resulting from varying the maximum size of the mesh elements along the blue edges.
Actuators 10 00209 g012
Figure 13. Matrix of plots showing the comparison among experimental (depicted in black) and simulated (depicted in red) curves, for different dome geometries.
Actuators 10 00209 g013
Figure 14. Intersection between the DE mechanical characteristics without (solid blue line) and with (solid red line) applied voltage, and ideal biasing behavior ensuring large stroke (solid black line). Points A e B represent the system equilibrium points for low and high voltage, respectively. Their distance along the horizontal axis defines the corresponding stroke.
Actuators 10 00209 g014
Figure 15. Surface fitting functions created based on the simulations dataset, with the final goal of deriving the dome geometric values for H and r based on the desired performance: (a) H as a function of stroke and slope; (b) r as a function of stroke and slope; (c) maximum force as a function of stroke and slope.
Actuators 10 00209 g015
Figure 16. Design algorithm experimental validation. The input is represented by the desired intersection points (black circles), while the dashed black curve and solid gray curve represent the simulated and experimental results based on the optimized dome geometry.
Actuators 10 00209 g016
Figure 17. Picture of the optimized DEA prototype.
Actuators 10 00209 g017
Figure 18. The upper part shows a step voltage signal applied as input, applied for a time of 10 s. The different colors represent signals of different amplitudes set as the input, which vary in the range 3–3.5 kV with increments of 0.1 kV. In the lower part, the corresponding stroke reached by the DEA is depicted.
Actuators 10 00209 g018
Figure 19. The upper part shows a sinusoidal voltage signal applied as input, at the frequency of 0.1 Hz. The different colors represent signals of different amplitudes set as the input, which vary in the range 3–3.5 kV with increments of 0.1 kV. In the lower part, the corresponding stroke reached by the DEA is depicted.
Actuators 10 00209 g019
Figure 20. Stroke reached by the DEA as a function of the applied voltage, considering sinusoidal voltage inputs having frequency of 0.1 Hz and different maximum amplitudes.
Actuators 10 00209 g020
Table 1. Experimental dataset splitting.
r = 2 mmr = 3 mmr = 4 mm
H = 3 mmValidatedValidatedValidated
H = 3.5 mmValidatedValidatedValidated
H = 4 mmIdentifiedIdentifiedIdentified
Table 2. Identified parameters values.
c10c20c30κA1A2A3
0.11 MPa3.29 kPa5.73 kPa0.25 × 1060.44 mm0.78 mm2.2 mm
Table 3. Normalized stroke reached with different bias elements: positive-rate biasing spring (PBS), attracting permanent magnets (PM), negative-rate biasing spring (NBS), and novel silicone dome.
PBSPMNBS + PBSSilicone Dome
0.1 [-]0.31 [-]0.4 [-]0.62 [-]
Publisher’s Note: MDPI stays neutral with regard to jurisdictional claims in published maps and institutional affiliations.

