1. Introduction
The synthetic jet (SJ) has potential application in the areas of mixing enhancement [
1,
2,
3,
4], heat transfer [
5,
6], mass transfer [
7,
8], and widely understood active flow control [
9,
10]. The physic parameters, the topology, and the performance of SJ are mainly dependent on the geometrical and the supply parameters of the synthetic jet actuator (SJA). Due to many applications of SJ, many ways to increase the efficiency of SJA, the velocity of SJ, or other parameters depending on the area of application and requirement.
Singh et al. [
11] investigated the acoustic SJA with one circular, rectangular, or square orifice for different orifice thicknesses. The SJ was used as an impingement jet and the average and local Nusselt number on the heated plate was measured. The measures heat transfer coefficient in the case of the SJ impingement jet was about 16 higher than in the case of natural convection. The highest value of the average Nusselt number was achieved for the rectangular orifice (around 25% and 33% higher than in the case of the square and circular orifice). The same authors investigated in more detail this issue in [
12] and showed that the use of more than one orifice can increase the average Nusselt number by around 60%. This was also confirmed numerically. Jacob et al. [
13] investigated the impinging SJ generated by actuators with one, two, and four circular orifices. The more orifices the higher heat transfer but this effect was strongly dependent on the orifice-plate distance.
Miro et al. [
14] investigated the flow topology of rectangular (slot) and circular impinging SJ. The turbulent mixing was higher in the case of the rectangular orifice, but the circular SJ leads to a higher heat transfer peak. It is caused by the different size and velocity distribution (topology) of the slot and circular SJ. Miro et al. [
14] used the numerical simulation but the topology difference depending on the orifice shape was more widely described and shown in [
15,
16]. Zong and Katsonis [
15] used the Schlieren and particle image velocimetry (PIV) methods and Gaputa et al. [
16] used laser-induced fluorescence (LIF) and PIV methods. In papers [
15,
16] was showed that the formation and evolution of SJ are strongly dependent on the actuator orifice shape.
Bhapkar et al. [
17] showed that the outer shape of the actuator cavity has an impact on the SJ impingement cooling. The effect of the cavity shape was high for a small orifice-plate distance. For the flat cavity wall and small orifice-plate distance between the orifice and heated plate was created in the closed space. The mixing of the air from this space and environment is strongly limited and the cooling efficiency decreased. The use of the round cavity allows for easier removal of hot air from the space between the actuator body and the plate and increased the heat transfer.
The heat transfer enhancement can be realized not only by SJA modification. One of the most effective methods is the use of heat sinks [
18,
19]. Mangate and Chaudhari [
19] provide that the use of the heat sink can increase the heat transfer coefficient even around seven times. They used multiple- orifices impinging SJ. Gil [
20,
21] closed the heat sink in the actuator chamber. This solution has smaller sizes compared to the classic impinging SJ (the cooled surface is the part of the actuator).
The efficiency of the SJ can be also increased by increasing the parameters of the synthetic jet. Ferro et al. [
22] investigated experimentally the impact of the cavity shape on the SJ performance. They tested three shapes of the cavity: cylindrical, conical, and contraction. The cylindrical cavity of SJA minimalized momentum flux while the contraction cavity reduces the power consumption and increased actuator electrical efficiency.
Smyk et al. [
23] investigated the impact of the confinement plate on the SJ. While, Mangate and Chaudhari [
19] investigate the impact of confinement plate in the cooling application, in paper [
23] the focus was on whether the confinement plate influences the SJ and actuators parameters. The presented results indicated that the limitation of the environment around the office has a negative impact on the SJ parameters. However, the dependences were not unambiguous.
The velocity of SJ and the efficiency of the actuator can be also increased by the appropriate design and selection of the resonant frequency of the actuator [
24,
25,
26] or the design of an optimal orifice diameter [
27]. However, in this paper, we want to focus on the idea presented in [
23] and check whether the coefficient plate decreased the velocity of SJ and impact other parameters.
2. Materials and Methods
The SJA was made from PMMA and the loudspeaker STX W.18.200.8.FGX (8 Ω) was used for the SJ generation. The diameter of the actuator cavity was 150 mm and the cavity height was 20 mm. Six different orifices were investigated: one short (case 0) and three long (case 1, 2, and 3). A short orifice is understood to mean a nozzle with a ratio t/d < 1, and a long the orifice with a ratio t/d ≥ 1, where t is the orifice height, and d is the orifice diameter. The orifice was extended by attaching to the SJA body a special extension made with the use of the 3D printing method. The outer area of the orifice was 24 mm.
During parts of tests with the actuators with the long orifice, the confinement plate on the end of the orifice was used. The plate reduces the space around the orifice outlet. In the case of actuators without the confinement plate, this role was played by the frontal surface of orifice extension. The case of the SJA with the confinement plate was marked with “A”, and without the plate with “B”. The area of the confinement plate was A = 25,132.74 mm2. It was also the area of the frontal surface of the actuator body. The area of the orifice front surface was 138.23 mm2.
The models of the actuators were presented in
Figure 1a. The most important parameters of SJA were presented in
Table 1.
The Rigol DG4162 waveform generator was used to suppling the SJA with a harmonic electric current. The LM3886 Texas Instruments amplifier was additionally used to strengthen the signal. The electrical power was measured with two Keithley 2701 multimeter (6.5 digit, 22-Bit) with 7706 all in one I/O module (20 analog input). The first multimeter measured the voltage drop on the loudspeaker and the second measured the current indirectly by measuring the voltage drop on the reference resistor (1 Ω, 0.01%). Data was recorded using a multifunction board National Instruments USB-6211.
The velocity was measured with a two-wire constant temperature anemometer (CTA) probe connected to the ATU 08 bridge. The first wire of the CTA probe was used for the velocity measurements and was calibrated in a range of 0.3–49 m/s. The second wire was used for the temperature measurements and the temperature compensation of the velocity. The CTA probe was positioned by the 3D manipulator with ±0.02 mm positioning accuracy. The sampling rate was 2000 samples per one SJA operation period and the velocity was calculated based on 100 cycles.
The barometric pressure was measured with a Honeywell HPB200W2DA-B barometer with accuracy ±40 Pa. The uncertainty of the other measured values was presented in
Table 2, and the test stands in
Figure 1b.
3. Data Reduction
The present paper is an extension of research presented in [
23] and is focused on the velocity measurements and the Reynolds number and the stroke length will be used for quantification of SJ. These parameters can for circular orifice be defined on the basis of the local centerline momentum velocity [
28,
29]:
where
is the orifice diameter [m],
is the kinematic viscosity of fluid [m
2/s],
is period of actuator operation (
) [s],
is a loudspeaker excitation frequency [s], and
is the centerline momentum velocity defined as:
where
is instantons velocity at a certain axial distance [m/s] and
is a specific moment of time [s]. The ratio between the velocity averaged over the entire cross-sectional area and the velocity in the centerline is strictly defined [
29,
30].
The velocity parameters as maximal, minimal velocity and peak-to-peak velocity were determined:
Additionally, the Stokes number was determined for the prepared measurements. The Stokes number can be calculated from:
4. Results and Discussion
4.1. Resonant Frequency
The first step during the SJ investigation is always to find the resonant frequency of SJA. For this purpose, the velocity for different operating frequencies of the loudspeaker was measured at real power
p = 3 W and axial distance
x = 0. The frequency was tested in the range of 8–50 Hz with the step of 1 Hz, 50–100 Hz with the step of 2 Hz. The results were presented in
Figure 2.
Based on the velocity measurements the resonant frequencies were designated. They were similar to in case of [
23], where the same actuators were tested but with other measurements method (thrust method [
31,
32]). The resonant frequencies and the momentum velocities for these frequencies were presented in
Table 3.
The velocity was weakly dependent on the coefficient wall—velocity was on average 1.2% larger in cases A—but was inversely proportional to the orifice height, and it is in line with other studies [
33,
34]. The lowest velocity was obtained in case 0 and it is surprising and incompatible with measurements presented in [
23], wherein in case 0 the highest time-mean reaction force was obtained.
The peak-to-peak velocity was presented in
Figure 3. The peak-to-peak velocity was regardless of the confinement plate and in all cases except case 0 was strongly dependent on the frequency. In case 0, it was equal to 33.8 ± 3.8 m/s and it achieved the highest value close to the resonant frequency. This apparent immutability and the previously mentioned difference are due to a short orifice, in our opinion.
In a long orifice, the jet flowing out of the chamber has enough distance and time to stabilize its parameters, e.g., develop a velocity profile. In the case of a short orifice, the jet does not have enough distance and time to fully develop, and its parameters will be developed significantly after expulsion from the orifice. It explains why the peak-to-peak velocity in case 0 is almost constant irrespective of the operating frequency—be further confirmed by measuring the velocity of the axial profile. It explains also why the velocity in case 0 at the resonant frequency is the lowest, while the reaction force from [
23] indicates that it should be the highest. The method of SJ parameters determination with reaction force measurements is independent of the orifice shape or number and determines the parameters for the entire SJ. The velocity measurement is carried out in a point or plane and therefore does not reflect the global state of SJ.
The resonant frequencies designed with the velocity measurements method and thrust method from [
23] was similar and only in case 0 the resonant frequency differs significantly but the velocity relative difference between the velocity for resonant frequency designed for the actuators in this paper and the velocity for resonant frequency designed in [
23] is below 3.5%. For this reason, and to be able to compare these two papers with each other, subsequent measurements were conducted for frequency
fr,1 from [
23].
Differences in the designated resonant frequencies were not caused by the different methods used in compared investigations—in [
23] the resonant frequencies were indicated on the base of the power factor. However, to verify this, a measurement of the power factor was made
Figure 4. The power factor for the resonant frequency tends to value one [
35] and the resonant frequencies designed on the base of the power factor overlap with frequencies values designed based on velocity. It must therefore be assumed that the differences in the results originate regardless of the method and can be a result of wear and tear of equipment or measurement conditions.
4.2. Impact of the Confinement Plate
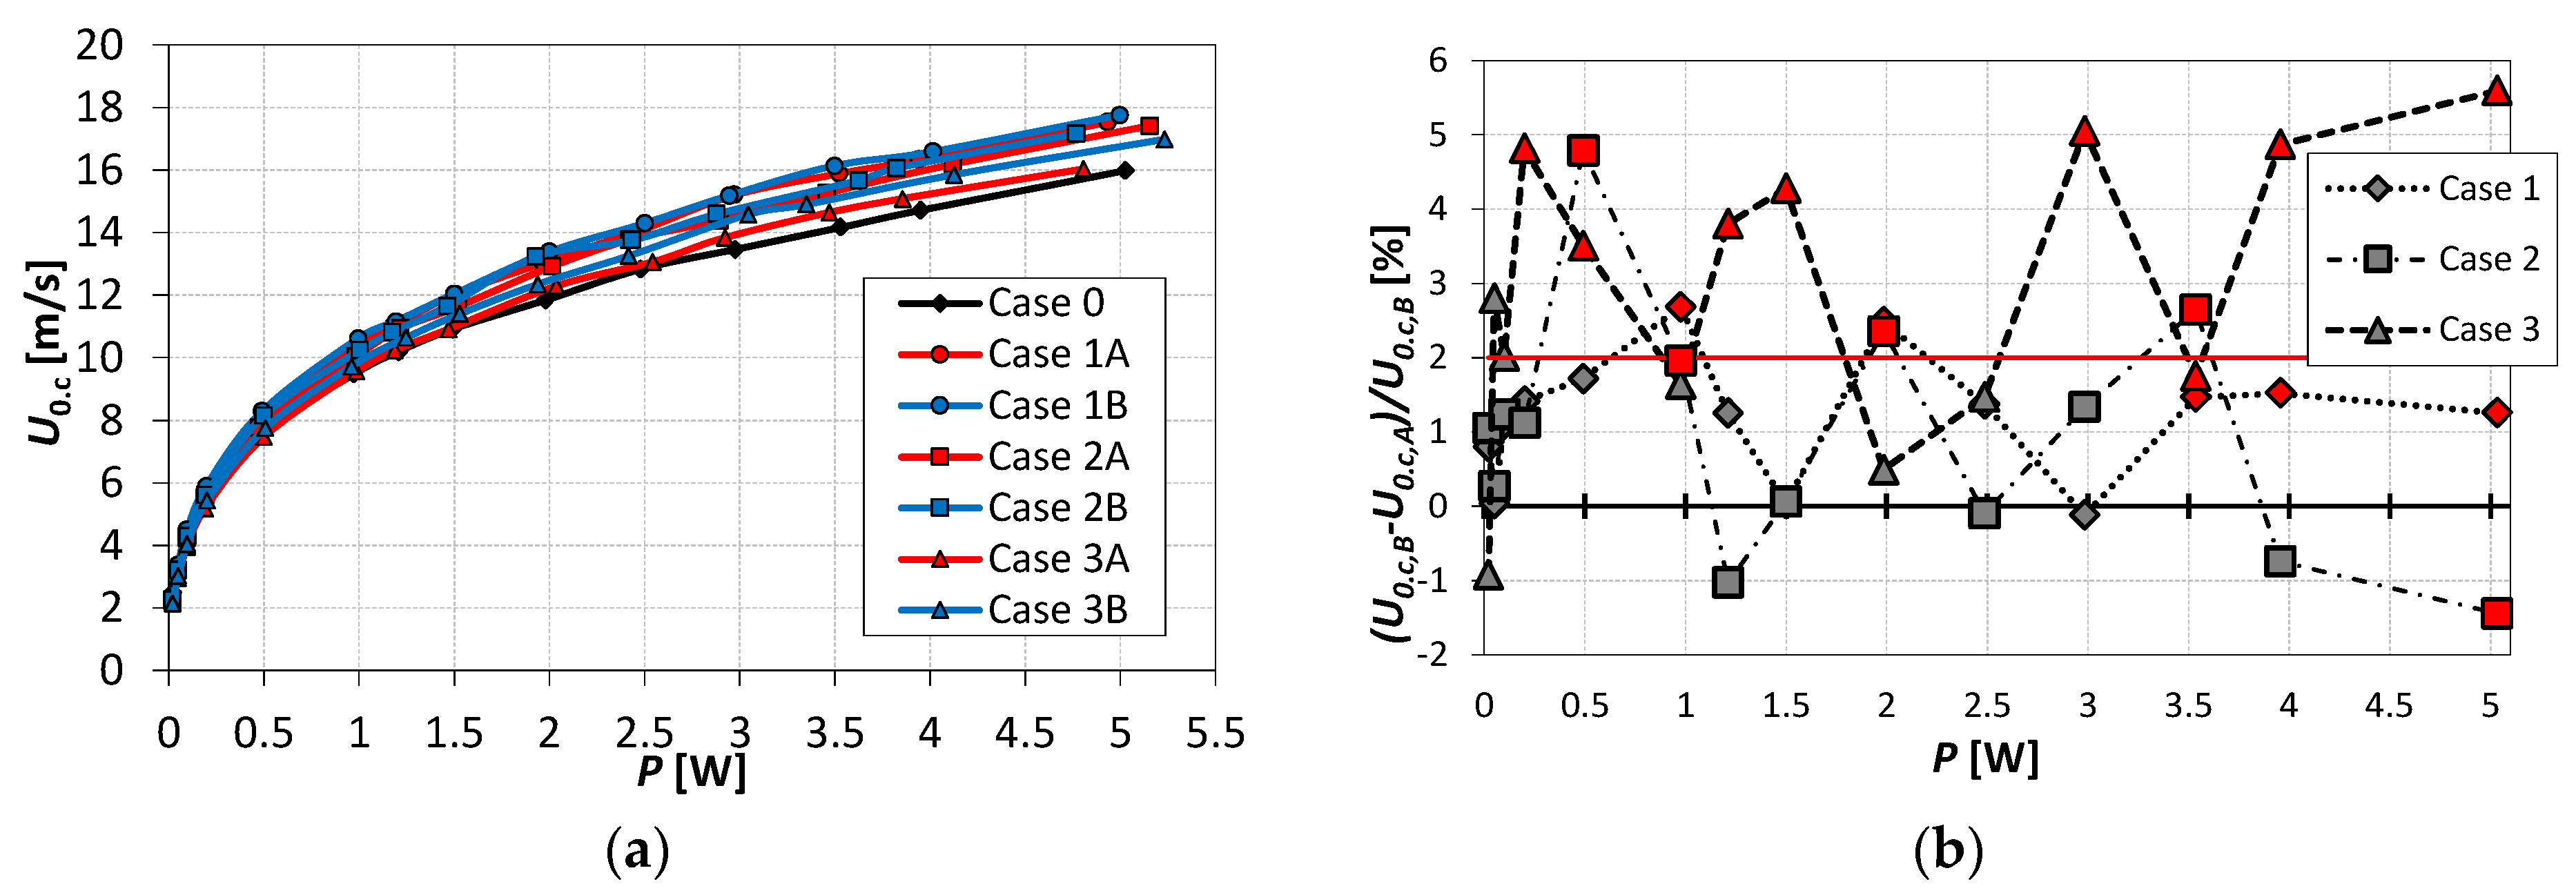
The centerline momentum velocity
Figure 5a was higher in B cases than in cases A, on average by 1.2% in case 1, by 1.0% in case 2, and by 2.9% in case 3. This difference was smaller than the velocity uncertainty
Table 2 which was 2% for the velocity above 2.6 m/s. For this reason, in
Figure 5b the difference between the velocity in case B and case A is presented and the level of the velocity uncertainty was marked with a red line.
The differences between casa A and B for cases 1 and 2 are slight and greater than the measurement uncertainty only at a few real power values. However, in case 3 the differences are significant. The velocity in case 3B was higher than the velocity in case 3A for 9 from 14 investigated real power value and only at
p = 0.02 W the velocity was higher in case 3A. Of course, the velocity uncertainty applies to both measurements and the line of 2% difference which was taken as the cut-off line is of a contractual nature. The measurement uncertainty for the velocity above 2.6 m/s is equal to 0.1 m/s (see
Table 2). Therefore to be sure, that the velocity in case B is higher than in case A is higher the difference between them should be higher than 0.2 m/s—assuming that the error of each measurement is the most unfavorable. This condition is met at 5 different real power in cases 1 and 2, and 8 different real power in cases 3 (these points were marked red in
Figure 5b. However, the velocity in case B was generally higher than in case A—except for points at
p > 0.2 and three other points in case 2, see
Figure 5b. The basis on this fact and the measurements presented by Smyk et al. [
23] can be assumed that the confinement plat reduces the velocity of SJ. The impact is minor, but this fact should be included in the design of SJA.
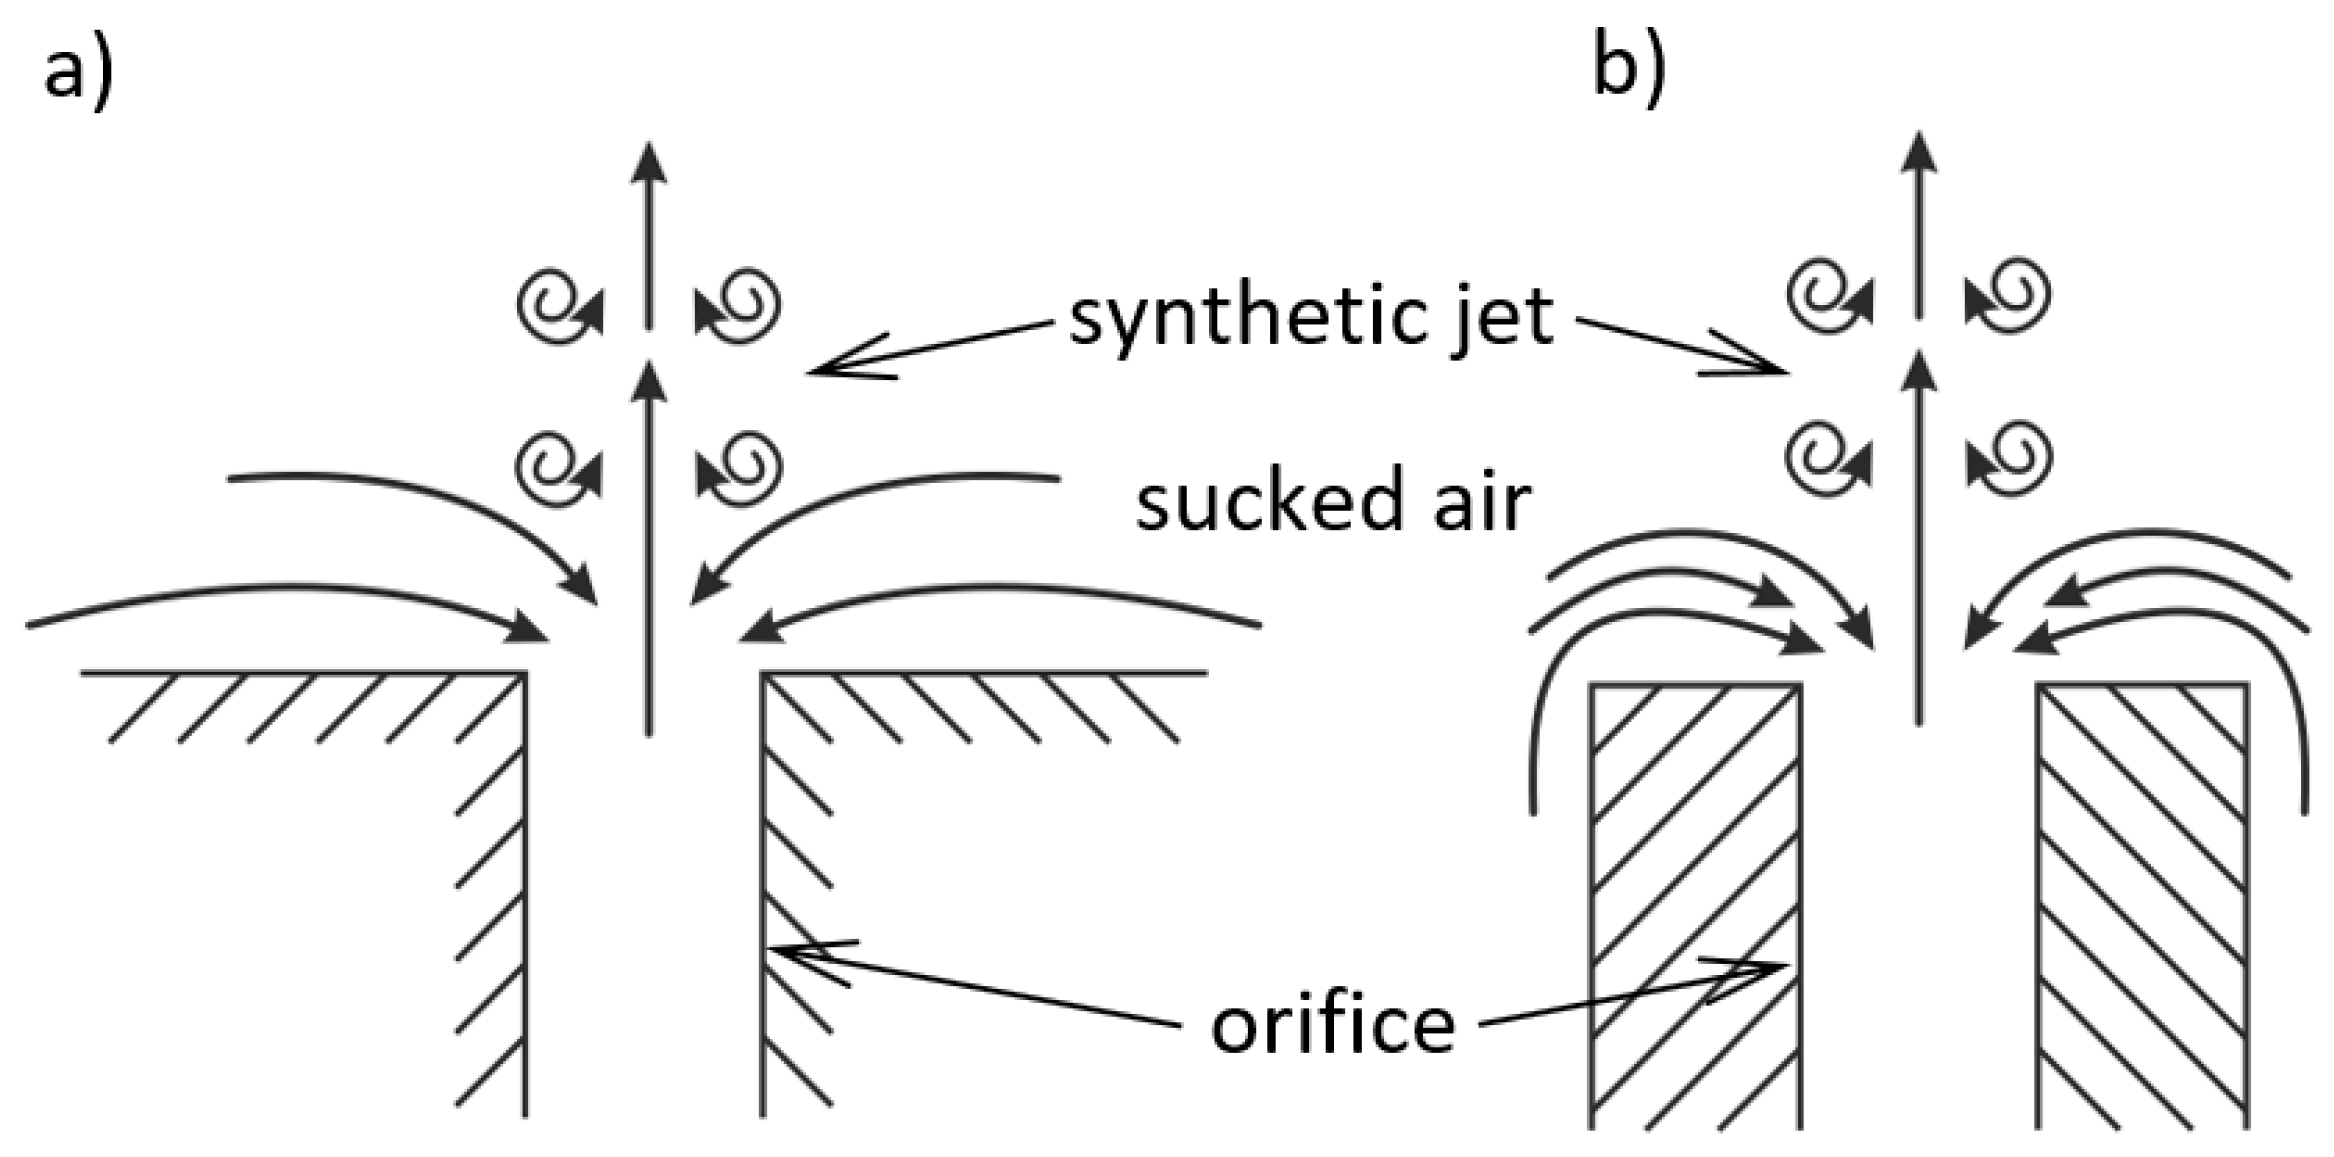
The negative impact of the confinement plat on the SJ velocity is due to the limit of the space around the orifice exit. The air sucked to the orifice in a different way
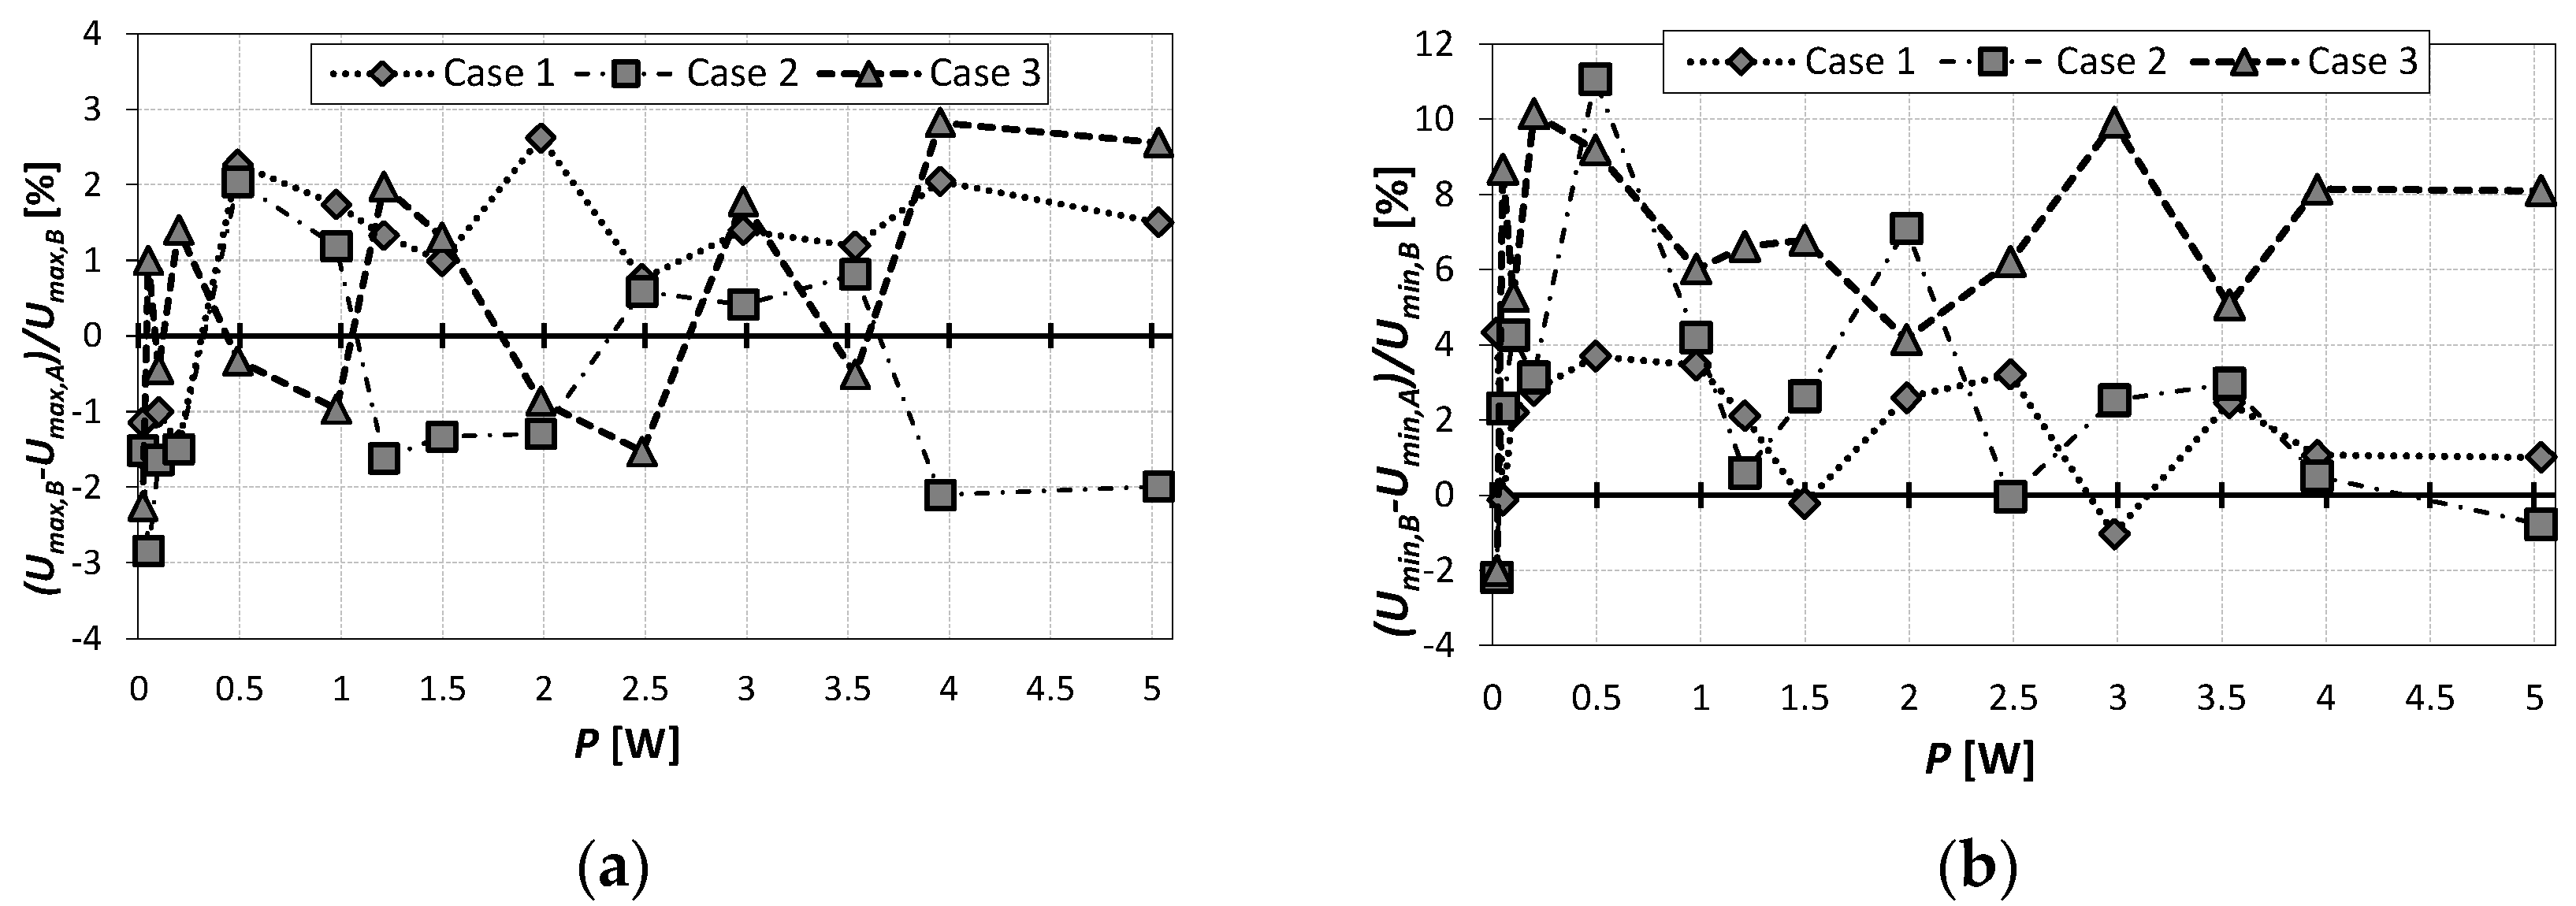
Figure 6, and it can be demonstrated by the comparison of the minimal velocity in cases A and B. For this reason, in
Figure 7 the percentage difference between the maximal
Figure 7a and minimal
Figure 7b velocity in cases B and A is presented. The maximal velocity difference is ambiguous and is in the range from −2.8% to 2.8%. Based on the velocity measurements, it can be inferred that the confinement plat has no impact on the maximal velocity of generating SJ. In the case of minimal velocity, the difference between cases A and B is significant.
Similarly, as in the case of the momentum velocity, the differences were the highest in case 3 and were in the range from 4.1% to 10.1%—the both of velocities were negative, and the positive value in
Figure 7b means that the minimal velocity in case B was smaller than in case A. In other words, the absolute value of the minimal velocity in case B was higher than in case A. So high differences cannot be caused by the uncertainty of measurements and show that the confinement plat has an impact on the SJA operation and SJ generation. The confinement plate decreased the velocity during the suction part of the period. Of course, the velocity value in the suction part of the operation period is not directly related to the momentum velocity but it affects it.
4.3. Dimensionless Parameters
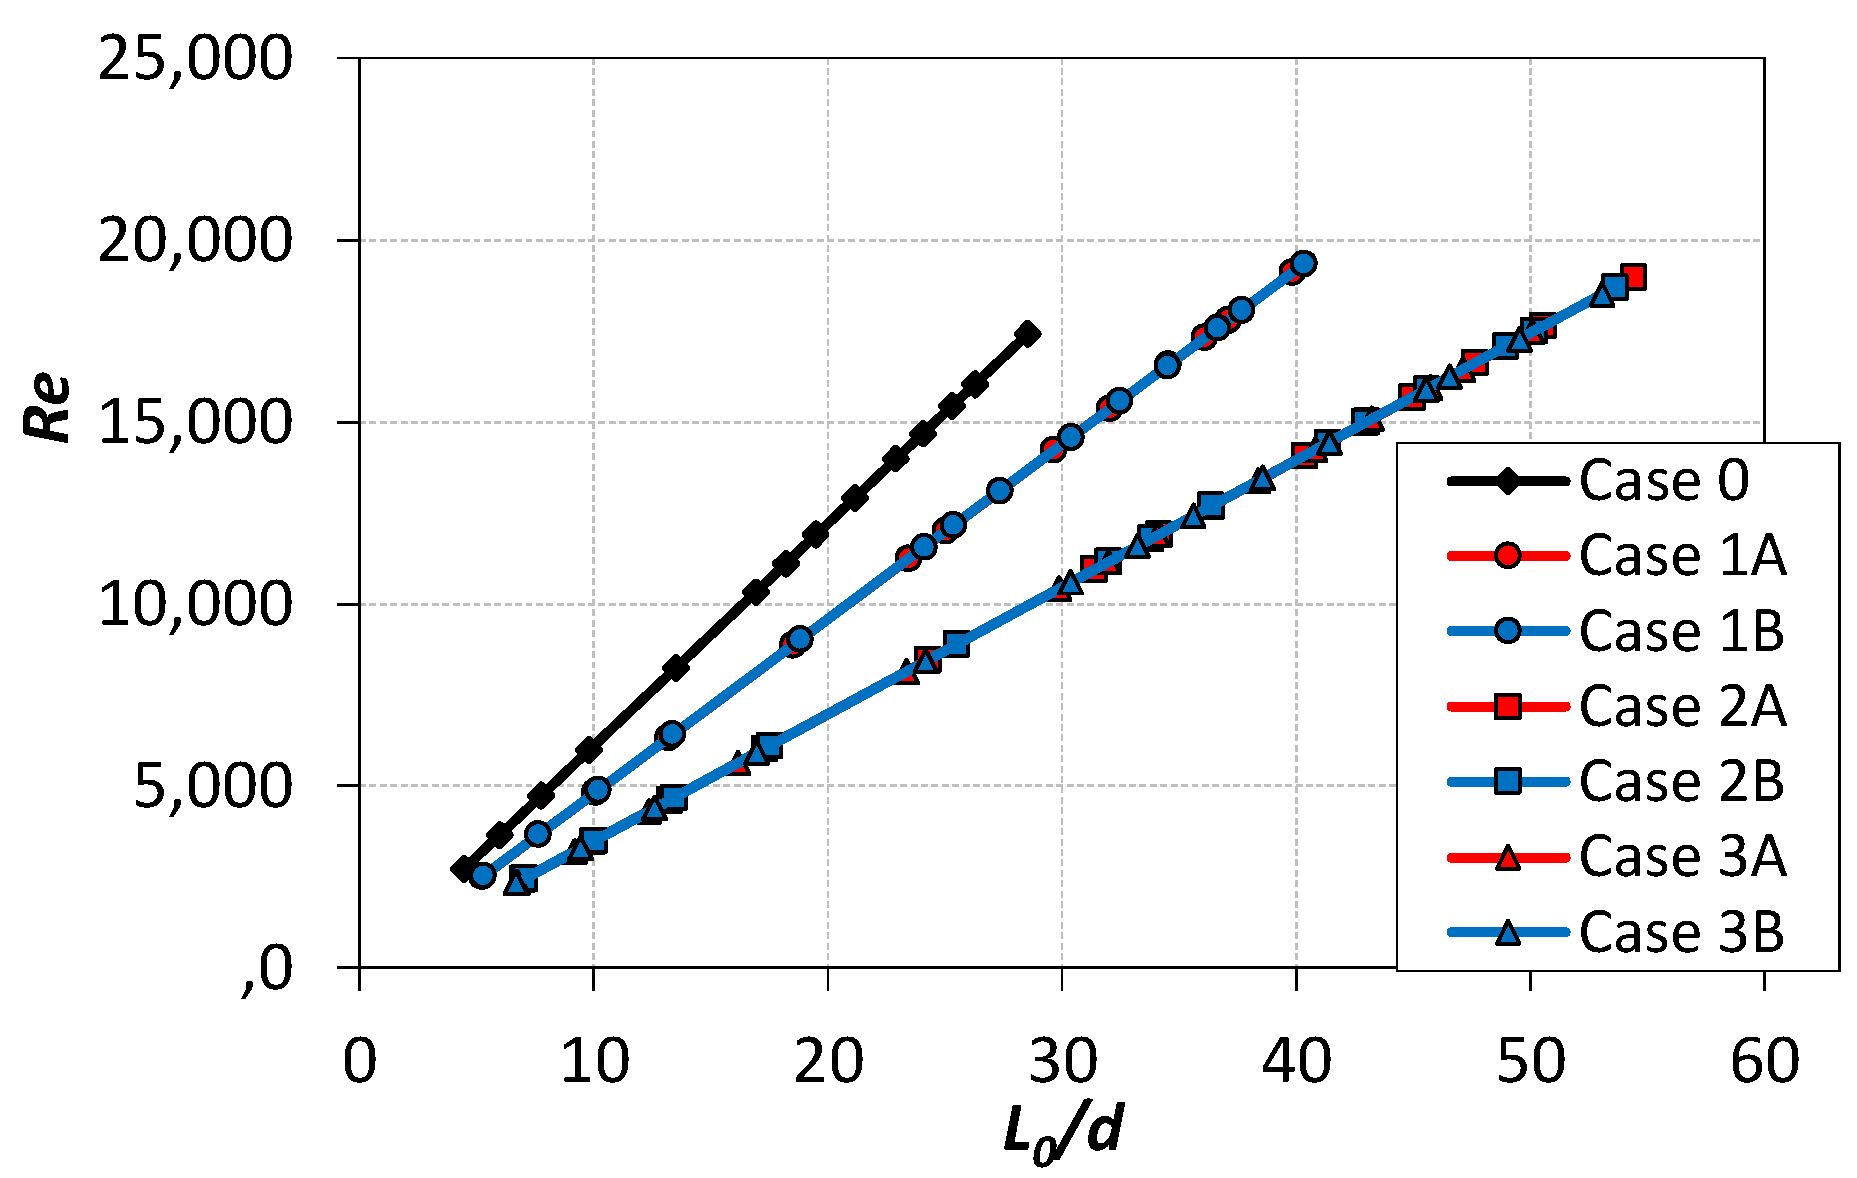
The dimensionless stroke length as a function of a Reynolds number was presented in
Figure 8. The parameters were dependent linear and in cases 2 and 3 was similar independent to confinement plate or the orifice height. The SJ formation criterion defined by Hollman et al. [
36] has been met in all measurements range. The Reynolds number by measurements presented in this paper was in the range of 2300 <
Re < 19,500. The Stokes number was in the range of 46 <
S < 62.
In this paper, the dimensionless parameters were calculated based on the centerline momentum velocity and in [
23] based on the time-mean reaction force. Kordík et al. [
29] showed that the ratio of the stroke length or Reynolds number calculated for the centerline velocity and calculated for the time- and spatially-averaged velocity depends on the stroke length and the geometry of SJA. Peszynski and Tesař [
30] proved the same but for the continuous jet. Although the momentum centerline velocity and not the centerline velocity was used in this paper the above relationship should be maintained. The average-to-centerline ratio can be calculated as:
where symbol * means the values from [
23].
The average-to-centerline ratio calculated based on the Reynolds number is equal
, and based on the dimensionless stroke length
. The values of the average-to-centerline ratio obtained by comparing the results presented in this paper and in [
23] were presented in
Figure 9. The difference between the two values is equal to two and is caused by the methodology of the Reynolds number calculation. The paper [
23] used the methodology described by Gil [
31]—errata were published for the both of papers [
23,
31]. Gil [
31] used the velocity calculated on the basis of slug-velocity-profile
to the calculation of the Reynolds number, and the time- and spatially-averaged velocity
was used to the calculation of the dimensionless stroke length. The ratio between these two velocities is
. If the Reynolds number from the paper [
23] will be calculated on the basis of the time- and spatially-averaged velocity
, then the average-to-centerline ratio calculated from Reynold number and dimensionless stroke length is
.
4.4. Axial Velocities Profiles
The axial velocity profile of centerline velocity was measured for the SJ in the range of 0 <
x/
d < 20. The axial centerline momentum velocity was presented in
Figure 10a and the comparison of the axial centerline momentum velocity in cases A and B to case 0 was presented in
Figure 10b.
The difference in the axial velocity between cases A and B was negligible and was about 2%. The axial velocity in case B was higher than the velocity of case A. The axial centerline velocity showed the impact of the orifice length on the velocity. The velocity of case 0 was the smallest at
x = 0
Figure 10a at
x = 0, but the SJ in case 0 is higher than in other cases at some distance from the orifice. The axial centerline momentum velocity in case 0 was higher in the distance range of 0.3 <
x/
d < 6 then in cases 2 and 3, and in the distance range of 0.3 <
x/
d < 11.7. The axial distance is the important parameter in the case of impinging SJ. Depending of the investigations the optimal axial distance between the orifice and cooled surface is recognized as
x/
d = 6.3–8.4 [
37],
x/
d = 5–8 [
38],
x/
d = 5–7 [
39],
x/
d = 5–10 [
8] and the heat transfer is dependent of the SJ velocity. The heat transfer optimal distance overlaps a distance in which the velocity in case 0 was greater than the other.
The axial centerline momentum velocity in cases 2 and 3 were similar in all distance range. The velocity in case 1 was smaller than in cases 2 and 3 at the distance range of 2 < x/d < 11.7. The distance x/d = 11.7 was the point where any velocity value differences disappeared, and the scatter of the results was too large to be able to draw conclusions from it.
The maximal centerline velocity
Figure 11a decreased with the axial distance for all cases except case 0 where the maximal velocity increased to the
x/
d = 2.1 and then decreased. The maximal velocity in case 0 is higher than in cases 2 and 3 in the range of 0.8 <
x/
d < 7.1 and is higher than in cases 1 in the range of 0.8 <
x/
d < 12.5. The confinement plate had not a significant impact on the maximal centerline velocity profile.
The minimal centerline velocity
Figure 11b in case 0 was higher than in cases 1 in the range of 1.4 <
x/
d < 12.5, higher than in cases 2 and 3 in the range of 1 <
x/
d < 9. The minimal velocity was higher in case B than in case A at the distance of
x/
d < 4 in all cases but the difference between the minimal velocity in case B and in case A was bigger than 0.2 (doubled value of the measurement uncertainty, see
Table 2) at the distance of
x/
d < 1.9 for all measurements point. The difference was around 2.5 m/s in case 1 and around 2.4 m/s in case 2. This confirms the assumption that the confinement plate impedes air ingestion by limits the area from which the air is sucked in the actuator. The supposed way of air ingestion was presented in
Figure 6.
5. Conclusions
The velocity differences for the actuator with and without the confinement plate are small and for many of the measurement points were below the velocity measurements uncertainty. However, presented measurements proved that the confinement plate decreases the velocity of the SJ even above 5%. The plate limits the area around the orifice and the velocity during the suction part of the operation is much smaller than in cases without a confinement plate. The area of the used plate was relatively big to the orifice area in case A, and the orifice wall thickness was 2 mm in case B. Based on the presented investigation it is impossible to determine, how the size of the front surface area of the orifice impacts the SJ but only whether it does.
On the basis of the presented investigation and previous research [
23], the average-to-centerline ratio was calculated for the actuators as a
. The range of the measurements was presented as the Reynolds number in a function of the dimensionless stroke length. The Reynolds number was in the range of 2300 <
Re < 19,500, and the Stokes number was in the range of 46 <
S < 62.
The impact of the confinement plate on the SJ velocity was also confirmed based on axial profiles of SJ. The coefficient plate impact was observed in the distance of x/d < 4, but the orifice length had more of an impact than the plate. Summarizing all the facts the confinement plate has a negative impact on the parameter of SJ, especially the velocity. However, this impact is slight.
The presented results are significant because they showed the previous unresolved problem. However, due to the scale of the impact, the problem of the confinement plate will be secondary during the SJA design.
Author Contributions
Conceptualization, E.S., and R.S.; methodology, E.S.; software, E.S.; validation, R.S.; formal analysis, R.S.; investigation, R.S.; resources, E.S.; data curation, E.S.; writing—original draft preparation, E.S.; writing—review and editing, E.S. and R.S.; visualization, E.S.; supervision, R.S. All authors have read and agreed to the published version of the manuscript.
Funding
This work was supported by the National Center for Research and Development, Poland. Grant No.: LIDER/6/0024/L-10/18/NCBR/2019.
Institutional Review Board Statement
Not applicable.
Informed Consent Statement
Not applicable.
Data Availability Statement
Some or all data generated or used during the study are available from the corresponding author by request.
Conflicts of Interest
The authors declare no conflict of interest.
Nomenclature
| A | confinement area, m2 |
| d | orifice inner diameter, m |
| D | cavity diameter, m |
| f | excitation frequency, Hz |
| H | cavity height, m |
| L0 | stroke length, m |
| P | real power, W |
| Re | Reynolds number |
| S | Stokes number |
| t | orifice height, m |
| T | oscillation period, s |
| x | axial distance, m |
| u | instantaneous velocity, m/s |
| U | characteristic velocity, m/s |
| Greek symbols | |
| ν | kinematic viscosity, m2/s |
| τ | time, s |
| Index | |
| c | centerline |
| min | minimal |
| max | maximal |
| p-p | peak-to-peak |
| Aberrations | |
| CTA | constant temperature anemometer |
| LIF | laser-induced fluorescence |
| PIV | particle image velocimetry |
| PMMA | poly(methyl methacrylate) |
| SJ | synthetic jet |
| SJA | synthetic jet actuator |
| ZNMF | zero-net mass-flux |
References
- Wang, P.; Shen, C.B. Characteristics of mixing enhancement achieved using a pulsed plasma synthetic jet in a supersonic flow. J. Zhejiang Univ. Sci. A 2019, 20, 701–713. [Google Scholar] [CrossRef]
- Xia, Q.; Zhong, S. Enhancement of inline mixing with lateral synthetic jet pairs at low Reynolds numbers: The effect of fluid viscosity. Flow Meas. Instrum. 2017, 53, 308–316. [Google Scholar] [CrossRef]
- Bagherzadeh, A.; Jalali, E.; Sarafraz, M.M.; Akbari, O.; Karimipour, A.; Goodarzi, M.; Bach, Q.-V. Effects of magnetic field on micro cross jet injection of dispersed nanoparticles in a microchannel. Int. J. Numer. Methods Heat Fluid Flow 2019, 30, 2683–2704. [Google Scholar] [CrossRef]
- Lebon, B.; Nguyen, M.Q.; Peixinho, J.; Shadloo, M.S.; Hadjadj, A. A new mechanism for periodic bursting of the recirculation region in the flow through a sudden expansion in a circular pipe. Phys. Fluids 2018, 30, 031701. [Google Scholar] [CrossRef]
- Arshad, A.; Jabbal, M.; Yan, Y. Synthetic jet actuators for heat transfer enhancement—A critical review. Int. J. Heat Mass Transf. 2020, 146, 118815. [Google Scholar] [CrossRef]
- Ikhlaq, M.; Yasir, M.; Demiroplu, M.; Arik, M. Synthetic Jet Cooling Technology for Electronics Thermal Management—A Critical Review. IEEE Trans. Compon. Packag. Manuf. Technol. 2021, 11, 1156–1170. [Google Scholar] [CrossRef]
- Trávnícek, Z.; Broucková, Z. Characterization of Impingement Heat/Mass Transfer to the Synthetic Jet Generated by a Biomimetic Actuator. J. Heat Transf. 2019, 141, 042203. [Google Scholar] [CrossRef]
- Ghaffari, O.; Solovitz, S.A.; Arik, M. An investigation into flow and heat transfer for a slot impinging synthetic jet. Int. J. Heat Mass Transf. 2016, 100, 634–645. [Google Scholar] [CrossRef]
- Li, S.; Luo, Z.; Deng, X.; Peng, W.; Liu, Z. Experimental investigation on active control of flow around a finite-length square cylinder using dual synthetic jet. J. Wind Eng. Ind. Aerodyn. 2021, 210, 104519. [Google Scholar] [CrossRef]
- Jankee, G.K.; Ganapathisubramani, B. Scalings for rectangular synthetic jet trajectory in a turbulent boundary layer. J. Fluid Mech. 2021, 915, A57. [Google Scholar] [CrossRef]
- Singh, P.K.; Sahu, S.K.; Upadhyay, P.K.; Jain, A.K. Experimental investigation on thermal characteristics of hot surface by synthetic jet impingement. Appl. Therm. Eng. 2020, 165, 114596. [Google Scholar] [CrossRef]
- Singh, P.K.; Sahu, S.K.; Upadhyay, P.K. Experimental investigation of the thermal behavior a single-cavity and multiple-orifice synthetic jet impingement driven by electromagnetic actuator for electronics cooling. Exp. Heat Transf. 2020, 1–27. [Google Scholar] [CrossRef]
- Jacob, A.; Shafi, K.; Roy, A.K.E.R. Heat Transfer Characteristics of Piston-Driven Synthetic Jet. Int. J. Thermofluids 2021, 11, 100104. [Google Scholar] [CrossRef]
- Miró, A.; Soria, M.; Cajas, J.C.; Rodríguez, I.; Moulinec, C. Flow topology and heat transfer analysis of slotted and axisymmetric synthetic impinging jets. Int. J. Therm. Sci. 2021, 164. [Google Scholar] [CrossRef]
- Zong, H.; Kotsonis, M. Effect of slotted exit orifice on performance of plasma synthetic jet actuator. Exp. Fluids 2017, 58, 17. [Google Scholar] [CrossRef] [Green Version]
- Gupta, J.; Satish, S.S.; Saha, G.A.K. Vortex formation in a low aspect ratio synthetic jet. J. Flow Vis. Image Process. 2020, 27, 117–141. [Google Scholar] [CrossRef]
- Bhapkar, U.S.; Srivastava, A.; Agrawal, A. Proper cavity shape can mitigate confinement effect in synthetic jet impingement cooling. Exp. Therm. Fluid Sci. 2015, 68, 392–401. [Google Scholar] [CrossRef]
- Huang, L.; Yeom, T.; Simon, T.; Cui, T. An experimental and numerical study on heat transfer enhancement of a heat sink fin by synthetic jet impingement. Heat Mass Transf. 2021, 57, 583–593. [Google Scholar] [CrossRef]
- Mangate, L.; Chaudhari, D.M.B. Experimental study on heat transfer characteristics of a heat sink with multiple-orifice synthetic jet. Int. J. Heat Mass Transf. 2016, 103, 1181–1190. [Google Scholar] [CrossRef]
- Gil, P. Performance of special type heat sink with an integrated synthetic jet actuator. E3S Web Conf. 2019, 100, 00017. [Google Scholar] [CrossRef] [Green Version]
- Gil, P. Experimental investigation on heat transfer enhancement of air-cooled heat sink using multiple synthetic jets. Int. J. Therm. Sci. 2021, 166, 106949. [Google Scholar] [CrossRef]
- Feero, M.A.; Lavoie, P.; Sullivan, P.E. Influence of cavity shape on synthetic jet performance. Sens. Actuators A Phys. 2015, 223, 1–10. [Google Scholar] [CrossRef]
- Smyk, E.; Przeszłowski, Ł.; Strzelczyk, P.M. Impact of the confinement plate on the synthetic jet. AIP Adv. 2020, 10, 105204, Erratum in 2021, 11, 039901. [Google Scholar] [CrossRef]
- Chiatto, M.; Palumbo, A.; de Luca, L. Design approach to predict synthetic jet formation and resonance amplifications. Exp. Therm. Fluid Sci. 2019, 107, 79–87. [Google Scholar] [CrossRef]
- De Luca, L.; Girfoglio, M.; Chiatto, M.; Coppola, G. Scaling properties of resonant cavities driven by piezo-electric actuators. Sens. Actuators A Phys. 2016, 247, 465–474. [Google Scholar] [CrossRef]
- Gil, P.; Wilk, J.; Korzeniowski, M. Helmholtz Resonance Frequency of the Synthetic Jet Actuator. Appl. Sci. 2021, 11, 5666. [Google Scholar] [CrossRef]
- Kordík, J.; Trávníček, Z. Optimal diameter of nozzles of synthetic jet actuators based on electrodynamic transducers. Exp. Therm. Fluid Sci. 2017, 86, 281–294. [Google Scholar] [CrossRef]
- Gil, P.; Wilk, J.; Smusz, R.; Gałek, R. Centerline heat transfer coefficient distributions of synthetic jets impingement cooling. Int. J. Heat Mass Transf. 2020, 160, 120147. [Google Scholar] [CrossRef]
- Kordík, J.; Trávníček, Z.; Timchenko, V.; Ismail, N.A. The predominant effect of stroke length on velocity profiles at the exit of axisymmetric synthetic jet actuators. Int. J. Heat Fluid Flow. 2017, 66, 197–208. [Google Scholar] [CrossRef]
- Peszynski, K.; Tesař, V. Algebraic model of turbulent flow in ducts of rectangular cross-section with rounded corners. Flow Meas. Instrum. 2020, 75. [Google Scholar] [CrossRef]
- Gil, P. Synthetic jet Reynolds number based on reaction force measurement. J. Fluids Struct. 2018, 81, 466–478, Corrigendum in 2021, 101, 103211. [Google Scholar] [CrossRef]
- Kordík, J.; Trávníček, Z. Integral Quantities of Axisymmetric Synthetic Jets Evaluated from a Direct Jet Thrust Measurement. Flow Turbul. Combust. 2019, 103, 827–844. [Google Scholar] [CrossRef]
- Gil, P.; Strzelczyk, P. Performance and efficiency of loudspeaker driven synthetic jet actuator. Exp. Therm. Fluid Sci. 2016, 76, 163–174. [Google Scholar] [CrossRef]
- Smyk, E.; Wawrzyniak, S.; Peszyński, K. Synthetic jet actuator with two opposite diaphragms. Mech. Mech. Eng. 2020, 24, 17–25. [Google Scholar] [CrossRef]
- Gil, P.; Smyk, E. Synthetic jet actuator efficiency based on the reaction force measurement. Sens. Actuators A Phys. 2019, 295, 405–413. [Google Scholar] [CrossRef]
- Holman, R.; Utturkar, Y.; Mittal, R.; Smith, B.L.; Cattafesta, L. Formation criterion for synthetic jets. AIAA J. 2005, 43, 2110–2116. [Google Scholar] [CrossRef] [Green Version]
- Kercher, D.; Lee, S.J.B.; Brand, O.; Allen, M.G.; Glezer, A. Microjet cooling devices for thermal management of electronics. IEEE Trans. Compon. Packag. Technol. 2003, 26, 359–366. [Google Scholar] [CrossRef]
- Mangate, L.; Yadav, H.; Agrawal, A.; Chaudhari, M. Experimental investigation on thermal and flow characteristics of synthetic jet with multiple-orifice of different shapes. Int. J. Therm. Sci. 2019, 140, 344–357. [Google Scholar] [CrossRef]
- Gil, P.; Wilk, J. Heat transfer coefficients during the impingement cooling with the use of synthetic jet. Int. J. Therm. Sci. 2020, 147, 106132. [Google Scholar] [CrossRef]
Figure 1.
The model of SJA (a), and the test stand with the actuator 1B (b).
Figure 1.
The model of SJA (a), and the test stand with the actuator 1B (b).
Figure 2.
The centerline momentum velocity as a function of frequency at p = 3 W, x = 0.
Figure 2.
The centerline momentum velocity as a function of frequency at p = 3 W, x = 0.
Figure 3.
The peak-to-peak, centerline velocity as a function of frequency at p = 3 W, x = 0.
Figure 3.
The peak-to-peak, centerline velocity as a function of frequency at p = 3 W, x = 0.
Figure 4.
The power factor as a function of frequency at p = 3 W.
Figure 4.
The power factor as a function of frequency at p = 3 W.
Figure 5.
The centerline momentum velocity (a), and the percentage difference between the velocity in cases B and A (b) as a function of real power, at the characteristic frequency and x = 0.
Figure 5.
The centerline momentum velocity (a), and the percentage difference between the velocity in cases B and A (b) as a function of real power, at the characteristic frequency and x = 0.
Figure 6.
The supposed way of air ingestion for the synthetic jet with (a) and without (b) confinement plate.
Figure 6.
The supposed way of air ingestion for the synthetic jet with (a) and without (b) confinement plate.
Figure 7.
The percentage difference between the maximal (a) and minimal (b) centerline velocity in cases B and A as a function of real power, at the characteristic frequency and x = 0.
Figure 7.
The percentage difference between the maximal (a) and minimal (b) centerline velocity in cases B and A as a function of real power, at the characteristic frequency and x = 0.
Figure 8.
The dimensionless stroke length vs. the Reynolds number.
Figure 8.
The dimensionless stroke length vs. the Reynolds number.
Figure 9.
The average-to-centerline ratio vs. the dimensionless stroke length.
Figure 9.
The average-to-centerline ratio vs. the dimensionless stroke length.
Figure 10.
The axial centerline momentum velocity (a), and the axial centerline momentum velocity ratio (b) as a function of axial distance x/d, at the characteristic frequency and real power p = 5 W.
Figure 10.
The axial centerline momentum velocity (a), and the axial centerline momentum velocity ratio (b) as a function of axial distance x/d, at the characteristic frequency and real power p = 5 W.
Figure 11.
The maxima (a) and minimal (b) centerline velocity as a function of axial distance x/d and close-ups on selected areas of the charts, at the characteristic frequency and real power p = 5 W.
Figure 11.
The maxima (a) and minimal (b) centerline velocity as a function of axial distance x/d and close-ups on selected areas of the charts, at the characteristic frequency and real power p = 5 W.
Table 1.
Matrix of parameters.
Table 1.
Matrix of parameters.
| | Orifice Diameter
d, mm | Orifice Height
t, mm | t/d | Confinement Area
A, mm2 |
|---|
| Case 0 | 20 | 5 | 0.25 | 25,132.74 |
| Case 1A | 20 | 20 | 1 | 25,132.74 |
| Case 2A | 20 | 40 | 2 | 25,132.74 |
| Case 3A | 20 | 60 | 3 | 25,132.74 |
| Case 1B | 20 | 20 | 1 | 138.23 |
| Case 2B | 20 | 40 | 2 | 138.23 |
| Case 3B | 20 | 60 | 3 | 138.23 |
Table 2.
Uncertainty of measurements.
Table 2.
Uncertainty of measurements.
| Name | Relative
Uncertainty | Absolute
Uncertainty |
|---|
| Area, A | ±0.15% | |
| Power, P | ±2% | |
Velocity, u
(calibration accuracy) | ±2% (2.6–49 m/s) | ±0.1 m/s (<2.6 m/s) |
Table 3.
Resonant frequencies and velocity.
Table 3.
Resonant frequencies and velocity.
| | Frequency,
fr, Hz | Velocity
Uc(fr) [m/s] | Frequency from [23]
fr,1, Hz | Velocity
Uc(fr,1) [m/s] | Velocity Relative
Difference, % |
|---|
| Case 0 | 19 | 13.84 | 28 | 13.51 | 2.4 |
| Case 1A | 19 | 15.21 | 22 | 14.94 | 1.7 |
| Case 2A | 15 | 14.67 | 16 | 14.57 | 0.7 |
| Case 3A | 14 | 14.09 | 16 | 13.67 | 3.0 |
| Case 1B | 16 | 15.37 | 22 | 14.86 | 3.4 |
| Case 2B | 16 | 14.95 | 16 | 14.95 | 0 |
| Case 3B | 13 | 14.44 | 16 | 14.33 | 0.8 |
| Publisher’s Note: MDPI stays neutral with regard to jurisdictional claims in published maps and institutional affiliations. |
© 2021 by the authors. Licensee MDPI, Basel, Switzerland. This article is an open access article distributed under the terms and conditions of the Creative Commons Attribution (CC BY) license (https://creativecommons.org/licenses/by/4.0/).


