1. Introduction
Electro-hydraulic servovalves provide very accurate flow control and a very fast response in hydraulic systems demanding high performance levels [
1,
2]. There are mainly two types of commercially available servovalves: the two-stage type, in which a torque motor is used to amplify the hydraulic power by means of a pilot stage, and the direct-drive type, in which the spool is directly driven by a linear force motor. The former can have mechanical or electrical feedback for the control of the spool position; the latter usually has only electrical feedback [
1]. The former is the most common architecture, since a two-stage architecture provides several benefits, such as very high actuation forces and low weight in addition to a fast response speed, thus being very appropriate for aeronautical applications. However, it has a few shortcomings, such as high manufacturing costs, complex structure, high leakage in the pilot stage [
1], and significant vibration of the torque motor [
3]. The pilot stages are also subject to intense cavitation, and current research studies aim at tackling this issue by proposing novel solutions and investigations [
4,
5,
6,
7]. Electrical faults in the pilot stage may also occur, including permanent magnet demagnetization, aging of the electrical components, coil faults, amplifier faults, and sensor faults [
8].
Direct-drive servovalves are produced by companies such as Moog [
9,
10], the world-leading manufacturer of servovalves, using linear force motors (LFMs) to directly move the spool inside its bushing sleeve. LFMs, employing rare earth magnets, have larger actuation forces, better linearity and a faster dynamic response than proportional solenoids, thus having better performance and wider operation ranges [
11].
A direct drive architecture has the disadvantage of having lower actuation forces than two-stage servovalves; hence, it has lower chip shear capability and a lower response speed [
1]. In addition, an LFM, being approximately the same size as the main stage, is much larger and heavier than a torque motor. Compared to a two-stage servovalve, a direct drive servovalve is therefore less convenient for some applications, such as aircraft, where the actuation forces and weight are important factors. Instead, for those industrial applications where these factors are less important, a direct drive servovalve is an interesting architecture, especially in terms of simplicity of construction, in contrast to the complexity of pilot stages, which have many finely toleranced parts, some of them needing to be assembled manually [
1].
This paper investigates whether a direct drive servovalve can be actuated by piezo-electric actuators (PEAs) in place of linear force motors. A PEA is a device based on the piezoelectric effect, namely, when an electric field is applied to a piezoceramic material, actuation force and displacement are generated. The excellent characteristics of PEAs, such as simple designs, reduced moving parts, high reliability and fast response, make them useful in several industrial applications [
12]. The application of PEAs for the actuation of valves can allow the settling time to be minimized, as shown in [
13], in which a new microvalve design was actuated by a piezoelectric bending cantilever.
Therefore, as far as the actuation of servovalves is concerned, the use of PEAs instead of electromagnetic actuators could lead to faster response time; in addition, lower energy consumption in the stationary state, smaller mass in motion, and simplification of the mechanical transmission can be achieved [
14]. An issue could be hysteresis, which is quite significant in piezo-electric actuators; however, effective compensation techniques already exist in the literature [
15], and closed-loop control can be used to reduce the effect of hysteresis.
Commercially available PEAs are rectangular and ring benders, piezo-stacks and amplified piezo-stacks [
14]. Ring benders and rectangular benders were demonstrated to be suitable for the actuation of the pilot stages of servovalves [
16,
17,
18,
19]. A novel two-stage architecture employing two ring benders was studied by us in references [
20,
21], and its feasibility was assessed using a detailed Simulink model of the hydraulic, mechanical and electrical parts.
Those studies proved that ring benders and rectangular benders are suitable for the actuation of the pilot stages of servovalves; however, they are not appropriate for the direct actuation of a main spool due to their low displacement and low actuation forces.
Piezo-stacks are different from ring benders and rectangular benders, being composed of many piezoelectric ceramic layers stacked to form a long actuator. The overall elongation is given by the sum of the contributions of all layers [
22]. A very interesting paper testing a throttle valve prototype controlled by piezoelectric stacks can be found in [
23].
There are more examples of applications of piezo-stacks for the direct actuation of servovalves [
24], but the main disadvantage is given by the large dimensions of the piezo-stacks needed for this purpose. Indeed, as a rough estimate, a piezo-stack that is 15 cm long can produce a maximum free stroke of only 240 μm in one direction [
14]; therefore, to obtain a displacement of 500 μm in one direction, a very large piezo-stack (about 30 cm long) is needed.
An amplified piezo-stack actuator allows for higher displacement to be achieved compared to a piezo stack. It is composed of a piezo-stack and an amplification system which is adopted to increase the displacement of the piezo-stack [
14]. By virtue of the increased displacement, the direct actuation of a main spool is feasible. In the literature, there are two studies proposing servo-valves directly driven by amplified piezo-stacks [
25,
26]. In both cases, the mechanical amplifier is based on a lever mechanism. This valve configuration, despite providing a limited maximum flow rate (around 8 L/min for an inlet pressure of 40 bar [
26]), shows that the concept is viable.
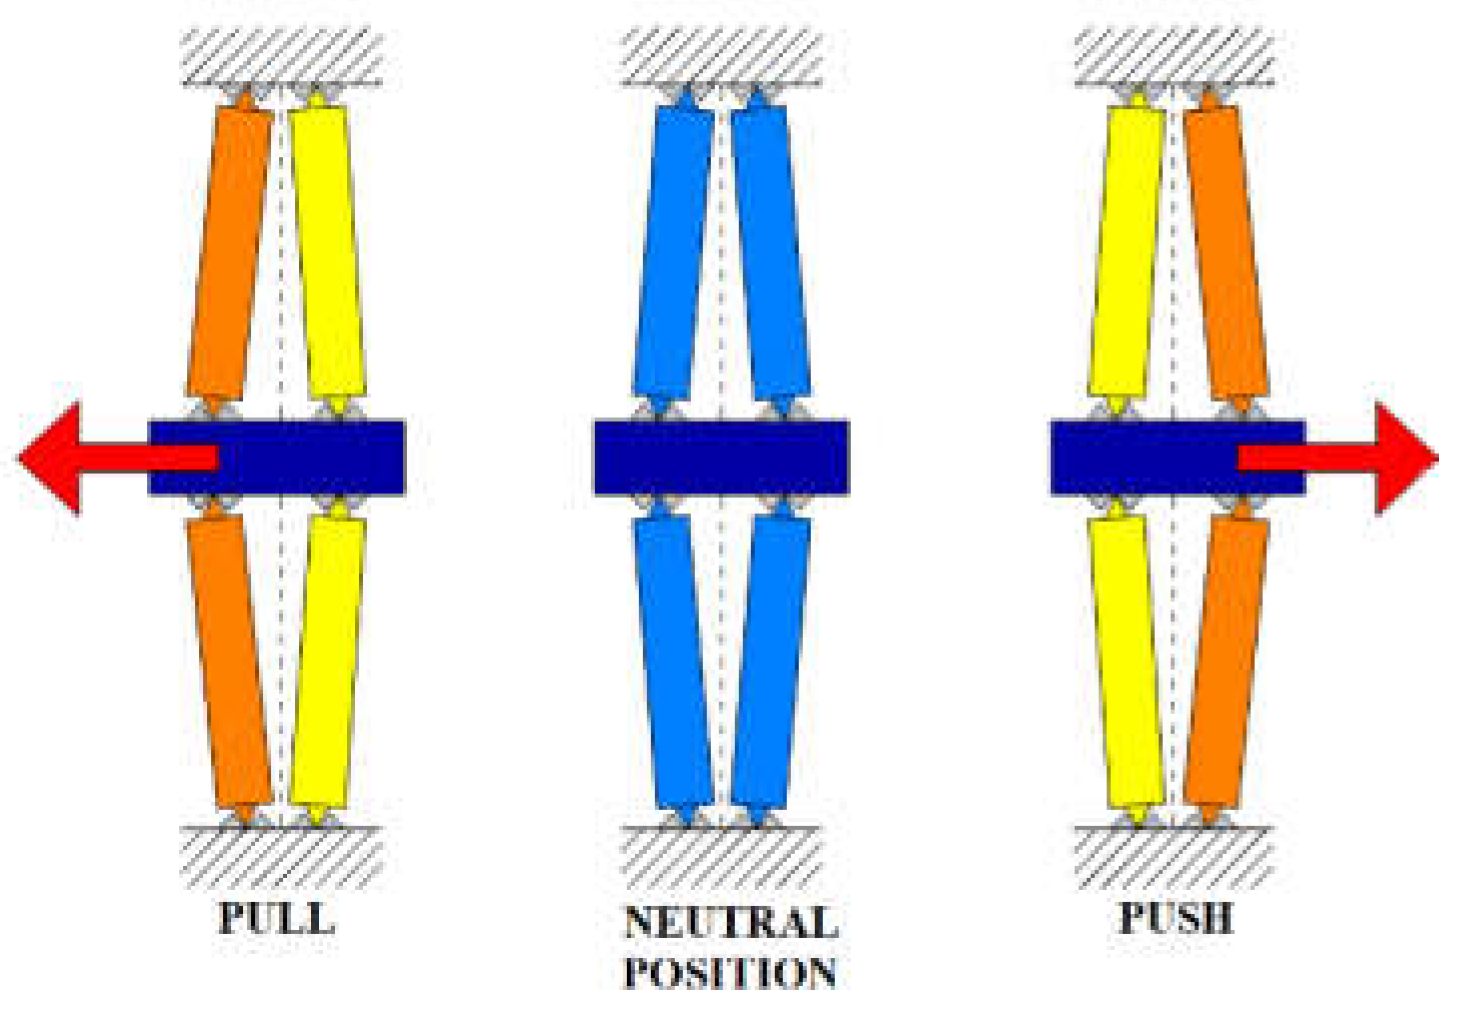
The idea here investigated thoroughly consists in using, in place of linear force motors, commercially available amplified piezo-stacks having diamond amplification mechanisms for the direct actuation of servovalves, in order to exploit the advantages that such amplified piezo stacks can provide, such as fast response and low weight. This idea was presented in [
27], where a preliminary feasibility study was performed using a simplified Simulink model in order to predict simple open-loop test tests. In this paper, a more complete assessment is performed using a more detailed Simulink model, which is now able to simulate hysteresis and to simulate closed-loop control. In addition to more open-loop step tests, the effects of using different amplifiers and of using different operating pressures are evaluated; closed-loop test tests are also simulated along with a detailed closed-loop frequency analysis aimed at obtaining the Bode plot of the proposed valve architecture.
Firstly, two possible configurations, using one or two amplified piezo-stacks, are presented in this paper. Then, the improved Simulink model, employed to predict the performance of one of these configurations, in terms of maximum displacement and maximum flow rate, step response speed and frequency response, is described. Advantages and disadvantages of this architecture, deduced by the simulation results and by the analysis of the characteristics of the amplified piezo-stack, are finally discussed in detail.
3. Results
The results of the numerical simulations are now presented and discussed. Firstly, the hysteresis model was validated against the data provided by Noliac on their website [
14].
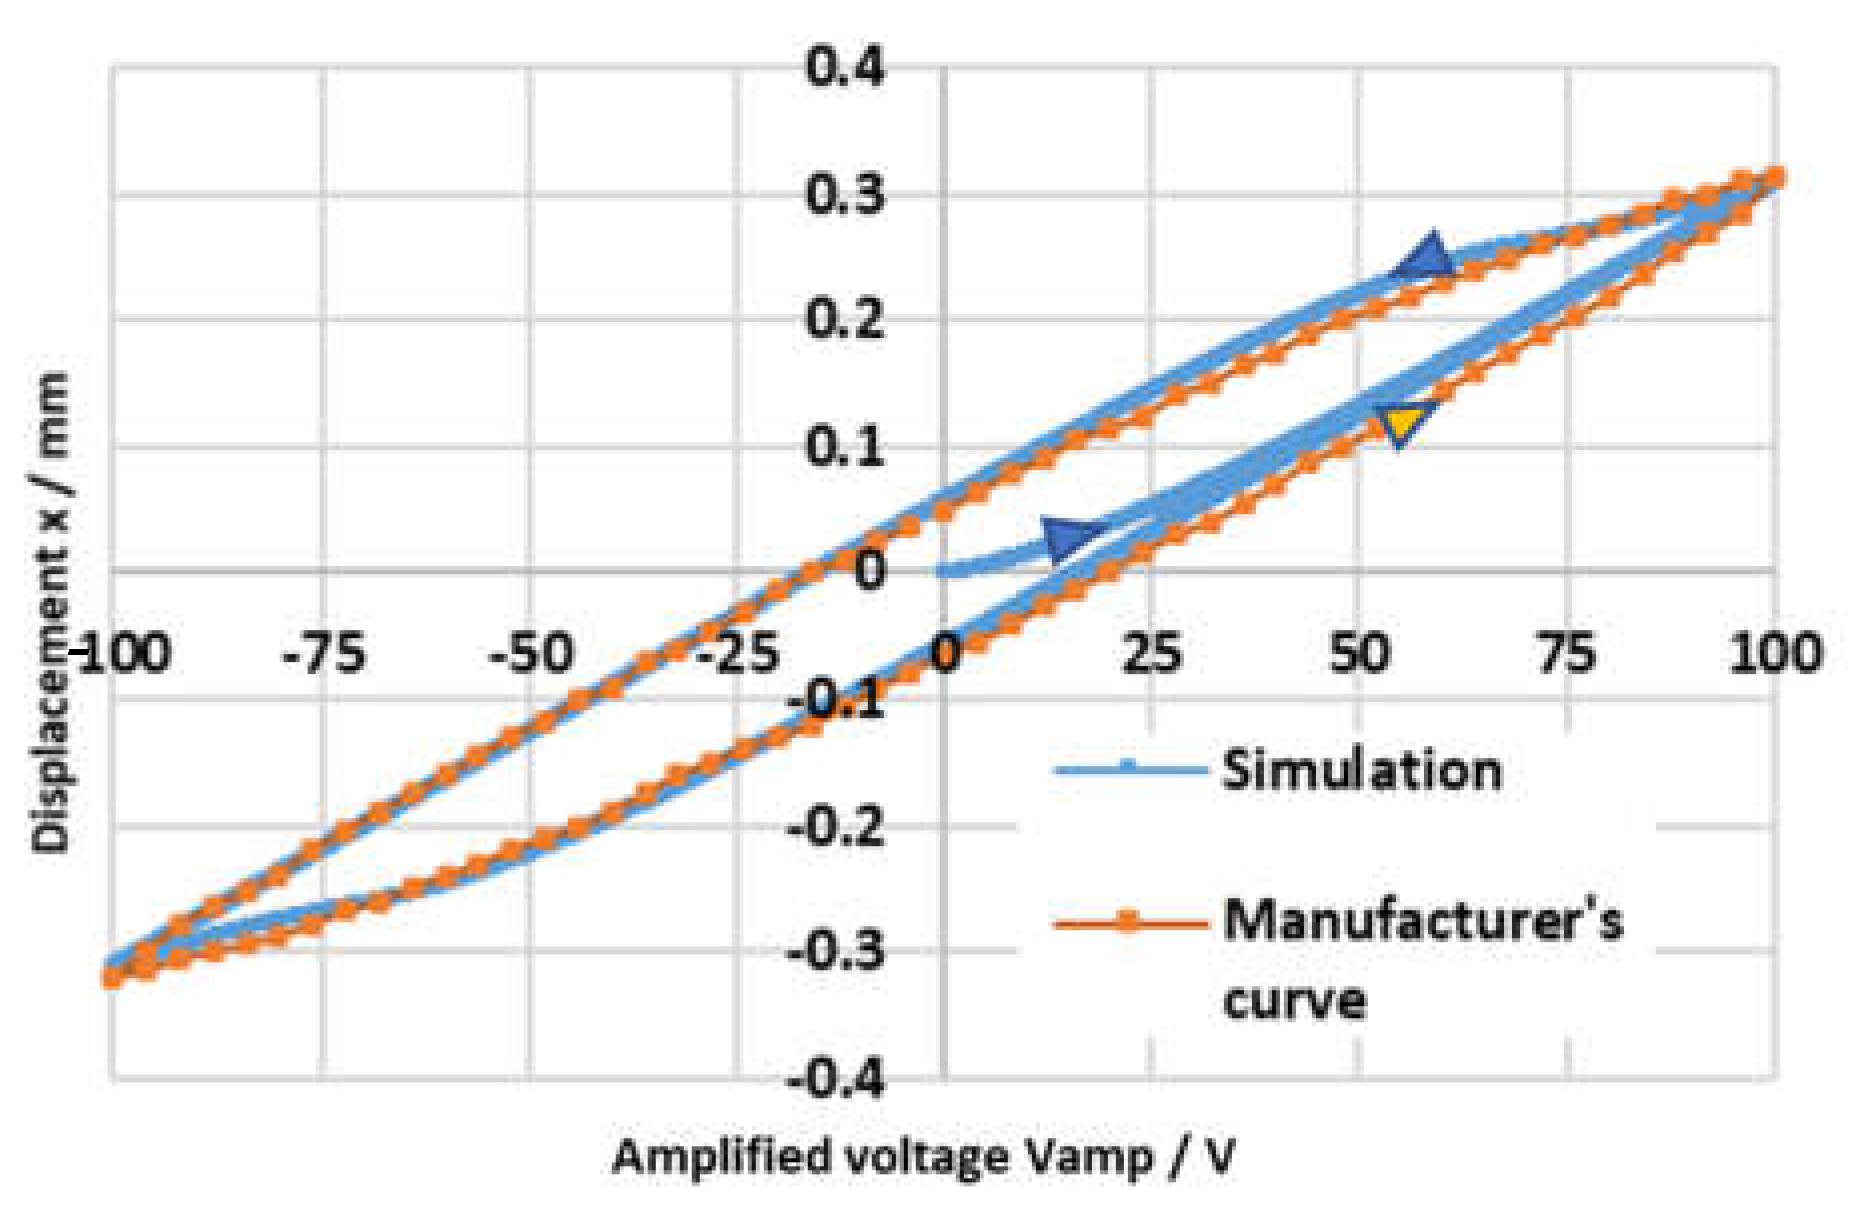
Figure 4 shows the hysteresis curve (displacement of the slider
x vs. amplified voltage
) provided by the manufacturer for model NAC2643 (the only hysteresis curve available), plotted as an orange curve. The simulated hysteresis curve (plotted in blue) was obtained using the above-mentioned equations with the tuned parameters
α = 0.7,
β = 0.013,
δ = 0.03 and
= 1.19, by applying a 1 Hz sinusoidal input voltage
with a 5 V amplitude (from −5 V to +5 V), with no load applied (i.e.,
), and using the characteristics of model NAC2643 (
. The amplifier employed in previous studies was assumed to be used in these simulations [
20]; it is characterized by
= 1400 rad/s and
= 1.5 (
Imax = 1 A). Its cut-off frequency (calculated as the frequency at which the amplitude ratio is −3 dB) is 83 Hz. The good correspondence between the simulation curve and the manufacturer’s curve shows the accuracy of the hysteresis model.
After the validation of the hysteresis model, the architecture of
Figure 2a was simulated using the full numerical code described in
Section 2.2. The amplified piezo-stack employed in the simulations was model NAC2645, being capable of producing the highest value of maximum free stroke (
= ±475 μm working in push/pull mode). The maximum blocking force of this model is
= 332 N; its stiffness is
= 700,000 N/m. The overall mass of the amplified piezo-stack comprising the case (which is the heaviest part, being realized in stainless steel [
14]) is 160 g; as already mentioned, in the simulations, the mass of the moving parts of the amplified piezo-stack
was assumed to be one half of the overall mass, namely,
= 80 g. Given the very similar characteristics between model NAC2643 and model NAC2645, the same tuned parameters
α = 0.7,
β = 0.013,
δ = 0.03 and
= 1.19 were used in this analysis to simulate the hysteresis of model NAC2645. In this regard,
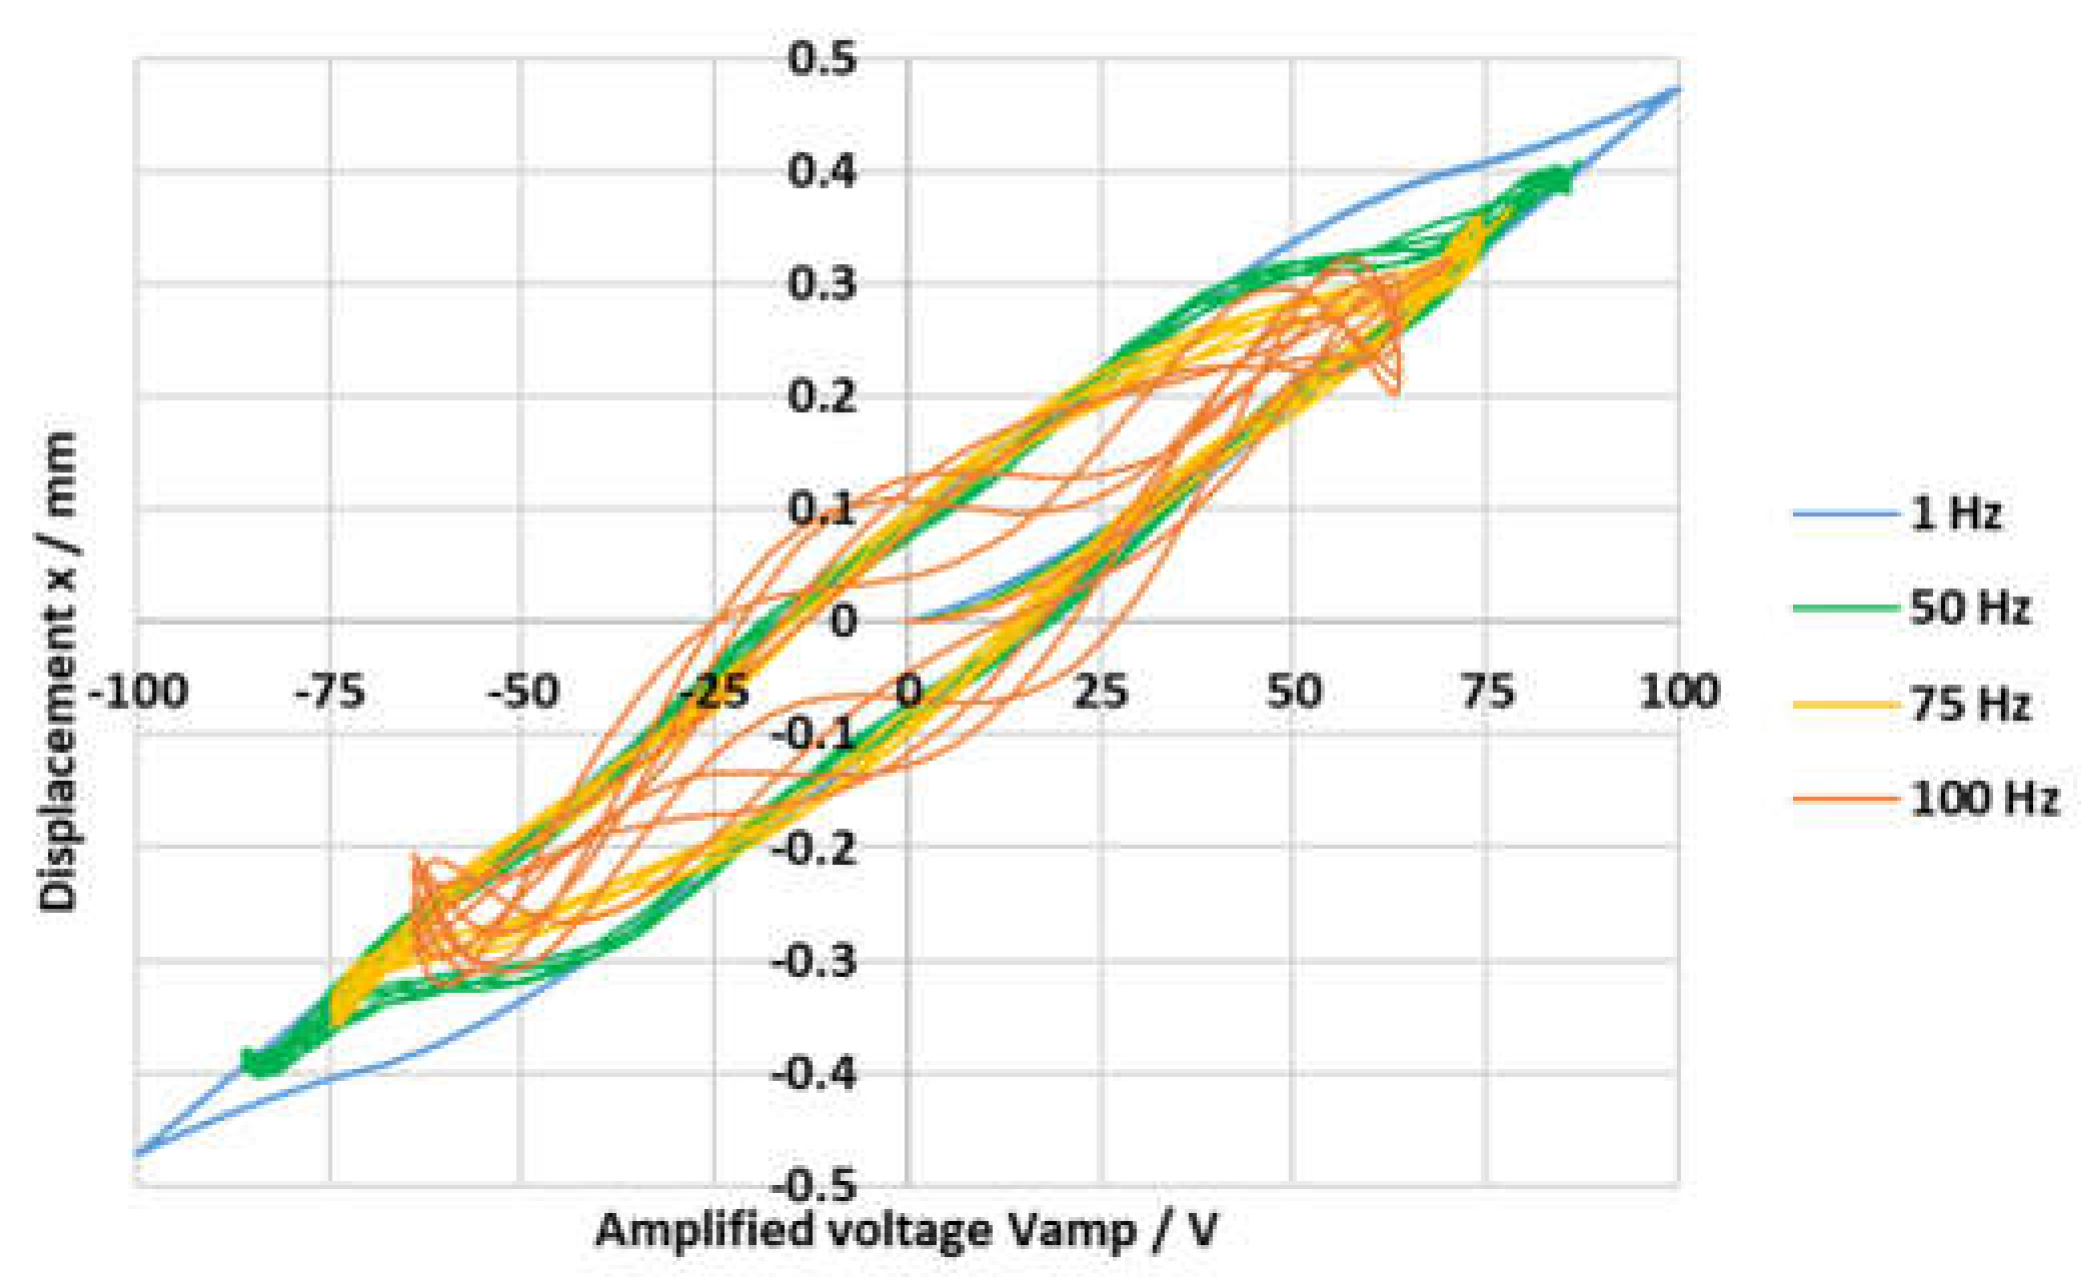
Figure 5 shows how the hysteresis curve of model NAC2645 changes according to the frequency of the input voltage
(sine wave from −5 V to +5 V), with no load applied (i.e.,
), and with
= 1400 rad/s and
= 1.5 (
Imax = 1 A).
Concerning the simulation of the entire valve architecture of
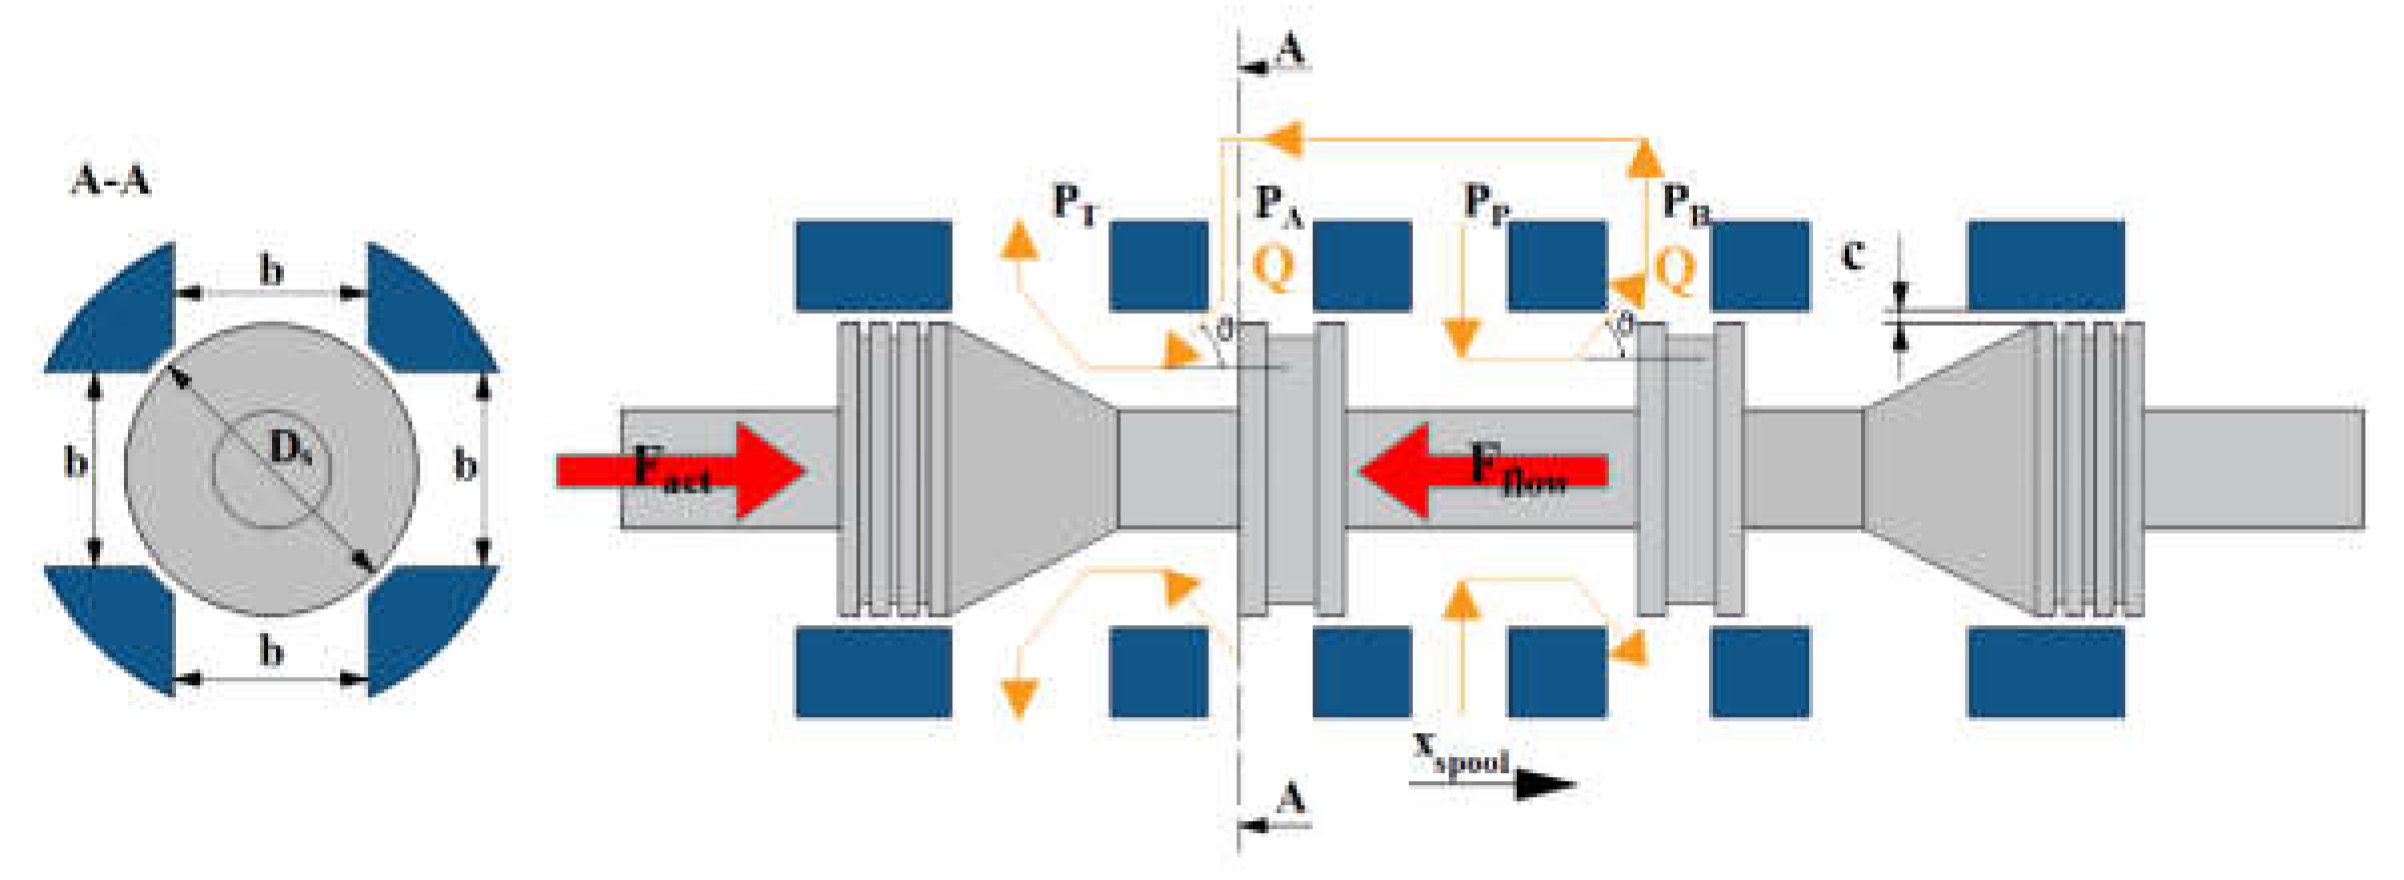
Figure 2a, a large size spool was used in the simulations, having a diameter of 15 mm and a mass of 30 g. The slot width was taken equal to 2/3 of the whole spool perimeter; therefore,
b = 31.42 mm. The clearance was assumed to be
c = 3 μm, being a typical value of servovalves [
31], leading to
= 0.09425 mm
2. The oil was assumed to be ISO VG 32 at 50 °C, characterized by
ρ = 851 kg/m
3 and
μ = 0.0187 kg/(m s). The damping factor of the spool was calculated using Equation (7): assuming a spool length equal to
= 50 mm and an eccentricity equal to
ε = 1 μm (common values for servovalves [
1]), the calculated damping factor is
= 15 Ns/m.
Concerning the discharge coefficient, it was assumed, for simplicity, to be constant and equal to
= 0.7. Because of the large pressure drops used in the simulations, this assumption can be considered valid for a large part of the spool stroke, when the flow is turbulent and, for turbulent flows, the discharge coefficient in servovalves is constant, ranging from 0.65 to 0.7 regardless of the spool position [
1,
33], unlike the discharge coefficient in proportional valves which can have different values even for turbulent flows depending on the notch geometry and on the spool position [
34]. The flow in the metering chamber of a servovalve is laminar only for very low values of the Reynolds number, usually for Re < 200 to 400 [
1,
29]; therefore, an error is introduced only at the very small opening degrees, without affecting the overall simulation. Similar considerations can be made for the flow angle, whose value was experimentally and numerically estimated to be around 69° for turbulent flows in servovalves [
29,
30,
33]. Therefore,
θ = 69° was imposed in Equation (8) to calculate the flow forces. Concerning the simulation of the amplifier, it was operated from −100 V to +100 V (the control voltage
being comprised between −5 V and +5 V, thus
= 20), the sign of the signal determining the direction of slider movement. All these parameters are reported in
Table 2 for completeness.
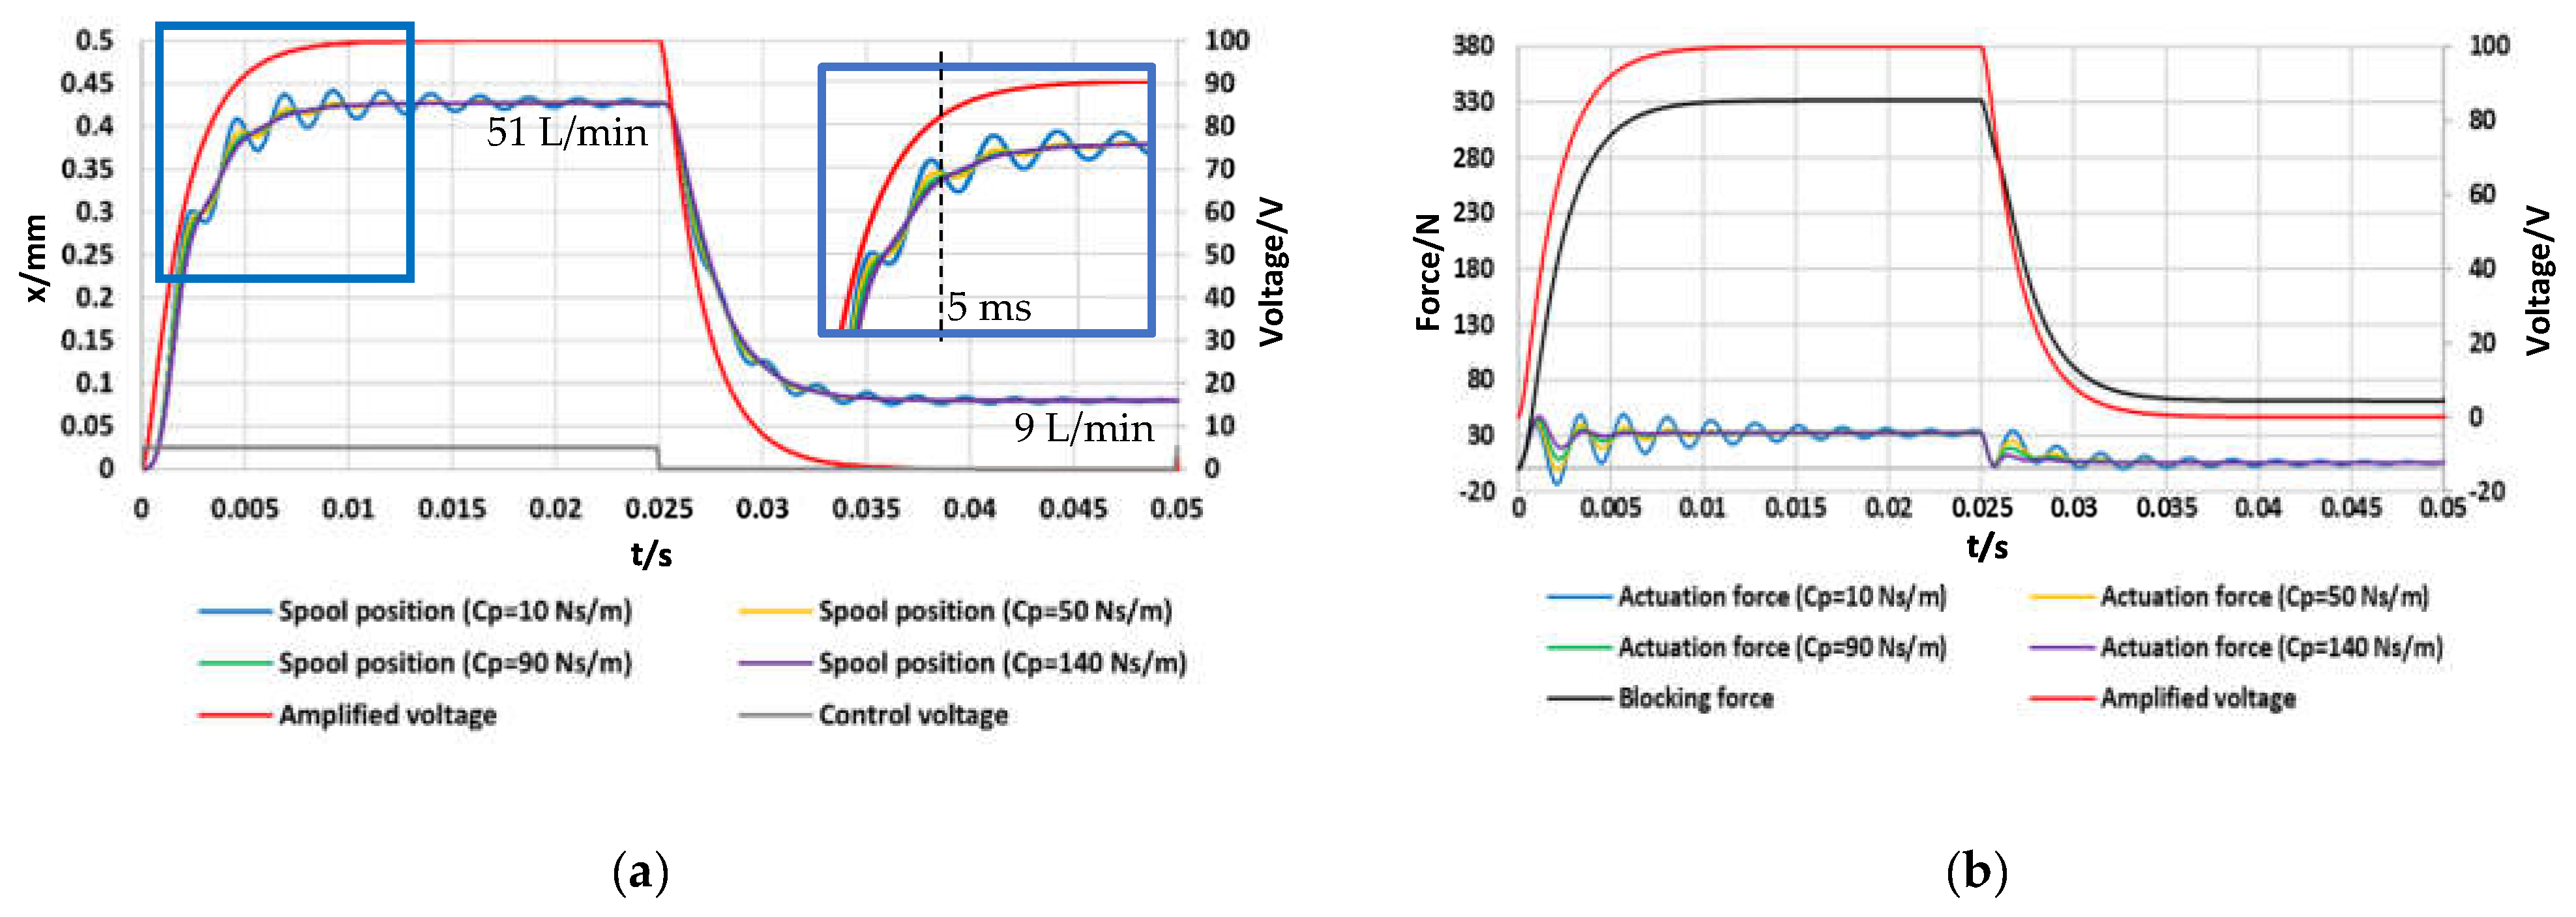
Figure 6a shows the time history of the spool position simulated in a step test in which the control voltage
was initially changed from 0 V to +5 V, and then from +5 V to 0 V, with an inlet pressure
= 71 bar and a discharge pressure
= 1 bar (overall pressure drop
= 70 bar), using the parameters of
Table 2.
Figure 6b shows the corresponding time history of the actuation force. The different curves were obtained for different values of the damping factor of the amplified piezo-stack, namely,
= 10, 50, 90, 140 Ns/m, since the damping factor of the amplified piezo-stack depends on the geometry of the housing in which it is placed (affecting how the oil is displaced). Therefore, we can assume that it is possible to obtain these values by properly designing the geometry of the housing.
All the curves of the spool position in
Figure 6a show oscillations, which are quite large for small values of
, while becoming negligible for larger values of
. Therefore, the response is very good for high values of
, with less than 10 ms being predicted on average to reach a stable condition. Instead, for low values of
, the output takes more time to reach a stable condition because of the large oscillations. This suggests that, if the housing of the amplified piezo-stack produces low values of the damping factor, changes can be made to the housing in order to increase the damping factor and reduce possible oscillations of the spool. However, in all the cases (regardless of the value of
), the time interval taken to reach 90% of the maximum opening is very short, being of the order of 5 ms.
The spool displacement reached for = +5 V is about 0.43 mm, which is similar to that achievable with linear force motors (±0.5 mm), and a high value of flow rate is achieved at the maximum opening (51 L/min for = 70 bar). When the control voltage returns to 0 V, the simulated spool position is greater than zero because of the hysteresis occurring in the amplified piezo-stack; this confirms that closed-loop controls must be employed to cope with hysteresis.
Concerning the actuation force, calculated as the difference between the blocking force (
) and the internal spring force (
), the graph of
Figure 6b reveals that the maximum value imposed by the manufacturer (
= 200 N at 50 °C) is never reached. This is due to the fact that the blocking force (black curve) has the same trend as the amplified voltage (red curve), and the maximum blocking force (
≃ 330 N) is obtained when
= +100 V. Because of the time interval taken by the amplifier to transform +5 V into +100 V, the maximum blocking force is obtained approximately in correspondence of the maximum opening, when the elastic force is maximum; as a result, the actuation force is always well below 200 N. Notably, the values of the actuation force become negative after about 2 ms for low values of the damping factor. This happens when the internal spring force momentarily exceeds the blocking force.
The curves of
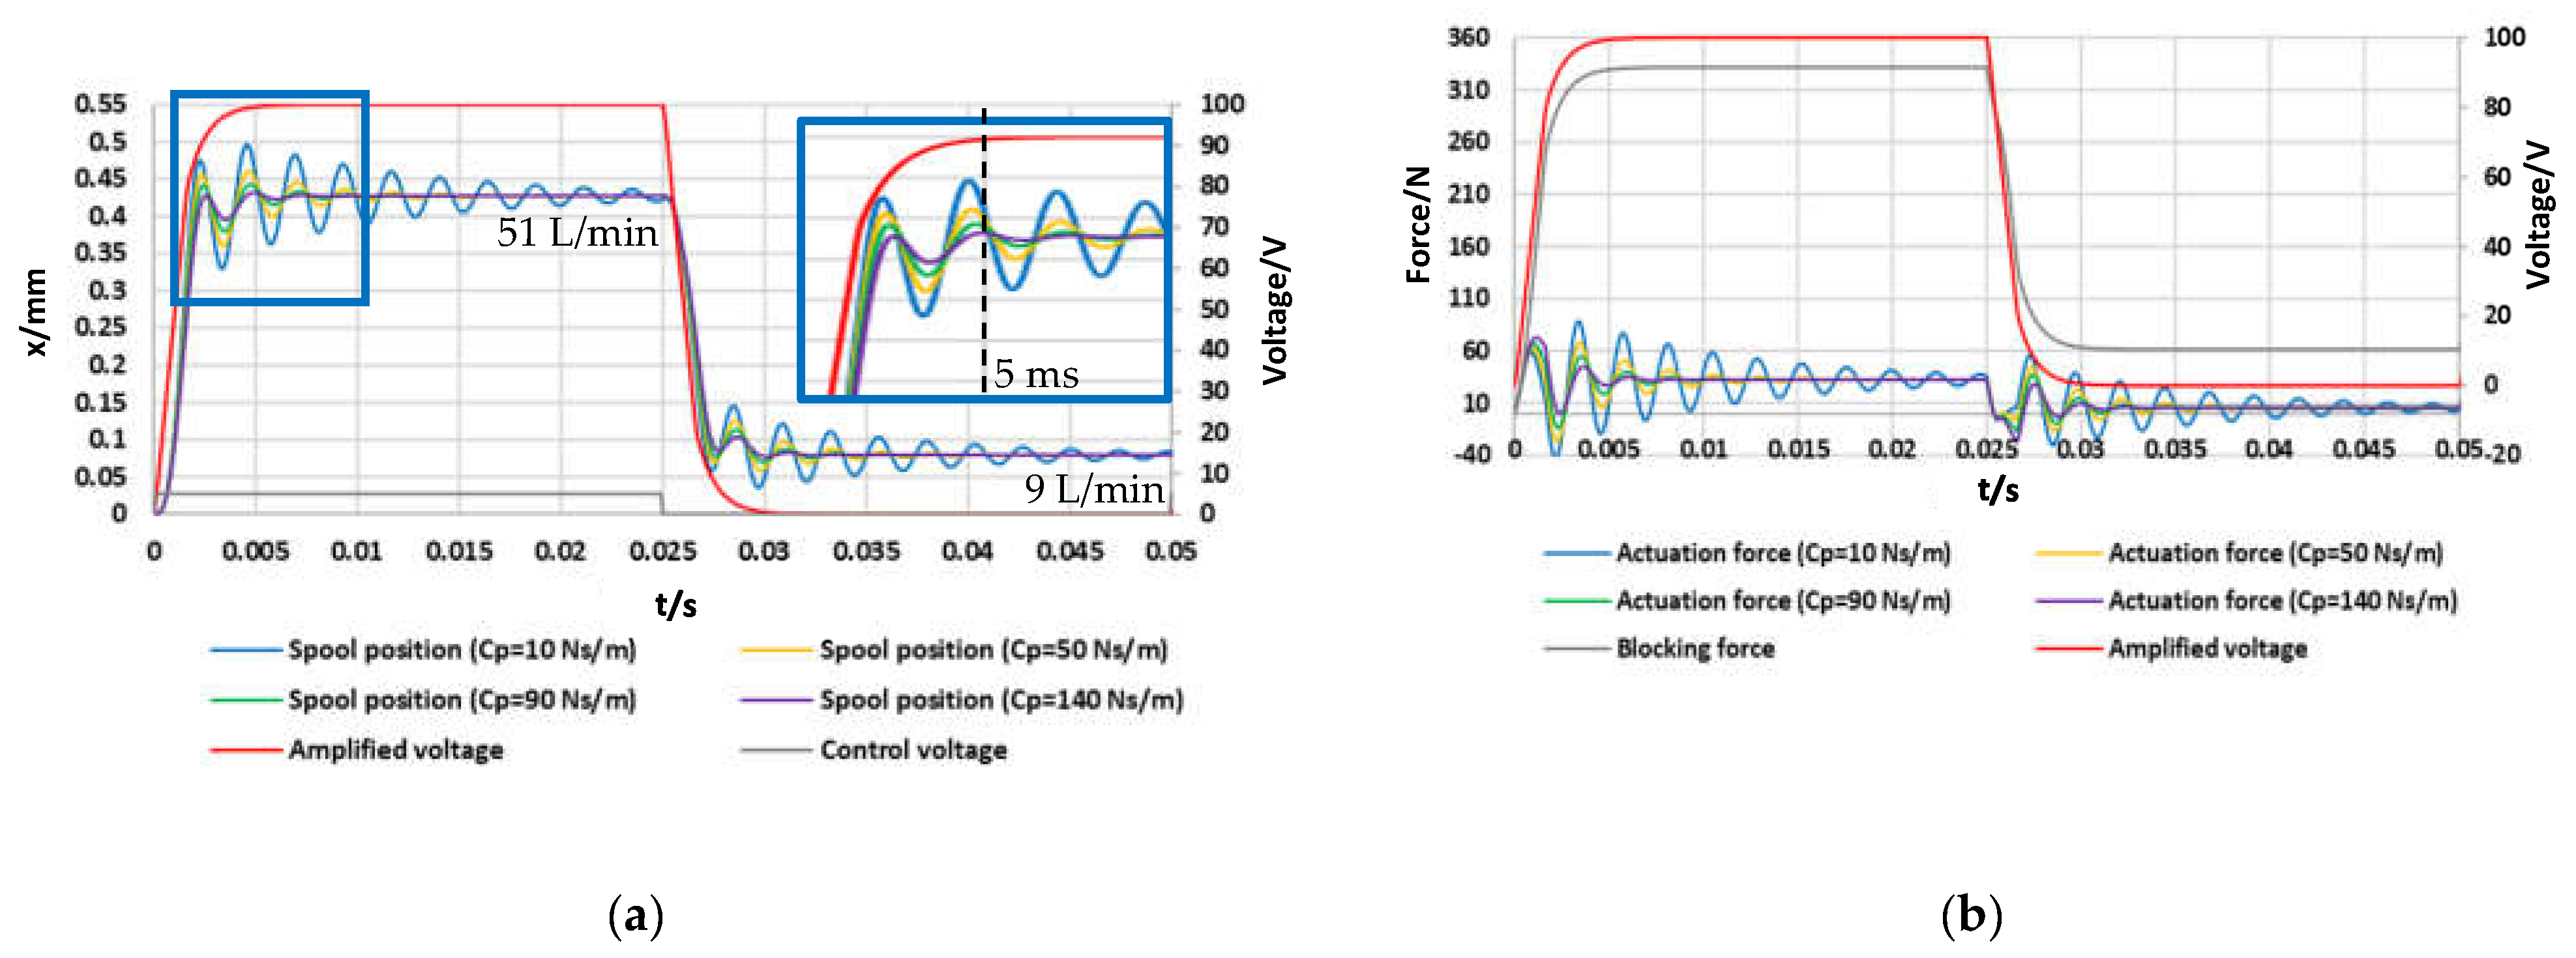
Figure 6a,b were obtained using an amplifier having
= 1400 rad/s; it is evident that the response time of this amplifier has a great effect on the response of the valve, since the blocking force has the same trend as that of the amplified voltage. To evaluate the effects of using a different amplifier,
Figure 7a,b, respectively, show the time history of the spool position and of the actuation force simulated for the same conditions as those of
Figure 6a,b, but using a different amplifier having
= 2800 rad/s (while maintaining
= 1.5 and
Imax = 1 A). Its cut-off frequency (calculated as the frequency at which the amplitude ratio is −3 dB) is 162 Hz. These curves show that the use of an amplifier with higher natural frequency can further improve the response time of the valve. Indeed, for high values of
, the time taken to reach a stable position is only slightly longer than 5 ms. In all the cases, regardless of the value of
, the time interval taken to reach 90% of the maximum opening is less than 3 ms, denoting a very fast response.
The results that are going to be presented from now on were obtained using the former amplifier, having
= 1400 rad/s, keeping in mind that the transient response can further be shortened by using amplifiers with higher natural frequencies.
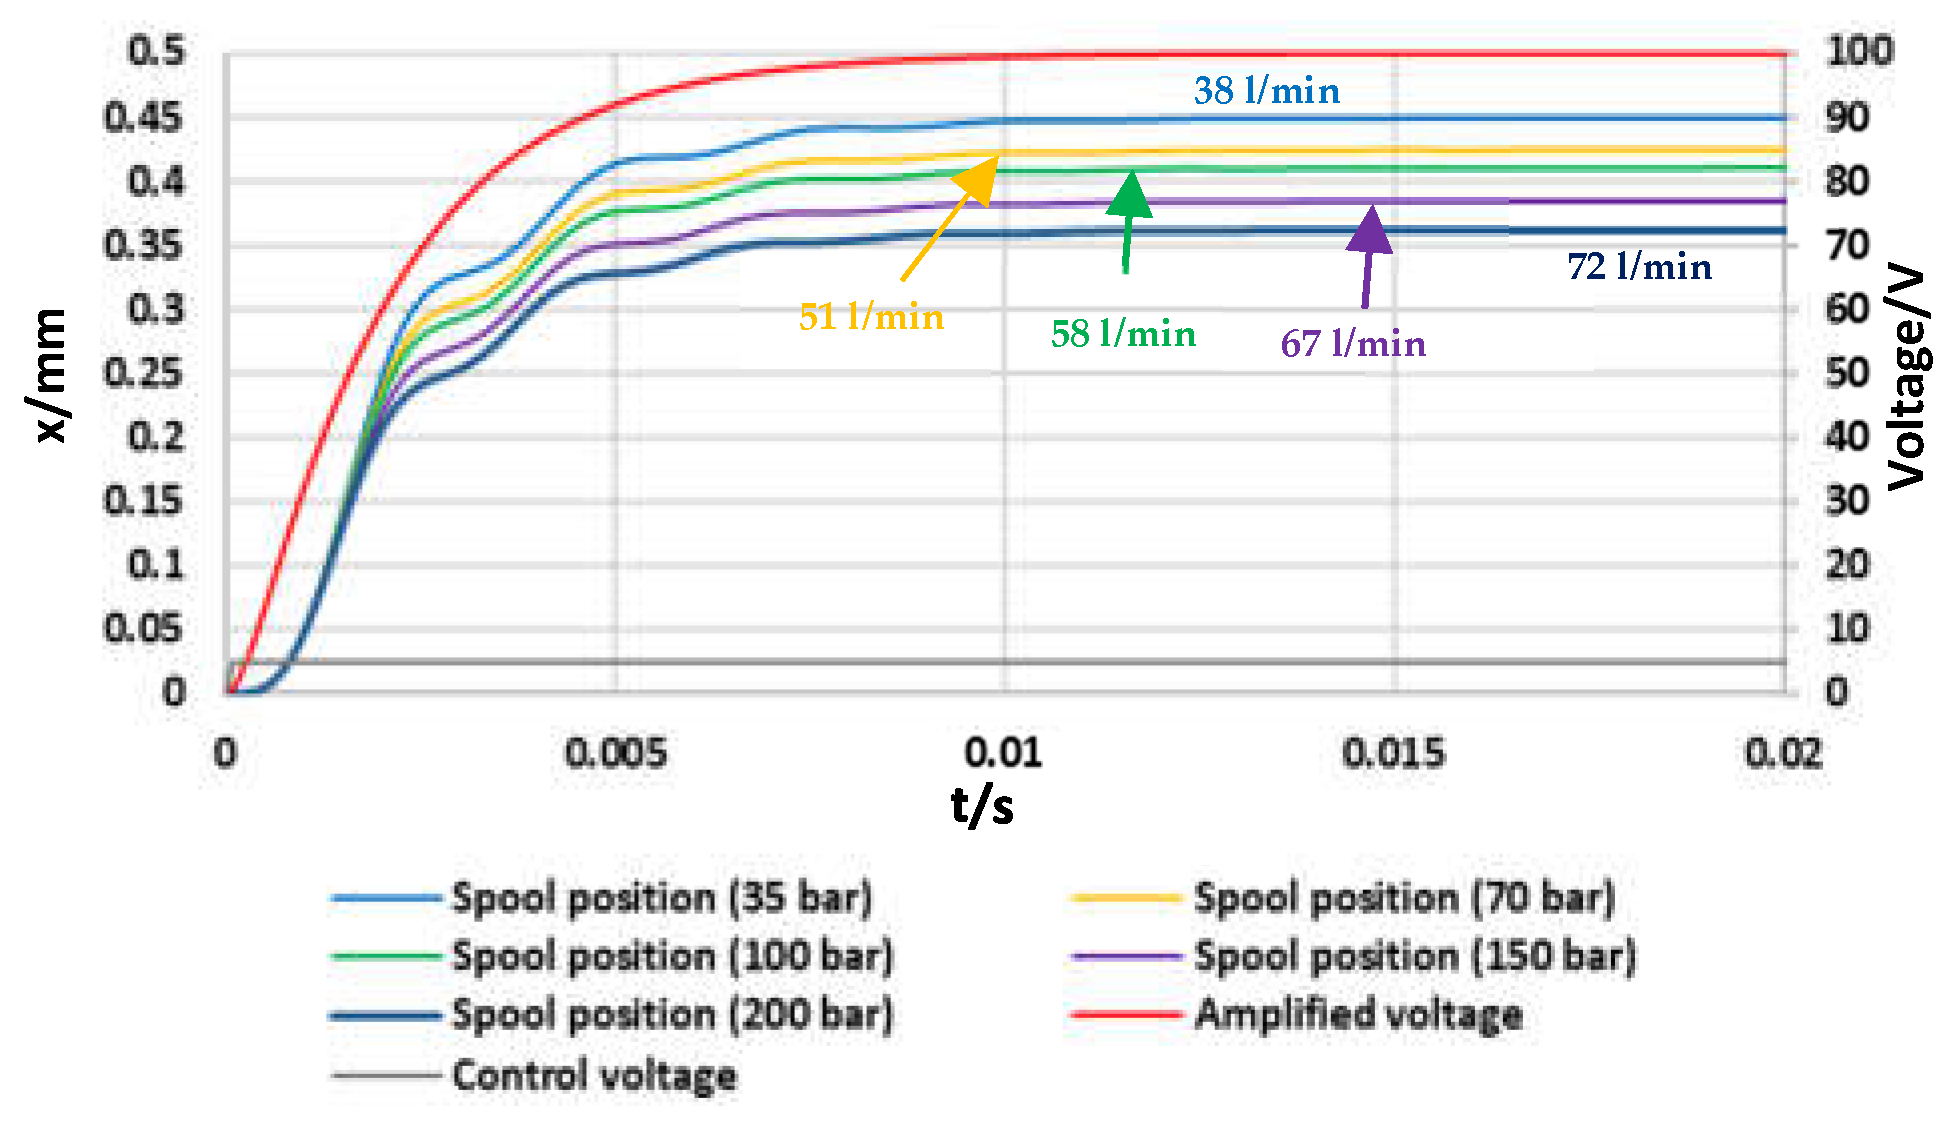
Figure 8 shows open-loop step tests, from
= 0 V to
= +5 V, predicted for different values of the overall pressure drop (
). The results were obtained using the parameters of
Table 2,
= 90 Ns/m,
= 80 g, and
= 1400 rad/s. As shown in the graphs, the response (initial part of the spool position curve) remains almost unchanged regardless of the pressure drop, which is typical of a direct drive valve. It is noteworthy that high levels of inlet pressure can be sustained by the valve, and hence, high flow rates can be reached (72 L/min at 200 bar). Note that the final spool position (for
= +100 V) slightly decreases with the pressure drop, since the flow force increases with the pressure drop.
In
Figure 6,
Figure 7 and
Figure 8, the mass of the moving parts of the amplified piezo-stack actuator was set to
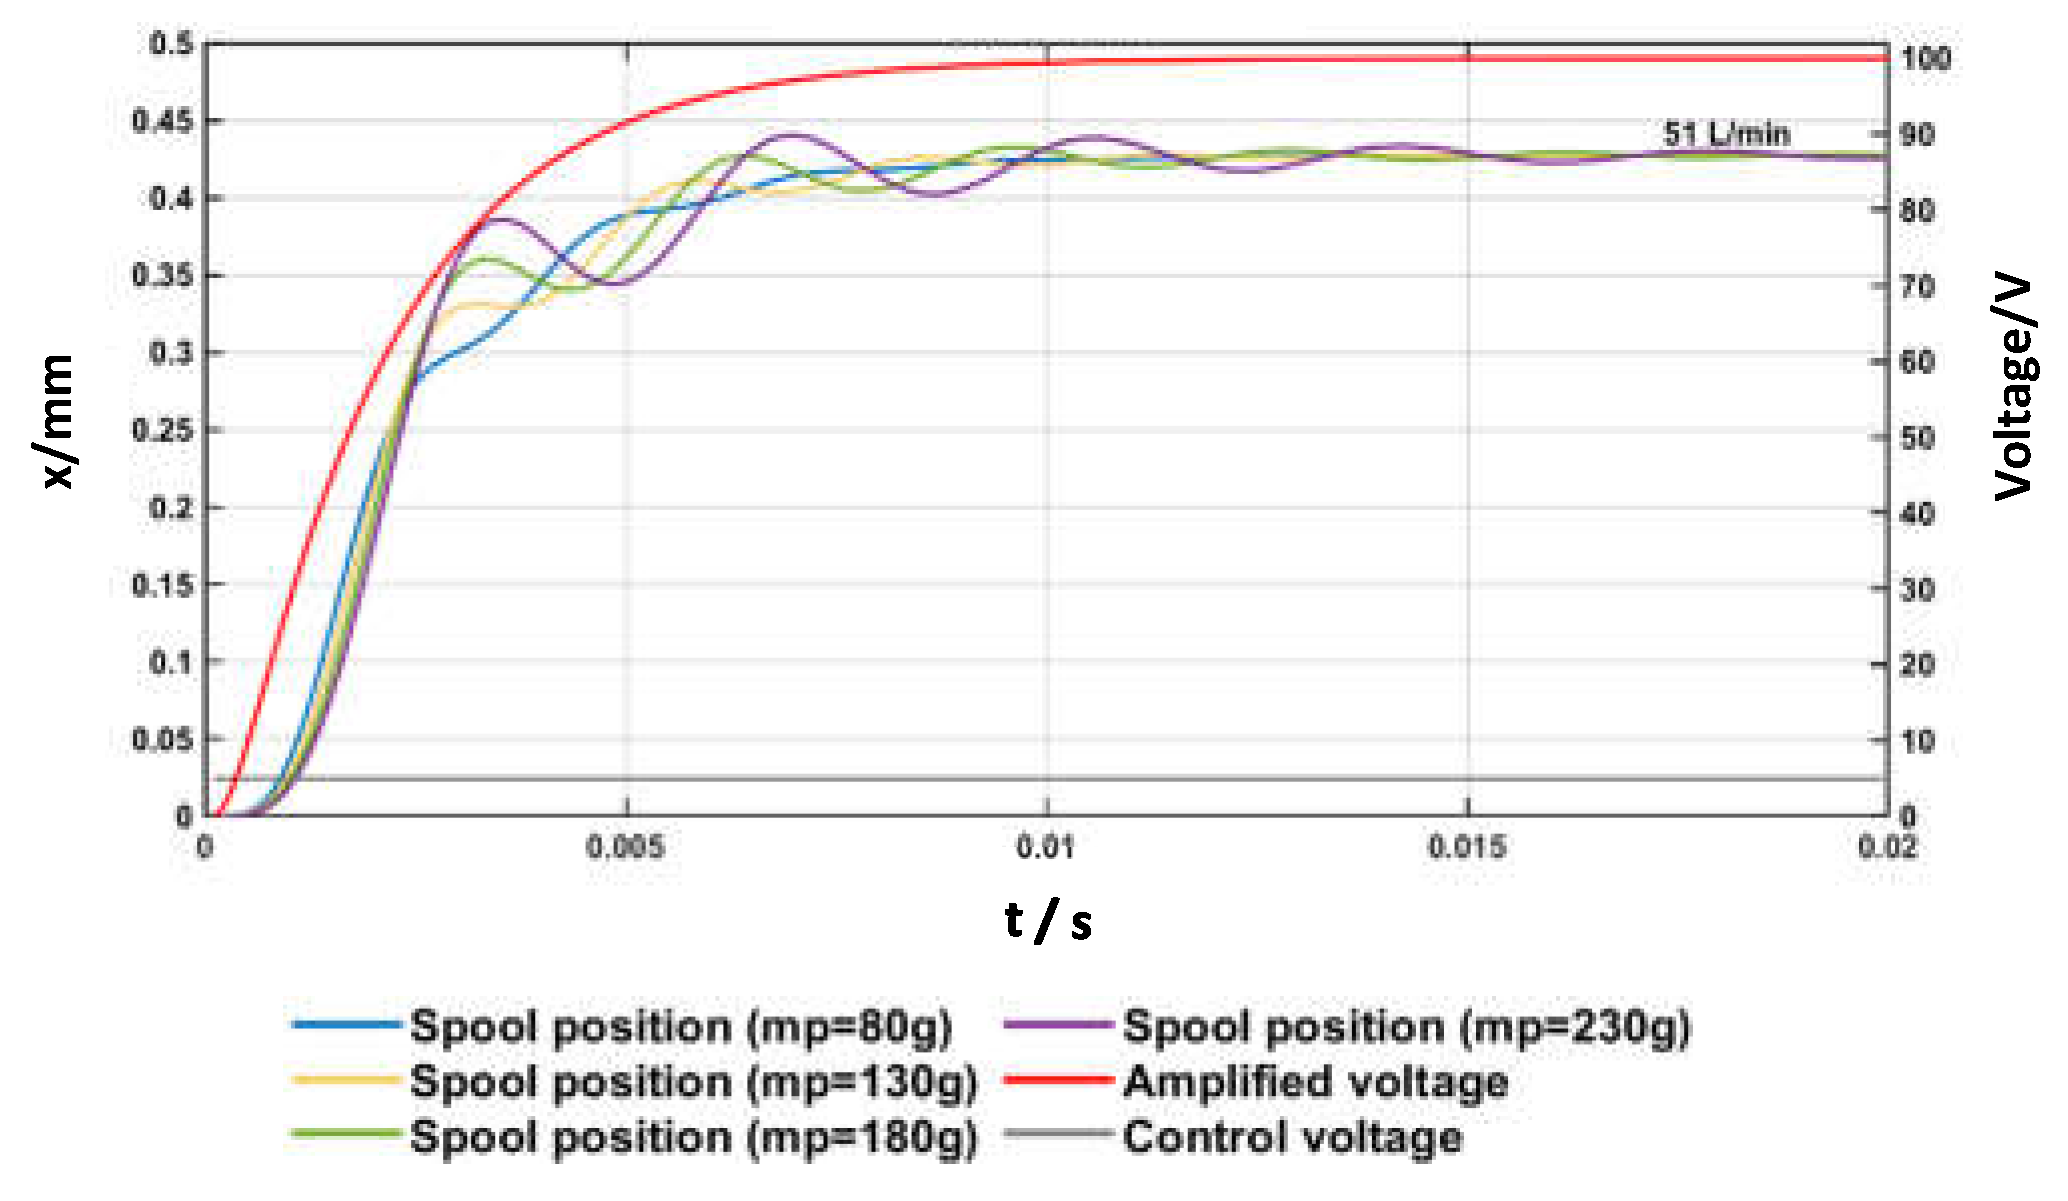
= 80 g. To evaluate the effects of the mass of the moving parts of the amplified piezo-stack upon the step response,
Figure 9 shows simulated open-loop step tests for different values of this mass, namely,
= 80, 130, 180, and 230 g (with
being changed from 0 V to +5 V;
= 70 bar;
= 90 Ns/m;
= 1400 rad/s). These graphs reveal that large oscillations of the spool position are predicted for large values of
. Therefore, it is also important that the mass of the moving parts of the amplified piezo-stack actuator is taken not too large, in order to limit the oscillations of the spool position and, therefore, of the flow rate.
All the results that have been presented up to this point were obtained through an open-loop control system, in order to assess the potential of the proposed architecture in terms of response speed. However, open-loop control is not able to cope with hysteresis, and closed-loop control is necessary for real applications. Therefore, closed-loop control was also simulated using a simple PI controller which changes the control signal (
) according to Equation (13) to reach the target position (set point). The parameters of the PI controller, which were determined taking advantage of the Ziegler–Nichols method, are
= 5.8 and
= 4100. The imposed saturation limits were
= ±5 V; the back calculation anti-windup method was used. As explained previously, this closed-loop control needs an LVDT to measure the spool position. Alternatively, in the literature, there are some open-loop control strategies with piezo-electric actuators that do not need any position sensor, are easy to handle and cost effective [
35].
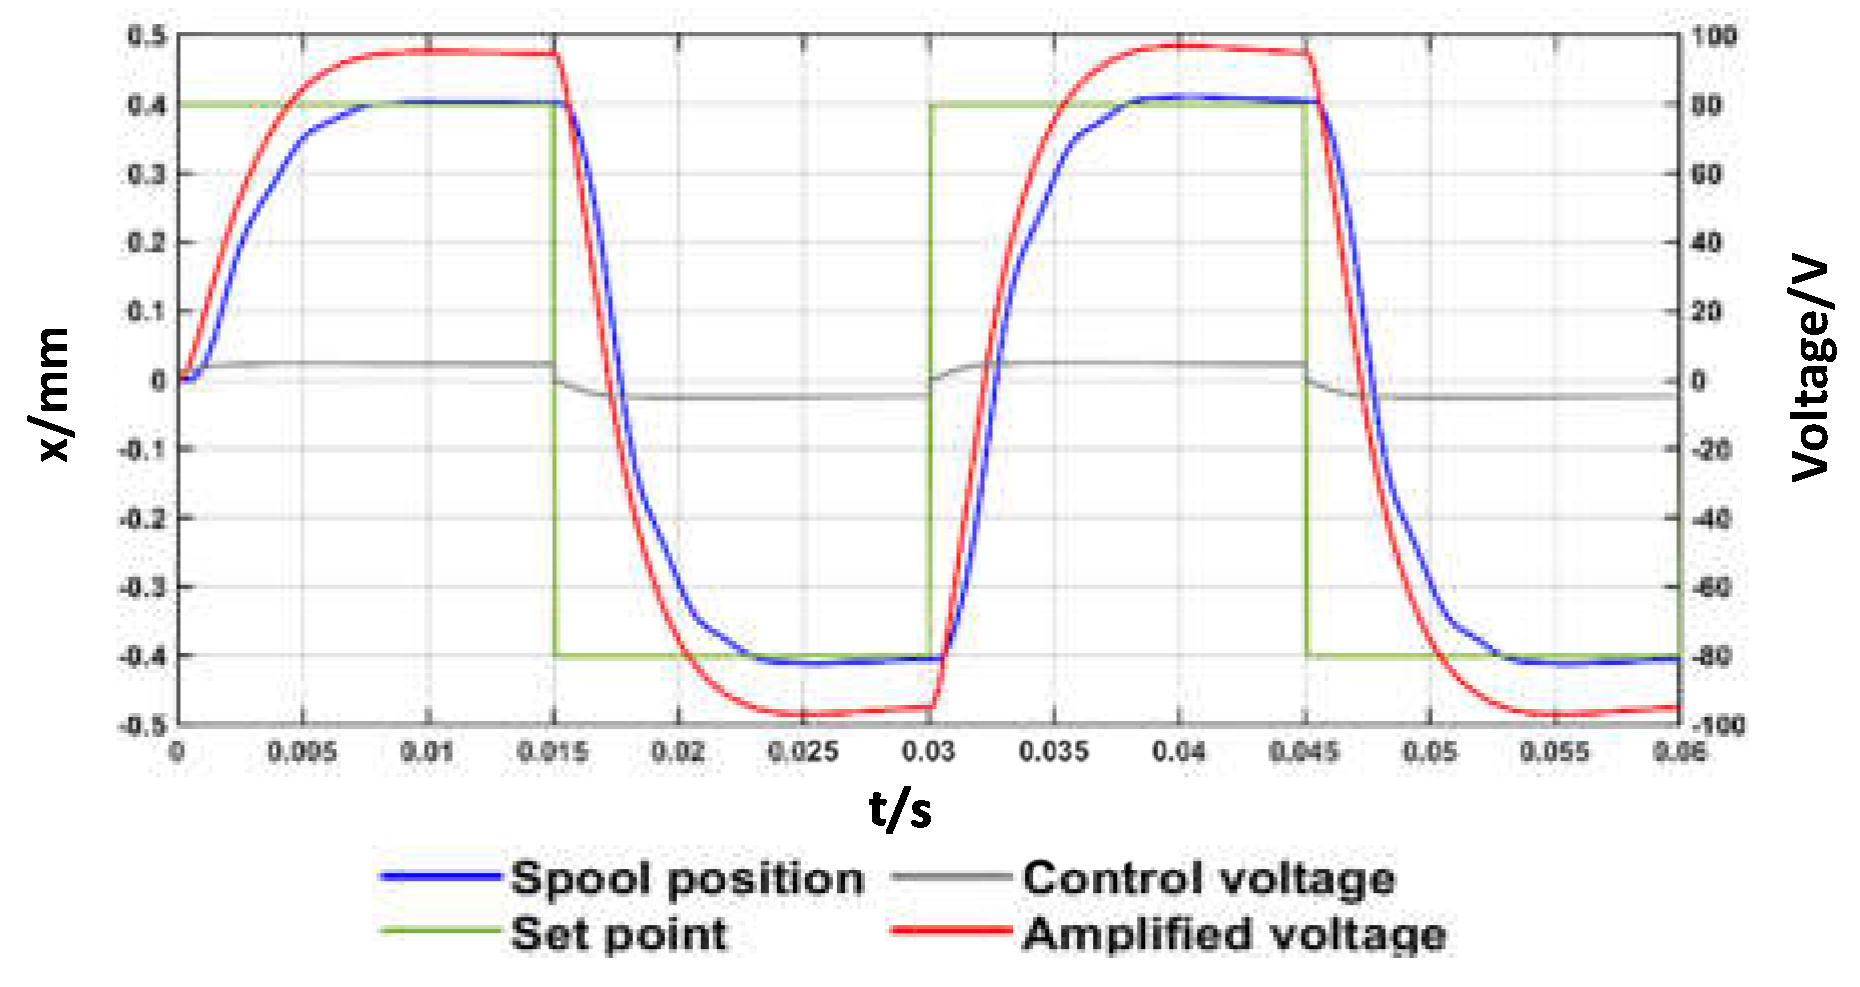
In the simulated closed-loop step tests, the set point was changed with a step size of 0.2 mm and 0.4 mm (
Figure 10), and with a step size of 0.4 mm and 0.8 mm (
Figure 11). In these simulated closed-loop step tests, the overall pressure difference across the valve was set to
70 bar, with
= 90 Ns/m and
= 80 g. The parameters of
Table 2 were used again in these simulations, along with
= 1400 rad/s.
These graphs show that the closed-loop control system allows the spool to reach the desired set points in short time intervals (overall, less than 10 ms to reach 90% of the set point). This reveals that such a simple closed-loop control system is capable of coping with the hysteresis that occurs in the amplified piezo-stack actuator.
The closed-loop frequency response of the valve is now discussed. The Bode Plot of hydraulic valves, in addition to depending on the supply pressure, usually depends on the amplitude of the input signal due to nonlinearities. Therefore, the Bode Plot is often obtained for an amplitude of the input signal equal either to 50% or to 100% of the maximum value [
1]. The Bode Plot predicted for the proposed valve is shown in
Figure 12, including both the magnitude diagram (i.e., the amplitude ratio) and the phase diagram, obtained for
= 70 bar,
= 90 Ns/m,
= 80 g,
= 1400 rad/s, along with the parameters of
Table 2, and for an input sine wave (set point) having an amplitude of 0.4 mm (close to the maximum opening). The dimensionless amplitude ratio in dB was calculated using the formula
20, where
.4 mm is the amplitude of the input sine wave (set point) and
is the amplitude in mm of the output wave (actual spool position). The phase diagram reports the phase lag in degrees between the input wave and output wave.
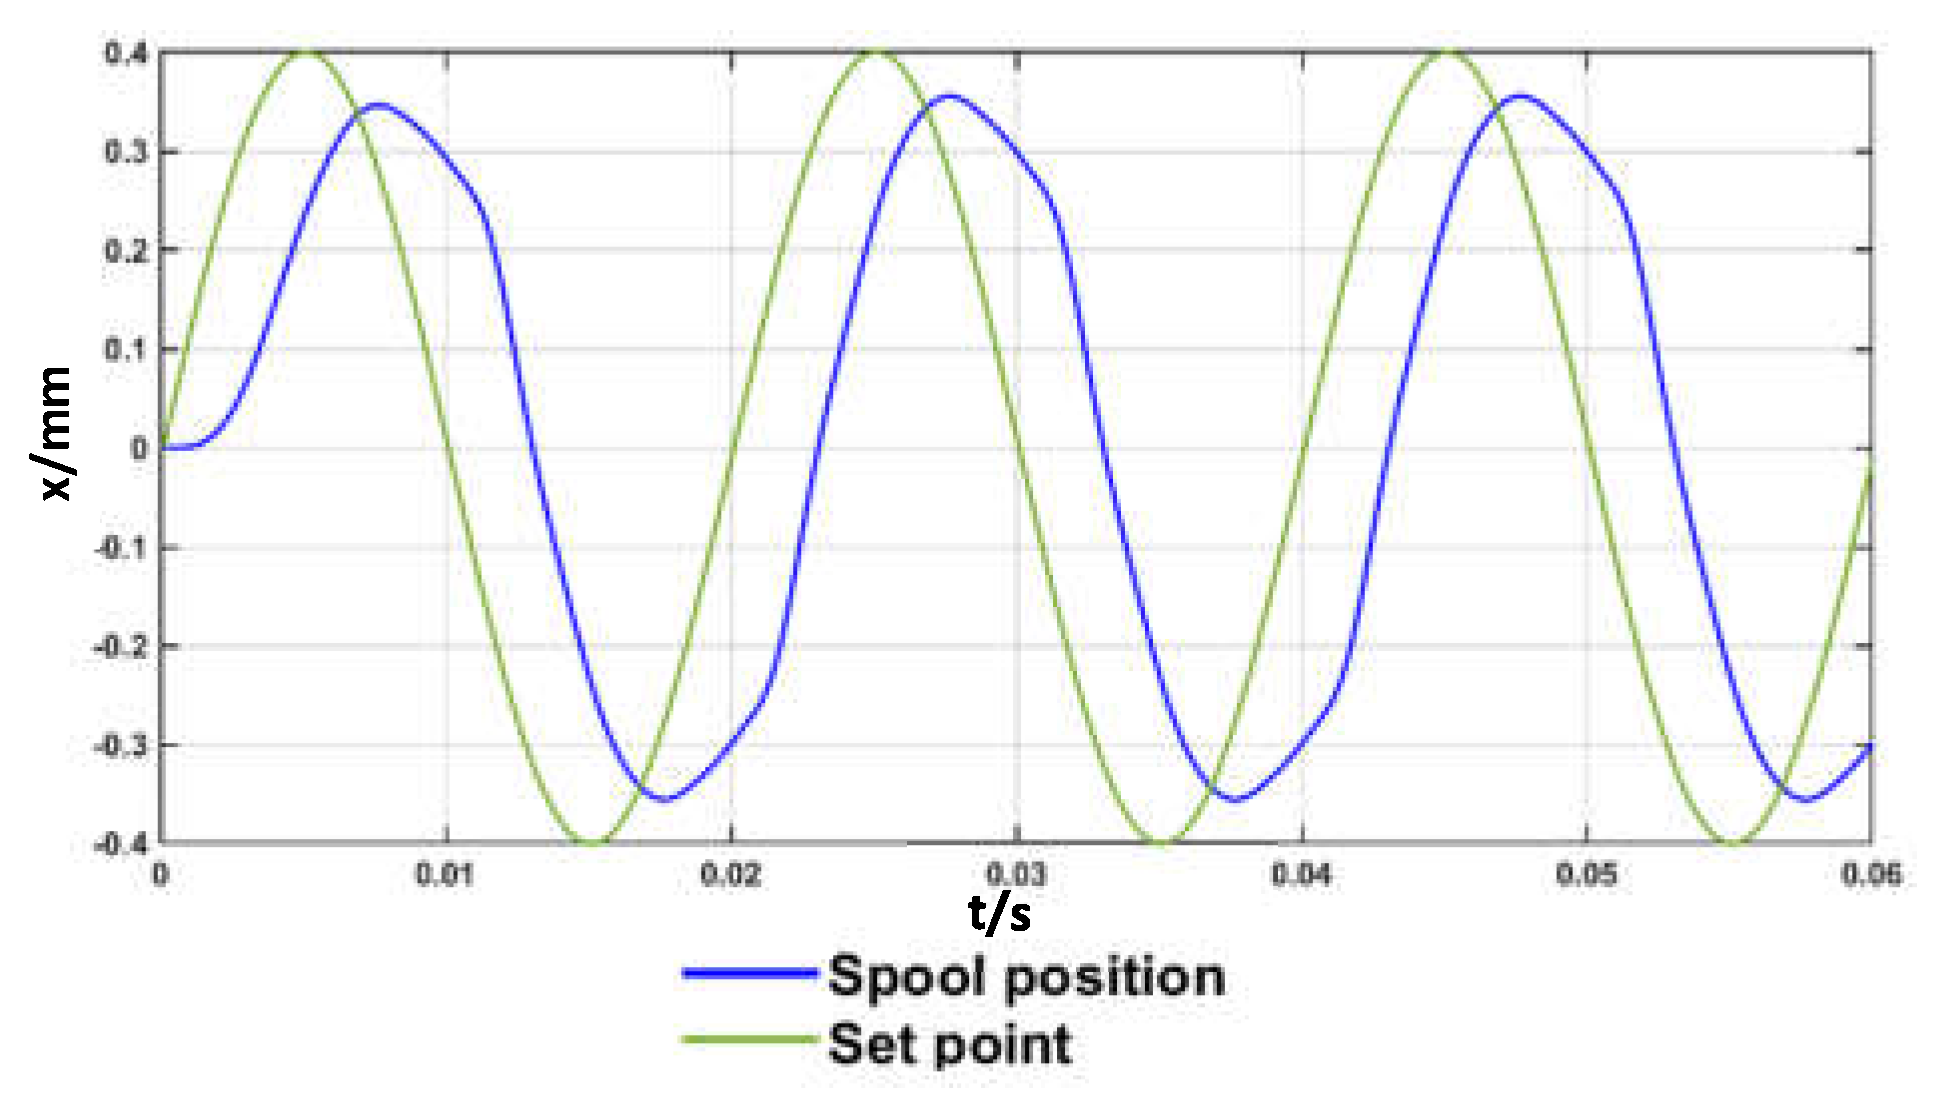
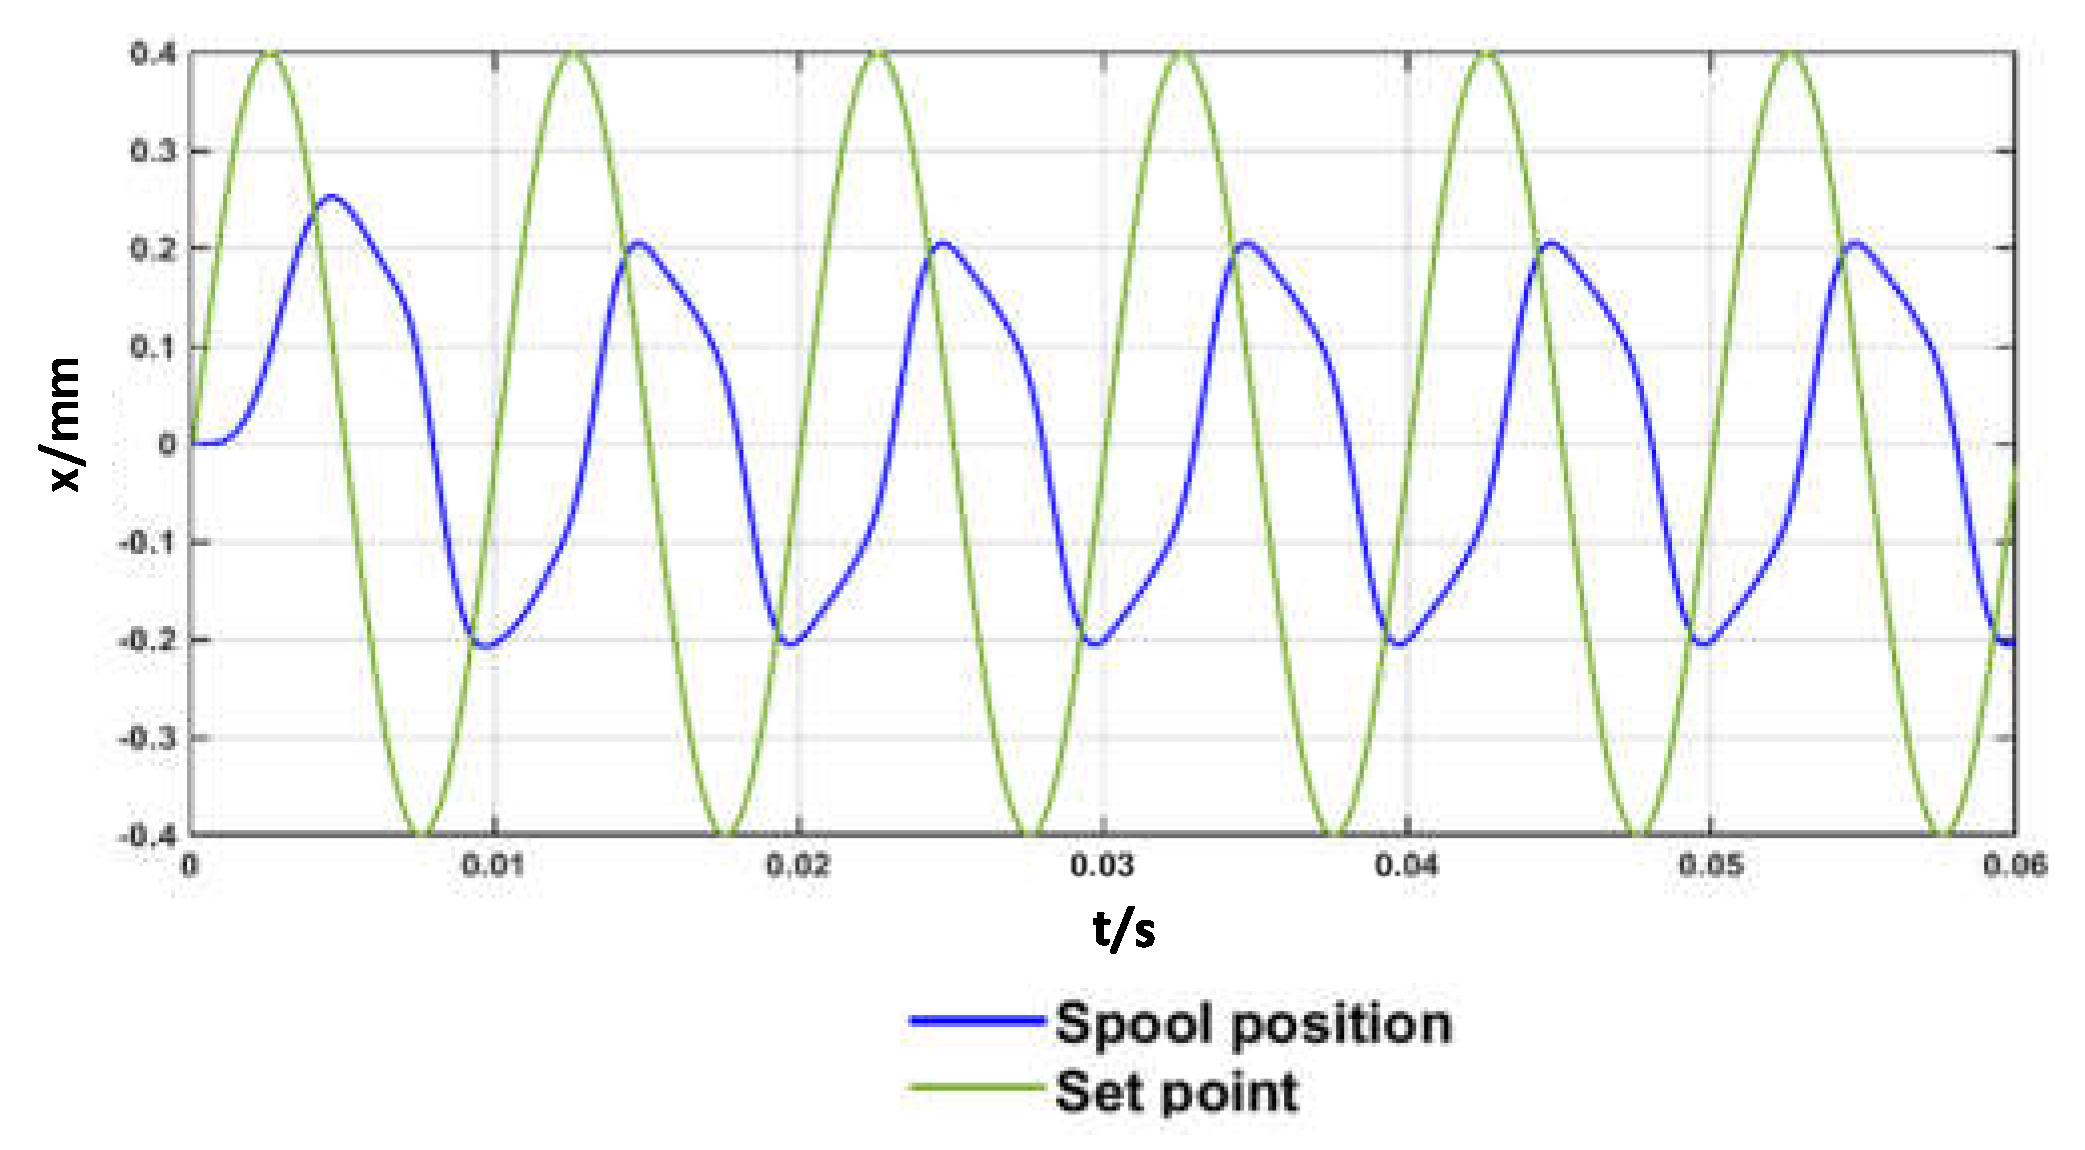
The plot shows that the predicted closed-loop frequency response is very good, with the phase shift being −54° for a frequency of 50 Hz (see
Figure 13), and −105° for a frequency of 100 Hz (see
Figure 14). The nonlinearity of the system is confirmed by
Figure 13 and
Figure 14, showing that the spool position is not exactly a sine wave.
