Article

MCI Detection Using Kernel Eigen-Relative-Power Features of EEG Signals

1
Graduate Institute of Mechatronic Engineering, National Taipei University of Technology, Taipei 106344, Taiwan
2
Department of Psychiatry, Taipei Veterans General Hospital, Taipei 11217, Taiwan
3
Faculty of Medicine, National Yang Ming Chiao Tung University, Taipei 11221, Taiwan
4
International Research Center for Neurointelligence (WPI-IRCN), The University of Tokyo Institutes for Advanced Study (UTIAS), The University of Tokyo, Tokyo 113-0033, Japan
5
Graduate Institute of Manufacturing Technology, National Taipei University of Technology, Taipei 106344, Taiwan
6
Department of Mechanical Engineering, National Taipei University of Technology, Taipei 106344, Taiwan
7
Department of Mechanical Engineering, National Taiwan University of Science and Technology, Taipei 106335, Taiwan
*
Author to whom correspondence should be addressed.
These authors contributed equally to this paper.
Actuators 2021, 10(7), 152; https://doi.org/10.3390/act10070152
Submission received: 16 May 2021 / Revised: 28 June 2021 / Accepted: 30 June 2021 / Published: 4 July 2021
(This article belongs to the Special Issue Actuators in Robotic Control)

Abstract

:
Classification between individuals with mild cognitive impairment (MCI) and healthy controls (HC) based on electroencephalography (EEG) has been considered a challenging task to be addressed for the purpose of its early detection. In this study, we proposed a novel EEG feature, the kernel eigen-relative-power (KERP) feature, for achieving high classification accuracy of MCI versus HC. First, we introduced the relative powers (RPs) between pairs of electrodes across 21 different subbands of 2-Hz width as the features, which have not yet been used in previous MCI-HC classification studies. Next, the Fisher’s class separability criterion was applied to determine the best electrode pairs (five electrodes) as well as the frequency subbands for extracting the most sensitive RP features. The kernel principal component analysis (kernel PCA) algorithm was further performed to extract a few more discriminating nonlinear principal components from the optimal RPs, and these components form a KERP feature vector. Results carried out on 51 participants (24 MCI and 27 HC) show that the newly introduced subband RP feature showed superior classification performance to commonly used spectral power features, including the band power, single-electrode relative power, and also the RP based on the conventional frequency bands. A high leave-one-participant-out cross-validation (LOPO-CV) classification accuracy 86.27% was achieved by the RP feature, using a simple linear discriminant analysis (LDA) classifier. Moreover, with the same classifier, the proposed KERP further improved the accuracy to 88.24%. Finally, cascading the KERP feature to a nonlinear classifier, the support vector machine (SVM), yields a high MCI-HC classification accuracy of 90.20% (sensitivity = 87.50% and specificity = 92.59%). The proposed method demonstrated a high accuracy and a high usability (only five electrodes are required), and therefore, has great potential to further develop an EEG-based computer-aided diagnosis system that can be applied for the early detection of MCI.

1. Introduction

Mild cognitive impairment (MCI) is a state between cognitive decline with normal aging and cognitive impairments caused by dementia in which Alzheimer’s disease (AD) is the most prevalent subtype [1,2]. MCI is a common condition in the older population with rates of prevalence of 8.4%, 10.1%, 14.8%, and 25.2% for age ranges 65–69, 70–74, 75–79, and 80–84, respectively [3]. Individuals with MCI are at higher risk of developing AD in their later stage [1,3]. Among individuals aged 65 years or older, the conversion rate from MCI to AD is 15% within 2 years [3] and 32% within 5 years [4] after the first diagnosis of MCI. At present, there is still no effective treatment for the neurodegenerative disease such as AD. Fortunately, there is increasing evidence that the risk of Alzheimer’s dementia can be greatly reduced by proper management of lifestyle, status control of hypertension and diabetes (if any), good mental health care, pharmacological and/or non-pharmacological interventions at the MCI phase [5,6,7,8]. However, MCI is usually underdiagnosed in the community because older adults with MCI are often not aware of subtle declination of their cognitive function, which primarily prevents them from seeking medical advice or even interventions. Therefore, a safe, objective, and easy-to-implement method for an accurate and efficient classification of individuals with MCI and heathy controls (HC) is essential to promote early intervention of MCI.
An electroencephalography-based (EEG-based) approach has been recognized as a promising solution in this regard [9], because it is well-established, inexpensive, and non-invasive for assessing brain activity that is more suitable for routine use and rapid screening than other imaging modalities, such as positron emission tomography (PET) [10] or functional magnetic resonance imaging (fMRI) [11]. Recently, classification between individuals with MCI and HC has received great attention in the EEG research community (e.g., [9,12,13,14,15,16,17,18,19,20,21,22,23,24,25,26,27]). According to the different nature of EEG acquisition and analyses, these studies fall into three categories: resting-state [12,13,14,15,16,17,18,19,20,21,22,23,24,25,26,27], task-related [28], and event-related potential (ERP) [9]. Among the category of resting-state EEG studies, most focused on the spectral features [12,13,14,15,16,17,18,19,20,21,22] and often found increased frontal theta power [12,13,14] in the MCI group.
Several studies have, therefore, combined spectral features extracted from resting-state EEGs and machine learning methods to classify between HC and individuals with MCI. Spectral features that have been commonly used in previous literature including band power [17,18,19], relative power (the ratio of a spectral band’s power to the power of a wilder spectral band, both were extracted from the same EEG signal of one single electrode) [17,18,20], power ratio (the ratio of a spectral band’s power to another spectral band’s power) [18,21], and the power spectral density (PSD) image [22]. The MCI-HC classification accuracies reported in [17,18,19,20,21,22] fell within the range from ~60% to 80%. For example, the classification performance based on a k-nearest-neighbor (k-NN) classifier and both band power and relative power features achieved an accuracy of 80% [17]; whereas the classification performance based on a convolutional neural network (CNN) and the PSD image feature achieved a considerably lower accuracy of 62.5% in their patient-based analysis (i.e., training and test sets had no data from the same subject) [22].
Additionally, loss of complexity and irregularity in resting-state EEGs was also found in individuals with MCI [19,23,24,25]. Therefore, a few recent studies have applied different nonlinear measures to MCI-HC classification. In the study by Maturana-Candelas et al. [26], the sensitivity of MCI detection was only 47% (only 8 out of the 17 MCI patients were successfully detected) based on the use of a multiscale entropy (MSE) profile feature. The study by Sharma et al. [27] achieved a classification accuracy of 84.1% by combining a Higuchi’s fractal dimension (HFD) feature and different spectral power features. The inconsistent results reported in these recent studies have suggested that the EEG-based MCI vs. HC classification problem is challenging and seeking other promising EEG features appears to be necessary.
Previous neuroimaging findings have shown a strong correlation between inter-hemispheric activity asymmetry (over the central-parietal regions in particular) and cognitive decline due to MCI [29,30,31]. Accordingly, a few works further used EEG complexity measures to estimate the brain dynamics, and confirmed that, indeed, there existed inter-hemispheric complexity difference between healthy aging and individuals with MCI [32,33]. In addition to the left–right asymmetry, anterior–posterior difference of theta power was also found to be a potential feature for the MCI-HC classification [14]. Based on the literature, we expect that the neural activities difference between brain regions, including, but not limited to, the left–right and anterior–posterior differences, may differ strongly for the two groups of MCI and HC.
In the EEG-based major depressive disorder (MDD) studies (e.g., [34,35,36]), activity difference between two brain areas is often represented by the relative power between a pair of electrodes (referred to as relative power hereafter), which is different from the relative power used in previous MCI studies [17,18,20] (referred to as single-electrode relative power hereafter, for the sake of distinction). To our knowledge, no prior study has used the EEG power difference between electrodes (i.e., the relative power) to improve EEG-based classification of MCI versus HC. Therefore, we first extracted and analyzed the relative power features from all possible regional inter-hemispheric, intra-hemispheric, and cross-regional inter-hemispheric electrode pairs for all possible frequency subbands. Next, we determined the optimal relative power feature subset by a feature selection method based on Fisher’s class separability criterion [37,38] and a top-ranked feature selection strategy [36,39]. After feature selection, we applied the kernel principal component analysis (kernel PCA) [40], which is capable of computing higher-order statistics among the original data and has shown its effectiveness in other domains of EEG applications (e.g., emotion recognition [41] and MDD detection [42]), to extract a set of more distinguishing components from the optimal relative power subset. Finally, a kernel eigen-relative-power (KERP) pattern formed by the extracted kernel PCA components is used as a novel EEG feature for the classification of MCI versus HC.
In the present study, since the proposed feature of interest was based on the spectral power of EEG, we compared the MCI-HC classification performance of relative power feature with spectral power features commonly used in previous studies. To preview the results, the classification performance of relative power outperformed other types of spectral power features and achieved a high subject-independent classification accuracy of ~86% by leave-one-participant-out cross validation, when a simple linear discriminant analysis (LDA) classifier was used. Next, we showed that the classification accuracy can be further improved (up to 90%) by using the proposed KERP feature, i.e., cascading kernel PCA to the optimal relative power features. Finally, classification performance based on several other commonly used classifiers including k-NN, LDA, quadratic discriminant analysis (QDA)—a variant of LDA and a support vector machine (SVM)—were compared to check if there is a possibility to achieve a higher accuracy. Our results showed that the combination of KERP and SVM achieved the best classification performance of 90.20%.

2. Materials and Methods
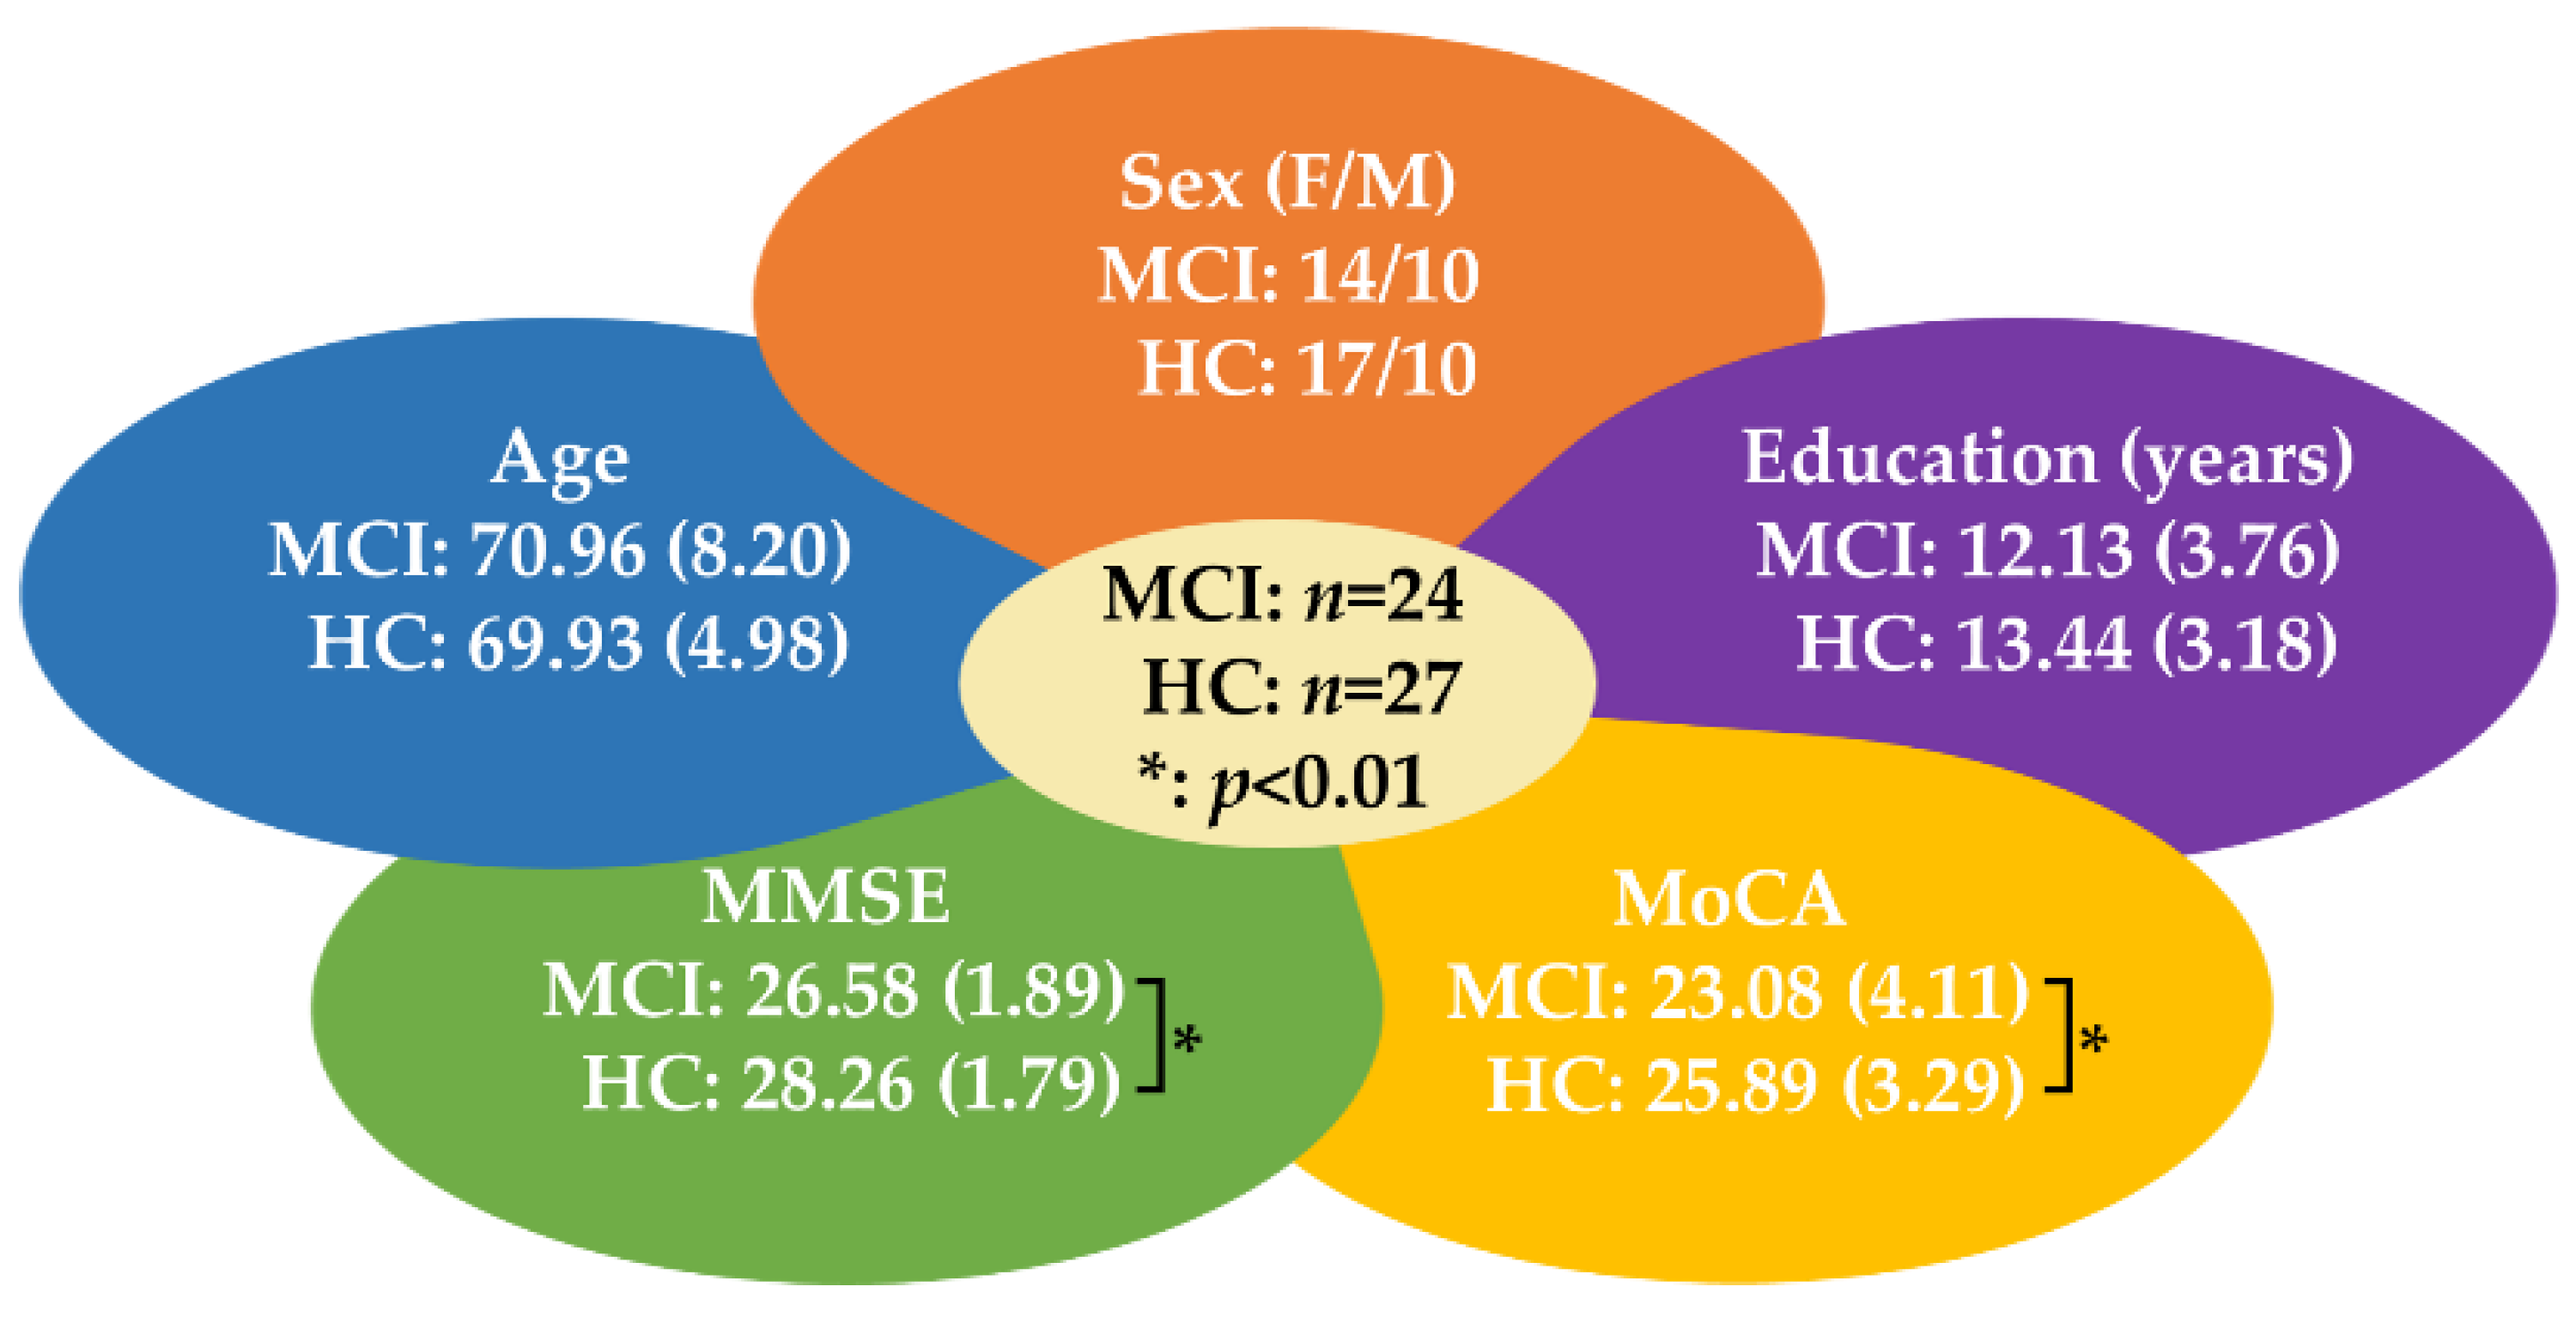
2.1. Participants

The present study enrolled 24 participants with MCI (14 females, mean age of 70.96 ± 8.2 y/o) in the experimental group and 27 (17 females, mean age of 69.93 ± 4.98 y/o) healthy individuals in the control group. Data was collected at a Memory Clinic of a tertiary 2700-bed referral medical center. Based on the results of clinical interviews, laboratory reports, brain imaging findings, and performance of neurocognitive assessments, the diagnostic impression was made under clinical consensus by a group of board-certified healthcare providers. Recommendations from the National Institute on Aging and the Alzheimer’s Association (NIA-AA) [43,44] were used as the core clinical criteria for diagnosis of MCI. Individuals defined as the control group were recruited via advertisement and confirmed as not having any condition for all-cause dementia listed in the NIA-AA criteria.
All healthy controls received standardized assessments of neuropsychological battery and their results were within normal range after adjustment for education [45]. For both groups, the exclusion criteria were (1) current major psychiatric comorbidity (clinically diagnosed in the 6 months prior to the baseline neuropsychological evaluation), (2) motor and/or sensory deficits that may confound the examination of cognitive performance, and (3) neurological diseases or condition that may influence cognitive function. The demographics and neuropsychological data of the participants are shown in Figure 1. The study protocol was reviewed and approved by the institutional review board of Taipei Veterans General Hospital (IRB No: 2017-06-009A). Written informed consents were obtained from each participant or their legal guardian according to the Declaration of Helsinki before participating in the study.

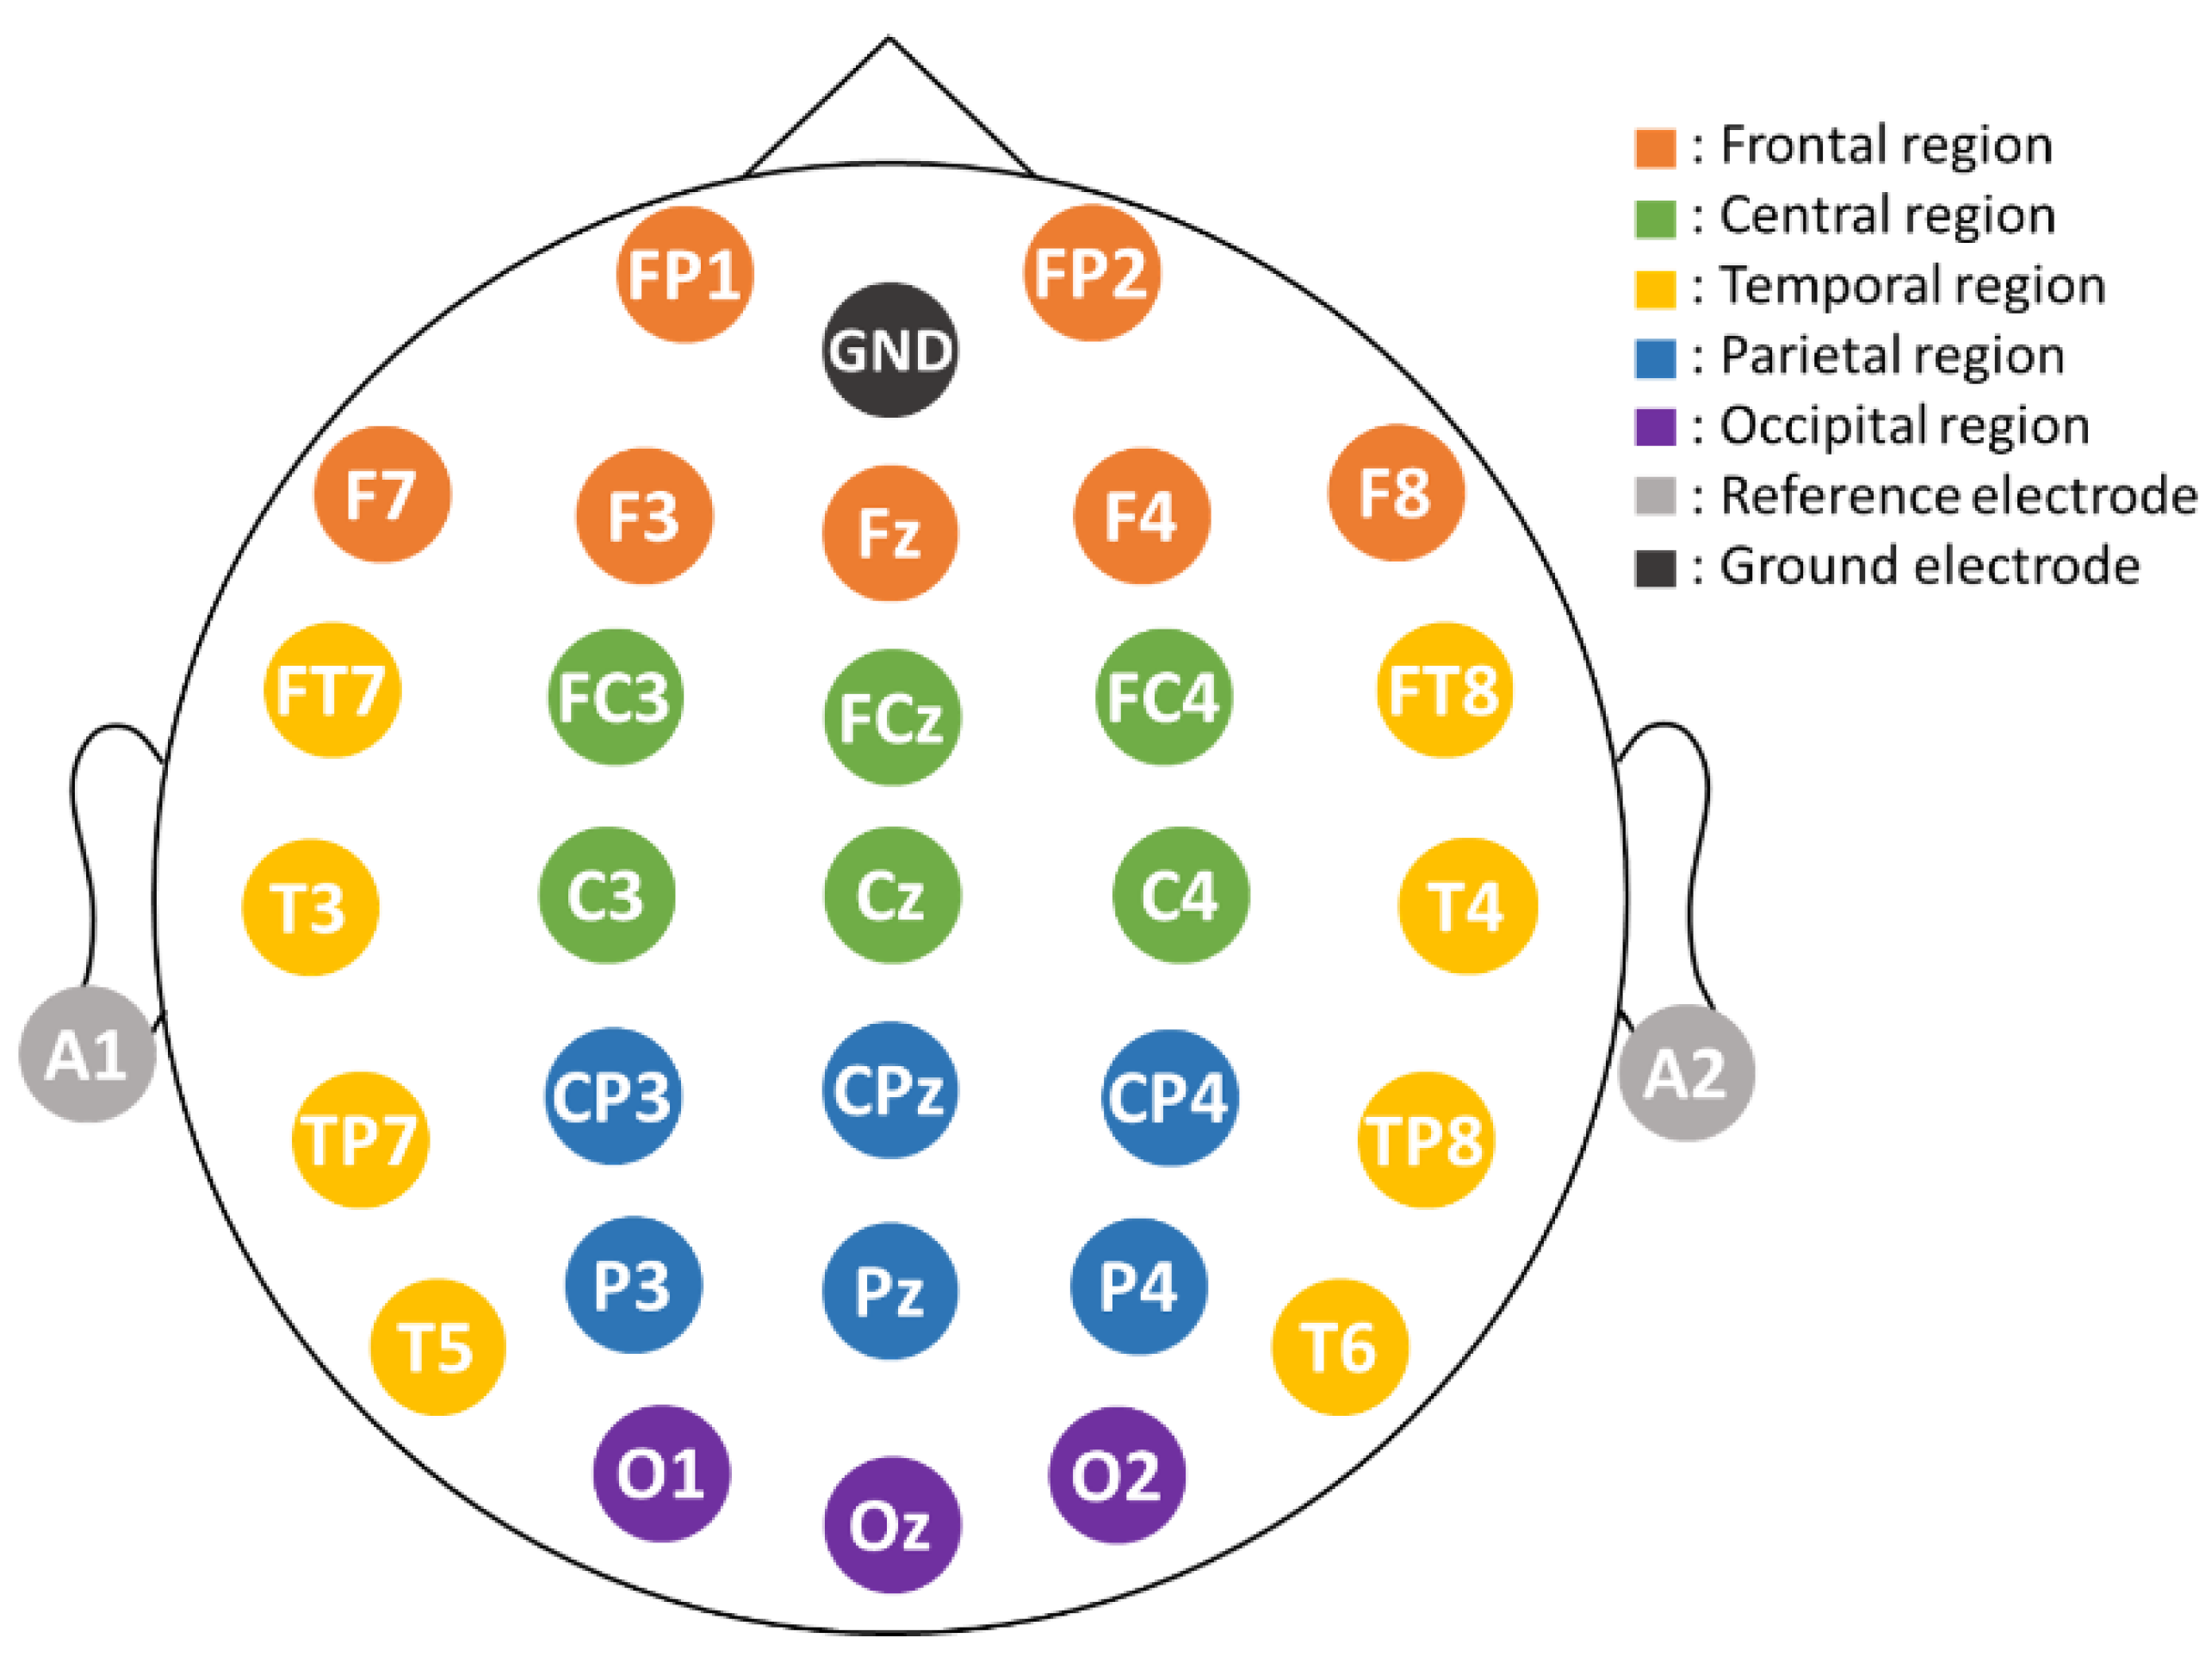
2.2. EEG Recording and Data Collection

A 33-channel electro-cap was used to record EEG signals. The layout of the Ag/AgCl electrodes followed the international 10–20 system (see Figure 2). The ground electrode was at the forehead and was also the physical reference electrode. The impedance of the electrodes was kept below 10 K Ohm by applying electrode gel. The EEG data were digitally re-referenced online to the average of A1 and A2 potentials. For example, C z = C z ( A 1 + A 2 ) / 2 . The remaining 30 channels were all used to record EEG signals for analysis. Electrooculography (EOG) signals were monitored by the electrodes attached at the right side of the right eye and above of the left eye, respectively. Both EEG and EOG signals were amplified, band-pass filtered (0.5–100 Hz), and converted to digital signals with a sampling frequency of 500 Hz using an EEG amplifier (NuAmp, NeuroScan Inc). The EOG artifacts were then removed from the EEG signals using the artifact removal software tool Scan 4.5 [46] provided by the NeuroScan, which is based on an EEG-VEOG covariance analysis, a linear regression procedure, and the creation and use of an LDR file to perform a point-by-point proportional subtraction of the eye blinks. Other possible artifact components, such as generic discontinuities and electromyography (EMG) signals, were further removed by using the independent component analysis (ICA, Infomax, EEGLAB [47]) and the ADJUST algorithm [48]. After these preprocessing steps, the EEG data were then used for analysis.
The EEG recordings include two eye-open resting-state sessions. During each resting-state session, participants were asked to maintain fixation on a black cross presented centrally on a gray background on a personal computer’s 22-inch display for 90 s, keep relaxed and try not to think about anything on purpose. We ended up recording 180 s of resting-state EEG signals ( 90   s / round   × 2   rounds ) from each participant. The EEG signal per electrode was then divided into   118   overlapping time windows of   3 -s length and a shifting length of 1.5 s. Note that between the two resting-state EEG sessions, participants performed working memory tasks for other research purposes, which is irrelevant to the current study and will not be discussed.

2.3. Feature Extraction

In this section, we introduce the procedures of the extraction of the relative power (RP) feature, the selection of optimal RP features, the extraction of kernel eigen-relative-power (KERP) features.

2.3.1. Relative Power (RP)

Previous EEG studies often focused the analysis on the conventional frequency bands of delta (0.5 or 1–4 Hz), theta (4–8 Hz), alpha (8–13 Hz), beta (13–30 Hz), and gamma (e.g., 30–45 Hz). However, subbands with a narrower frequency range may carry more discriminating information for EEG classification. Therefore, we partitioned the frequency band of 2–44 Hz into 21 non-overlapping subbands of 2-Hz width (i.e., 2–4 Hz, 4–6 Hz, …, 42–4 Hz) for analysis. For each 3-s EEG epoch, the band power (BP) of every subband was calculated by discrete Fourier transform. Then, for each subband, the BPs calculated from the 118 EEG epochs belonging to the same electrode’s EEG were further averaged. Based on the average BP (in the following, a BP refers to the averaged one), the RP between a pair of electrodes A and B at a specific subband was given by [36]
R P = W ( A ) W ( B ) W ( A ) + W ( B )  
where W is the ratio of the subband’s BP to the total power of the entire spectral band of 2–44 Hz. As there were 21 different subbands and 30 electrodes ( 30 × 29 / 2   electrode pairs), we extracted a total of 9135 different RP features from each participant.

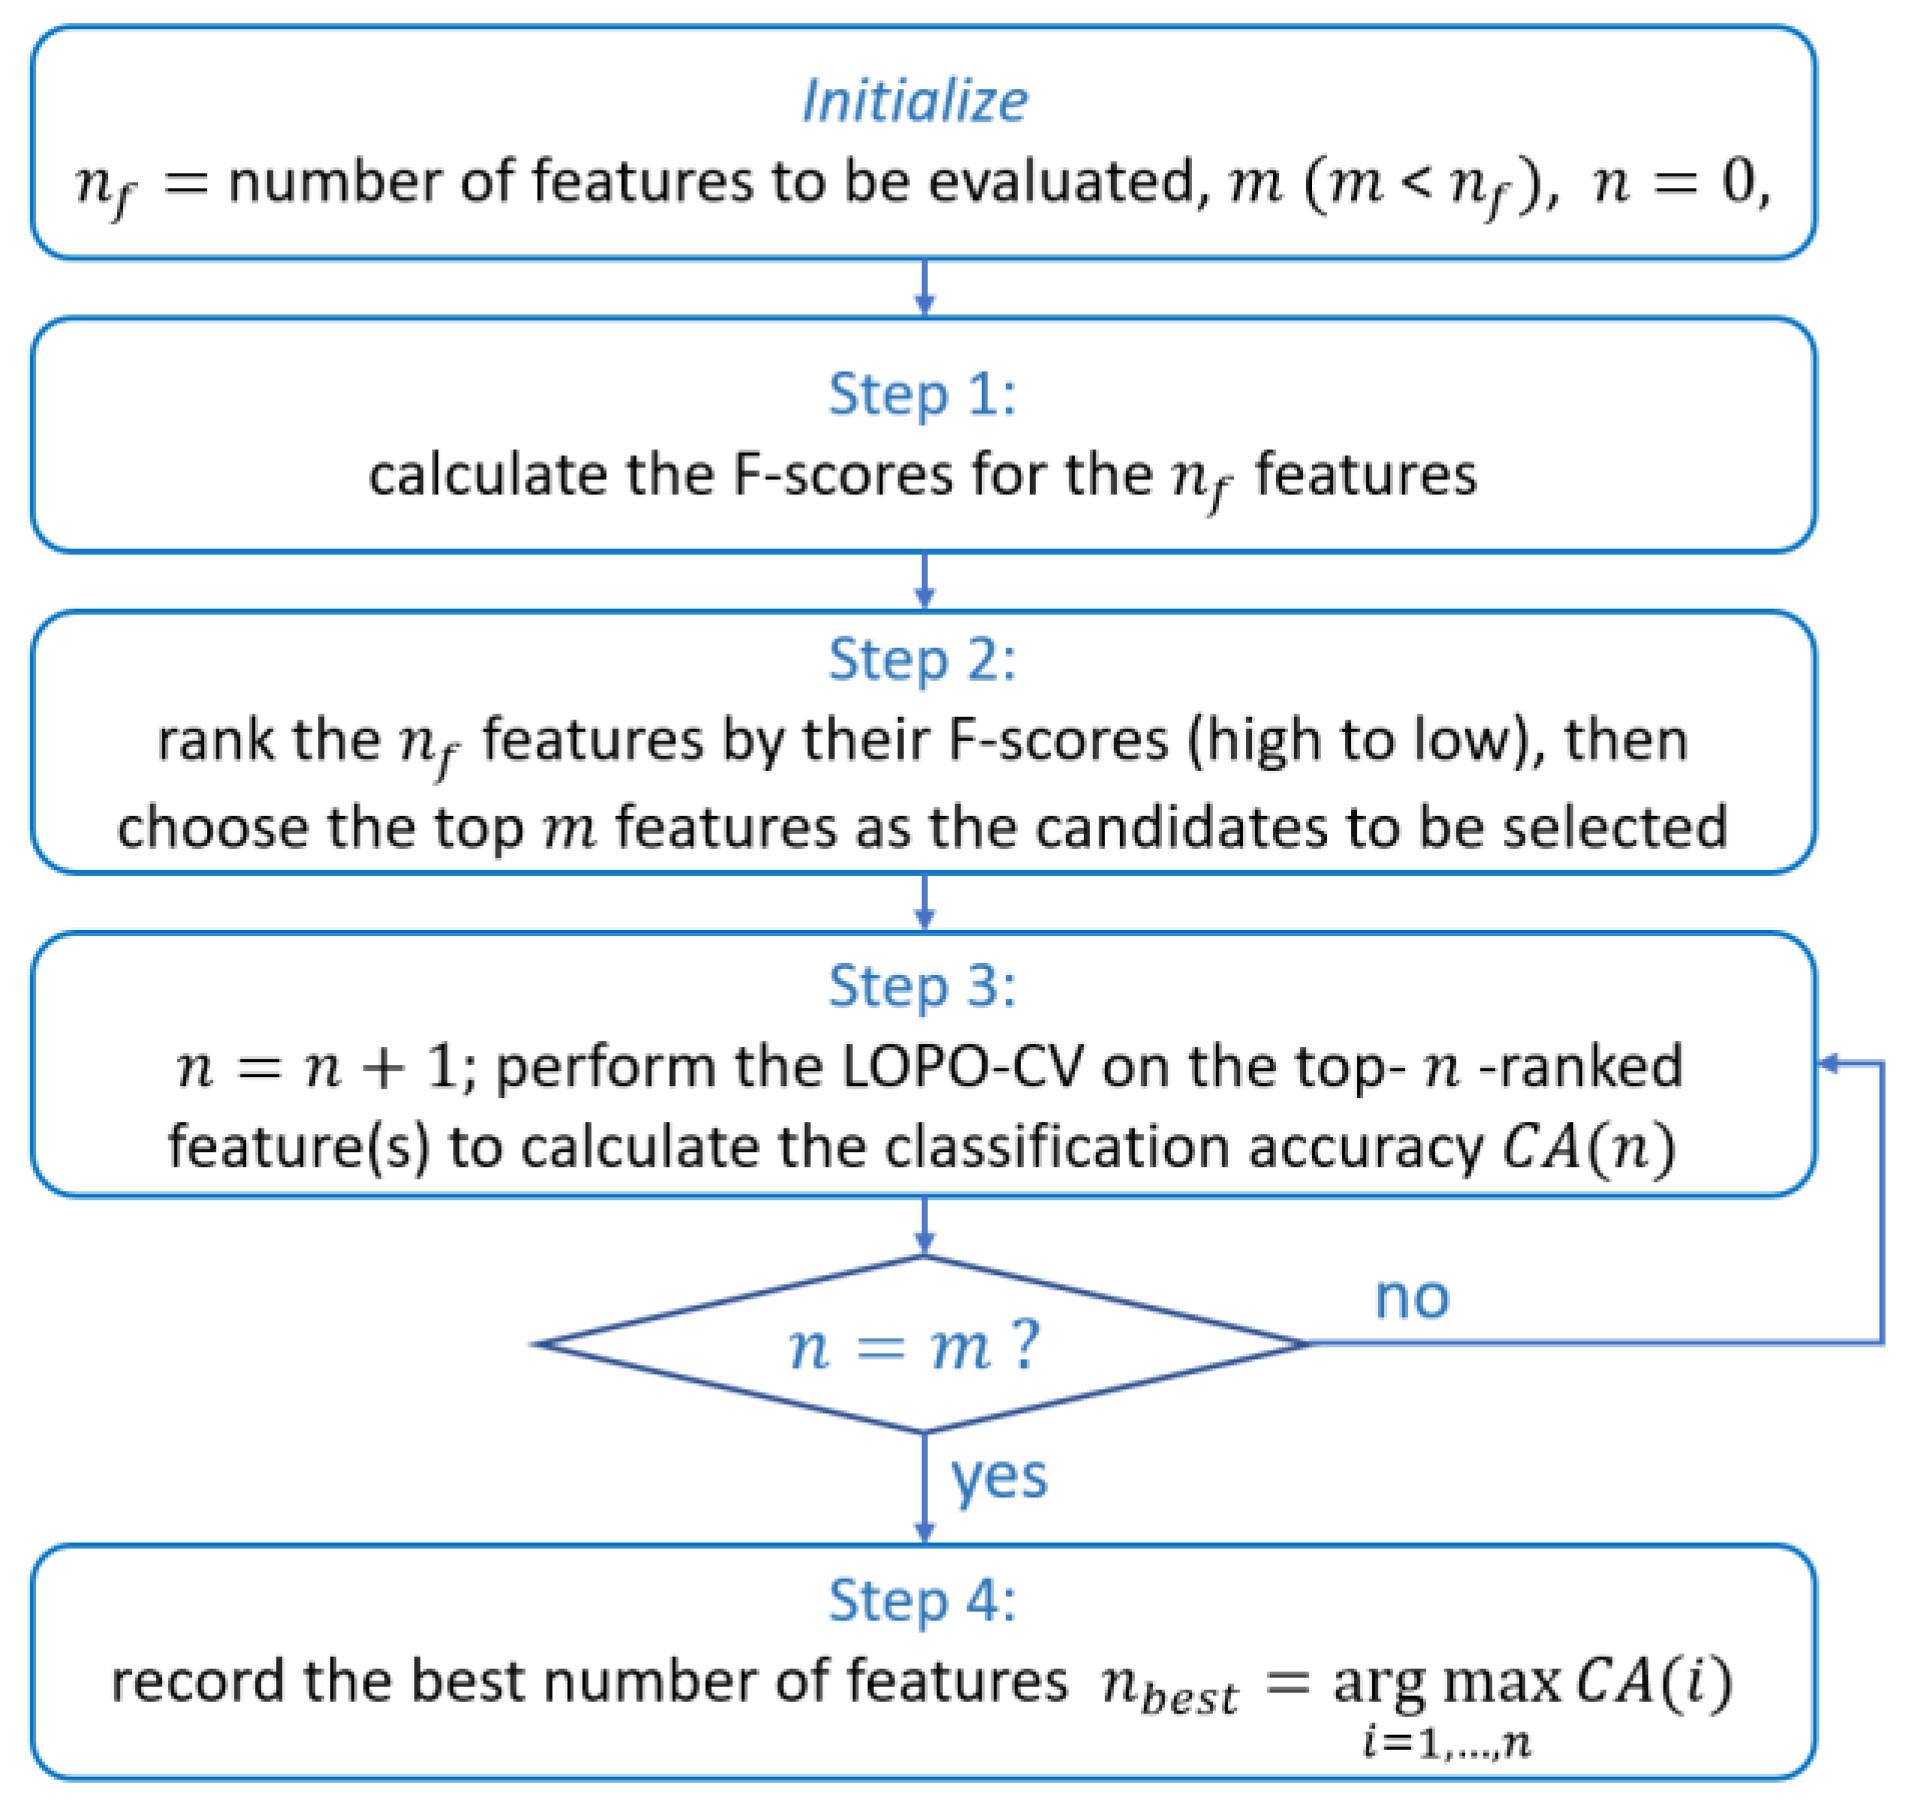
2.3.2. Optimal Relative Power Feature Selection

Feature selection can be accomplished by embedded, wrapper, or filter approaches [49]. Embedded and wrapper approaches directly use generalization performance (often represented by cross validation accuracy) as the evaluation criterion to determine the optimal features, and thus both are classifier-specific [50]. However, their computational complexity is relatively high because the classifier’s training process is involved in the entire feature selection process. This drawback further magnifies when the number of feature candidates increases. By contrast, filter approach evaluates the features directly by using predefined classifier-independent criteria, and thus filter approach is more efficient in implementation. Considering that we had a huge number of feature candidates to be evaluated (9135 RP features in total), filter approach is more appropriate for the feature selection. Accordingly, the popular filter approach—Fisher’s class separability criterion [37]—was chosen for evaluating the RP features in the current study.
Given n f feature candidates, the Fisher’s method calculates a Fisher score (F-score) for each feature (see [38] for the calculation of the F-score). A higher F-score corresponds to a higher ratio of the between-class separability to the within-class variation. We calculated the F-scores of the 9135 RP features ( n f = 9135 ), and then ranked the features in descending order according to their F-scores. Then, we selected the top 50 ranked RP features as the candidates ( m = 50 , where m denotes the number of the maximum number of features that really participate in the feature selection in practice), and applied the top-n-F-score-ranked feature selection strategy [36,39] on the 50 features. For every n , 1 n m , a leave-one-participant-out cross validation (LOPO-CV) procedure was applied on the top n features, where an LDA classifier was employed to test the classification accuracy. In each fold of the LOPO-CV, data (n-dimensional vectors) from 50 participants were used as the training set, and n-dimensional data from the remaining one participant was used as the test data. This step was repeated until every participant’s data had been used as the test data once. After the LOPO-CV procedure was finished for a specific n, we then calculated the classification accuracy: the number of correctly classified participants divided by the total number of participants from two groups. The best n was determined by (denoted as n b e s t ) the highest LOPO-CV classification accuracy across the range of 1 n m . The top n b e s t RP features formed an optimal RP subset. The entire feature selection process is summarized as the four steps in Figure 3. Based on the optimal RP features, the KERP is derived as follows.

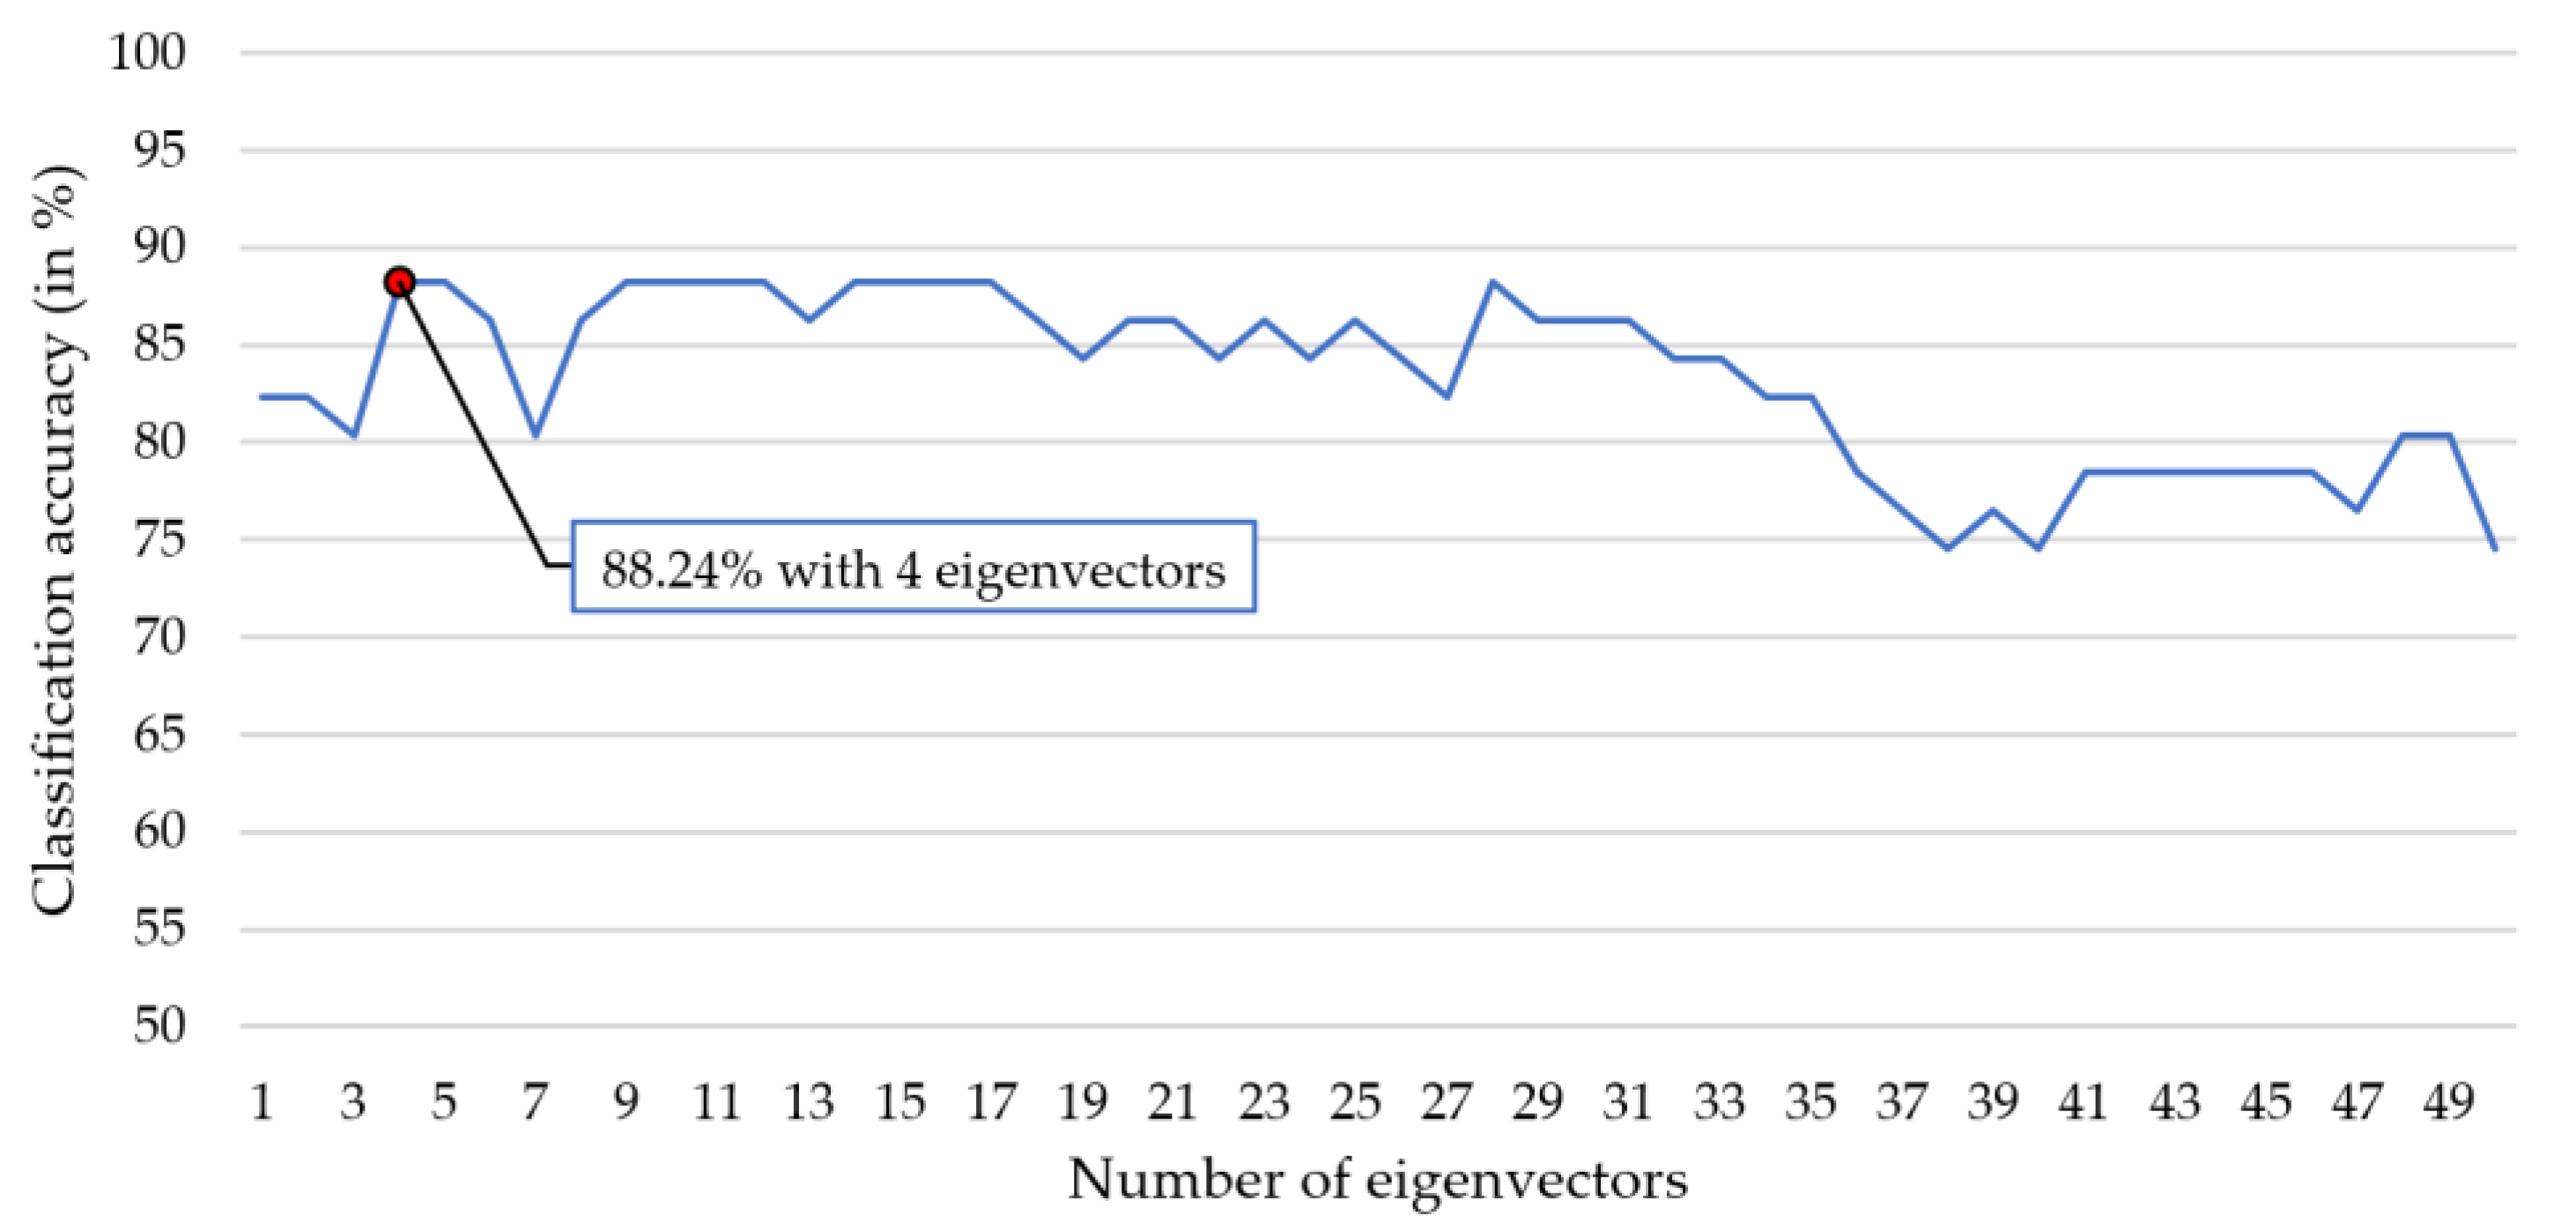
2.3.3. Kernel Eigen-Relative-Power (KERP) Extraction

Given a training set { x i R n } i = 1 M   containing M training data of both classes of MCI and HC, where the elements in the data x i (i.e., an n -dimensional feature vector) are the n optimal RP features ( n = n b e s t ), kernel PCA maps all the training data into a higher-dimensional feature space F via a nonlinear mapping φ : x i R n φ ( x i ) F   , where the mapped data centered to have zero mean i = 1 M φ ( x i ) = 0 [40], and then diagonalizes the covariance of the φ ( x i ) s as
C v = λ v ,  
where C = 1 / M i = 1 M φ ( x i ) φ ( x i ) T is data covariance, and v   is an eigenvector associated with a nonzero eigenvalue λ . All solutions v lie within the span of the mapped data associated spanning coefficients a i ,   i = 1 , ,   M , i.e., v = i = 1 M a i φ ( x i ) , which are nonlinearly related to the RP features in the original space. Solving the problem expressed as (2) is equivalent to solving the eigenvalue problem as
M λ a = K a ,
where K is the M × M   kernel matrix in which the entries are K i j = K ( x i , x j ) = φ ( x i ) · φ ( x j ) , and a k = ( a k 1 ,   , a k M   ) T are the eigenvectors of the kernel matrix subject to the normalization constraint a k 2 = 1 / λ k , k = 1 , ,   M . The first d leading eigenvectors v s are chosen as the projection axes. For a test data x , projection of its image φ ( x ) onto the pth eigenvector v p is calculated as
y p = φ ( x ) · v p = i = 1 M a p i φ ( x i ) · φ ( x ) = i = 1 M a p i K ( x , x i ) ,     p = 1 , ,   d ,
The nonlinear principal components corresponding to φ form a d-dimensional kernel eigen-relative power (KERP) pattern y = ( y 1 , ,   y d ) T , 1 d M . The KERP feature extraction method involves two parameters, including the number of chosen eigenvectors   d , and the kernel parameter. Here, we employed the Gaussian kernel,
K ( x i , x j ) = e x p ( x i x j 2 / 2 σ 2 )
where σ is the parameter of the kernel function.

2.4. Classification and Parameter Optimization

In the present study, classification performances based on four common classifiers, including k-NN, LDA, QDA, and SVM, were compared. Please see the author’s previous work [36] for the decision functions of these chosen classifiers. In both LDA and QDA, the penalties for positive and negative classes were set as 1, because we treated the two classes (MCI and HC) equally in the training. The Gaussian kernel in (5) was also used for SVM. Therefore, among the four classifiers, only the SVM classifier involves free parameters, including the penalty weight C and kernel parameter σ . On the other hand, among the feature extraction methods (including the KERP and the other spectral features to be compared), only the KERP involves free parameters. All the free parameters were optimized using the LOPO-CV and grid search method. For SVM, the grids were in the set { ( C , σ ) | C = 1 ,   10 ,   100 ,   1000 ;   σ = 1.05 x , x = ± 1 ,   ± 1.5 ,   ± 2 , , ± 30 } , while for KERP the girds to be searched are in the set { ( d , σ ) | d = 1 ,   2 ,   ,   20 ;   σ = 1.05 x , x = ± 1 ,   ± 1.5 ,   ± 2 , , ± 30 } . The optimal grid is the one resulting in the highest LOPO-CV classification accuracy.

3. Results and Discussion

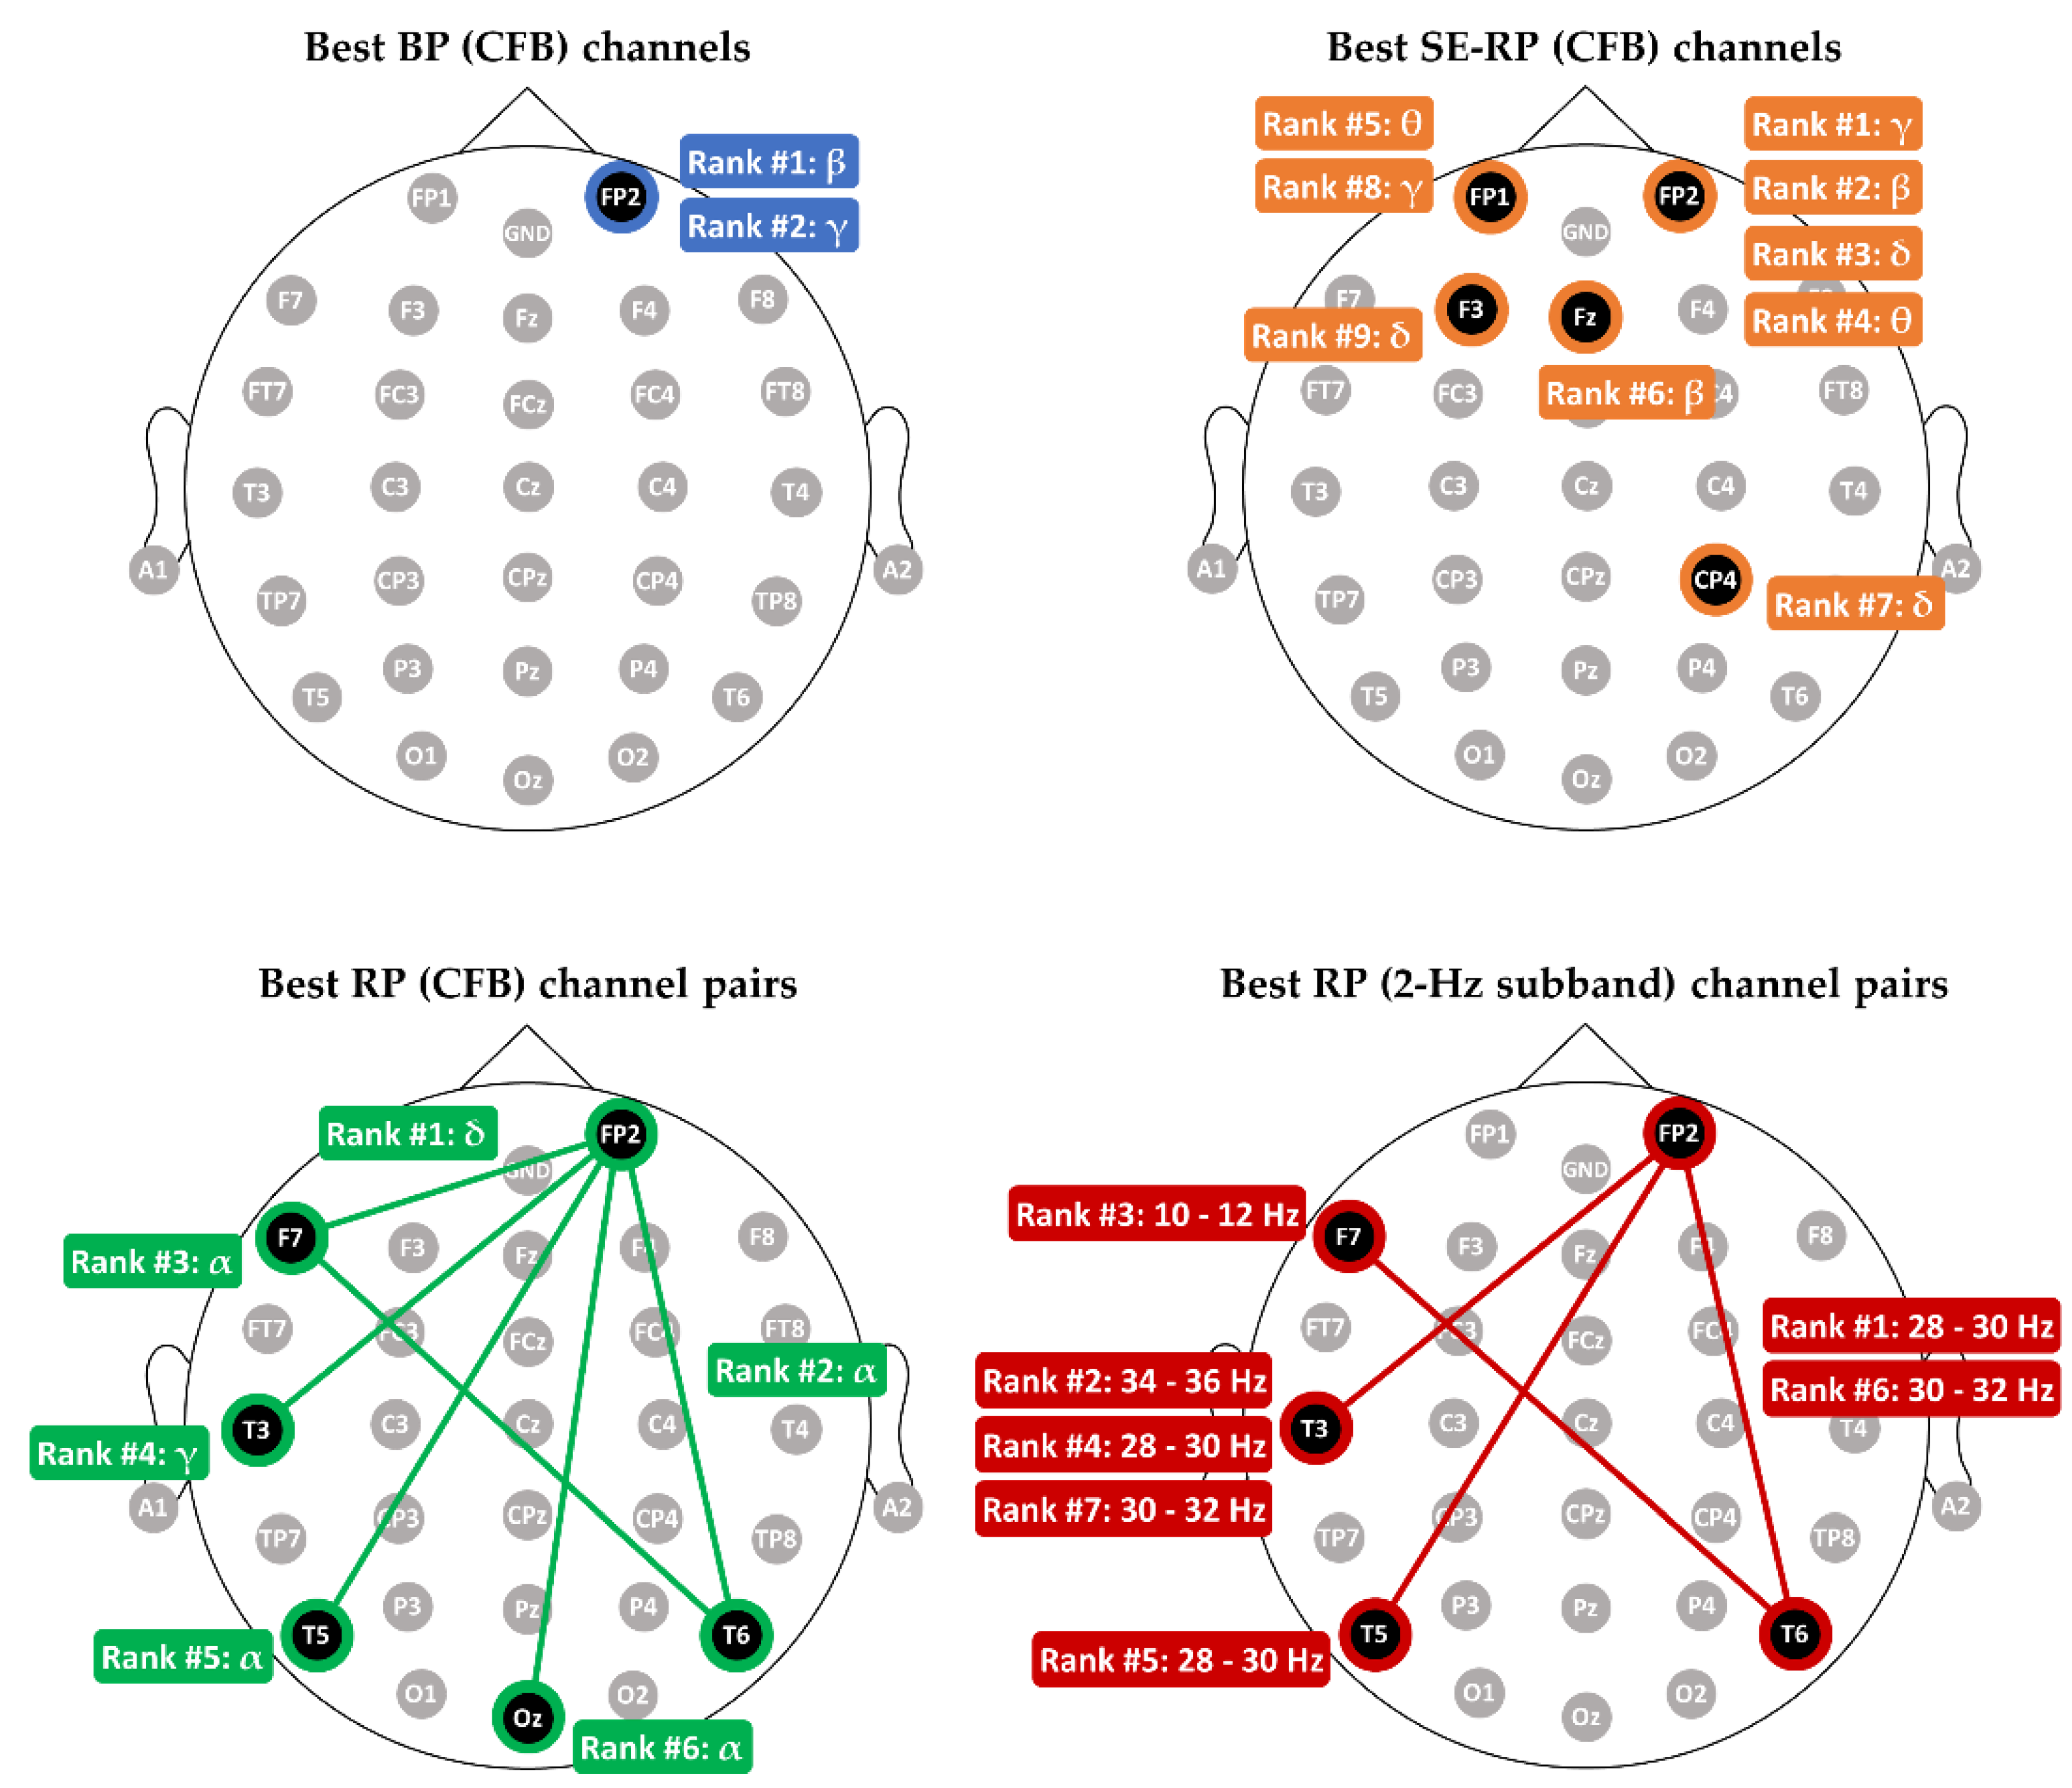
3.1. Comparing Relative Power with other Spectral Features in MCI-HC Classification

We first compare the classification performance of relative power (RP) feature with other spectral power features commonly adopted in previous EEG-based MCI-HC classification studies, including BP and single-electrode relative power (SE-RP). Moreover, instead of using the five conventional frequency bands (CFB) like delta ( δ ), theta ( θ ), alpha ( α ), beta ( β ) and gamma ( γ ), we proposed to use a 2-Hz-width subband analysis method to derive the RP feature, as mentioned in Section 2.3.1. Therefore, we also compared the classification performance between the subband-based and the CFB-based RPs. Detailed descriptions regarding the four types of features are as follows,
(1)
BP (CFB): number of features n f is 150 ( 5   b a n d s / e l e c t r o d e × 30   e l e c t r o d e s );
(2)
SE-RP (CFB): n f = 150 ( 5   R P s / e l e c t r o d e × 30   e l e c t r o d e s ), where the 5 RPs for each electrode are δ -RP, θ -RP, α -RP, β -RP, and γ -RP, and, for example, δ -RP is the ratio of delta power to the total power of 1–44 Hz;
(3)
RP (CFB): n f = 2175 ( 5   b a n d s × ( 30 × 29 / 2 )   e l e c t r o d e   p a i r s );
(4)
RP (2-Hz subband): n f = 9135 ( 21   s u b b a n d s × ( 30 × 29 / 2 )   e l e c t r o d e   p a i r s ).
For a fair comparison, we compared the four features’ best LOPO-CV classification accuracies obtained by their corresponding optimal feature subsets selected by the Fisher’s feature selection method and the top-F-score-ranked feature selection strategy. Notice that hereafter, both classification accuracy and accuracy refer to the LOPO-CV classification accuracy. Figure 4 plots the accuracies against the number of top-F-score-ranked features for the four types of features. The optimal subset and the best electrodes for each of the four features are displayed in Figure 5.
As shown in Figure 4, for all feature types, classification accuracy generally increases with the increase of the number of top-F-score-ranked features until reaching the maximum, and then gradually decreases. The best classification accuracies for BP (CFB), SE-RP (CFB), RP (CFB), and RP (2-Hz subband) are 70.59%, 64.71%, 80.39%, and 86.27%, respectively, and their sizes of the optimal feature subsets are 2, 9, 6, and 7, respectively. This comparison shows that the subband-based between-electrode RP feature greatly outperforms BP by 15.58% and outperforms SE-RP by 21.56%. This reveals that the EEG power difference between electrodes (i.e., RP) is more sensitive than the single-electrode-based spectral features (i.e., BP and SE-RP) in MCI-HC classification. Moreover, Figure 4 also shows that RP (2-Hz subband) performed better than RP (CFB), which suggests that the 2-Hz subband approach is more effective than the conventional frequency bands to extract sensitive RP features for the MCI-HC classification.
According to Figure 5, three main finding are worth discussing. First, electrodes with the best classification performance for single-electrode features (BP and SE-RP) mainly reside over the frontal scalp region (with CP4 as the only exception). Second, all the optimal features for the between-electrode features, RP (CFB) and RP (2-Hz subband), are cross-regional and composed of different bands. Take the RP (2-Hz subband) as an example. Its best features were extracted from the four electrode pairs of FP2-T6 (right frontal–right temporal), FP2-T3 (right frontal–left temporal), FP2-T5 (right frontal–left temporal), F7-T6 (left frontal–right temporal). This finding reveals that the optimal subband analysis-based RP features should be extracted from regional intra-hemispheric and cross-regional inter-hemispheric electrode pairs. Third, FP2 is the only electrode appearing in the best electrode sets for all the four feature types, suggesting that right prefrontal scalp area could be a critical region in distinguishing MCI from HC. For BP, the best two BP features ( β and γ BPs) are extracted from the same site of FP2. Using the two BPs and one electrode FP2, a classification accuracy 70.59% was achieved, which is higher than chance level 50%.

3.2. Comparing Classification Performance between Different Scalp Regions and Frequency Bands

Here, the aim was to analyze and compare which scalp region(s) and which spectral frequency band(s) are the most sensitive to the detection of MCI. The results are listed in Table 1. Several settings about this experiment are described as follows.
(1)
For a specific frequency band and a scalp region. Take frontal δ BP as an example. We extracted the δ BP features from the seven electrodes’ EEG signals from each participant and fed the seven δ BPs into the LDA classifier. The classification accuracy is 54.90%. Then, we performed the feature selection task on the seven δ BPs. The selected optimal δ BPs achieved a slightly higher accuracy of 56.86%.
(2)
For the termmerged”. Take frontal BP as an example. We extracted the BPs of five conventional frequency bands from the EEG signals of the seven electrodes over the frontal scalp region from each participant. Then, feeding the 35 BP features into LDA classifier achieves an accuracy of 66.67%. After performing the feature selection on the 35 BP features, we again fed the selected optimal ones into LDA for classification and obtained an accuracy of 70.59%.
According to Table 1, the accuracies given by the optimal feature subsets are higher than those obtained by using the original features in most cases. The accuracy improvement is large in some cases. For example, in the case of “β-BP” and the “entire” scalp region (entire: the β-BPs of the 30 electrodes were used as the features), when all the original 30 β-BPs were used as the features, the accuracy was only 47.06%; whereas feeding the optimal β-BP subset (few among the 30 β-BPs) into the LDA classifier yielded a much higher result 68.63%. In the following, we discussed other results in terms of the accuracy with feature selection.
Frontal δ and θ powers have been highlighted in previous studies. Our results showed that the most sensitive scalp regions were at the central region for the BP feature (β-BP: 70.59%), at the frontal region for the SE-RP feature (β-SE-RP: 70.59% and γ -SE-RP: 70.59%), and at the frontal region for the RP (CFB) feature (δ-RP: 76.47%). The best classification performance achieved by the frontal δ-RP echoes the finding reported in the study by Yener et al. [20], where frontal delta oscillations were found to be a marker for MCI detection (classification of MCI vs. HC). On the other hand, the studies by Grunwald et al. [12] and by Rossini et al. [14] indicated that participants with MCI had higher resting-state frontal θ powers on average. However, the group difference remains inconclusive: the difference is significant in [14] but not in [12]. Our result in Table 1 indicates that frontal θ-BP provides only 58.82% accuracy, revealing that frontal θ power is not a feasible marker for an accurate detection of MCI. Finally, it can be observed from Table 1 that for all possible features and scalp regions, the RP (2-Hz subband) features over the temporal region achieves the highest accuracy of 82.35%.

3.3. Comparing the Accuracies between Different Classifiers with KERP Feature

Given the best RP (2-Hz subband) feature subset, we further test the performance of the proposed KERP feature in MCI-HC classification. As shown in Figure 5, the best seven RP features are (1) FP2-T6 (28–30 Hz), (2) FP2-T3 (34–36 Hz), (3) F7-T6 (10–12 Hz), (4) FP2-T3 (28–30 Hz), (5) FP2-T5 (28–30 Hz), (6) FP2-T6 (30–32 Hz), and (7) FP2-T3 (30–32 Hz). The seven RP features form a vector that was fed into the kernel PCA. Then, we determined the best number of chosen eigenvectors d and the optimal value of the kernel parameter by LDA classifier-based LOPO-CV and grid searching. The optimal values for the two parameters were found to be d = 4 and σ = 2.9235 . Hence, a KERP feature is a vector of four dimensions. Figure 6 plots the LDA classifier-based classification accuracy against the number of chosen eigenvectors of the KERP feature under the setting of σ = 2.9235 .
Then, we fed the KERP features into different classifiers (k-NN, LDA, QDA, SVM) to test the participant-independent classification accuracy (i.e., by LOPO-CV). For the k-NN classifier, we set k = 3 . The optimal values of SVM were C = 10 and σ = 3.7975 . The accuracies of these classifiers based on the same KERP feature are listed in Table 2. Comparing the LDA-based accuracy (88.24%) in Table 2 with the highest accuracy of RP shown in Figure 4 (86.27%), we can see that the KERP feature shows better classification performance than the optimal RP feature, and therefore better than other commonly used spectral features (BP and SE-RP). Moreover, among the four classifiers, SVM gave the highest accuracy (90.20%) and k-NN performed the worst (76.47%). The comparison indicates that the combination of KERP feature and the SVM classifier can achieve a high MCI-HC classification accuracy, with the sensitivity of 87.50% (only 3 out of the 24 MCI participants were misclassified) and specificity of 92.59% (only 2 out of the 27 HC were misclassified).

4. Conclusions

Being the first study that used the between-electrode relative power (RP) as an EEG feature for the MCI-HC classification, we successfully demonstrated that the RP feature can achieve high MCI-HC classification accuracy which outperforms other commonly used spectral power features of EEG signals. Based on the optimal RP features, we further proposed a novel EEG feature—KERP for higher detection accuracy of MCI. We showed that the KERP feature combined with an SVM classifier can achieve a considerably high classification accuracy of 90.20%, with only five electrodes.
Although the current study provided very promising results of the effectiveness of KERP features in the MCI-HC classification, several limitations are still yet to be noted. First, the sample size of the current study was relatively small, which limited the generalizability of the current results. Testing the classification performance of KERP with larger sample size will be needed to increase the generalizability. Second, although resting-state EEG recordings is easier to implement in clinical settings due to its task-free nature, it was unclear whether features extracted from resting-state are stable across time. Future studies that test resting-state EEGs from two time points separated for at least a month will be needed to test the stability of the classification performance of KERP. Last but not least, since individuals with MCI commonly suffer from notable memory declines, it will be very interesting to test the classification performance of KERP features extracted from task-induced EEGs (e.g., working memory tasks). It is very likely that task-induced EEGs may contain more information than resting-state EEGs in terms of MCI detection.
On the other hand, many BCI systems have been integrated with virtual reality (VR) techniques for the purpose of improving cognitive functions of users. Such BCI-VR applications are based on closed-loop control systems. Firstly, these BCI-VR systems allow users to control the actuators in the virtual environment (e.g., virtual racing cars [51]) through their brain activities. In the feedback path, the BCI-VR systems quantify/assess the cognitive performance of the users (attention for example [51]) by extracting the cognitive-sensitive markers from the recorded EEG signals. In the current study, we proposed a novel EEG-based method for accurate and early detection of MCI. The proposed method, therefore, has the potential to serve as a neurofeedback approach for developing reliable BCI systems for assessing and even improving the cognitive performance of individuals with MCI. Such BCI systems can be viewed as non-pharmacological interventions, if the systems are implemented and validated in the future. Moreover, the EEG difference between different scalp locations, in fact, somewhat represents the EEG power (or the EEG amplitude’s voltage in a specific frequency band) gradient from one location to another. There might exist similar results when applying other methods that can quantify the voltage or power gradients across the scalp, which might be also a research issue worth investigating.

Author Contributions

Y.-T.H. participated in the KERP algorithm design, EEG data analysis, and drafting. C.-F.T. participated in the study conception, participant recruitment in the hospital, EEG data collection, and discussion. C.-T.W. conceptualized the study design, coordinated data collection, involved in data analyses and participated in manuscript writing and revision. T.-T.T. helped process the EEG data and participated in the discussion. C.-Y.L. secured the researching funding, participated in the analysis and discussion of critical points. Y.-H.L. was responsible for project coordination, conceptualized the study design, secured the researching funding, designed analysis protocols, and participated in the analysis and the original paper preparation. All authors have read and agreed to the published version of the manuscript.

Funding

This work was supported by the funding from the Ministry of Science and Technology (MOST) of Taiwan, under Grant No. MOST 109-2221-E-027-031.

Institutional Review Board Statement

The study was conducted according to the guidelines of the Declaration of Helsinki, and approved by the Institutional Review Board of Taipei Veterans General Hospital (IRB No: 2017-06-009A, Date of approval: 4 July 2017).

Informed Consent Statement

Informed consent was obtained from all subjects involved in the study.

Data Availability Statement

The current patient dataset cannot be shared in any form due to regulation of IRB and Personal Information protection Act.

Conflicts of Interest

The authors declare no conflict of interest.

References

  1. Petersen, R.C.; Doody, R.; Kurz, A.; Mohs, R.C.; Morris, J.C.; Rabins, P.V.; Ritchie, K.; Rossor, M.; Thal, L.; Winblad, B. Current concepts in mild cognitive impairment. Arch. Neurol. 2001, 58, 1985–1992. [Google Scholar] [CrossRef] [PubMed]
  2. Vinters, H.V. Emerging concepts in Alzheimer’s disease. Annu. Rev. Pathol. Mech. Dis. 2015, 10, 291–319. [Google Scholar] [CrossRef]
  3. Petersen, R.C.; Lopez, O.; Armstrong, M.J.; Getchius, T.S.D.; Ganguli, M.; Gloss, D.; Gronseth, G.S.; Marson, D.; Pringsheim, T.; Day, G.S.; et al. Practice guideline update summary: Mild cognitive impairment. Neurology 2017, 90, 126–135. [Google Scholar] [CrossRef] [PubMed]
  4. Ward, A.; Tardiff, S.; Dye, C.; Arrighi, H.M. Rate of Conversion from Prodromal Alzheimer’s Disease to Alzheimer’s Dementia: A Systematic Review of the Literature. Dement. Geriatr. Cogn. Disord. Extra 2013, 3, 320–332. [Google Scholar] [CrossRef] [PubMed]
  5. Livingston, G.; Huntley, J.; Sommerlad, A.; Ames, D.; Ballard, C.; Banerjee, S.; Brayne, C.; Burns, A.; Cohen-Mansfield, J.; Cooper, C.; et al. Dementia prevention, intervention, and care: 2020 report of the Lancet Commission. Lancet 2020, 396, 413–446. [Google Scholar] [CrossRef]
  6. Rodakowski, J.; Saghafi, E.; Butters, M.A.; Skidmore, E.R. Non-pharmacological interventions for adults with mild cognitive impairment and early stage dementia: An updated scoping review. Mol. Asp. Med. 2015, 43, 38–53. [Google Scholar] [CrossRef] [Green Version]
  7. Balietti, M.; Giuli, C.; Fattoretti, P.; Fabbietti, P.; Postacchini, D.; Conti, F. Cognitive Stimulation Modulates Platelet Total Phospholipases A2 Activity in Subjects with Mild Cognitive Impairment. J. Alzheimer’s Dis. 2016, 50, 957–962. [Google Scholar] [CrossRef] [Green Version]
  8. Sherman, D.S.; Mauser, J.; Nuno, M.; Sherzai, D. The Efficacy of Cognitive Intervention in Mild Cognitive Impairment (MCI): A Meta-Analysis of Outcomes on Neuropsychological Measures. Neuropsychol. Rev. 2017, 27, 440–484. [Google Scholar] [CrossRef] [Green Version]
  9. Khatun, S.; Morshed, B.I.; Bidelman, G.M. A Single-Channel EEG-Based Approach to Detect Mild Cognitive Impairment via Speech-Evoked Brain Responses. IEEE Trans. Neural Syst. Rehabil. Eng. 2019, 27, 1063–1070. [Google Scholar] [CrossRef]
  10. Suk, H.-I.; Lee, S.-W.; Shen, D. Latent feature representation with stacked auto-encoder for AD/MCI diagnosis. Brain Struct. Funct. 2015, 220, 841–859. [Google Scholar] [CrossRef]
  11. Ni, H.; Qin, J.; Zhou, L.; Zhao, Z.; Wang, J.; Hou, F. Network analysis in detection of early-stage mild cognitive impairment. Phys. A Stat. Mech. Appl. 2017, 478, 113–119. [Google Scholar] [CrossRef]
  12. Grunwald, M.; Busse, F.; Hensel, A.; Riedel-Heller, S.; Kruggel, F.; Arendt, T.; Wolf, H.; Gertz, H.-J. Theta-power Differences in Patients with Mild Cognitive Impairment Under Rest Condition and During Haptic Tasks. Alzheimer Dis. Assoc. Disord. 2002, 16, 40–48. [Google Scholar] [CrossRef] [PubMed] [Green Version]
  13. Moretti, D.V.; Miniussi, C.; Frisoni, G.; Zanetti, O.; Binetti, G.; Geroldi, C.; Galluzzi, S.; Rossini, P.M. Vascular damage and EEG markers in subjects with mild cognitive impairment. Clin. Neurophysiol. 2007, 118, 1866–1876. [Google Scholar] [CrossRef] [PubMed] [Green Version]
  14. Rossini, P.M.; Buscema, M.; Capriotti, M.; Grossi, E.; Rodriguez, G.; Del Percio, C.; Babiloni, C. Is it possible to automatically distinguish resting EEG data of normal elderly vs. mild cognitive impairment subjects with high degree of accuracy? Clin. Neurophysiol. 2008, 119, 1534–1545. [Google Scholar] [CrossRef] [PubMed]
  15. Prichep, L.S.; John, E.R.; Ferris, S.H.; Rausch, L.; Fang, Z.; Cancro, R.; Torossian, C.; Reisberg, B. Prediction of longitudinal cognitive decline in normal elderly with subjective complaints using electrophysiological imaging. Neurobiol. Aging 2006, 27, 471–481. [Google Scholar] [CrossRef]
  16. Yener, G.G.; Emek-Savaş, D.D.; Lizio, R.; Çavuşoğlu, B.; Carducci, F.; Ada, E.; Güntekin, B.; Babiloni, C.C.; Başar, E. Frontal delta event-related oscillations relate to frontal volume in mild cognitive impairment and healthy controls. Int. J. Psychophysiol. 2016, 103, 110–117. [Google Scholar] [CrossRef]
  17. Kashefpoor, M.; Rabbani, H.; Barekatain, M. Automatic diagnosis of mild cognitive impairment using electroencephalogram spectral features. J. Med. Signals Sens. 2016, 6, 25–32. [Google Scholar] [CrossRef]
  18. Kashefpoor, M.; Rabbani, H.; Barekatain, M. Supervised dictionary learning of EEG signals for mild cognitive impairment diagnosis. Biomed. Signal Process. Control 2019, 53, 101559. [Google Scholar] [CrossRef]
  19. Ruiz-Gómez, S.; Gómez, C.; Poza, J.; Gutiérrez-Tobal, G.; Tola-Arribas, M.; Cano, M.; Hornero, R. Automated Multiclass Classification of Spontaneous EEG Activity in Alzheimer’s Disease and Mild Cognitive Impairment. Entropy 2018, 20, 35. [Google Scholar] [CrossRef] [Green Version]
  20. Musaeus, C.S.; Engedal, K.; Høgh, P.; Jelic, V.; Mørup, M.; Naik, M.; Oeksengaard, A.-R.; Snaedal, J.; Wahlund, L.-O.; Waldemar, G.; et al. EEG Theta Power Is an Early Marker of Cognitive Decline in Dementia due to Alzheimer’s Disease. J. Alzheimer’s Dis. 2018, 64, 1359–1371. [Google Scholar] [CrossRef]
  21. Farina, F.R.; Emek-Savaş, D.D.; Rueda-Delgado, L.; Boyle, R.; Kiiski, H.; Yener, G.; Whelan, R. A comparison of resting state EEG and structural MRI for classifying Alzheimer’s disease and mild cognitive impairment. Neuroimage 2020, 215, 116795. [Google Scholar] [CrossRef]
  22. Ieracitano, C.; Mammone, N.; Bramanti, A.; Hussain, A.; Morabito, F.C. A Convolutional Neural Network approach for classification of dementia stages based on 2D-spectral representation of EEG recordings. Neurocomputing 2019, 323, 96–107. [Google Scholar] [CrossRef]
  23. Abásolo, D.; Hornero, R.; Gómez, C.; García, M.; López, M. Analysis of EEG background activity in Alzheimer’s disease patients with Lempel–Ziv complexity and central tendency measure. Med. Eng. Phys. 2006, 28, 315–322. [Google Scholar] [CrossRef] [PubMed] [Green Version]
  24. Abásolo, D.; Escudero, J.; Hornero, R.; Gómez, C.; Espino, P. Approximate entropy and auto mutual information analysis of the electroencephalogram in Alzheimer’s disease patients. Med. Biol. Eng. Comput. 2008, 46, 1019–1028. [Google Scholar] [CrossRef] [Green Version]
  25. Cao, Y.; Cai, L.; Wang, J.; Wang, R.; Yu, H.; Cao, Y.; Liu, J. Characterization of complexity in the electroencephalograph activity of Alzheimer’s disease based on fuzzy entropy. Chaos Interdiscip. J. Nonlinear Sci. 2015, 25, 083116. [Google Scholar] [CrossRef] [PubMed]
  26. Maturana-Candelas, A.; Gómez, C.; Poza, J.; Pinto, N.; Hornero, R. EEG Characterization of the Alzheimer’s Disease Continuum by Means of Multiscale Entropies. Entropy 2019, 21, 544. [Google Scholar] [CrossRef] [PubMed] [Green Version]
  27. Sharma, N.; Kolekar, M.H.; Jha, K.; Kumar, Y. EEG and Cognitive Biomarkers Based Mild Cognitive Impairment Diagnosis. IRBM 2018, 40, 113–121. [Google Scholar] [CrossRef]
  28. Cicalese, P.A.; Li, R.; Ahmadi, M.B.; Wang, C.; Francis, J.T.; Selvaraj, S.; Schulz, P.E.; Zhang, Y. An EEG-fNIRS hybridization technique in the four-class classification of Alzheimer’s disease. J. Neurosci. Methods 2020, 336, 108618. [Google Scholar] [CrossRef]
  29. Dolcos, F.; Rice, H.J.; Cabeza, R. Hemispheric asymmetry and aging: Right hemisphere decline or asymmetry reduction. Neurosci. Biobehav. Rev. 2002, 26, 819–825. [Google Scholar] [CrossRef]
  30. Long, X.; Zhang, L.; Liao, W.; Jiang, C.; Qiu, B. Distinct laterality alterations distinguish mild cognitive impairment and Alzheimer’s disease from healthy aging: Statistical parametric mapping with high resolution MRI. Hum. Brain Mapp. 2013, 34, 3400–3410. [Google Scholar] [CrossRef]
  31. Cottone, C.; Tomasevic, L.; Porcaro, C.; Filligoi, G.; Tecchio, F. Physiological Aging Impacts the Hemispheric Balances of Resting State Primary Somatosensory Activities. Brain Topogr. 2013, 26, 186–199. [Google Scholar] [CrossRef] [PubMed]
  32. Smits, F.M.; Porcaro, C.; Cottone, C.; Cancelli, A.; Rossini, P.M.; Tecchio, F. Electroencephalographic Fractal Dimension in Healthy Ageing and Alzheimer’s Disease. PLoS ONE 2016, 11, e0149587. [Google Scholar] [CrossRef]
  33. John, T.N.; Dharmapalan, P.S.; Menon, N.P. Exploration of time–frequency reassignment and homologous inter-hemispheric asymmetry analysis of MCI–AD brain activity. BMC Neurosci. 2019, 20, 1–14. [Google Scholar] [CrossRef] [Green Version]
  34. Knott, V.; Mahoney, C.; Kennedy, S.; Evans, K. EEG power, frequency, asymmetry and coherence in male depression. Psychiatry Res. Neuroimaging 2001, 106, 123–140. [Google Scholar] [CrossRef]
  35. Segrave, R.A.; Cooper, N.R.; Thomson, R.H.; Croft, R.J.; Sheppard, D.M.; Fitzgerald, P.B. Individualized Alpha Activity and Frontal Asymmetry in Major Depression. Clin. EEG Neurosci. 2011, 42, 45–52. [Google Scholar] [CrossRef] [PubMed]
  36. Wu, C.-T.; Dillon, D.; Hsu, H.-C.; Huang, S.; Barrick, E.; Liu, Y.-H. Depression Detection Using Relative EEG Power Induced by Emotionally Positive Images and a Conformal Kernel Support Vector Machine. Appl. Sci. 2018, 8, 1244. [Google Scholar] [CrossRef]
  37. Fang, L.; Zhao, H.; Wang, P.; Yu, M.; Yan, J.; Cheng, W.; Chen, P. Feature selection method based on mutual information and class separability for dimension reduction in multidimensional time series for clinical data. Biomed. Signal Process. Control 2015, 21, 82–89. [Google Scholar] [CrossRef] [Green Version]
  38. Liu, Y.-H.; Huang, S.; Huang, H.-C.; Peng, W.-H. Novel Motor Imagery-Based Brain Switch for Patients with Amyotrophic Lateral Sclerosis: A Case Study Using Two-Channel Electroencephalography. IEEE Consum. Electron. Mag. 2019, 8, 72–77. [Google Scholar] [CrossRef]
  39. Lin, Y.P.; Wang, C.H.; Jung, T.P.; Wu, T.L.; Jeng, S.K.; Duann, J.R.; Chen, J.H. EEG-based emotion recognition in music listening. IEEE Trans. Biomed. Eng. 2010, 57, 1798–1806. [Google Scholar] [CrossRef]
  40. Schölkopf, B.; Smola, A.; Müller, K.-R. Nonlinear Component Analysis as a Kernel Eigenvalue Problem. Neural Comput. 1998, 10, 1299–1319. [Google Scholar] [CrossRef] [Green Version]
  41. Liu, Y.-H.; Wu, C.-T.; Cheng, W.-T.; Hsiao, Y.-T.; Chen, P.-M.; Teng, J.-T. Emotion Recognition from Single-Trial EEG Based on Kernel Fisher’s Emotion Pattern and Imbalanced Quasiconformal Kernel Support Vector Machine. Sensors 2014, 14, 13361–13388. [Google Scholar] [CrossRef] [Green Version]
  42. Liao, S.-C.; Wu, C.-T.; Huang, H.-C.; Cheng, W.-T.; Liu, Y.-H. Major Depression Detection from EEG Signals Using Kernel Eigen-Filter-Bank Common Spatial Patterns. Sensors 2017, 17, 1385. [Google Scholar] [CrossRef] [Green Version]
  43. Albert, M.S.; DeKosky, S.T.; Dickson, D.; Dubois, B.; Feldman, H.H.; Fox, N.C.; Gamst, A.; Holtzman, D.M.; Jagust, W.J.; Petersen, R.C.; et al. The diagnosis of mild cognitive impairment due to Alzheimer’s disease: Recommendations from the National Institute on Aging-Alzheimer’s Association workgroups on diagnostic guidelines for Alzheimer’s disease. Alzheimer’s Dement. 2011, 7, 270–279. [Google Scholar] [CrossRef] [PubMed] [Green Version]
  44. McKhann, G.M.; Knopman, D.S.; Chertkow, H.; Hyman, B.T.; Jack, C.R.; Kawas, C.H.; Klunk, W.E.; Koroshetz, W.J.; Manly, J.J.; Mayeux, R.; et al. The diagnosis of dementia due to Alzheimer’s disease: Recommendations from the National Institute on Aging-Alzheimer’s Association workgroups on diagnostic guidelines for Alzheimer’s disease. Alzheimer’s Dement. 2011, 7, 263–269. [Google Scholar] [CrossRef] [PubMed] [Green Version]
  45. Tsai, C.-F.; Lee, W.-J.; Wang, S.-J.; Shia, B.-C.; Nasreddine, Z.; Fuh, J.-L. Psychometrics of the Montreal Cognitive Assessment (MoCA) and its subscales: Validation of the Taiwanese version of the MoCA and an item response theory analysis. Int. Psychogeriatr. 2012, 24, 651–658. [Google Scholar] [CrossRef]
  46. Neuroscan FAQs. Available online: http://compumedicsneuroscan.com/wp-content/uploads/3502D-Neuroscan-FAQs.pdf (accessed on 3 July 2021).
  47. Delorme, A.; Makeig, S. EEGLAB: An open source toolbox for analysis of single-trial EEG dynamics including independent component analysis. J. Neurosci. Methods 2004, 134, 9–21. [Google Scholar] [CrossRef] [Green Version]
  48. Mognon, A.; Jovicich, J.; Bruzzone, L.; Buiatti, M. ADJUST: An automatic EEG artifact detector based on the joint use of spatial and temporal features. Psychophysiology 2011, 48, 229–240. [Google Scholar] [CrossRef]
  49. Jović, A.; Brkić, K.; Bogunović, N. A review of feature selection methods with applications. In Proceedings of the 2015 38th International Conference on Information and Communication Technology, Electronics and Microelectronics, Opatija, Croatia, 25–29 May 2015. [Google Scholar]
  50. You, W.; Yang, Z.; Ji, G. Feature selection for high-dimensional multi-category data using PLS-based local recursive feature elimination. Expert Syst. Appl. 2014, 41, 1463–1475. [Google Scholar] [CrossRef]
  51. Yeh, S.C.; Hou, C.L.; Peng, W.H.; Wei, Z.Z.; Huang, S.; Kung, E.Y.C.; Lin, L.; Liu, Y.H. A multiplayer online car racing virtual-reality game based on internet of brains. J. Syst. Archit. 2018, 89, 30–40. [Google Scholar] [CrossRef]
Figure 1. A summary of demographic data and neuropsychological test results of participants. HC = healthy control, MCI = mild cognitive impairment, MMSE = mini-mental state examination, MoCA = Montreal Cognitive Assessment, SD = standard deviation. p-values show the significance of statistical testing of the differences between the two groups. A p-value was considered significant when p-value < 0.01. * denotes p < 0.01.
Actuators 10 00152 g001
Figure 2. Layout of the electrodes. Their positions follow the 10–20 international system. Ground (GND) electrode is at the forehead, and two references are at A1 and A2, respectively. For analysis, we divided the entire scalp area into five different regions, including frontal (brown), central (green), parietal (blue), occipital (purple), and temporal (yellow).
Actuators 10 00152 g002
Figure 3. Feature selection based on Fisher’s criterion and top-n-F-score-ranked feature selection strategy.
Actuators 10 00152 g003
Figure 4. Comparison of MCI-HC classification accuracy among conventional frequency band (CFB)-based BP, SE-RP (CFB), RP (CFB), and 2-Hz-width subband-based RP based on the LDA classifier. The total numbers of feature candidates for the four features are 150, 150, 2175, and 9135, respectively. The best classification accuracies for the four features are 70.59%, 64.71%, 80.39%, and 86.27%, respectively. In terms of RP (2-Hz subband), its accuracy curve reached the maximum 86.27% when the number of top-F-score-ranked-feature increased to 7, which occupy only a very small portion of the whole RP feature candidates (7/9135 = 0.07%).
Actuators 10 00152 g004
Figure 5. The best feature subsets of the BP (CFB), SE-RP (CFB), RP (CFB), and RP (2-Hz subband) features. (Upper-left): the best set for BP includes beta (top-1-ranked) and gamma (top-2-ranked) BPs, and their electrode locations are at FP2. (Upper-right): the best set of SE-RP includes nine features at five different electrode channels. (Bottom-left): the best set of RP (CFB) includes six features from six different electrodes. (Bottom-right): the best set of RP includes seven features from five different electrodes.
Actuators 10 00152 g005
Figure 6. The plot of classification accuracy against the number of chosen eigenvectors in KERP feature using LDA classifier.
Actuators 10 00152 g006
Table 1. Comparison of classification accuracies among different features, frequency bands, and scalp regions using LDA (in %). In each grid of this table, the numbers outside and inside the brackets denote the accuracies obtained from the features with and without feature selection.
EEG FeaturesFrontalCentralTemporalParietalOccipitalEntire
BP (CFB)δ56.86 (54.90)60.78 (60.78)50.98 (45.10)50.98 (45.10)47.06 (43.14)56.86 (43.14)
θ58.82 (56.86)52.94 (49.02)58.82 (56.86)54.90 (49.02)56.86 (47.06)58.82 (39.22)
α54.90 (52.94)56.86 (52.94)58.82 (54.90)56.86 (54.90)54.90 (50.98)54.90 (47.06)
β68.63 (66.67)70.59 (68.63)62.75 (54.90)54.90 (47.06)43.14 (37.25)68.63 (47.06)
γ68.63 (64.71)58.82 (50.98)66.67 (54.90)58.82 (50.98)47.06 (45.10)68.63 (45.10)
SE-RP (CFB)δ68.63 (68.63)56.86 (49.02)54.90 (52.94)64.71 (49.02)45.10 (39.22)60.78 (37.25)
θ60.78 (58.82)62.75 (52.94)45.10 (37.25)62.75 (58.82)49.02 (33.33)64.71 (33.33)
α56.86 (49.02)52.94 (50.98)54.90 (50.98)62.75 (58.82)58.82 (50.98)72.55 (68.63)
β70.59 (70.59)52.94 (39.22)54.90 (52.94)50.98 (47.06)45.10 (45.10)68.63 (64.71)
γ70.59 (70.59)54.90 (52.94)62.75 (62.75)54.90 (47.06)49.02 (35.29)70.59 (56.86)
RP (CFB)δ76.47 (60.78)62.75 (41.18)68.63 (47.06)64.71 (60.78)52.94 (52.94)78.43 (56.86)
θ70.59 (47.06)72.55 (62.75)62.75 (41.18)64.71 (62.75)50.98 (45.10)64.71 (45.10)
α66.67 (56.86)60.78 (49.02)72.55 (58.82)66.67 (66.67)50.98 (43.14)76.47 (64.71)
β70.59 (50.98)50.98 (33.33)60.78 (47.06)62.75 (37.25)50.98 (50.98)74.51 (50.98)
γ70.59 (68.63)62.75 (58.82)70.59 (66.67)60.78 (33.33)50.98 (37.25)72.55 (50.98)
BP (merged CFB)70.59 (66.67)58.82 (45.10)60.78 (50.98)54.90 (43.14)52.94 (45.10)70.59 (52.94)
SE-RP (merged CFB)68.63 (56.86)52.94 (43.14)68.63 (56.86)64.71 (41.18)54.90 (33.33)64.71 (50.98)
RP (merged CFB)76.47 (60.78)64.71 (43.14)72.55 (49.02)66.67 (58.82)60.78 (50.98)80.39 (56.86)
RP (merged subband)74.51 (47.06)72.55 (50.98)82.35 (64.71)66.67 (39.22)80.39 (58.82)86.27 (43.14)
Table 2. Comparison of classification performance among LDA, QDA, k-NN, and SVM classifiers using KERP feature (in %).
ClassifierAccuracySensitivitySpecificity
LDA88.2491.6785.19
QDA82.3579.1785.19
k-NN76.4775.0077.78
SVM90.2087.5092.59
Publisher’s Note: MDPI stays neutral with regard to jurisdictional claims in published maps and institutional affiliations.

