Article

Development and Evaluation of Energy-Saving Electro-Hydraulic Actuator

1
Faculty of Mechanical Engineering, Ho Chi Minh City University of Technology, 268 Ly Thuong Kiet Street, District 10, Ho Chi Minh City 72506, Vietnam
2
Vietnam National University Ho Chi Minh City (VNU-HCM), Linh Trung Ward, Thu Duc District, Ho Chi Minh City 71300, Vietnam
3
Industrial University of Ho Chi Minh City, 12 Nguyen Van Bao Street, Go Vap District, Ho Chi Minh City 71400, Vietnam
*
Author to whom correspondence should be addressed.
Actuators 2021, 10(11), 302; https://doi.org/10.3390/act10110302
Submission received: 9 August 2021 / Revised: 20 October 2021 / Accepted: 11 November 2021 / Published: 17 November 2021
(This article belongs to the Section Control Systems)

Abstract

:
This paper will develop a novel electro-hydraulic actuator with energy saving characteristics. This system is able to work in differential configurations through the shifting algorithm of the valves, meaning that this developed system can be adjusted flexibly to obtain the desirable working requirements including the high effectiveness of energy recovery from the load, high velocity or torque. Instead of establishing the mathematical model for the purpose of the dynamic analysis, a model of the developed actuator is built in AMESim software. The simulation results reveal that the system is able to save approximately 20% energy consumption compared with a traditional without energy recovery EHA. Furthermore, to evaluate the accuracy of the model, experiments will be performed that prove strongly that the experimental results are well matched to the results attained from the simulation model. This work also offers a useful insight into designing and analyzing hydraulic systems without experiments.

1. Introduction

Nowadays, valve controlled hydraulic systems are widely applied in industry such as presses because of good dynamic response. However, the most common drawback of traditional valve-controlled hydraulic systems is low efficiency in many operation points due to throttling control or mismatch power [1,2,3]. To overcome these problems, many works have been conducted and these studies are briefly reviewed as follows.
Based on the valve controlled systems, some modifications for multi-actuator systems are proposed to reduce energy loss of throttling control [4,5,6,7,8]. The simulation results proved that these systems significantly reduce the energy losses. However, the energy losses were fairly high in such systems.
Load sensing systems (LS) are considered as state of the art of hydraulic systems because of high efficiency and good performance. They have been widely applied in hydraulic mobile applications, especially for multi-actuator systems. However, losses in the LS systems were still remained due to principle of working of load sensing pump and throttling control [9,10,11,12].
Digital hydraulic systems are another solution to control flow into the actuator by controlling the on/off high speed valve. Compared with basis valve controlled systems, the digital hydraulic system considerably reduces energy loss. Moreover, studies on the control algorithms as well as optimization of digital hydraulic systems have been conducted, which prove these systems have great application potential in industry or construction machinery [13,14,15,16]. However, energy recovery has not been studied for the digital hydraulic systems yet.
In displacement controlled systems, flow into the actuator is controlled by adjusting the displacement of the hydraulic pump. Therefore, losses deal to the throttling control are totally neglected. Although the displacement controlled systems have high efficiency, the performance of these systems are worse than that of the valve controlled systems [1,9,17,18].
The hydraulic transformer system has been developed based on the pressure coupling type of hydraulic system [19,20]. The hydraulic transformer system is able to recover energy as well good tracking control but it requires more equipment to fabricate a hydraulic system when compared with the above systems. The hydraulic transformer is suitable for heavy multi-actuator hydraulic systems.
The electro-hydraulic actuator (EHA) is considered as an energy saving hydraulic system. The EHA systems have been proven to have high recovery efficiency and good performance [21,22]. Modern control algorithms have been designed for such systems to improve applicability of EHA systems into industries [23,24,25,26]. However, the cost and the low specific power for the EHA systems using batteries or the low specific energy for the EHA systems using super capacitors are the drawbacks of the EHA systems [27].
In this study, a novel energy saving hydraulic system is proposed and investigated. The system is a pump controlled hydraulic system developed for the cylinder actuator. The proposed system has advanced characteristics in both energy saving and high specific power by using a hydraulic accumulator. The energy saving potential of the system is obtained by recovering energy as well not using throttle valves. The hydraulic accumulator is used to store the recovery energy in the charging phase and to boost the pump in the discharging phase.
The rest of this paper is organized as follows. Section 2 presents the proposed system from the principle of working to control strategy. A model of the system using AMESim software is built in Section 3. Simulation results are presented in Section 4. Experimental setup and results are discussed in Section 5. Finally, some conclusions are given in Section 6.

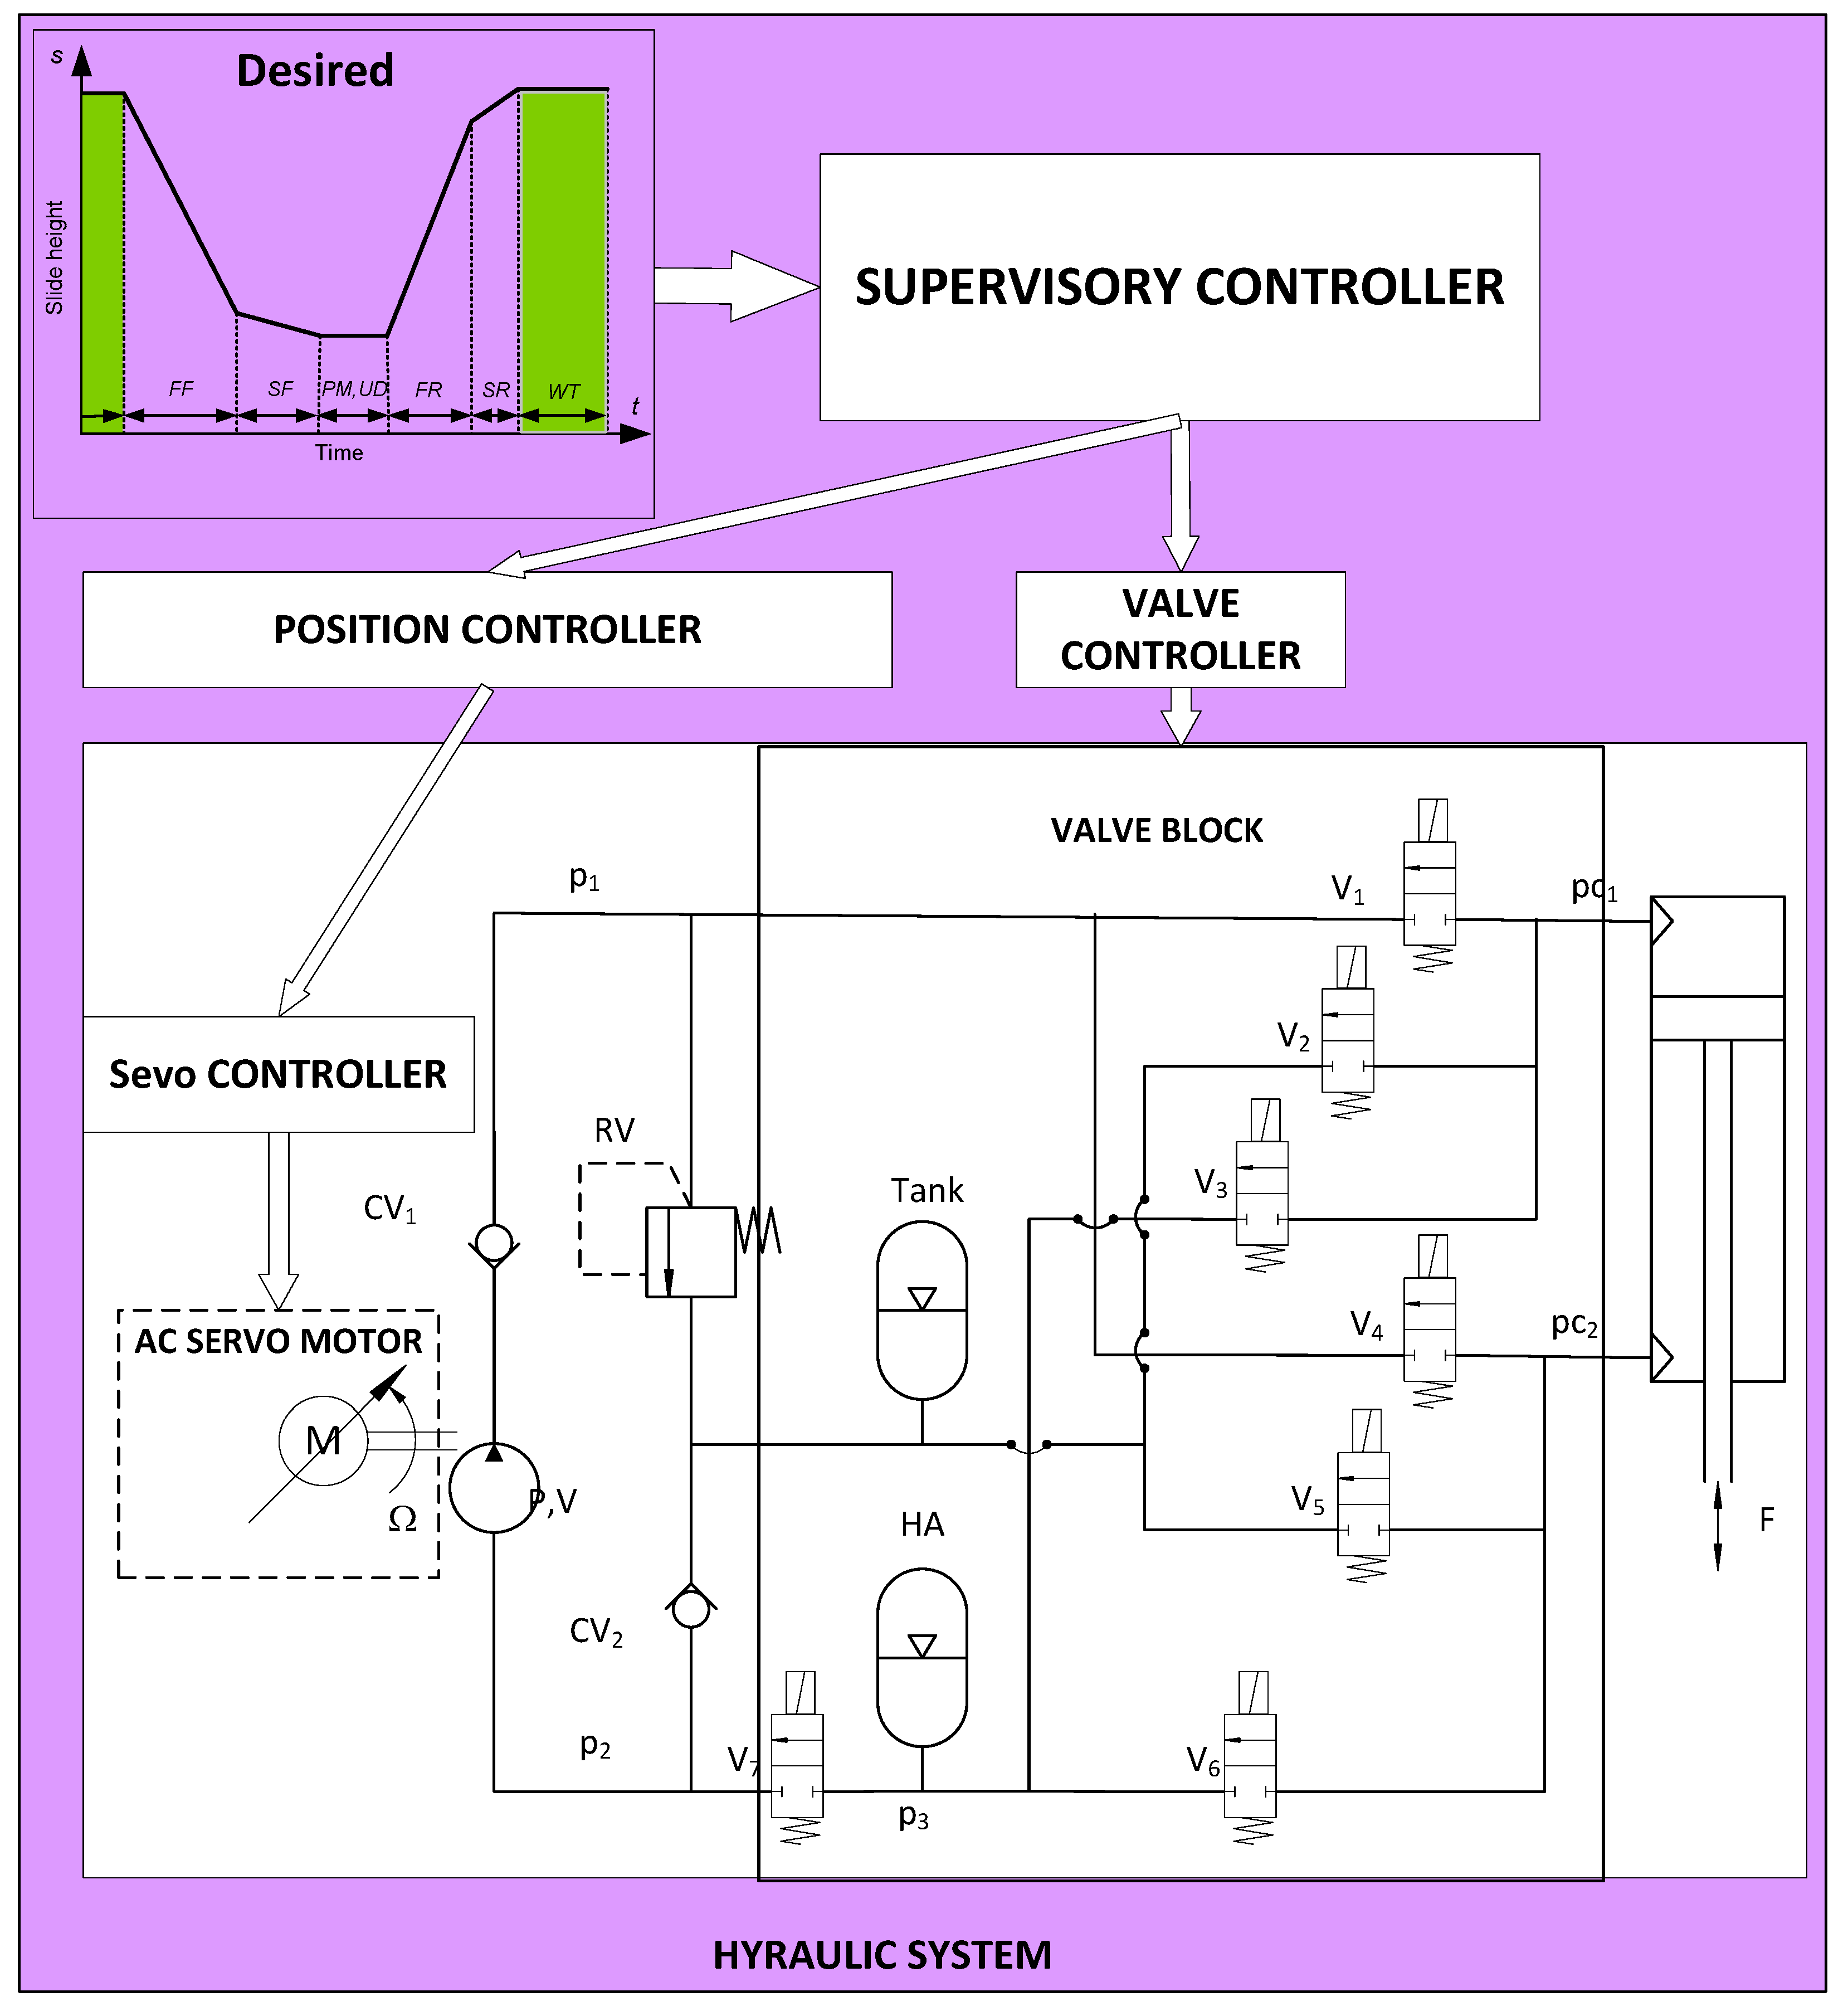
2. Proposed Energy Saving Hydraulic System

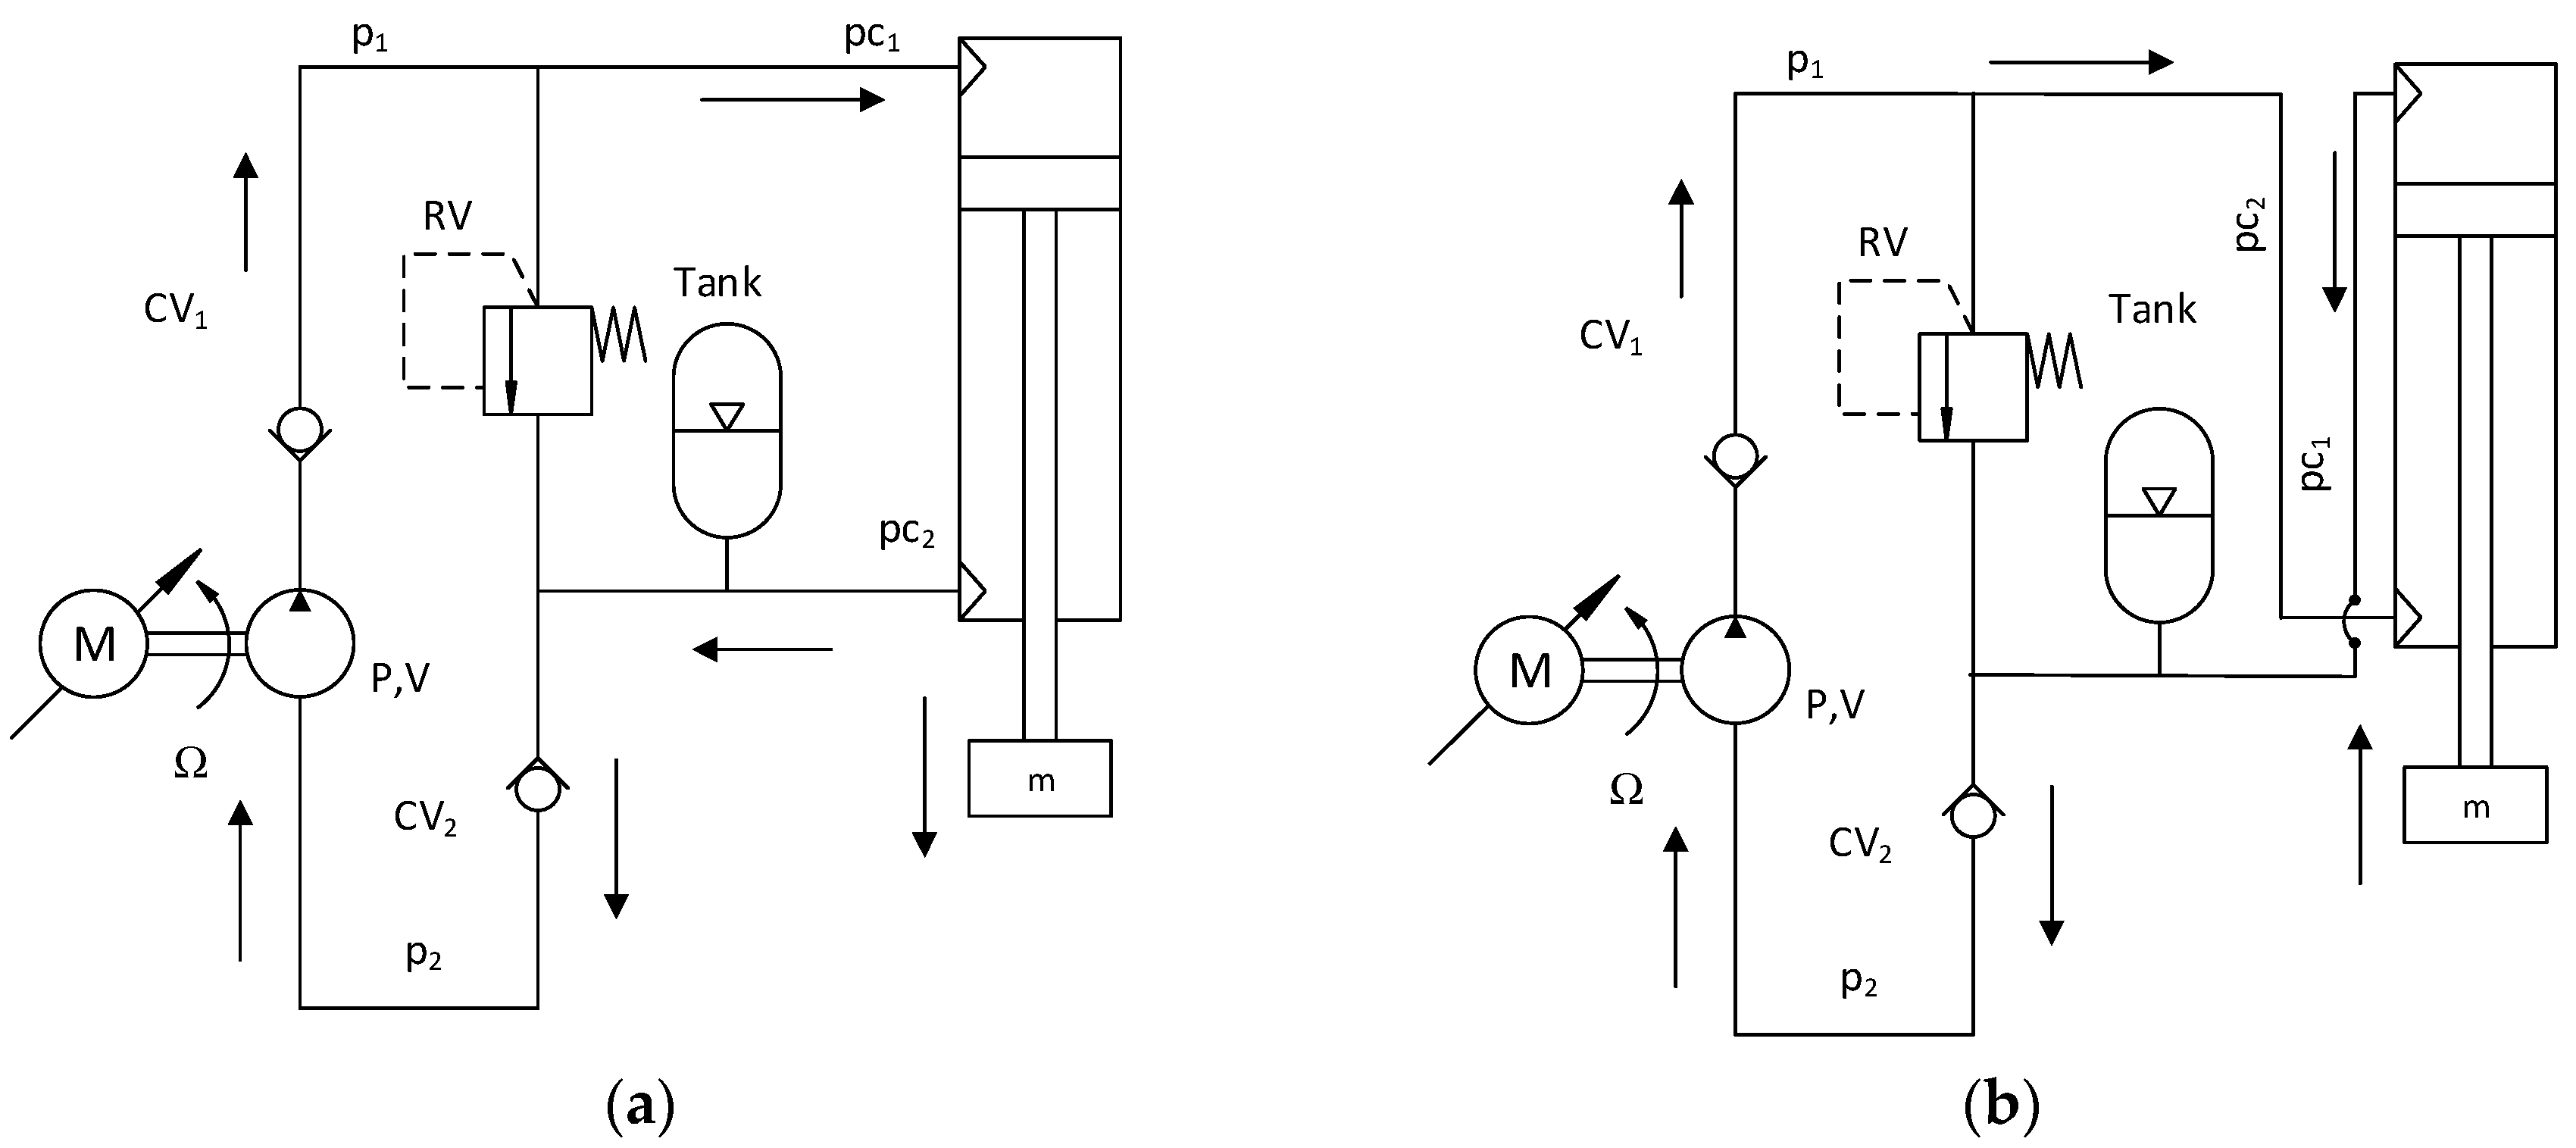
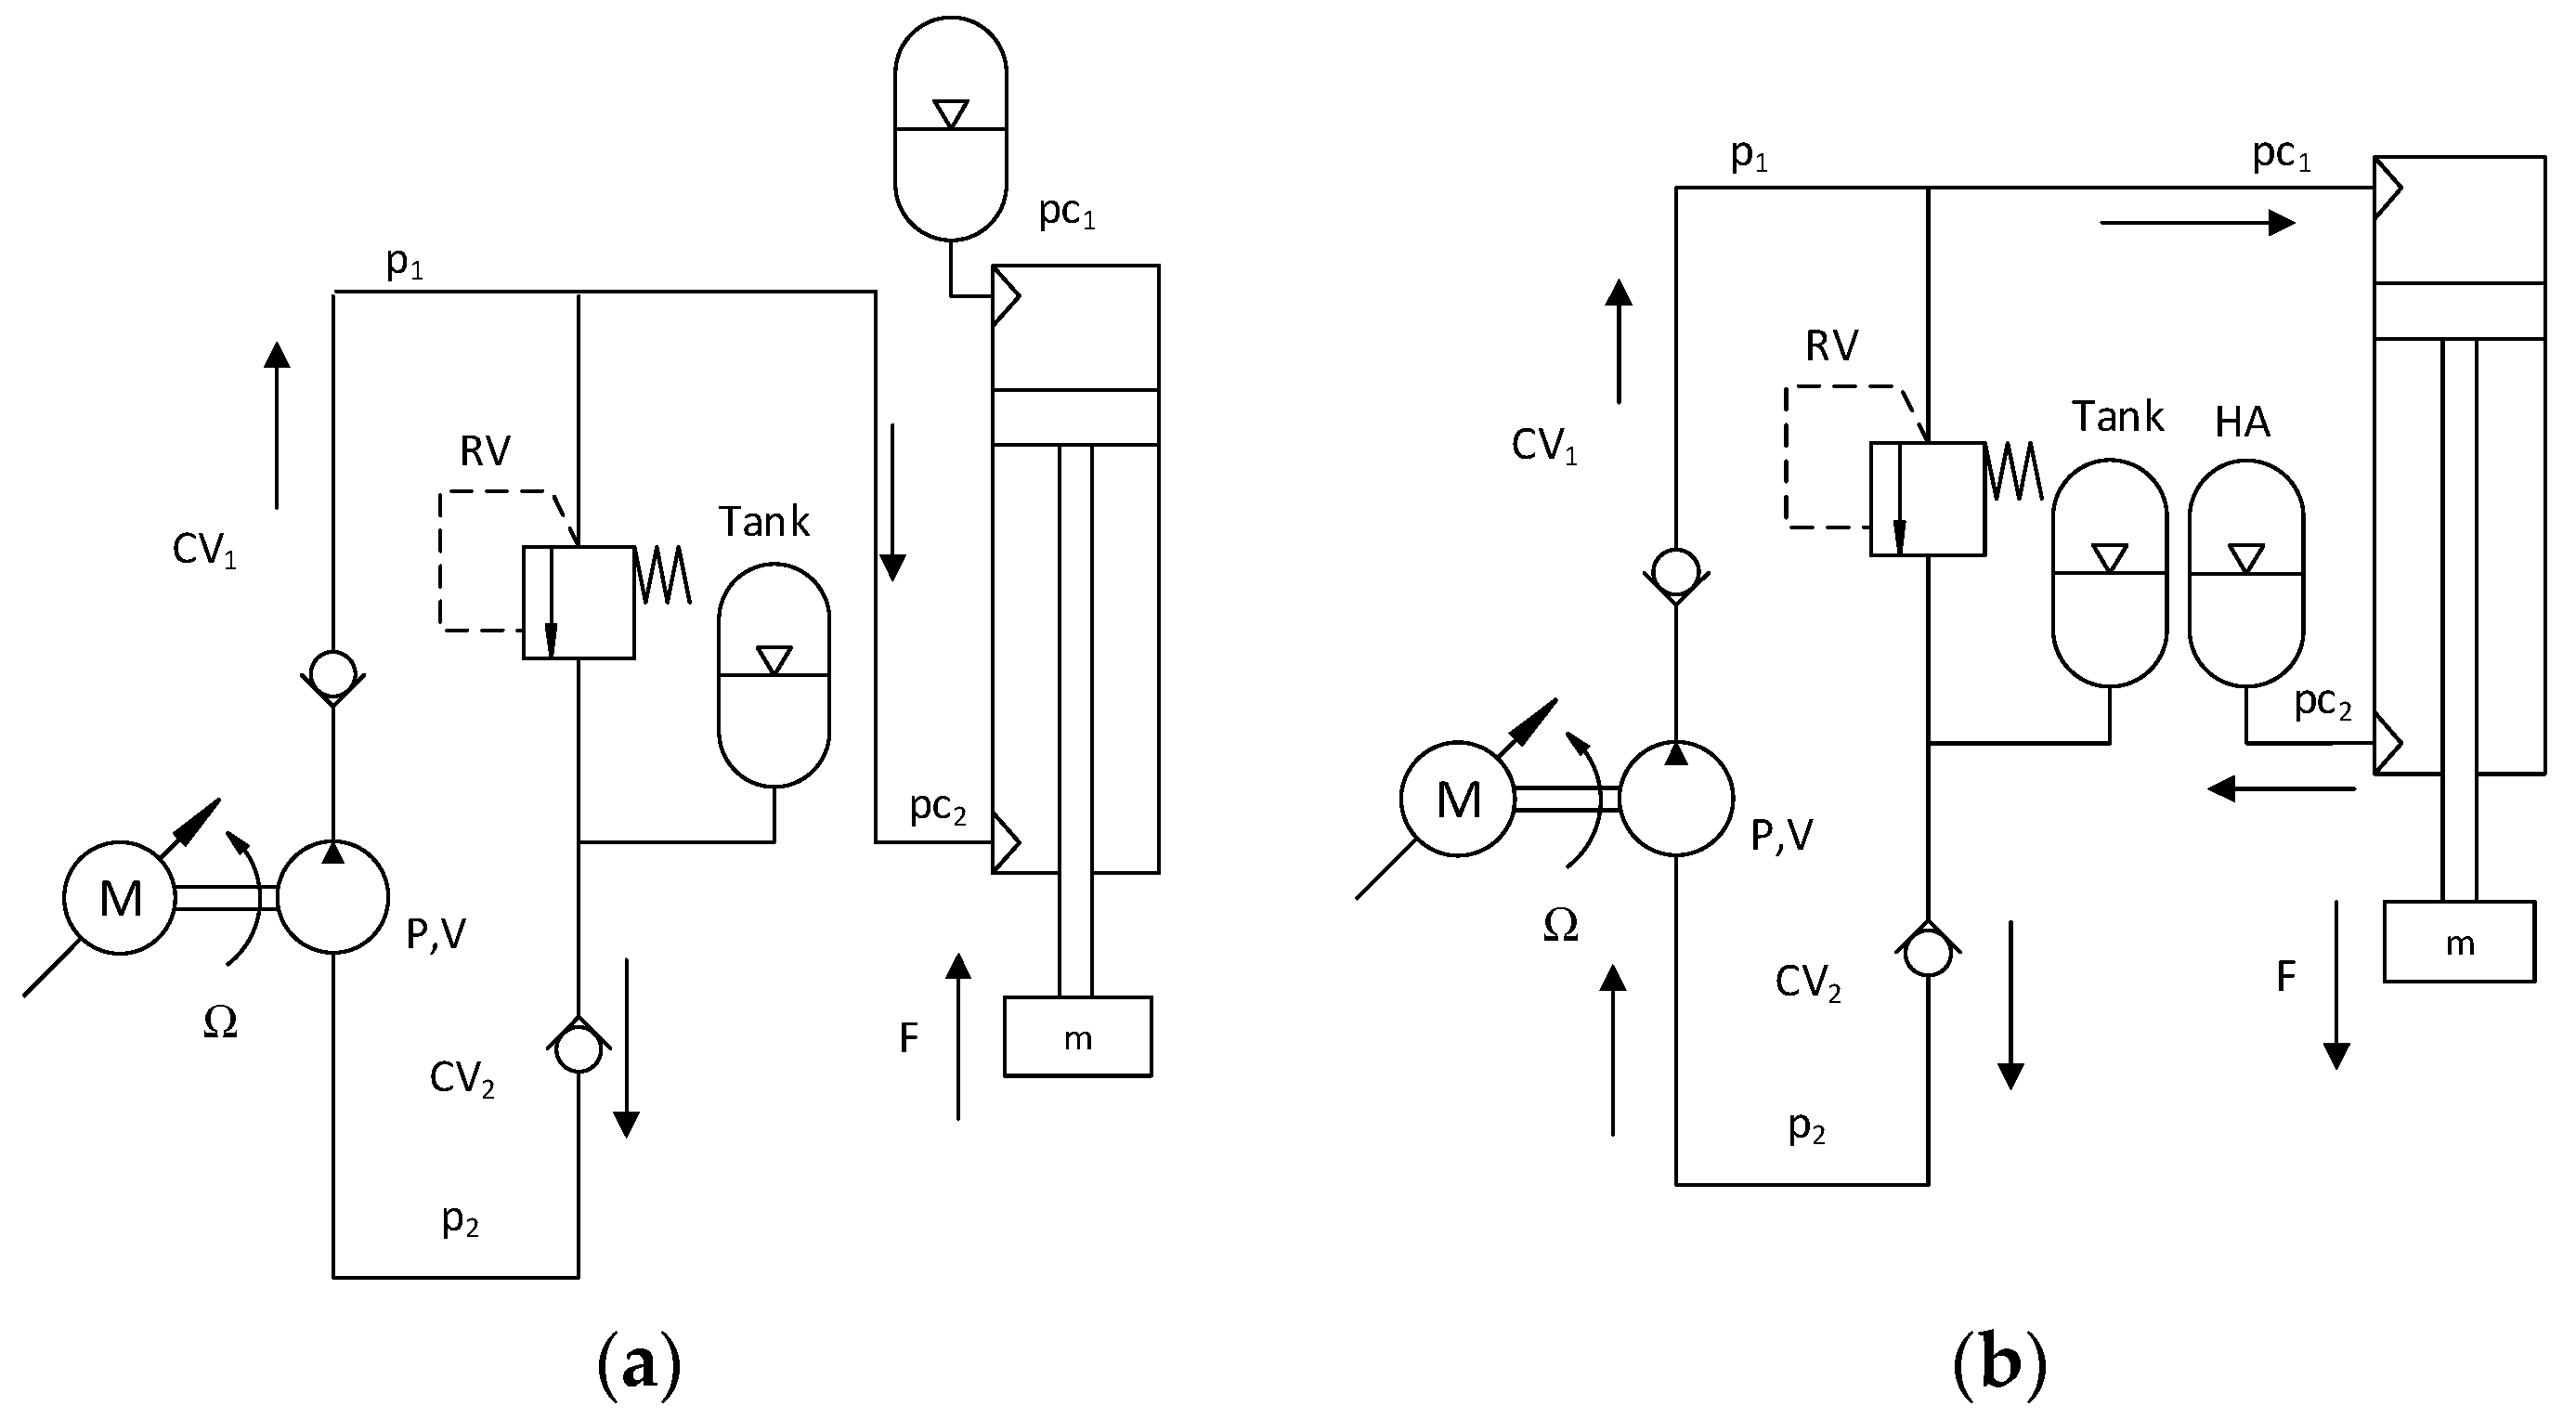
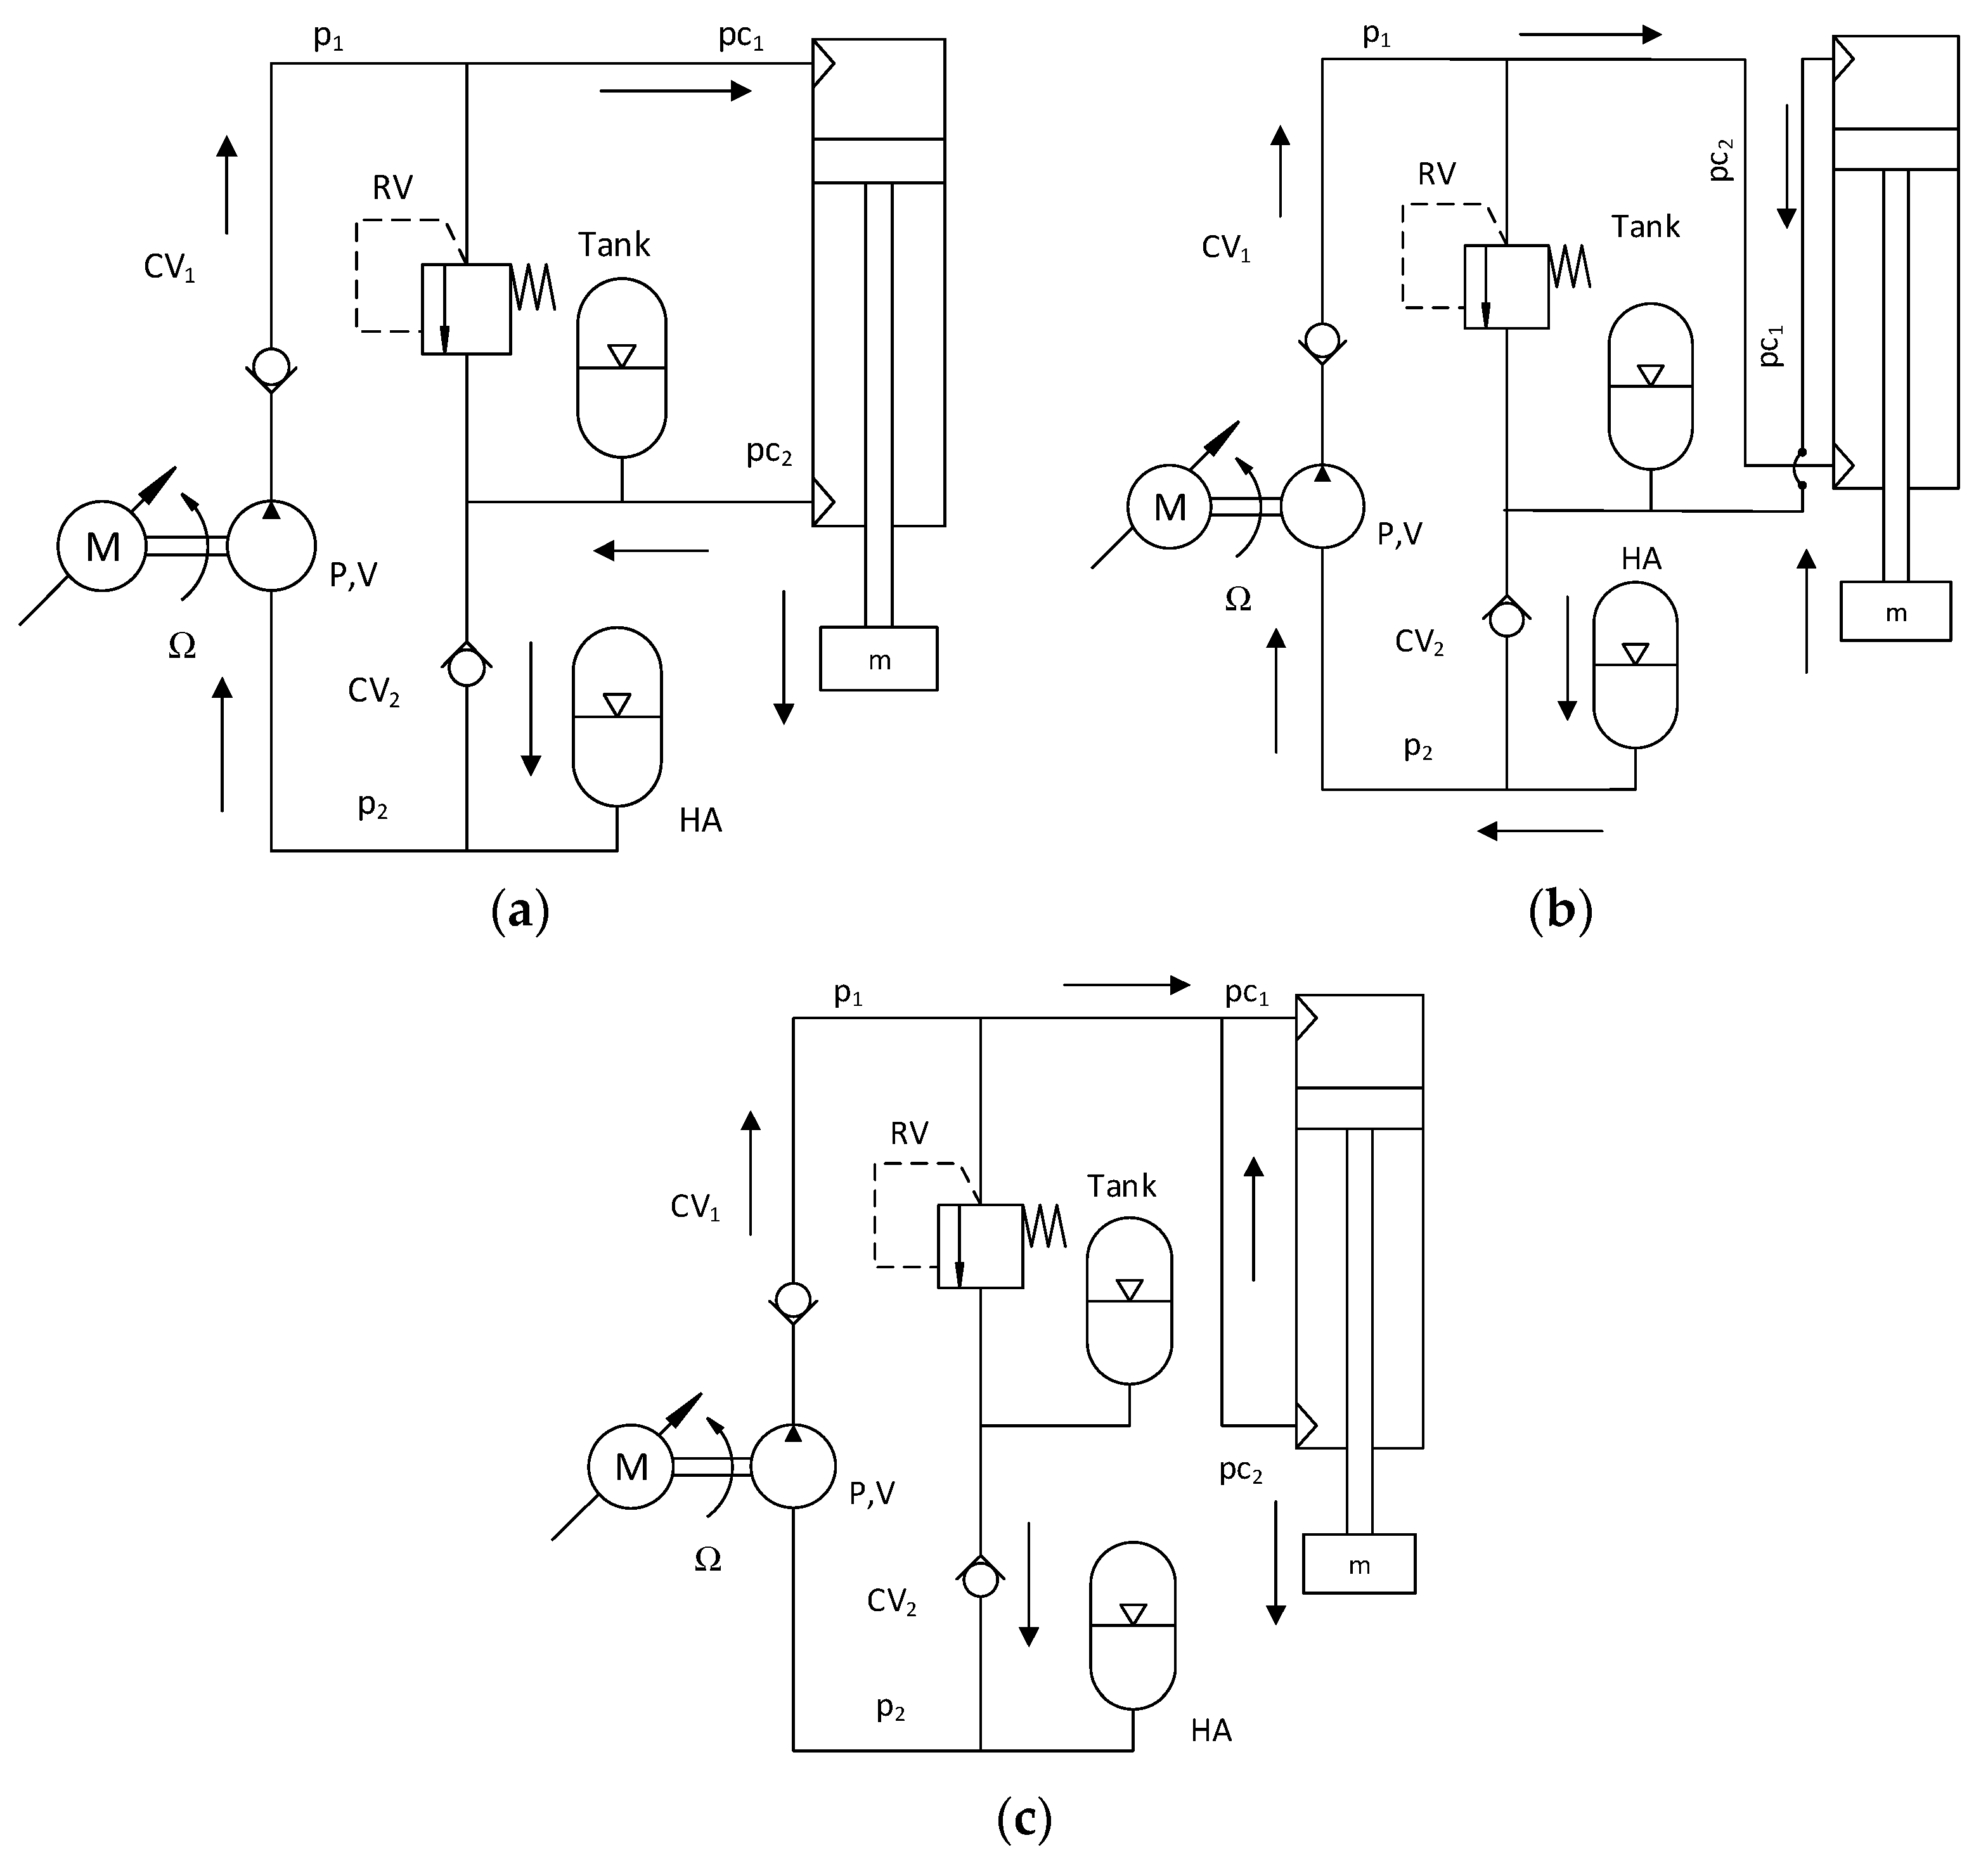
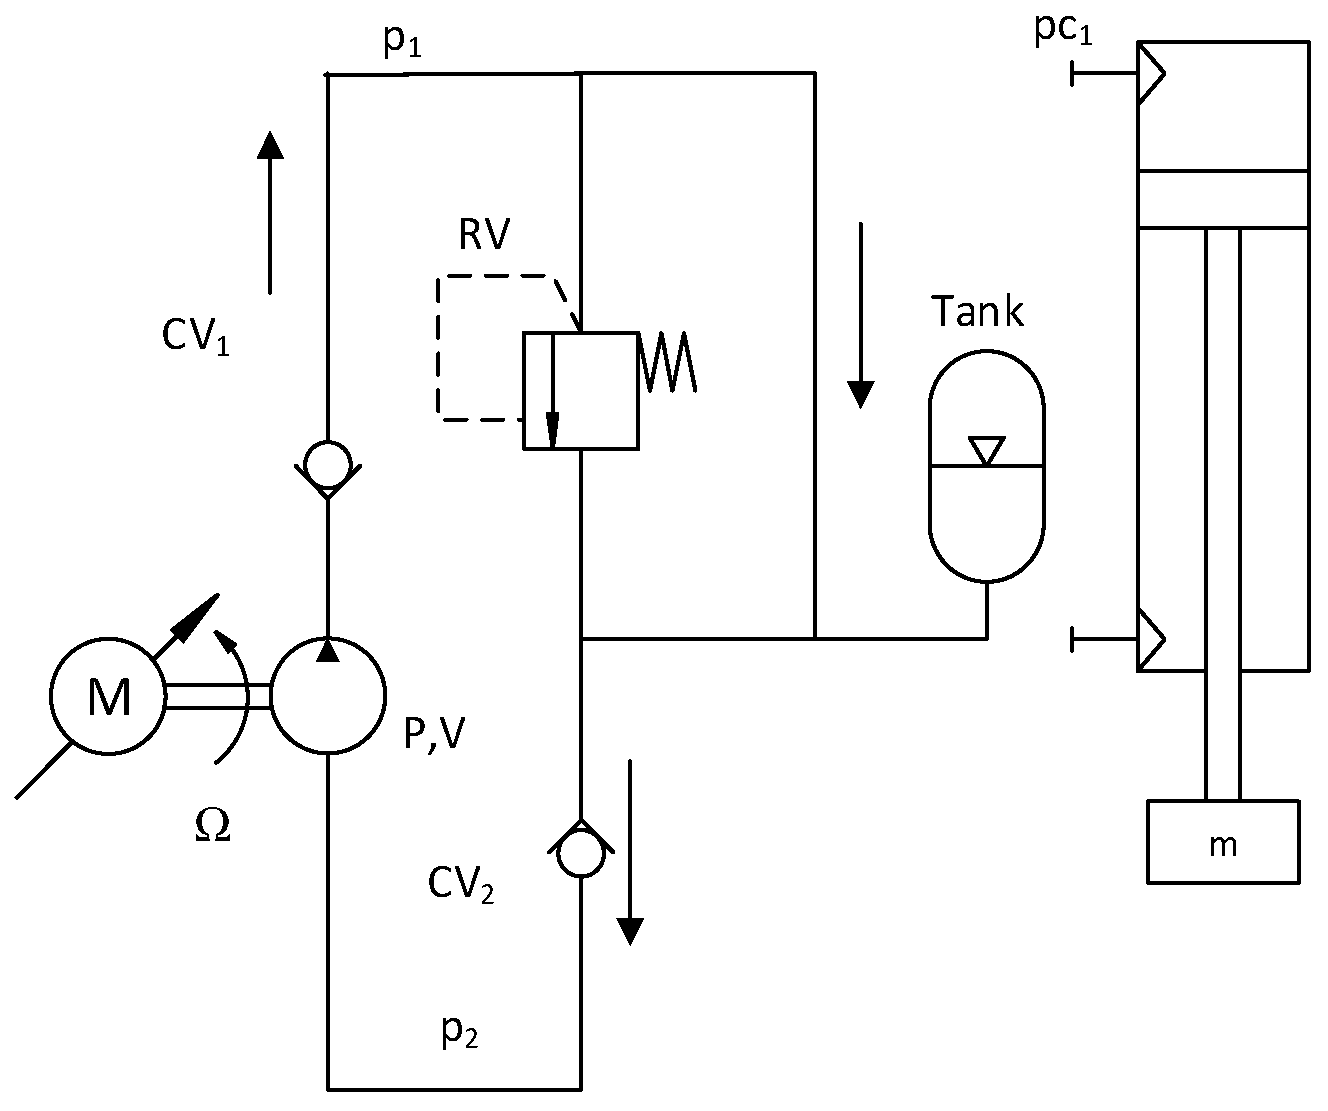
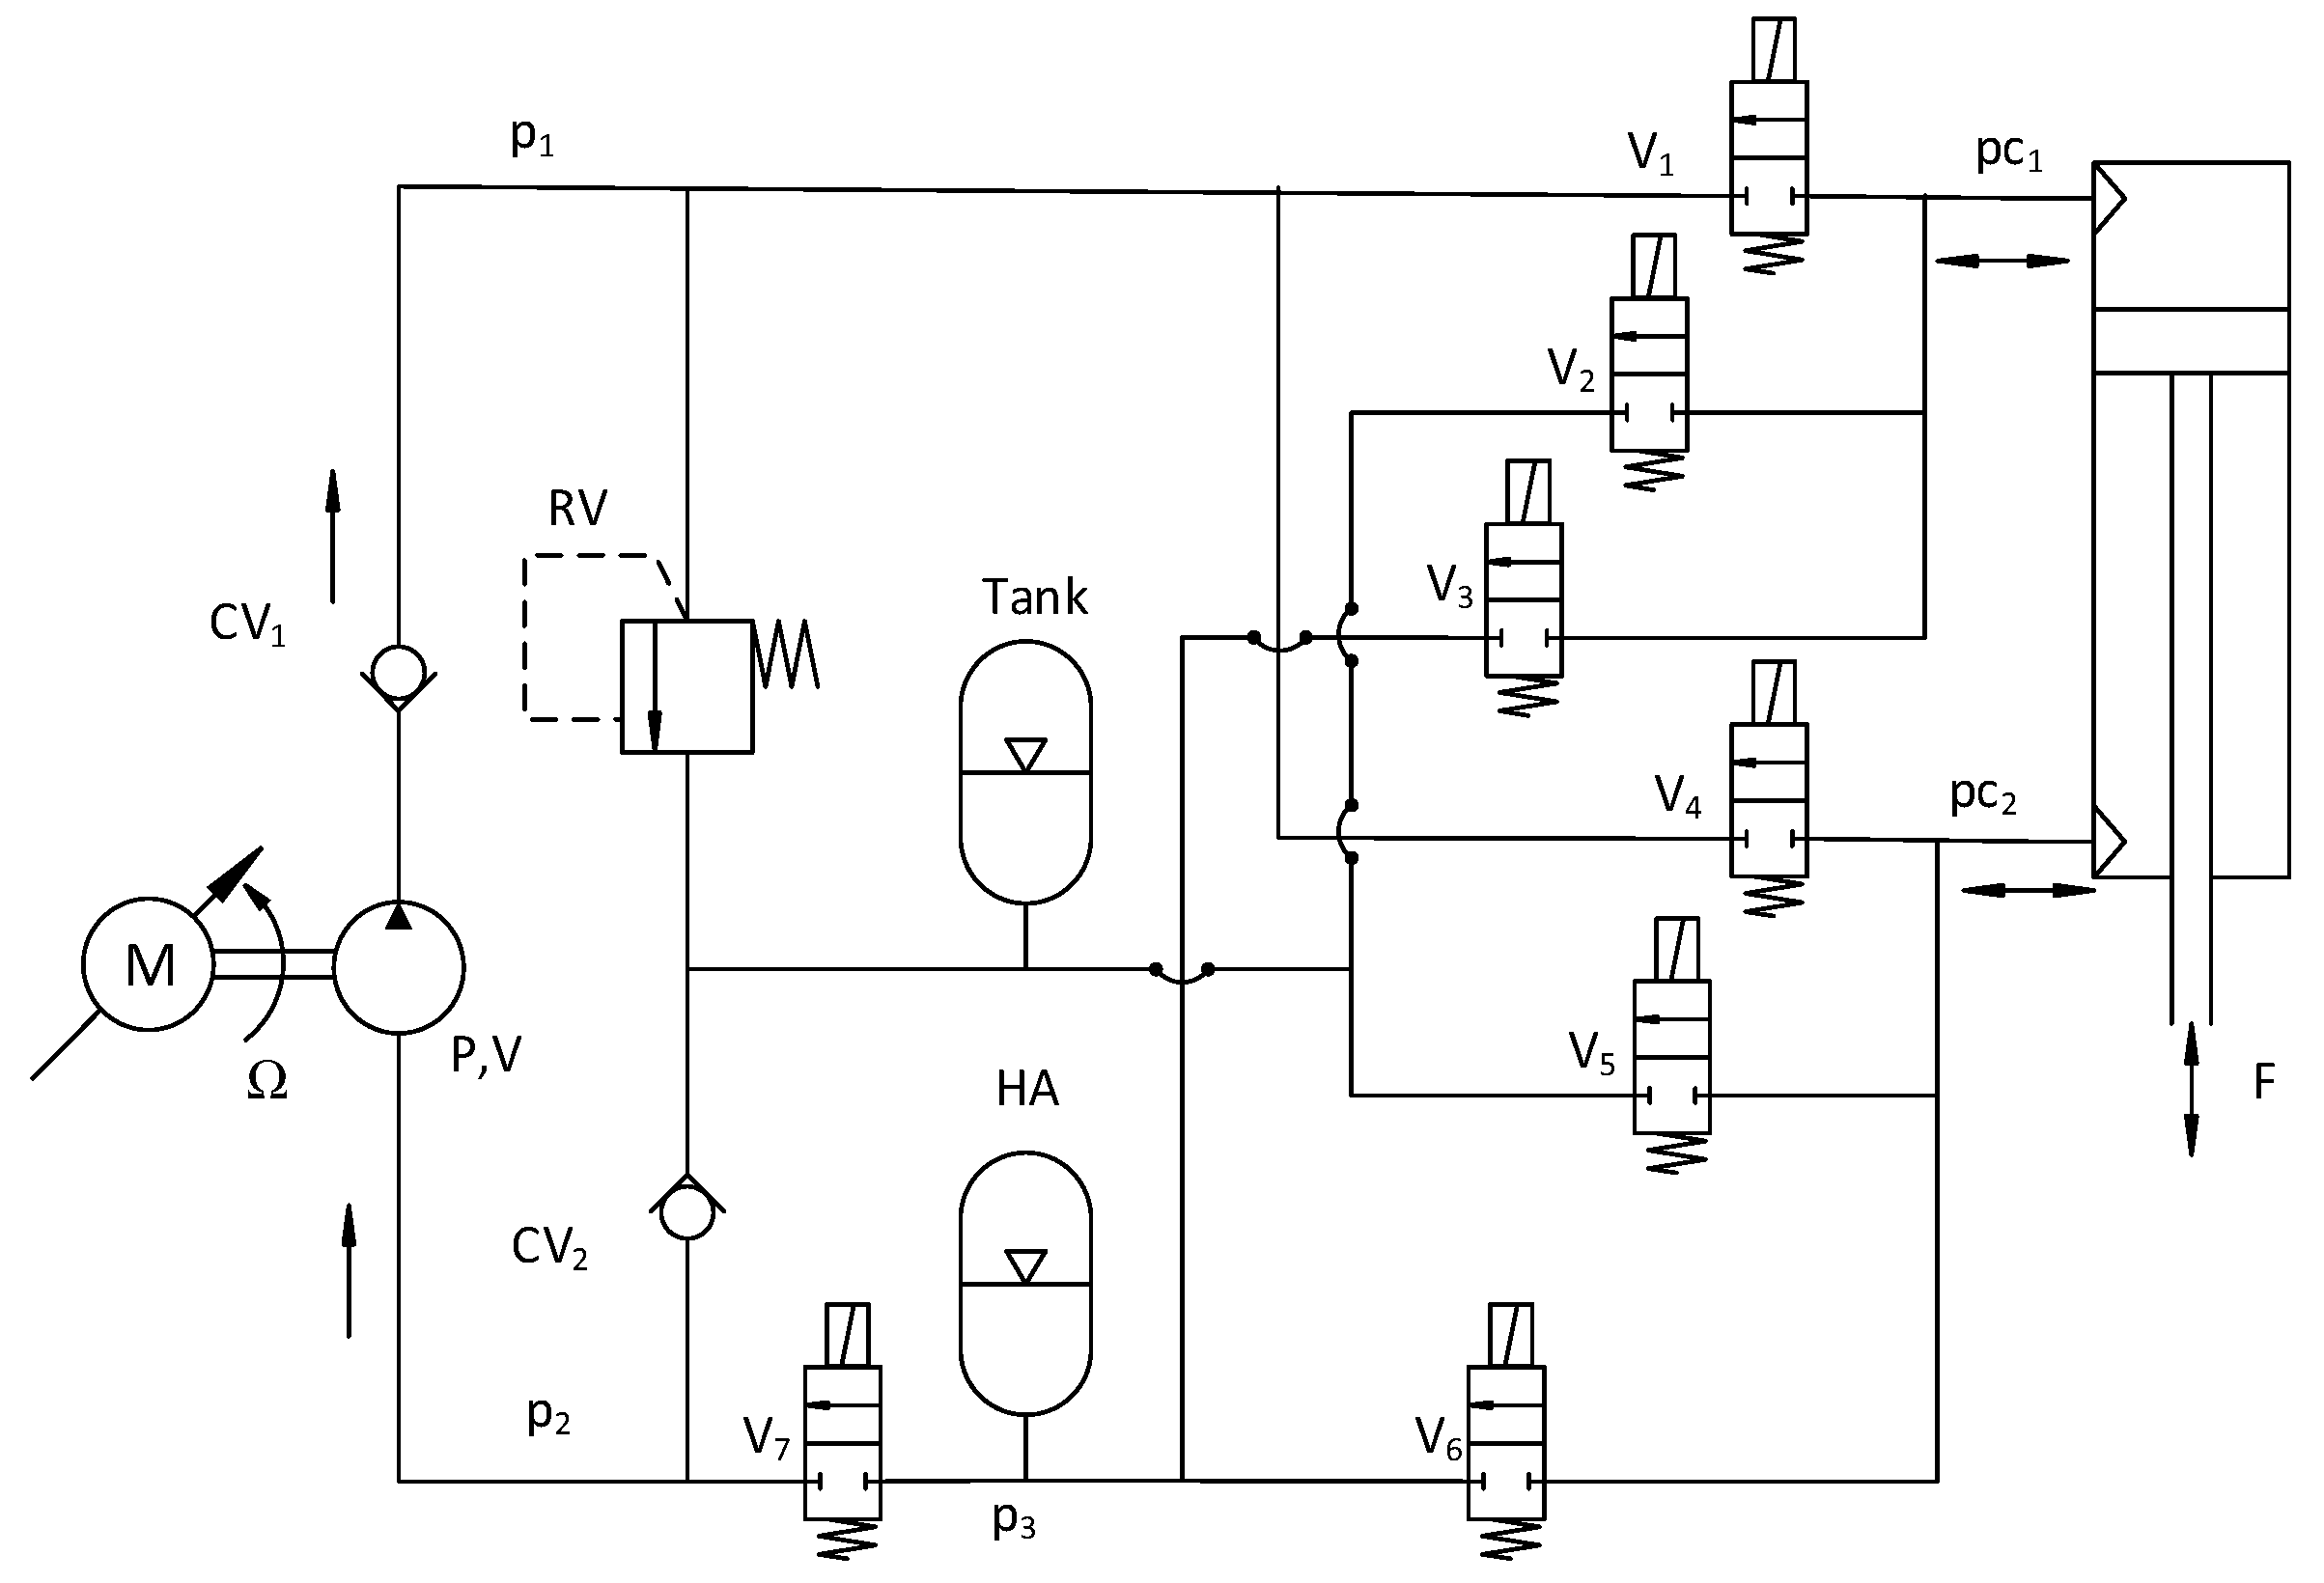
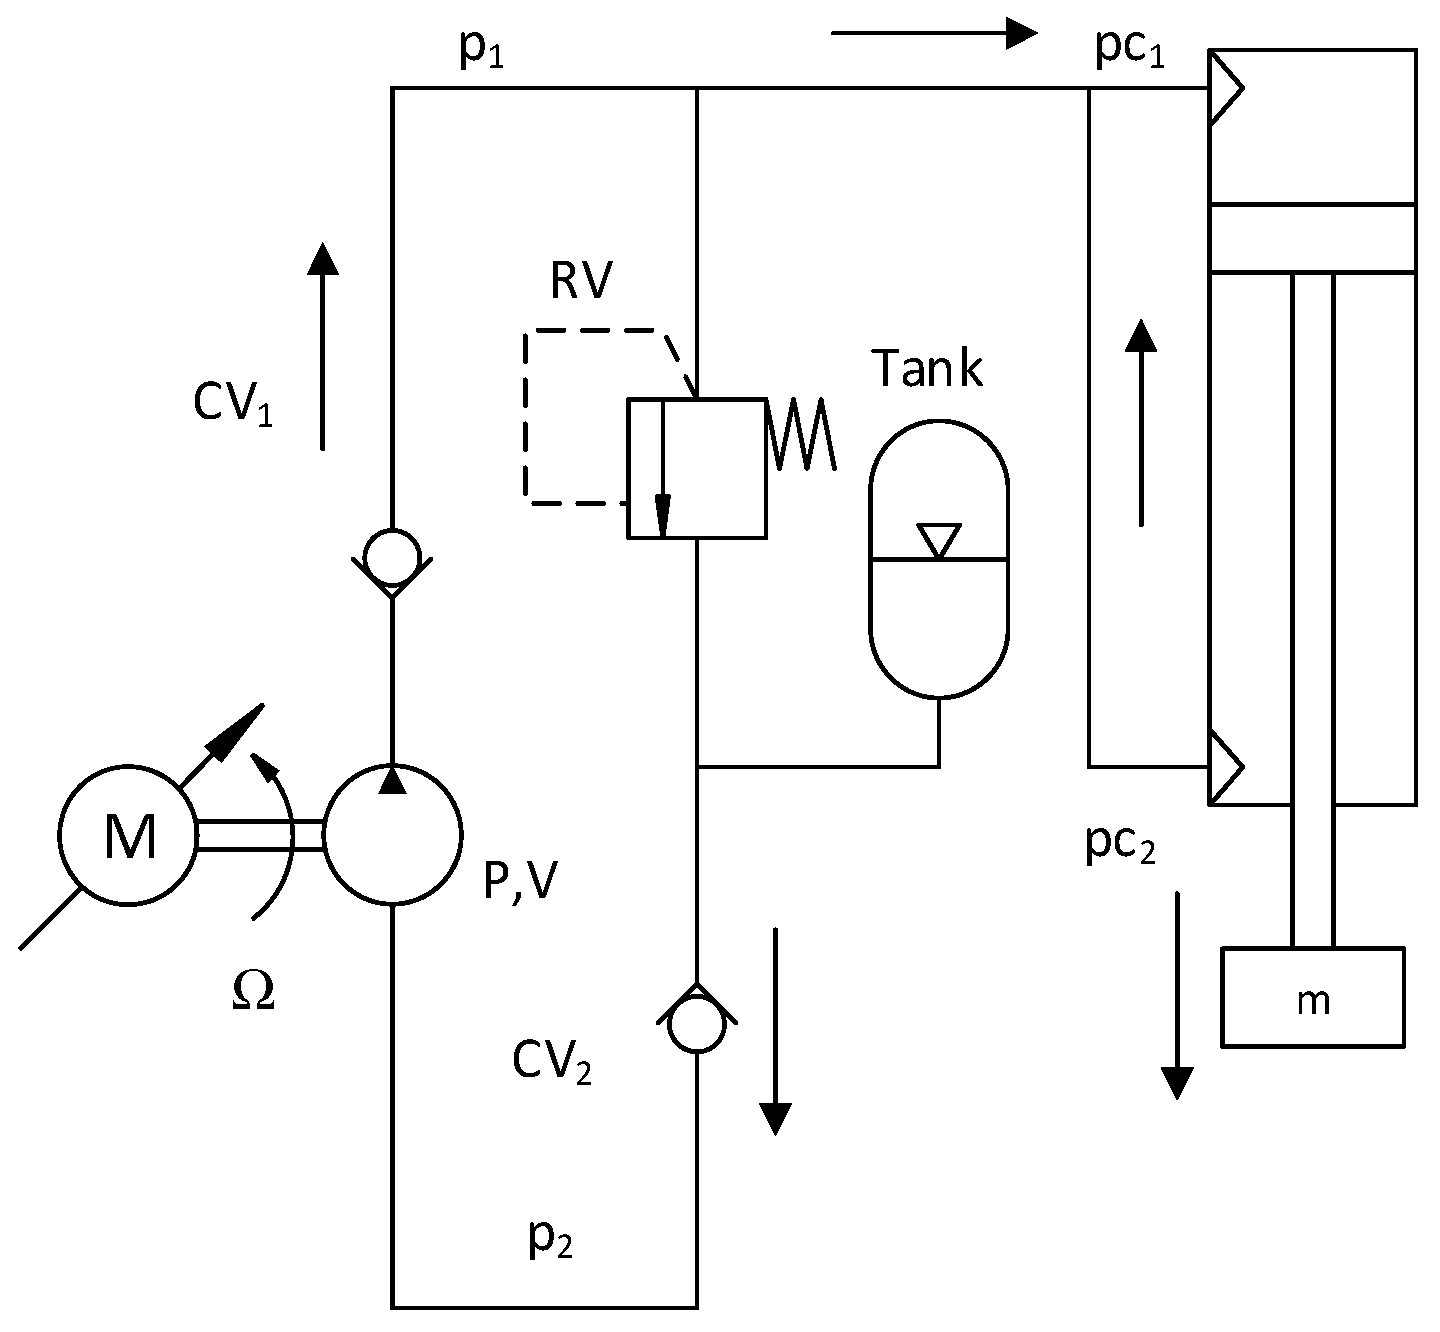
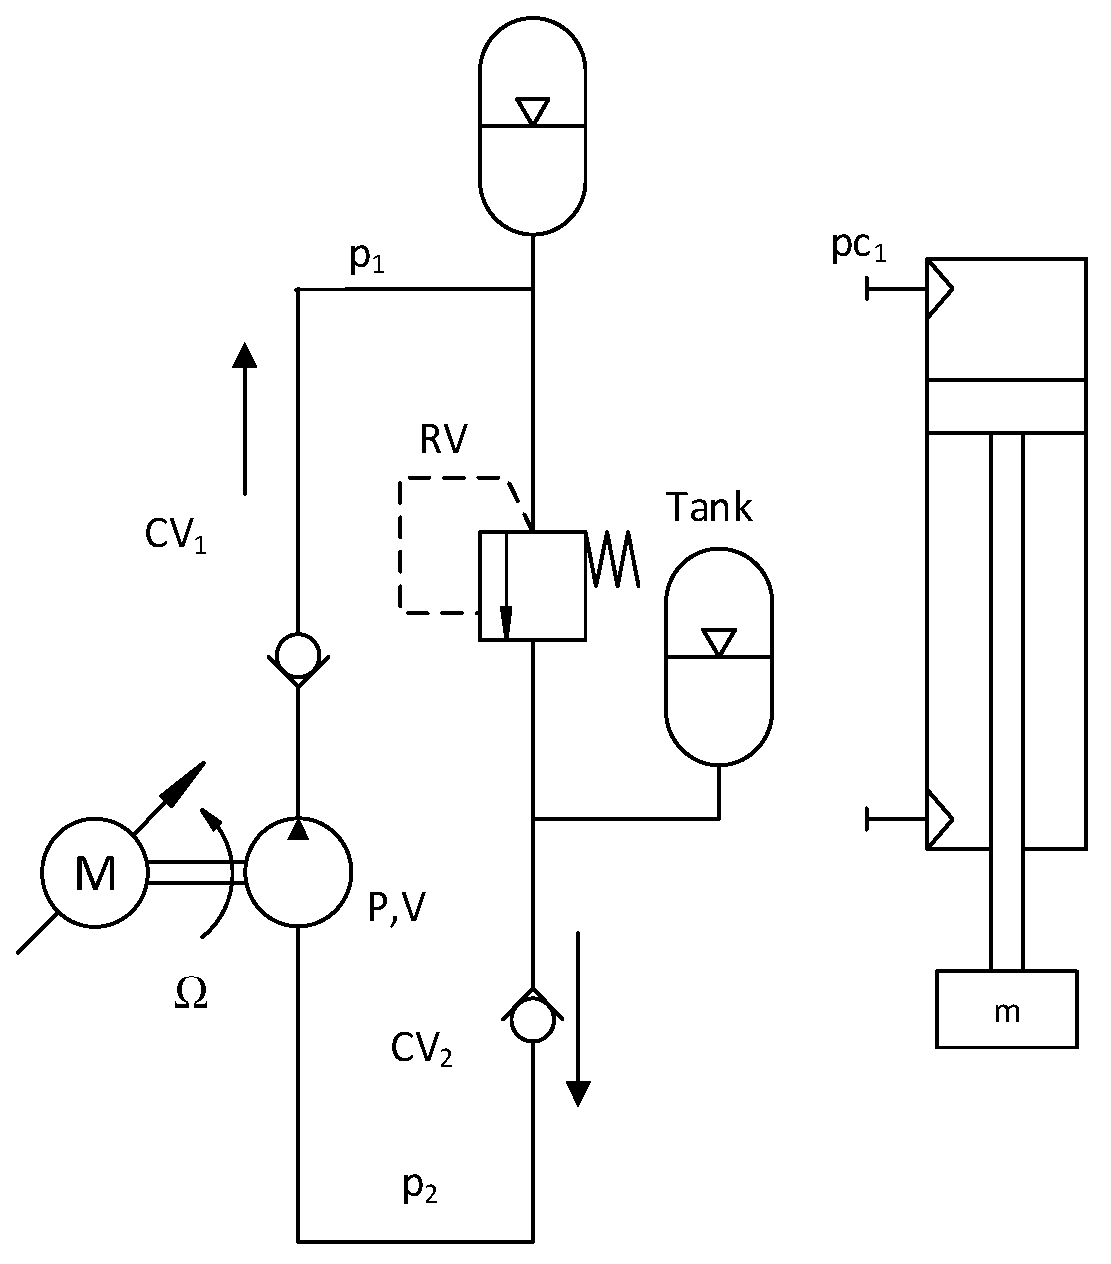
2.1. Hydraulic Circuit

The proposed system is presented in Figure 1. The system includes an AC servo motor (M), a fix displacement hydraulic pump (P), a hydraulic cylinder, seven directional controlled valves (V1,…,V7), a tank (Tank), a high pressure hydraulic accumulator (HA) and a relief valve RV. In the system, a low pressure accumulator is used as a tank to boost the pump via check valve CV2. Two check valves (CV1, CV2) pilot the flow direction to the pump. In this system, the speed of the hydraulic cylinder is controlled by adjusting the speed of the pump. The high pressure accumulator is used to store recovery energy and serves as a booster of the pump.
By switching the seven controlled valves, the system can utilize different working modes that are defined and described in Table 1.
The working modes of the system are described in following section. Using conditions in Table 1, the hydraulic circuit is redrawn according to each mode as follows. The normal-out and normal-in modes are described in Figure 2a,b, respectively. This is an open circuit EHA system and outputs of the cylinder are controlled by adjusting speed of the pump. This is an open circuit because the out port of the cylinder and suction port of the pump are connected directly to the tank. High force is an outstanding characteristic of the normal-out mode.
The regenerative mode is described in Figure 3. In this mode, the cylinder is only extended. The speed of the cylinder is faster, while the pressure p1 is higher to yield to the same force at the cylinder rod when compared with that of the normal-out mode.
The recovery-in and the recovery-out modes are described in Figure 4a,b, respectively. The system is in recovery-in mode when an external force pushes the cylinder to retract. In this mode, the energy of the external force is recovered and stored in the accumulator in form of hydraulic energy. On the other hand, when an external force pulls the cylinder to extend the system it works in recovery-out mode. As a result, the energy of the external forces can be recovered in both directions of the cylinder. The pressure in the accumulator increases during the recovery modes.
Reused normal-out, reused normal-in and reused regenerative-out modes are shown in Figure 5. In these reused modes, the accumulator is directly connected to suction port of the pump. Pressure of fluid in the accumulator varies from phigh to plow in respect to beginning and ending period of these modes. The pressure of fluid in the accumulator reduces different pressure between the two ports of the pump. As a result, torque at the pump shaft is reduced in these reused modes when compared with the previous modes.
The reused regenerative mode (RURG) is shown in Figure 5c. In a regenerative mode, flow in hydraulic circuit is regeneratively connected so that the cylinder has a high velocity but low force when compared with that values for a normal-out mode. However, the accumulator works as a booster of the pump in reused regenerative mode so the working pressure p1 is able to increase. As a result, the system achieves not only high velocity but also high force of the cylinder for reused regenerative mode.
It can be observed that the roles of the accumulator in the system are storing recovery energy in the two recovery modes and boosting the pump in the three reused working modes. This implies that the accumulator partially aids power along with the electric motor to drive the pump.
As mentioned above, the reused regenerative mode has advantages about force and velocity. If recovery energy stored in the accumulator is not enough to use next phase, the accumulator should be charged in advance a given level by the pump. In applications where recovery energy is not available the accumulator can be pre-charged to boost the pump if required power of the cylinder is higher than the motor power. Charging accumulator mode is described in Figure 6. In this mode, fluid from the tank is pumped to the accumulator until it reaches a given pressure value then the pump is shut off.
The unloading mode is described in Figure 7, in which fluid is circle pumped without any load or the pump is unloading. The cylinder is blocked in any position within its stroke in both the charging and unloading modes.
Defining velocity and force dimensionless factors KV, KF as expressed in Equations (1) and (2)
K V = v ω · r 0
K F = F T / r 0
In which, v [m/s] and F [N] are velocity and force of the hydraulic cylinder, respectively. Ω [rad/s] and T [Nm] are speed and torque of the pump, respectively. Defining of r0 [m] as a radius of the virtual hydraulic pump shaft so that tangential speed and force of the pump shaft at the radius are ω · r 0 and T / r 0 , respectively. Therefore, the velocity and force factors express static amplification of outputs of the cylinder over inputs of the pump. These factors and characteristics of the system in different working modes are expressed in Table 2.
In the table, VD [m3/rad] is displacement of the pump, D [m] and d [m] are the bore and the rod diameters of the cylinder, respectively, and p1 and p2 are values of relative pressure at delivery and suction ports of the pump, respectively.
From Table 2, the normal and regenerative-out modes have velocity factor KV1 and KV3, respectively. It is observed that, the value of KV3 is higher than KV1, so the velocity of the cylinder in the regenerative-out mode is higher than that of the normal-out mode with the same speed of the pump. With the same value of torque at the pump shaft, the cylinder of the system in the normal-out mode can yield a larger force than that of generative-out mode because the value of KF1 is bigger than that of KF3.
The proposed system is able work in different modes with different velocity or force factors. Among them, the highest values of KV and KF are KV3 and KF6, respectively. While, other systems such as EHA has two modes that are normal-out and normal-in modes. As a result, the proposed system reveals some advantages when compared with an EHA system as follows. The system is able to recover energy from the external force in both directions when its works in recovery modes. The size of the hydraulic pump and the electric motor is down which reduces cost of the system when it works in reuse modes. For example, the proposed system works in regenerative mode will has velocity factor KV3 while the EHA has velocity factor KV1. It is known that KV3 is higher than KV1, so the required speed of the pump in the proposed system is lower than that of the EHA. If the speed of the pump is the same, the required displacement of the pump in the proposed system is smaller than that of the EHA.

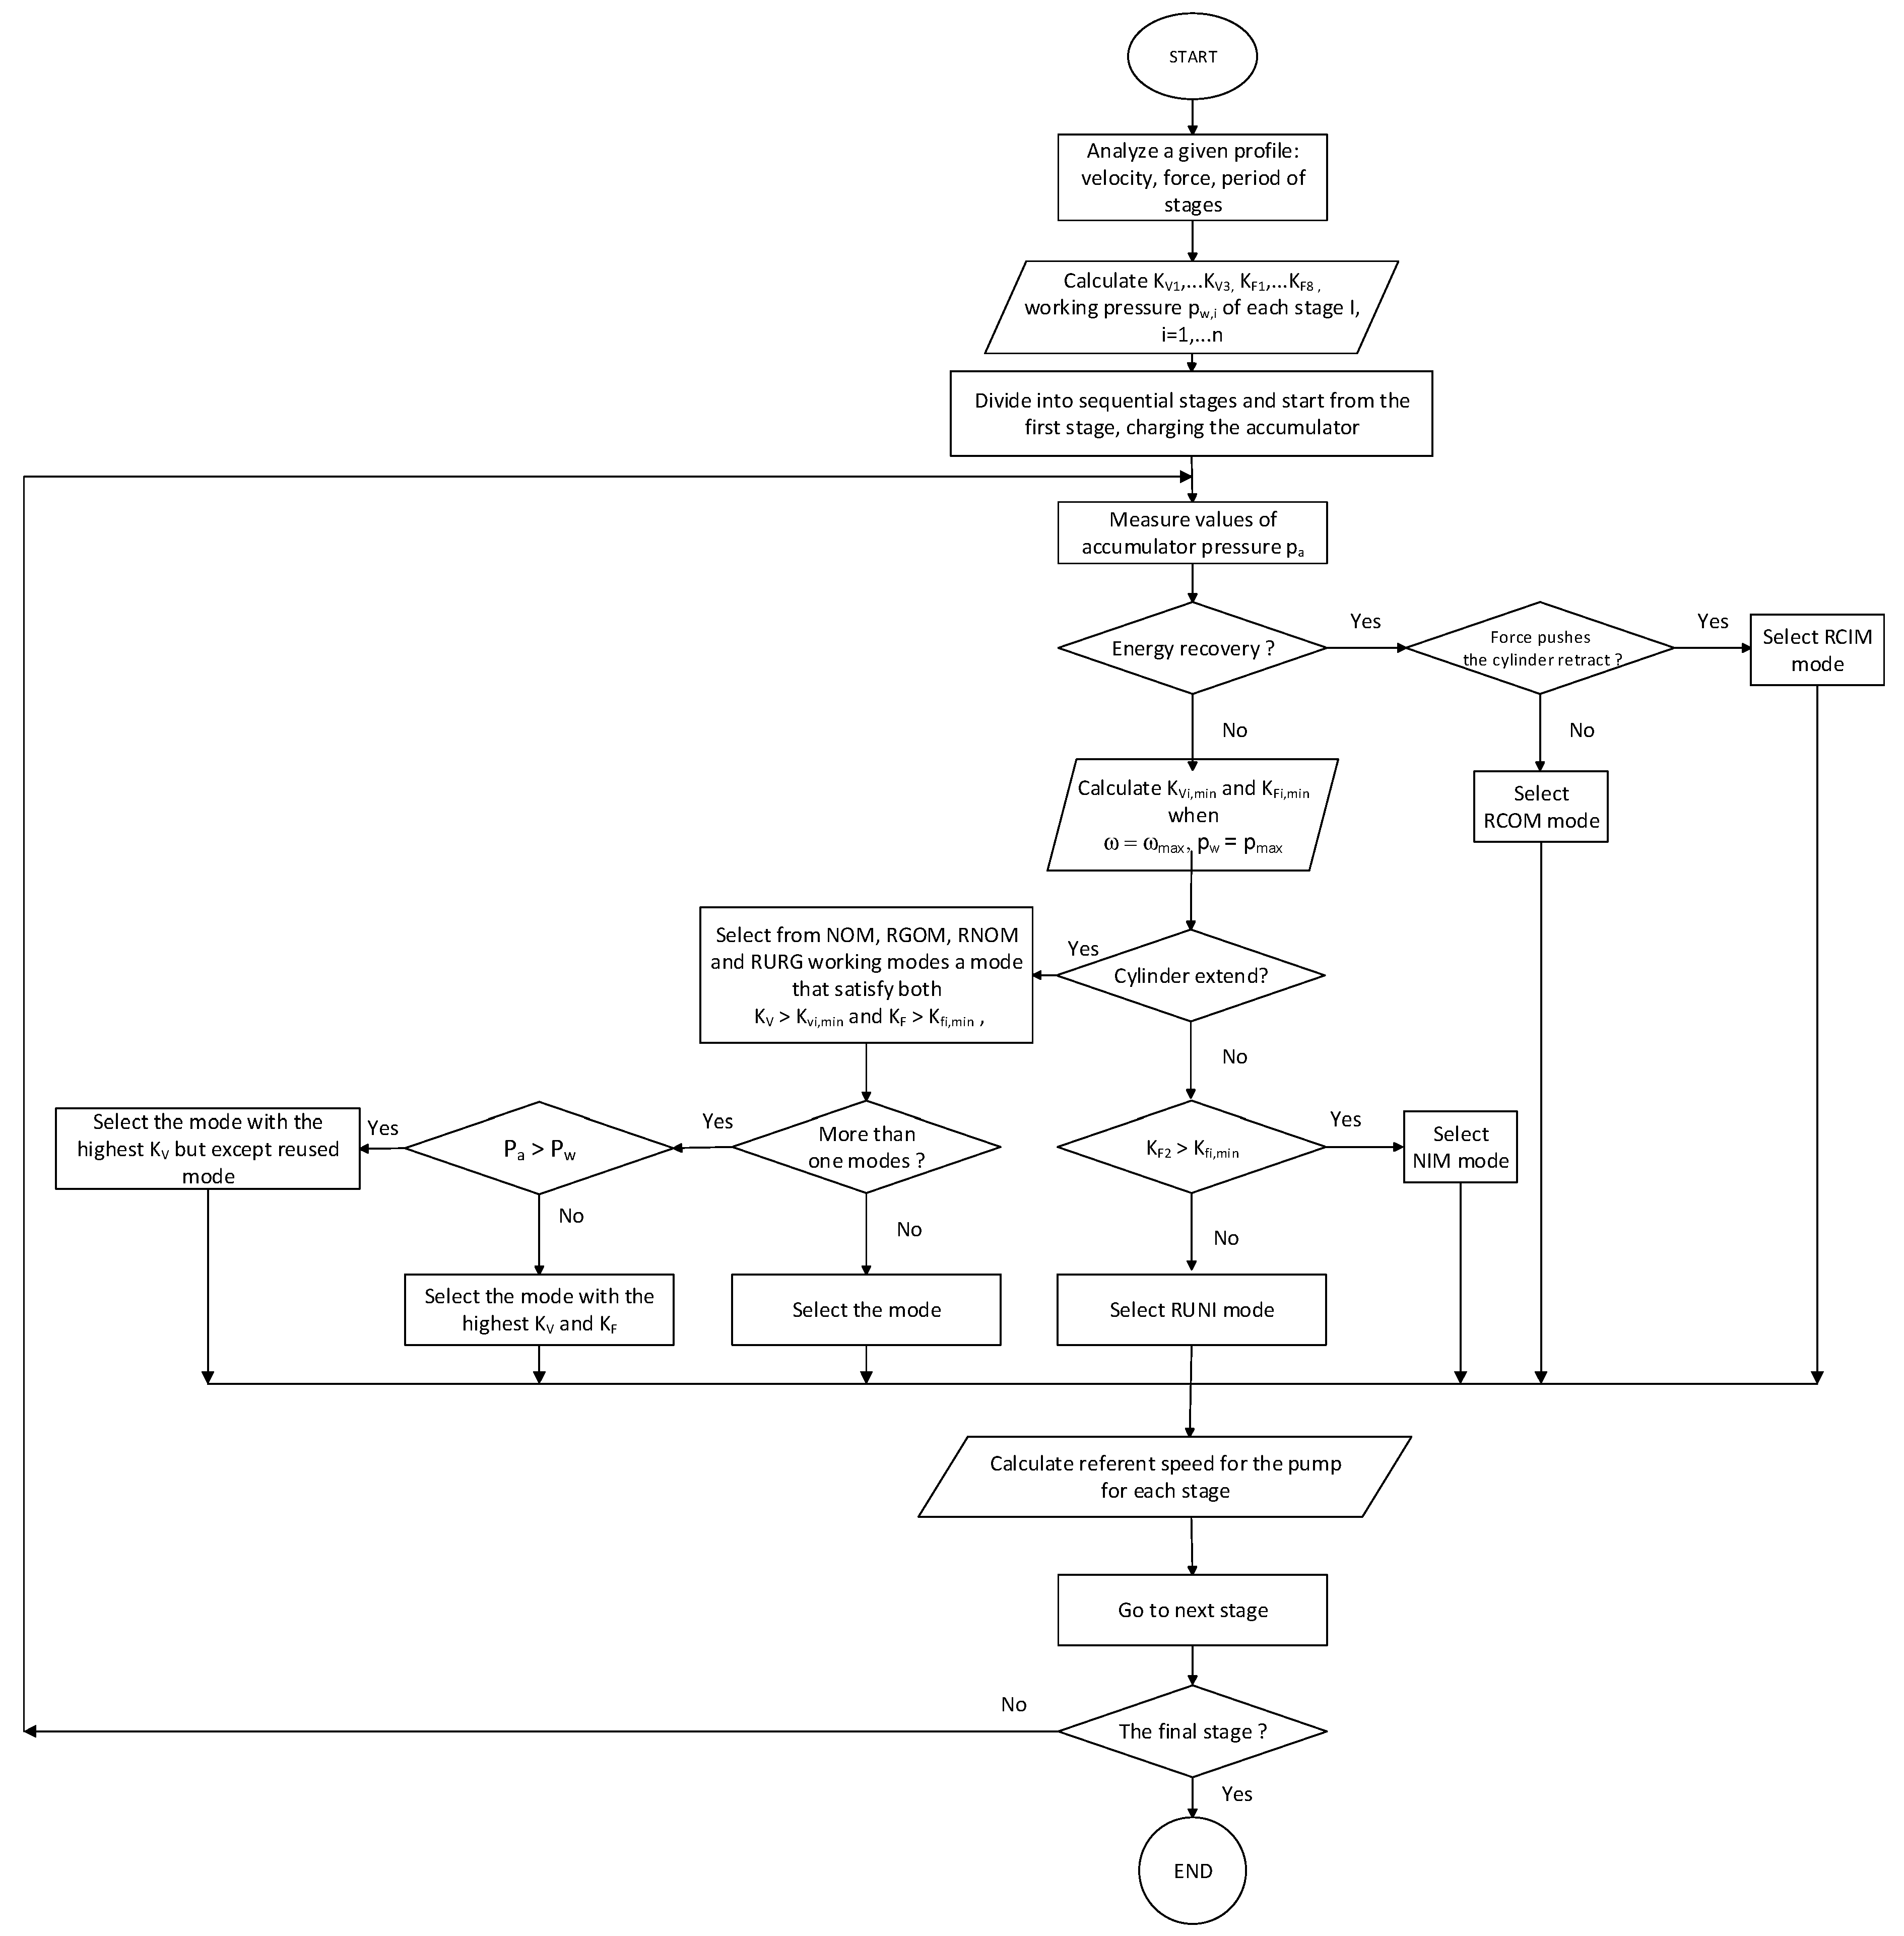
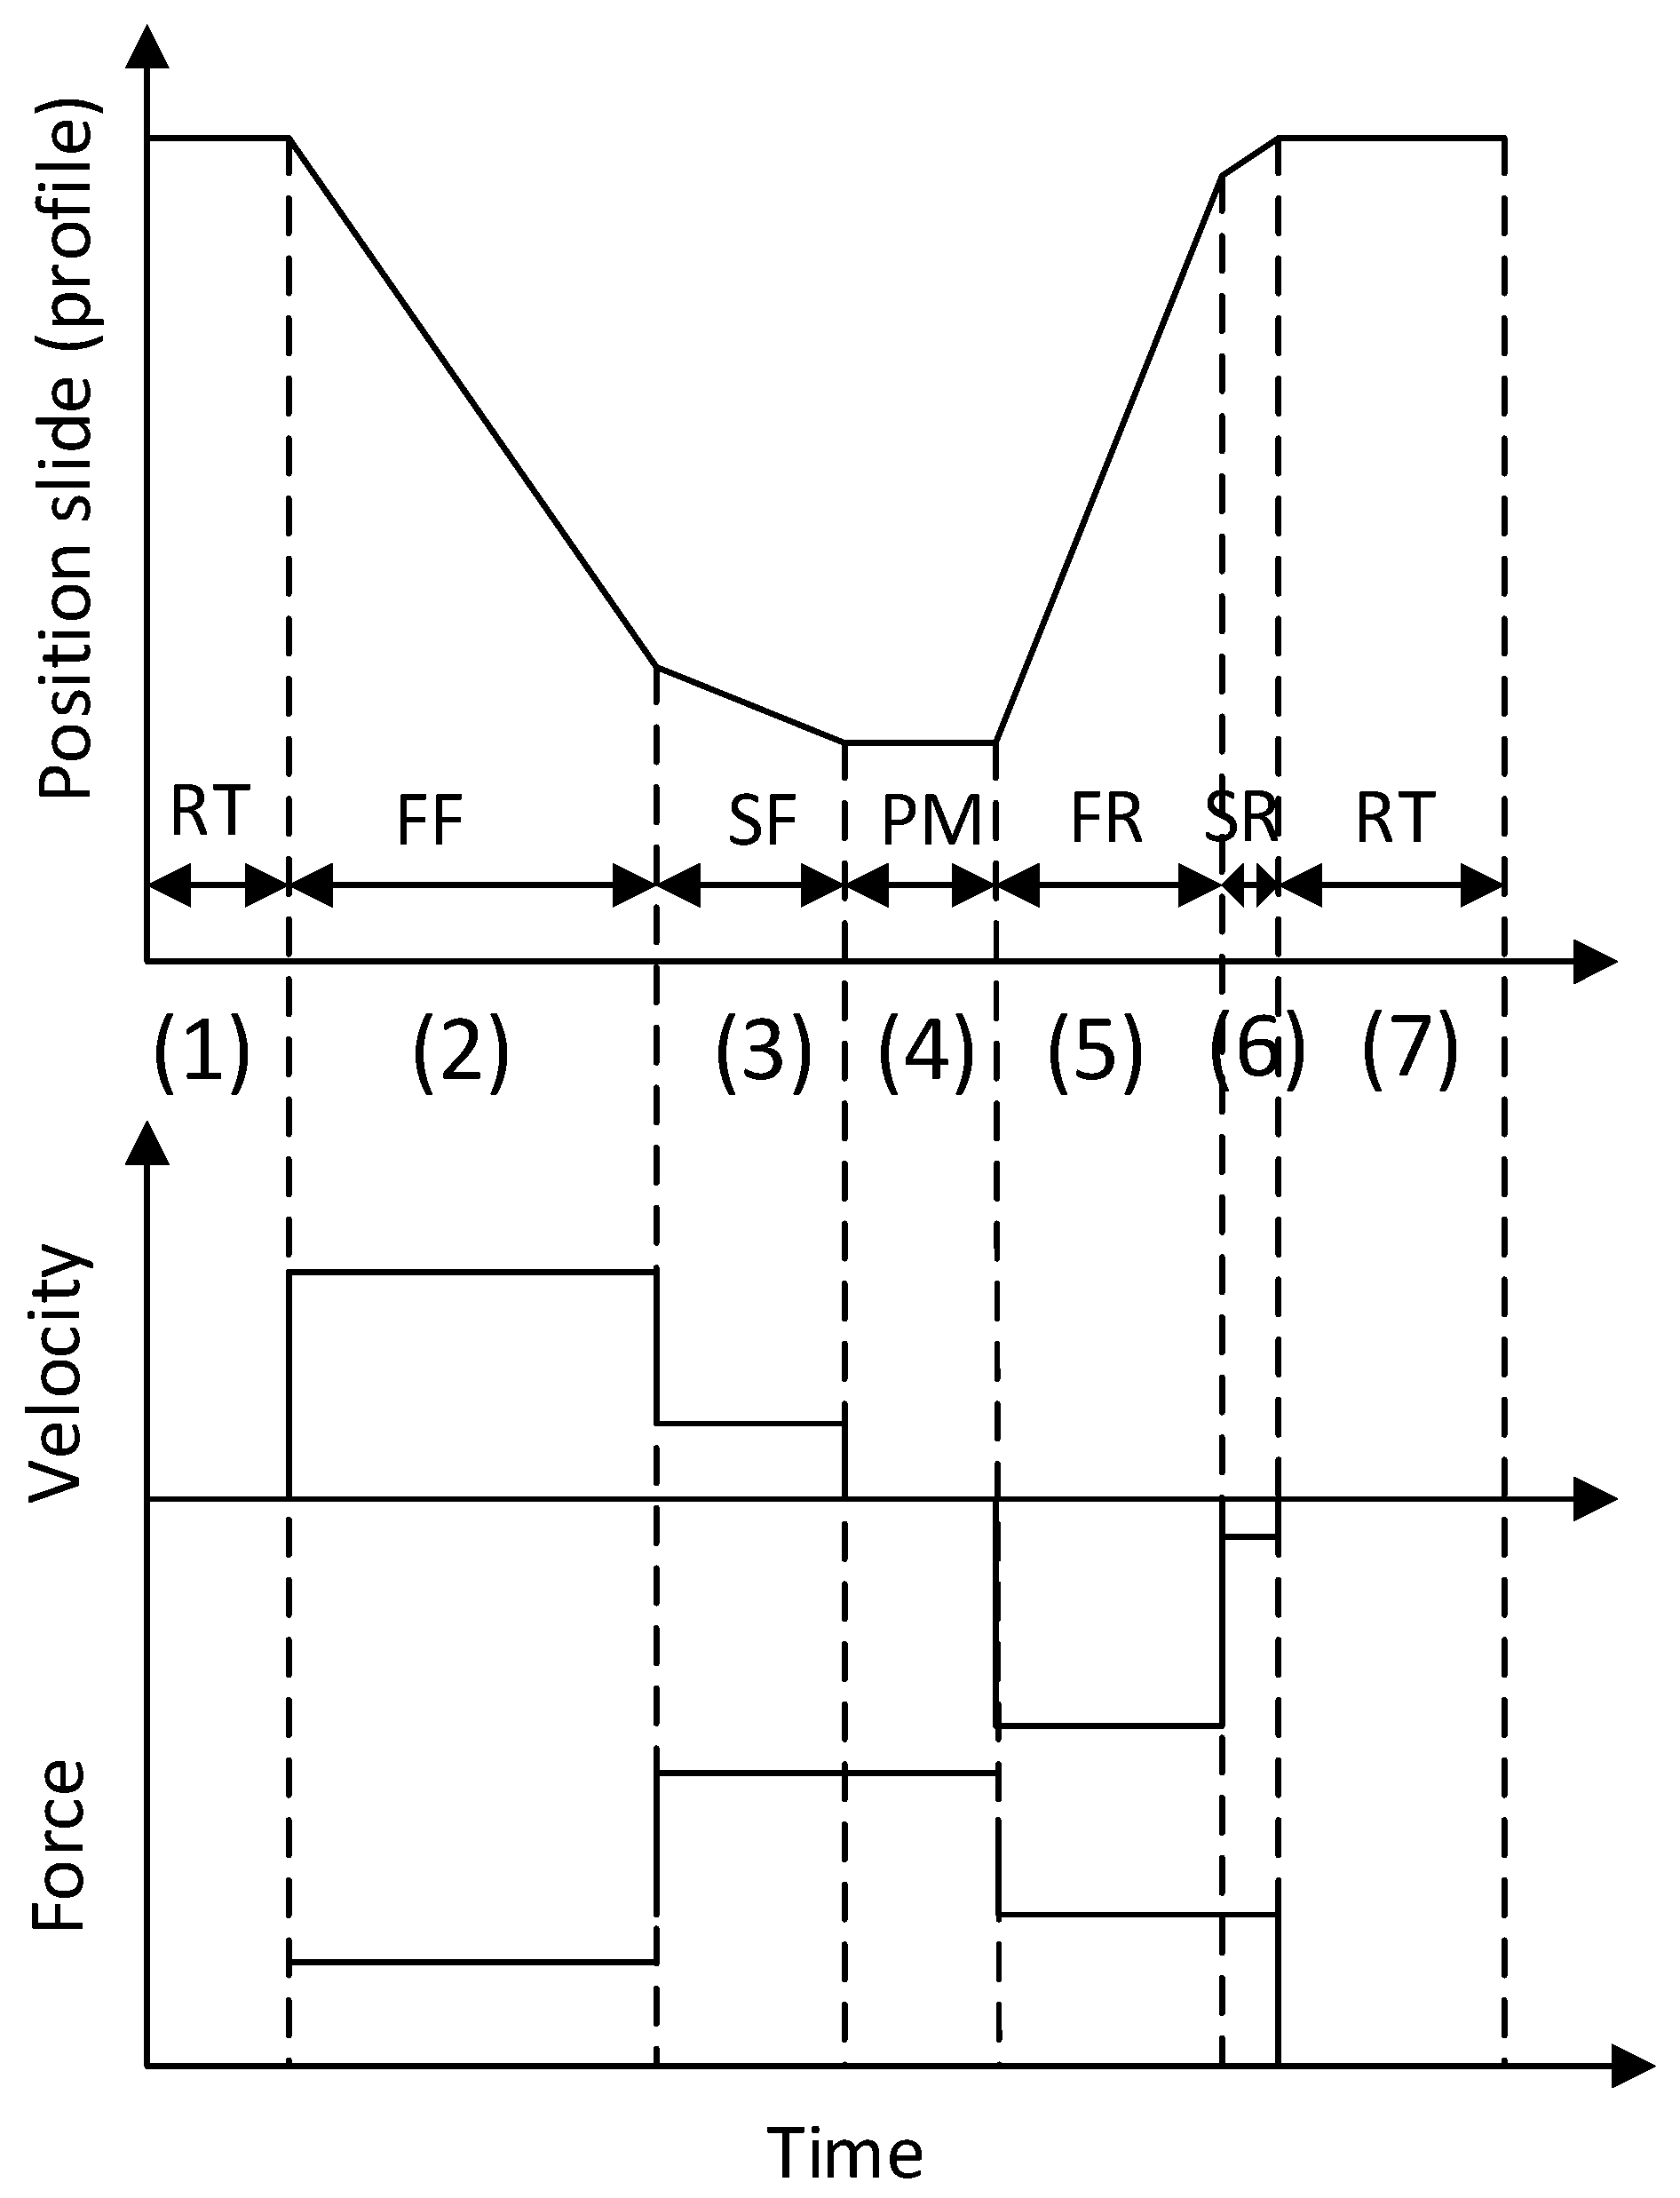
2.2. Control Strategy

A structured controller is suggested for the proposed control strategy, as presented in Figure 8 for controlling the motor to produce the desired cycle. The whole controller consists of a supervisory controller and a position controller.
The supervisory controller selects the working mode and calculates the pump speed set point. The diagram algorithm for selecting the working mode is described in Figure 9. Then, the working mode is achieved by switching the on/off valves as described in Table 1. In this study, the working mode is selected so that the system has the highest velocity factor or force factor as well it recovers energy of external force for a given cycle. A working mode is selected for each phase and this process is taken place in advance for a given cycle. This strategy is suitable for so many industrial applications such as pressing machines where each pressing profile of a product is usually able to be pre-estimated. This is an open-loop time based control strategy, so a period is used to change the phases of the system.
The speed set point ωn of the pump is considered as a steady speed of the pump according to the desired velocity of the cylinder for each phase. When the working mode is selected, a value of KV is also calculated by using the data in Table 2. The value of ωn is calculated by using Equation (1), whereby v is the desired velocity and the value of KV for each phase is shown in Table 2.
The position controller is used for position tracking control of the cylinder. A traditional controller such as a feedforward controller is used for the position controller. The controller consists of a PID algorithm and a feedforward signal, in which parameters of the PID controller such as KP, KI and KD are selected by turning with trials and errors. The speed set point of the pump is used as the feedforward signal. The input of the position controller is the desired cycle and the feedback signal is the position of the cylinder. The output of the controller is sent to the servo controller to control the servo motor.
Where, KV,min is achieved when the speed of the pump has reached its maximum value and KF,min accounts for working pressure reaches the design limit of the system.
For the purpose of effective evaluation of the control strategy, a typical pressing profile as shown in Figure 10 is brought into analysis, in which RT, FF, SF, PM, FR and SR stands for resting time, fast falling, slow falling, power maintaining, fast returning and slow returning phases in the pressing cycle, respectively. Minimum velocity factor KV,min and force factor KF,min of the system are presented in Table 3. It is observed that, KV,min of the system is high in both FF and FR phases to increase productivity. While high requiring of KF,min in SF and PM phases to yield the high force at the cylinder rod.
To finish the pressing cycle, three control strategies are suggested including proposed strategy PS, not recovery strategy (NRS) and EHA strategy without energy recovery (EHA). The three strategies are described in Table 4. Among them, The EHA is considered as basic strategy that satisfies requirements of both high velocity and force for 2nd and 4th phases of the cycle. Besides, the EHA strategy is not taking place energy recovery in 5th and 6th phases of the cycle. On the other hand, the PS strategy is used diagram shown in Figure 9 to select working modes. Therefore, energy of external load is recovered during returning phases (6th and 7th phases) of the cycle. Moreover, the accumulator is used for storing energy in 1st and 7th phases and reusing in 3rd and 4th phases. The only difference between the NRS and the PS strategy is that the system does not recover energy from external load in 5th and 6th phases of the pressing cycle.
Within the PS strategy, the system has KV3 in 2nd phase and it has KF6 in 3rd and 4th phases. As a result, the system is the fastest in 2nd phase and the strongest in both 3rd and 4th phases when comparison with EHA control strategy. Moreover, the KF of the system is −KF2 in both 5th and 6th phases, which indicates that the system is able to recover energy from the external load. The general characteristics of the three control strategies for the pressing profile are described in Table 5.

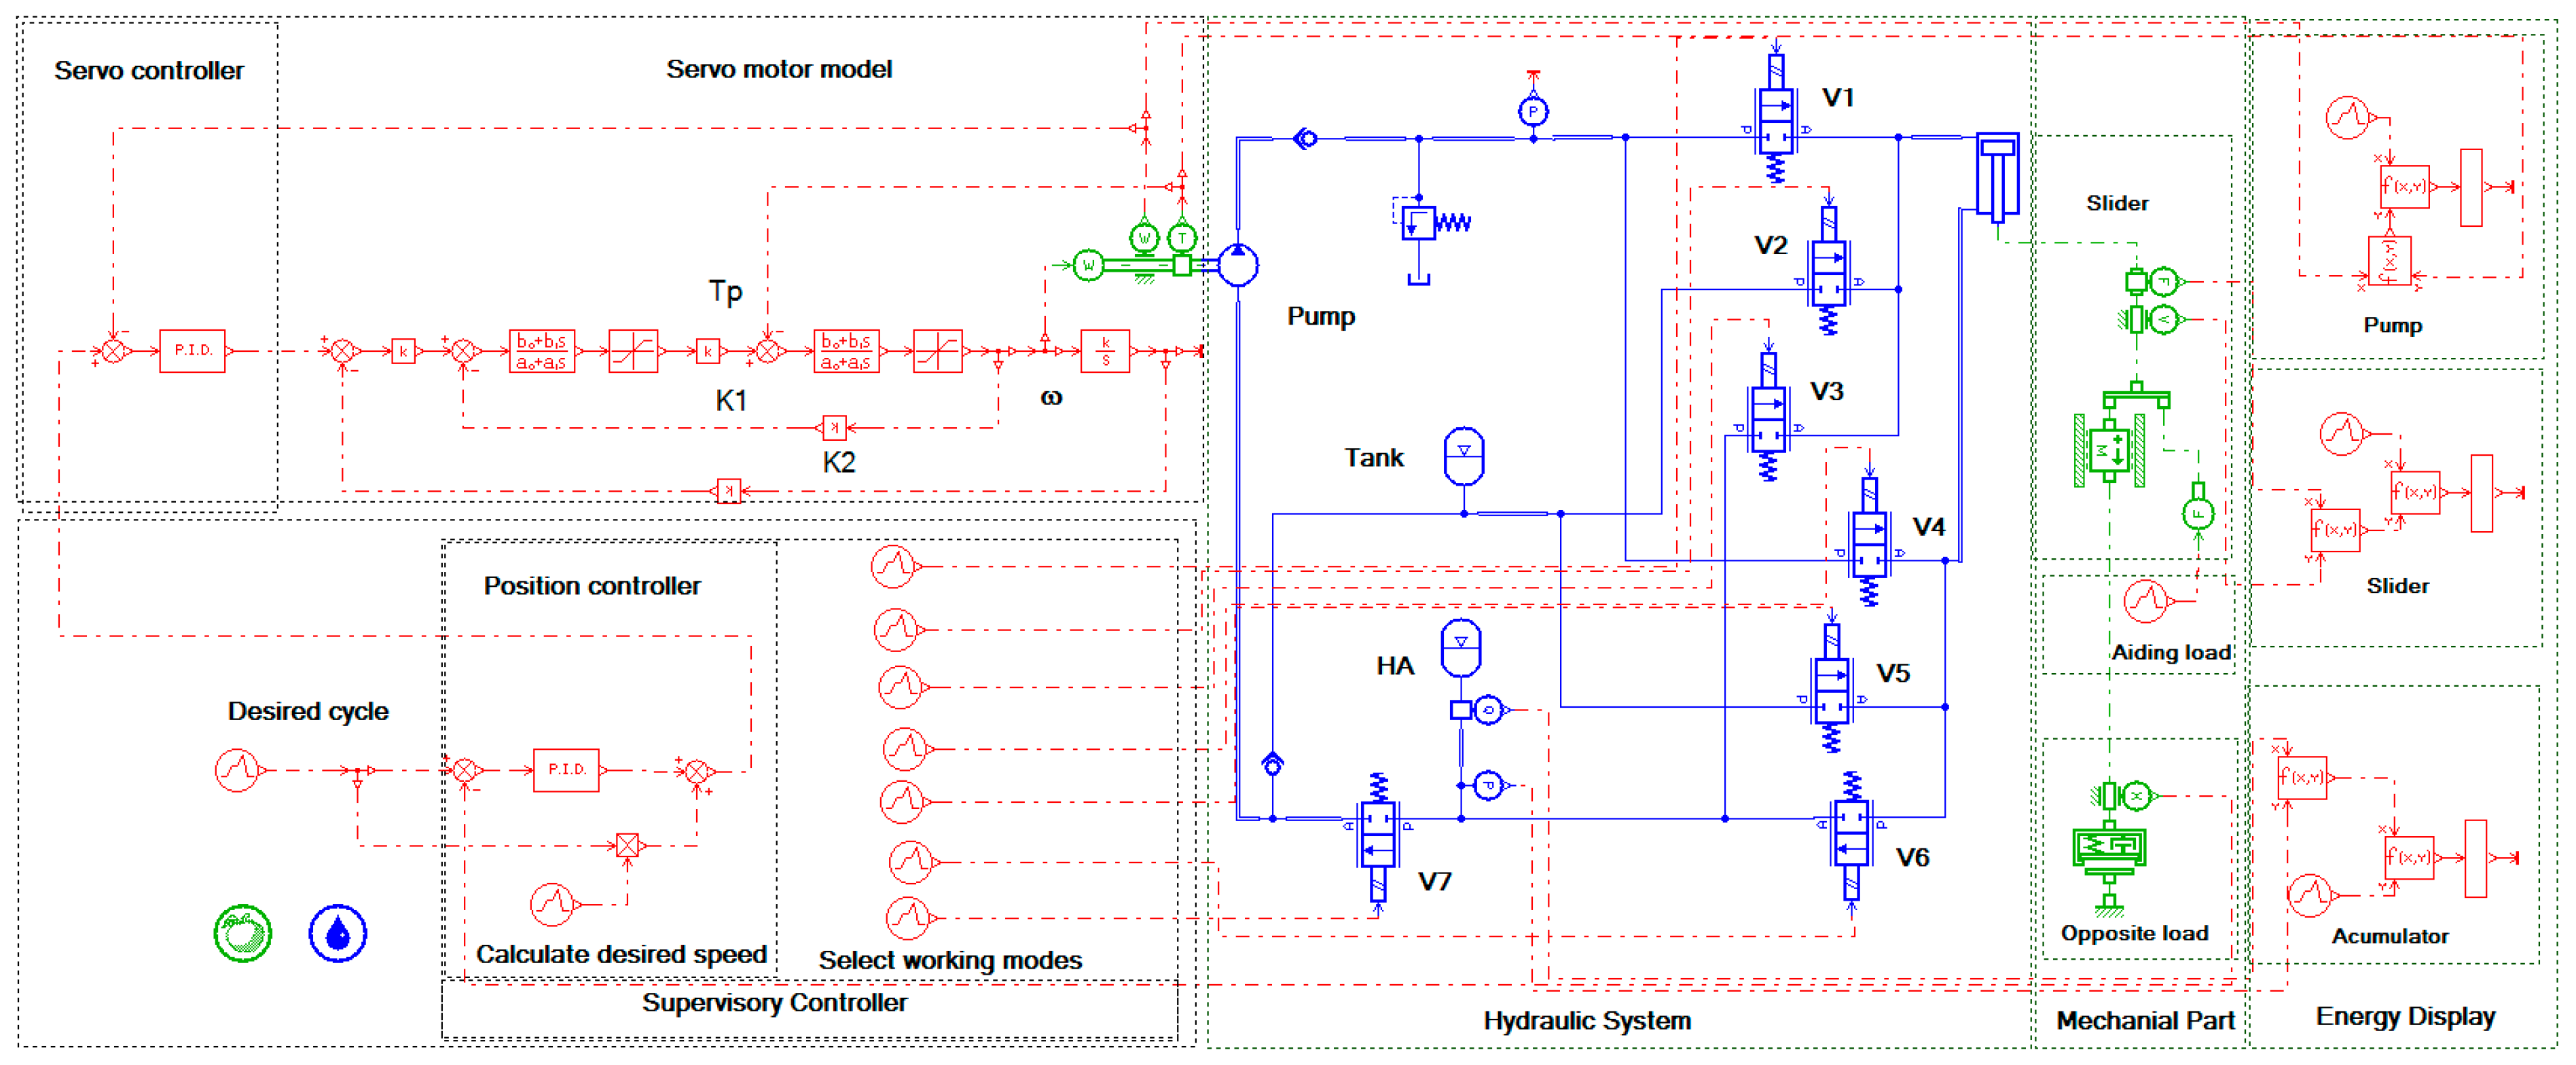
3. Modeling of the System in AMESim Software

For the purpose of verifying the energy saving ability of the system, a model of the system is built in AMESim software as presented in Figure 11. The parameters of the model are described in Table 6 in which these components are modeled based on the following assumed conditions.

3.1. Hydraulic Pump

The model of the hydraulic pump is shown in Figure 11, in which the pump is driven by the AC servo motor via the way that the speed signal output of the motor model is connected to the speed signal of the pump.
The volumetric and mechanical efficiencies of a pump depend on pump speed and different pressure between two ports of the pump [1]. These efficiencies can be achieved from the data sheet of the pump. In this case, the values of the mechanical and volumetric efficiencies of the pump vary in two intervals (0.8–0.93) and (0.63–0.95), respectively. When the value of the pressure p2 is higher than that of the value of p1, the hydraulic pump works as a motor. When the pump works in the motor mode, the system recovers energy from the external load. In this study, the values of the mechanical and volumetric efficiencies of the pump in the motor mode vary in two intervals (0.7–0.9) and (0.6–0.9), respectively. In AMESim software, these efficiencies are converted into form of table inputs.

3.2. Hydraulic Accumulator

The hydraulic accumulator was modeled with high orders and in multi-domains including the gas flow rate, gas pressure and temperature of the accumulator [17]. For simplicity, a model of the accumulator with the pressure and volume is used in order to evaluate energy recovery potential of system. The energy loss model of the accumulator due to thermal is neglected in the condition that the temperature of the accumulator is not much changed.

3.3. Hydraulic Cylinder and Slider

In this paper, the friction of the cylinder is lumped with friction of the slider. The external load appears in the SF and PM phases of the pressing cycle. The values of slider friction parameters shown in Table 6 are achieved by the literature review and modified from the prototype model [28,29]. The model of the hydraulic cylinder is built based on the compressibility of the fluid in the cylinder chambers, leakage, damping coefficient on end stops and deformation on end stops at which the damping rate is fully effective. The model of HJ020 in AMESim is used for the cylinder and its parameters are described in Table 6 [1,9].

3.4. Hydraulic Valves

In this study, directional control valves are used. The nominal flow rate and sifting time are the considered parameters, as described in Table 6. For this system, the phase change is performed by switching the on/off directional control valve. The model of the on/off valve can be used a proportional valve model, as shown in Figure 11, as it has the same performance with step input.

3.5. Hydraulic Pipes

The hydraulic pipe model is used as a compressibility and friction hydraulic pipe model in AMESim in which the bulk modulus, length and diameter of the pipes are considered, as in Table 6. The pipe length varies depending on its connected position. Connections between the directional control valve are used in the simple direct model because the volumes under pressure are low and the fluid compressibility does not introduce significant dynamics.

3.6. Energy Model

In the first study, only the energy flow in the hydraulic system is investigated in order to neglect the effect of the efficiency of the electric motor as well the servo controller. The pump efficiencies are studied in depth because they depend on the torque and the speed of the pump. As a result, the supplying energy is defined as the mechanical energy at the pump shaft level. The energy in the display block shows the supplying energy of the pump, slider and the accumulator. This energy is estimated by Equations (3)–(5).
The hydraulic energy stored in the accumulator Ea is expressed by Equation (3), and the accumulator energy is considered as the recovery energy for the PS control strategy.
E a = t 0 t 1 p a q a d t + t 4 t 6 p a q a d t
The supplying energy to the pump shaft Em is expressed by Equation (4):
E m = t 0 t 7 | T · ω | d t
The consumed energy of the hydraulic system to finish a cycle Er is expressed by Equation (5):
E r = E m E a
In which, t0, t1, t4 and t7 are time at the beginning and the ending of resting and returning phases, respectively; pa is pressure and qa is flow rate to the accumulator.

3.7. AC Servo Motor and Servo Controller Models

In this study, a model using signal for both the AC servo motor and its servo controller is reconstructed because the control of the motor is not implemented in the details. Moreover, only the speed response of the servomotor and its controller is studied, so a simple block diagram of the motor model is used [30,31,32], as shown in Figure 11.
In this diagram—RS, RR: stator and rotor resistances (Ω); LS, LR: stator and rotor inductances (mH); K1, K2: motor constants (Nm/V, Nms/rad); Vs: control field voltage in stator; c: damping resistance of the load (Nms/rad); θm: angular position of the motor (rad); θmR: reference angular position of the motor (rad), θ ˙ m : angular velocity of the motor (rad/s); Jm, Jg, Jp: moment of inertias of the motor, gearbox and pump; torque constant K1 (Nm/V) and K2 (Nms/rad) are speed constant; θ ¨ m : angular acceleration of the motor (rad/s2); Values of these parameters are given as Jm = 0.012 kg·m2, Jp = 0.005 kg·m2, K1 = 8.43 × 10⁻³ Nm/V, K2 = 7.03 × 10⁻³ Nms/rad, Ls = LR = 50 mH, RS = RR = 3.6 Ω, and, limit speed and torque are of 3000 rpm and 25 Nm, respectively.
The servo controller is used a PID algorithm and these parameters of the servo controller KIs, KPs and KDs are selected by turning with trials and errors. The tuning values are found as Kp = 25, KV = 12, and Ki = 3, respectively.

4. Simulation Results
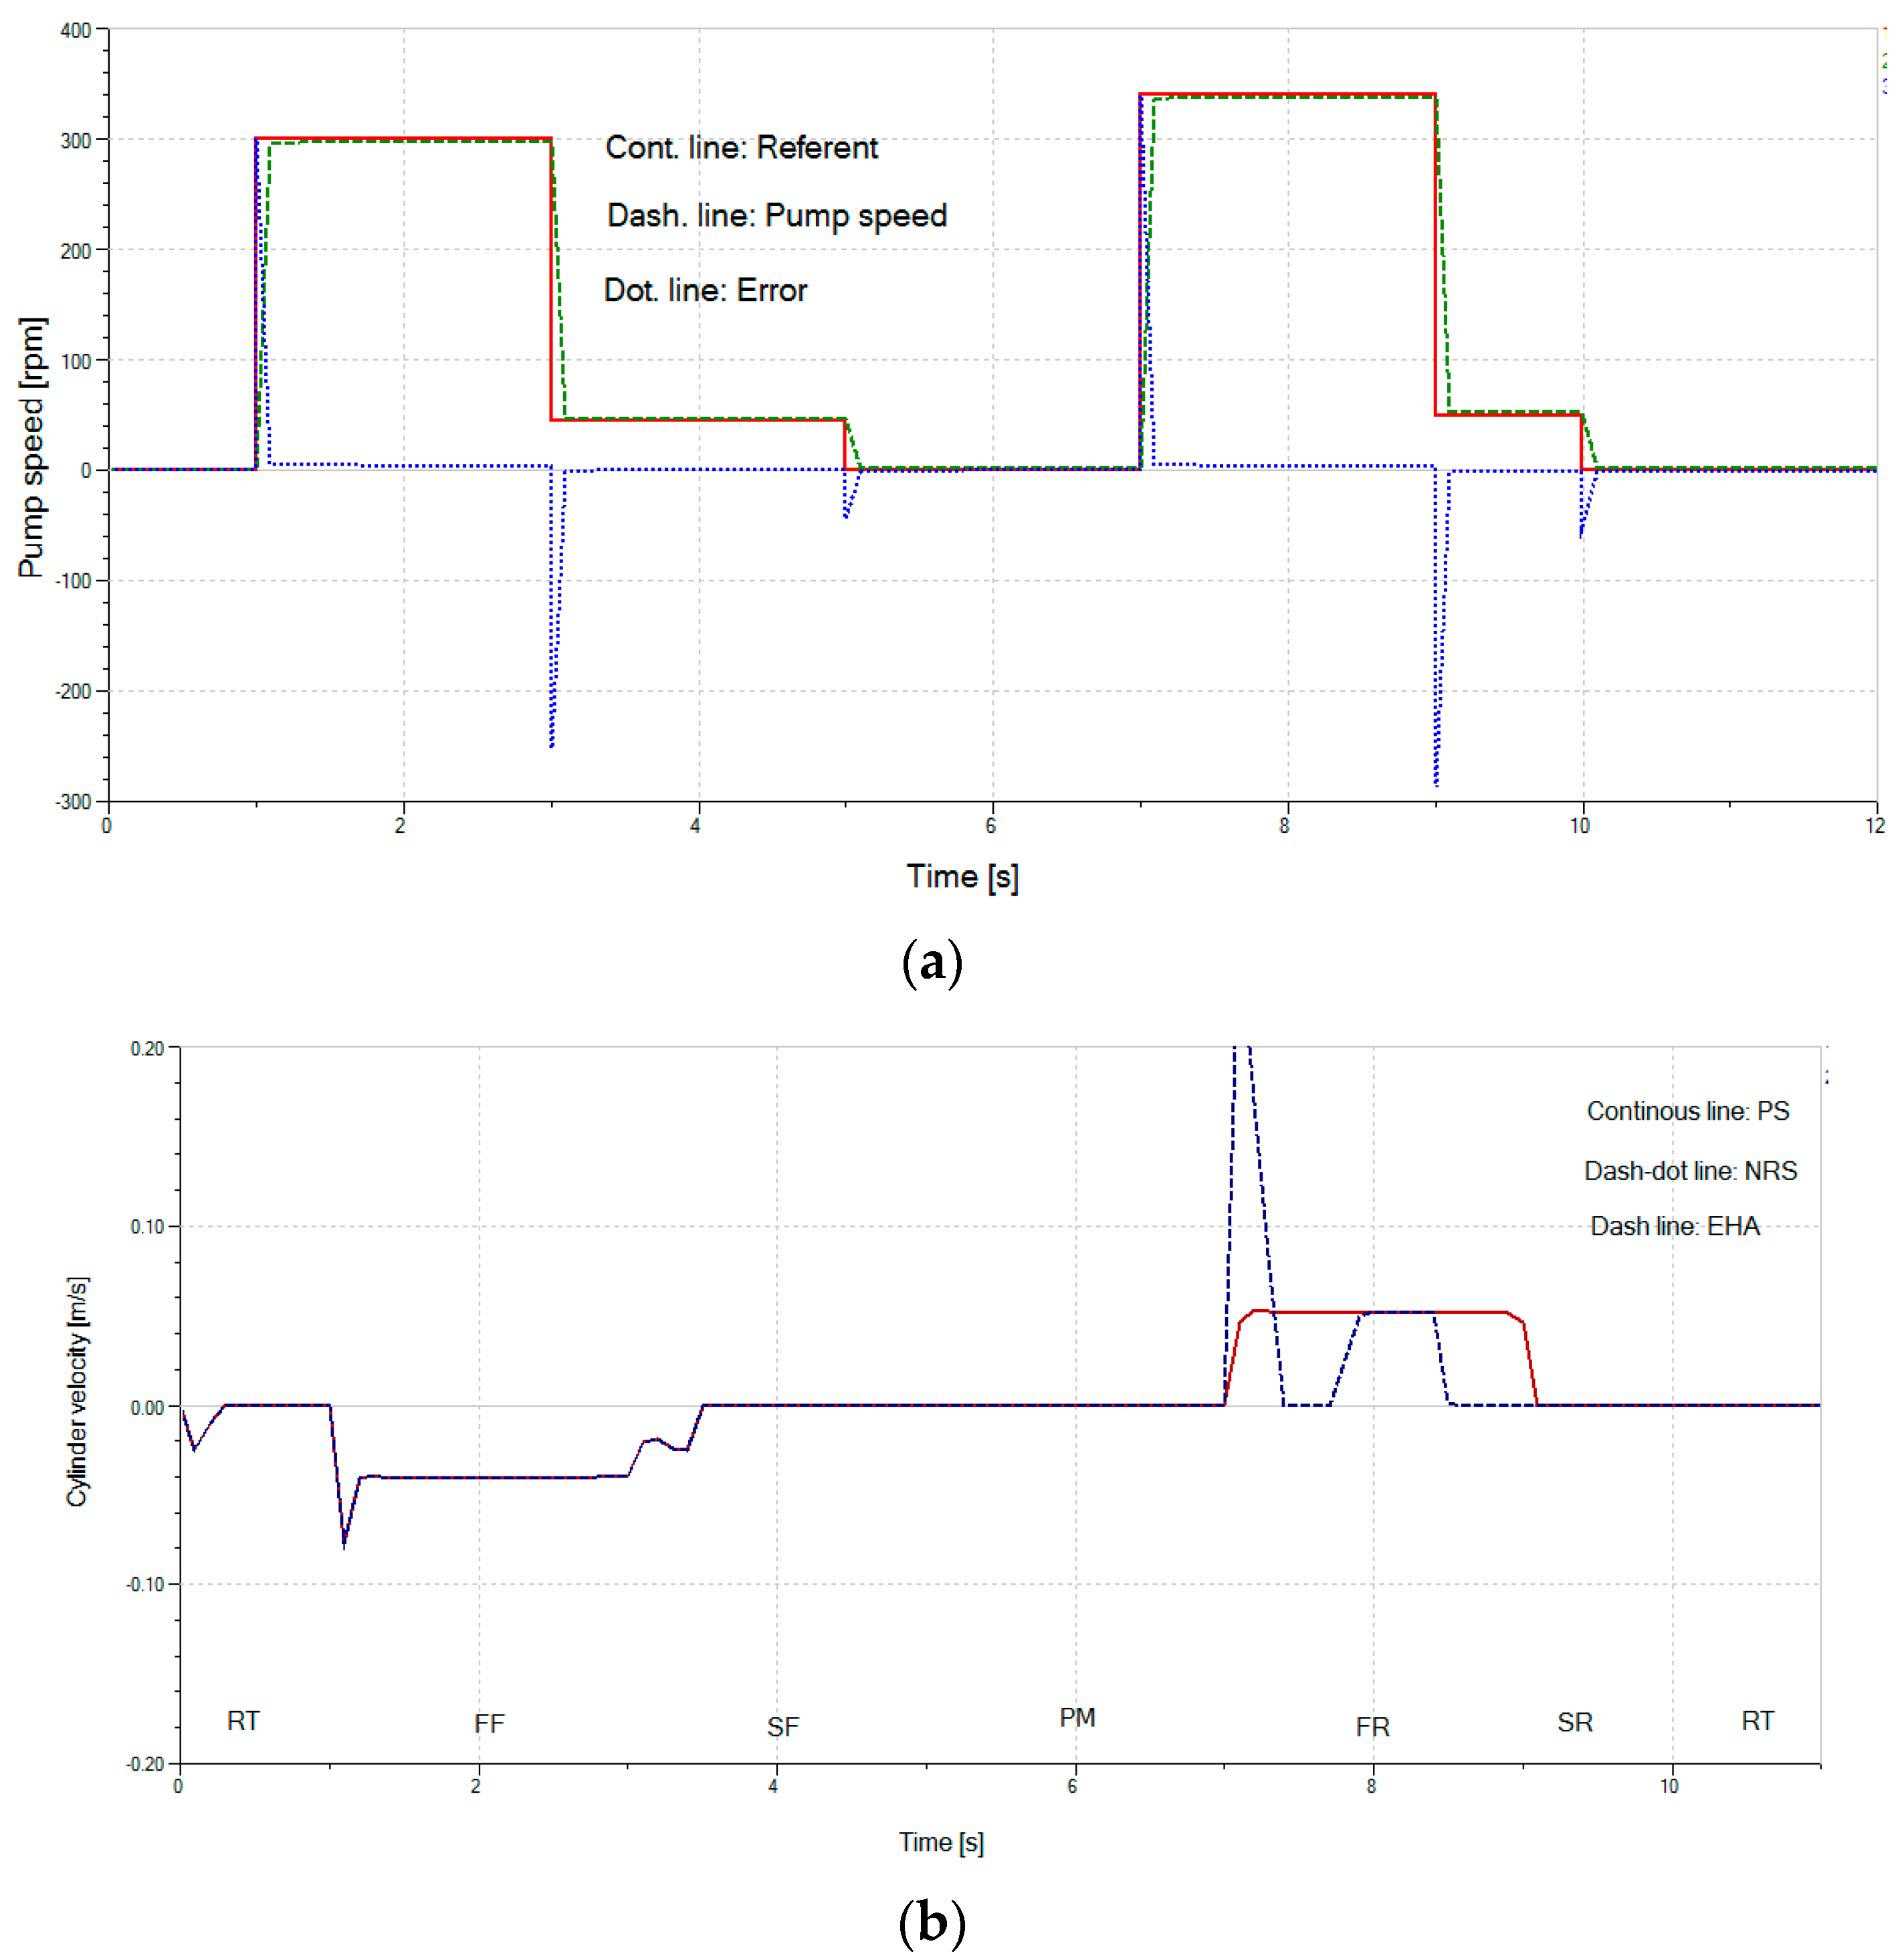
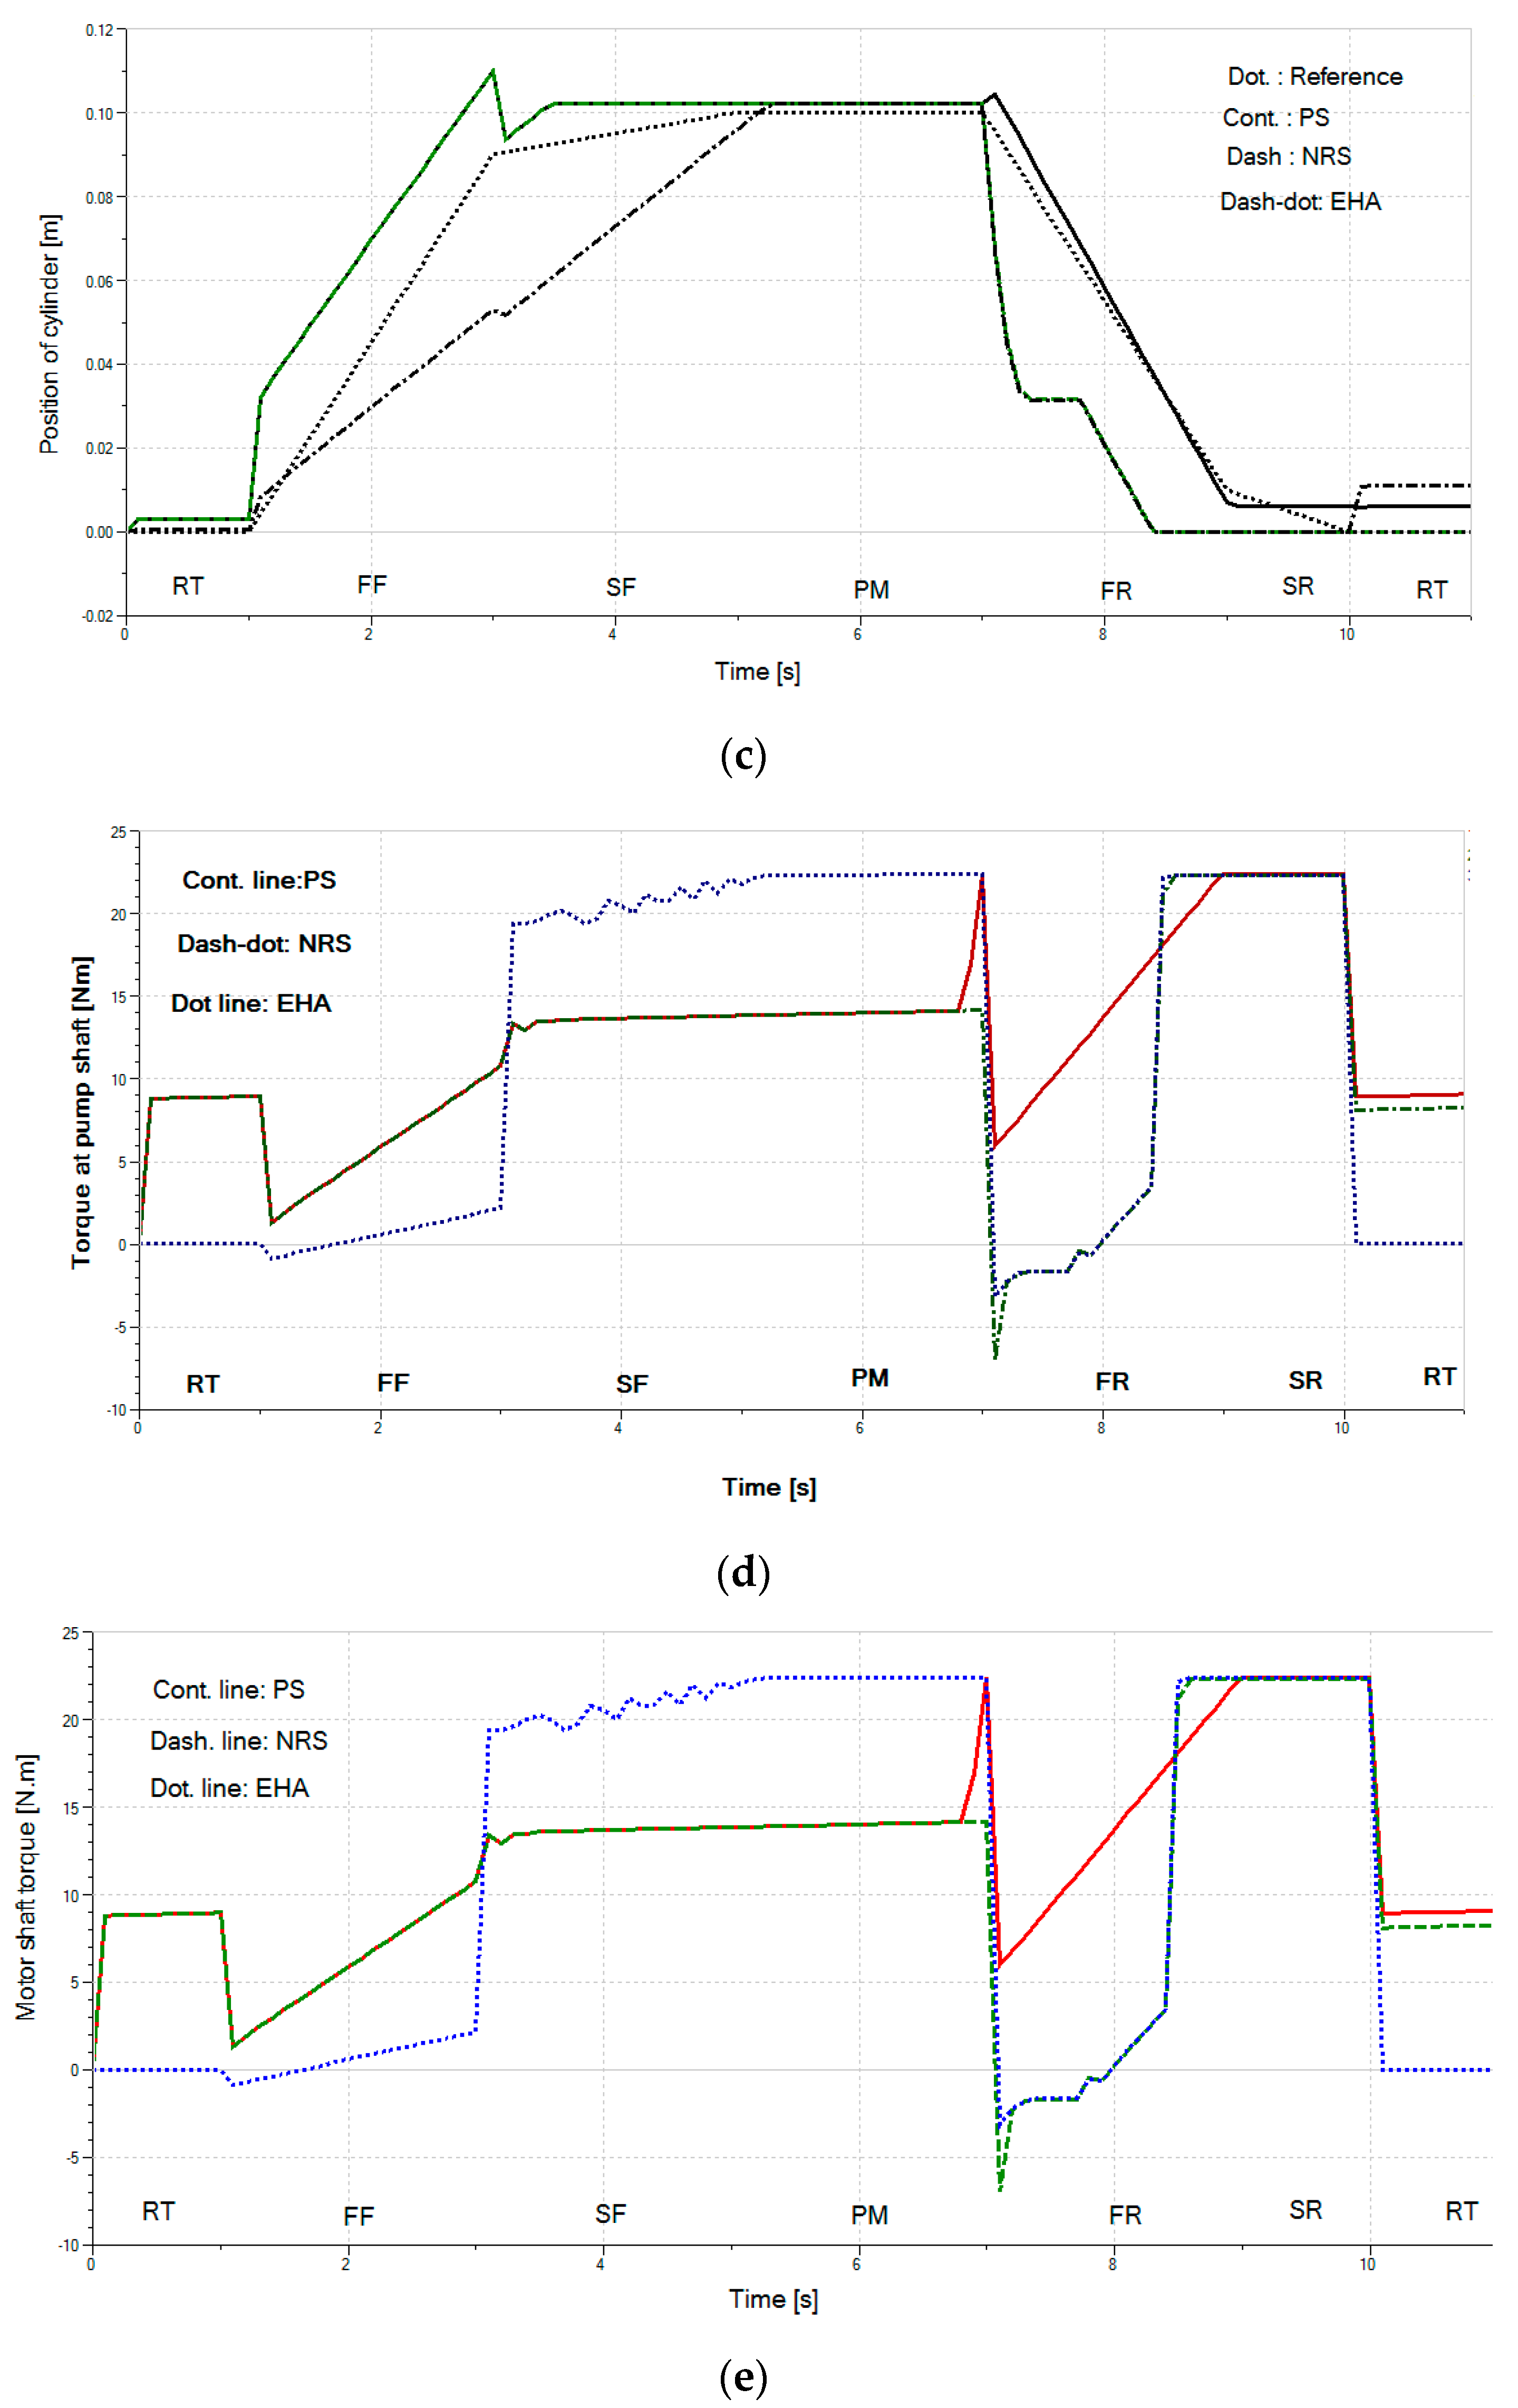
In this simulation, three control strategies that are the PS, the NRS and the EHA are brought into simulation. Parameters of the cycle are described in Table 7 in which speed of the pump is controlled by servo controller.

4.1. Open Response

The response of speed of the motor with the servo controller in EHA mode in respect to the multi-step input is shown in Figure 12a. To finish a cycle, the speed of the motor starts from zero and finishes also at zero speed after the 12th second. It is observed that, the output of the model plotted by the dashed line is well tracked by the reference plotted by the continuous line. The error plotted by the dotted line is acceptable with the steady state error at zero.
The open response of the cylinder according to the step input for three control strategies are presented in Figure 12b, in which the speed of the pump is 400 rpm, and the time period for each phase is described in Table 7. It is observed that, the velocity of the cylinder in the PS or the NRS strategy is much higher than that value for the EHA strategy within the FF phase. There are notches when the changing phases, and its value is about 15% according with the PS strategy. There is vibration in the PM stage within the EHA strategy, that is an effect of the external force.
The notch occurred at the 7th second for both the NRS and the EHA strategies while not for the PS strategy, which is the cause of the reload force of the spring. For both the EHA and NRS strategies, the flow outlet of the cylinder goes directly to the tank without any throttling control during returning phases. Therefore, the value of the speed for the EHA or NRS strategy is so high at the beginning of the FR phase when compared with that value for the PS strategy. For the PS strategy, the reload force is partially compensated by a hydraulic force due to pressure in the accumulator. As a result, the position of the cylinder that is shown in Figure 12c is different within three strategies. The cylinder reaches the value of 0.1 m in about 2 s for the PS or the NRS strategy, while that value is 4 s for the EHA strategy. Notches in the position occur and the values of them are about 20% at the 3rd second. Moreover, there is remained steady position error in the PM and the ending phases of the cycle.
The operating pressure of the system for the PS strategy is higher than that value for the EHA strategy in the FF and FR phases and the cause of the regenerative and recovery operating modes, respectively. The pressure of the suction port of the pump for the PS strategy is higher than that value for the EHA strategy in SF and PM phases. That is the result of the reused operating mode, where the pressure of the accumulator charges to the suction port of the pump. Therefore, torque at the pump shaft for the PS strategy is lower than that value for the EHA strategy.
Torque of the shaft pump in different control strategies is shown in Figure 12e. It is observed that, torque of pump shaft for the NRS or the EHA strategy is low in FR phase cause of reload force of the spring. During this time, the accumulator is charging or the pressure of the cylinder end is increasing for the PS strategy. As a result, the operating pressure or torque is high in this phase.
Parameters of the accumulator are shown in Figure 13 that are pressure and flow rate of fluid and volume of gas in the accumulator. Pressure and volume of hydraulic fluid in the accumulator are presented in Figure 13a,b, respectively. At the beginning of the cycle, the gas pressure is 60 bar and it raises to 66 bar at the end the cycle, while the volume of fluid is raised from 0 L to 5.5 L or the volume of fluid increases from 0 to 0.5 L, respectively.

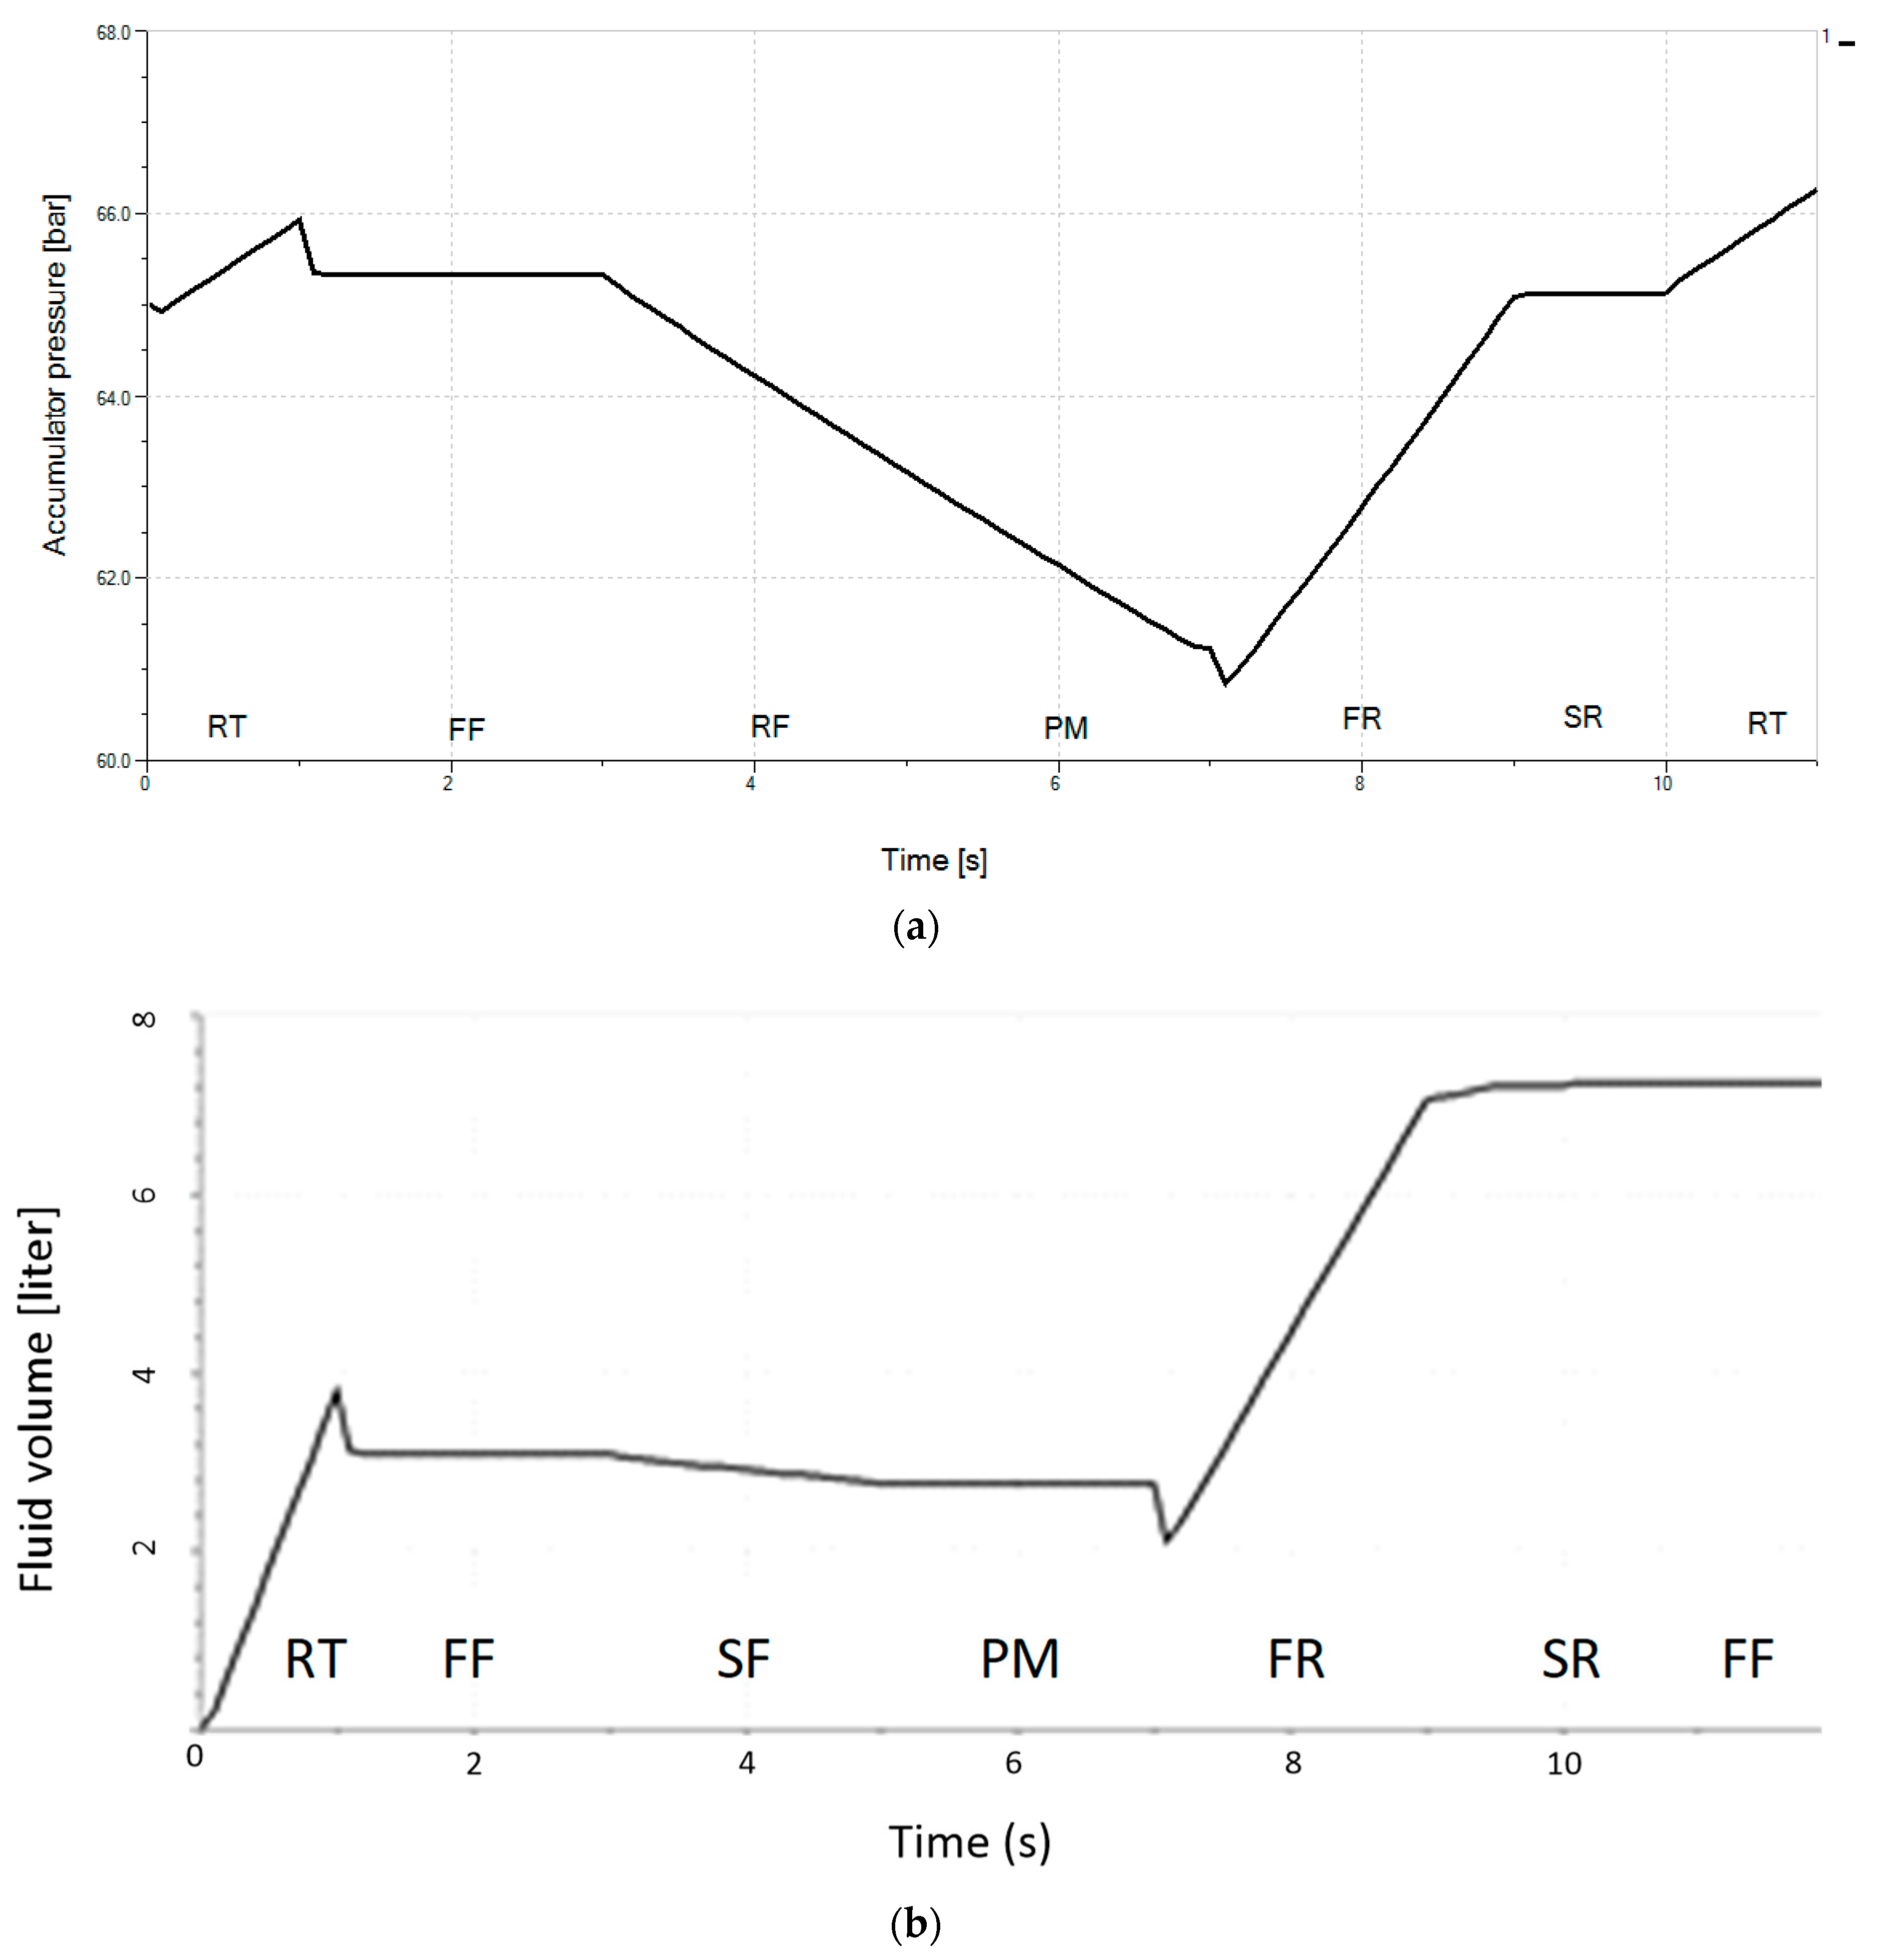
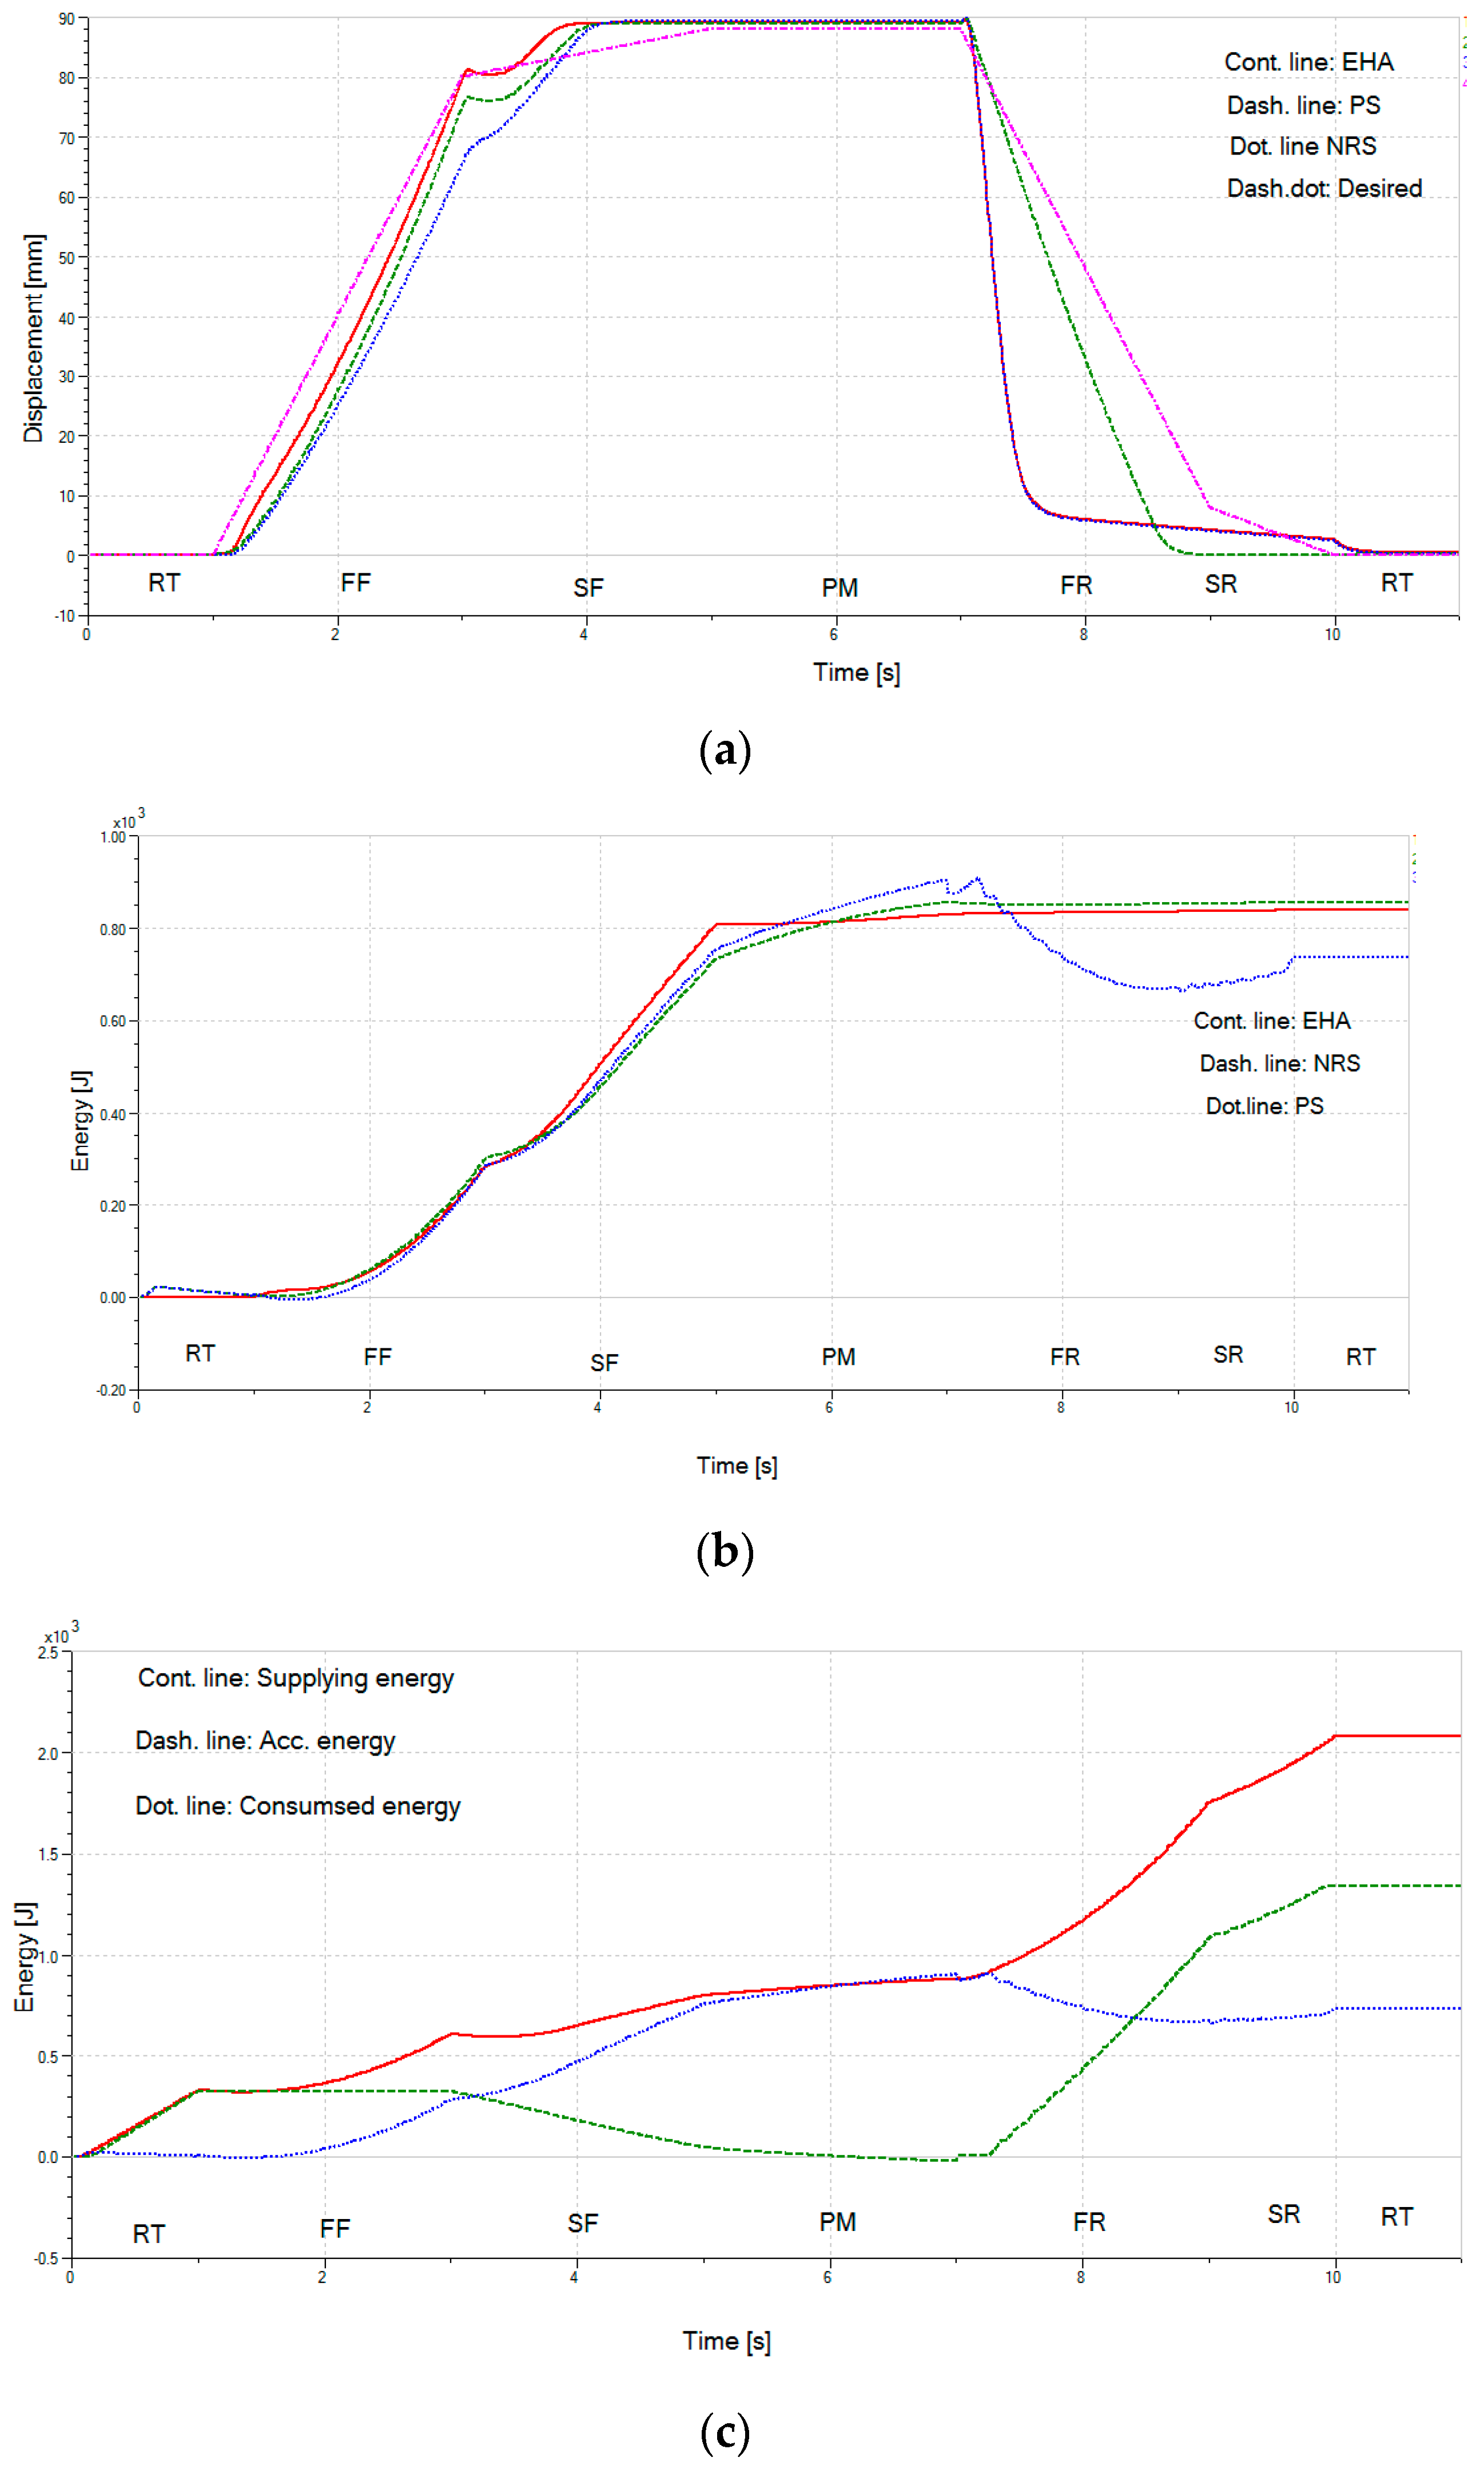
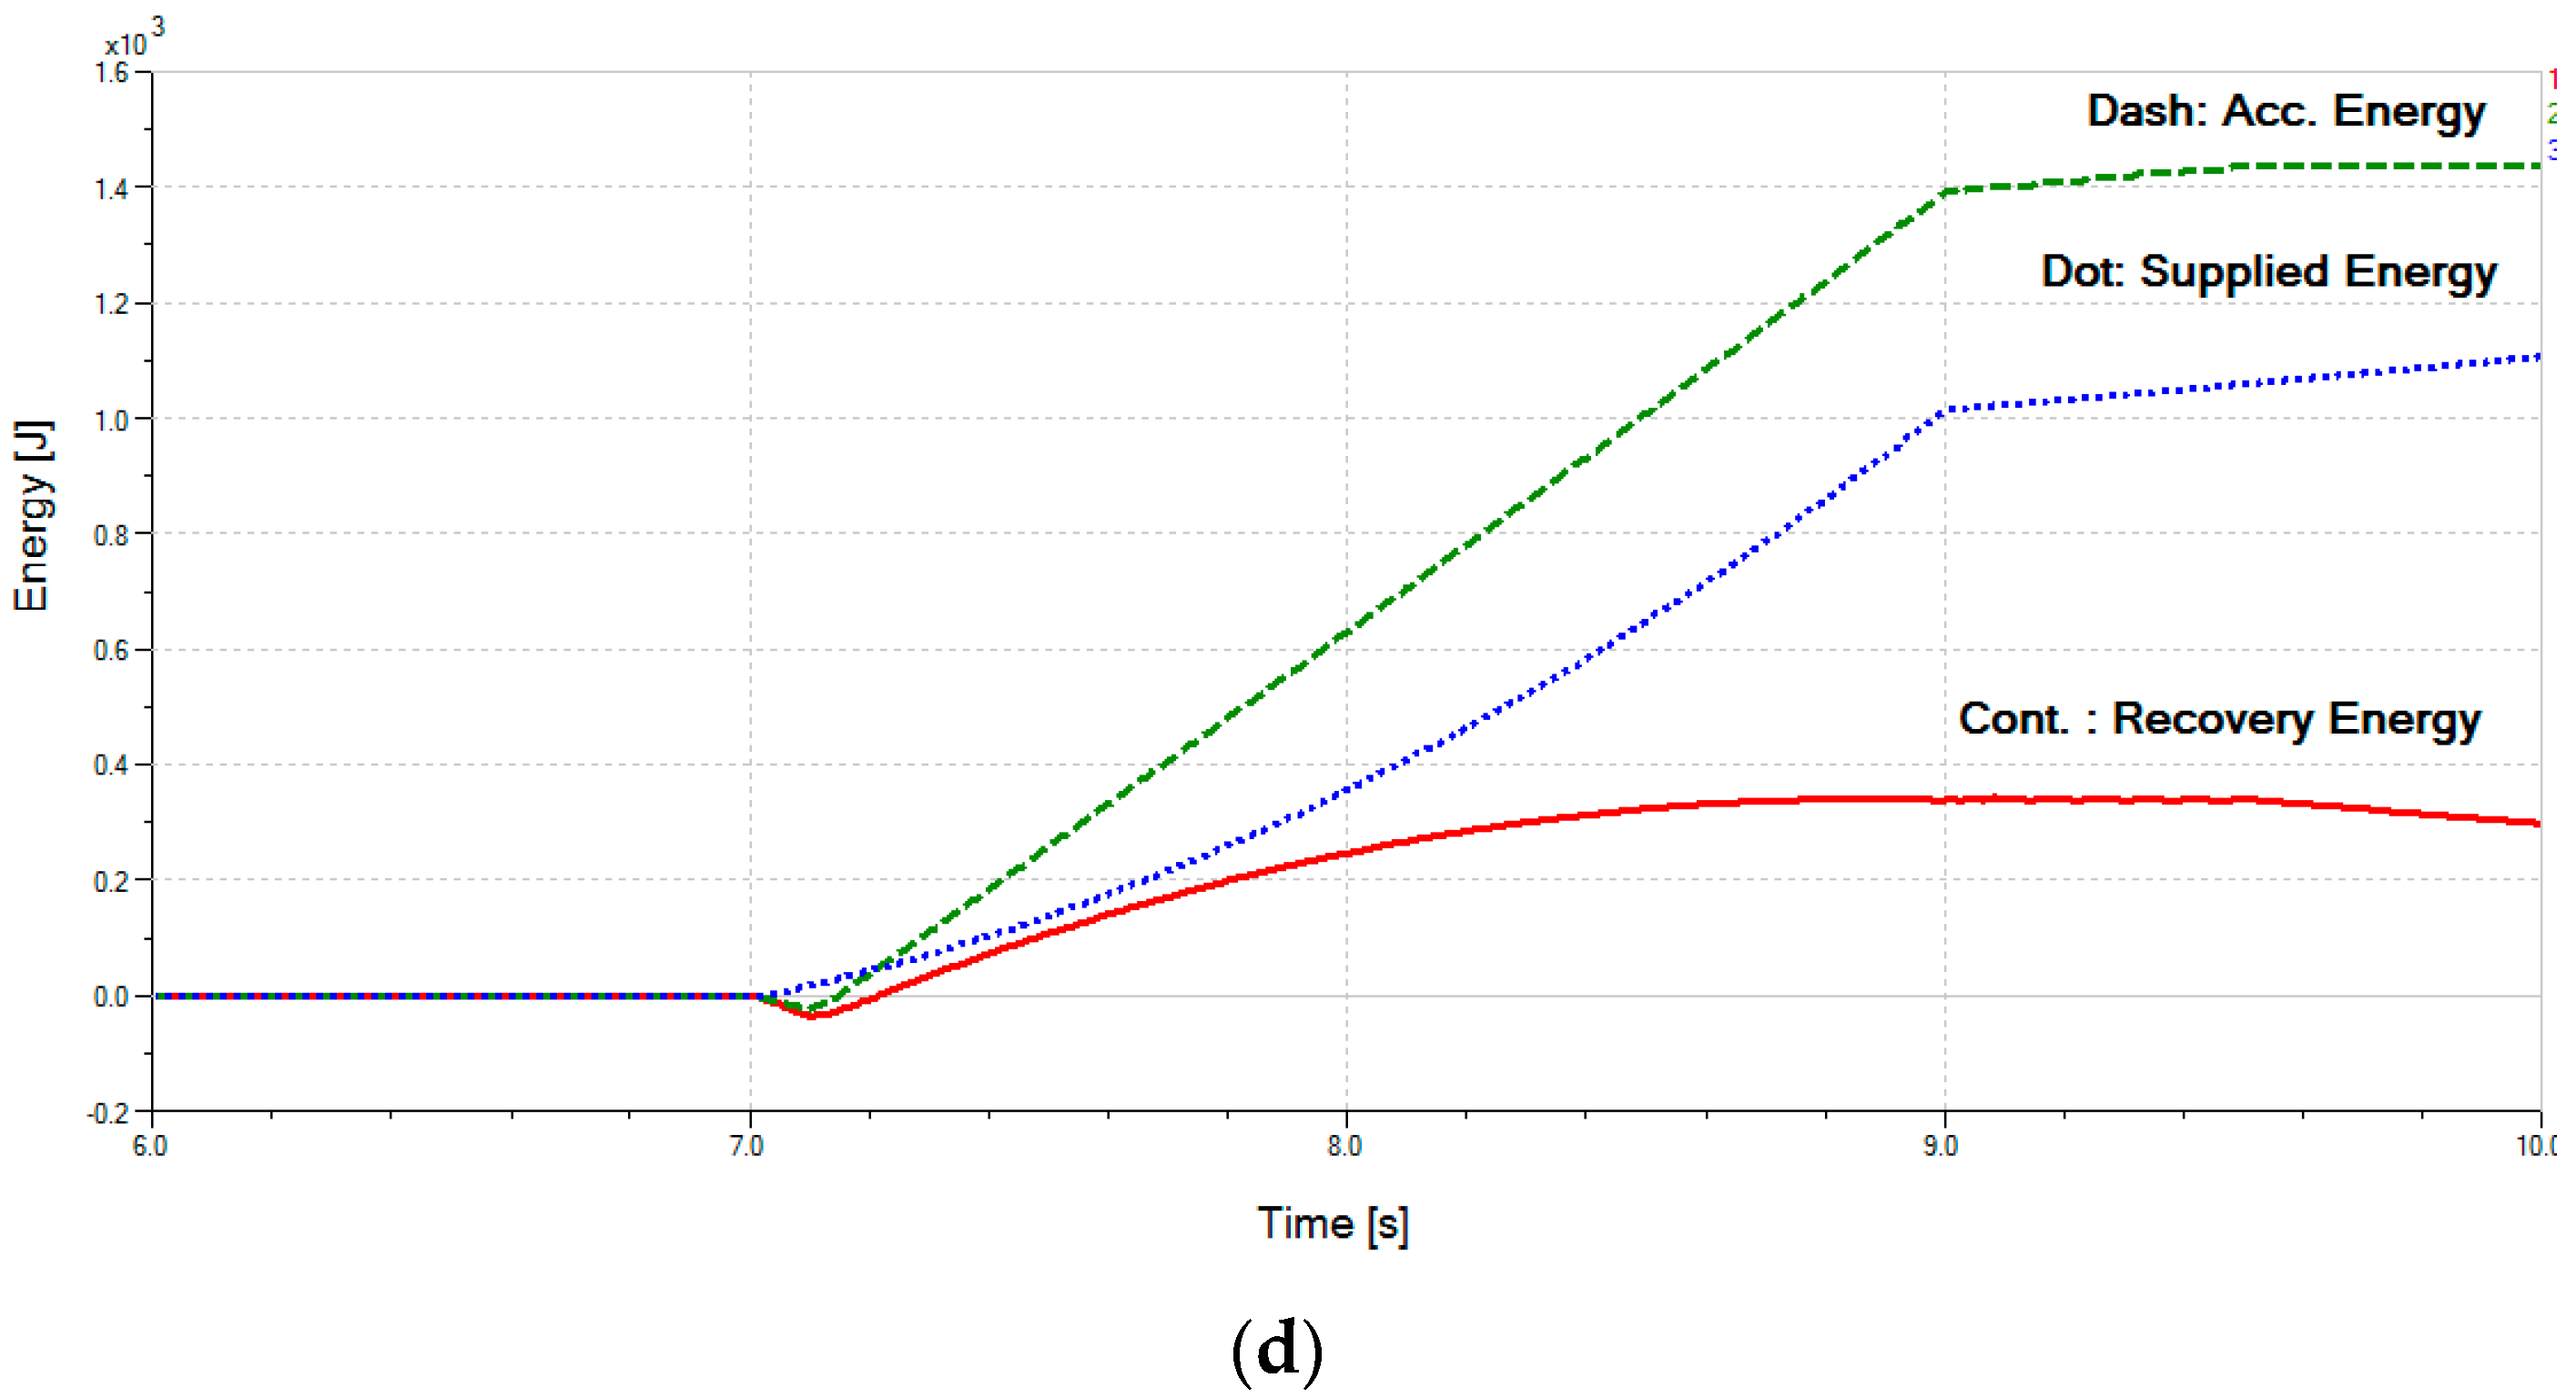
4.2. Energy Recovery Ability of the System for PS Strategy

From the open response, it is observed that a closed position controller of the system for every control strategy is needed. The position of the controller is described in the control strategy section. The parameters KP, KI and KD are selected by turning with trials and errors and the feedforward signal is used the estimated value of the motor speed as described in Table 7. Results of the cylinder position response for the three control strategies to a pressing cycle are shown in Figure 14a, in which the speed of the cylinder in the FF phase is very fast for both the NRS and EHA strategies. The system for both EHA and NRS strategies is not able to reduce these speeds because the outlet port of the cylinder is directly connected to the tank. As a result, the cylinder is pushed by the spring force to starting level and the pump is only delivering flow rate with low pressure. However, the position errors in the SF and PM phases are maintained at a low value for the three strategies. Therefore, the system is brought into energy consumption assessment for this cycle.
The energy consumption of the system in the cycle is shown in Figure 14b, in which the system consumes 700 J to finish the pressing cycle for the PS strategy. While the system consumes 854 J and 840 J for the pressing cycle for both the NRS and the EHA strategies, respectively. Therefore, the proposed system is more saving energy than a typical without energy recovery EHA system about 20% for the pressing cycle with recoverable external force. In FR and SR phases, consumed energy of the system for PS strategy is reduced which implies that the system is recovering in theses phases.
The energy flow of the system for PS strategy in the cycle is shown in Figure 14c. It can be observed that energy is always supplied from the motor, in which that energy is used to charge the accumulator in RT phase while that energy is used to overcome external load and push the cylinder out during FF and SF phases. On the other hand, the motor still supplies energy during the recovery phases and the recovery energy is stored in the accumulator instead of electronics drive as a traditional energy recovery EHA system. Moreover, it has also to be mentioned that the energy losses in the electronic drive are neglected and efficiencies of the pump are included.
The total energy is supplied to the pump is 2.143 kJ, but the accumulator is stored 1.435 kJ. Therefore, the system consumes 700 J to finish the cycle. During RT phase, the supplying and the accumulator or recovery energy are nearly the same. The consumed increases in FF and SF phases but decrease in FR and SR phases, which is proved that the system recovers during the returning phases of the cycle.
Figure 14d shows energy flow of the system for PS strategy in FR and SR phases of the cycle, in which the energy supplied from the motor is lower than energy stored in the accumulator. Which indicates that the system recovers energy of the spring in these phases.

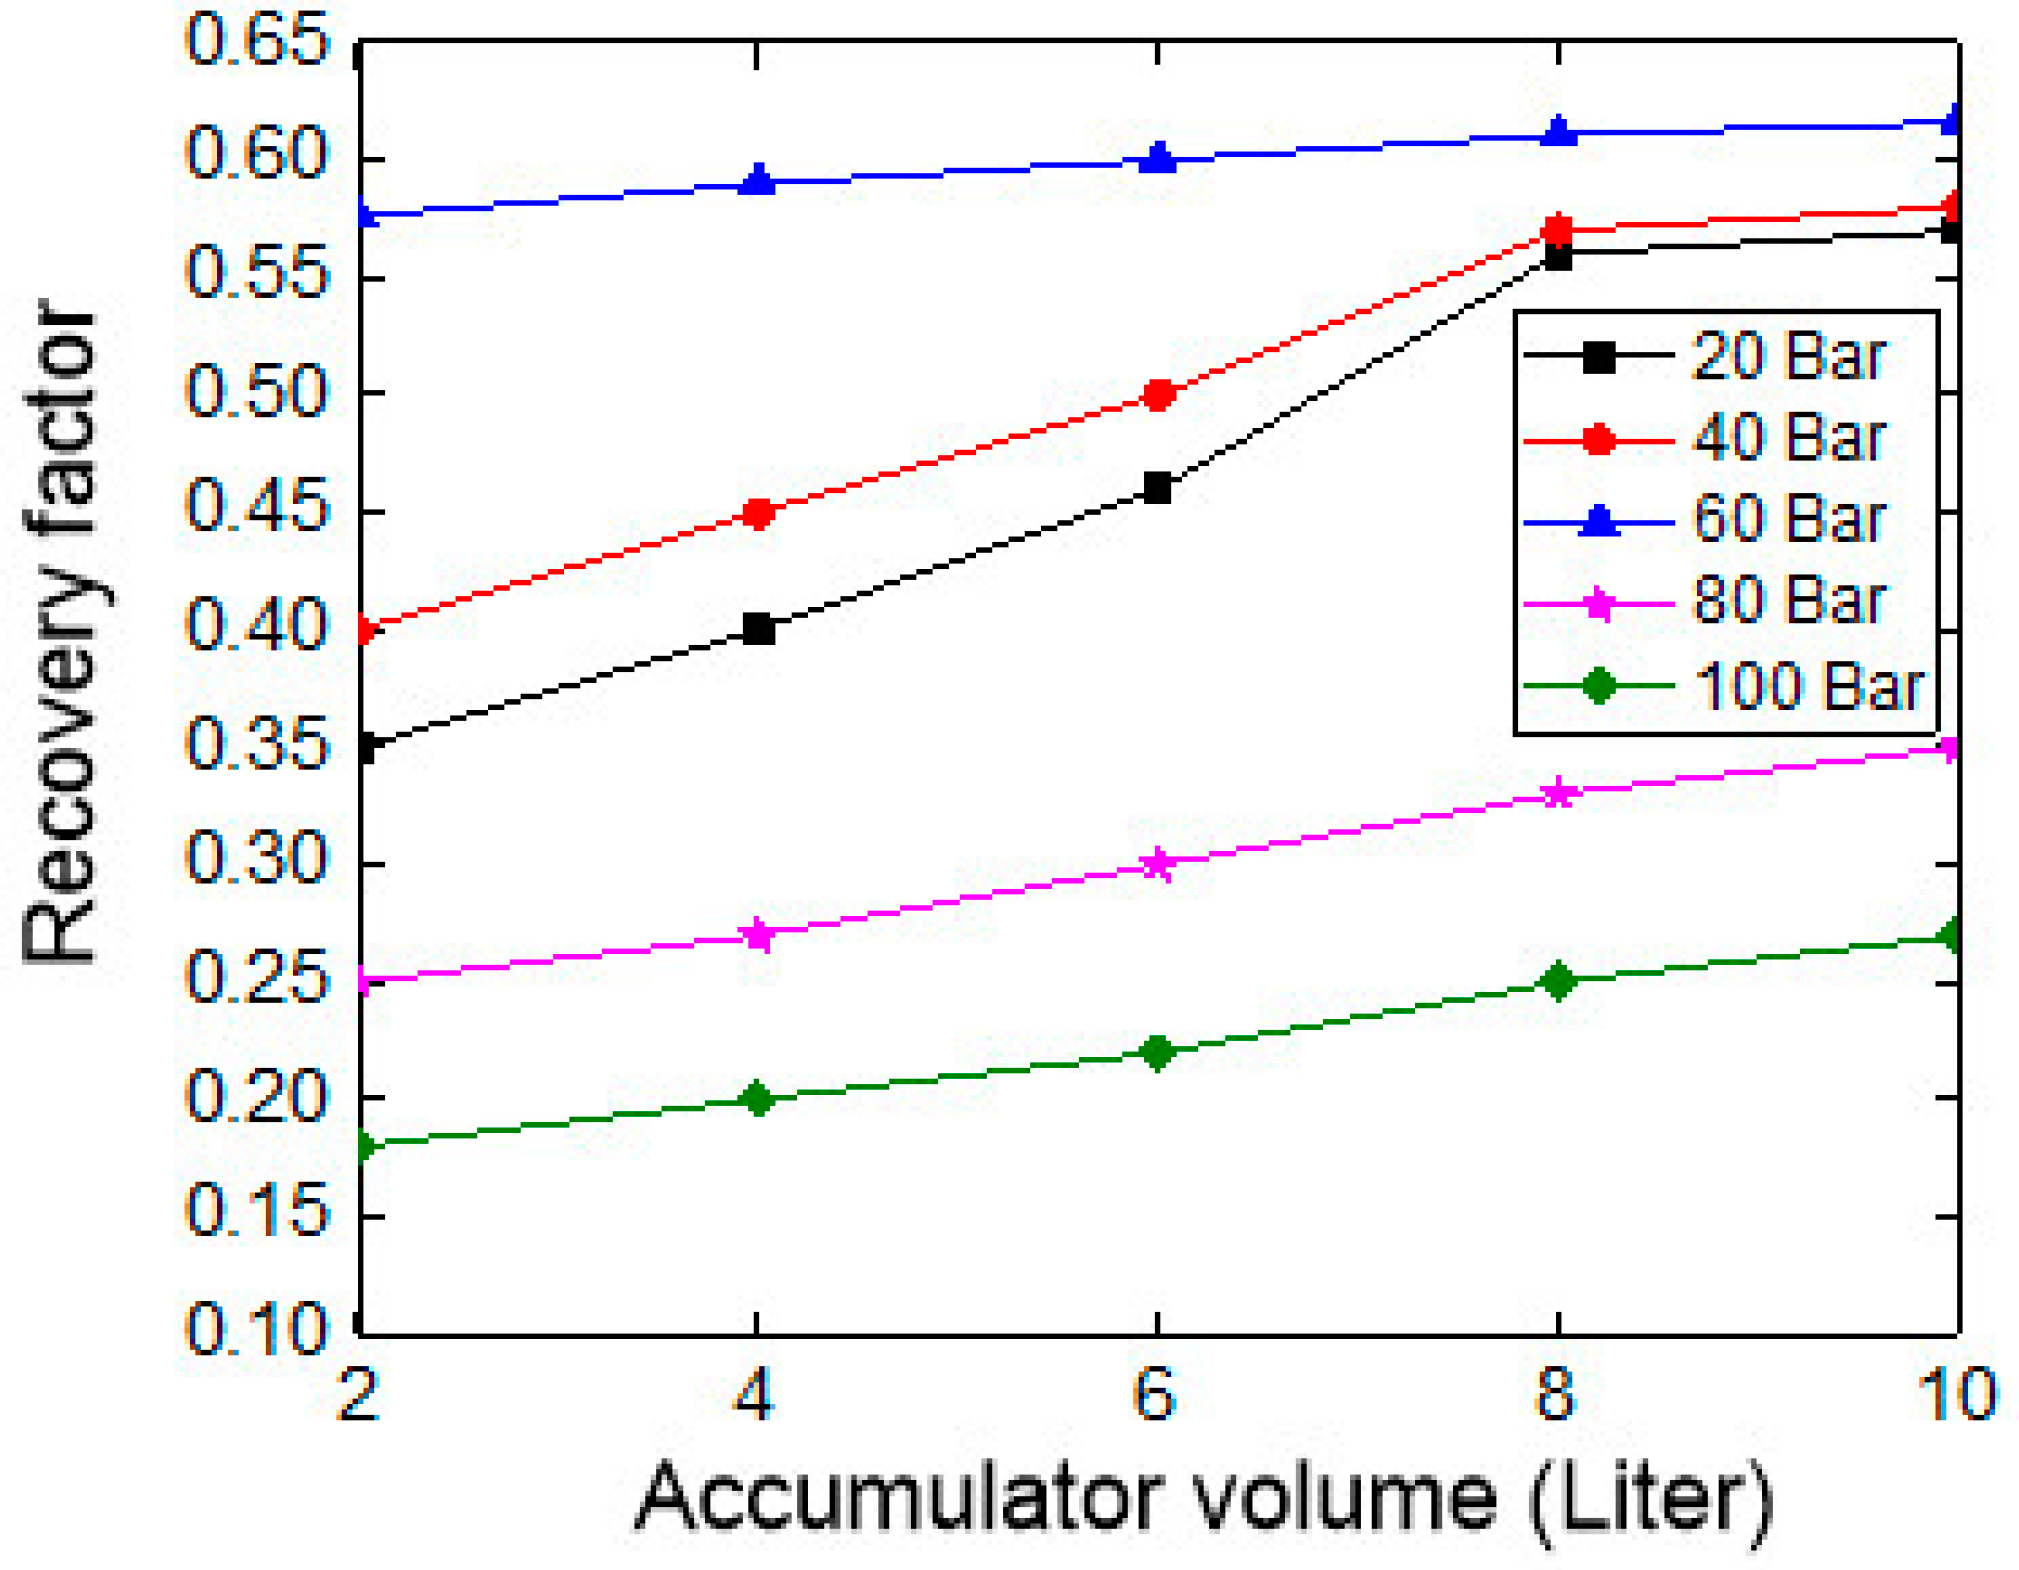
4.3. Effect of the Accumulator Parameters on Energy Recovery Potential of the System

The system reveals that it is able to recover energy of opposite external force for the PS strategy. The recovery energy is stored in the accumulator during returning phases of a pressing cycle. The maximum theoretical recoverable energy from the spring is defined in Equation (6).
E r e c o _ max = E p , s p E p , s l = 1 2 K x 2 m g h
In Equation (6), Ep,sp is the potential energy of the spring and Ep,sl is the potential energy of the slider, K is the stiffness of the spring, x is the displacement of the slider, m is mass of the slider, g is the gravity of acceleration, and the height of the slider is h.
During the recovering phase, the energy of the accumulator consists of recovery energy of the load and the supplying energy from the pump. Therefore, the supplying energy should be estimated in order to calculate the value of recovery energy, via the energy recovery factor (RF), as expressed in Equation (7):
R F = E r e c o v e r E r e c o max = ( E f i n a c E int a c E m E p , s p ) μ m E r e c o max
In Equation (7), Efin-ac and Eint-ac are the hydraulic energy of the accumulator at the final and beginning states, respectively. Electric motor efficiency μm is selected as 1 in this study. Erecover is the hydraulic energy that is recovered and stored in the accumulator. Efin-ac and Eint-ac are estimated by using Equation (1) with different conditions.
For partial recovery applications, the energy recovery factor of the system versus pre-charge pressure and volume of the accumulator is described in Figure 15, in which the setting value of the relief valve in the hydraulic circuit is 200 bar and that value is not increased because it depends on type of the pump. It is revealed that the RF varies, and it reaches the high value about 0.6 when pre-charge pressure of the accumulator is 60 bar. These values are reduced when the pre-charge pressure is too high or that is too low. When it is set too low, the slider goes very fast. When the pre-charge pressure is increased, the operating pressure of the system is increased and reaches the setting pressure of the relief valve. Moreover, when the volume of the accumulator increases, the recovery factor is also increased and vice versa. It is observed that the effect of the pre-charge pressure to the energy recovery factor is higher than the effect of the volume.

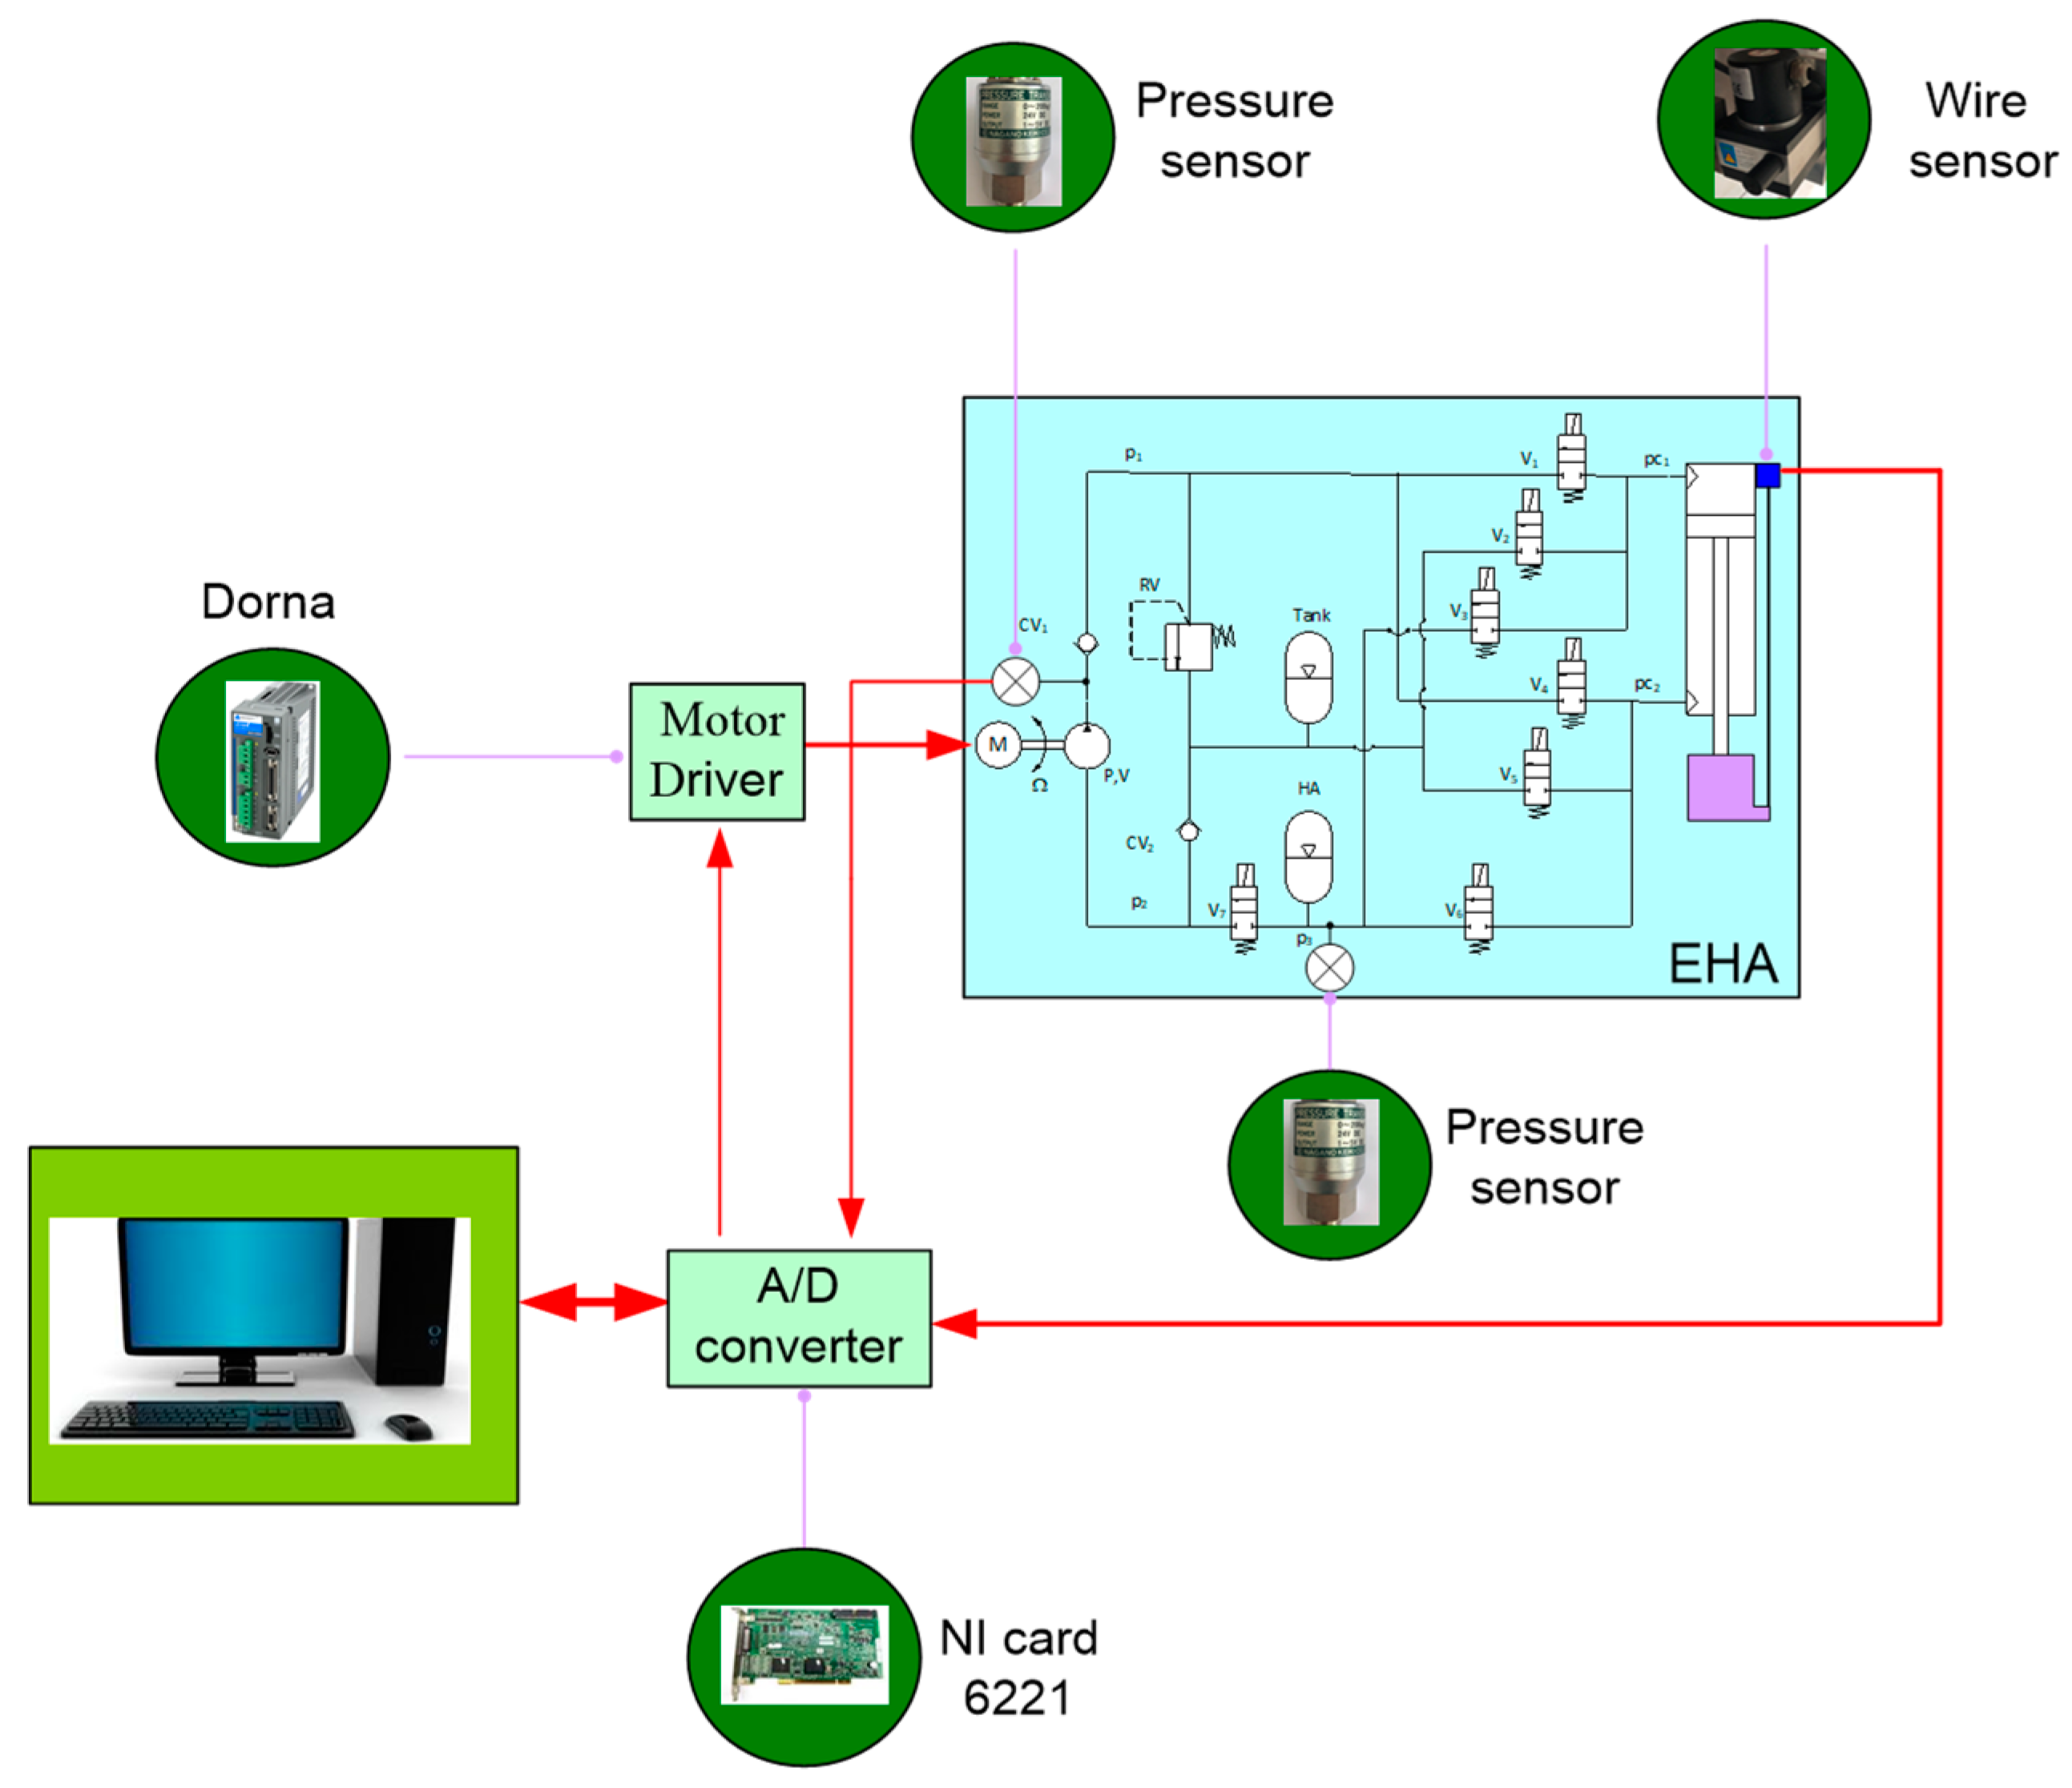
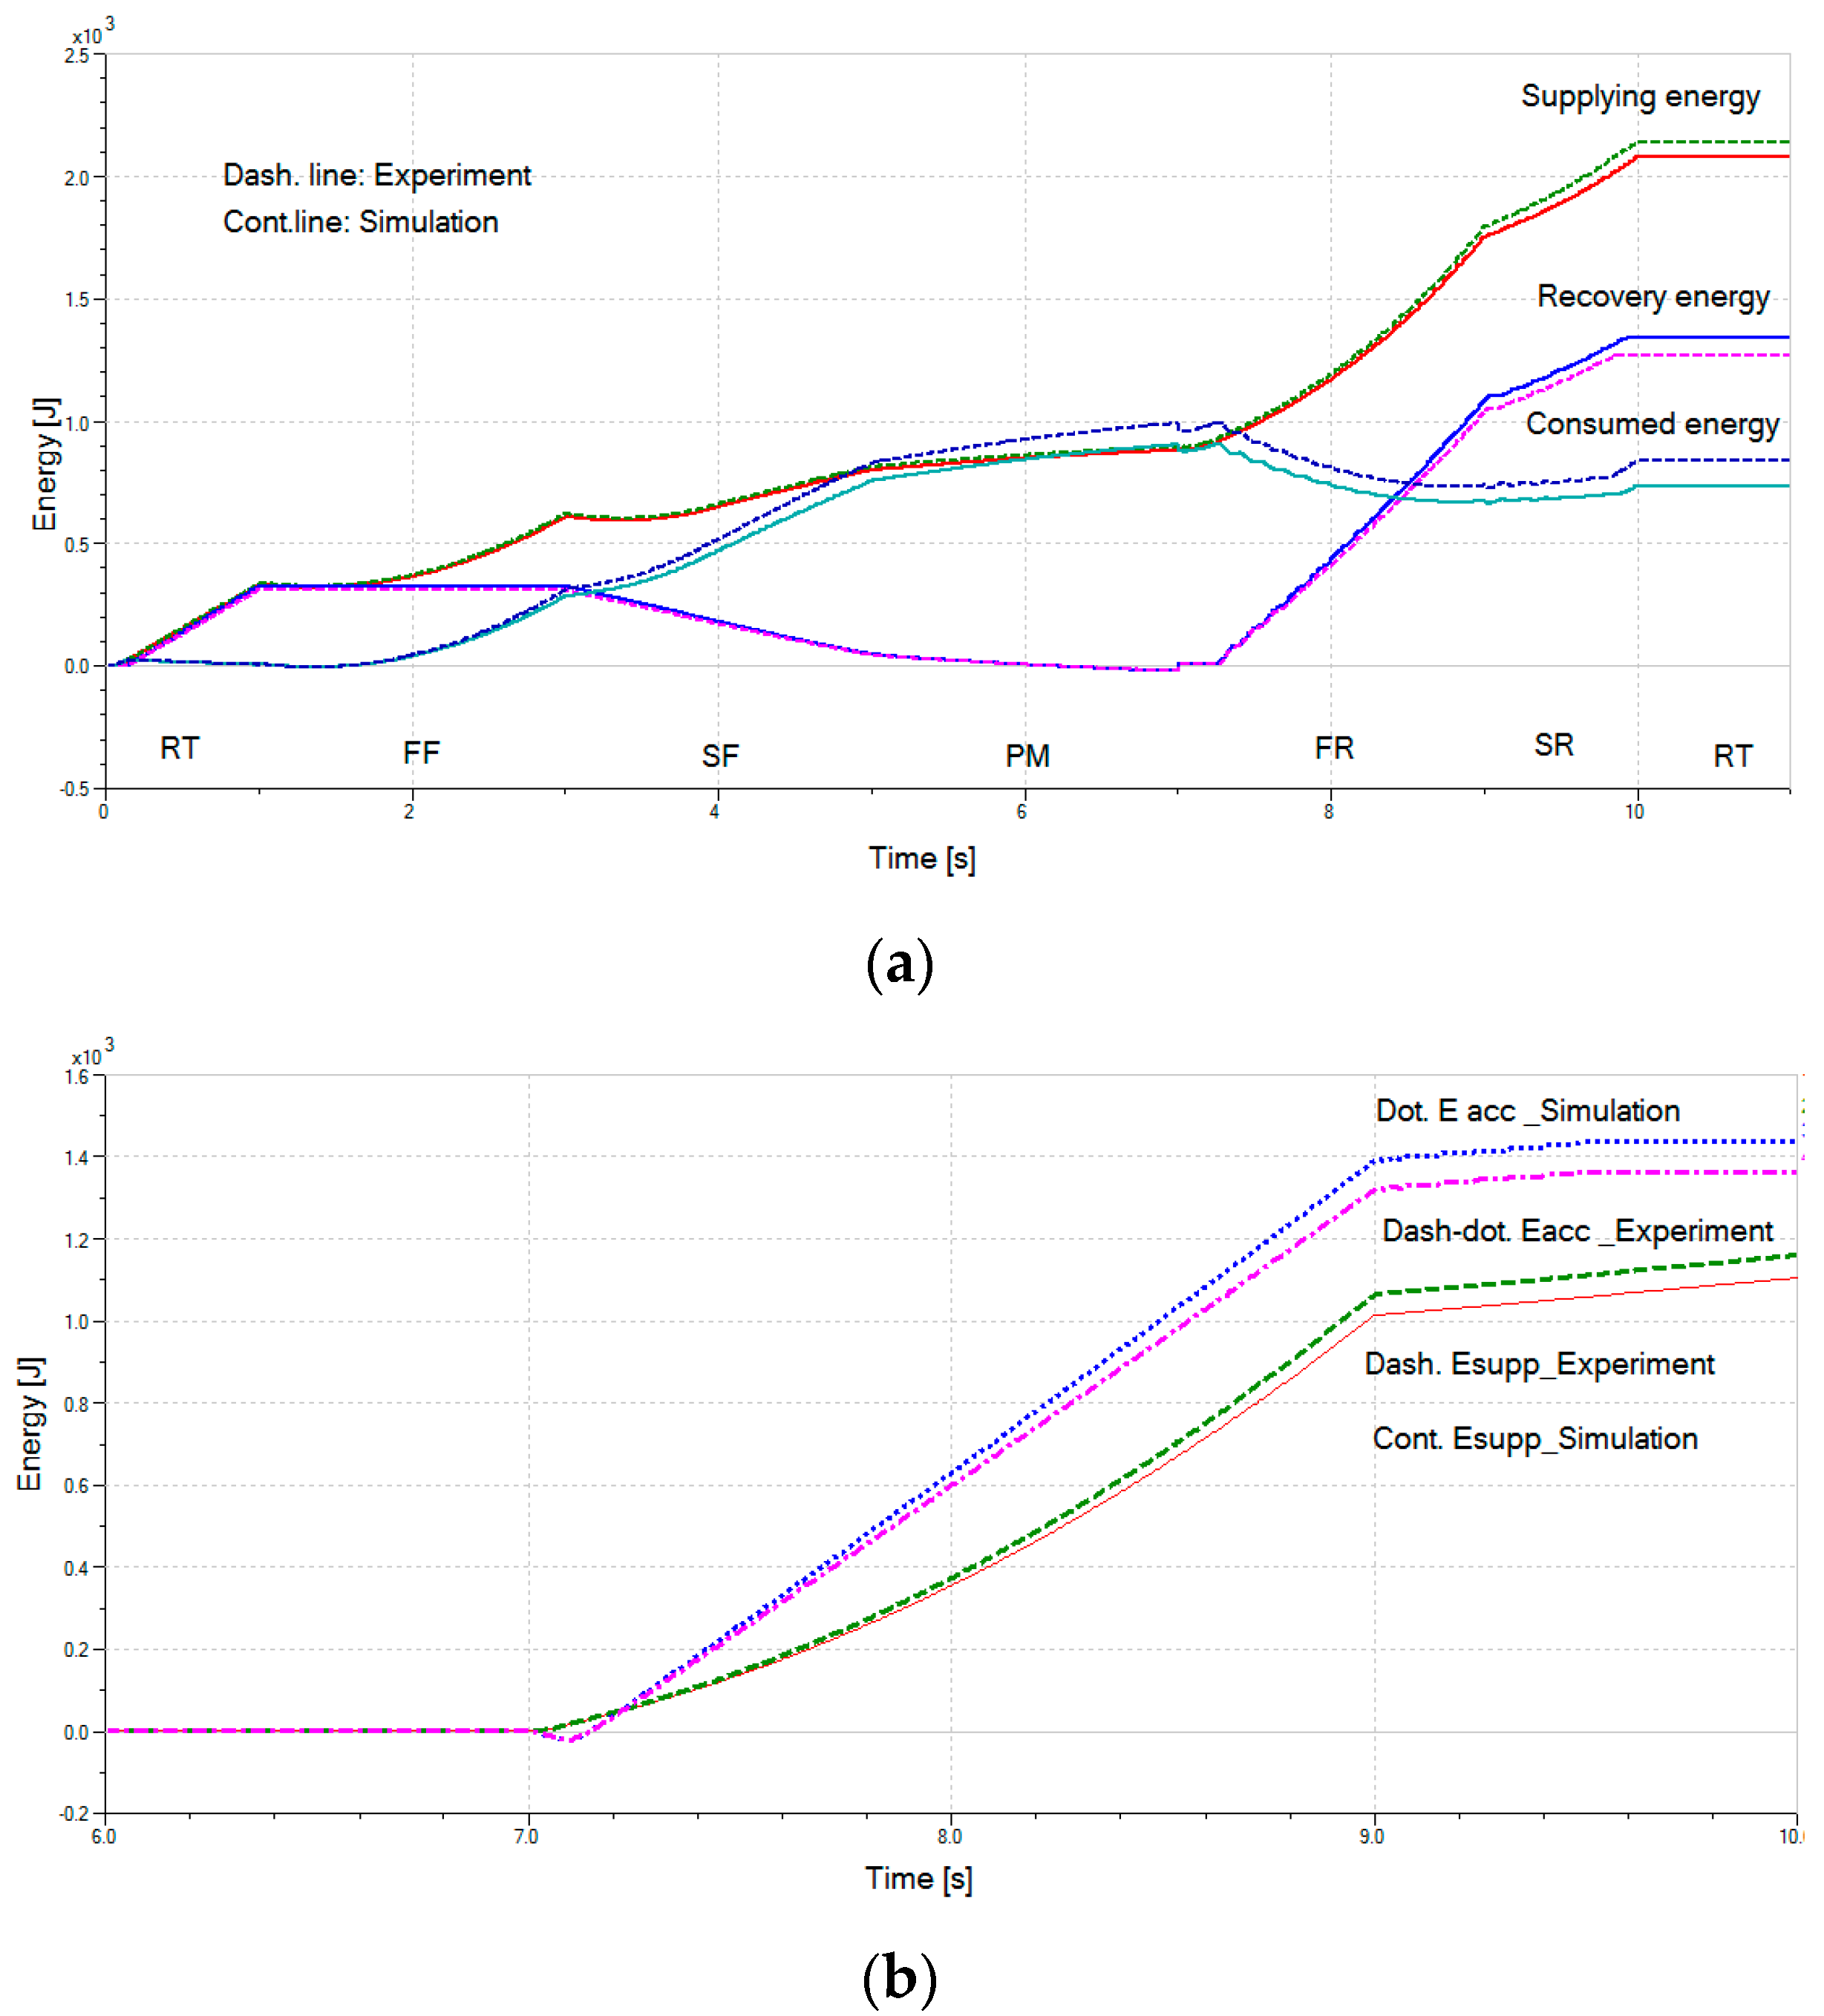
5. Experimental Results

For the purpose of verifying the analysis results from the model, a prototype of the developed hydraulic system is set up as shown in Figure 16 and the structure of the experimental model is described in Figure 17. In which the position of the hydraulic cylinder is measured by a wire sensor meanwhile the two pressure sensors type KH-15 manufactured by Nagano Keiki are employed to measure the pressure at the outlet of the pump and inlet of the accumulator. The speed sensor and torque transducer are SETech products. All of the data from the sensors are transmitted to the personal computer (PC) through NI card 6221 worked as an A/D converter. In addition, the fixed displacement bidirectional van pump is driven by the AC servo motor. The signal from the PC can be sent to the motor driver through the converter for aiming the adjustment of the motor’s speed according to wanted working condition.
In the same manner of the operation of the simulation model, the real position response of the slider is compared with that measured from the simulation model as shown in Figure 18a. It is noteworthy that the experimental result is in good in agreement with the position error of approximately 1.5 mm in PM phase. Although the pressure response obtained from the experimental appears as the oscillation, it almost tracks well the reference. This oscillating phenomenon is affected by the elasticity of the line system, which indicates that the oscillation of the pressure curve can be reduced according to the increase in the compressibility of the line system. Indeed, installing the accumulator on the return line leads to the elasticity of this line increased. The result is the oscillation of the pressure P3 (plotted by the dashed line in Figure 18c) reduced compared with that of the pressure at the outlet of the pump (denoted by the dashed line in Figure 18b).
The speed and torque of the pump for PS control strategy by simulation and experiment are shown in Figure 19. It is observed that, both the simulated and measured speed are affected when the system changes its phases. At the beginning of SF phase, torque of the motor is negative because pressure of the inlet port is higher that of the outlet port of the pump. That phenomenal is a result of the phase change of the system from RNOM mode to RUNO mode. The value of motor torque is increased during FR phase and reached the highest value in SR phase due to pressure in the accumulator for recovery modes.
It is observed that, at the end of first cycle, the pressure of the accumulator of the ending is higher than that of the beginning as shown in Figure 18c because recovery energy in returning phases is stored in the accumulator. The speed of the pump at the beginning and the ending is different, as shown in Figure 19a, because the system charges the accumulator in a second for first cycle. Therefore, only position of the cylinder is repetitive cycle instead of any system parameter such as pressure of the accumulator or speed of the pump. For overcoming this phenomenon, a charging accumulator strategy or a power management for the total cycle should be added in next study.
The energy of the system in simulation and experiment for the pressing cycle is described in Figure 20a. The supplying energy is calculated by indirectly measured torque and speed of the motor. It is observed that, there are errors in simulation and measured values for supplying, recovery and consumed energy, in which the value of measured supplying energy is higher than that of the simulation one. While the value of measured recovery energy is lower than that of the simulation one. As a result, the measured consumed energy is higher than that of the simulation one. It is observed that, the system consumes about 770 J while that value in simulation is about 700 J to finish this cycle.
For this system, only the PS strategy is able to recover energy by using the accumulator. The supplying energy and accumulator energy of the system during returning phases are described in Figure 20b. From the figure, the energy of the accumulator in simulation (plotted by the dot. line) is higher than that of experiment (plotted by the dashed-dot. line). While the supplied energy of the system in simulation (plotted by the dashed line) is lower than that of experiment. The simulation supplied energy is 1100 J but that value in measured is 1160 J. Therefore, error between the experiment and the simulation result is about 5%. While values of accumulator energy for simulation and measured are 1435 J and 1364 J, respectively. As a result, value RF of the system in experiment is about 50%, which implies that measured RF value is lower than that of simulation about 8%.

6. Conclusions

A novel reconfiguration energy saving hydraulic system is proposed and investigated in this paper. Control strategies are suggested for the system and are brought into analysis. Advantages of the system are energy recovery and high velocity or force factor. In a given profile, the proposed system is saving about 20% consumed energy when compared with a typical without energy recovery EHA system. That saving energy ability is due to external load is recoverable. In this study, about 50% of energy from the opposite load is recovered and this value depends on relationship pre-charge pressure of the accumulator and value of the load.
Besides, the velocity of the cylinder is twice higher than that value of a typical EHA system with the same size of hydraulic equipment, while the torque at the shaft of the pump is lower than that of an EHA system to yield the same output force of hydraulic cylinder. Which implies that the size of hydraulic pump and power of electric motor are reduced over that in a EHA system.
Through experimental verifying, high nonlinearities of a hydraulic system are well designed by using AMESim model. Although the system still has some notches when the valves shift, this value is kept low and acceptable in applications such as industrial presses where energy saving is the dominant consideration. Furthermore, the closed loop controller for the tracking position should be added to improve the dynamic response as well the accuracy of the system.

Author Contributions

Conceptualization, T.H.H.; methodology, T.D.L. and T.H.H.; software, T.H.H.; validation, T.H.H.; formal analysis, T.H.H.; investigation, T.D.L.; resources, T.H.H.; data curation, T.D.L.; writing—original draft preparation, T.D.L. and T.H.H.; writing—review and editing, T.D.L.; visualization, T.D.L. and T.H.H.; supervision, T.D.L. and T.H.H. All authors have read and agreed to the published version of the manuscript.

Funding

This research is funded by Vietnam National University Ho Chi Minh City (VNU-HCM) under grant number C2018-20-03. We acknowledge the support of time and facilities from Ho Chi Minh City University of Technology (HCMUT), VNU-HCM for this study.

Institutional Review Board Statement

No applicable.

Informed Consent Statement

No applicable.

Data Availability Statement

No applicable.

Conflicts of Interest

The authors declare no conflict of interest.

References

  1. Manring, N.D.; Fales, R.C. Hydraulic Control System, 2nd ed.; Wiley: Hoboken, NJ, USA, 2020. [Google Scholar]
  2. Zhao, K.; Liu, Z.; Yu, S.; Li, X.; Huang, H.; Li, B. Analytical energy dissipation in large and medium-sized hydraulic press. J. Clean. Prod. 2015, 103, 908–915. [Google Scholar] [CrossRef]
  3. Gao, M.; He, K.; Li, L.; Wang, Q. A Review on Energy Consumption, Energy Efficiency and Energy Saving of Metal Forming Processes from Different Hierarchies. Processes 2019, 7, 357. [Google Scholar] [CrossRef] [Green Version]
  4. Liu, Z.; Wang, Y.; Huang, H.; Li, X.; Li, L.; Zhou, D. An Energy Matching Method for Hydraulic Press Group Based on Operation Load Profile. Procedia CIRP 2016, 48, 219–223. [Google Scholar] [CrossRef] [Green Version]
  5. Li, L.; Huang, H.; Zhao, F.; Sutherland, J.W.; Liu, Z. An Energy-Saving Method by Balancing the Load of Operations for Hydraulic Press. IEEE/ASME Trans. Mechatron. 2017, 22, 2673–2683. [Google Scholar] [CrossRef]
  6. Liu, Z.; Huang, H.; Zhao, F.; Li, L.; Liu, Z. An Improved Energy-Saving Design Method for Drive System with Multi Motor-Pumps by Using Genetic Algorithm. Procedia CIRP 2019, 80, 79–83. [Google Scholar]
  7. Song, W.; Liu, S.; Pan, H.; Zhu, S. Investigation on the design of hydraulic high-speed punching press with a large press force and a long press stroke. Adv. Mech. Eng. 2016, 8, 1–12. [Google Scholar] [CrossRef] [Green Version]
  8. Yao, J.; Lu, B.; Zhang, C.; Sadatomi, M. Optimal Design of Hydraulic System for an Industrial Press Machine for Performance Improvement and Noise Reduction. Open J. Mech. Eng. 2013, 1, 1–16. [Google Scholar]
  9. Vacca, A.; Franzoni, G. Hydraulic Fluid Power; Wiley: Hoboken, NJ, USA, 2021; pp. 379–413. [Google Scholar]
  10. Ligang, H.; Yu, T.; Jio, Z.; Li, Y. Active Load-Sensitive Electro-Hydrostatic Actuator for More Electric Aircraft. Appl. Sci. 2020, 10, 6978. [Google Scholar]
  11. Casoli, P.; Scolari, P.; Minav, T.; Rundo, M. Comparative Energy Analysis of a Load Sensing System and a Zonal Hydraulics for a 9-Tonne Excavator. Actuators 2020, 9, 39. [Google Scholar] [CrossRef]
  12. Lovrec, D.; Kastrevc, M.; Ulaga, M. Ectro hydraulic load sensing with a speed controlled hydraulic supply system on forming machines. Int. J. Adv. Manuf. Technol. 2008, 41, 1066–1075. [Google Scholar] [CrossRef]
  13. Huova, M.; Aalto, A.; Linjama, M.; Huhtala, K. Study of Energy Losses in Digital Hydraulic Multi-Pressure Actuator. In Proceedings of the 15th Scandinavian International Conference on Fluid Power, SICFP’17, Linköping, Sweden, 7–9 June 2017; pp. 214–223. [Google Scholar]
  14. Heybroek, K.; Sahlman, M. A hydraulic hybrid excavator based on multi-chamber cylinders and secondary control—Design and experimental validation. Int. J. Fluid Power 2018, 19, 91–105. [Google Scholar] [CrossRef]
  15. Kalaiarassan, G.; Krishnamurthy, K. Digital hydraulic single-link trajectory tracking control through flow-based control. Meas. Control 2019, 52, 775–787. [Google Scholar] [CrossRef]
  16. Sell, P.N.; Johnston, D.N.; Plummer, A.R.; Kudzma, S. Control of a fast switching valve for digital hydraulics. In Proceedings of the 13th Scandinavian International Conference on Fluid Power, SICFP2013, Linköping, Sweden, 3–5 June 2013; pp. 497–503. [Google Scholar]
  17. Pourmovahed, A.; Beachey, N.; Fronczak, F. Modeling of a Hydraulic Energy Regeneration System—Part I: Analytical Treatment. ASME 1992, 114, 155–159. [Google Scholar]
  18. Kim, C.S.; Lee, C.O. Speed control of an overcenetered variable displacement hydraulic motor with a load torque observer. Control. Eng. Pract. 1996, 4, 1563–1570. [Google Scholar] [CrossRef]
  19. Guo, M.; Wang, L.; Jia, Z.; Liang, J. Wang Application of Hydraulic Transformer on Energy Saving for Boom System of Hybrid Hydraulic Excavator. Appl. Mech. Mater. 2017, 868, 118–123. [Google Scholar]
  20. Lee, S.; Li, Y.P. A Hardware-In-The-Loop (HIL) Testbed for Hydraulic Transformers Research. In Proceedings of the SICFP2017, Linköping, Sweden, 7–9 June 2017; pp. 179–185. [Google Scholar]
  21. Alle, N.; Hiremath, S.S.; Makaram, S.; Subramaniam, K.; Talukdar, A. Review on electro hydrostatic actuator for flight control. Intern. J. Fluid Power 2016, 17, 125–145. [Google Scholar]
  22. Du, C.; Plummer, A.R.; Johnston, D.N. Performance analysis of an energy-efficient variable supply pressure electro-hydraulic motion control system. Control. Eng. Pract. 2016, 48, 10–21. [Google Scholar] [CrossRef]
  23. Hagen, D.; Padovani, D.; Choux, M. A Comparison Study of a Novel Self-Contained Electro-Hydraulic Cylinder versus a Conventional Valve—Controlled Actuator—Part 1: Motion Control. Actuators 2019, 8, 79. [Google Scholar] [CrossRef] [Green Version]
  24. Sharghi, A.H.; Mohammadi, R.K.; Farrokh, M.; Zolfagharysaravi, S. Feed-Forward Controlling of Servo-Hydraulic Actuators Utilizing a Least-Squares Support—Vector Machine. Actuators 2020, 9, 11. [Google Scholar] [CrossRef] [Green Version]
  25. Wang, L.; Book, W.J.; Huggins, J.D. Application of Singular Perturbation Theory to Hydraulic Pump Controlled Systems. IEEE/ASME Trans. Mechatron. 2012, 17, 251–259. [Google Scholar] [CrossRef]
  26. Lin, Y.; Shi, Y.; Burton, R. Modeling and Robust Discrete-Time Sliding-Mode Control Design for a Fluid Power Electrohydraulic Actuator (EHA) System. IEEE/ASME Trans. Mechatron. 2013, 18, 1–10. [Google Scholar] [CrossRef]
  27. Guzzella, L.; Sciarretta, A. Vehicle Propulsion Systems: Introduction to Modeling and Optimization; Springer: Berlin/Heidelberg, Germany, 2007. [Google Scholar]
  28. Jaiswal, S.; Sopanen, J.; Mikkola, A. Efficiency comparison of various friction models of a hydraulic cylinder in the framework of multibody system dynamics. Nonlinear Dyn. 2021, 104, 3497–3515. [Google Scholar] [CrossRef]
  29. Tran, X.B.; Yanada, H. Dynamic Friction Behaviors of Pneumatic Cylinders. Intell. Control Autom. 2013, 4, 180–190. [Google Scholar] [CrossRef] [Green Version]
  30. Dulger, C.L.; Kirecci, A. Motion Control and Implementation for an AC Servomotor System. Model. Simul. Eng. 2007, 2007, 50586. [Google Scholar] [CrossRef]
  31. Wu, Y.; Wang, Z.; Li, Y.; Chen, W.; Du, R.; Chen, Q. Characteristic Modeling and Control of Servo Systems with Backlash and Friction. Math. Probl. Eng. 2014, 2014, 328450. [Google Scholar] [CrossRef]
  32. Sheng, H.W.; Wei, L.C.; Lo, H.P.; Shiuh, Y.S. Precision Control and Compensation of Servomotors and Machine Tools via the Disturbance Observer. IEEE Trans. Ind. Electron. 2009, 57, 420–431. [Google Scholar]
Figure 1. Proposed hydraulic system.
Actuators 10 00302 g001
Figure 2. (a) Normal-out mode. (b) Normal-in mode.
Actuators 10 00302 g002
Figure 3. Regenerative-out mode.
Actuators 10 00302 g003
Figure 4. (a) Recovery-in mode. (b) Recovery-out mode.
Actuators 10 00302 g004
Figure 5. (a) Reused normal-out mode; (b) reused normal-in mode; (c) reused regenerative-out mode.
Actuators 10 00302 g005
Figure 6. Charging accumulator mode.
Actuators 10 00302 g006
Figure 7. Unloading mode.
Actuators 10 00302 g007
Figure 8. Structure of controller.
Actuators 10 00302 g008
Figure 9. Diagram algorithm for selecting working mode.
Actuators 10 00302 g009
Figure 10. A typical pressing profile.
Actuators 10 00302 g010
Figure 11. AMESim model of the system.
Actuators 10 00302 g011
Figure 12. (a) Pump speed response in EHA mode; (b) cylinder velocity open response; (c) cylinder position open response; (d) pressure at pump ports; (e) torque at pump shaft.
Actuators 10 00302 g012aActuators 10 00302 g012b
Figure 13. (a) Pressure of the accumulator; (b) hydraulic volume of the accumulator.
Actuators 10 00302 g013
Figure 14. (a) Cylinder position response; (b) consumption energy of the system for the PS, NRS and EHA strategies; (c) energy flow of the system for PS strategy; (d) energy of the system in FR and SR phases of the cycle.
Actuators 10 00302 g014aActuators 10 00302 g014b
Figure 15. Energy recovery factor versus accumulator volume under the various pressure of the accumulator.
Actuators 10 00302 g015
Figure 16. First stage model.
Actuators 10 00302 g016
Figure 17. Block diagram of experimental model.
Actuators 10 00302 g017
Figure 18. (a) The time history of the position; (b) pressure at outlet of the pump; (c) pressure in the inlet of the accumulator.
Actuators 10 00302 g018
Figure 19. (a) Speed of the pump. (b) Torque of the pump.
Actuators 10 00302 g019
Figure 20. (a) Energy of the system; (b) the energy recovery of the system.
Actuators 10 00302 g020
Table 1. Working modes of the hydraulic system.
NoDefining Working ModesControl Vales
V1V2V3V4V5V6V7
1Normal-out mode (NOM)ONOFFOFFOFFONOFFOFF
2Normal-in mode (NIM)OFFONOFFONOFFOFFOFF
3Regenerative mode (RGOM)ONOFFOFFONOFFOFFOFF
4Recovery-out mode (RCOM)ONOFFOFFOFFOFFONOFF
5Recovery-in mode (RCIM)OFFOFFONONOFFOFFOFF
6Reused normal-out mode (RUNO)ONOFFOFFOFFONOFFON
7Reused normal-in mode (RUNI)OFFONOFFONOFFOFFON
8Reused regenerative mode (RURG)ONOFFOFFONOFFOFFON
9Charging accumulator mode (CAM)ONOFFONOFFOFFOFFOFF
10Unloading pump mode (ULM)ONONOFFOFFOFFOFFOFF
Table 2. Velocity and force factors of the system in different working modes.
NoWorking ModesCharacteristicsFactors
KVKF
1NOMHigh force
Low speed
K V 1 = 4 · V D π D 2 r 0 K F 1 = π D 2 r 0 4 · V D
2NIMLow force
High speed
K V 2 = 4 · V D π ( D 2 d 2 ) r 0 K F 2 = π ( D 2 d 2 ) r 0 4 · V D
3RGOMLow force
High speed
K V 3 = 4 · V D π d 2 r 0 K F 3 = π d 2 r 0 4 · V D
4RCOMEnergy recovery in extend directionKV1−KF1
5RCIMEnergy recovery in retract directionKV2−KF2
6RUNOThe highest force
Low speed
KV1 K F 6 = K F 1 ( p 1 p 1 p 2 )
7RUNIHigh force
High speed
KV2 K F 7 = K F 2 ( p 1 p 1 p 2 )
8RURGHigh force
High speed
KV3 K F 8 = K F 3 ( p 1 p 1 p 2 )
9CAMSharing power00
10ULMUnloading system00
Table 3. Required velocity factor and force factor of the system.
Requirement of FactorsPhase in the Pressing Cycle
RTFFSFPRFRSRRT
Phase number1234567
Velocity factor KV,minNOHIGHLOWLOWHIGHLOWNO
Force factor KF,minNOLOWHIGHHIGHLOWLOWNO
Table 4. Control strategies.
OrderPressing PhasesPSNRSEHA
KVKFWorking ModesKVKFWorking ModesKVKFWorking Modes
1RT00CAM00CAM00ULM
2FFKV3KF3RGOMKV3KF3RGOMKV1KF1NOM
3SFKV1KF6RUNOKV1KF6RUNOKV1KF1NOM
4PMKV1KF6RUNOKV1KF6RUNOKV1KF1NOM
5FRKV2-KF2RCIMKV2KF2NIMKV2KF2NIM
6SRKV2-KF2RCIMKV2KF2NIMKV2KF2NIM
7RT00ULM00ULM00ULM
Table 5. General characteristics of the three control strategies.
NoPressing PhaseCharacteristics of the Three Control Strategies
PSNRSEHA
1RTNo velocity, no force, low input powerNo velocity, no force, low input powerNo velocity, no force, no input power
2FFHigh velocity, low forceHigh velocity, low forceLow velocity, high force
3SFLow velocity, high force, low pump torqueLow velocity, high force, low pump torqueLow velocity, high force, high pump torque
4PMLow velocity, high force, low pump torqueLow velocity, high force, low pump torqueLow velocity, high force, high pump torque
5FREnergy recovery, high velocity, low forceNo energy recovery, high velocity, low forceNo energy recovery, high velocity, low force
6SREnergy recovery, high velocity, low forceNo energy recovery, high velocity, low forceNo energy recovery, high velocity, low force
7RTNo velocity, no force, no input powerNo velocity, no force, no input powerNo velocity, no force, no input power
Table 6. Parameters of the system.
NoEquipmentParametersValuesUnit
1Hydraulic pumpDisplacement (V)1.6 × 10⁻⁶m3/rad
Volumetric efficiency in pump modeas a function of speed end pressure-
Mechanical efficiency in pump mode
Volumetric efficiency in motor modeas a function of speed end pressure-
Mechanical efficiency in motor mode
Moment of inertia0.012kg·m2
2Hydraulic valveNominal flow rate 10−3m3/s
Sifting time20ms
3Hydraulic cylinderBore diameter D6 × 10−2m
Rod diameter d4.5 × 10−3m
Max Stroke0.3m
Dead volume at port 1 end5 × 10−5m3
Dead volume at port 2 end5 × 10−5m3
Leakage coefficient10−7m3/s/bar
4Hydraulic accumulator Pre-charge pressure60 × 105Pa
Volume6 × 10−3m3
5SliderMass 100kg
External load30kN
Viscous friction coefficient0.1N/(m/s)
Coulomb force250N
Stiction force800N
6SpringStiffness 12 × 104N/m
7Pipe Diameter 12.8 × 10⁻³m
Bulk modulus8 × 109Pa
Length0.5–1.5m
8Relief valveSetting pressure15MPa
Table 7. Parameters of pressing cycle.
Pressing PhasesRTFFSFPMFRSRRT
Phase numbers1234567
Period (second)1222211
External force (kN)003030000
Speed of the pump (rpm)
PS strategy500400800400900
NRS 500400800400900
EHA5008001600400900
Publisher’s Note: MDPI stays neutral with regard to jurisdictional claims in published maps and institutional affiliations.

