Humoral and Cell-Mediated Immune Response Validation in Calves after a Live Attenuated Vaccine of Babesia bigemina

 ,
,  , , , and
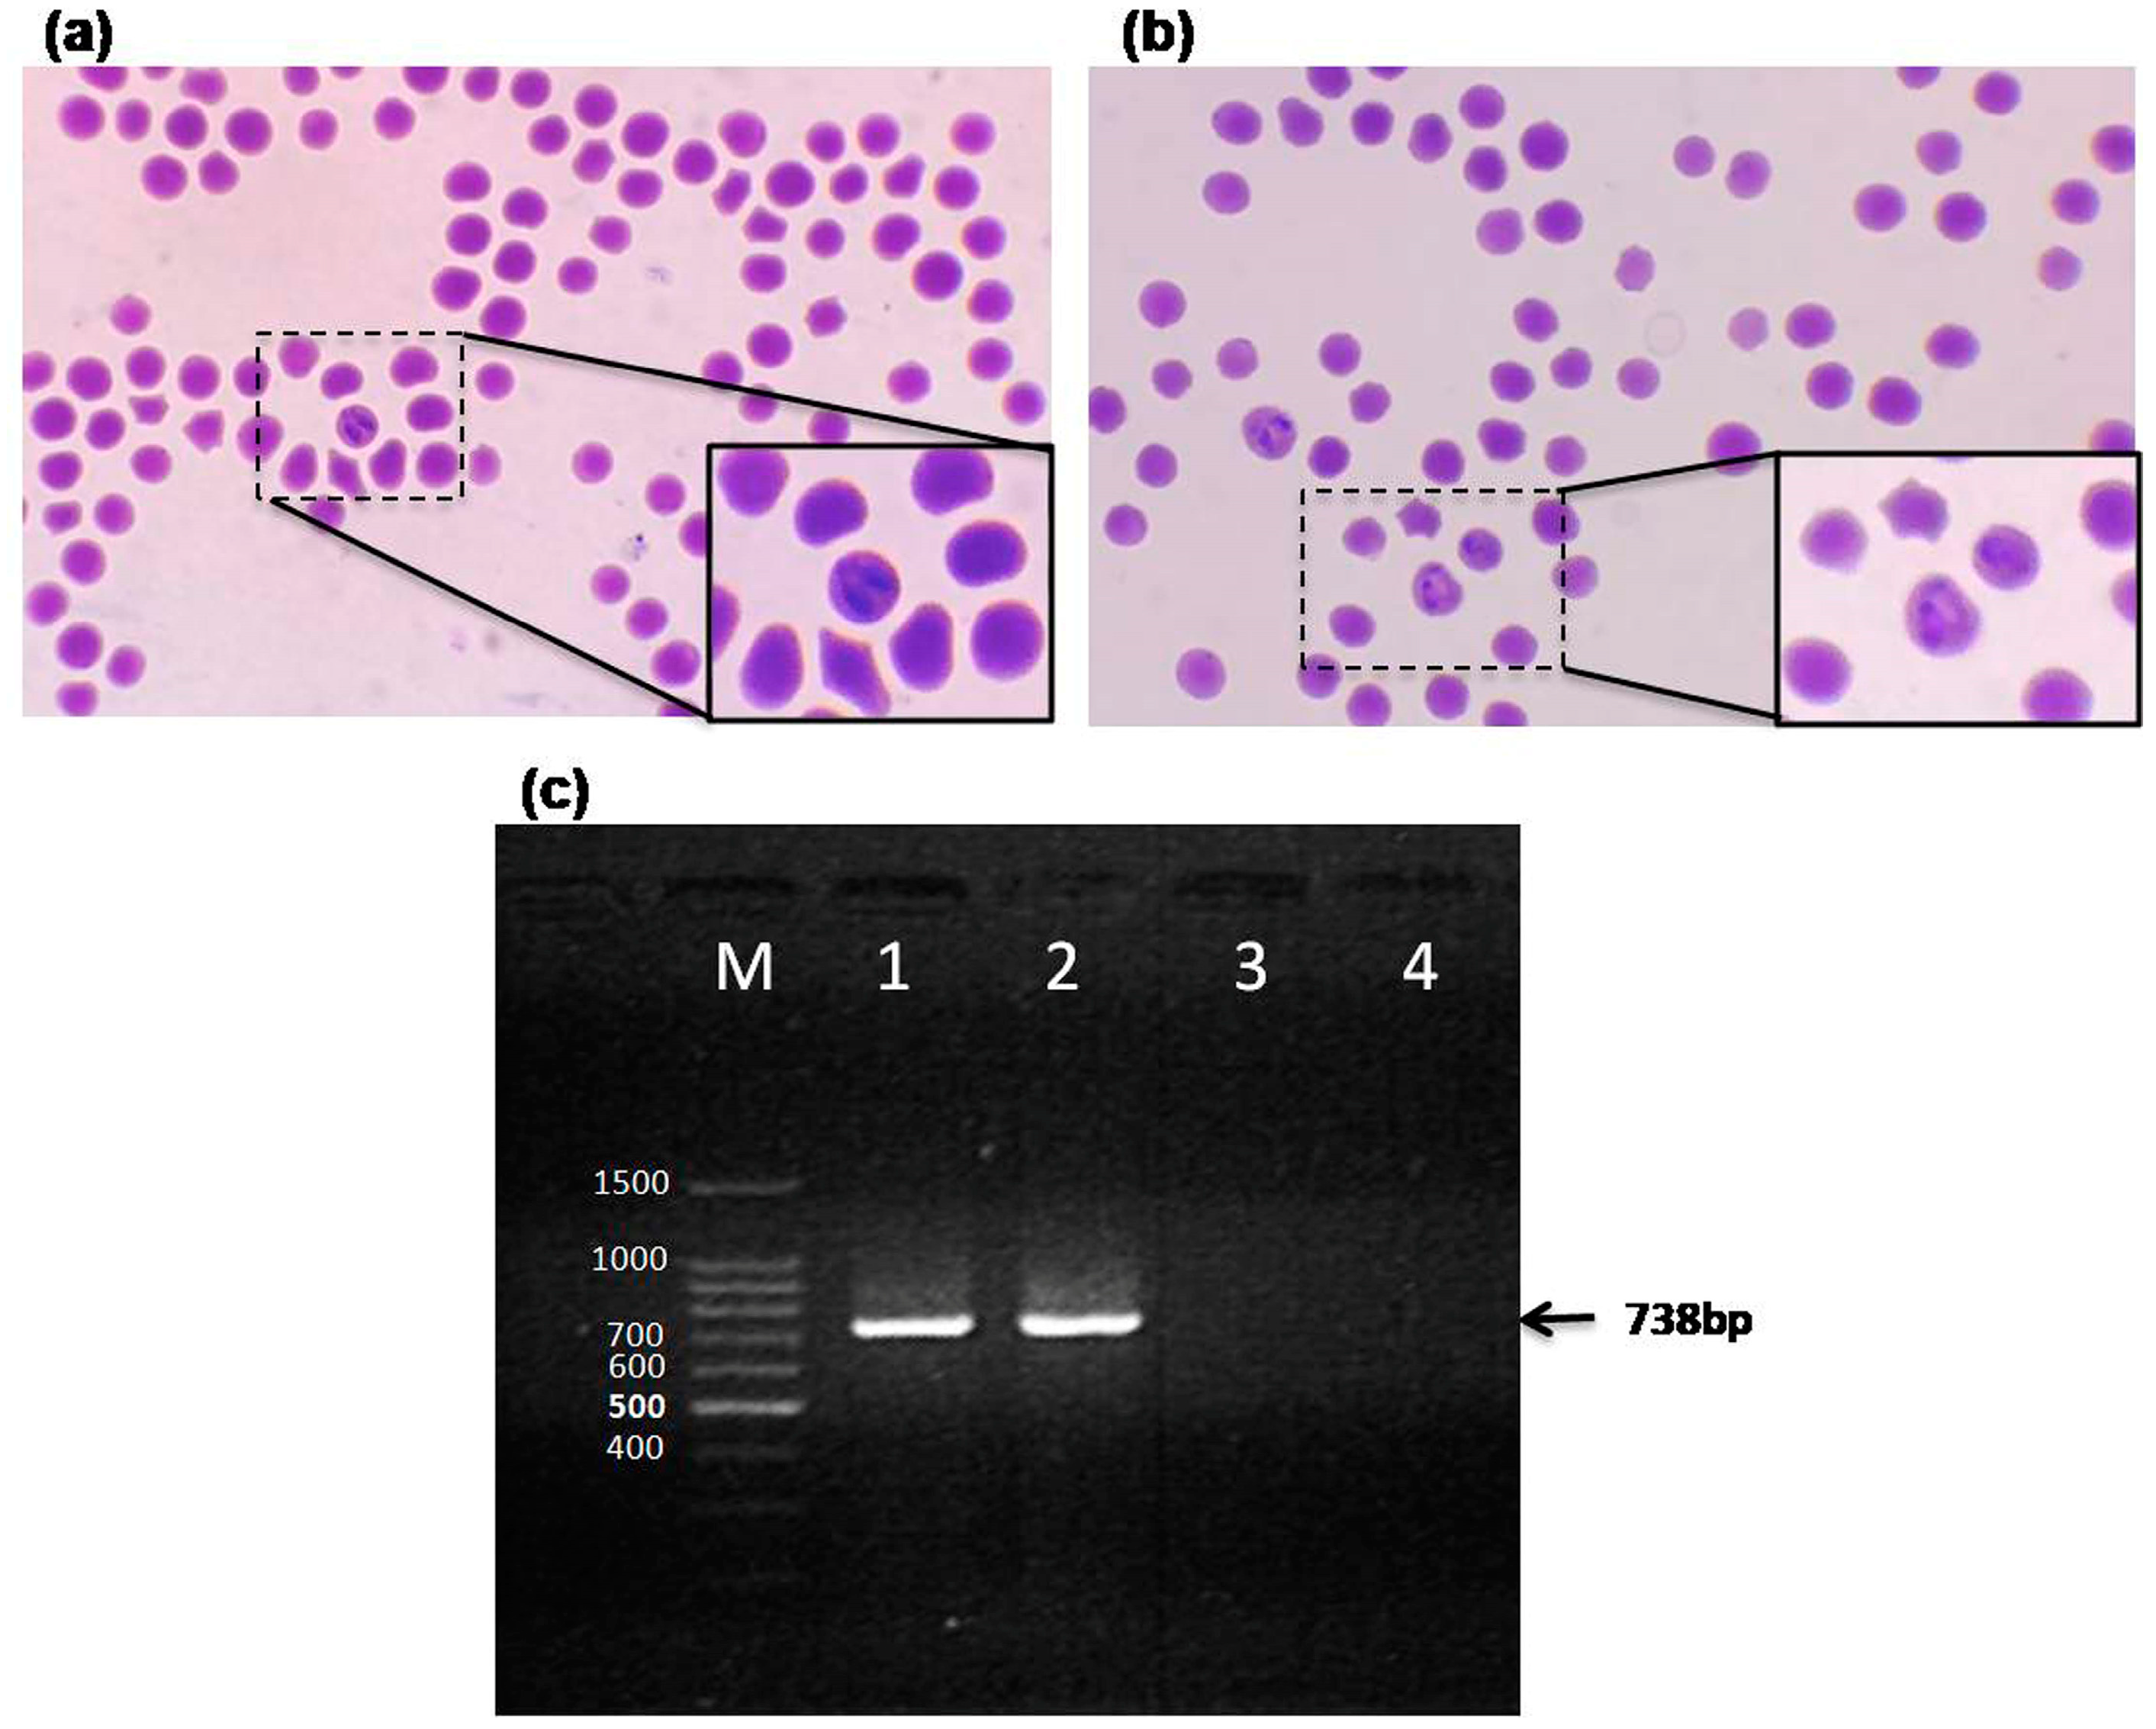
Abstract
1. Introduction
2. Materials and Methods
2.1. Ethical Statement
2.2. Source of Infection
2.3. Genomic DNA Extraction and PCR Assay
2.4. Attenuation of Local Strain and Vaccine Preparation
2.5. Animal Trial
2.6. Preparation of Native Antigens
2.7. Serology
2.8. Blood Cell Isolation for Flow Cytometry
2.9. Antibodies
2.10. Flow Cytometry
2.11. Statistical Analyses
3. Results
3.1. Microscopic and PCR Detection
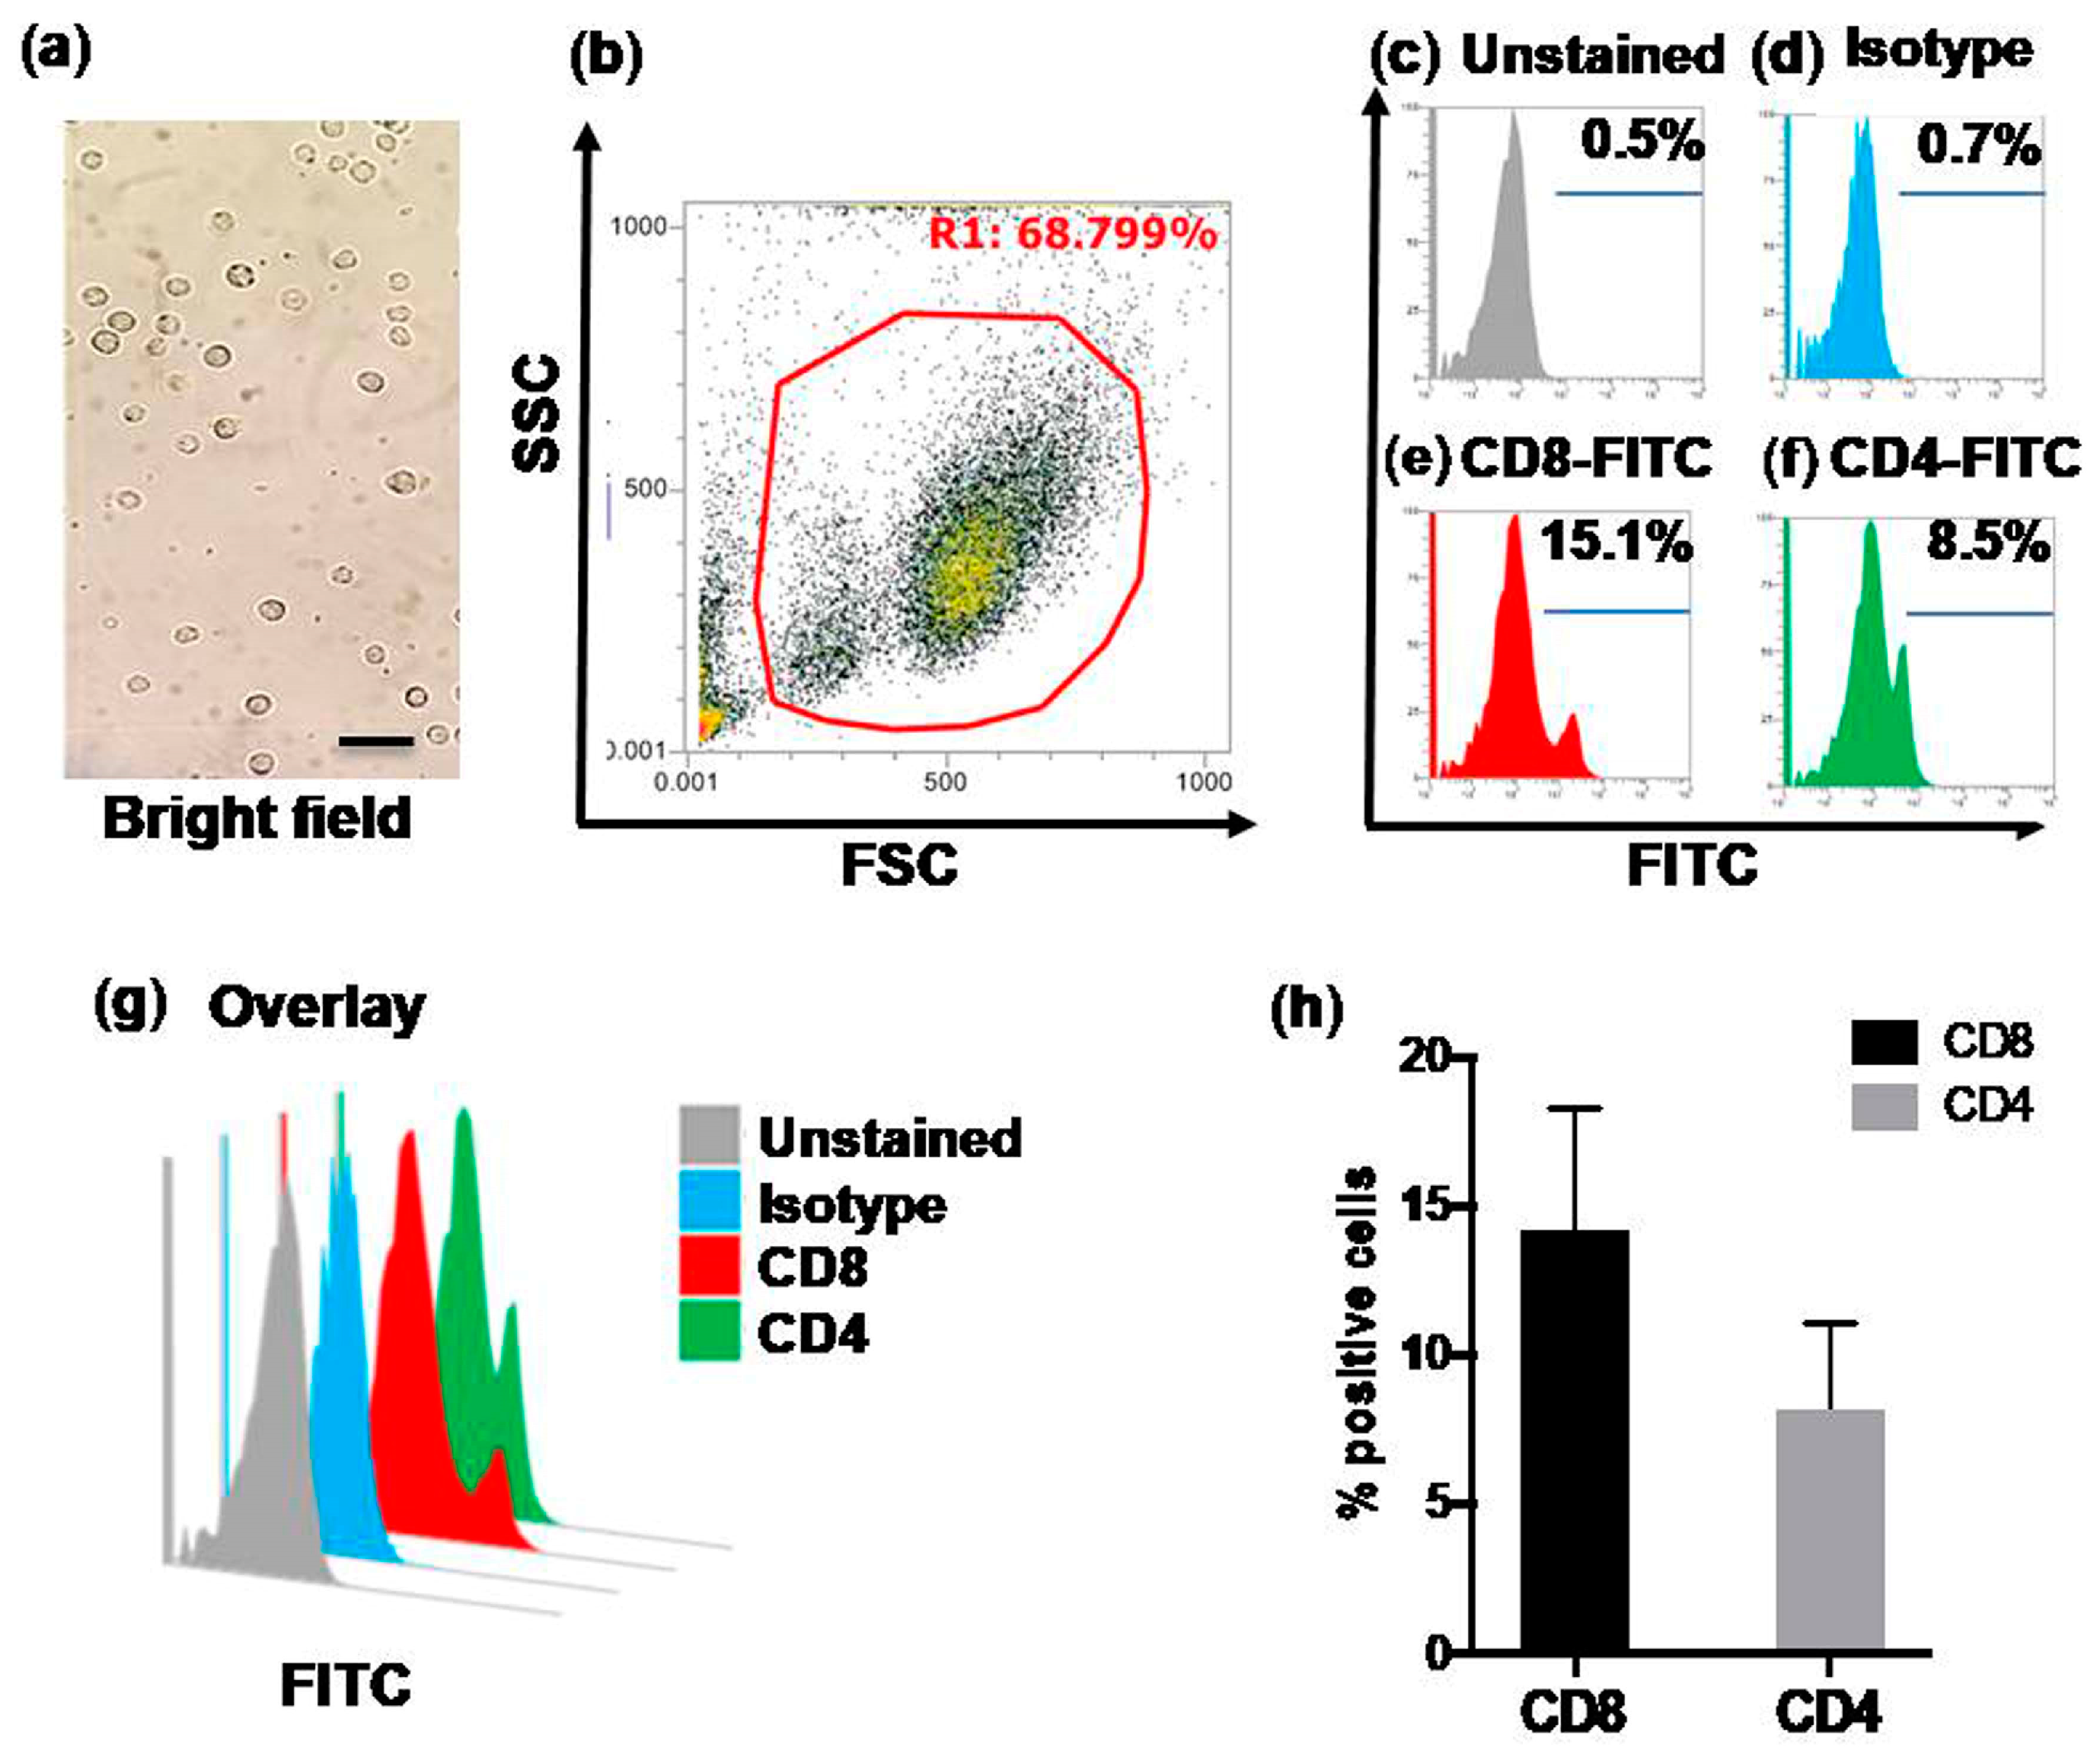
3.2. Flow Cytometric Quantification of CD4+ and CD8+ T Cells in Control Calves (Group-A)
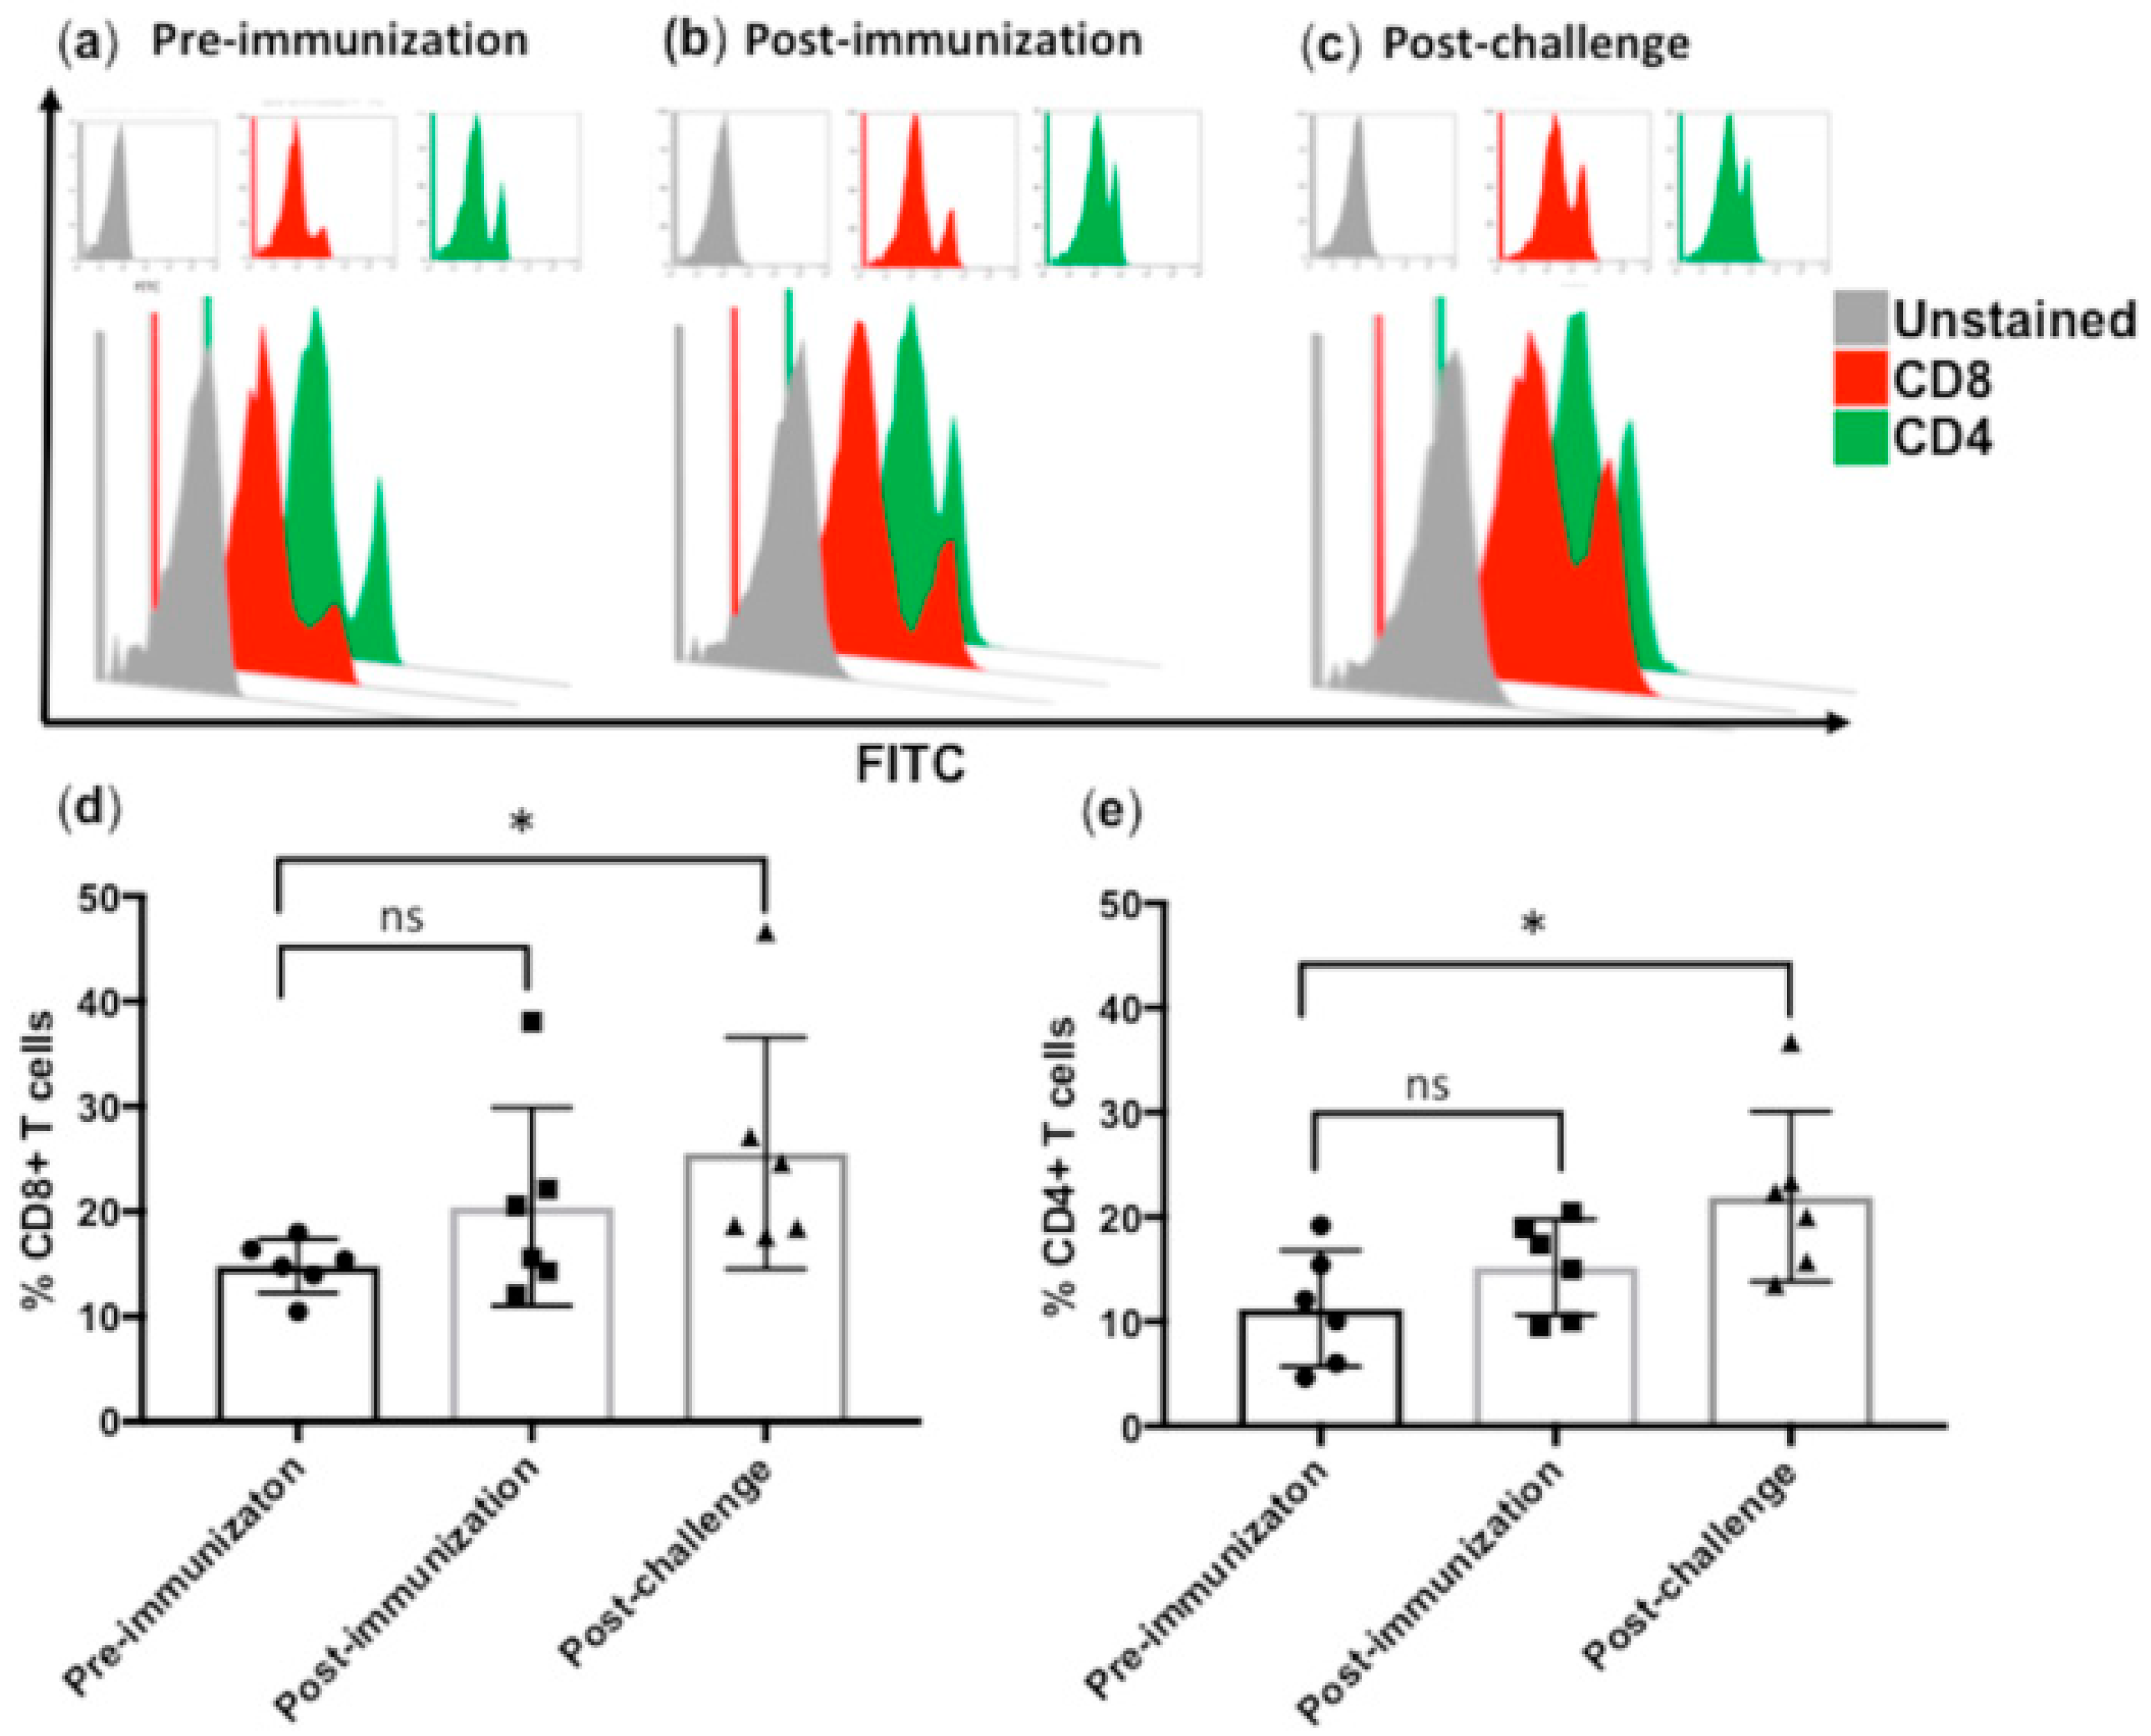
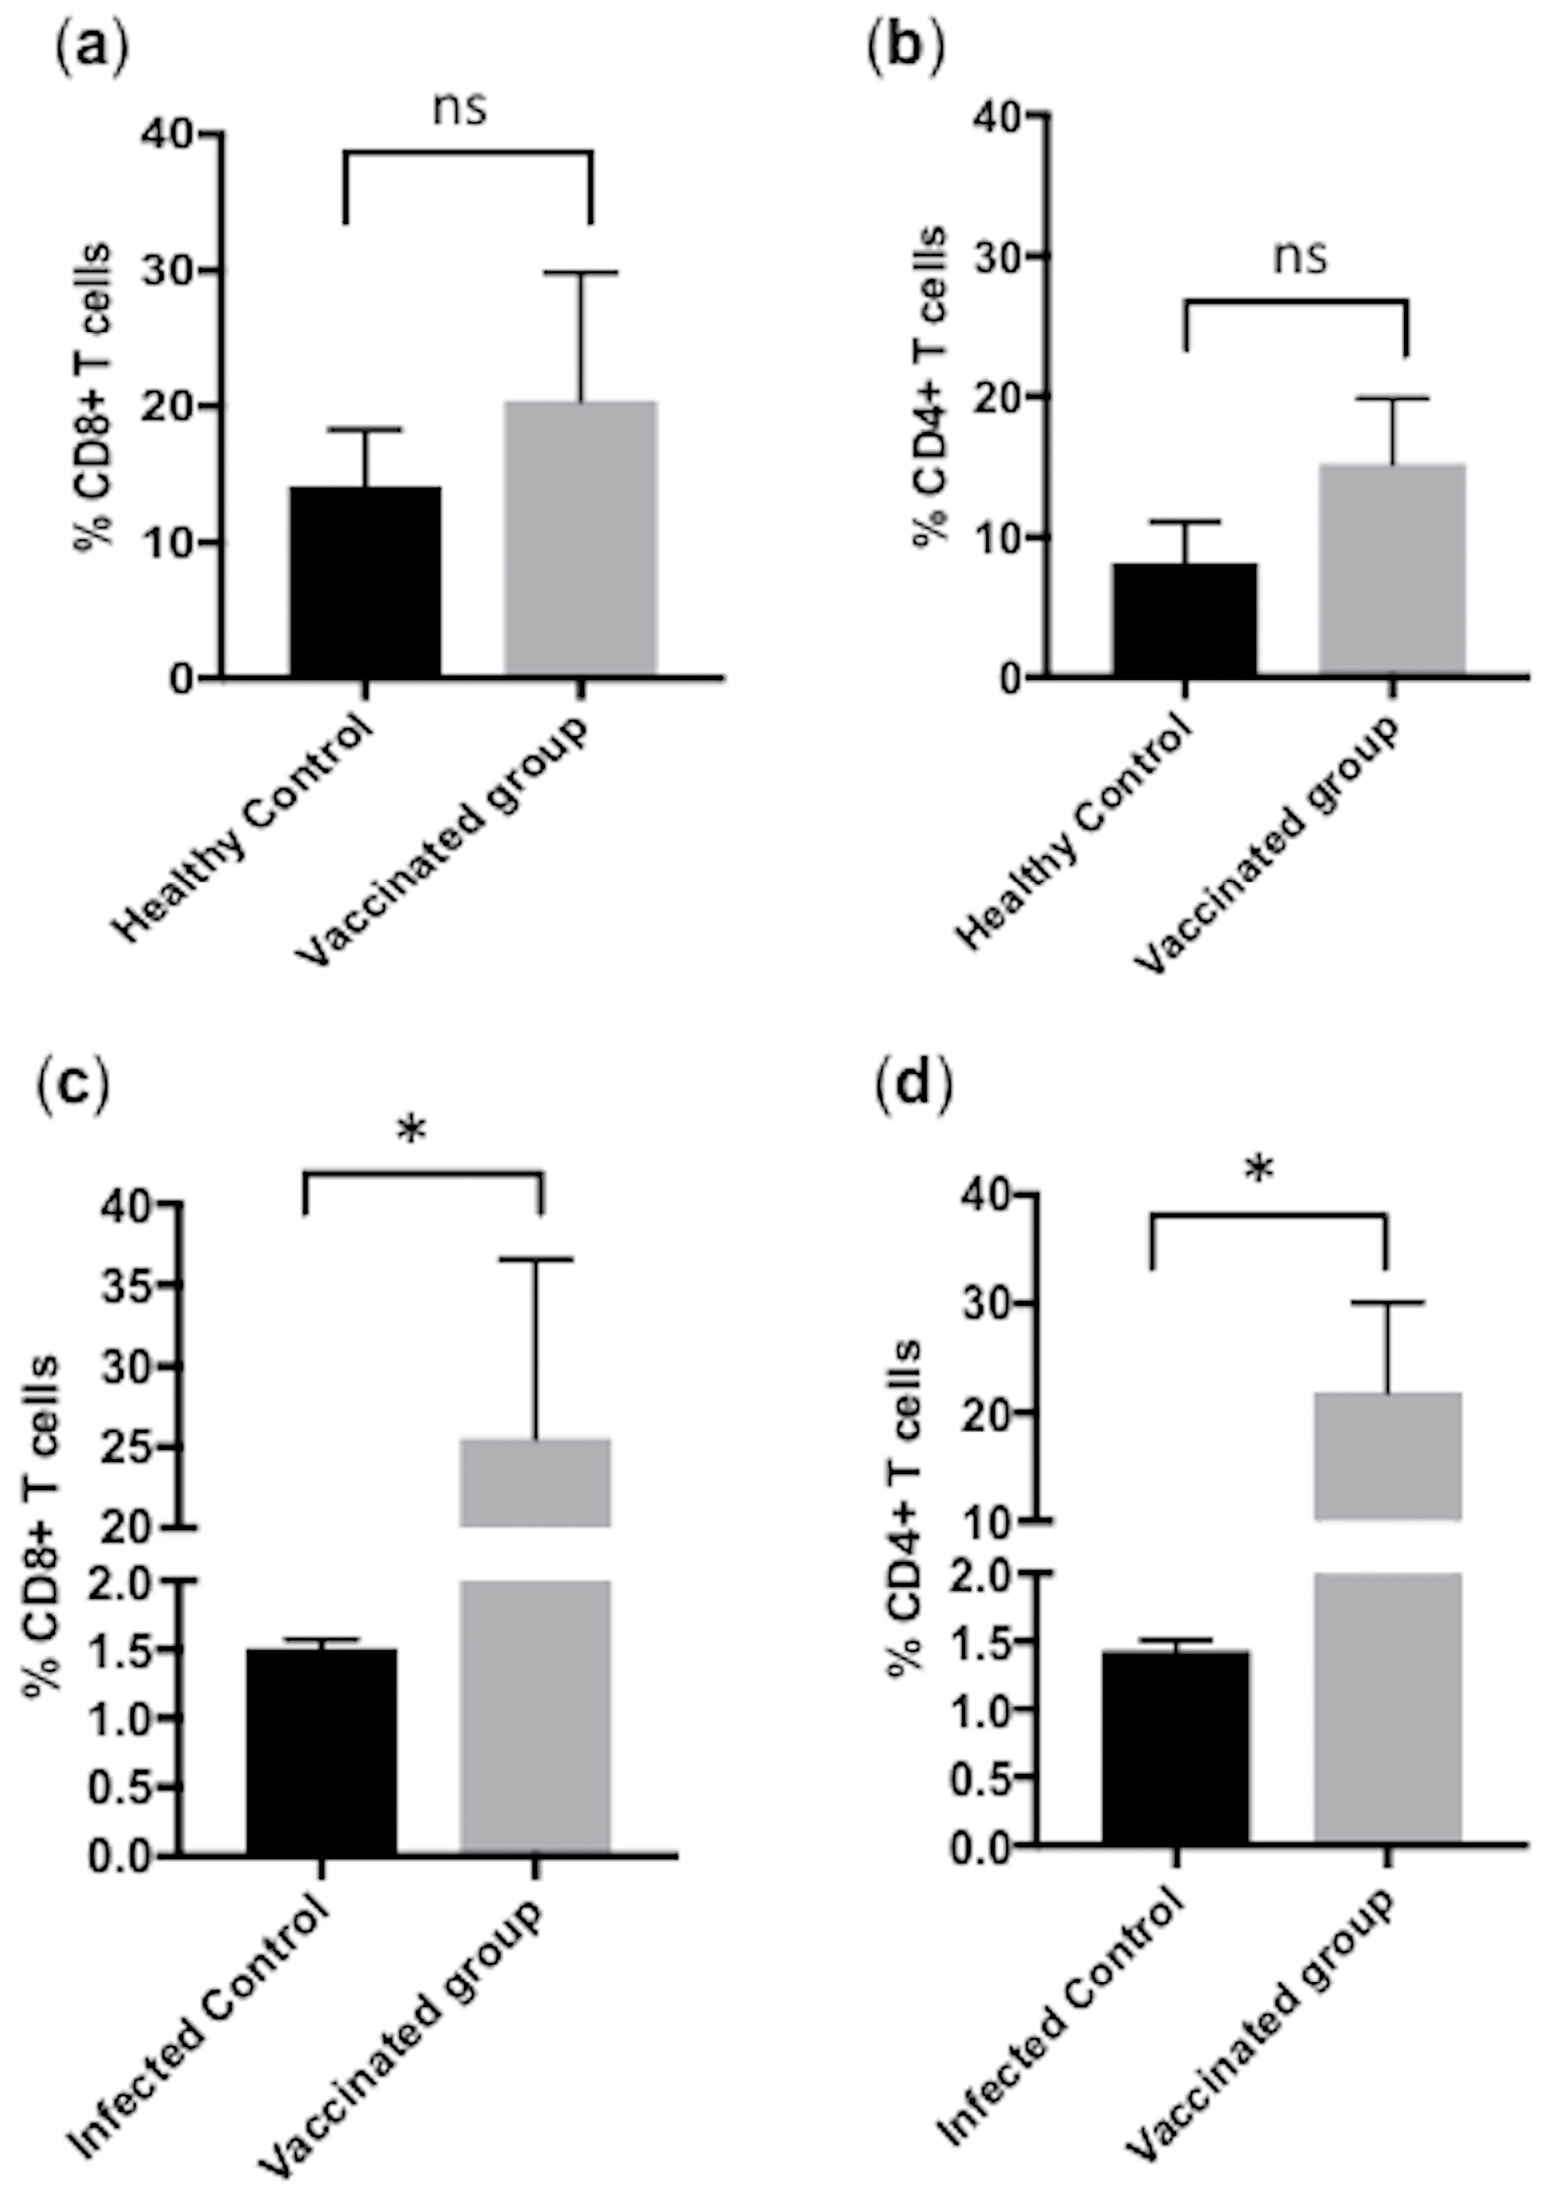
3.3. Subcutaneous Immunization with Culture-Derived Attenuated B. bigemina Elicited Increased CD4+ and CD8+ T Cells Responses
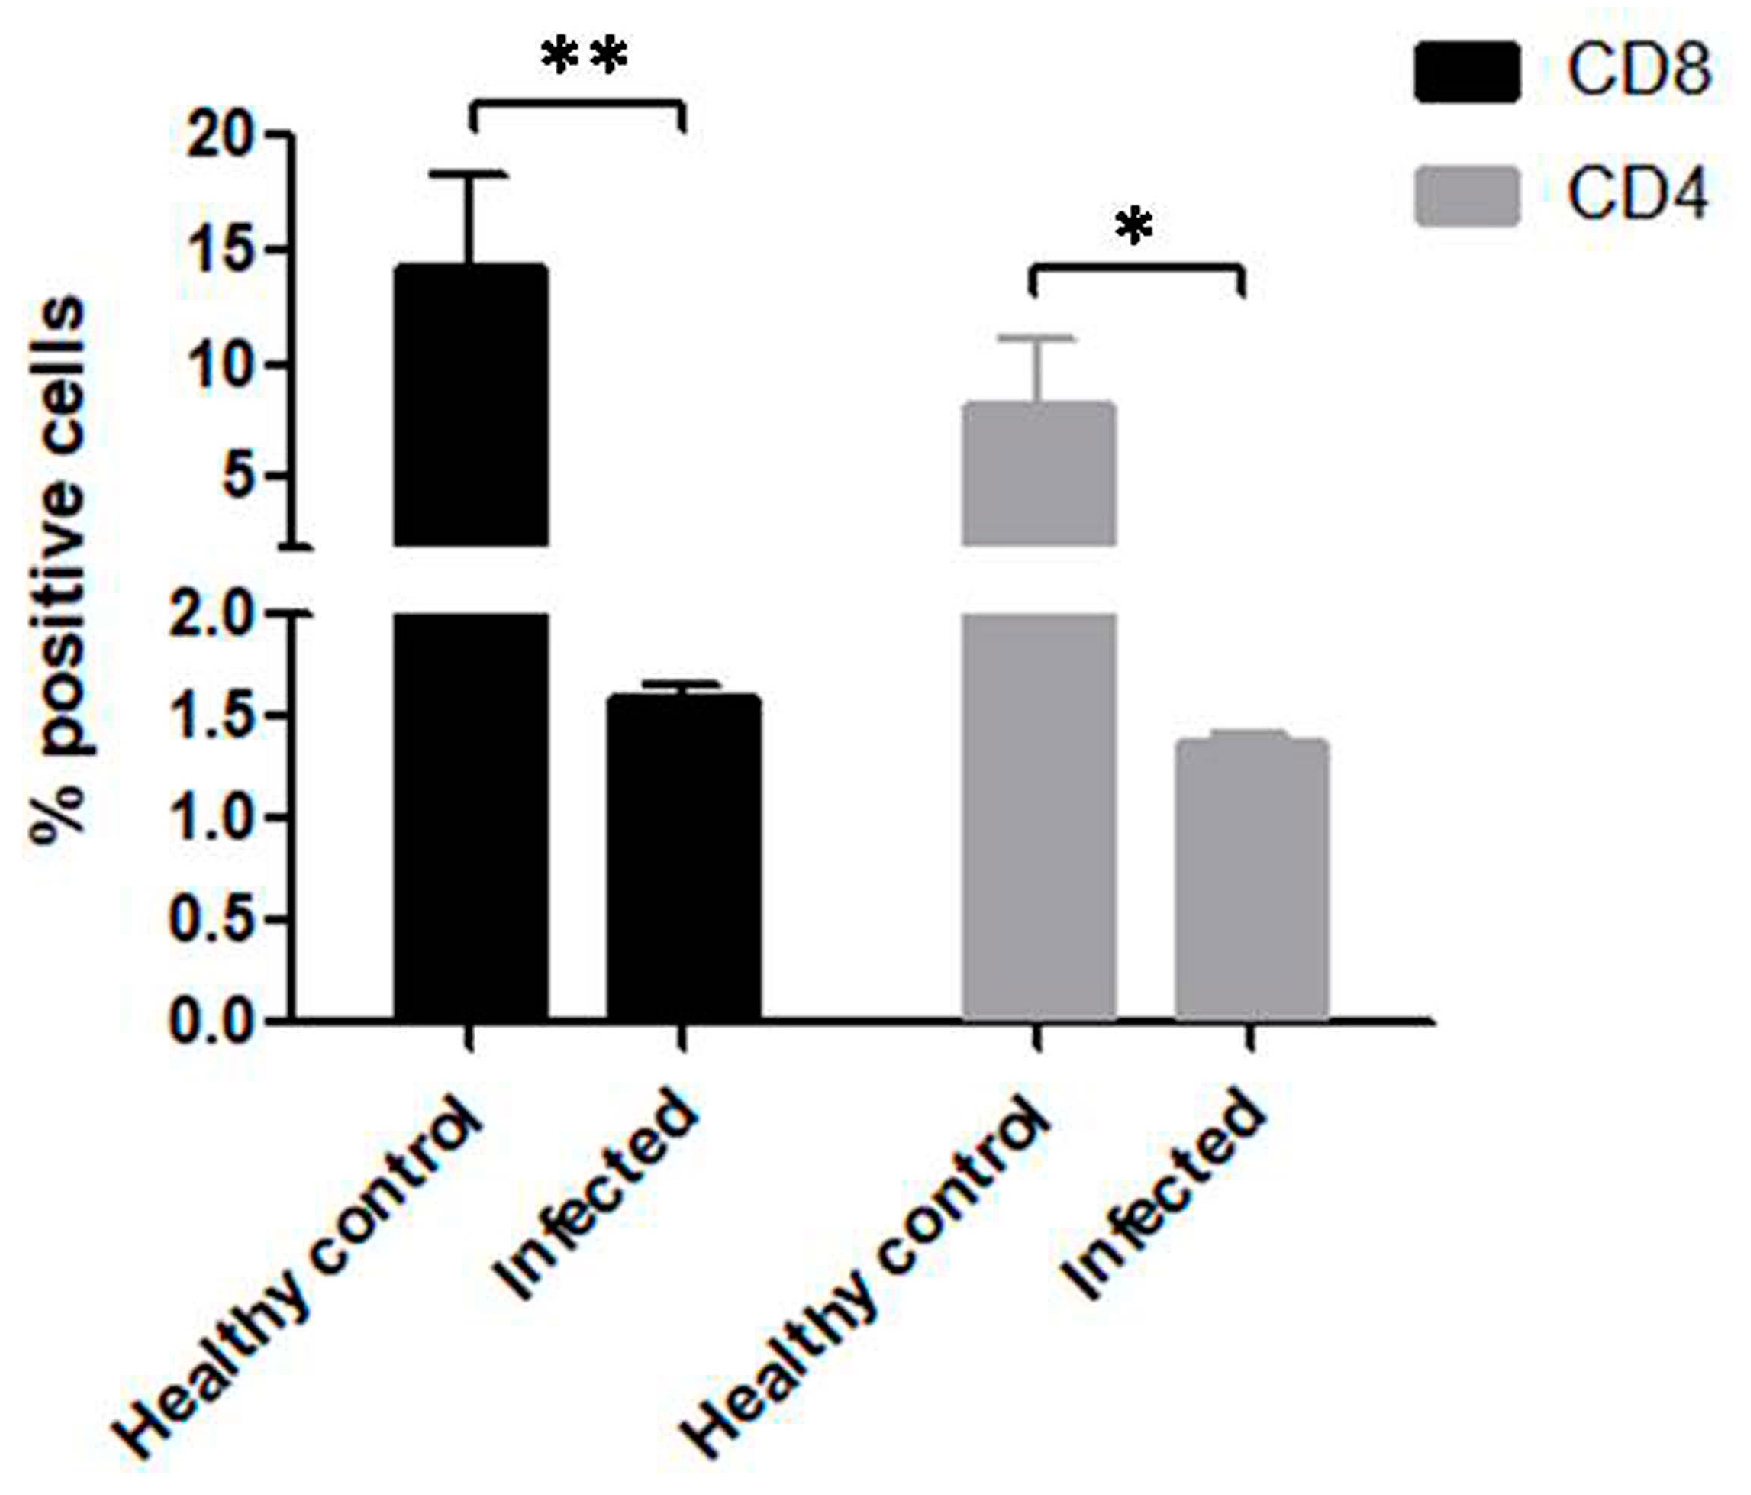
3.4. Significant Reduction in CD4+ and CD8+ T Cells in B. bigemina Challenged Calves of Group C
3.5. Comparison of CD4+ and CD8+ T Cells between Calves from Group A, B and C
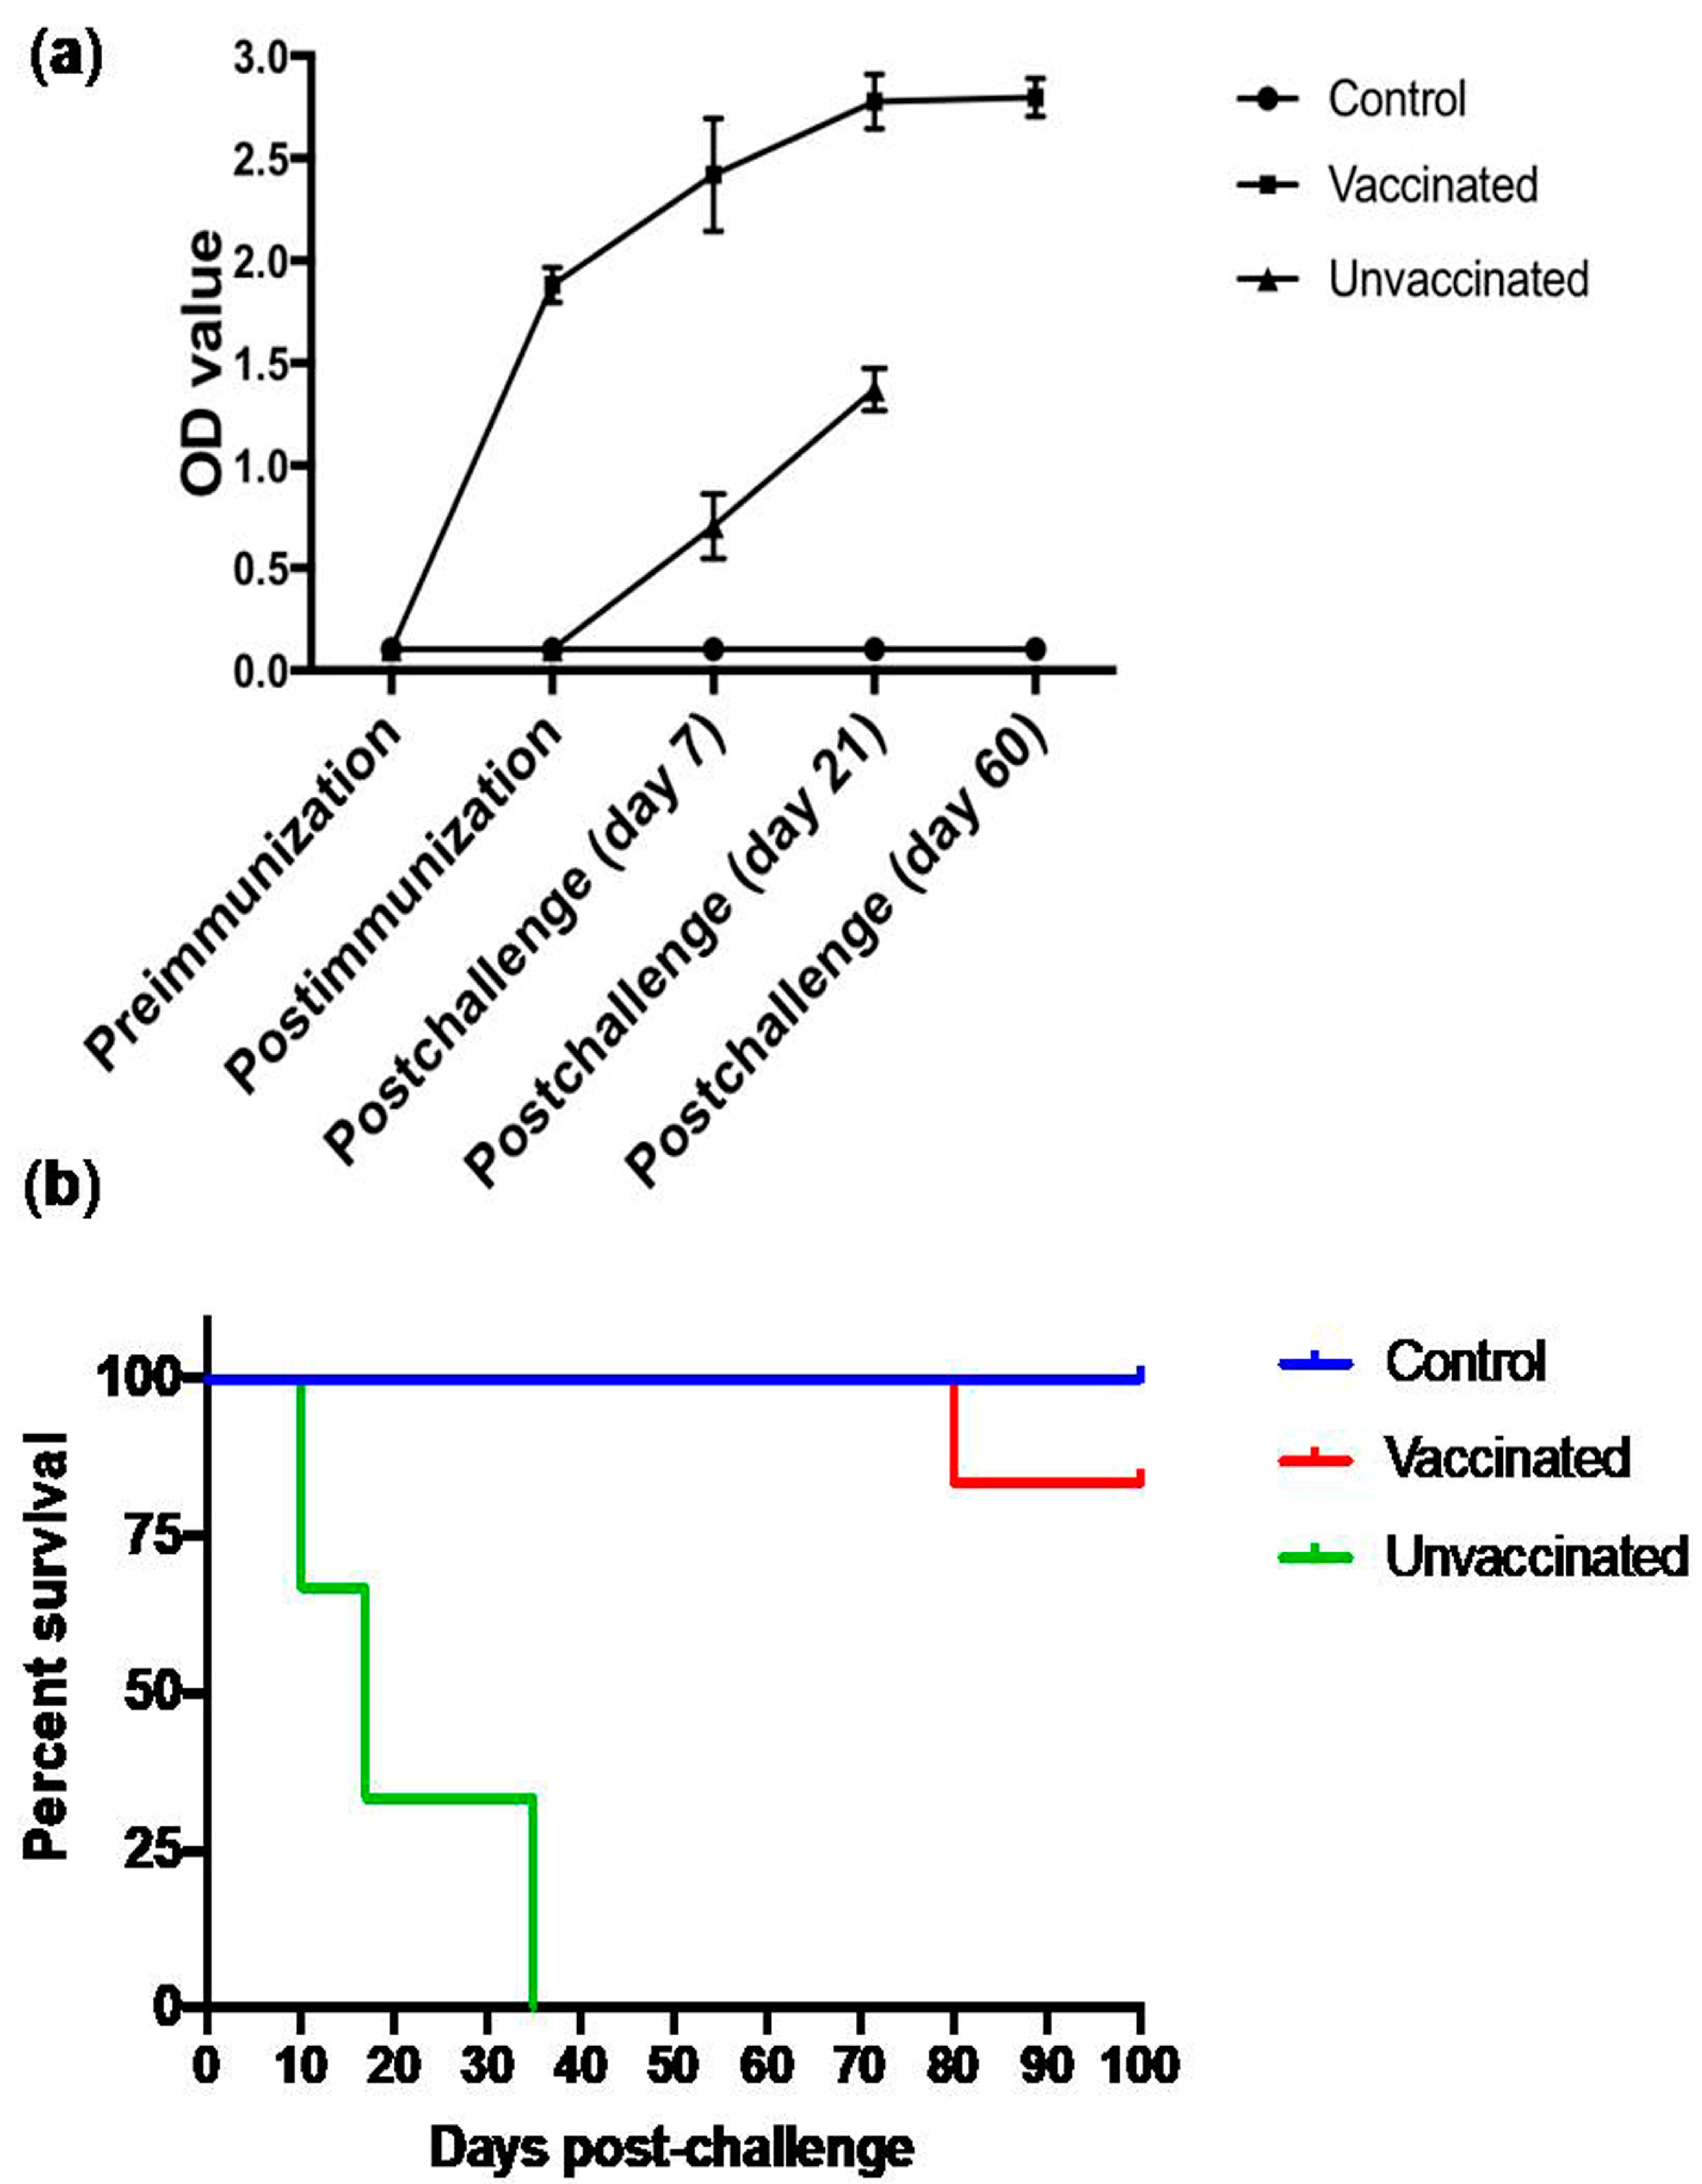
3.6. Subcutaneous Immunization with Culture-Derived Attenuated B. bigemina Elicited Increased Humoral Response
3.7. Animal Trial Outcome and Survival Curve
4. Discussion
Author Contributions
Funding
Acknowledgments
Conflicts of Interest
References
- Narladkar, B.W. Projected economic losses due to vector and vector-borne parasitic diseases in livestock of india and its significance in implementing the concept of integrated practices for vector management. Vet. World 2018, 11, 151–160. [Google Scholar] [CrossRef]
- Terkawi, M.A.; Huyen, N.X.; Wibowo, P.E.; Seuseu, F.; Aboulaila, M.; Ueno, A.; Goo, Y.K.; Yokoyama, N.; Xuan, X.; Igarashi, I. Spherical body protein 4 is a new serological antigen for global detection of Babesia bovis infection in cattle. Clin. Vaccine Immunol. 2011, 18, 337–342. [Google Scholar] [CrossRef]
- Pegram, R.G.; Tatchell, R.J.; de Castro, J.J.; Chizyuka, H.G.B.; Creek, M.J.; McCosker, P.J.; Moran, M.C.; Nigarura, G. Ticks in a Changing World—Les Tiques dans un Monde en Évolution—Las Garrapatas en un Mundo en Evolución. Available online: http://www.fao.org/3/u9550T04.htm (accessed on 27 August 2020).
- Lew-Tabor, A.E.; Rodriguez Valle, M. A review of reverse vaccinology approaches for the development of vaccines against ticks and tick borne diseases. Ticks Tick. Borne. Dis. 2016, 7, 573–585. [Google Scholar] [CrossRef]
- Singh, N.K.; Singh, H.; Jyoti; Haque, M.; Rath, S.S. Prevalence of parasitic infections in cattle of Ludhiana district, Punjab. J. Parasit. Dis. 2012, 36, 256–259. [Google Scholar] [CrossRef]
- Mosqueda, J.; Olvera-Ramirez, A.; Aguilar-Tipacamu, G.; J. Canto, G. Current Advances in Detection and Treatment of Babesiosis. Curr. Med. Chem. 2012, 19, 1504–1518. [Google Scholar] [CrossRef] [PubMed]
- Silva, M.G.; Knowles, D.P.; Suarez, C.E. Identification of interchangeable cross-species function of elongation factor-1 alpha promoters in Babesia bigemina and Babesia bovis. Parasites Vectors 2016, 9, 1–9. [Google Scholar] [CrossRef] [PubMed]
- Klafke, G.; Webster, A.; Dall Agnol, B.; Pradel, E.; Silva, J.; de La Canal, L.H.; Becker, M.; Osório, M.F.; Mansson, M.; Barreto, R.; et al. Multiple resistance to acaricides in field populations of Rhipicephalus microplus from Rio Grande do Sul state, Southern Brazil. Ticks Tick. Borne. Dis. 2017, 8, 73–80. [Google Scholar] [CrossRef] [PubMed]
- Maiorano, A.M.; Giglioti, R.; Oliveira, M.C.S.; Oliveira, H.N.; Cyrillo, J.N.S.G.; Mercadante, M.E.Z.; Silva, J.A.I.I.V. Resistance to the tick Rhipicephalus microplus and Babesia bovis infection levels in beef heifers raised in an endemic area of Sao Paulo state, Brazil. Anim. Prod. Sci. 2019, 59, 938. [Google Scholar] [CrossRef]
- Suarez, C.E.; Noh, S. Emerging perspectives in the research of bovine babesiosis and anaplasmosis. Vet. Parasitol. 2011, 180, 109–125. [Google Scholar] [CrossRef]
- Goo, Y.-K.; Terkawi, M.A.; Jia, H.; Aboge, G.O.; Ooka, H.; Nelson, B.; Kim, S.; Sunaga, F.; Namikawa, K.; Igarashi, I.; et al. Artesunate, a potential drug for treatment of Babesia infection. Parasitol. Int. 2010, 59, 481–486. [Google Scholar] [CrossRef]
- Tuvshintulga, B.; Sivakumar, T.; Yokoyama, N.; Igarashi, I. Development of unstable resistance to diminazene aceturate in Babesia bovis. Int. J. Parasitol. Drugs Drug Resist. 2019, 9, 87–92. [Google Scholar] [CrossRef] [PubMed]
- Yoshida, M.; Reyes, S.G.; Tsuda, S.; Horinouchi, T.; Furusawa, C.; Cronin, L. Time-programmable drug dosing allows the manipulation, suppression and reversal of antibiotic drug resistance in vitro. Nat. Commun. 2017, 8. [Google Scholar] [CrossRef] [PubMed]
- Çiloglu, A.; İnci, A.; Yildirim, A.; Önder, Z.; Duzlu, Ö. Molecular characterization and expression of the apical membrane antigen-1 from in vivo and in vitro isolates of Babesia bigemina Kayseri/Turkey strain. Ankara Üniv. Vet. Fakültesi Derg. 2018, 3, 239–246. [Google Scholar]
- Bock, R.E.; De Vos, A.J. Immunity following use of Australian tick fever vaccine: A review of the evidence. Aust. Vet. J. 2001, 79, 832–839. [Google Scholar] [CrossRef] [PubMed]
- Callow, L.L.; Dalgliesh, R.J.; De Vos, A.J. Development of effective living vaccines against bovine babesiosis—The longest field trial? Int. J. Parasitol. 1997, 27, 747–767. [Google Scholar] [CrossRef]
- Echaide, I.E.; de Echaide, S.T.; Guglielmone, A.A. Live and soluble antigens for cattle protection to Babesia bigemina. Vet. Parasitol. 1993, 51, 35–40. [Google Scholar] [CrossRef]
- Jorgensen, W.; Vos, A.D.; Dalgliesh, R. Comparison of immunogenicity and virulence between Babesia bigemina parasites from continuous culture and from a splenectomised calf. Aust. Vet. J. 1989, 66, 371–372. [Google Scholar] [CrossRef]
- Mangold, A.J.; Vanzini, V.R.; Echaide, I.E.; De Echaide, S.T.; Volpogni, M.M.; Guglielmone, A.A. Viability after thawing and dilution of simultaneously cryopreserved vaccinal Babesia bovis and Babesia bigemina strains cultured in vitro. Vet. Parasitol. 1996, 61, 345–348. [Google Scholar] [CrossRef]
- Shkap, V.; Leibovitz, B.; Krigel, Y.; Hammerschlag, J.; Marcovics, A.; Fish, L.; Molad, T.; Savitsky, I.; Mazuz, M. Vaccination of older Bos taurus bulls against bovine babesiosis. Vet. Parasitol. 2005, 129, 235–242. [Google Scholar] [CrossRef]
- Guillemi, E.; Ruybal, P.; Lia, V.; González, S.; Farber, M.; Wilkowsky, S.E. Multi-locus typing scheme for Babesia bovis and Babesia bigemina reveals high levels of genetic variability in strains from Northern Argentina. Infect. Genet. Evol. 2013, 14, 214–222. [Google Scholar] [CrossRef]
- Allred, D.R. Variable and Variant Protein Multigene Families in Babesia bovis Persistence. Pathogens 2019, 8, 76. [Google Scholar] [CrossRef]
- Dalgliesh, R.J.; Callow, L.L.; Mellors, L.T.; McGregor, W. Development of a highly infective Babesia bigemina vaccine of reduced virulance. Aust. Vet. J. 1981, 57, 8–11. [Google Scholar] [CrossRef] [PubMed]
- Gale, K.R.; Waltisbuhl, D.J.; Bowden, J.M.; Jorgensen, W.K.; Matheson, J.; East, I.J.; Zakrzewski, H.; Leatch, G. Amelioration of virulent Babesia bovis infection in calves by administration of the nitric oxide synthase inhibitor aminoguanidine. Parasite Immunol. 1998, 20, 441–445. [Google Scholar] [CrossRef] [PubMed]
- Vega, C.A.; Buening, G.M.; Green, T.J.; Carson, C.A. In vitro cultivation of Babesia bigemina. Am. J. Vet. Res. 1985, 46, 416–420. [Google Scholar] [PubMed]
- Shkap, V.; Pipano, E. Culture-Derived Parasites in Vaccination of Cattle against Tick-Borne Diseases. Ann. N. Y. Acad. Sci. 2006, 916, 154–171. [Google Scholar] [CrossRef] [PubMed]
- Almazan, C.; Tipacamu, G.A.; Rodriguez, S.; Mosqueda, J.; Perez de Leon, A. Immunological control of ticks and tick-borne diseases that impact cattle health and production. Front. Biosci.-Landmark 2018, 23, 1535–1551. [Google Scholar] [CrossRef] [PubMed]
- Dalgliesh, R.J.; Jorgensen, W.K.; de Vos, A.J. Australian frozen vaccines for the control of babesiosis and anaplasmosis in cattle—A review. Trop. Anim. Health Prod. 1990, 22, 44–52. [Google Scholar] [CrossRef]
- Rojas-Martínez, C.; Rodríguez-Vivas, R.I.; Millán, J.V.F.; Bautista-Garfias, C.R.; Castañeda-Arriola, R.O.; Lira-Amaya, J.J.; Urióstegui, P.V.; Carrasco, J.J.O.; Martínez, J.A.Á. Bovine babesiosis: Cattle protected in the field with a frozen vaccine containing Babesia bovis and Babesia bigemina cultured in vitro with a serum-free medium. Parasitol. Int. 2018, 67, 190–195. [Google Scholar] [CrossRef]
- Bautista-Garfias, C.R.; Lozano, A.R.; Martínez, C.R.; Martínez, J.A.Á.; Millán, J.V.F.; García, G.R.R.; Castañeda-Arriola, R.; Aguilar-Figueroa, B.R. Co-immunization of cattle with a vaccine against babesiosis and Lactobacillus casei increases specific IgG1 levels to Babesia bovis and B. bigemina. Parasitol. Int. 2015, 64, 319–323. [Google Scholar] [CrossRef]
- Alvarez, J.A.; Rojas, C.; Figueroa, J.V. An Overview of Current Knowledge on in vitro Babesia Cultivation for Production of Live Attenuated Vaccines for Bovine Babesiosis in Mexico. Front. Vet. Sci. 2020, 7, 364. [Google Scholar] [CrossRef]
- Schetters, T. Vaccination against canine babesiosis. Trends Parasitol. 2005, 21, 179–184. [Google Scholar] [CrossRef] [PubMed]
- Sivakumar, T.; Altangerel, K.; Battsetseg, B.; Battur, B.; AbouLaila, M.; Munkhjargal, T.; Yoshinari, T.; Yokoyama, N.; Igarashi, I. Genetic detection of Babesia bigemina from Mongolian cattle using apical membrane antigen-1 gene-based PCR assay. Vet. Parasitol. 2012, 187, 17–22. [Google Scholar] [CrossRef] [PubMed]
- Levy, M.G.; Ristic, M. Babesia bovis: Continuous cultivation in a microaerophilous stationary phase culture. Science (80-.) 1980, 207, 1218–1220. [Google Scholar] [CrossRef] [PubMed]
- Shkap, V.; Rasulov, I.; Abdurasulov, S.; Fish, L.; Leibovitz, B.; Krigel, Y.; Molad, T.; Mazuz, M.L.; Savitsky, I. Babesia bigemina: Attenuation of an Uzbek isolate for immunization of cattle with live calf- or culture-derived parasites. Vet. Parasitol. 2007, 146, 221–226. [Google Scholar] [CrossRef]
- Gonçalves Ruiz, P.M.; Passos, L.M.F.; Machado, R.Z.; Lima, J.D.; Ribeiro, M.F.B. Development of an Enzyme-linked Immunosorbent Assay for Detection of IgM Antibodies to Babesia bigemina in Cattle. Mem. Inst. Oswaldo Cruz 2001, 96, 237–240. [Google Scholar] [CrossRef][Green Version]
- Naeem, H.; Sana, M.; Islam, S.; Khan, M.; Riaz, F.; Zafar, Z.; Akbar, H.; Shehzad, W.; Rashid, I. Induction of Th1 type-oriented humoral response through intranasal immunization of mice with SAG1- Toxoplasma gondii polymeric nanospheres. Artif. Cells Nanomed. Biotechnol. 2018, 46, 1025–1034. [Google Scholar] [CrossRef]
- Suleman, M.; Prysliak, T.; Clarke, K.; Burrage, P.; Windeyer, C.; Perez-Casal, J. Mycoplasma bovis isolates recovered from cattle and bison (Bison bison) show differential in vitro effects on PBMC proliferation, alveolar macrophage apoptosis and invasion of epithelial and immune cells. Vet. Microbiol. 2016, 186. [Google Scholar] [CrossRef]
- Bock, R.; Jackson, L.; De Vos, A.; Jorgensen, W. Babesiosis of cattle. Parasitology 2004, 129. [Google Scholar] [CrossRef]
- Jacob, S.S.; Sengupta, P.P.; Paramanandham, K.; Suresh, K.P.; Chamuah, J.K.; Rudramurthy, G.R.; Roy, P. Bovine babesiosis: An insight into the global perspective on the disease distribution by systematic review and meta-analysis. Vet. Parasitol. 2020, 283, 109136. [Google Scholar] [CrossRef]
- Suarez, C.E.; Alzan, H.F.; Silva, M.G.; Rathinasamy, V.; Poole, W.A.; Cooke, B.M. Unravelling the cellular and molecular pathogenesis of bovine babesiosis: Is the sky the limit? Int. J. Parasitol. 2019, 49, 183–197. [Google Scholar] [CrossRef]
- Okagawa, T.; Konnai, S.; Nishimori, A.; Maekawa, N.; Goto, S.; Ikebuchi, R.; Kohara, J.; Suzuki, Y.; Yamada, S.; Kato, Y.; et al. Cooperation of PD-1 and LAG-3 in the exhaustion of CD4+ and CD8+ T cells during bovine leukemia virus infection. Vet. Res. 2018, 49, 50. [Google Scholar] [CrossRef] [PubMed]
- Ikebuchi, R.; Konnai, S.; Shirai, T.; Sunden, Y.; Murata, S.; Onuma, M.; Ohashi, K. Increase of cells expressing PD-L1 in bovine leukemia virus infection and enhancement of anti-viral immune responses in vitro via PD-L1 blockade. Vet. Res. 2011, 42, 103. [Google Scholar] [CrossRef] [PubMed]
- Suleman, M.; Cyprian, F.S.; Jimbo, S.; Maina, T.; Prysliak, T.; Windeyer, C.; Perez-Casal, J. Mycoplasma bovis-induced inhibition of bovine peripheral blood mononuclear cell proliferation is ameliorated after blocking the immune-inhibitory programmed death 1 receptor. Infect. Immun. 2018, 86. [Google Scholar] [CrossRef] [PubMed]
- Han, S.; Norimine, J.; Brayton, K.A.; Palmer, G.H.; Scoles, G.A.; Brown, W.C. Anaplasma marginale infection with persistent high-load bacteremia induces a dysfunctional memory CD4+ T lymphocyte response but sustained high IgG titers. Clin. Vaccine Immunol. 2010, 17, 1881–1890. [Google Scholar] [CrossRef] [PubMed]
- Brown, W.C.; Logan, K.S.; Wagner, G.G.; Tetzlaff, C.L. Cell-mediated immune responses to Babesia bovis merozoite antigens in cattle following infection with tick-derived or cultured parasites. Infect. Immun. 1991, 59, 2418–2426. [Google Scholar] [CrossRef]
- Hemmer, R.M.; Ferrick, D.A.; Conrad, P.A. Role of T cells and cytokines in fatal and resolving experimental babesiosis: Protection in tnfrp55−/− mice infected with the human babesia wa1 parasite. J. Parasitol. 2000, 86, 736–742. [Google Scholar] [CrossRef]
- Tetzlaff, C.L.; Rice-Ficht, A.C.; Woods, V.M.; Brown, W.C. Induction of proliferative responses of T cells from Babesia bovis-immune cattle with a recombinant 77-kilodalton merozoite protein (Bb-1). Infect. Immun. 1992, 60, 644–652. [Google Scholar] [CrossRef]
- Wilson, C.; Su, J.-S.; Silver, Z.; Laurie, S.; Telford, S.; Krause, P.J.; Wortis, H.H.; Vannier, E. P007 IL-21, B cells and CD4-CD8- T cells are key for resistance to Babesia microti infection in immunosuppressed hosts. Cytokine 2012, 59, 521. [Google Scholar] [CrossRef]
- Good, M.F.; Miller, L.H. T-cell antigens and epitopes in malaria vaccine design. Curr. Top. Microbiol. Immunol. 1990, 155, 65–78. [Google Scholar]
- Brown, W.C.; Lonsdale-Eccles, J.D.; DeMartini, J.C.; Grab, D.J. Recognition of soluble Theileria parva antigen by bovine helper T cell clones: Characterization and partial purification of the antigen. J. Immunol. 1990, 144, 271–277. [Google Scholar]
- Siegrist, C.-A. Plotkin’s Vaccines; Elsevier: Amsterdam, The Netherlands, 2018. [Google Scholar]
- Xu, H.; Wipasa, J.; Yan, H.; Zeng, M.; Makobongo, M.O.; Finkelman, F.D.; Kelso, A.; Good, M.F. The mechanism and significance of deletion of parasite-specific CD4+ T cells in malaria infection. J. Exp. Med. 2002, 195, 881–892. [Google Scholar] [CrossRef] [PubMed]
- Jordan, K.A.; Hunter, C.A. Regulation of CD8+ T cell responses to infection with parasitic protozoa. Exp. Parasitol. 2010, 126, 318–325. [Google Scholar] [CrossRef] [PubMed]
- Villarino, N.; Schmidt, N. CD8+ T Cell Responses to Plasmodium and Intracellular Parasites. Curr. Immunol. Rev. 2014, 9, 169–178. [Google Scholar] [CrossRef] [PubMed]
- Khan, I.A.; Hwang, S.; Moretto, M. Toxoplasma gondii: CD8 T Cells Cry for CD4 Help. Front. Cell. Infect. Microbiol. 2019, 9, 136. [Google Scholar] [CrossRef]
- Jaramillo Ortiz, J.M.; Del Médico Zajac, M.P.; Zanetti, F.A.; Molinari, M.P.; Gravisaco, M.J.; Calamante, G.; Wilkowsky, S.E. Vaccine strategies against Babesia bovis based on prime-boost immunizations in mice with modified vaccinia Ankara vector and recombinant proteins. Vaccine 2014, 32, 4625–4632. [Google Scholar] [CrossRef]
- Rauch, S.; Jasny, E.; Schmidt, K.E.; Petsch, B. New vaccine technologies to combat outbreak situations. Front. Immunol. 2018, 9, 1963. [Google Scholar] [CrossRef] [PubMed]
- Brown, W.C.; Norimine, J.; Knowles, D.P.; Goff, W.L. Immune control of Babesia bovis infection. Vet. Parasitol. 2006, 138, 75–87. [Google Scholar] [CrossRef]
- Jaramillo Ortiz, J.M.; Molinari, M.P.; Gravisaco, M.J.; Paoletta, M.S.; Montenegro, V.N.; Wilkowsky, S.E. Evaluation of different heterologous prime–boost immunization strategies against Babesia bovis using viral vectored and protein-adjuvant vaccines based on a chimeric multi-antigen. Vaccine 2016, 34, 3913–3919. [Google Scholar] [CrossRef]


Publisher’s Note: MDPI stays neutral with regard to jurisdictional claims in published maps and institutional affiliations. |
© 2020 by the authors. Licensee MDPI, Basel, Switzerland. This article is an open access article distributed under the terms and conditions of the Creative Commons Attribution (CC BY) license (http://creativecommons.org/licenses/by/4.0/).
Share and Cite
Rauf, U.; Suleman, M.; Abid, A.; Jamil, H.; Menghwar, H.; Durrani, A.Z.; Rashid, M.I.; Akbar, H. Humoral and Cell-Mediated Immune Response Validation in Calves after a Live Attenuated Vaccine of Babesia bigemina. Pathogens 2020, 9, 936. https://doi.org/10.3390/pathogens9110936
Rauf U, Suleman M, Abid A, Jamil H, Menghwar H, Durrani AZ, Rashid MI, Akbar H. Humoral and Cell-Mediated Immune Response Validation in Calves after a Live Attenuated Vaccine of Babesia bigemina. Pathogens. 2020; 9(11):936. https://doi.org/10.3390/pathogens9110936
Chicago/Turabian StyleRauf, Umber, Muhammad Suleman, Asadullah Abid, Hamna Jamil, Harish Menghwar, Aneela Zameer Durrani, Muhammad Imran Rashid, and Haroon Akbar. 2020. "Humoral and Cell-Mediated Immune Response Validation in Calves after a Live Attenuated Vaccine of Babesia bigemina" Pathogens 9, no. 11: 936. https://doi.org/10.3390/pathogens9110936
APA StyleRauf, U., Suleman, M., Abid, A., Jamil, H., Menghwar, H., Durrani, A. Z., Rashid, M. I., & Akbar, H. (2020). Humoral and Cell-Mediated Immune Response Validation in Calves after a Live Attenuated Vaccine of Babesia bigemina. Pathogens, 9(11), 936. https://doi.org/10.3390/pathogens9110936