Article

Genomic Markers Distinguishing Shiga Toxin-Producing Escherichia coli: Insights from Pangenome and Phylogenomic Analyses

1
Center for Food Animal Health, Food Safety and Defense, Department of Pathobiology, College of Veterinary Medicine, Tuskegee University, Tuskegee, AL 36088, USA
2
Department of Food Hygiene and Control, Faculty of Veterinary Medicine, University of Sadat City, Sadat City 32897, Egypt
*
Author to whom correspondence should be addressed.
Pathogens 2025, 14(9), 862; https://doi.org/10.3390/pathogens14090862 (registering DOI)
Submission received: 23 July 2025 / Revised: 20 August 2025 / Accepted: 27 August 2025 / Published: 30 August 2025
(This article belongs to the Section Bacterial Pathogens)

Abstract

Shiga toxin-producing Escherichia coli (STEC) are genetically diverse foodborne pathogens of major global public health concerns. Serogroup-level identification is critical for effective surveillance and outbreak control; however, it is often challenged by STEC’s genome plasticity and frequent recombination. In this study, we employed a standardized pangenomic pipeline integrating Roary ILP Bacterial Core Annotation Pipeline (RIBAP) and Panaroo to analyze 160 complete, high-quality STEC genomes representing eight major serogroups at a 95% sequence identity threshold. Candidate serogroup-specific markers were identified using gene presence/absence profiles from RIBAP and Panaroo. Our analysis revealed several high-confidence markers, including metabolic genes (dgcE, fcl_2, dmsA, hisC) and surface polysaccharide-related genes (capD, rfbX, wzzB). Comparative pangenomic evaluation showed that RIBAP predicted a larger pangenome size than Panaroo. Additionally, some genomes from the O104:H1, O145:H28, and O45:H2 serotypes clustered outside their expected clades, indicating sporadic serotype misplacements in phylogenetic reconstructions. Functional annotation suggested that most candidate markers are involved in critical processes such as glucose metabolism, lipopolysaccharide biosynthesis, and cell surface assembly. Notably, approximately 22.9% of the identified proteins were annotated as hypothetical. Overall, this study highlights the utility of pangenomic analysis for potential identification of clinically relevant STEC serogroups markers and phylogenetic interpretation. We also note that pangenome analysis could guide the development of more accurate diagnostic and surveillance tools.

1. Introduction

Shiga toxin-producing Escherichia coli (STEC) are among the most dangerous foodborne pathogens, causing illnesses that range from mild gastrointestinal discomfort to severe, life-threatening complications such as hemolytic uremic syndrome (HUS) [1,2]. The ongoing evolution of these microbes towards increased virulence, combined with diagnostic under-detection and the urgent need for novel and improved therapeutic options, has amplified public health concerns. For instance, in 2010, an estimated 2.8 million STEC infections resulted in 230 deaths, 270 cases of end-stage renal disease (ESRD), and 3890 cases of HUS [3]. To date, more than 470 STEC serotypes have been identified [4,5].
Although Escherichia coli O157:H7 remains the most commonly associated serotype with human infections, an increasing number of foodborne outbreaks have been linked to non-O157 serogroups, including O26, O45, O103, O111, O121, O145, and O104 [6,7]. The distribution of these serogroups varies by geographic region. In North America, most reported STEC infections are caused by serogroups O26, O45, O103, O111, O121, O145, and O157, collectively known as the “top seven” [8,9]. Between 2000 and 2010, 83% of non-O157 STEC infections in the United States were attributed to the “big six” non-O157 serogroups, O26, O111, O103, O121, O45, and O145 [9,10].
In 2011, E. coli O104:H4 emerged as a causative agent of a large outbreak across 16 European countries, primarily in Germany, with several travel-associated cases reported in North America [11]. The O104:H4 serotype is not classified as a typical O157-like STEC. Instead, it represents a hybrid pathotype, exhibiting virulence determinants characteristic of both STEC and enteroaggregative E. coli (EAEC) [12]. O104:H4 typically exhibits an EAEC backbone (aggR+, pAA+) with acquisition of an stx2 encoding prophage. Characteristically, EAEC strains carry the aggregative-adherence plasmid (pAA), which encodes the AraC-family regulator AggR (aggR gene), a widely used molecular marker of the enteroaggregative phenotypes. AggR activates transcription of hallmark EAEC loci, including aggregative adherence fimbriae (AAF, agg/aaf), the antiaggregation protein Dispersin (aap) together with its secretion system (aatPABCD transporter), and components of the aai type VI secretion apparatus [13]. According to Rahal et al. [14], this event underscores the significance of non-traditional serotypes in public health. Notably, while most STEC serotypes are associated with ruminant reservoirs, E. coli O104:H4 appears to persist within human populations and lacks a known animal reservoir [15].
Culture-based methodologies for STEC detection, such as sorbitol-MacConkey agar, are cost-effective but have notable drawbacks, including false-negative due to the emergence of sorbitol-fermenting non-O157 and O157 STEC serotypes [16]. Similarly, antigen agglutination test with specific antisera against O- and H-antigens of E. coli are time-consuming and prone to inaccuracies [17,18]. To overcome these limitations, recent approaches increasingly employ molecular serotyping, now routinely complemented by genome-based approaches such as in-silico serotyping from WGS assemblies [19,20]. Additional complementary strategies include Achtman MLST/cgMLST via EnteroBase [21], and recombination-aware core-genome phylogeny using tools like Gubbins/ClonalFrameML v1.12 [21,22].
As noted by Chaudhuri and Henderson [23], STEC possesses a highly dynamic genomic architecture consisting of a conserved core genome and a variable accessory genome rich in phages, plasmids, and pathogenicity islands. A deeper understanding of these genomic dynamics is essential to developing improved diagnostic tools, identifying novel genetic markers, and designing more effective intervention strategies. Pangenome analysis and whole-genome sequencing (WGS) techniques have revolutionized bacterial genomics by enabling high-resolution analysis of genetic diversity both within and across species [24]. The pangenome approach, which assesses the full complement genes across strains of a species, is a powerful strategy for differentiating between core and accessory genomic elements [25].
In E. coli, pangenome studies have identified an expansive gene repertoire of approximately 89,000 genes, in contrast to a relatively small core genome of around 3100 genes [26]. However, most of this research has been conducted at the species level [27]. Comparative analysis across sequence types (STs) or serogroups can offer additional insights into the evolutionary dynamics of E. coli. Inter-pangenome comparisons can reveal genes that are core within one group but variable or absent in others, shedding light on differential selective pressures and adaptation mechanisms unique to specific serogroup [28]. This is particularly relevant for STEC, while different serotypes are associated with distinct clinical outcomes and antigenic profiles [29]. Although O157 remains a major concern, non-O157 STEC serogroups contribute significantly to the global disease burden [7,30]. The high genetic diversity of E. coli driven largely by horizontal gene transfer is central to its adaptability and persistence [31,32]. This diversity also presents opportunities to advance our understanding of the pathogen beyond the species level. Investigating the core and accessory genomes of various STEC serogroups can facilitate the identification of conserved genetic elements critical for broad-spectrum detection and serogroups-specific markers suitable for high-resolution typing.
In this study, we conducted a comparative pangenomes analysis of STEC serotypes to identify genetic elements that could serve as the basis for serotype-specific identification. The analyzed serogroups included the “top seven” most frequently reported in North American surveillance, as well as the emergent O104:H4 serotype from Europe. Two pangenome analysis tools, RIBAP and Panaroo, were used to explore the genetic diversity of these eight STEC serogroups and to identify unique genetic targets associated with each serogroup.

2. Materials and Methods

2.1. Genomic Dataset Collection and Quality Filtering

On 3 January 2025, whole genome assemblies of 160 Shiga toxin-producing Escherichia coli (STEC) were retrieved from the National Center for Biotechnology Information (NCBI) database in nucleotide FASTA format. The dataset consisted of 20 genome assemblies for each of the eight predominant serogroups O157, O145, O121, O111, O103, O26, O45, and O104.
Each genome assembly was assessed for quality using CheckM (v1.2.3) [33], and met our inclusion requirements with >95% completeness and <5% contamination for further analysis. The total number of genomes included in this study was capped at 160 due to the substantial disk space and computational resources required to perform pairwise gene comparisons and subsequent integer linear programming (ILP) optimization using RIBAP, particularly for datasets exceeding 100 genomes [34]. NCBI accession numbers for all genome assemblies used in this study are provided in Supplementary Table S1.

2.2. Genome Annotation and Pangenome Analysis

Genome annotation was performed using Prokka (v1.14.6) [35,36] via a Nextflow platform integrated within RIBAP. The use of Nextflow enabled standardized gene prediction and functional annotation across all datasets, ensuring reproducibility of the analyses pipeline [37].
Following annotation, the resulting GFF3 files were used as input for comprehension pangenome analysis using both Panaroo (v1.2.8) and RIBAP (v1.1.0). Panaroo, a graph-based pangenome clustering tool [38], operates using protein sequence data, while RIBAP employes an integer linear programming approach to refine gene clusters initially predicted by Roary, thereby improving core genes identification [34].
Both tools were executed using a 95% sequence identity threshold to ensure a high-stringency clustering, reduce the influence of fragmented annotations, and minimize spurious gene calls. This consistent threshold also helped mitigate potential biases in each tool’s ability to identify putative serogroup-specific markers.
Virulence genes, including Shiga toxin (stx1/stx2 and their subtypes), the aggregative adherence regulator (AggR; gene aggR) and intimin (eae), were detected by screening genome assemblies against the Virulence Factor Database (VFDB) using ABRicate, applying thresholds of ≥90% sequence identity and ≥60% coverage [39,40].
A core-genome-based phylogenetic tree was generated as part of the RIBAP analysis and was subsequently used to map serotype positions of the isolates by using iTOL v6 [41].
Three discordant isolates-showing serotype–phylogeny mismatch in which the assigned O:H serotype did not cluster with its corresponding serotype clade in the core-genome phylogenetic tree were re-analyzed using a multi-step genomic pipeline. Serotype-Finder v2.0 [20] was used to confirm the O- and H-antigen types for each isolate, applying thresholds of ≥90% sequence identity and ≥60% coverage. Sequence types (STs) were assigned based on the Achtman MLST scheme using mlst software v 2.23 [42]. Whole-genome relatedness to references strains (listed in Supplementary Table S3) was assessed using FastANI v1.34 [43] and Mash v2.3 [44]. To evaluate O-antigen gene cluster (OAGC) similarity, the galFgnd region, which brackets the OAGC in most E. coli was extracted in silico from each genome using samtools faidx v 1.22 [45] to enable locus comparison, aligned with MAFFT v7.526 [46], and pairwise distances were computed using the Kimura 2-parameter model in EMBOSS distmat [47]. Using these conserved flanks as boundaries enabled capture of the complete wzx/wzy (Wzy-dependent) or wzm/wzt (ABC-transporter) module along with adjacent glycosyltransferase and sugar-pathway genes. Together, these elements constitute the core genetic unit for assessing O-antigen similarity and detecting potential serogroup switching events [48].

2.3. Identification, Validation, and Cross-Verification of Candidate Marker Genes

Candidate serogroup-specific markers were initially identified from the gene presence/absence profiles generated by RIBAP and Panaroo. Genes that were both consistently present across all genomes within a given serogroup and absent from others were selected as preliminary candidates. These genes were then subjected to a multi-step validation process.
First, each candidate gene was analyzed using BLASTN against the NCBI nucleotide database (https://blast.ncbi.nlm.nih.gov/Blast.cgi, accessed on 15 January 2025) to assess specificity, sequence coverage, nucleotide identity, and potential cross-reactivity with non-target genomes. Subsequently, the presence or absence of each gene was further verified in the curated genome set using Geneious Prime (v2024.0.1) (https://www.geneious.com). Cross-validation was then performed by confirming that each candidate gene consistently appeared in the gene presence/absence matrices generated by both RIBAP and Panaroo, thereby improving marker reliability.
Additionally, the core-genome phylogenetic tree from the RIBAP output and the genes presence/absence matrices from both tools were compared and visualized using Phandango [49].

2.4. Functional Characterization of Serogroup-Specific Genes via Gene Ontology Annotation

To investigate the functional roles of serogroup-associated genetic targets, Gene Ontology (GO) annotation was performed using the UniProt database (release 2024_06, accessed on 20 January 2025).

2.5. Visualization of Figures

All visualization, including heatmaps, were generated using R software (v 4.3.1) with the following packages ggplot2 [50], ggforce [51] and viridis [52]. A summarized workflow of methodology is provided in Figure 1.
Summarized workflow for STEC marker identification: integrating pangenome analysis, candidate marker validation, and functional classification.

3. Results

3.1. Comparative Pangenome Composition and Genomic Diversity of STEC Using RIBAP and Panaroo Tools

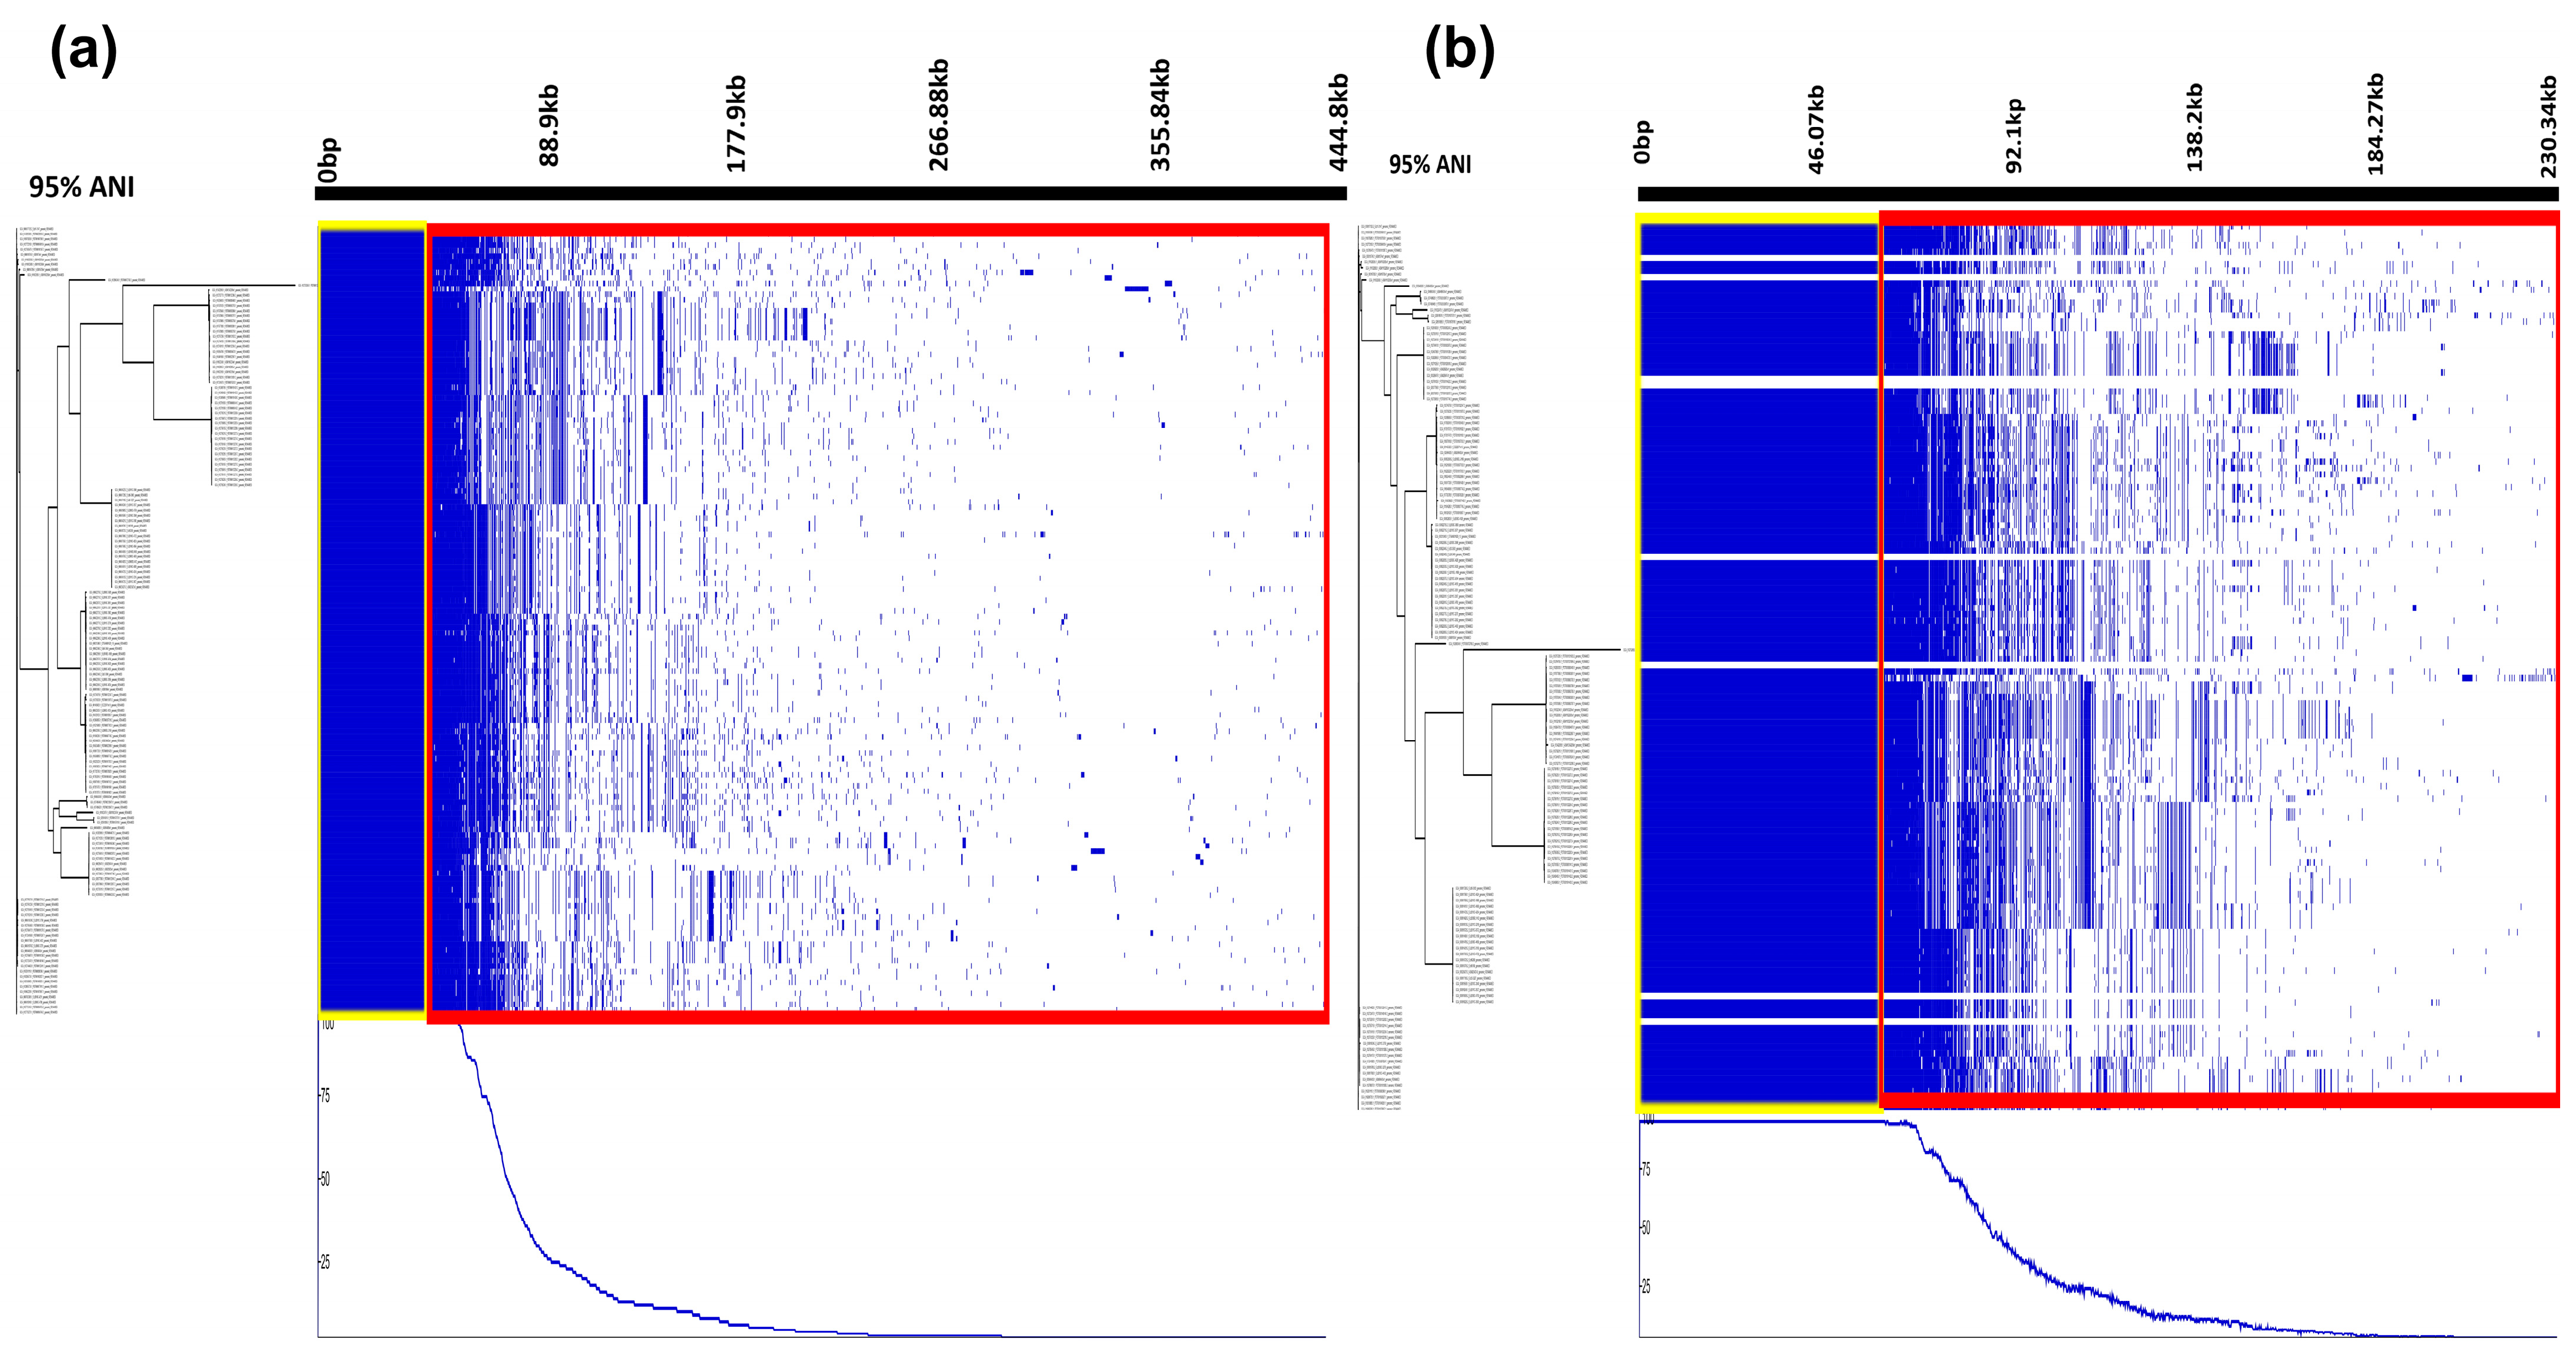
Pangenome analysis of the 160 STEC genomes using both RIBAP and Panaroo revealed an open pangenome structure, characterized by a substantially larger accessory genome than the core genome. This indicates significant genetic variability among STEC serotypes, as illustrated in Figure 2.
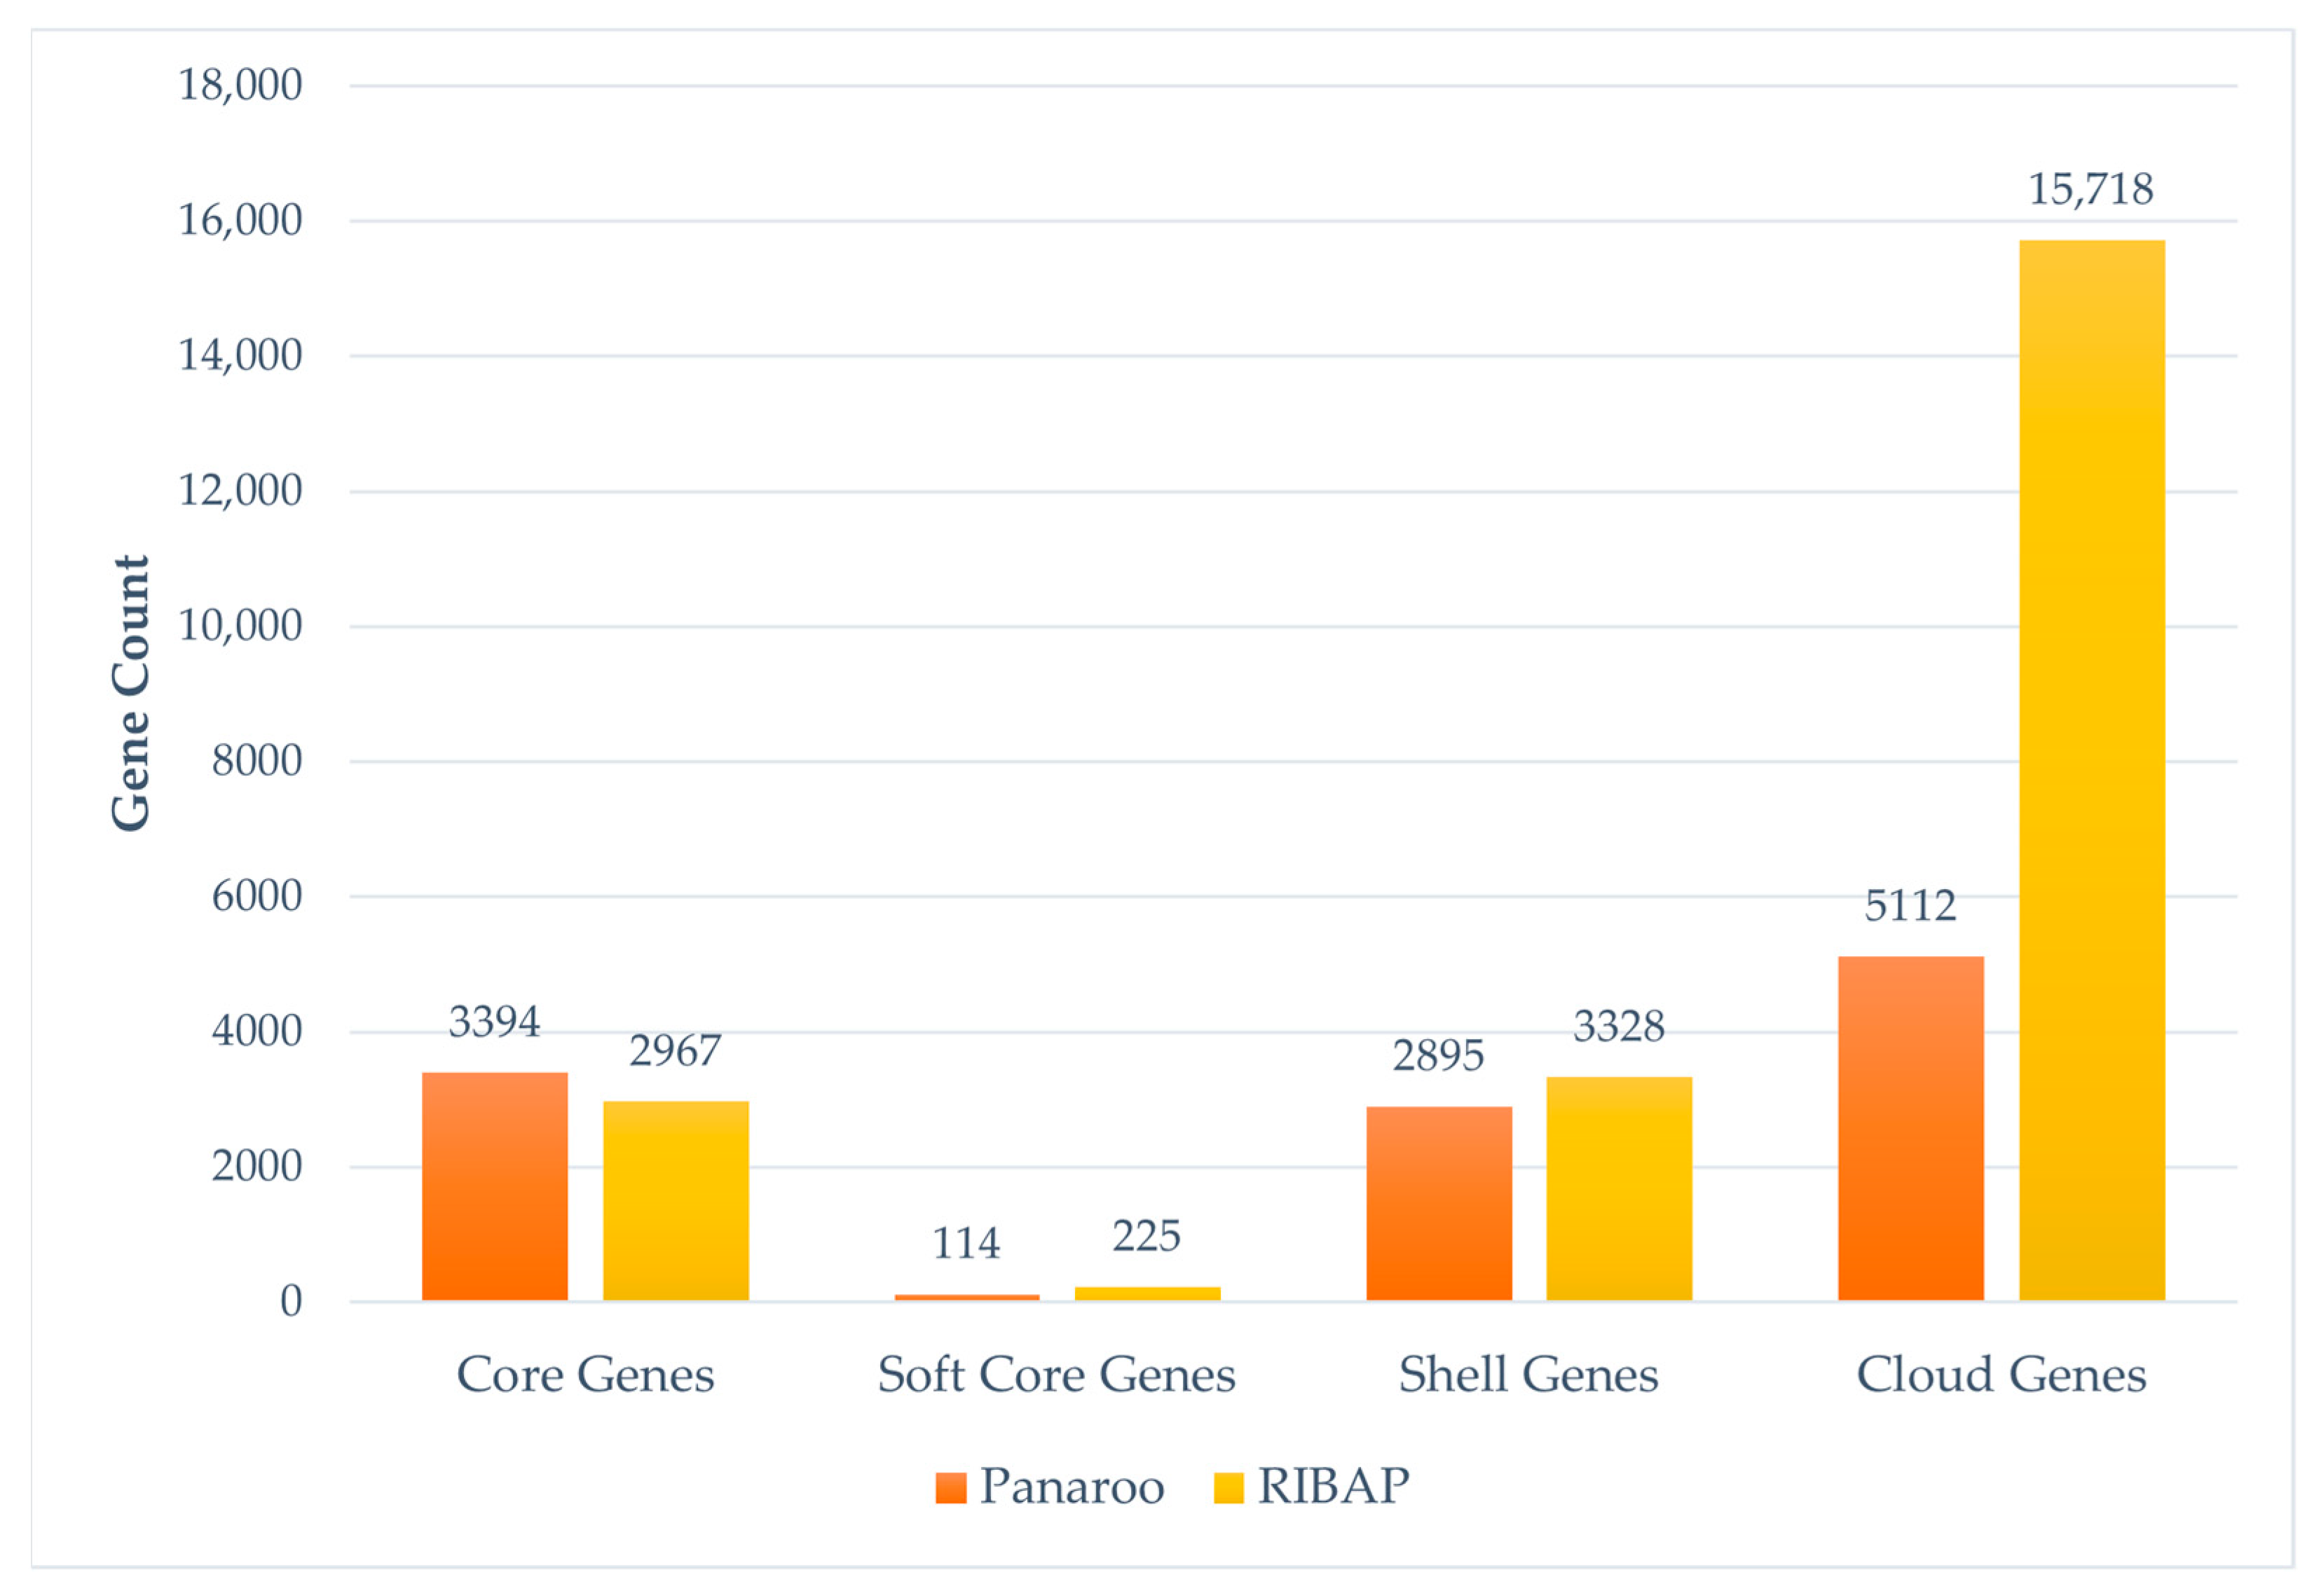
Marked differences were observed in gene category distribution and total gene counts across the two tools (Figure 3). Due to graph-based error correction and stricter filtering, Panaroo identified 11,515 gene clusters significantly fewer than 22,238 clusters detected by RIBAP.
Panaroo reported a core genome of 3394 genes, which was higher than the 2967 core genes identified by RIBAP (Figure 2). Additionally, Panaroo’s stringiest criteria resulted in fewer soft-core genes (present in 95–99% of genomes)—114 genes, compared to 225 identified by RIBAP.
RIBAP identified 3328 shell genes (genes present in 15–95% of genomes), while Panaroo reported 2895 identified (Figure 3).
A notable pattern in the gene presence/absence matrix was that, unlike RIBAP, Panaroo’s output exhibited a fractionated profile, seen as white streaks extending from the core to accessory gene segment (Figure 2).
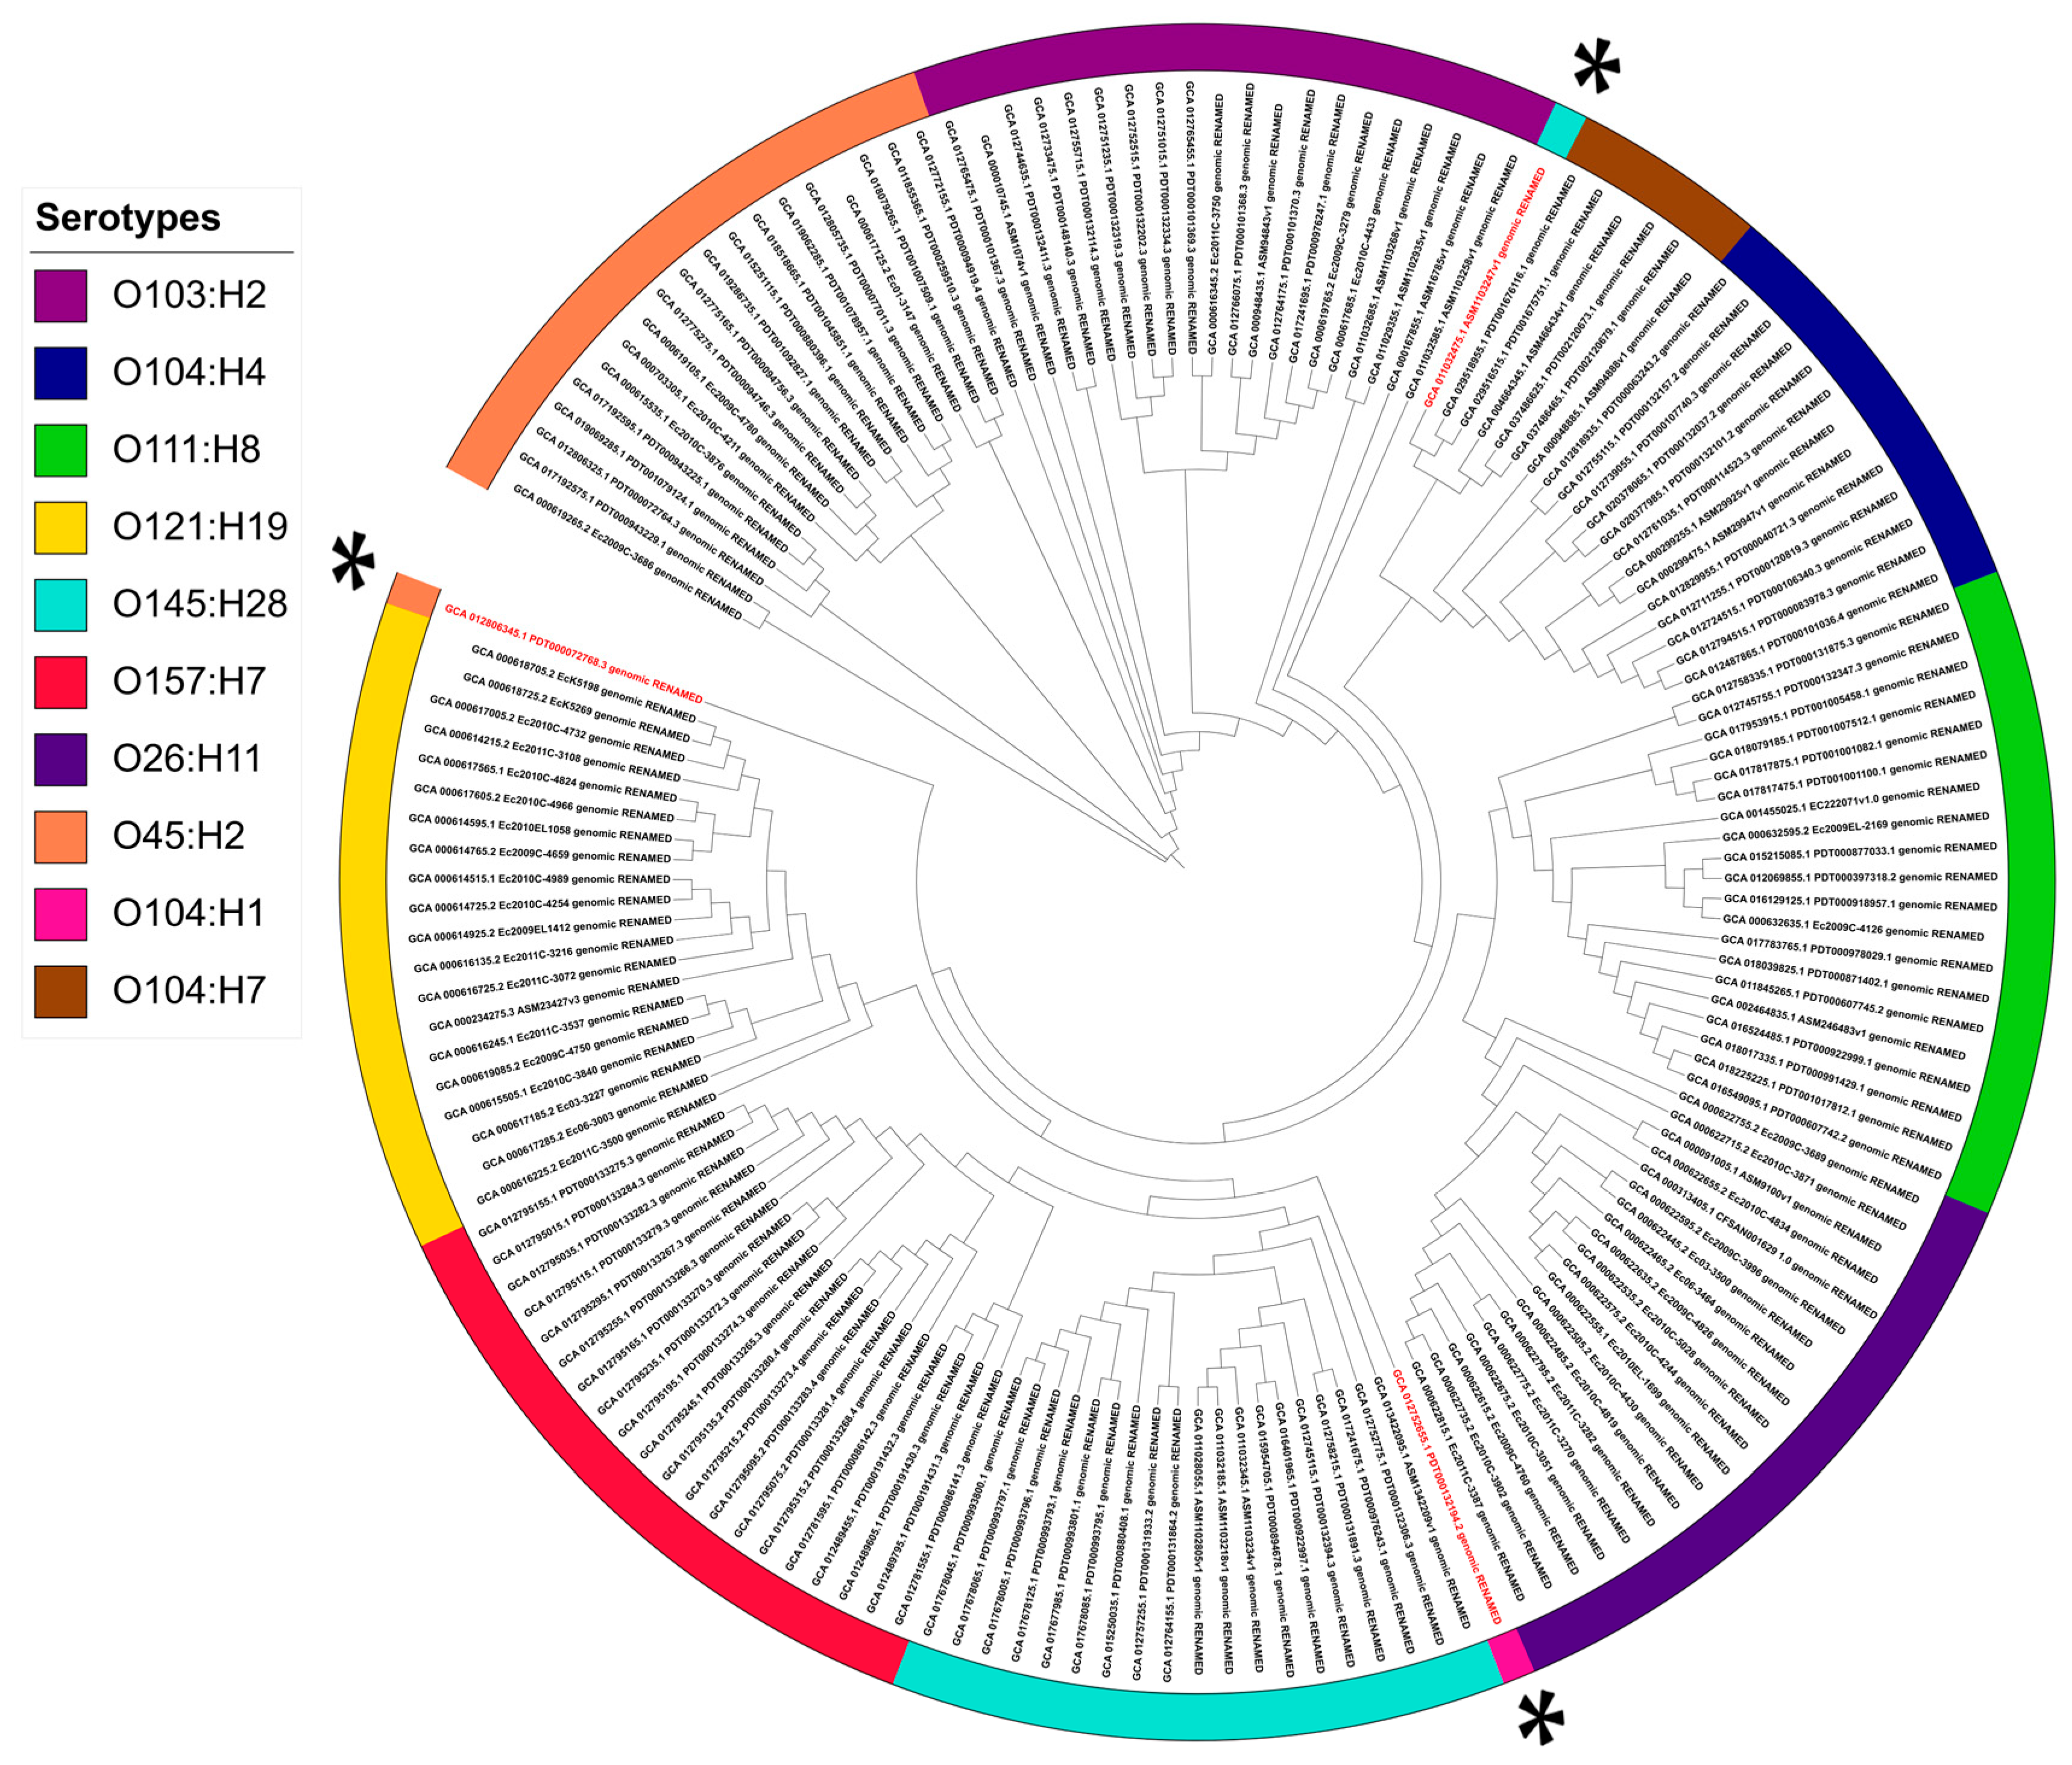
Moreover, three genomes were positioned outside their expected serotype clade. For example, one genome of O145:H28 isolates clustered within the O104:H7 lineage, one O104:H1 genome nested within the O157:H7 clade away from O104:H4 and O104:H7 clades, and individual genome of O45:H2 was clustered in a clade near the O121:H19/O157:H7 clade as shown in (Figure 4).

3.2. Identification and Validation of Specific Genetic Markers for Major Shiga Toxin-Producing Escherichia coli Serogroups

A total of 48 candidate genetic markers were identified as serogroup-specific for the major Shiga toxin-producing Escherichia coli (STEC) serogroups, as summarized in Table 1. For each serogroup, two to thirteen unique genes were selected from the presence/absence matrices and subsequently validated.
BLASTN analysis of the candidate genes demonstrated high specificity. Most markers achieved 100% sequence identity and coverage, with a little of cross-reactivity against non-target serogroups or unrelated bacterial taxa (Supplementary Table S2).

3.3. Functional Characterization of Serogroup-Specific Genes via Gene Ontology Annotation

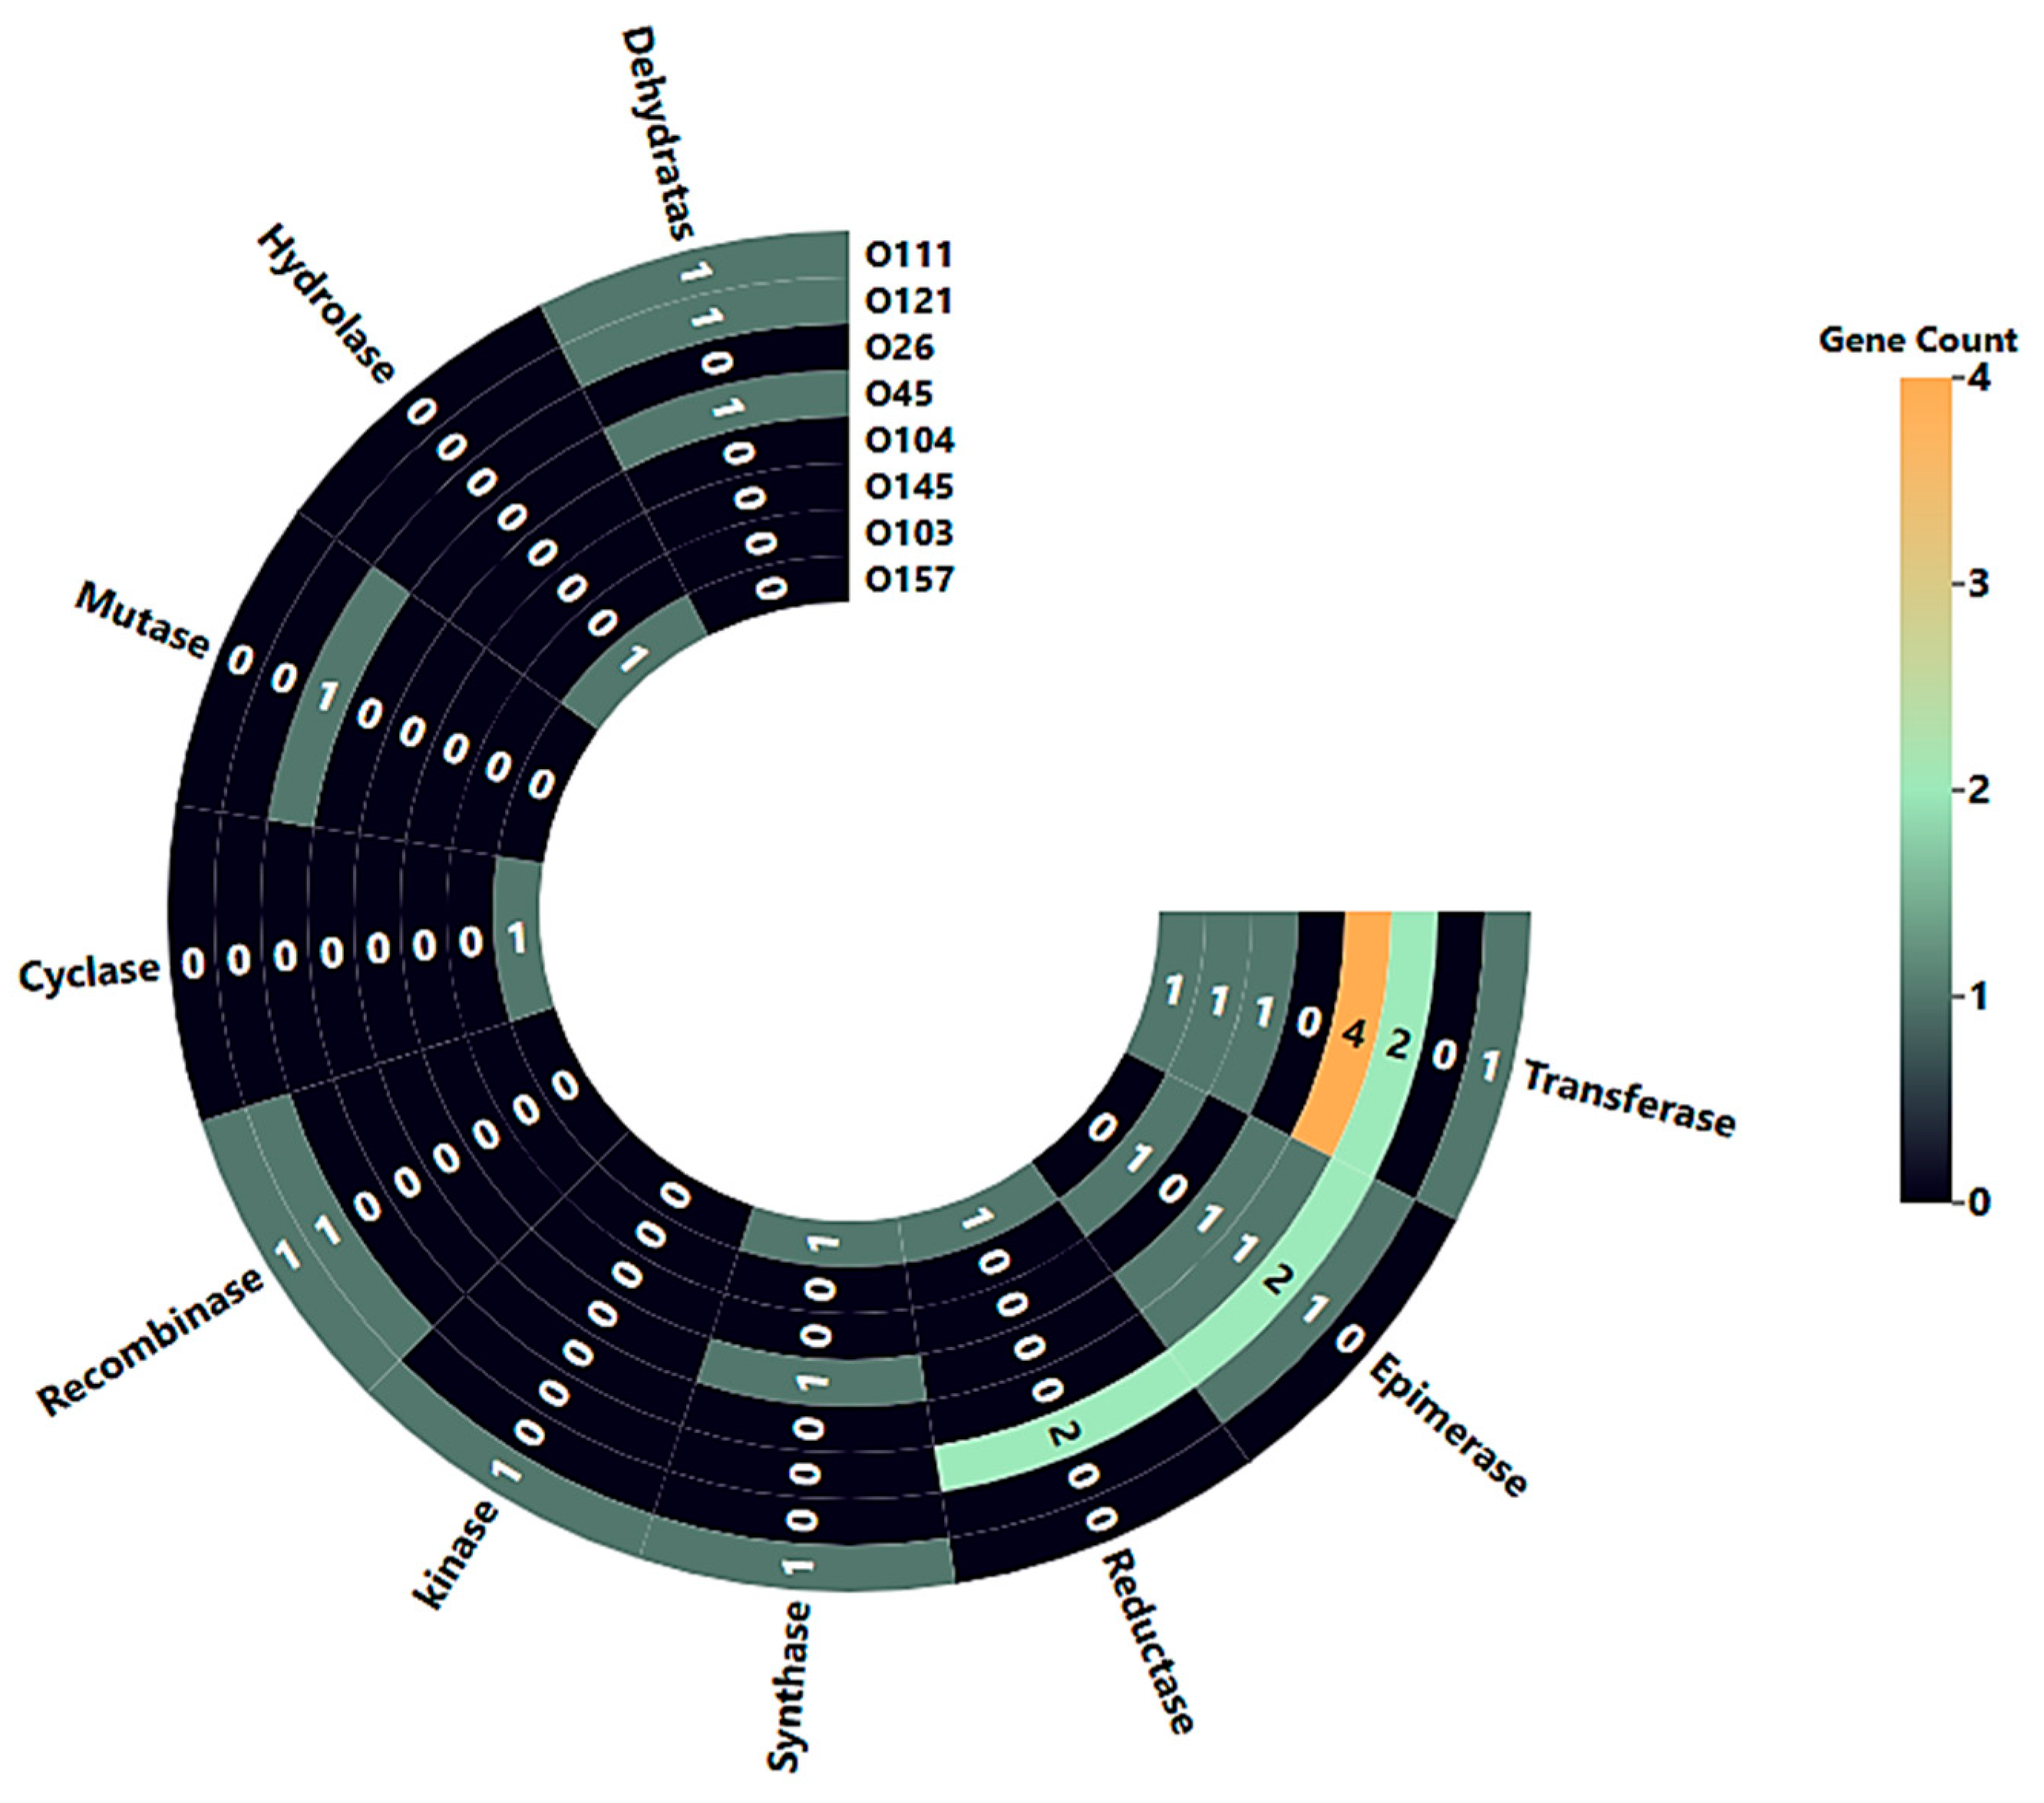
Gene Ontology (GO) annotation using the UniProt database revealed that 31 out of the 48 serogroup-specific candidate genes encode enzymes. These enzymes were classified by molecular function into various categories, including transferases (10/31), epimerases (6/31), reductases (3/31), synthase (3/31), kinase (1/31), recombinase (2/31), cyclase (1/31), mutase (1/31), hydrolase (1/31), and dehydratases (3/31), as illustrated in Figure 5.
Subcellular localization predictions indicate that most enzymes were cytoplasmic, while several were membrane-associated. Notably, key membrane-targeted proteins included WecA_1, chiP_1, dgcE_2, dmsA_1, pglJ, yehC 1, rfbX, wzc, and wzzB (see Table 1).
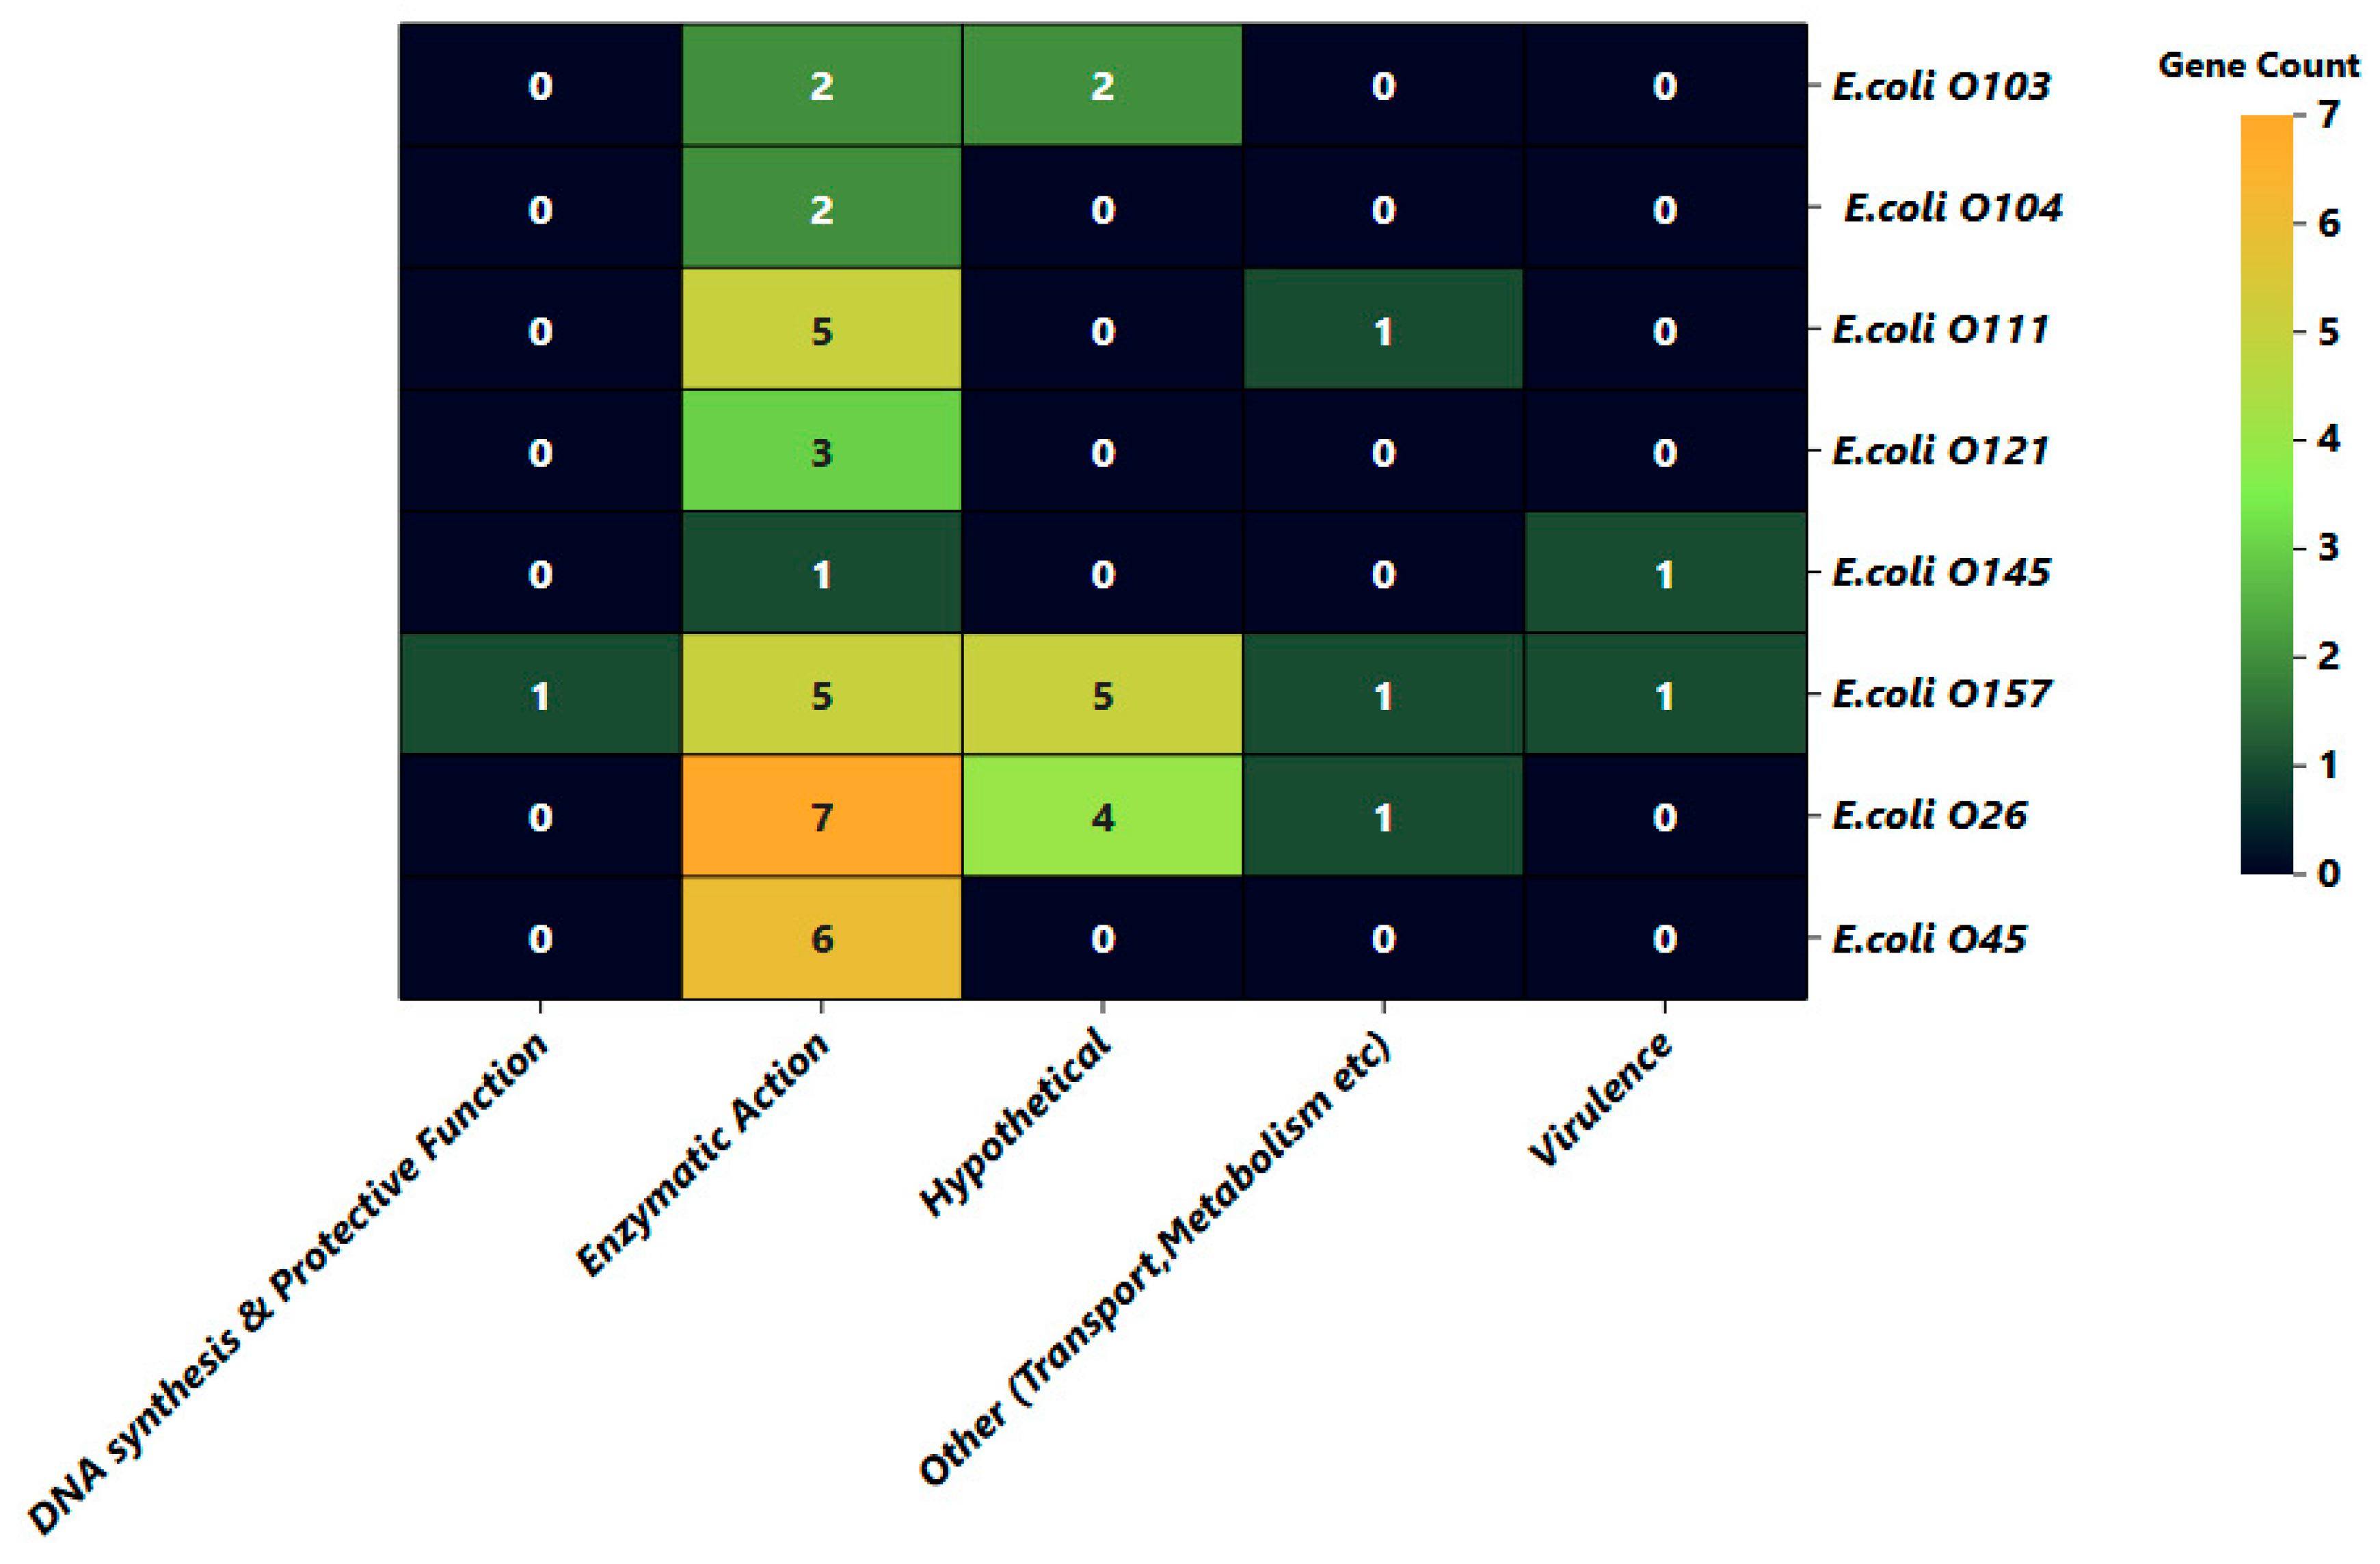
Additionally, the 48 identified genes were categorized into five major functional groups based on their biological roles, as shown in Figure 6. It is noteworthy that 11 out of 48 (22.91%) of the identified proteins were annotated as hypothetical.

4. Discussion

Pangenome analysis has entered a new era of complexity, driven by the availability of thousands of complete genomic sequences from diverse strains of the same species [53]. In this study, we conducted a comprehensive pangenome analysis of 160 shiga toxin-producing Escherichia coli (STEC) genomes, encompassing eight clinically important serogroups. The aim was to identify promising genetic markers for serogroup-specific identification and to characterize the overall pangenome structure of STEC.
Our findings revealed that RIBAP was significantly more computationally demanding than Panaroo, largely due to its pairwise comparison method that employs integer linear programming (ILP). As previously reported by Lamkiewicz et al. [34], analyzing even 71 genomes with RIBAP can require up to 3.4 TB of disk space. This resource-intense nature posed a limitation in our study, which involved a considerably larger dataset of 160 genomes.
When comparing the pangenome matrices generated by Panaroo and RIBAP, we observed that Panaroo’s matrix exhibited distinct white streaks for certain genomes, an indication of missing gene calls or data filtering. This phenomenon is likely due to Panaroo’s stringent graph-based quality control measures, which eliminates coding sequences with frameshifts, implausible gene lengths, or assemblies with gene/contig-statistics falling outside the interquartile range of the dataset. This filtering occurs even when assemblies meet CheckM’s thresholds for ≥95% completeness and low contamination [33,38].
Despite these discrepancies, we found that the same genomes remained represented in RIBAP’s matrix. This may be attributed to RIBAP’s ILP-based refinement approach, which aims to resolve fragmented or misannotated genes and incorporate them into a reconciled pangenome profile [34], albeit at the cost of potential annotation noise and increased computational burden.
The tools used in this study, RIBAP and Panaroo differed significantly in their representation of accessory genomes, definition of core genes, and estimated total pangenome size. Panaroo produced a larger and more inclusive core genome, likely due to its graph-based filtering and alignment correction strategies, which prioritize conserved orthologs and eliminate spurious gene calls or collapsed paralogs [38]. In contrast, RIBAP applies a gene-by-gene progressive alignment strategy with stricter orthology criteria. This conservative approach results in a smaller core genome and a larger cloud gene set by assigning genes with minor sequence variations to separate clusters [34].
Despite their methodological differences, both tools consistently confirmed the open nature of the STEC pangenome characterized by a continually expanding accessory genome that exceeds the size of the core genome. This pattern reflects the high genomic plasticity and extensive horizontal gene transfer of E. coli [54] and aligns with findings from prior studies [55]. Comparatively, while Salmonella enterica genetically close to E. coli, species-level studies suggest it tends towards closed pangenome. However, at the serotype level, Salmonella also demonstrates an open pan-genome structure [56,57,58]. This contrast is attributed to the rapid depletion of the cross-serovar accessory gene pool in Salmonella enterica’s, where horizontal gene transfer predominantly occurs within serovars rather than between them, resulting in a limited number of novel genes per genome relative to genome size [56,57,58].
The remarkable genomic plasticity of STEC was further highlighted by three isolates in our dataset that failed to cluster within their expected serotype clades, leading to phylogenetic discordance (Figure 4). In silico serotyping using SerotypeFinder v2.0 (≥90% identity, ≥60% coverage) confirmed that the assigned metadata matched the predicted, serotype for all genomes, except one isolate originally identified as O145:H28, which was reassigned as O121:H7. The complete O:H serotypes for all isolates are reported in Supplementary Table S1. Additionally, one O104:H1 isolate formed a distinct lineage separate from the O104:H4/H7 cluster, which is consistent with the fact that serotypes are defined by both O and H antigens; differences in H types often reflect distinct genomic lineages within the same O group.
Furthermore, one O45:H2 isolate (ST306) clustered outside the main O45:H2 clade despite concordant O and H serogroups. Its O-antigen cluster (galF–gnd) was nearly identical to the O45:H2 reference (Kimura ≈ 0.01), yet genome-wide similarity to references was only intermediate (FastANI ≈ 98.6%; Mash ≈ 0.012–0.013), suggesting within-serotype diversity or recombination. The re-typed O121:H7 isolate clustered with O104:H7 (FastANI = 99.38%; Mash = 0.0071) and carried an O121 O-antigen locus (Kimura = 0.14), consistent with O-antigen exchange and metadata mis-serotyping. Collectively, these findings illustrate that apparent serotype–phylogeny incongruence within a shared O-serogroup may arise from different H-antigen types, recombination, and O-antigen gene cluster (OAGC) exchange, resulting in mosaic and atypical isolates. This underscores the need to interpret serotype in the context of complete O:H antigens [59,60] (Supplementary Table S3). Similar incongruences have been documented in comparative E. coli studies, where lateral gene transfer disrupts the correlation between serotypes and phylogeny [61,62], highlighting OAGC mobility of as a major driver of STEC diversity.
In this study, virulence determinants were characterized to document stx types/subtypes and eae status for each genome (Supplementary Table S1). Clear lineage-specific patterns were observed: O26:H11 and O103:H2 were predominantly eae+, stx1+ (with occasional stx1 + stx2); O111:H8 was mostly eae+ with stx1 or stx1 + stx2; O121:H19 was uniformly eae+ carrying stx2 or stx1; O145:H28 generally carried eae with stx2, stx1 or both; and O157:H7 was typically eae+, stx2+ (occasionally with stx1).
By contrast, O104 serogroup genomes were typically eae, with subsets carrying stx2+ together with aggR+ or being stx/aggR, consistence with EAEC–STEC hybrid backgrounds [63]. Rarer eae+/stx isolates likely reflect loss of the stx-converting prophages, while eae/stx+ combinations represents locus of enterocyte effacement (LEE)–negative STEC [64]. Across O104: H types, aggR was detected in (11/13) O104:H4 genomes but was absent in O104:H7/H1, similar to the O145:H28 isolate, which clustered within the O104:H7 clade and was likewise aggR. These patterns emphasize that mobile loci frequently decouple virulence profile from serotype.
Consequently, accurate detection of highly pathogenic STEC in food remains a major diagnostic challenge. Conventional culture-based diagnostic methods are labor-intensive and time-consuming, reinforcing the need for rapid and robust molecular detection approaches [65]. Such strategies could be strengthened by targeting additional genes more specifically associated with enterohemorrhagic E. coli (EHEC), particularly those simultaneously harboring stx and eae [66].
The key objective of this study was to identify and characterize serogroup-specific genetic markers across the eight major STEC serogroups. For instance, dmsA encodes a dimethyl sulfoxide (DMSO) reductase subunit involved in anaerobic respiration by converting DMSO to dimethyl sulfide [67]. fcl_2 is involved in the synthesis of GDP-fucose, a sugar crucial for O-antigens biosynthesis and surface polysaccharide variation, both of which contribute to immune evasion and serotype differentiation [68]. DgcE, which synthesizes cyclic-di-GMP, plays a regulatory role in motility, biofilm formation, and stress response, key attributes for the prolonged colonization and persistence of O157 strains in host environment [69]. Collectively, these genes reflect lineage-specific metabolic adaptations consistent with previously reported functional trait in STEC O157 serogroup.
Additionally, several genes involved in O-antigen biosynthesis and capsule modification were shown to vary by serogroup. FdtB, which contributes to the synthesis of dTDP-3-amino-3,6-dideoxy-D-galactose, was uniquely conserved in O103 serogroup, corroborating structural studies of O103-specific O-antigen sugar modifications [70]. Similarly, hisC and various capsule acetyltransferases were consistently identified in O145 serogroup, supporting the view that metabolic and capsule-associated genes are critical for molecular serotyping [71]. Other serogroup-specific genes with roles in O-antigen synthesis and transport included rfbX (wzx), wzzB, and capD. Specifically, wzzB regulates O-antigen chain length, thereby influencing lipopolysaccharide (LPS) structure and immune recognition [72,73]; capD is involved in capsule polysaccharides assembly [74], and rfbX encodes an O-unit flippase essential for O-antigen export [75].
Functional annotation of these serogroup-specific markers highlighted biological processes central to STEC pathogenicity, including O-antigen production, carbohydrate metabolism, and surface structure assembly. Several genes, such as galU, gmd, and rfbC, were associated with nucleotide sugar biosynthesis. In addition, stress response and recombination related genes, including pinR, parE4, and xerC, were identified. As noted by Sampaio et al. [76], these findings underscore the role of genome plasticity in STEC’s long term evolution and ecological adaptability.
The observed diversity in virulence and transport-associated genes among serogroups suggest distinct ecological niches and pathogenic pathways. Notably, over 22% of the identified markers were annotated as hypothetical proteins, representing a substantial subset of genes with currently unknown functions. These uncharacterized proteins may play important, yet unexplored roles in STEC virulence, environmental persistence, or resistance mechanisms, and thus represent promising targets for future functional studies.
A limitation of this study is that it focused primarily on well-established and known STEC serotypes, including the “big six” [77]. While some of these serotypes may currently be rare, their inclusion provided valuable insights into pangenome dynamic, and they may also re-emerge as public health threats in the future. Emerging serotypes such as O80:H2 [78] and O177:H11/O177:H25 [79] further highlight the need to expand genomic investigation beyond the traditional serotypes. Future studies will aim to characterize these emerging lineages for genomic markers, as demonstrated here, to support rapid and specific detection. Such efforts have the potential to generate novel perspectives and uncover new research insights.

5. Conclusions

Using a cross-validated analytical framework, this study identified high-confidence serogroup-specific gene markers that may serve as candidates for future investigation into novel virulence mechanisms or for enhancing molecular diagnostic strategies. The analysis also highlighted substantial genetic diversities among STEC isolates, with discordant phylogenetic placements largely attributable to differences in H-serogroups. Collectively, these findings advance our understanding of STEC population structure and provide a foundation for the development of improved detection and diagnostic approaches.

Supplementary Materials

The following supporting information can be downloaded at: https://www.mdpi.com/article/10.3390/pathogens14090862/s1, Table S1: Genome assembly details, including GenBank assembly accession numbers, assembly names, strain/isolate designations, virulence genes profile and serotypes; Table S2: serogroup-candidate target markers, including protein name (gene), accession number, amplicon size (bp), number of hits in the target organism, percent coverage, and sequence; Table S3: Further analysis of three discordant isolates.

Author Contributions

A.E. and K.E.B.: conceptualization, writing—original draft preparation, writing—review and editing, methodology, analysis, and visualization; E.K., R.N., V.O., Y.W. and T.J.: writing—review and editing, data curation, and visualization; T.S. and W.A.: Conceptualization, writing—review and editing, and supervision; W.A. and T.S.: funding acquisition. All authors have read and agreed to the published version of the manuscript.

Funding

This research was supported by grants from the National Institute of Food and Agriculture, United States Department of Agriculture (NIFA-USDA): 2021-38821-34710; 2022-38821-37362.

Institutional Review Board Statement

Not applicable.

Informed Consent Statement

Not applicable.

Data Availability Statement

The whole genome sequences used in this study were obtained from the National Center for Biotechnology Information (NCBI). Both their accession numbers and the corresponding Assembly accession numbers are listed in the Supplementary Materials.

Acknowledgments

The authors appreciate former and current Dean of Tuskegee University College of Veterinary Medicine, for supporting graduate research and the Center for Food Animal Health, Food Safety, and Defense Laboratory.

Conflicts of Interest

The authors declare no conflicts of interest.

References

  1. Smith, J.L.; Fratamico, P.M.; Gunther, N.W., IV. Shiga toxin-producing Escherichia coli. Adv. Appl. Microbiol. 2014, 86, 145–197. [Google Scholar]
  2. Alhadlaq, M.A.; Aljurayyad, O.I.; Almansour, A.; Al-Akeel, S.I.; Alzahrani, K.O.; Alsalman, S.A.; Yahya, R.; Al-Hindi, R.R.; Hakami, M.A.; Alshahrani, S.D. Overview of pathogenic Escherichia coli, with a focus on Shiga toxin-producing serotypes, global outbreaks (1982–2024) and food safety criteria. Gut Pathog. 2024, 16, 57. [Google Scholar] [CrossRef]
  3. Majowicz, S.E.; Scallan, E.; Jones-Bitton, A.; Sargeant, J.M.; Stapleton, J.; Angulo, F.J.; Yeung, D.H.; Kirk, M.D. Global incidence of human Shiga toxin–producing Escherichia coli infections and deaths: A systematic review and knowledge synthesis. Foodborne Pathog. Dis. 2014, 11, 447–455. [Google Scholar] [CrossRef]
  4. Ludwig, J.B.; Shi, X.; Shridhar, P.B.; Roberts, E.L.; DebRoy, C.; Phebus, R.K.; Bai, J.; Nagaraja, T. Multiplex PCR assays for the detection of one hundred and thirty seven serogroups of Shiga toxin-producing Escherichia coli associated with cattle. Front. Cell. Infect. Microbiol. 2020, 10, 378. [Google Scholar] [CrossRef] [PubMed]
  5. Zhang, X.; Payne, M.; Kaur, S.; Lan, R. Improved genomic identification, clustering, and serotyping of Shiga toxin-producing Escherichia coli using cluster/serotype-specific gene markers. Front. Cell. Infect. Microbiol. 2022, 11, 772574. [Google Scholar] [CrossRef] [PubMed]
  6. Kaper, J.B.; O’Brien, A.D. Overview and historical perspectives. Microbiol. Spectr. 2014, 2, 10. [Google Scholar] [CrossRef]
  7. Valilis, E.; Ramsey, A.; Sidiq, S.; DuPont, H.L. Non-O157 Shiga toxin-producing Escherichia coli—A poorly appreciated enteric pathogen: Systematic review. Int. J. Infect. Dis. 2018, 76, 82–87. [Google Scholar] [CrossRef] [PubMed]
  8. Capps, K.M.; Ludwig, J.B.; Shridhar, P.B.; Shi, X.; Roberts, E.; DebRoy, C.; Cernicchiaro, N.; Phebus, R.K.; Bai, J.; Nagaraja, T. Identification, Shiga toxin subtypes and prevalence of minor serogroups of Shiga toxin-producing Escherichia coli in feedlot cattle feces. Sci. Rep. 2021, 11, 8601. [Google Scholar] [CrossRef]
  9. Gould, L.H.; Mody, R.K.; Ong, K.L.; Clogher, P.; Cronquist, A.B.; Garman, K.N.; Lathrop, S.; Medus, C.; Spina, N.L.; Webb, T.H. Increased recognition of non-O157 Shiga toxin–producing Escherichia coli infections in the United States during 2000–2010: Epidemiologic features and comparison with E. coli O157 infections. Foodborne Pathog. Dis. 2013, 10, 453–460. [Google Scholar] [CrossRef]
  10. Blankenship, H.M.; Mosci, R.E.; Dietrich, S.; Burgess, E.; Wholehan, J.; McWilliams, K.; Pietrzen, K.; Benko, S.; Gatesy, T.; Rudrik, J.T. Population structure and genetic diversity of non-O157 Shiga toxin-producing Escherichia coli (STEC) clinical isolates from Michigan. Sci. Rep. 2021, 11, 4461. [Google Scholar] [CrossRef]
  11. Navarro-Garcia, F.; Sperandio, V.; Hovde, C.J. Escherichia coli O104: H4 Pathogenesis: Enteroaggregative E. coli/Shiga Toxin-Producing E. coli Explosive Cocktail of High Virulence. Microbiol. Spectr. 2014, 2, 6. [Google Scholar] [CrossRef]
  12. Delannoy, S.; Beutin, L.; Burgos, Y.; Fach, P. Specific detection of enteroaggregative hemorrhagic Escherichia coli O104: H4 strains by use of the CRISPR locus as a target for a diagnostic real-time PCR. J. Clin. Microbiol. 2012, 50, 3485–3492. [Google Scholar] [CrossRef]
  13. Zhang, W.; Bielaszewska, M.; Kunsmann, L.; Mellmann, A.; Bauwens, A.; Köck, R.; Kossow, A.; Anders, A.; Gatermann, S.; Karch, H. Lability of the pAA virulence plasmid in Escherichia coli O104: H4: Implications for virulence in humans. PLoS ONE 2013, 8, e66717. [Google Scholar] [CrossRef]
  14. Rahal, E.A.; Fadlallah, S.M.; Nassar, F.J.; Kazzi, N.; Matar, G.M. Approaches to treatment of emerging Shiga toxin-producing Escherichia coli infections highlighting the O104: H4 serotype. Front. Cell. Infect. Microbiol. 2015, 5, 24. [Google Scholar] [CrossRef] [PubMed]
  15. Karch, H.; Denamur, E.; Dobrindt, U.; Finlay, B.B.; Hengge, R.; Johannes, L.; Ron, E.Z.; Tønjum, T.; Sansonetti, P.J.; Vicente, M. The enemy within us: Lessons from the 2011 European Escherichia coli O104: H4 outbreak. EMBO Mol. Med. 2012, 4, 841–848. [Google Scholar] [CrossRef]
  16. Hirvonen, J.J.; Siitonen, A.; Kaukoranta, S.-S. Usability and Performance of CHROMagar STEC Medium in Detection of Shiga Toxin-Producing Escherichia coli Strains. J. Clin. Microbiol. 2012, 50, 3586–3590. [Google Scholar] [CrossRef]
  17. Gyles, C. Shiga toxin-producing Escherichia coli: An overview. J. Anim. Sci. 2007, 85, E45–E62. [Google Scholar] [CrossRef]
  18. Fratamico, P.M.; DebRoy, C.; Liu, Y.; Needleman, D.S.; Baranzoni, G.M.; Feng, P. Advances in molecular serotyping and subtyping of Escherichia coli. Front. Microbiol. 2016, 7, 644. [Google Scholar] [CrossRef] [PubMed]
  19. DebRoy, C.; Fratamico, P.M.; Yan, X.; Baranzoni, G.; Liu, Y.; Needleman, D.S.; Tebbs, R.; O’Connell, C.D.; Allred, A.; Swimley, M. Comparison of O-antigen gene clusters of all O-serogroups of Escherichia coli and proposal for adopting a new nomenclature for O-typing. PLoS ONE 2016, 11, e0147434. [Google Scholar]
  20. Joensen, K.G.; Tetzschner, A.M.; Iguchi, A.; Aarestrup, F.M.; Scheutz, F. Rapid and easy in silico serotyping of Escherichia coli isolates by use of whole-genome sequencing data. J. Clin. Microbiol. 2015, 53, 2410–2426. [Google Scholar] [CrossRef]
  21. Zhou, Z.; Alikhan, N.-F.; Mohamed, K.; Fan, Y.; Achtman, M.; Brown, D.; Chattaway, M.; Dallman, T.; Delahay, R.; Kornschober, C. The EnteroBase user’s guide, with case studies on Salmonella transmissions, Yersinia pestis phylogeny, and Escherichia core genomic diversity. Genome Res. 2020, 30, 138–152. [Google Scholar] [CrossRef]
  22. Didelot, X.; Wilson, D.J. ClonalFrameML: Efficient inference of recombination in whole bacterial genomes. PLoS Comput. Biol. 2015, 11, e1004041. [Google Scholar] [CrossRef]
  23. Chaudhuri, R.R.; Henderson, I.R. The evolution of the Escherichia coli phylogeny. Infect. Genet. Evol. 2012, 12, 214–226. [Google Scholar] [CrossRef]
  24. Rasko, D.A.; Moreira, C.G.; Li, D.R.; Reading, N.C.; Ritchie, J.M.; Waldor, M.K.; Williams, N.; Taussig, R.; Wei, S.; Roth, M. Targeting QseC signaling and virulence for antibiotic development. Science 2008, 321, 1078–1080. [Google Scholar] [CrossRef]
  25. Tettelin, H.; Masignani, V.; Cieslewicz, M.J.; Donati, C.; Medini, D.; Ward, N.L.; Angiuoli, S.V.; Crabtree, J.; Jones, A.L.; Durkin, A.S. Genome analysis of multiple pathogenic isolates of Streptococcus agalactiae: Implications for the microbial “pan-genome”. Proc. Natl. Acad. Sci. USA 2005, 102, 13950–13955. [Google Scholar] [CrossRef]
  26. Land, M.; Hauser, L.; Jun, S.-R.; Nookaew, I.; Leuze, M.R.; Ahn, T.-H.; Karpinets, T.; Lund, O.; Kora, G.; Wassenaar, T. Insights from 20 years of bacterial genome sequencing. Funct. Integr. Genom. 2015, 15, 141–161. [Google Scholar] [CrossRef]
  27. Gordienko, E.N.; Kazanov, M.D.; Gelfand, M.S. Evolution of pan-genomes of Escherichia coli, Shigella spp., and Salmonella enterica. J. Bacteriol. 2013, 195, 2786–2792. [Google Scholar] [CrossRef]
  28. Sheppard, S.K.; Guttman, D.S.; Fitzgerald, J.R. Population genomics of bacterial host adaptation. Nat. Rev. Genet. 2018, 19, 549–565. [Google Scholar] [CrossRef] [PubMed]
  29. Glassman, H.; Suttorp, V.; White, T.; Ziebell, K.; Kearney, A.; Bessonov, K.; Li, V.; Chui, L. Clinical Outcomes and Virulence Factors of Shiga Toxin-Producing Escherichia coli (STEC) from Southern Alberta, Canada, from 2020 to 2022. Pathogens 2024, 13, 822. [Google Scholar] [CrossRef] [PubMed]
  30. Scallan, E.; Hoekstra, R.M.; Angulo, F.J.; Tauxe, R.V.; Widdowson, M.-A.; Roy, S.L.; Jones, J.L.; Griffin, P.M. Foodborne illness acquired in the United States—Major pathogens. Emerg. Infect. Dis. 2011, 17, 7. [Google Scholar] [CrossRef] [PubMed]
  31. Brockhurst, M.A.; Harrison, E.; Hall, J.P.; Richards, T.; McNally, A.; MacLean, C. The ecology and evolution of pangenomes. Curr. Biol. 2019, 29, R1094–R1103. [Google Scholar] [CrossRef]
  32. Johnson, J.R.; Thuras, P.; Johnston, B.D.; Weissman, S.J.; Limaye, A.P.; Riddell, K.; Scholes, D.; Tchesnokova, V.; Sokurenko, E. The Pandemic H30 Subclone of Escherichia coli Sequence Type 131 Is Associated With Persistent Infections and Adverse Outcomes Independent From Its Multidrug Resistance and Associations With Compromised Hosts. Clin. Infect. Dis. 2016, 62, 1529–1536. [Google Scholar] [CrossRef] [PubMed]
  33. Parks, D.H.; Imelfort, M.; Skennerton, C.T.; Hugenholtz, P.; Tyson, G.W. CheckM: Assessing the quality of microbial genomes recovered from isolates, single cells, and metagenomes. Genome Res. 2015, 25, 1043–1055. [Google Scholar] [CrossRef] [PubMed]
  34. Lamkiewicz, K.; Barf, L.-M.; Sachse, K.; Hölzer, M. RIBAP: A comprehensive bacterial core genome annotation pipeline for pangenome calculation beyond the species level. Genome Biol. 2024, 25, 170. [Google Scholar] [CrossRef] [PubMed]
  35. Page, A.J.; Cummins, C.A.; Hunt, M.; Wong, V.K.; Reuter, S.; Holden, M.T.; Fookes, M.; Falush, D.; Keane, J.A.; Parkhill, J. Roary: Rapid large-scale prokaryote pan genome analysis. Bioinformatics 2015, 31, 3691–3693. [Google Scholar] [CrossRef]
  36. Seemann, T. Prokka: Rapid prokaryotic genome annotation. Bioinformatics 2014, 30, 2068–2069. [Google Scholar] [CrossRef]
  37. Di Tommaso, P.; Chatzou, M.; Floden, E.W.; Barja, P.P.; Palumbo, E.; Notredame, C. Nextflow enables reproducible computational workflows. Nat. Biotechnol. 2017, 35, 316–319. [Google Scholar] [CrossRef]
  38. Tonkin-Hill, G.; MacAlasdair, N.; Ruis, C.; Weimann, A.; Horesh, G.; Lees, J.A.; Gladstone, R.A.; Lo, S.; Beaudoin, C.; Floto, R.A. Producing polished prokaryotic pangenomes with the Panaroo pipeline. Genome Biol. 2020, 21, 180. [Google Scholar] [CrossRef]
  39. Liu, B.; Zheng, D.; Zhou, S.; Chen, L.; Yang, J. VFDB 2022: A general classification scheme for bacterial virulence factors. Nucleic Acids Res. 2022, 50, D912–D917. [Google Scholar] [CrossRef]
  40. Seemann, T. Abricate [Internet]. Github. Available online: https://github.com/tseemann/abricate (accessed on 10 August 2025).
  41. Letunic, I.; Bork, P. Interactive Tree Of Life (iTOL) v5: An online tool for phylogenetic tree display and annotation. Nucleic Acids Res. 2021, 49, W293–W296. [Google Scholar] [CrossRef]
  42. Seemann, T. Scan Contig Files Against PubMLST Typing Schemes. Available online: https://github.com/tseemann/mlst (accessed on 4 June 2025).
  43. Jain, C.; Rodriguez, R.L.M.; Phillippy, A.M.; Konstantinidis, K.T.; Aluru, S. High throughput ANI analysis of 90K prokaryotic genomes reveals clear species boundaries. Nat. Commun. 2018, 9, 5114. [Google Scholar] [CrossRef]
  44. Ondov, B.D.; Treangen, T.J.; Melsted, P.; Mallonee, A.B.; Bergman, N.H.; Koren, S.; Phillippy, A.M. Mash: Fast genome and metagenome distance estimation using MinHash. Genome Biol. 2016, 17, 132. [Google Scholar] [CrossRef]
  45. Li, H.; Handsaker, B.; Wysoker, A.; Fennell, T.; Ruan, J.; Homer, N.; Marth, G.; Abecasis, G.; Durbin, R.; Subgroup, G.P.D.P. The sequence alignment/map format and SAMtools. Bioinformatics 2009, 25, 2078–2079. [Google Scholar] [CrossRef] [PubMed]
  46. Katoh, K.; Standley, D.M. MAFFT multiple sequence alignment software version 7: Improvements in performance and usability. Mol. Biol. Evol. 2013, 30, 772–780. [Google Scholar] [CrossRef] [PubMed]
  47. Rice, P.; Longden, I.; Bleasby, A. EMBOSS: The European molecular biology open software suite. Trends Genet. 2000, 16, 276–277. [Google Scholar] [CrossRef]
  48. Geue, L.; Menge, C.; Eichhorn, I.; Semmler, T.; Wieler, L.H.; Pickard, D.; Berens, C.; Barth, S.A. Evidence for contemporary switching of the O-antigen gene cluster between Shiga toxin-producing Escherichia coli strains colonizing cattle. Front. Microbiol. 2017, 8, 424. [Google Scholar] [CrossRef] [PubMed]
  49. Hadfield, J.; Megill, C.; Bell, S.M.; Huddleston, J.; Potter, B.; Callender, C.; Sagulenko, P.; Bedford, T.; Neher, R.A. Nextstrain: Real-time tracking of pathogen evolution. Bioinformatics 2018, 34, 4121–4123. [Google Scholar] [CrossRef]
  50. Wickham, H.; Sievert, C. ggplot2: Elegant Graphics for Data Analysis; Springer: New York, NY, USA, 2009; Volume 10. [Google Scholar]
  51. Pedersen, T.L. Ggforce: Accelerating “ggplot2”. 2024. Available online: https://cran.r-project.org/web/packages/ggforce/index.html (accessed on 17 April 2025).
  52. Garnier, S.; Ross, N.; Rudis, B.; Sciaini, M.; Camargo, A.P.; Scherer, C. R Package ‘Viridis’. 2021. Available online: https://cran.r-project.org/package=viridis (accessed on 17 April 2025).
  53. Chauhan, S.M.; Ardalani, O.; Hyun, J.C.; Monk, J.M.; Phaneuf, P.V.; Palsson, B.O. Decomposition of the pangenome matrix reveals a structure in gene distribution in the Escherichia coli species. mSphere 2025, 10, e00532-24. [Google Scholar] [CrossRef]
  54. Touchon, M.; Perrin, A.; De Sousa, J.A.M.; Vangchhia, B.; Burn, S.; O’Brien, C.L.; Denamur, E.; Gordon, D.; Rocha, E.P. Phylogenetic background and habitat drive the genetic diversification of Escherichia coli. PLoS Genet. 2020, 16, e1008866. [Google Scholar] [CrossRef]
  55. Collis, R.M.; Biggs, P.J.; Midwinter, A.C.; Browne, A.S.; Wilkinson, D.A.; Irshad, H.; French, N.P.; Brightwell, G.; Cookson, A.L. Genomic epidemiology and carbon metabolism of Escherichia coli serogroup O145 reflect contrasting phylogenies. PLoS ONE 2020, 15, e0235066. [Google Scholar] [CrossRef]
  56. Laing, C.R.; Whiteside, M.D.; Gannon, V.P. Pan-genome analyses of the species Salmonella enterica, and identification of genomic markers predictive for species, subspecies, and serovar. Front. Microbiol. 2017, 8, 1345. [Google Scholar] [CrossRef]
  57. Jacobsen, A.; Hendriksen, R.S.; Aaresturp, F.M.; Ussery, D.W.; Friis, C. The Salmonella enterica pan-genome. Microb. Ecol. 2011, 62, 487–504. [Google Scholar] [CrossRef]
  58. Tettelin, H.; Riley, D.; Cattuto, C.; Medini, D. Comparative genomics: The bacterial pan-genome. Curr. Opin. Microbiol. 2008, 11, 472–477. [Google Scholar] [CrossRef]
  59. Kaas, R.S.; Friis, C.; Ussery, D.W.; Aarestrup, F.M. Estimating variation within the genes and inferring the phylogeny of 186 sequenced diverse Escherichia coli genomes. BMC Genom. 2012, 13, 577. [Google Scholar] [CrossRef]
  60. Touchon, M.; Hoede, C.; Tenaillon, O.; Barbe, V.; Baeriswyl, S.; Bidet, P.; Bingen, E.; Bonacorsi, S.; Bouchier, C.; Bouvet, O. Organised genome dynamics in the Escherichia coli species results in highly diverse adaptive paths. PLoS Genet. 2009, 5, e1000344. [Google Scholar] [CrossRef]
  61. Ingle, D.J.; Valcanis, M.; Kuzevski, A.; Tauschek, M.; Inouye, M.; Stinear, T.; Levine, M.M.; Robins-Browne, R.M.; Holt, K.E. In silico serotyping of E. coli from short read data identifies limited novel O-loci but extensive diversity of O: H serotype combinations within and between pathogenic lineages. Microb. Genom. 2016, 2, e000064. [Google Scholar] [CrossRef]
  62. Hazen, T.H.; Sahl, J.W.; Fraser, C.M.; Donnenberg, M.S.; Scheutz, F.; Rasko, D.A. Refining the pathovar paradigm via phylogenomics of the attaching and effacing Escherichia coli. Proc. Natl. Acad. Sci. USA 2013, 110, 12810–12815. [Google Scholar] [CrossRef] [PubMed]
  63. Lang, C.; Fruth, A.; Campbell, I.W.; Jenkins, C.; Smith, P.; Strockbine, N.; Weill, F.-X.; Nübel, U.; Grad, Y.H.; Waldor, M.K. O-antigen diversification masks identification of highly pathogenic shiga toxin-producing Escherichia coli O104: H4-Like strains. Microbiol. Spectr. 2023, 11, e0098723. [Google Scholar] [CrossRef]
  64. Krause, M.; Barth, H.; Schmidt, H. Toxins of locus of enterocyte effacement-negative Shiga toxin-producing Escherichia coli. Toxins 2018, 10, 241. [Google Scholar] [CrossRef] [PubMed]
  65. Kuufire, E.; Bentum, K.E.; Nyarku, R.; Osei, V.; Elrefaey, A.; James, T.; Woube, Y.; Folitse, R.; Samuel, T.; Abebe, W. Identification of Novel Gene-Specific Markers for Differentiating Various Pathogenic Campylobacter Species Using a Pangenome Analysis Approach. Pathogens 2025, 14, 477. [Google Scholar] [CrossRef] [PubMed]
  66. Delannoy, S.; Tran, M.-L.; Fach, P. Insights into the assessment of highly pathogenic Shiga toxin-producing Escherichia coli in raw milk and raw milk cheeses by high throughput real-time PCR. Int. J. Food Microbiol. 2022, 366, 109564. [Google Scholar] [CrossRef]
  67. Sambasivarao, D.; Weiner, J.H. Dimethyl sulfoxide reductase of Escherichia coli: An investigation of function and assembly by use of in vivo complementation. J. Bacteriol. 1991, 173, 5935–5943. [Google Scholar] [CrossRef] [PubMed]
  68. Samuel, G.; Reeves, P. Biosynthesis of O-antigens: Genes and pathways involved in nucleotide sugar precursor synthesis and O-antigen assembly. Carbohydr. Res. 2003, 338, 2503–2519. [Google Scholar] [CrossRef] [PubMed]
  69. Pfiffer, V.; Sarenko, O.; Possling, A.; Hengge, R. Genetic dissection of Escherichia coli’s master diguanylate cyclase DgcE: Role of the N-terminal MASE1 domain and direct signal input from a GTPase partner system. PLoS Genet. 2019, 15, e1008059. [Google Scholar] [CrossRef]
  70. Liu, B.; Perepelov, A.V.; Svensson, M.V.; Shevelev, S.D.; Guo, D.; Senchenkova, S.y.N.; Shashkov, A.S.; Weintraub, A.; Feng, L.; Widmalm, G. Genetic and structural relationships of Salmonella O55 and Escherichia coli O103 O-antigens and identification of a 3-hydroxybutanoyltransferase gene involved in the synthesis of a Fuc3N derivative. Glycobiology 2010, 20, 679–688. [Google Scholar] [CrossRef]
  71. Sivaraman, J.; Li, Y.; Larocque, R.; Schrag, J.D.; Cygler, M.; Matte, A. Crystal structure of histidinol phosphate aminotransferase (HisC) from Escherichia coli, and its covalent complex with pyridoxal-5′-phosphate and l-histidinol phosphate. J. Mol. Biol. 2001, 311, 761–776. [Google Scholar] [CrossRef]
  72. Kalynych, S.; Ruan, X.; Valvano, M.A.; Cygler, M. Structure-guided investigation of lipopolysaccharide O-antigen chain length regulators reveals regions critical for modal length control. J. Bacteriol. 2011, 193, 3710–3721. [Google Scholar] [CrossRef] [PubMed]
  73. Islam, S.T.; Huszczynski, S.M.; Nugent, T.; Gold, A.C.; Lam, J.S. Conserved-residue mutations in Wzy affect O-antigen polymerization and Wzz-mediated chain-length regulation in Pseudomonas aeruginosa PAO1. Sci. Rep. 2013, 3, 3441. [Google Scholar] [CrossRef]
  74. Han, Y.; Luo, P.; Zeng, H.; Wang, P.; Xu, J.; Chen, P.; Chen, X.; Chen, Y.; Cao, Q.; Zhai, R. The effect of O-antigen length determinant wzz on the immunogenicity of Salmonella Typhimurium for Escherichia coli O2 O-polysaccharides delivery. Vet. Res. 2023, 54, 15. [Google Scholar] [CrossRef]
  75. Liu, D.; Cole, R.A.; Reeves, P.R. An O-antigen processing function for Wzx (RfbX): A promising candidate for O-unit flippase. J. Bacteriol. 1996, 178, 2102–2107. [Google Scholar] [CrossRef]
  76. Sampaio, N.M.; Blassick, C.M.; Andreani, V.; Lugagne, J.-B.; Dunlop, M.J. Dynamic gene expression and growth underlie cell-to-cell heterogeneity in Escherichia coli stress response. Proc. Natl. Acad. Sci. USA 2022, 119, e2115032119. [Google Scholar] [CrossRef] [PubMed]
  77. Bertoldi, B.; Richardson, S.; Schneider, R.G.; Kurdmongkolthan, P.; Schneider, K.R. Preventing Foodborne Illness: E. coli “The Big Six”: FSHN13-09/FS233, rev. 1/2018. EDIS, University of Florida IFAS Extension. 2018. Available online: https://edis.ifas.ufl.edu/publication/FS233 (accessed on 11 August 2025).
  78. Mainil, J.G.; Nakamura, K.; Ikeda, R.; Crombé, F.; Diderich, J.; Saulmont, M.; Piérard, D.; Thiry, D.; Hayashi, T. Emerging hybrid shigatoxigenic and enteropathogenic Escherichia coli serotype O80: H2 in humans and calves. Clin. Microbiol. Rev. 2025, 38, e00011-25. [Google Scholar] [CrossRef] [PubMed]
  79. Bonardi, S.; Conter, M.; Andriani, L.; Bacci, C.; Magagna, G.; Rega, M.; Lamperti, L.; Loiudice, C.; Pierantoni, M.; Filipello, V. Emerging of Shiga toxin-producing Escherichia coli O177: H11 and O177: H25 from cattle at slaughter in Italy. Int. J. Food Microbiol. 2024, 423, 110846. [Google Scholar] [CrossRef] [PubMed]
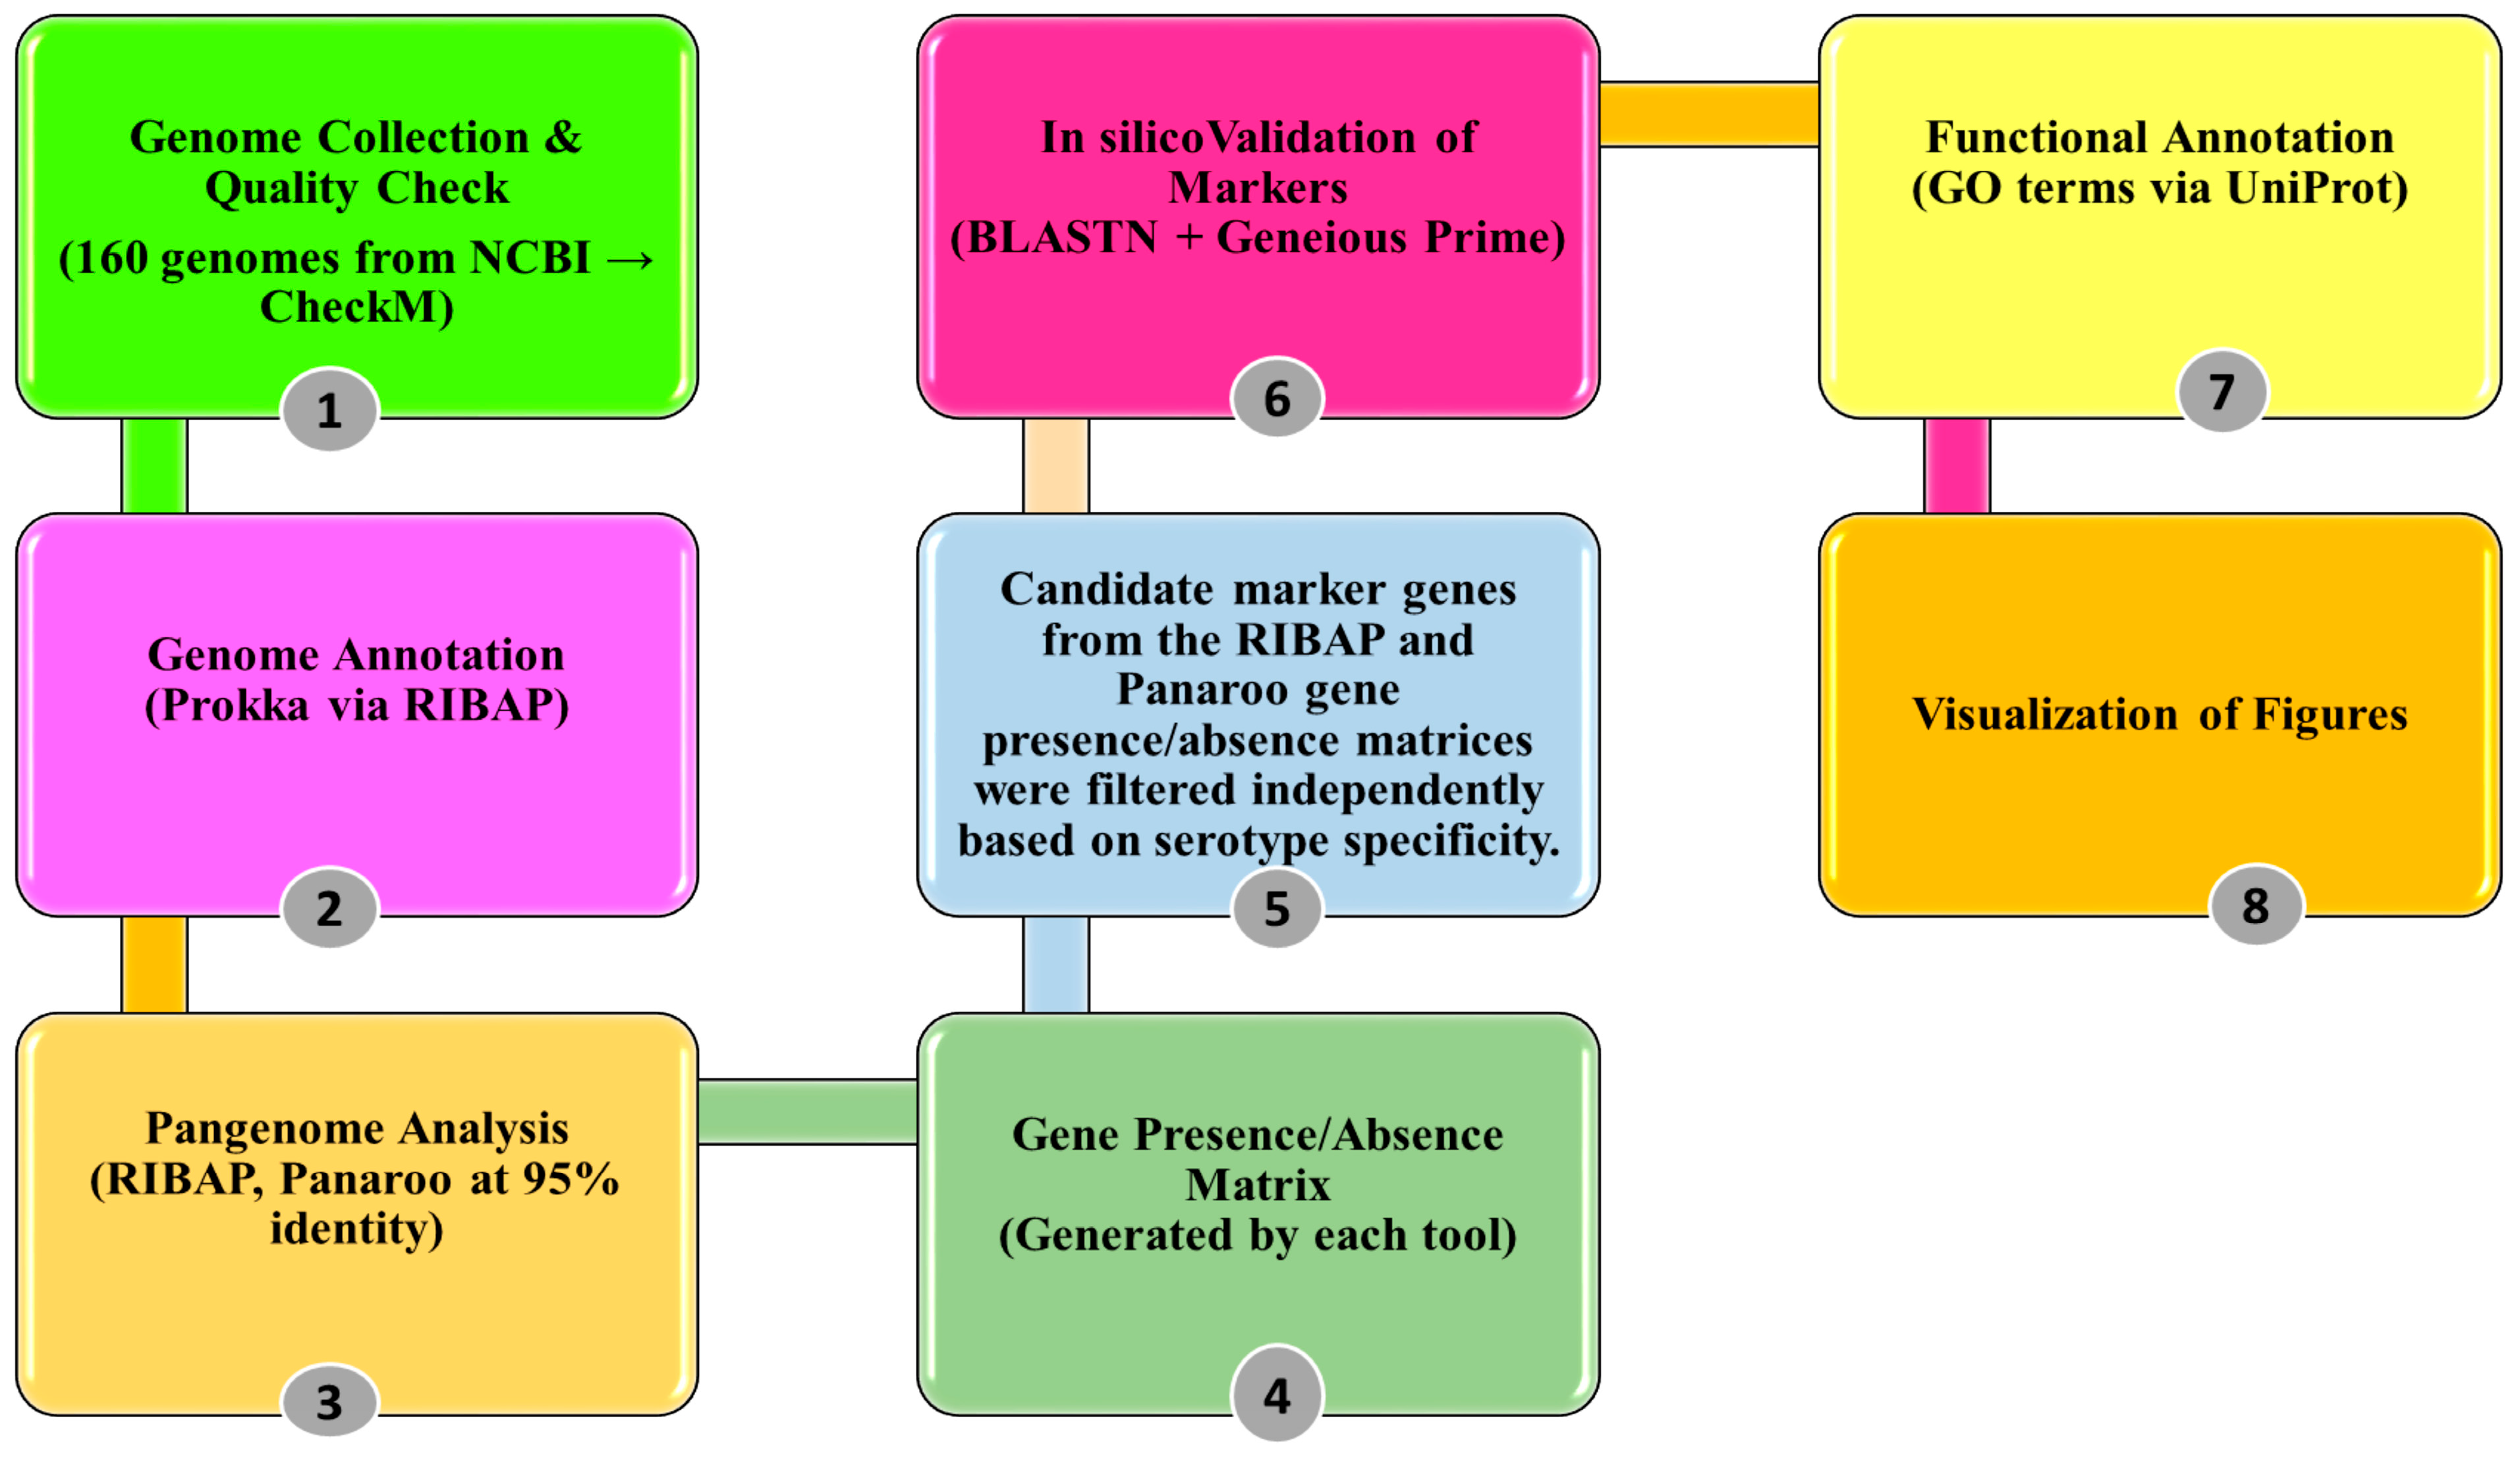
Figure 1. Workflow of Methodology.
Pathogens 14 00862 g001
Figure 2. Gene composition identified by pangenome tools in STEC genomes of eight serogroups. Bar plots compare the distribution of core, soft core, shell, and cloud genes identified by RIBAP and Panaroo. The figure illustrates differences in gene categorization and total gene counts among the tools.
Pathogens 14 00862 g002
Figure 3. Pangenome distribution and phylogenetic relationships of Shiga toxin-producing Escherichia coli (STEC) serotypes analyzed using RIBAP (a) and Panaroo (b). Core gene-based phylogenetic trees (left) illustrate the evolutionary relationships among ten STEC serotypes. Gene presence and absence are represented in blue and white, respectively. Yellow rectangles denote conserved core genome regions conserved at a 95% sequence threshold, while the red rectangles highlight accessory genome regions.
Pathogens 14 00862 g003
Figure 4. Core–genome phylogeny of STEC isolates across ten serotypes. Maximum-likelihood tree constructed from RIBAP-derived core–gene alignments. Colored outer strips correspond to serotype predictions (legend, left), illustrating the phylogenetic distribution of ten STEC serotypes. Red-labeled isolates and asterisks (*) indicate genomes that do not cluster with their expected serotype clade.
Pathogens 14 00862 g004
Figure 5. Enzyme classification of serogroup-specific genes based on UniProt Gene Ontology. Radial heatmap Illustrating the distribution of enzyme types among the 31-serotype specific proteins identified across the eight STEC serogroups.
Pathogens 14 00862 g005
Figure 6. Functional distribution of identified serogroup markers across the eight shiga toxin-producing E. coli (STEC) serogroups. The heatmap displays the distribution of identified serotype-specific genes across five major functional categories: DNA synthesis and protection, enzymatic activity, hypothetical proteins, transport/metabolism, and virulence. Color intensity reflects gene abundance, with lighter shades indicating higher counts and darker shades representing lower counts. Numeric values within each cell denote the total number of genes assigned to a specific functional category for each serogroup.
Pathogens 14 00862 g006
Table 1. Candidate markers for eight key STEC serogroups, with accession numbers, sequence lengths, and functional gene categories.
SerogroupsProtein Name (Gene)Accession No.Size (bp)Subcellular LocalizationFunctional Gene Category
O157Hypothetical proteinAAG58872.1624UnknownHypothetical
Hypothetical proteinWP_000369315.1672UnknownHypothetical
Hypothetical proteinEHV01783.1135UnknownHypothetical
Hypothetical proteinWP_000526425.1300UnknownHypothetical
YehF proteinWP_001215588.729UnknownHypothetical
GDP-L-fucose synthase (fcl_2)AAC32346.1966CytoplasmEnzymatic action
GDP-mannose mannosyl hydrolase (gmm_2)WP_000478513.1510CytoplasmEnzymatic action
Mannose-1-phosphate guanylyltransferase 1(manC1_2)WP_001278239.11449CytoplasmEnzymatic action
Putative diguanylate cyclase DgcE (dgcE_2)ASL58608.12808Inner cell membrane (cytosolic side)Enzymatic Action
Chitoporin (chiP_1)ACI72635.1480Outer membrane (porin)Others (Transport, Metabolism, etc.)
Dimethyl sulfoxide reductase (dmsA_1)WP_000380694.12382Periplasmic side of the inner cell membraneEnzymatic action
Toxin ParE4WP_000277484.1282CytoplasmVirulence
Protein YciFAAG56012.1501CytoplasmDNA synthesis and protection
O103Hypothetical proteinWP_001064117.1407UnknownHypothetical
Hypothetical proteinEJV1286191.1528UnknownHypothetical
UDP-glucose 4-epimerase (lnpD)WP_000996555.11029CytoplasmEnzymatic action
N-acetylgalactosamine-N, N’-diacetylbacillosaminyl-diphospho-undecaprenol4-alpha-N-acetylgalactosaminyltransferase(pglJ)HGU3025143.11092Membrane-associatedEnzymatic action
O145Putative fimbrial chaperone YehC (yehC 1)EKO1170350.1292Periplasmic space (inner-membrane-anchored chaperone)Virulence
Histidinol-phosphate aminotransferase (hisC)WP_001099213.11071CytoplasmEnzymatic action
O104UDP-N-acetylglucosamine 2-epimerase (neuC)WP_000723247.11164CytoplasmEnzymatic action
CMP-N, N’-diacetyllegionaminic acid synthase (Legl)EGT66549.1330CytoplasmEnzymatic action
O45Serine acetyltransferase (cysE_1)EOV7831118.1240CytoplasmEnzymatic action
dTDP-4-dehydrorhamnose 3,5-epimerase (rfbC)WP_001100944.1540CytoplasmEnzymatic action
UDP-N-acetyl-alpha-D-glucosamine C6 dehydratase (pglF)WP_001435027.11887CytoplasmEnzymatic action
UDP-N-acetylbacillosamine N-acetyltransferase (pglD)WP_000342233.1561CytoplasmEnzymatic action
Undecaprenyl-phosphate alpha-N-acetylglucosaminyl 1-phosphate transferase (wecA_1)WP_000966114.11035Inner cell membraneEnzymatic action
Glucose-1-phosphate thymidylyltransferase 2 (rffH_1)WP_000676072.1873CytoplasmEnzymatic action
O26Hypothetical proteinAOM43287.1508UnknownHypothetical
UDP-23-diacetamido-23-dideoxy-D-glucuronate 2-epimerase (wbpI)WP_000734421.11131CytoplasmEnzymatic action
UDP-2-acetamido-26-beta-L-arabino-hexul-4-ose reductase (wbjC)WP_001429673.11107CytoplasmEnzymatic action
UDP-glucose 4-epimerase (capD)WP_000475914.11035CytoplasmEnzymatic action
hypothetical proteinEET7051301.1795UnknownHypothetical
hypothetical proteinWP_000291456.11023UnknownHypothetical
Putative O-antigen transporter (rfbX)WP_000914145.11263Inner cell membraneOthers (Transport, Metabolism, etc.)
Glucose-1-phosphate thymidylyltransferase 1 (rfbA)WP_000857547.1879CytoplasmEnzymatic action
dTDP-4-dehydrorhamnose reductase (rfbD)WP_001023633.1900CytoplasmEnzymatic action
hypothetical proteinWP_001116073.11214UnknownHypothetical
D-inositol-3-phosphate glycosyltransferase (mshA_1)WP_000862644.11041CytoplasmEnzymatic action
Phosphomannomutase/phosphoglucomutase (algC)KGM70217.1836CytoplasmEnzymatic action
O121dTDP-glucose 4,6-dehydratase (rfbB)KDV82622.1712CytoplasmEnzymatic action
Tyrosine recombinase (xerC_1)WP_001234104.11212CytoplasmEnzymatic action
dTDP-4-keto-6-deoxy-D-glucose 3,5-epimerase (wbtF)EFF6995043.11116CytoplasmEnzymatic action
O111GDP-mannose 46-dehydratase (gmd_1)EGZ2997311.1561CytoplasmEnzymatic action
Serine recombinase (PinR)WP_000268365.1549CytoplasmEnzymatic action
Tyrosine-protein kinase (wzc)WP_000137212.12163Membrane-associatedEnzymatic action
UTP--glucose-1-phosphate uridylyltransferase (galF)WP_000609087.1894CytoplasmEnzymatic action
Chain length determinant protein (wzzB)WP_000027959.1984Inner cell membraneOthers (Transport, Metabolism etc.)
GDP-L-colitose synthase (colC)WP_000866332.1924CytoplasmEnzymatic action
Disclaimer/Publisher’s Note: The statements, opinions and data contained in all publications are solely those of the individual author(s) and contributor(s) and not of MDPI and/or the editor(s). MDPI and/or the editor(s) disclaim responsibility for any injury to people or property resulting from any ideas, methods, instructions or products referred to in the content.