Communication

Retrospective Epidemiological Analysis of Influenza A Infections in a Single Hospital in Korea (2007–2024): Age, Sex, and Seasonal Patterns

1
Department of Biomedical Laboratory Science, College of Health Sciences, Dankook University, Cheonan-si 31116, Republic of Korea
2
Department of Medicine, College of Medicine, Dankook University, Cheonan-si 31116, Republic of Korea
*
Author to whom correspondence should be addressed.
These authors contributed equally to this work.
Pathogens 2025, 14(3), 282; https://doi.org/10.3390/pathogens14030282
Submission received: 12 February 2025 / Revised: 4 March 2025 / Accepted: 13 March 2025 / Published: 14 March 2025

Abstract

:
Influenza A is a respiratory virus that causes high infection rates and mortality worldwide, particularly affecting high-risk groups such as children, older adults, and individuals with chronic conditions. This retrospective study was conducted at a single tertiary hospital in Korea to analyze the epidemiological characteristics of influenza A infections from 2007 to 2024, focusing on age, sex, and seasonal variations. Using multiplex real-time PCR data from 23,284 individuals, we found that the overall positivity rate for influenza A was 5.6%, with seasonal fluctuations showing the highest rate in winter (14.0%) and the lowest in summer (0.5%). Age-based analysis revealed significantly higher positivity rates in older adults (7.9%) and adults (7.6%) than in children (5.0%) and infants (3.1%). No significant differences were observed in positivity rates between sexes (male: 5.43%, female: 5.76%, p = 0.428). These findings provide essential insights into the regional and seasonal patterns of influenza A, emphasizing the importance of targeted vaccination strategies, adaptive public health interventions, and continuous surveillance for effective prevention and outbreak control management.

1. Introduction

Influenza A is a respiratory virus that causes high infection rates and mortality worldwide, resulting in millions of hospitalizations and tens of thousands of deaths each year [1,2]. It poses a significant risk to vulnerable populations such as children, older adults, and individuals with chronic diseases [3,4,5], placing a considerable burden on global healthcare systems. Influenza A exhibits seasonal epidemic patterns [6], and the regular occurrence of these outbreaks presents a significant challenge to public health management [7]. These characteristics underscore the need for influenza vaccination policies and offer opportunities for more effective infection control strategies by understanding the virus’s mutations and seasonal trends.
Moreover, long-term data are valuable for analyzing regional epidemic patterns, seasonal variations, and the vulnerability of high-risk groups [8,9]. Gathering comprehensive data dating back to 2007 can offer valuable insights into understanding the trends in the spread of influenza A virus based on its mutations and seasonal characteristics. Such an approach is crucial in informing epidemic control and prevention strategies as well as in developing effective responses and policies for mitigating regional outbreaks and protecting the high-risk populations [10,11].
This study aimed to comprehensively analyze the epidemiological characteristics of influenza A infection using multiplex real-time PCR data from 2007 to 2024. Through this, the study sought to identify trends in regional epidemics and the infection patterns among high-risk groups such as children, older adults, and individuals with chronic diseases. The findings of the study are anticipated to establish the foundational data that can be leveraged for the development of future public health management and prevention strategies.

2. Materials and Methods

2.1. Study Design

This study was designed as a retrospective observational study using data from molecular identification tests for respiratory viruses conducted at Dankook University Hospital (Cheonan-si, South Korea) during the study period. The study data include results from multiplex real-time PCR tests related to influenza A collected from 2007 to 2024.

2.2. Data Collection

This study included all individuals who underwent multiplex real-time PCR testing for respiratory viruses at Dankook University Hospital from January 2007 to December 2024. Patients were included regardless of symptom severity or clinical suspicion. Cases with missing essential data (e.g., age, sex, or test date) were excluded from the analysis to maintain data integrity. The distribution of study participants by age group and sex is shown in Table 1.

2.3. RNA Extraction and Real-Time PCR

Nucleic acid was extracted from nasal swabs using the QIAamp Viral RNA Mini Kit (Qiagen, Hilden, Germany), strictly following the manufacturer’s protocol. The extracted nucleic acid was analyzed using a multiplex real-time PCR kit (LG Life Sciences, Changwon-si, South Korea), which includes specific primers and probes for detecting the influenza A gene. PCR reactions were performed using the SLAN real-time PCR equipment (LG Life Sciences, Changwon-si, South Korea) following the manufacturer’s recommended conditions. The interpretation of PCR results was based on the cycle threshold (CT) values provided by the manufacturer. Positive results were defined as those with a CT ≤ 40, which was used as the criterion to reliably confirm the presence of the virus.

2.4. Data Preprocessing

Missing data were excluded from the analysis. Age groups were categorized based on The International Council for Harmonisation of Technical Requirements for Pharmaceuticals for Human Use (ICH) age classification guidelines used in South Korea: infant (0 years); child (1–19 years); adult (20–64 years); and older adults (65 years and above). Data were categorized by sex and test date, and seasonal and annual variables were created for analysis.

2.5. Data Analysis

Seasonal incidence frequencies were calculated, and data analysis of key variables was performed using Excel 2024. The expected positivity rates for each age group and season were determined by calculating the observed influenza A positivity rate within each subgroup and multiplying it by the total number of individuals in that group, while the expected number of negative cases was obtained by subtracting the expected positive cases from the total cases. To minimize selective testing bias, broad inclusion criteria encompassing all RT-PCR-confirmed influenza A cases were applied. Additionally, a longitudinal data analysis covering 18 years (2007–2024) was conducted to account for temporal variations in testing protocols and seasonal effects. Sex- and age-based analyses were performed using Z-tests and chi-square tests in SPSS software (version 17.0, SPSS Inc., Chicago, IL, USA), allowing comparisons of positivity rates across different demographic and seasonal subgroups and mitigating the impact of sample distribution differences.

2.6. Ethical Considerations

This study was approved by the Institutional Review Board of Dankook University (IRB No. [DKU 2023-03-004-005]). Personal identifying information was excluded from this study and data were anonymized before analysis. Informed consent from participants was waived owing to the nature of the study.

3. Results

3.1. Annual Trends of Incidence

The annual positivity rate of influenza A from 2007 to 2024 was analyzed (Figure 1). The data over 18 years showed significant fluctuations in the influenza A infection rate, with a sharp increase observed in 2009. From 2010 to 2020, the positivity rate remained relatively stable. However, in 2021 and 2022, a sharp decline was observed. During this period, the transmission of influenza A was significantly suppressed, leading to a near-zero positivity rate. The positivity rate increased again in 2023.

3.2. Seasonal Patterns

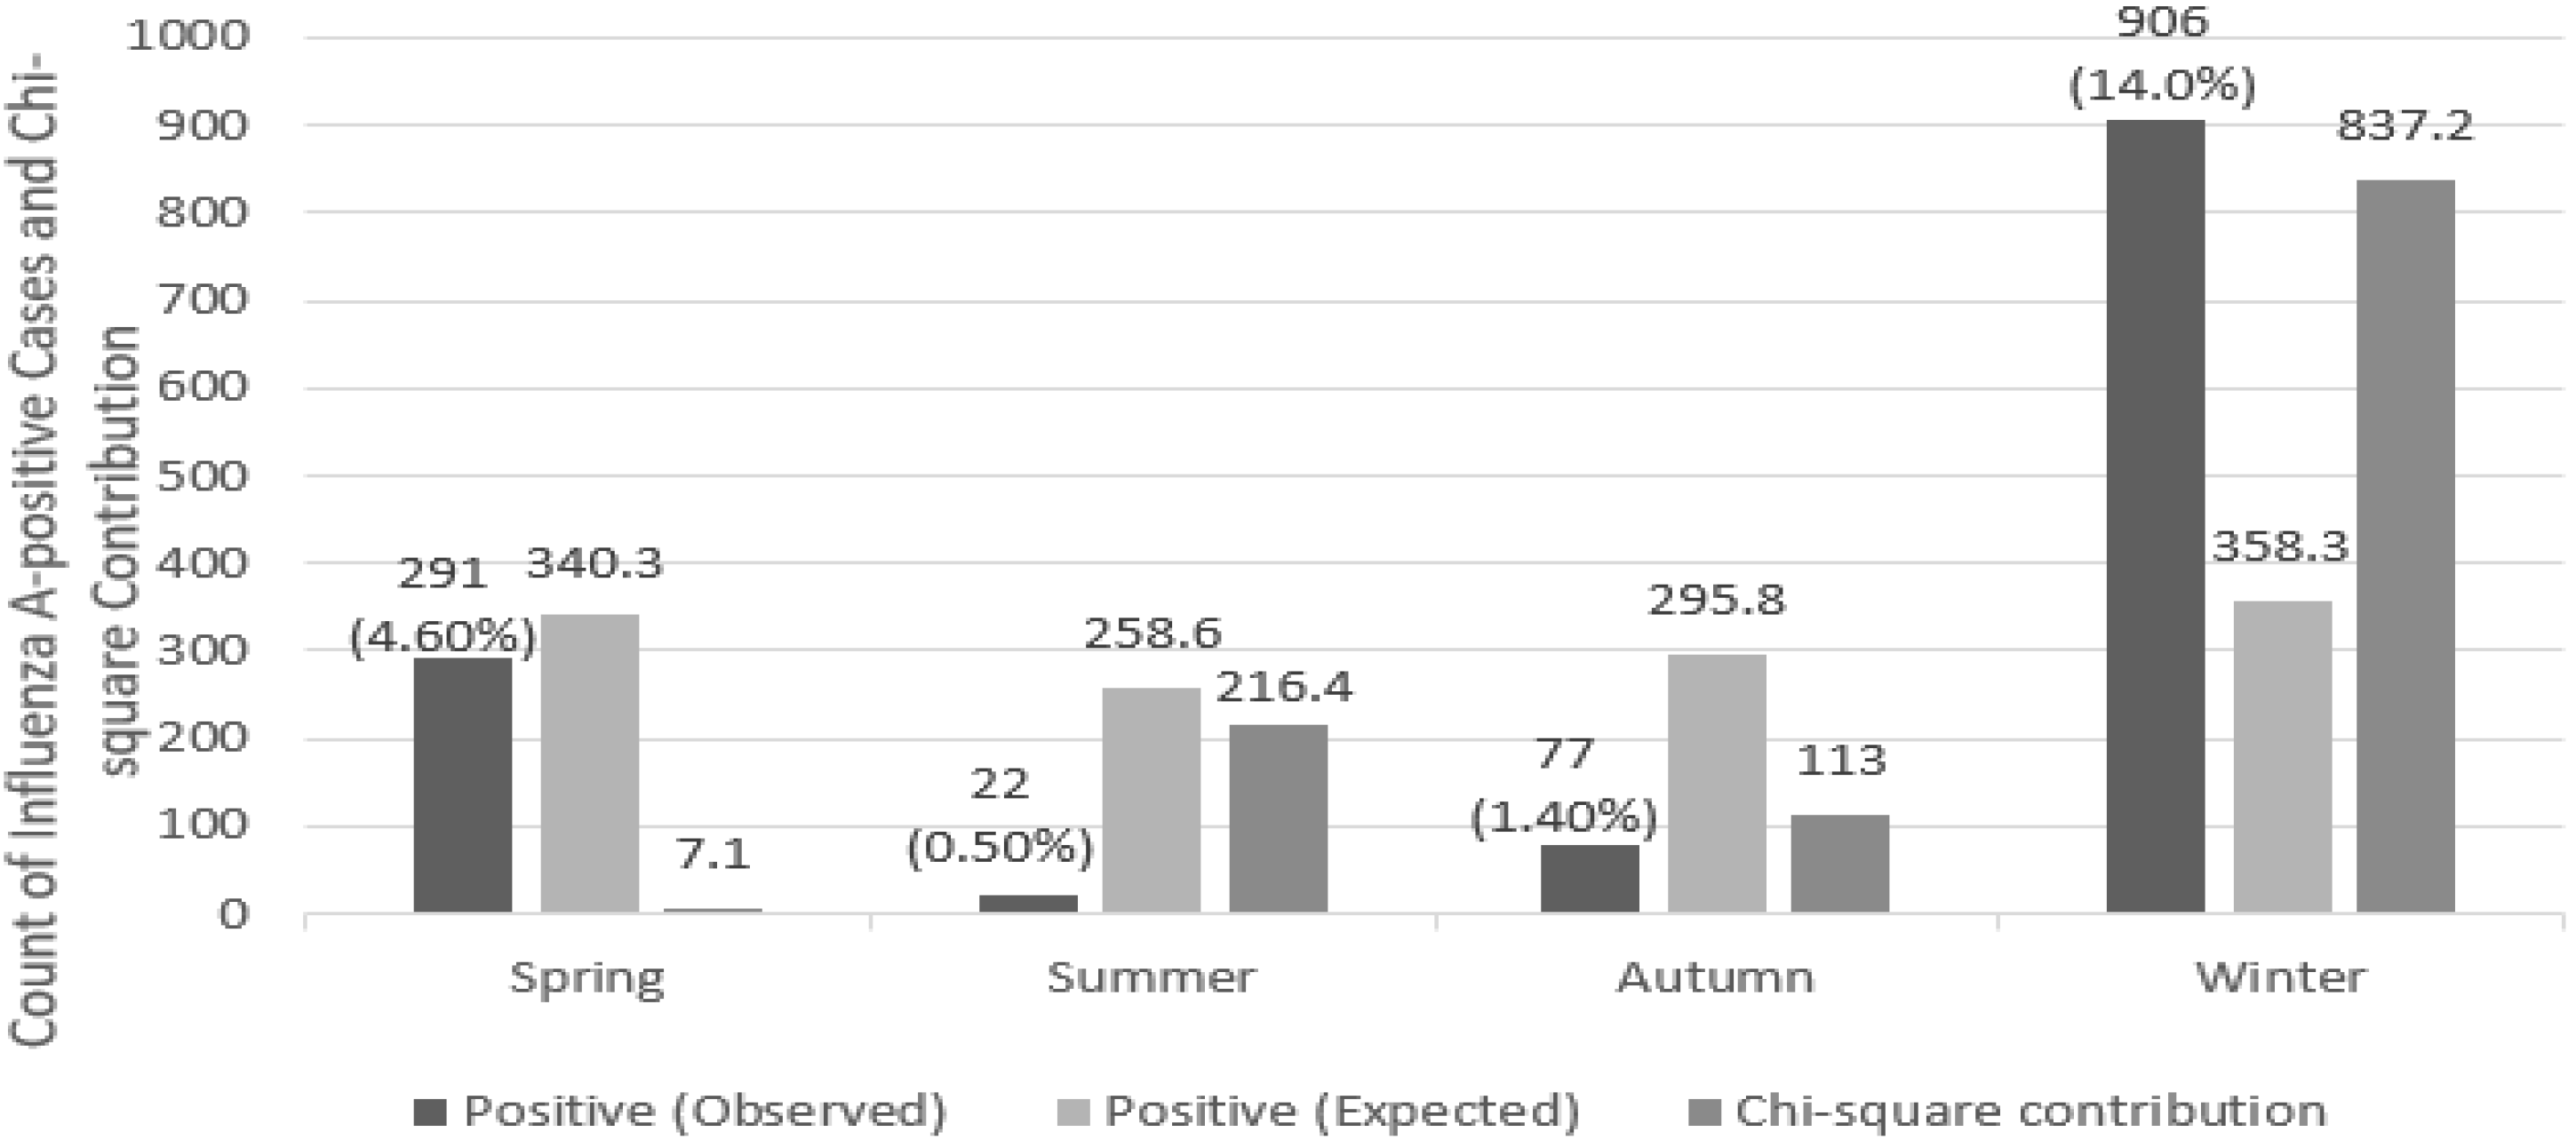
A total of 23,284 specimens, collected from 2007 to 2024, were included in this study. Statistically significant seasonal differences in the positivity rate of influenza A were examined by analyzing data from 2007 to 2024 across four seasons: spring (March–May), summer (June–August), fall (September–November), and winter (December–February). The observed and expected positivity rates, as well as their chi-square contributions, are shown in Table 2 and Figure 2.
The chi-square test revealed that the critical value was 7.815, with χ2(3) = 1173.7, which greatly exceeded the threshold, indicating a significant difference in the influenza A positivity rate by season (p < 0.05). When the positivity rates are examined by season, the winter season had the highest positivity rate, while the summer season had the lowest positivity rate. In winter, the proportion of positive cases was highest across the entire sample, whereas in summer, the positivity rate was very low, indicating a significant difference in the pattern of occurrence of influenza A (p < 0.001).

3.3. Sex-Based Analysis

To analyze statistically significant differences in influenza A positivity rates between men and women, data were collected from 13,961 men, among which 759 tested positive (positivity rate: 5.43%), and 9323 women, among which 537 tested positive (positivity rate: 5.76%). The distribution of p-values for influenza A positivity rates by sex is shown in Figure 3. Chi-square analysis revealed no statistically significant differences in influenza A positivity rates between sexes (p = 0.428).

3.4. Age-Based Analysis

The total numbers of individuals and positive cases for each age group are shown in Table 3. The influenza A positivity rate tended to increase with age. To test the statistical significance between these data, the positivity rates of influenza A across different age groups were compared and analyzed. To compare the infection rates by age group, the expected values for both positive and negative cases in each age group were calculated. The overall infection rate was found to be 0.05%, and based on this, the expected values for positive and negative cases were derived for each age group (Table 4). Chi-square analysis was performed based on the expected values for positive and negative cases by age group. The influenza A positivity rates and chi-square contributions by age group are shown in Figure 4. The analysis results show that χ2(3) = 124.8, which is greater than the critical value of 7.815, indicating a statistically significant difference in influenza A infection rates across different age groups (p < 0.001). Among these, higher infection rates were observed in the older adults and adult groups.

4. Discussion

4.1. Annual Trends of Incidence

The significant increase in 2009 can be attributed to a large-scale H1N1 epidemic [12,13]. Despite the relative stability of positivity rates between 2010 and 2020, continuous public health measures remained necessary to prevent the spread of influenza. The sharp decline in 2021 and 2022 was likely influenced by social changes brought about by the COVID-19 pandemic, including large-scale quarantine measures, mask-wearing, and hand hygiene, which played a key role in reducing influenza A transmission [14,15,16]. The increase in positivity rates from 2023 onward suggests a gradual return to normal life, indicating that influenza A positivity rate trends are influenced not only by time but also by ecological, social, and policy factors. This highlights the importance of a multifaceted approach in predicting and responding to future infectious disease outbreaks. Moving forward, influenza vaccination will continue to play a critical role, and future changes in positivity rates will depend on various health policies and prevention strategies. The fluctuations in influenza A positivity rates are closely linked to public health policies, infectious disease outbreaks, and social behavior changes. Understanding these trends will enable the development of more effective influenza prevention strategies, strengthening preventive measures and enhancing preparedness for future pandemics.

4.2. Seasonal Patterns

The seasonal epidemic cycle of influenza A has been linked to seasonal factors, with higher infection rates observed in winter and fall [17]. This difference in infection rates can be attributed to seasonal changes, such as temperature and humidity, which influence the transmission and survival of the influenza virus. Additionally, previous studies suggest that influenza viruses remain stable and viable for longer durations under low temperature and humidity, which may further contribute to the seasonal increase in detection rates. Future studies should consider viral stability as a key factor in understanding seasonal influenza transmission dynamics. In winter, the higher density of people indoors and lower humidity increase the survival rate of the virus, and the closer contact between individuals makes it easier for the infection to spread [18,19].
Additionally, seasonal variations can affect people’s immunity. In winter, people spend more time indoors and are less exposed to sunlight, which can lead to a deficiency in vitamin D and a reduction in immune function [20,21]. These factors can further accentuate the seasonal differences in influenza A infection rates [22].
The results show that the prevalence of influenza A is influenced by seasonal factors, suggesting the need to consider seasonal characteristics in future prevention and management strategies. Focused preventive measures should be tailored to specific seasons, such as increasing vaccination rates during winter and fall when influenza infection rates tend to spike [23,24]. Furthermore, while this study analyzed data from 2007 to 2024, long-term monitoring could provide a clearer understanding of seasonal fluctuations in infection rates. Comparing these results with those from other regions and countries and evaluating the impact of other social and environmental factors on infection rates would also be important.

4.3. Sex-Based Analysis

The results of sex-based analysis suggest that sex does not have a significant impact on influenza A infection, implying that sex-specific differentiation in prevention and treatment strategies may not be necessary. However, while this study found no significant sex-based differences, further research is needed to account for additional biological, behavioral, and social factors that may influence influenza susceptibility. Future studies should consider hormonal influences, healthcare-seeking behavior, occupational exposure, and vaccination status to determine whether more subtle sex-based differences exist in influenza A infection rates.

4.4. Age-Based Analysis

The results suggest that adults and older individuals have higher influenza A infection rates, highlighting the need for targeted prevention and treatment strategies. Older adults are more vulnerable to infections due to weaker immune systems [25,26], making tailored and detailed preventive measures and treatment approaches essential for this demographic. For adults aged 20–64 years, the relatively high influenza A positivity rate is likely influenced by increased social interactions, occupational exposure, and frequent healthcare visits rather than weakened immune responses. These factors may contribute to higher transmission risk in this age group, underscoring the need for preventive measures tailored to their lifestyle and exposure patterns. However, this study did not involve a detailed subgroup analysis within these high-risk populations, such as stratifying based on comorbidities, vaccination status, or hospitalization rates. Future research should incorporate these factors to provide a more refined understanding of influenza A susceptibility and disease severity among high-risk individuals.
The infection rates in children and infants were relatively low. Children and infants are mostly protected within the home environment and are exposed to fewer external factors, which could reduce the likelihood of being exposed to infectious agents. However, the lower influenza A positivity rate in children may not be solely due to reduced exposure. Studies have shown that respiratory syncytial virus exhibits an exceptionally high positivity rate (over 90%) in infants, whereas influenza A virus is more commonly detected in older age groups. This suggests that influenza A virus may have age-specific immunological and epidemiological characteristics that influence infection patterns. Additionally, children are frequently exposed to multiple respiratory viruses, which may create a competitive infection environment, reducing the likelihood of testing positive for influenza A. Given these factors, it is crucial to consider not only exposure but also age-dependent susceptibility, immune response variations, and viral interactions when interpreting the lower influenza A positivity rate in children. Future research should further investigate the interplay between different respiratory viruses and the mechanisms underlying age-related differences in influenza A susceptibility and transmission.
In contrast, adults and older adults tend to have more social interactions and are more likely to visit healthcare facilities, increasing their chances of exposure to various infectious agents [27]. From a vaccination perspective, children and infants typically receive regular vaccinations, which provide immunity against influenza A. These vaccinations play a crucial role in preventing infections [28]. However, older individuals often have lower vaccination rates, and even if they receive the vaccine, their weakened immune systems may result in slower antibody production, leaving them more susceptible to infections [29,30,31].
This study emphasizes the importance of considering age when developing prevention and management strategies for influenza A. Focused prevention and treatment efforts for high-risk groups are necessary, which could contribute to reducing overall infection rates. However, relying on a single technique such as real-time PCR for diagnosing influenza A may introduce errors due to its limitations, highlighting the need for additional research to improve diagnostic accuracy. In this study, we analyzed the positivity rates of influenza A virus but focused on the overall detection of influenza A infections rather than distinguishing specific subtypes such as H3N2 or H1N1. Identifying subtypes could provide a more in-depth understanding of seasonal influenza trends. Although this study did not include subtype classification, future research should consider this aspect to conduct a more detailed epidemiological analysis of influenza A infections.
Additionally, while we analyzed influenza A positivity rates separately by age group and sex, we did not perform subgroup analysis comparing sex differences within the same age group or age differences within the same sex group. Future studies should incorporate such interaction analyses to provide deeper insights into the combined effects of age and sex on influenza transmission. This study primarily focused on analyzing influenza A virus positivity rates across different age and sex groups. However, individual vaccination records were not included in our dataset, which limited direct evaluation of the impact of immunization on influenza positivity rates. While previous studies have shown that vaccination plays a crucial role in reducing the influenza burden, our findings provide important demographic insights into the distribution of influenza A infections. Future studies should consider integrating vaccination history to further elucidate its influence on influenza transmission and infection rates. Furthermore, analyzing other factors (such as living environments and social factors) that influence age-specific infection rate differences is essential. This will provide valuable foundational data to develop more effective prevention and management strategies for influenza A in the future. Based on our findings, we propose strengthening vaccination programs for high-risk groups, implementing seasonal prevention measures such as improving indoor ventilation, humidity control, and public awareness campaigns, and enhancing real-time influenza surveillance systems to improve early detection and outbreak management. These strategies may contribute to the development of more effective influenza control policies and help reduce the disease burden.

5. Conclusions

This study provides novel insights into the long-term epidemiological trends of influenza A from 2007 to 2024, highlighting key seasonal and demographic variations. Our findings reveal that despite frequent exposure to respiratory viruses, children exhibit lower influenza A positivity rates, suggesting the influence of age-specific immune responses and viral interactions. Public health interventions during the COVID-19 pandemic significantly suppressed influenza A transmission, demonstrating the impact of large-scale health measures on respiratory virus dynamics. Influenza A positivity rates are shaped not only by seasonal factors but also by social behaviors and public health policies, emphasizing the need for continuous monitoring and adaptable prevention strategies. These findings contribute to a deeper understanding of influenza A transmission and underscore the importance of targeted vaccination campaigns, adaptive public health policies, and ongoing surveillance systems in mitigating future outbreaks. Future studies should further investigate the interplay between immunological, environmental, and social factors influencing influenza A dynamics.

Author Contributions

Conceptualization, J.S.H. and H.H.K.; software, J.S.H.; validation, J.S.H., H.H.K., J.-S.J. and Y.N.C.; formal analysis, J.S.H.; investigation, H.H.K.; writing—original draft preparation, J.S.H.; writing—review and editing, J.-S.J. and Y.N.C.; visualization, J.S.H.; supervision, J.K.K.; project administration, J.K.K., J.S.H. and H.H.K. contributed equally to this work. All authors have read and agreed to the published version of the manuscript.

Funding

This research received no external funding.

Institutional Review Board Statement

This study was approved by the Institutional Review Board of Dankook University (IRB No. [DKU 2023-03-004-005]), and the data were anonymized before analysis.

Informed Consent Statement

Informed consent from participants was waived owing to the nature of the study.

Data Availability Statement

The authors confirm that the data supporting the findings of this study are available within the article.

Acknowledgments

We thank the publishers for their support in bringing this research paper into publication. We sincerely acknowledge the efforts of the editorial team in reviewing and refining our manuscript, and we are thankful for the chance to contribute to the academic community through this publication. This opportunity has enabled us to share our research with a broader audience, and we appreciate the resources and platforms made available by the publishers. We would also like to extend our deepest gratitude to collaborators, individuals, and organizations that provided valuable resources and contributed significantly to the success of this research.

Conflicts of Interest

The authors declare no conflicts of interest.

Abbreviation

The following abbreviation is used in this manuscript:
CTCycle threshold

References

  1. Thompson, W.W.; Shay, D.K.; Weintraub, E.; Brammer, L.; Bridges, C.B.; Cox, N.J.; Fukuda, K. Influenza-associated hospitalizations in the United States. JAMA 2004, 292, 1333–1340. [Google Scholar] [CrossRef] [PubMed]
  2. Iuliano, A.D.; Roguski, K.M.; Chang, H.H.; Muscatello, D.J.; Palekar, R.; Tempia, S.; Cohen, C.; Gran, J.M.; Schanzer, D.; Cowling, B.J.; et al. Estimates of global seasonal influenza-associated respiratory mortality: A modelling study. Lancet 2018, 391, 1285–1300. [Google Scholar] [CrossRef] [PubMed]
  3. Lin, J.C.; Nichol, K.L. Excess mortality due to pneumonia or influenza during influenza seasons among persons with acquired immunodeficiency syndrome. Arch. Intern. Med. 2001, 161, 441–446. [Google Scholar] [CrossRef]
  4. Keilich, S.R.; Bartley, J.M.; Haynes, L. Diminished immune responses with aging predispose older adults to common and uncommon influenza complications. Cell. Immunol. 2019, 345, 103992. [Google Scholar] [CrossRef]
  5. Wong, K.K.; Jain, S.; Blanton, L.; Dhara, R.; Brammer, L.; Fry, A.M.; Finelli, L. Influenza-associated pediatric deaths in the United States, 2004–2012. Pediatrics 2013, 132, 796–804. [Google Scholar] [CrossRef]
  6. Coletti, P.; Poletto, C.; Turbelin, C.; Blanchon, T.; Colizza, V. Shifting patterns of seasonal influenza epidemics. Sci. Rep. 2018, 8, 12786. [Google Scholar] [CrossRef] [PubMed]
  7. Musau, J.; Baumann, A.; Kolotylo, C.; O’Shea, T.; Bialachowski, A. Infectious disease outbreaks and increased complexity of care. Int. Nurs. Rev. 2015, 62, 404–411. [Google Scholar] [CrossRef]
  8. Rao, X.; Chen, Z.; Dong, H.; Zhu, C.; Yan, Y. Epidemiology of influenza in hospitalized children with respiratory tract infection in Suzhou area from 2016 to 2019. J. Med. Virol. 2020, 92, 3038–3046. [Google Scholar] [CrossRef]
  9. Stark, J.H.; Sharma, R.; Ostroff, S.; Cummings, D.A.T.; Ermentrout, B.; Stebbins, S.; Burke, D.S.; Wisniewski, S.R. Local spatial and temporal processes of influenza in Pennsylvania, USA: 2003–2009. PLoS ONE 2012, 7, e34245. [Google Scholar] [CrossRef]
  10. Baguelin, M.; Flasche, S.; Camacho, A.; Demiris, N.; Miller, E.; Edmunds, W.J. Assessing optimal target populations for influenza vaccination programmes: An evidence synthesis and modelling study. PLoS Med. 2013, 10, e1001527. [Google Scholar] [CrossRef]
  11. Basta, N.E.; Chao, D.L.; Halloran, M.E.; Matrajt, L.; Longini, I.M., Jr. Strategies for pandemic and seasonal influenza vaccination of schoolchildren in the United States. Am. J. Epidemiol. 2009, 170, 679–686. [Google Scholar] [CrossRef]
  12. Hsieh, Y.H.; Huang, H.M.; Lan, Y.C. On temporal patterns and circulation of influenza virus strains in Taiwan, 2008–2014: Implications of 2009 pH1N1 pandemic. PLoS ONE 2016, 11, e0154695. [Google Scholar] [CrossRef] [PubMed]
  13. Neumann, G.; Kawaoka, Y. The first influenza pandemic of the new millennium. Influenza Other Respir. Viruses 2011, 5, 157–166. [Google Scholar] [CrossRef]
  14. Lu, Y.; Wang, Y.; Shen, C.; Luo, J.; Yu, W. Decreased incidence of influenza during the COVID-19 pandemic. Int. J. Gen. Med. 2022, 15, 2957–2962. [Google Scholar] [CrossRef]
  15. Bonacina, F.; Boëlle, P.Y.; Colizza, V.; Lopez, O.; Thomas, M.; Poletto, C. Global patterns and drivers of influenza decline during the COVID-19 pandemic. Int. J. Infect. Dis. 2023, 128, 132–139. [Google Scholar] [CrossRef] [PubMed]
  16. Olsen, S.J.; Azziz-Baumgartner, E.; Budd, A.P.; Brammer, L.; Sullivan, S.; Pineda, R.F.; Cohen, C.; Fry, A.M. Decreased influenza activity during the COVID-19 pandemic—United States, Australia, Chile, and South Africa, 2020. Morb. Mortal. Wkly. Rep. 2020, 69, 1305–1309. [Google Scholar] [CrossRef] [PubMed]
  17. Lofgren, E.; Fefferman, N.H.; Naumov, Y.N.; Gorski, J.; Naumova, E.N. Influenza seasonality: Underlying causes and modeling theories. J. Virol. 2007, 81, 5429–5436. [Google Scholar] [CrossRef]
  18. Lowen, A.C.; Steel, J. Roles of humidity and temperature in shaping influenza seasonality. J. Virol. 2014, 88, 7692–7695. [Google Scholar] [CrossRef]
  19. Kudo, E.; Song, E.; Yockey, L.J.; Rakib, T.; Wong, P.W.; Homer, R.J.; Iwasaki, A. Low ambient humidity impairs barrier function and innate resistance against influenza infection. Proc. Natl. Acad. Sci. USA 2019, 116, 10905–10910. [Google Scholar] [CrossRef] [PubMed]
  20. Aranow, C. Vitamin D and the immune system. J. Investig. Med. 2011, 59, 881–886. [Google Scholar] [CrossRef]
  21. Cantorna, M.T. Mechanisms underlying the effect of vitamin D on the immune system. Proc. Nutr. Soc. 2010, 69, 286–289. [Google Scholar] [CrossRef]
  22. Cannell, J.J.; Vieth, R.; Umhau, J.C.; Holick, M.F.; Grant, W.B.; Madronich, S.; Garland, C.F.; Giovannucci, E. Epidemic influenza and vitamin D. Epidemiol. Infect. 2006, 134, 1129–1140. [Google Scholar] [CrossRef] [PubMed]
  23. Laskowski, M.; Xiao, Y.; Charland, N.; Moghadas, S.M. Strategies for early vaccination during novel influenza outbreaks. Sci. Rep. 2015, 5, 18062. [Google Scholar] [CrossRef]
  24. Bianchi, F.P.; Stefanizzi, P.; Cuscianna, E.; Di Lorenzo, A.D.; Martinelli, A.; Tafuri, S. Effectiveness of on-site influenza vaccination strategy in Italian healthcare workers: A systematic review and statistical analysis. Expert Rev. Vaccines 2023, 22, 17–24. [Google Scholar] [CrossRef]
  25. Hakim, F.T.; Gress, R.E. Immunosenescence: Deficits in adaptive immunity in the elderly. Tissue Antigens 2007, 70, 179–189. [Google Scholar] [CrossRef] [PubMed]
  26. Kline, K.A.; Bowdish, D.M. Infection in an aging population. Curr. Opin. Microbiol. 2016, 29, 63–67. [Google Scholar] [CrossRef] [PubMed]
  27. Lansbury, L.E.; Brown, C.S.; Nguyen-Van-Tam, J.S. Influenza in long-term care facilities. Influenza Other Respir. Viruses 2017, 11, 356–366. [Google Scholar] [CrossRef]
  28. Jackson, M.L.; Chung, J.R.; Jackson, L.A.; Phillips, C.H.; Benoit, J.; Monto, A.S.; Martin, E.T.; Belongia, E.A.; McLean, H.Q.; Gaglani, M.; et al. Influenza vaccine effectiveness in the United States during the 2015–2016 season. N. Engl. J. Med. 2017, 377, 534–543. [Google Scholar] [CrossRef] [PubMed]
  29. Goodwin, K.; Viboud, C.; Simonsen, L. Antibody response to influenza vaccination in the elderly: A quantitative review. Vaccine 2006, 24, 1159–1169. [Google Scholar] [CrossRef]
  30. Allen, J.C.; Toapanta, F.R.; Chen, W.; Tennant, S.M. Understanding immunosenescence and its impact on vaccination of older adults. Vaccine 2020, 38, 8264–8272. [Google Scholar] [CrossRef]
  31. Ciabattini, A.; Nardini, C.; Santoro, F.; Garagnani, P.; Franceschi, C.; Medaglini, D. Vaccination in the elderly: The challenge of immune changes with aging. Semin. Immunol. 2018, 40, 83–94. [Google Scholar] [CrossRef] [PubMed]
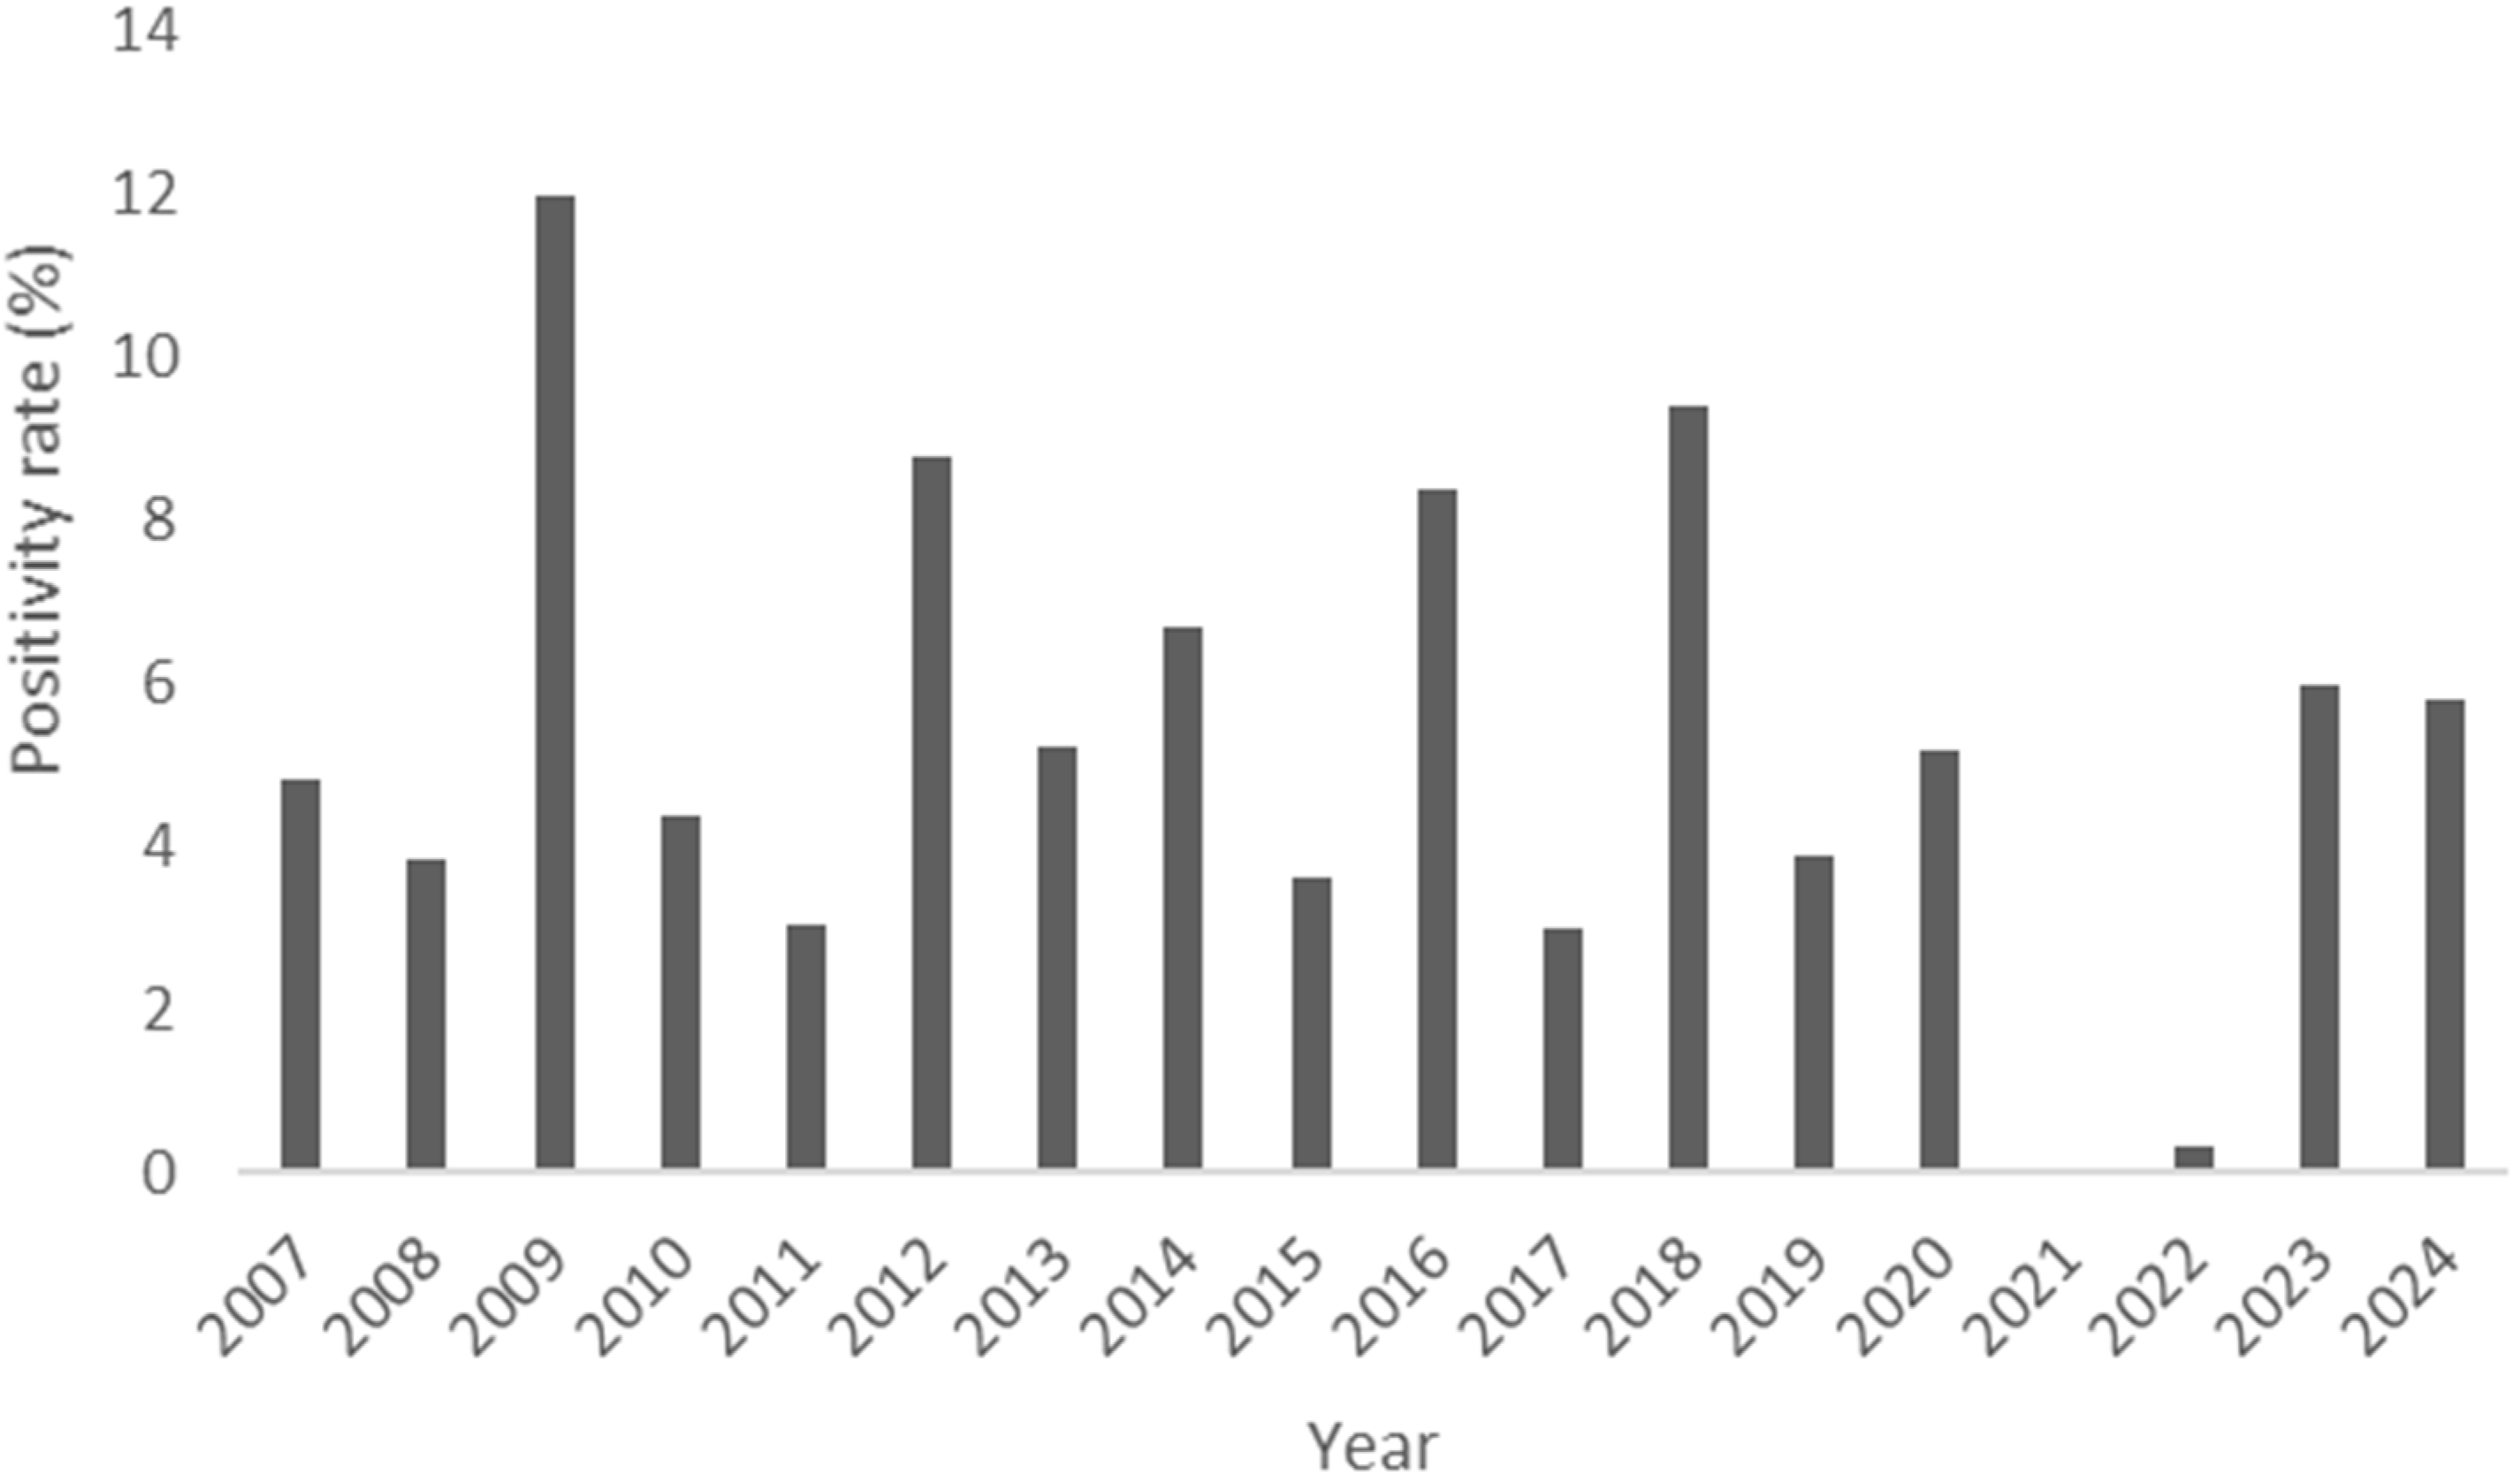
Figure 1. Influenza A positivity rate from 2007 to 2024.
Pathogens 14 00282 g001
Figure 2. Seasonal influenza A positivity rates and contributions from 2007 to 2024.
Pathogens 14 00282 g002
Figure 3. Distribution of p-values for influenza A positivity rates by sex from 2007 to 2024.
Pathogens 14 00282 g003
Figure 4. Influenza A positivity rates and chi-square contributions by age group from 2007 to 2024.
Pathogens 14 00282 g004
Table 1. Distribution of study participants (n = 23,284) by age group and sex.
Age GroupMale (n)Female (n)Total (n)
Infants (0)270918444556
Children (1–19)6341479611,137
Adults (20–64)187210272899
Older adults (>65)303616564692
Total13,958932323,284
Table 2. Observed and expected influenza A positivity rates from 2007 to 2024 by season.
SeasonPositive
(Observed)
Positive
(Expected)
Negative
(Observed)
Negative
(Expected)
Positivity Rate (%)
Spring291 (4.6%)340.36100 (95.4%)6050.74.6%
Summer22 (0.5%)258.64788 (99.5%)4551.40.5%
Autumn77 (1.4%)295.85530 (98.6%)5311.21.4%
Winter906 (14.0%)358.35570 (86.0%)6117.714.0%
Table 3. Influenza A positivity rates by age group from 2007 to 2024.
Age GroupTotal IndividualsPositiveNegativePositivity Rate (%)
Infants (0)455614244143.1
Children (1–19)11,13755910,5785.0
Adults (20–64)289922126787.6
Older adults (>65)469237443187.9
Table 4. Expected values for positive and negative cases by age group between 2007 and 2024.
Age GroupPositive (Expected)Negative (Expected)
Infants (0 years)255.14301
Children (1–19 years)62410,513
Adults (20–64 years)162.32737
Older adults (65 years and above)2634429
Disclaimer/Publisher’s Note: The statements, opinions and data contained in all publications are solely those of the individual author(s) and contributor(s) and not of MDPI and/or the editor(s). MDPI and/or the editor(s) disclaim responsibility for any injury to people or property resulting from any ideas, methods, instructions or products referred to in the content.