
Spatial Distribution of Drug-Resistant Mycobacterium tuberculosis Infections in Rural Eastern Cape Province of South Africa

 ,
,  ,
,
Abstract
1. Introduction
2. Methods
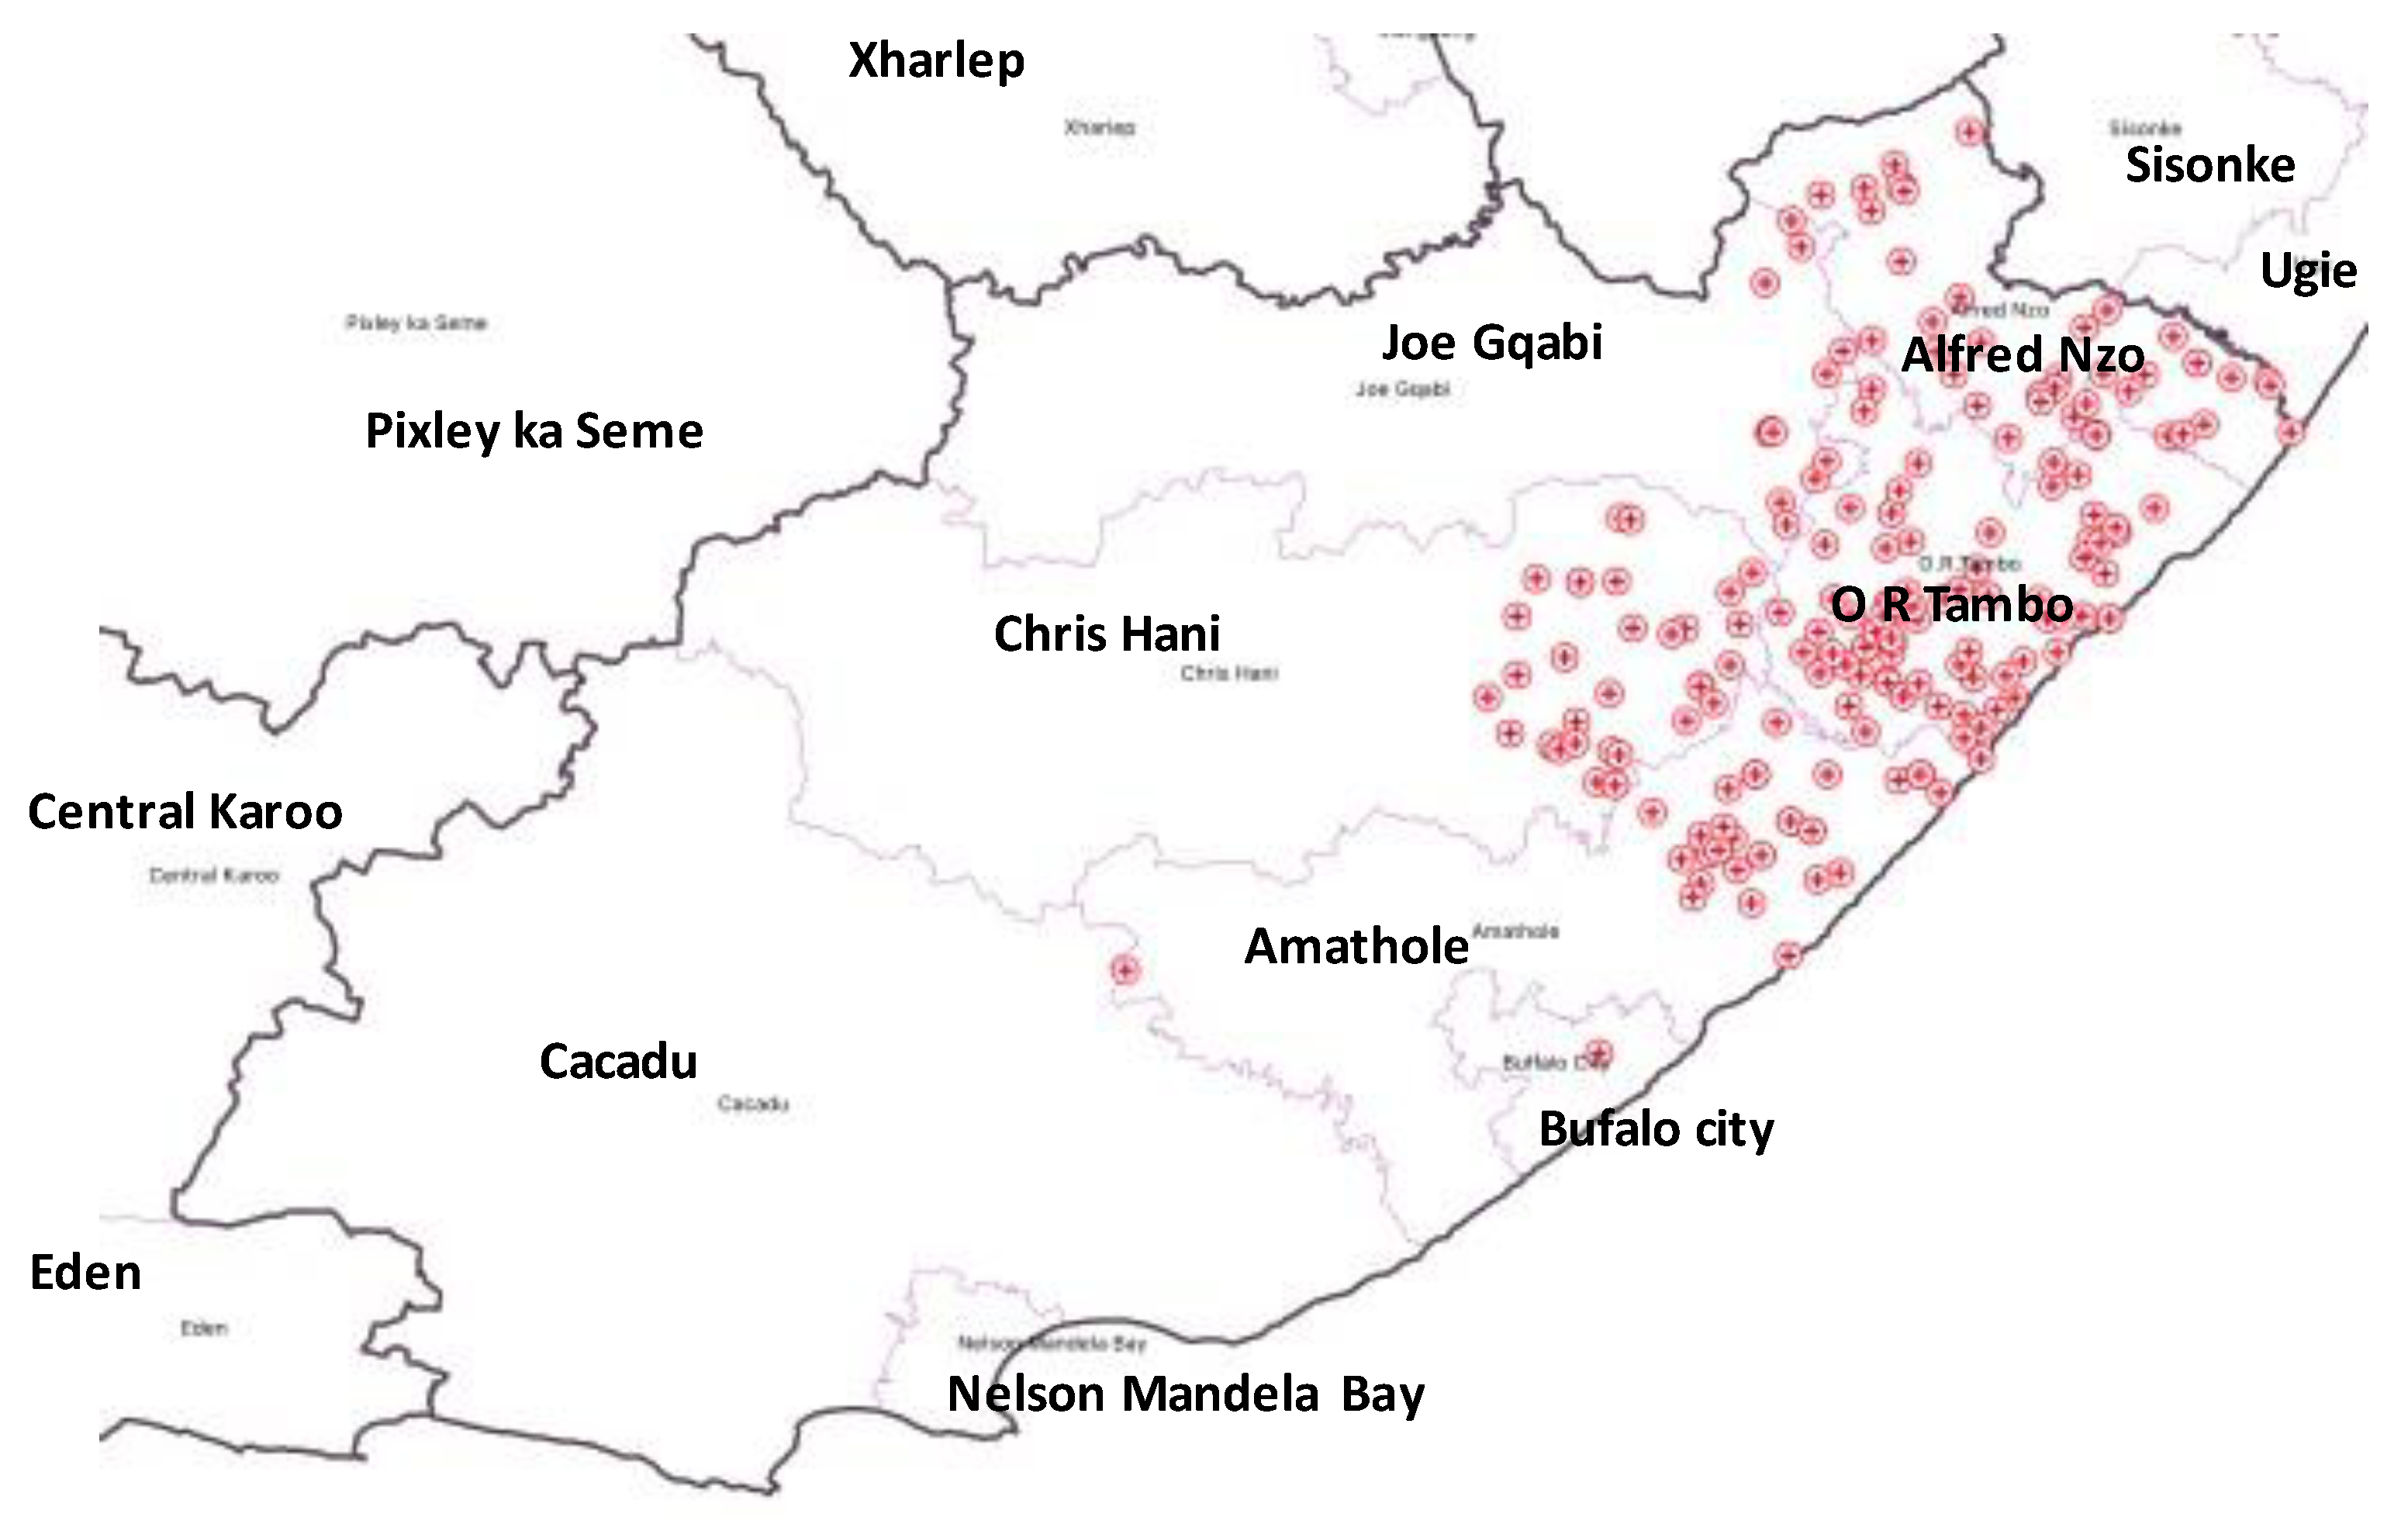
2.1. Study Design and Setting
2.2. Study Population and Sampling Strategy
2.3. Data Collection and Isolates Identification
2.4. Isolates Analysis
3. Results
Distribution of Mutations, Lineages of Isolates
4. Discussion
5. Conclusions
Author Contributions
Funding
Institutional Review Board Statement
Informed Consent Statement
Data Availability Statement
Acknowledgments
Conflicts of Interest
References
- World Health Organization. Global Tuberculosis Report 2019. Available online: https://apps.who.int/iris/bitstream/handle/10665/329368/9789241565714 (accessed on 21 January 2022).
- Olmo-Fontánez, A.M.; Turner, J. Tuberculosis in an Aging World. Pathogens 2022, 11, 1101. [Google Scholar] [CrossRef] [PubMed]
- WHO Global Tuberculosis Report. Geneva: World Health Organization. 2022. Licence: CC BY-NC-SA 3.0 IGO. Available online: https://www.who.int/teams/global-tuberculosis-programme/tb-reports/global-tuberculosis-report-2022 (accessed on 28 September 2022).
- Alene, K.A.; Viney, K.; McBryde, E.S.; Clements, A.C.A. Spatial patterns of multidrug resistant tuberculosis and relationships to socio-economic, demographic and household factors in northwest Ethiopia. PLoS ONE 2017, 12, e0171800. [Google Scholar] [CrossRef] [PubMed]
- Maja, T.F.; Maposa, D. An Investigation of Risk Factors Associated with Tuberculosis Transmission in South Africa Using Logistic Regression Model. Infect. Dis. Rep. 2022, 14, 66. [Google Scholar] [CrossRef] [PubMed]
- Murray, C.J.; Vos, T.; Lozano, R.; Naghavi, M.; Flaxman, A.D.; Michaud, C.; Ezzati, M.; Shibuya, K.; Salomon, J.A.; Abdalla, S.; et al. Disability-adjusted life years (DALYs) for 291 diseases and injuries in 21 regions, 1990–2010: A systematic analysis for the Global Burden of Disease Study 2010. Lancet 2012, 380, 2197–2223. [Google Scholar] [CrossRef]
- Statistics South Africa. Mortality and Causes of Death in South Africa. Findings from Death Notification. Pretoria, South Africa. Stats SA’s June 2021 Report. Available online: http://www.statssa.gov.za/publications/P0302/Mid%20year%20estimates%202021_presentation.pdf (accessed on 21 August 2022).
- World Health Organisation. The Global Tuberculosis Report 2020. Geneva: World Health Organization. 2020. Licence: CC BY-NC-SA 3.0 IGO. Available online: https://www.who.int/publications/i/item/9789240013131 (accessed on 28 September 2022).
- World Health Organization Global Tuberculosis Report 2016. Geneva World Health Organization. Available online: https://apps.who.int/iris/handle/10665/250441 (accessed on 15 June 2022).
- Robsky, K.O.; Kitonsa, P.J.; Mukiibi, J.; Nakasolya, O.; Isooba, D.; Nalutaaya, A.; Salvatore, P.P.; Kendall, E.A.; Katamba, A.; Dowdy, D. Spatial distribution of people diagnosed with tuberculosis through routine and active case finding: A community-based study in Kampala, Uganda. Infect. Dis. Poverty 2020, 9, 73. [Google Scholar] [CrossRef] [PubMed]
- Nguyen, T.N.; Berre, A.L.; Bañuls, A.L.; Nguyen, T.V. Molecular diagnosis of drug-resistant tuberculosis; a literature review. Front. Microbiol. 2019, 10, 794. [Google Scholar] [CrossRef]
- Chihota, V.N.; Niehaus, A.; Streicher, E.M.; Wang, X.; Sampson, S.L.; Mason, P.; Källenius, G.; Mfinanga, S.G.; Pillay, M.; Klopper, M.; et al. Geospatial distribution of Mycobacterium tuberculosis genotypes in Africa. PLoS ONE 2018, 13, e0200632. [Google Scholar] [CrossRef]
- Cui, Z.; Lin, D.; Chongsuvivatwong, V.; Zhao, J.; Lin, M.; Ou, J.; Zhao, J. Spatiotemporal patterns and ecological factors of tuberculosis notification: A spatial panel data analysis in Guangxi, China. PLoS ONE 2019, 14, e0212051. [Google Scholar] [CrossRef]
- Porter, J.D.H.; Ogden, J.A.; Pronyk, P. The way forward: An integrated approach to tuberculosis control. In Tuberculosis—An Interdisciplinary Perspective; Porter, J.D.H., Grange, J.M., Eds.; Imperial College Press: London, UK, 1999; pp. 359–378. [Google Scholar]
- Asare, P.; Otchere, I.D.; Bedeley, E.; Brites, D.; Loiseau, C.; Baddoo, N.A.; Asante-Poku, A.; Osei-Wusu, S.; Prah, D.A.; Borrell, S.; et al. Whole genome sequencing and spatial analysis identifies recent tuberculosis transmission hotspots in Ghana. Front. Med. 2020, 7, 161. [Google Scholar] [CrossRef]
- Gwitira, I.; Karumazondo, N.; Shekede, M.D.; Sandy, C.; Siziba, N.; Chirenda, J. Spatial patterns of pulmonary tuberculosis (TB) cases in Zimbabwe from 2015 to 2018. PLoS ONE 2021, 16, e0249523. [Google Scholar] [CrossRef] [PubMed]
- Brooks, M.B.; Millones, A.K.; Puma, D.; Contreras, C.; Jimenez, J.; Tzelios, C.; Jenkins, H.E.; Yuen, C.M.; Keshavjee, S.; Lecca, L.; et al. Mapping local hot spots with routine tuberculosis data: A pragmatic approach to identify spatial variability. PLoS ONE 2022, 7, e0265826. [Google Scholar] [CrossRef] [PubMed]
- Caprarelli, G.; Fletcher, S. A brief review of spatial analysis concepts and tools used for mapping, containment and risk modelling of infectious diseases and other illnesses. Parasitology 2014, 141, 581–601. [Google Scholar] [CrossRef] [PubMed]
- Chan-Yeung, M.; Yeh, A.G.; Tam, C.M.; Kam, K.M.; Leung, C.C.; Yew, W.W.; Lam, C.W. Socio-demographic and geographic indicators and distribution of tuberculosis in Hong Kong: A spatial analysis. Int. J. Tuberc. Lung Dis. 2005, 9, 1320–1326. [Google Scholar]
- Zulu, L.C.; Kalipeni, E.; Johannes, E. Analyzing spatial clustering and the spatiotemporal nature and trends of HIV/AIDS prevalence using GIS: The case of Malawi, 1994–2010. BMC Infect. Dis. 2014, 14, 285. [Google Scholar] [CrossRef] [PubMed]
- Hain Lifescience. Company History and Product Releases. 2016. Available online: http://www.hain-lifescience.de/en/company/history.html (accessed on 11 February 2021).
- Couvin, D.; David, A.; Zozio, T.; Rastogi, N. Macro-geographical specificities of the prevailing tuberculosis epidemic as seen through SITVIT2, an updated version of the Mycobacterium tuberculosis genotyping database. Infect. Genet. Evol. 2019, 72, 31–43. [Google Scholar] [CrossRef]
- Alene, K.A.; Xu, Z.; Bai, L.; Yi, H.; Tan, Y.; Gray, D.; Viney, K.; Archie, C.A.; Clements, A.C.A. Spatial clustering of drug-resistant tuberculosis in Hunan province, China: An ecological study. BMJ Open 2021, 11, e043685. [Google Scholar] [CrossRef]
- Tafess, K.; Beyen, T.K.; Girma, S.; Girma, A.; Siu, G. Spatial clustering and genetic diversity of Mycobacterium tuberculosis isolate among pulmonary tuberculosis suspected patients, Arsi Zone, Ethiopia. BMC Pulm. Med. 2021, 21, 206. [Google Scholar] [CrossRef]
- Kumwenda, G.; Chipungu, G.; Sloan, D.; Kaimila, Y.; Chiumya, K.; Pangani, H. The occurrence and frequency of genomic mutations that mediate Isoniazid and Rifampicin resistance in Mycobacterium tuberculosis isolates from untreated pulmonary Tuberculosis cases in urban Blantyre, Malawi. Malawi Med. J. 2018, 30, 1–5. [Google Scholar] [CrossRef]
- Nam, B.H.; Nishizato, K.; Sugimoto, K.; Ueki, M.; Karibe, R.; Yashio, T.; Nishi, Y.; Munkhtuya, T. Frequency and distribution of drug-resistant tuberculosis gene mutations in Africa between 2010 and 2020. South. Afr. J. Public Health 2022, 5, 60–64. [Google Scholar]
- Chen, Y.; Jiang, Q.; Zou, J.; Yang, T.; Liu, Q.; Luo, G.; Gan, M.; Jiang, Y.; Takiff, H.E.; Lu, L.; et al. Deep whole-genome sequencing reveals no evidence for heteroresistance influencing treatment outcomes among drug-susceptible tuberculosis patients. Tuberculosis 2021, 130, 102120. [Google Scholar] [CrossRef]
- Tessema, B.; Beer, J.; Emmrich, F.; Sack, U.; Rodloff, A.C. Analysis of gene mutations associated with isoniazid, rifampicin and ethambutol resistance among Mycobacterium tuberculosis isolates from Ethiopia. BMC Infect. Dis. 2012, 12, 37. [Google Scholar] [CrossRef] [PubMed]
- Brhane, M.; Kebede, A.; Petros, Y. Molecular detection of multidrug-resistant tuberculosis among smear-positive pulmonary tuberculosis patients in Jigjiga town, Ethiopia. Infect. Drug Resist. 2017, 10, 75–83. [Google Scholar] [CrossRef] [PubMed]
- Liu, Q.; Via, L.E.; Luo, T.; Liang, L.; Liu, X.; Wu, S.; Shen, Q.; Wei, W.; Ruan, X.; Yuan, X.; et al. Within patient microevolution of Mycobacterium tuberculosis correlates with heterogeneous responses to treatment. Sci. Rep. 2015, 5, 17507. [Google Scholar] [CrossRef] [PubMed]
- van Rie, A.; Victor, T.C.; Richardson, M.; Johnson, R.; van der Spuy, G.D.; Murray, E.J.; Beyers, N.; van Pittius, N.C.G.; van Helden, P.D.; Warren, R.M. Reinfection and mixed infection cause changing Mycobacterium tuberculosis drug-resistance patterns. Am. J. Respir. Crit. Care Med. 2005, 172, 636–642. [Google Scholar] [CrossRef]
- Shin, S.S.; Modongo, C.; Baik, Y.; Allender, C.; Engelthaler, D.M.; Warren, R.M.; Klausner, J.; Zetola, N. Deep sequencing to estimate the prevalence of heteroresistance among mixed-strain and single-strain Mycobacterium tuberculosis infections. Am. J. Respir. Crit. Care Med. 2017, 195, A1177. [Google Scholar]
- Operario, D.J.; Koeppel, A.F.; Turner, S.D.; Bao, Y.; Pholwat, S.; Banu, S.; Foongladda, S.; Mpagama, S.; Gratz, J.; Ogarkov, O.; et al. Prevalence and extent of heteroresistance by next generation sequencing of multidrug-resistant tuberculosis. PLoS ONE 2017, 12, e0176522. [Google Scholar]
- Hofmann-Thiel, S.; van Ingen, J.; Feldmann, K.; Turaev, L.; Uzakova, G.T.; Murmusaeva, G.; van Soolingen, D.; Hoffmann, H. Mechanisms of heteroresistance to isoniazid and rifampin of Mycobacterium tuberculosis in Tashkent, Uzbekistan. Eur. Respir. J. 2009, 33, 368–374. [Google Scholar] [CrossRef]
- Rigouts, L.; Miotto, P.; Schats, M.; Lempens, P.; Cabibbe, A.M.; Galbiati, S.; Lampasona, V.; de Rijk, P.; Cirillo, D.M.; de Jong, B.C. Fluoroquinolone heteroresistance in Mycobacterium tuberculosis: Detection by genotypic and phenotypic assays in experimentally mixed populations. Sci. Rep. 2019, 9, 11760. [Google Scholar] [CrossRef]
- Couvin, D.; Reynaud, Y.; Rastogi, N. Two tales: Worldwide distribution of Central Asian (CAS) versus ancestral East-African Indian (EAI) lineages of Mycobacterium tuberculosis underlines a remarkable cleavage for phylogeographical, epidemiological and demographical characteristics. PLoS ONE 2019, 14, e0219706. [Google Scholar] [CrossRef]
- Caws, M.; Thwaites, G.; Dunstan, S.; Hawn, T.R.; Lan, N.T.; Thuong, N.T.; Stepniewska, K.; Huyen, M.N.; Bang, N.D.; Loc, T.H.; et al. The Influence of Host and Bacterial Genotype on the Development of Disseminated Disease with Mycobacterium tuberculosis. PLoS Pathog. 2008, 4, e1000034. [Google Scholar] [CrossRef]
- Thwaites, G.; Caws, M.; Chau, T.T.; D’Sa, A.; Lan, N.T.; Huyen, M.N.; Gagneux, S.; Anh, P.T.; Tho, D.Q.; Torok, E.; et al. Relationship between Mycobacterium tuberculosis Genotype and the Clinical Phenotype of Pulmonary and Meningeal Tuberculosis. J. Clin. Microbiol. 2008, 46, 1363–1368. [Google Scholar] [CrossRef] [PubMed]
- Von Groll, A.; Martin, A.; Felix, C.; Prata, P.F.S.; Honscha, G.; Portaels, F.; Vandame, P.; da Silva, P.E.; Palomino, J.C. Fitness study of the RDRio lineage and Latin American- Mediterranean family of Mycobacterium tuberculosis in the city of Rio Grande, Brazil. FEMS Immunol. Med. Microbiol. 2010, 58, 119–127. [Google Scholar] [CrossRef] [PubMed]
- Maung, H.M.; Palittapongarnpim, P.; Aung, H.L.; Surachat, K.; Nyunt, W.W.; Chongsuvivatwong, V. Geno-Spatial Distribution of Mycobacterium Tuberculosis and Drug Resistance Profiles in Myanmar–Thai Border Area. Trop. Med. Infect. Dis. 2020, 5, 153. [Google Scholar] [CrossRef] [PubMed]
- Hu, Y.; Mathema, B.; Zhao, Q.; Zheng, X.; Li, D.; Jiang, W.; Wang, W.; Xu, B. Comparison of the socio-demographic and clinical features of pulmonary TB patients infected with sub-lineages within the W-Beijing and non-Beijing Mycobacterium tuberculosis. Tuberculosis 2016, 97, 18–25. [Google Scholar] [CrossRef] [PubMed]
- Karmakar, M.; Trauer, J.M.; Ascher, D.B.; Denholm, J.T. Hyper transmission of Beijing lineage Mycobacterium tuberculosis: Systematic review and meta-analysis. J. Infect. 2019, 79, 572–581. [Google Scholar] [CrossRef]
- Said, H.; Ratabane, J.; Erasmus, L.; Gardee, Y.; Omar, S.; Dreyer, A.; Ismail, F.; Bhyat, Z.; Lebaka, T.; van der Meulen, M.; et al. Distribution and Clonality of drug-resistant tuberculosis in South Africa. BMC Microbiol. 2021, 21, 157. [Google Scholar] [CrossRef]
- Maguga-Phasha, N.T.; Munyai, N.S.; Mashinya, F.; Makgatho, M.E.; Mbajiorgu, E.F. Genetic diversity and distribution of Mycobacterium tuberculosis genotypes in Limpopo, South Africa. BMC Infect. Dis. 2017, 17, 764. [Google Scholar] [CrossRef]
- Nelson, K.N.; Shah, N.S.; Mathema, B.; Ismail, N.; Brust, J.C.; Brown, T.S.; Auld, S.C.; Omar, S.V.; Morris, N.; Campbell, A.; et al. Spatial patterns of extensively drug-resistant tuberculosis transmission in KwaZulu-Natal, South Africa. J. Infect. Dis. 2018, 218, 1964–1973. [Google Scholar] [CrossRef]
- Pillay, M.; Sturm, A.W. Evolution of the extensively drug-resistant F15/LAM4/KZN strain of Mycobacterium tuberculosis in KwaZulu-Natal, South Africa. Clin. Infect. Dis. 2007, 45, 1409–1414. [Google Scholar] [CrossRef]
- Luo, T.; Comas, I.; Luo, D.; Lu, B.; Wu, J.; Wei, L.; Yang, C.; Liu, Q.; Gan, M.; Sun, G.; et al. Southern East Asian origin and coexpansion of Mycobacterium tuberculosis Beijing family with Han Chinese. Proc. Natl. Acad. Sci. USA 2015, 112, 8136–8141. [Google Scholar] [CrossRef]
- Kone, B.; Somboro, A.M.; Holl, J.L.; Baya, B.; Togo, A.A.; Sarro, Y.D.; Diarra, B.; Kodio, O.; Murphy, R.L.; Bishai, W.; et al. Exploring the usefulness of molecular epidemiology of tuberculosis in Africa: A systematic review. Int. J. Mol. Epidemiol. Genet. 2020, 11, 1. [Google Scholar]
- Le Hang, N.T.; Hijikata, M.; Maeda, S.; Miyabayashi, A.; Wakabayashi, K.; Seto, S.; Diem, N.T.; Yen, N.T.; Van Duc, L.; Thuong, P.H.; et al. Phenotypic and genotypic features of the Mycobacterium tuberculosis lineage 1 subgroup in central Vietnam. Sci. Rep. 2021, 11, 13609. [Google Scholar] [CrossRef] [PubMed]
- Chen, H.; He, L.; Huang, H.; Shi, C.; Ni, X.; Dai, G.; Ma, L.; Li, W. Mycobacterium tuberculosis lineage distribution in Xinjiang and Gansu Provinces, China. Sci. Rep. 2017, 7, 1068. [Google Scholar] [CrossRef] [PubMed]
- Van der Spoel van Dijk, A.; Makhoahle, P.M.; Rigouts, L.; Baba, K. Diverse Molecular genotypes of Mycobacterium tuberculosis complex isolates circulating in the Free State, South Africa. Int. J. Microbiol. 2016, 2016, 6572165. [Google Scholar] [CrossRef]
- Solo, E.S.; Suzuki, Y.; Kaile, T.; Bwalya, P.; Lungu, P.; Chizimu, J.Y.; Shah, Y.; Nakajima, C. Characterization of Mycobacterium tuberculosis genotypes and their correlation to multidrug resistance in Lusaka, Zambia. Int. J. Infect. Dis. 2021, 102, 489–496. [Google Scholar] [CrossRef] [PubMed]
- Mogashoa, T.; Melamu, P.; Ley, S.D.; Streicher, E.M.; Iketleng, T.; Kelentse, N.; Mupfumi, L.; Mokomane, M.; Kgwaadira, B.; Novitsky, V.; et al. Genetic diversity of Mycobacterium tuberculosis strains circulating in Botswana. PLoS ONE 2019, 14, e0216306. [Google Scholar] [CrossRef] [PubMed]


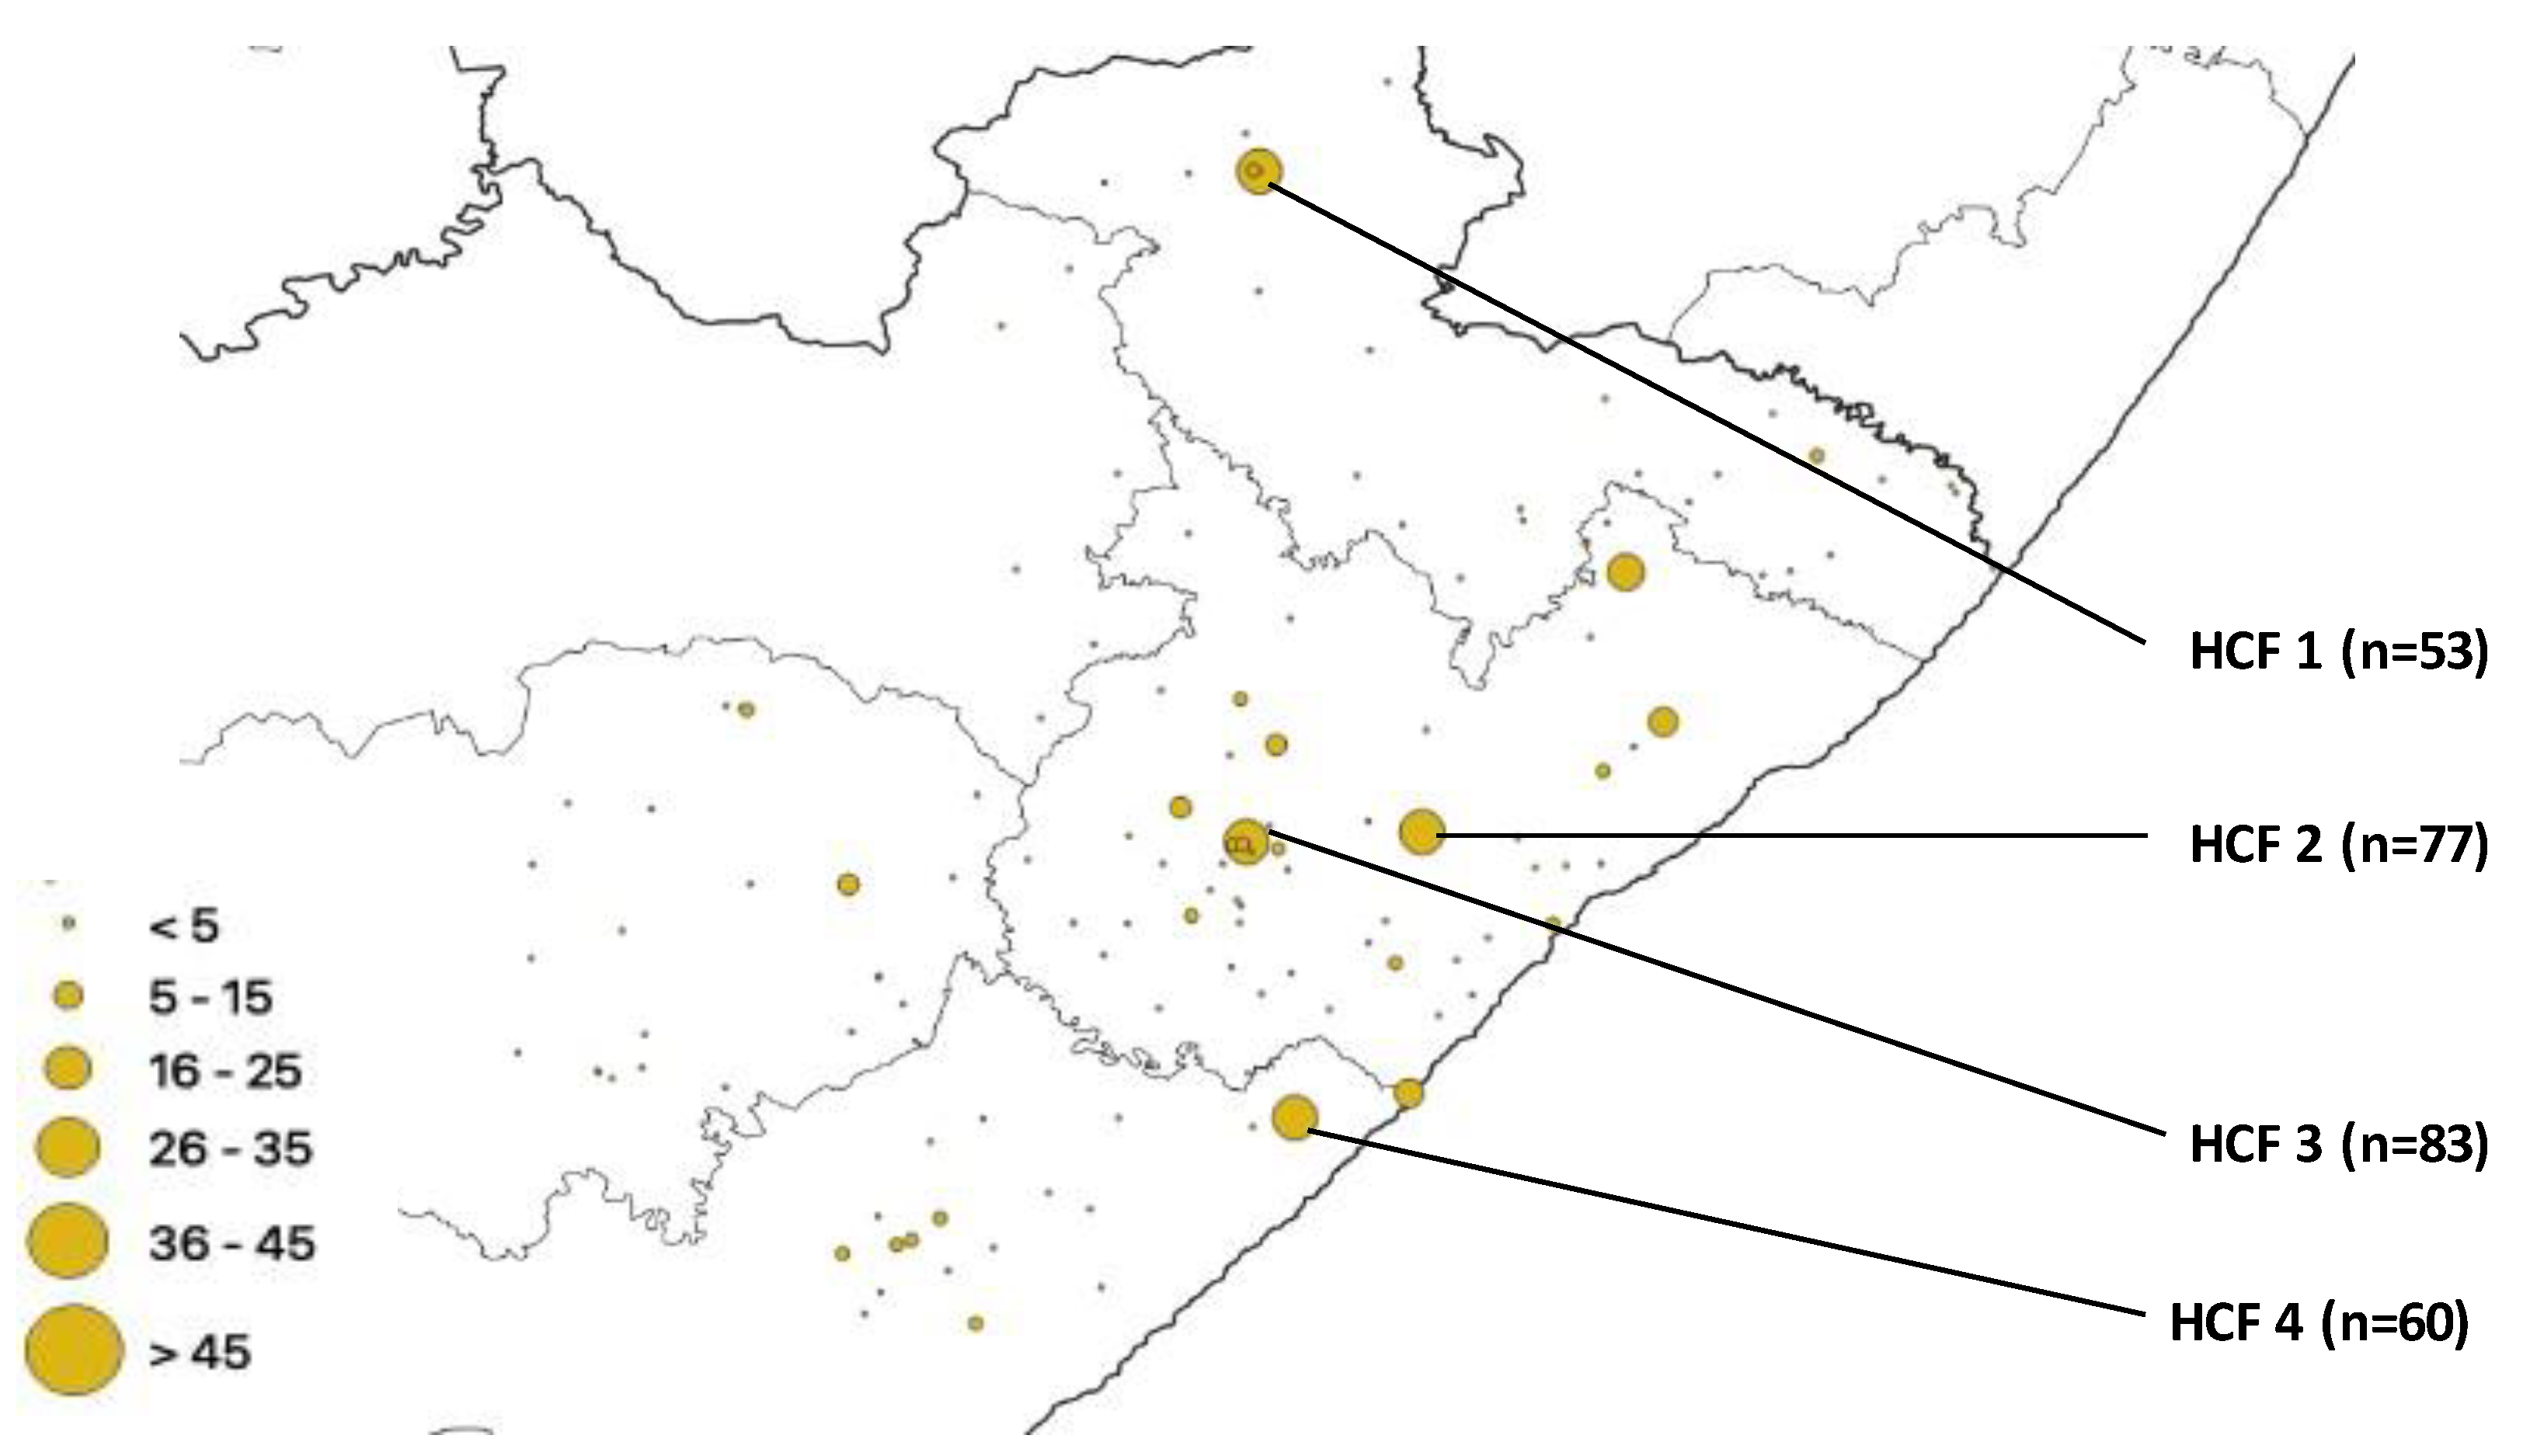
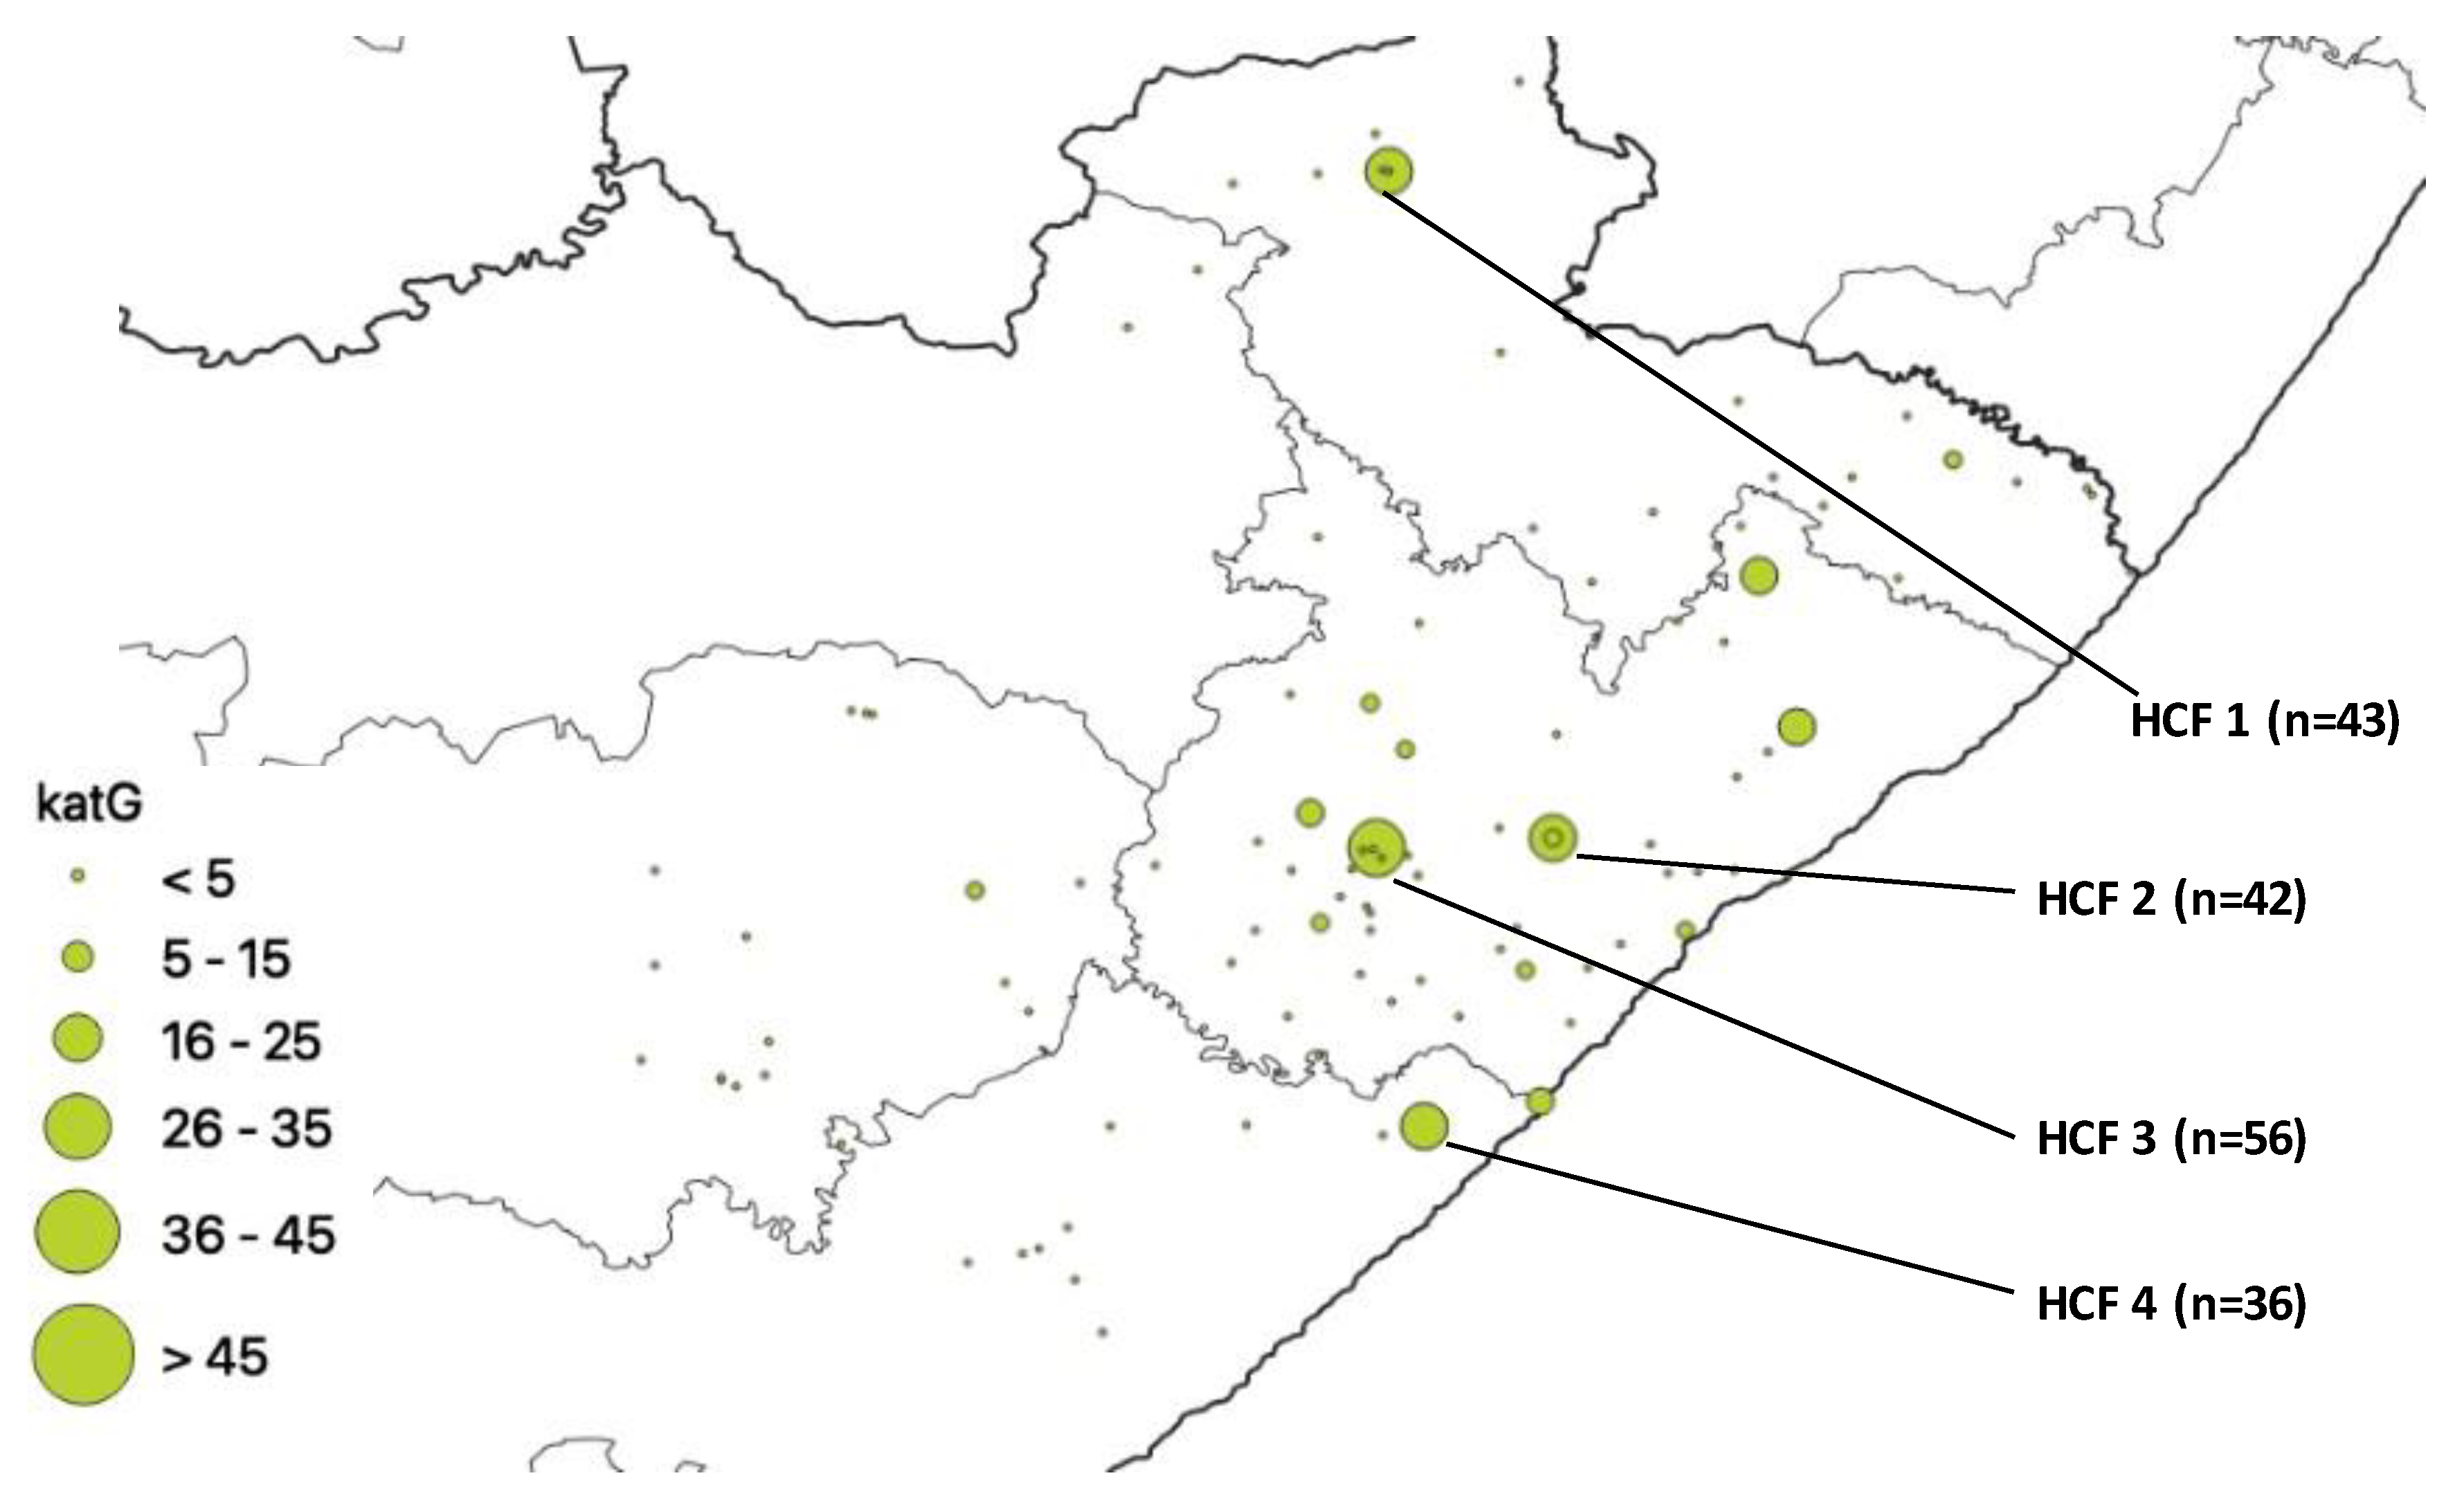
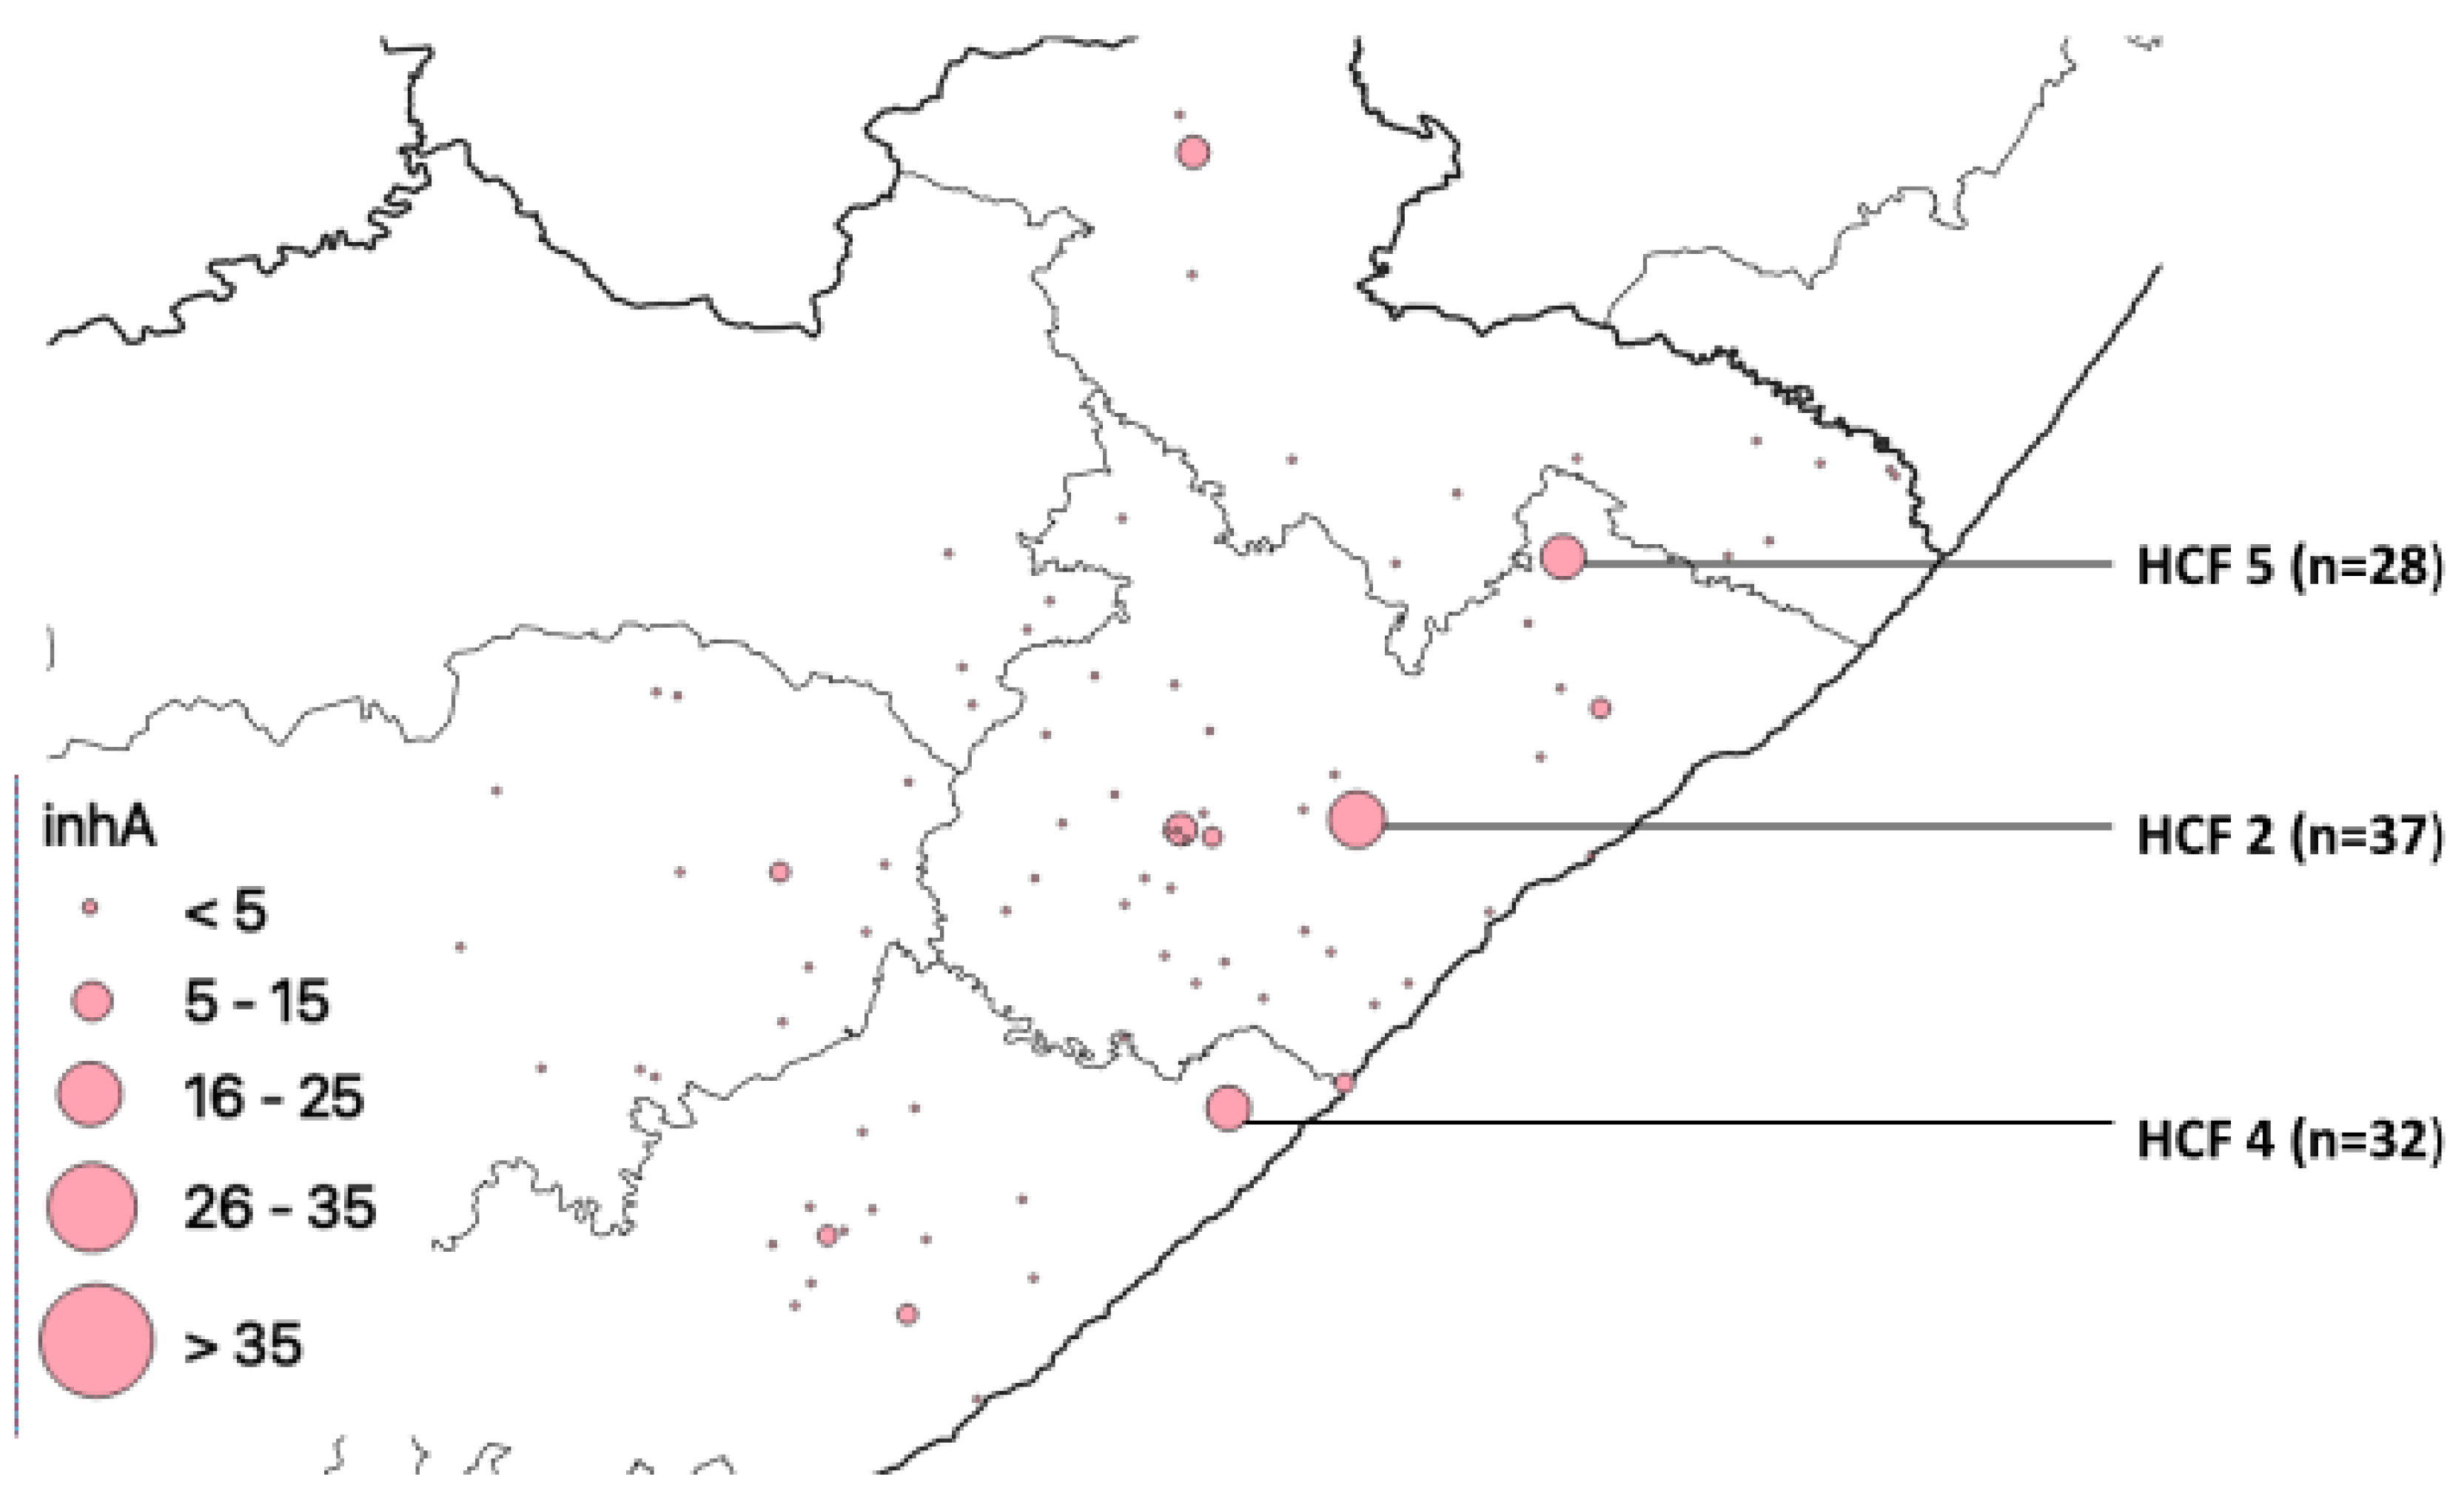
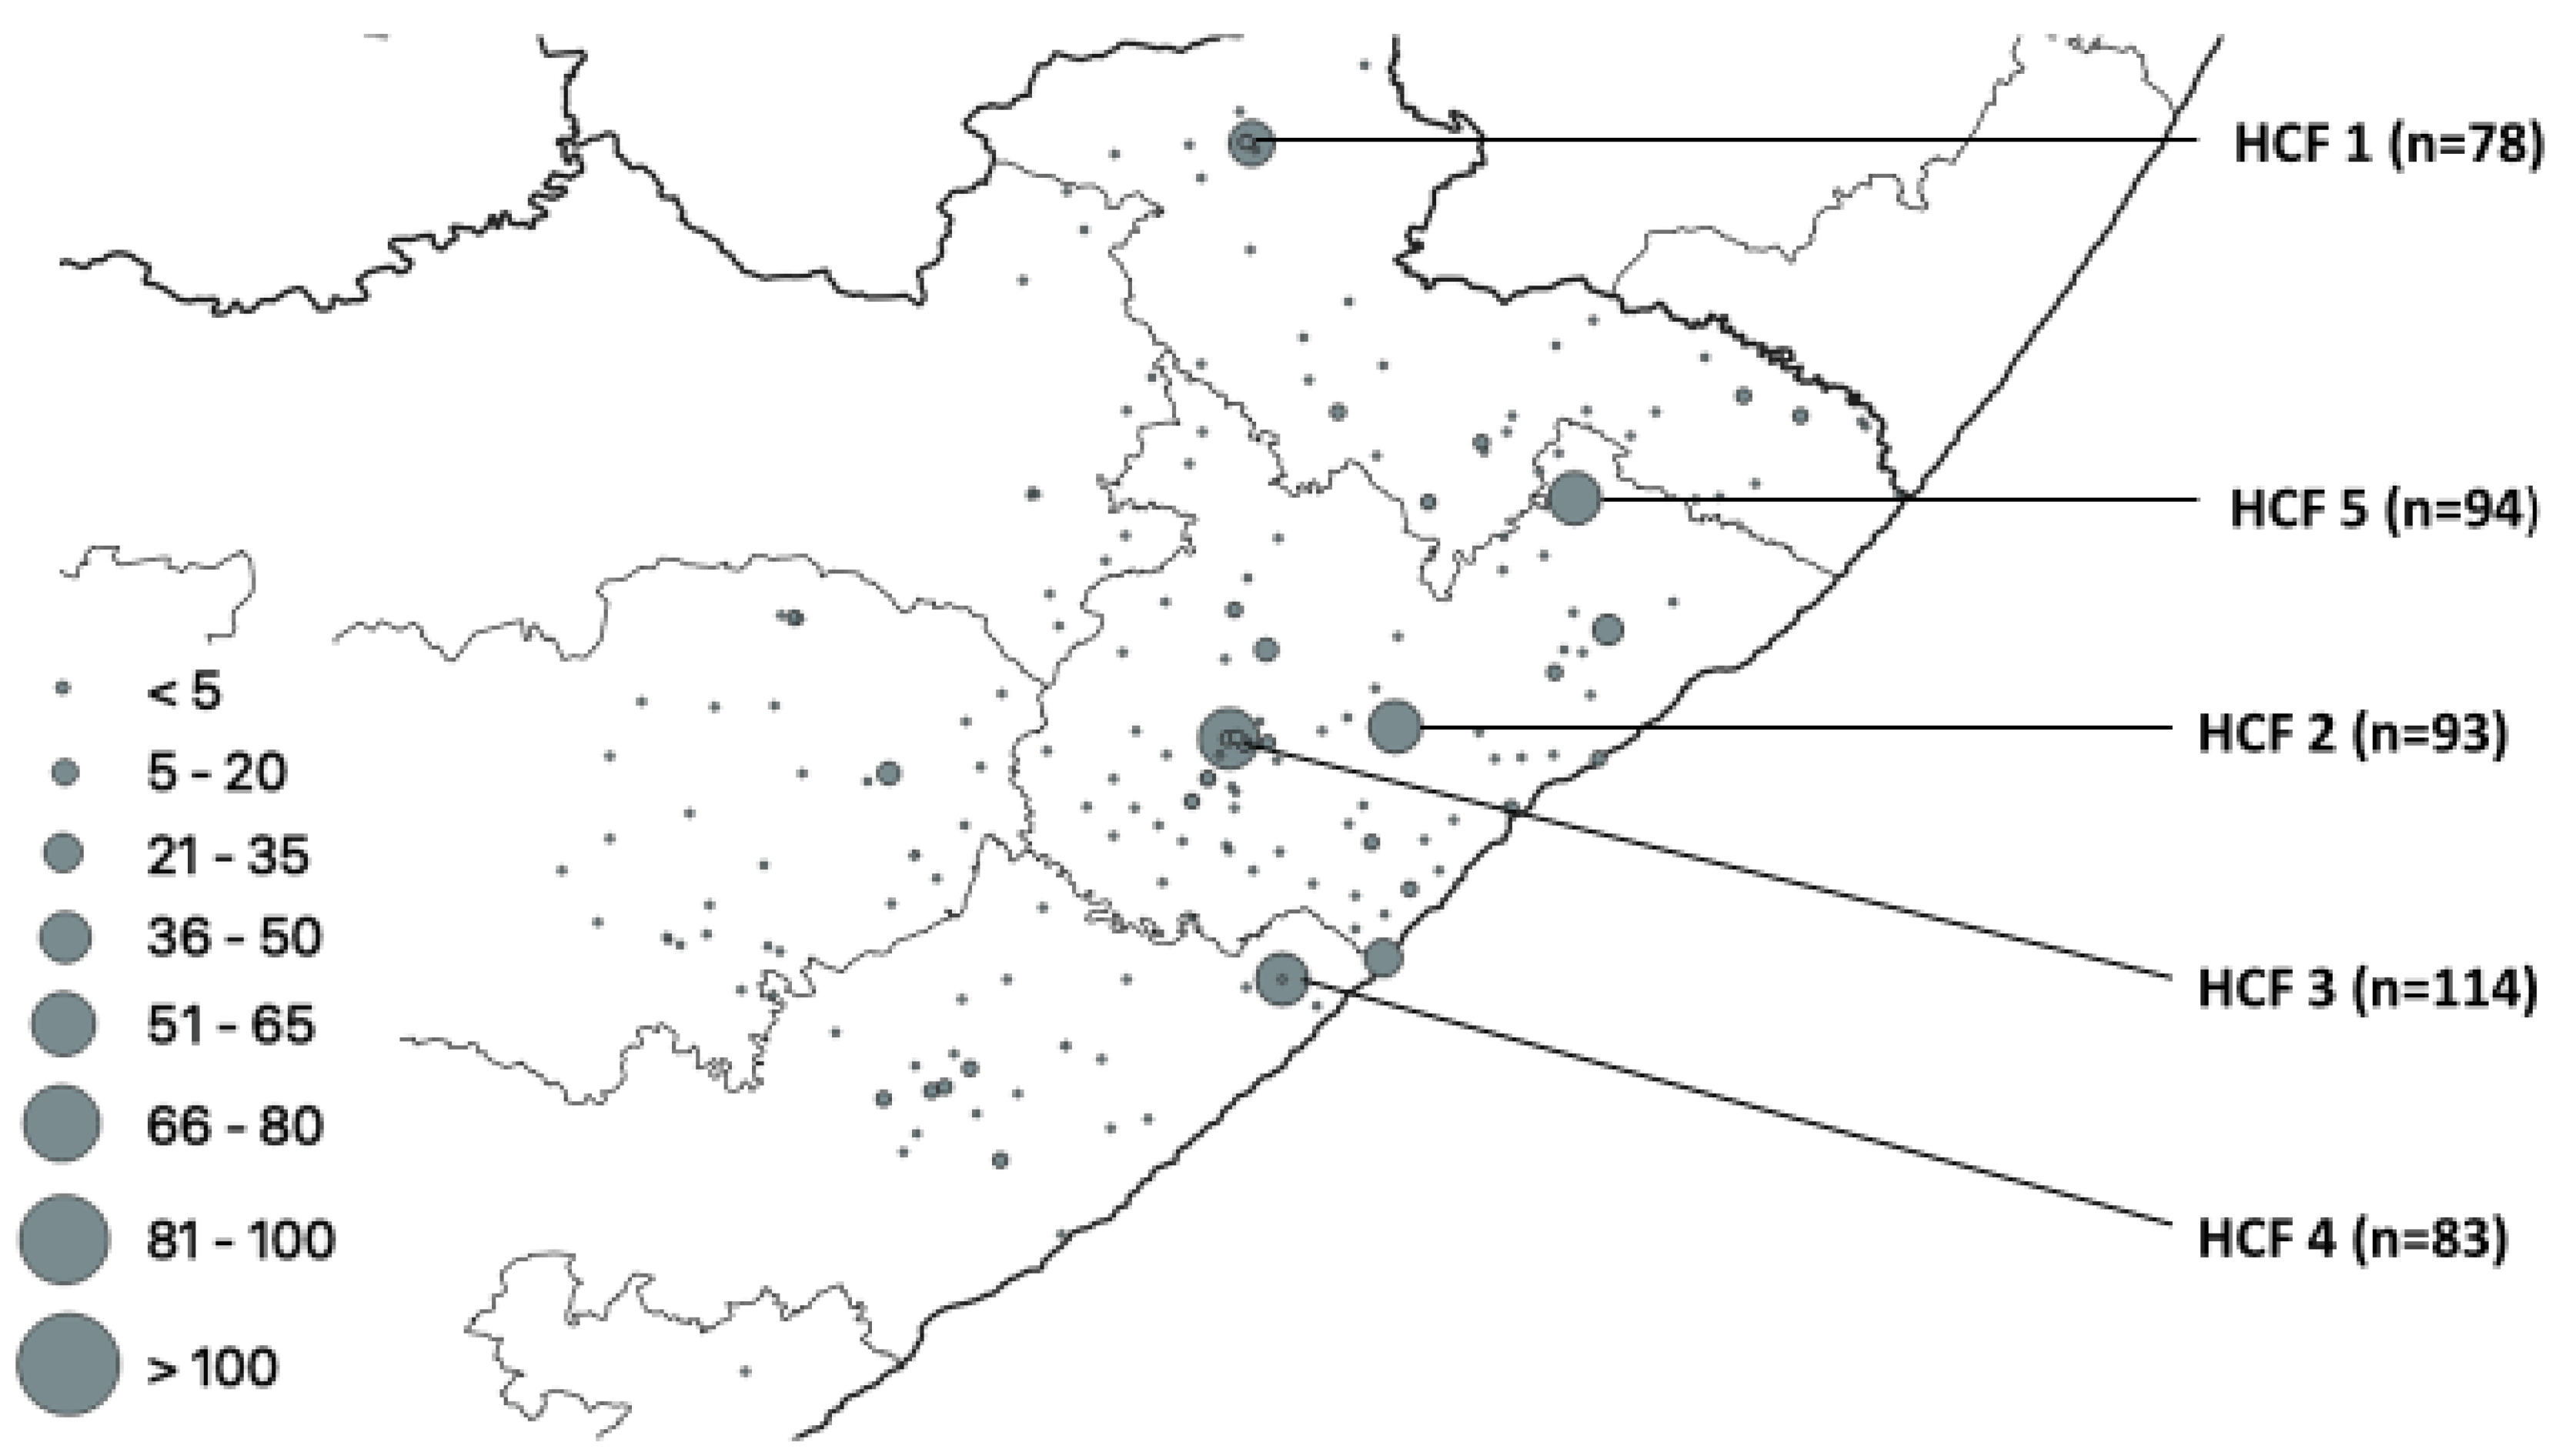
| HCF | Municipality | rpoB | katG | inhA | Heteroresistant Genes |
|---|---|---|---|---|---|
| 1 | Alfred Nzo | 53 | 43 | 0 | 78 |
| 2 | O. R. Tambo | 77 | 42 | 37 | 93 |
| 3 | O. R. Tambo | 83 | 56 | 0 | 114 |
| 4 | Amathole | 60 | 36 | 32 | 83 |
| 5 | O. R. Tambo | 0 | 0 | 28 | 94 |
| Lineage | No of Isolates | Sublineage | No of Isolates | SIT | Spoligo Pattern | No of Isolates |
|---|---|---|---|---|---|---|
| Beijing | 185 | 1 |  | 185 | ||
| LAM | 83 | LAM3 | 62 | 33 |  | 36 |
| 719 |  | 17 | ||||
| ORPHAN |  | 2 | ||||
| 4 |  | 1 | ||||
| 130 |  | 1 | ||||
| 376 |  | 1 | ||||
| 2014 |  | 1 | ||||
| 2284 |  | 1 | ||||
| 2302 |  | 1 | ||||
| not in SITVIT |  | 1 | ||||
| LAM4 | 15 | 60 |  | 15 | ||
| LAM5 | 2 | 93 |  | 1 | ||
| 136 |  | 1 | ||||
| LAM9 | 2 | 42 |  | 2 | ||
| LAM11-ZWE | 2 | 811 |  | 1 | ||
| 1873 |  | 1 | ||||
| X | 48 | X1 | 18 | 2022 |  | 10 |
| 2226 |  | 4 | ||||
| 119 |  | 3 | ||||
| 336 |  | 1 | ||||
| X2 | 3 | 18 |  | 1 | ||
| 137 |  | 1 | ||||
| 2016 |  | 1 | ||||
| X3 | 27 | 92 |  | 21 | ||
| 2286 |  | 4 | ||||
| 2020 |  | 2 | ||||
| T | 34 | T1 | 29 | 53 |  | 13 |
| 926 |  | 4 | ||||
| 334 |  | 2 | ||||
| 501 |  | 2 | ||||
| 156 |  | 1 | ||||
| 245 |  | 1 | ||||
| 373 |  | 1 | ||||
| 519 |  | 1 | ||||
| 732 |  | 1 | ||||
| 1122 |  | 1 | ||||
| 1144 |  | 1 | ||||
| ORPHAN |  | 1 | ||||
| T2 | 1 | 52 |  | 1 | ||
| T2/3 | 2 | 73 |  | 2 | ||
| T3 | 1 | ORPHAN |  | 1 | ||
| T5-RUS1 | 1 | 254 |  | 1 | ||
| T-TUSCANY | 2 | 1737 |  | 2 | ||
| S | 31 | 34 |  | 18 | ||
| 789 |  | 4 | ||||
| 71 |  | 3 | ||||
| Not in SITVIT |  | 2 | ||||
| 790 |  | 1 | ||||
| 1211 |  | 1 | ||||
| Not in SITVIT |  | 1 | ||||
| Not in SITVIT |  | 1 | ||||
| EAI | 16 | EAI1-SOM | 10 | 806 |  | 6 |
| 48 |  | 2 | ||||
| 1649 |  | 2 | ||||
| EAI5 | 5 | 625 |  | 3 | ||
| ORPHAN |  | 2 | ||||
| EAI | 1 | Not in SITVIT |  | 1 | ||
| H | 6 | H1 | 5 | 62 |  | 2 |
| 2375 |  | 2 | ||||
| 47 |  | 1 | ||||
| H3 | 1 | 50 |  | 1 | ||
| CAS | 5 | CAS1-Kili | 2 | 21 |  | 2 |
| CAS1-Delhi | 1 | 1092 |  | 1 | ||
| CAS | 2 | Not in SITVIT |  | 2 | ||
| unknown | 4 | Unknown | 1 | 2018 |  | 1 |
| Not in SITVIT | 3 | Not in SITVIT |  | 1 | ||
| Not in SITVIT |  | 1 | ||||
| Not in SITVIT | 67 | 1 | ||||
| no result | 27 | |||||
| TOTAL | 441 |
| Our Study n (%) | Western Cape n (%) [43] | Gauteng n (%) [43] | KZN n (%) [43] | Free Staten (%) [51] | Limpopo n (%) [44] | North- West n (%) [43] | Zambia n (%) [52] | Botswana n (%) [53] | ||
|---|---|---|---|---|---|---|---|---|---|---|
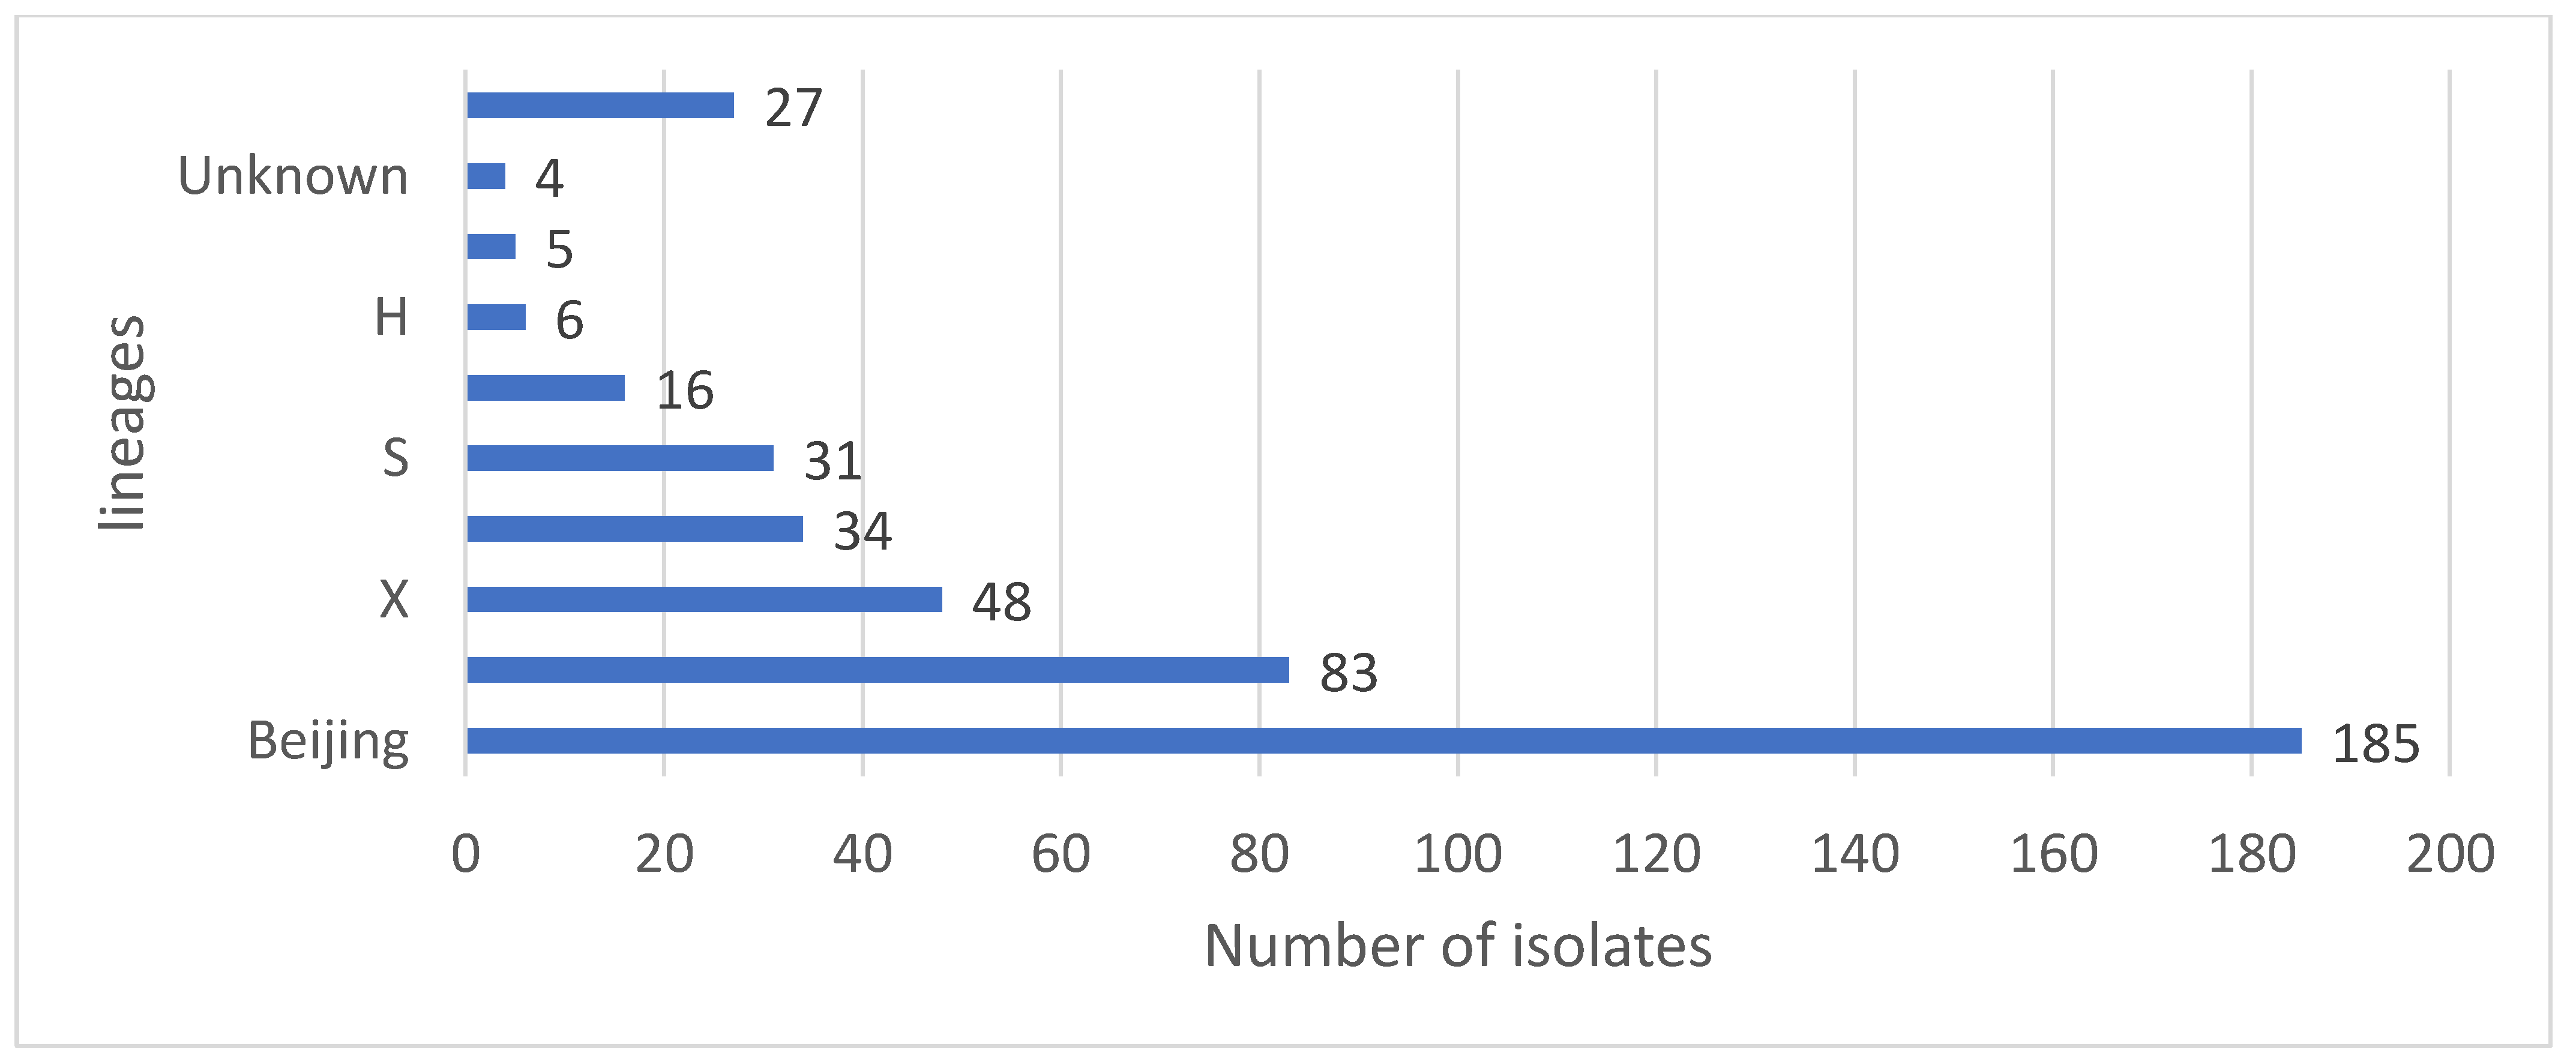
| Lineage | Family | 441 | 897 | 142 | 230 | 86 | 226 | 358 | 274 | 458 |
| 2 | Beijing | 185 (42) | 599 (66.8) | 44 (31.0) | 57 (24.8) | 5 (5.8) | 34 (15.0) | 88 (24.6) | 1 (0.4) | 41 (9.0) |
| 4 | LAM | 83 (18.8) | 53 (5.9) | 29 (20.4) | 42 (18.3) | 18 (20.9) | 60 (26.5) | 54 (15.1) | 149 (54.4) | 150 (32.8) |
| 4 | X | 48 (10.9) | 88 (9.8) | 9 (6.3) | 14 (6.1) | 5 (5.8) | 12 (5.3) | 27 (7.5) | 19 (6.9) | 75 (16.4) |
| 4 | T | 34 (7.7) | 61(6.8) | 18 (12.7) | 29 (12.6) | 14 (16.3) | 43 (19.0) | 60 (16.8) | 39 (14.2) | 73 (15.9) |
| 4 | S | 31 (7.0) | 23 (2.6) | 9 (6.3) | 49 (21.3) | 6 (7.0) | 21 (9.1) | 37 (10.3) | 4 (1.5) | 62 (13.5) |
| 1 | EAI MANU | 16 (3.6) 0 | 6 (0.7) 0 | 12 (8.5) 3 (2.1) | 6 (2.6) 2 (0.9) | 0 0 | 11 (4.9) 3 (1.3) | 24 (6.7) 6 (1.7) | 6 (2.2) | 31 (6.8) 2 (0.4) |
| 4 | H | 6 (1.4) | 10(1.1) | 6 (4.8) | 8 (3.5) | 1 (1.2) | 31 (13.7) | 26 (7.3) | 0 | 21 (4.6) |
| 3 | CAS | 5 (1.1) | 8 (0.9) | 2 (1.4) | 5 (2.2) | 0 | 10 (4.4) | 6 (1.7) | 44 (16.1) | 2 (0.4) |
| 3 | U | 0 | 7 (0.8) | 0 | 1 (0.4) | 0 | 1 (0.4) | 1 (0.3) | 0 | 3 (0.7) |
Disclaimer/Publisher’s Note: The statements, opinions and data contained in all publications are solely those of the individual author(s) and contributor(s) and not of MDPI and/or the editor(s). MDPI and/or the editor(s) disclaim responsibility for any injury to people or property resulting from any ideas, methods, instructions or products referred to in the content. |
© 2023 by the authors. Licensee MDPI, Basel, Switzerland. This article is an open access article distributed under the terms and conditions of the Creative Commons Attribution (CC BY) license (https://creativecommons.org/licenses/by/4.0/).
Share and Cite
Faye, L.M.; Hosu, M.C.; Vasaikar, S.; Dippenaar, A.; Oostvogels, S.; Warren, R.M.; Apalata, T. Spatial Distribution of Drug-Resistant Mycobacterium tuberculosis Infections in Rural Eastern Cape Province of South Africa. Pathogens 2023, 12, 475. https://doi.org/10.3390/pathogens12030475
Faye LM, Hosu MC, Vasaikar S, Dippenaar A, Oostvogels S, Warren RM, Apalata T. Spatial Distribution of Drug-Resistant Mycobacterium tuberculosis Infections in Rural Eastern Cape Province of South Africa. Pathogens. 2023; 12(3):475. https://doi.org/10.3390/pathogens12030475
Chicago/Turabian StyleFaye, Lindiwe M., Mojisola C. Hosu, Sandeep Vasaikar, Anzaan Dippenaar, Selien Oostvogels, Rob M. Warren, and Teke Apalata. 2023. "Spatial Distribution of Drug-Resistant Mycobacterium tuberculosis Infections in Rural Eastern Cape Province of South Africa" Pathogens 12, no. 3: 475. https://doi.org/10.3390/pathogens12030475
APA StyleFaye, L. M., Hosu, M. C., Vasaikar, S., Dippenaar, A., Oostvogels, S., Warren, R. M., & Apalata, T. (2023). Spatial Distribution of Drug-Resistant Mycobacterium tuberculosis Infections in Rural Eastern Cape Province of South Africa. Pathogens, 12(3), 475. https://doi.org/10.3390/pathogens12030475