
Immunohistochemical Characterization of M1, M2, and M4 Macrophages in Leprosy Skin Lesions

 , , , , ,
Abstract
:1. Introduction
2. Materials and Methods
2.1. Patients and Skin Lesion Samples
2.2. Immunostaining for Mφ Characterization and Statistical Analysis
2.3. Ethical Aspects
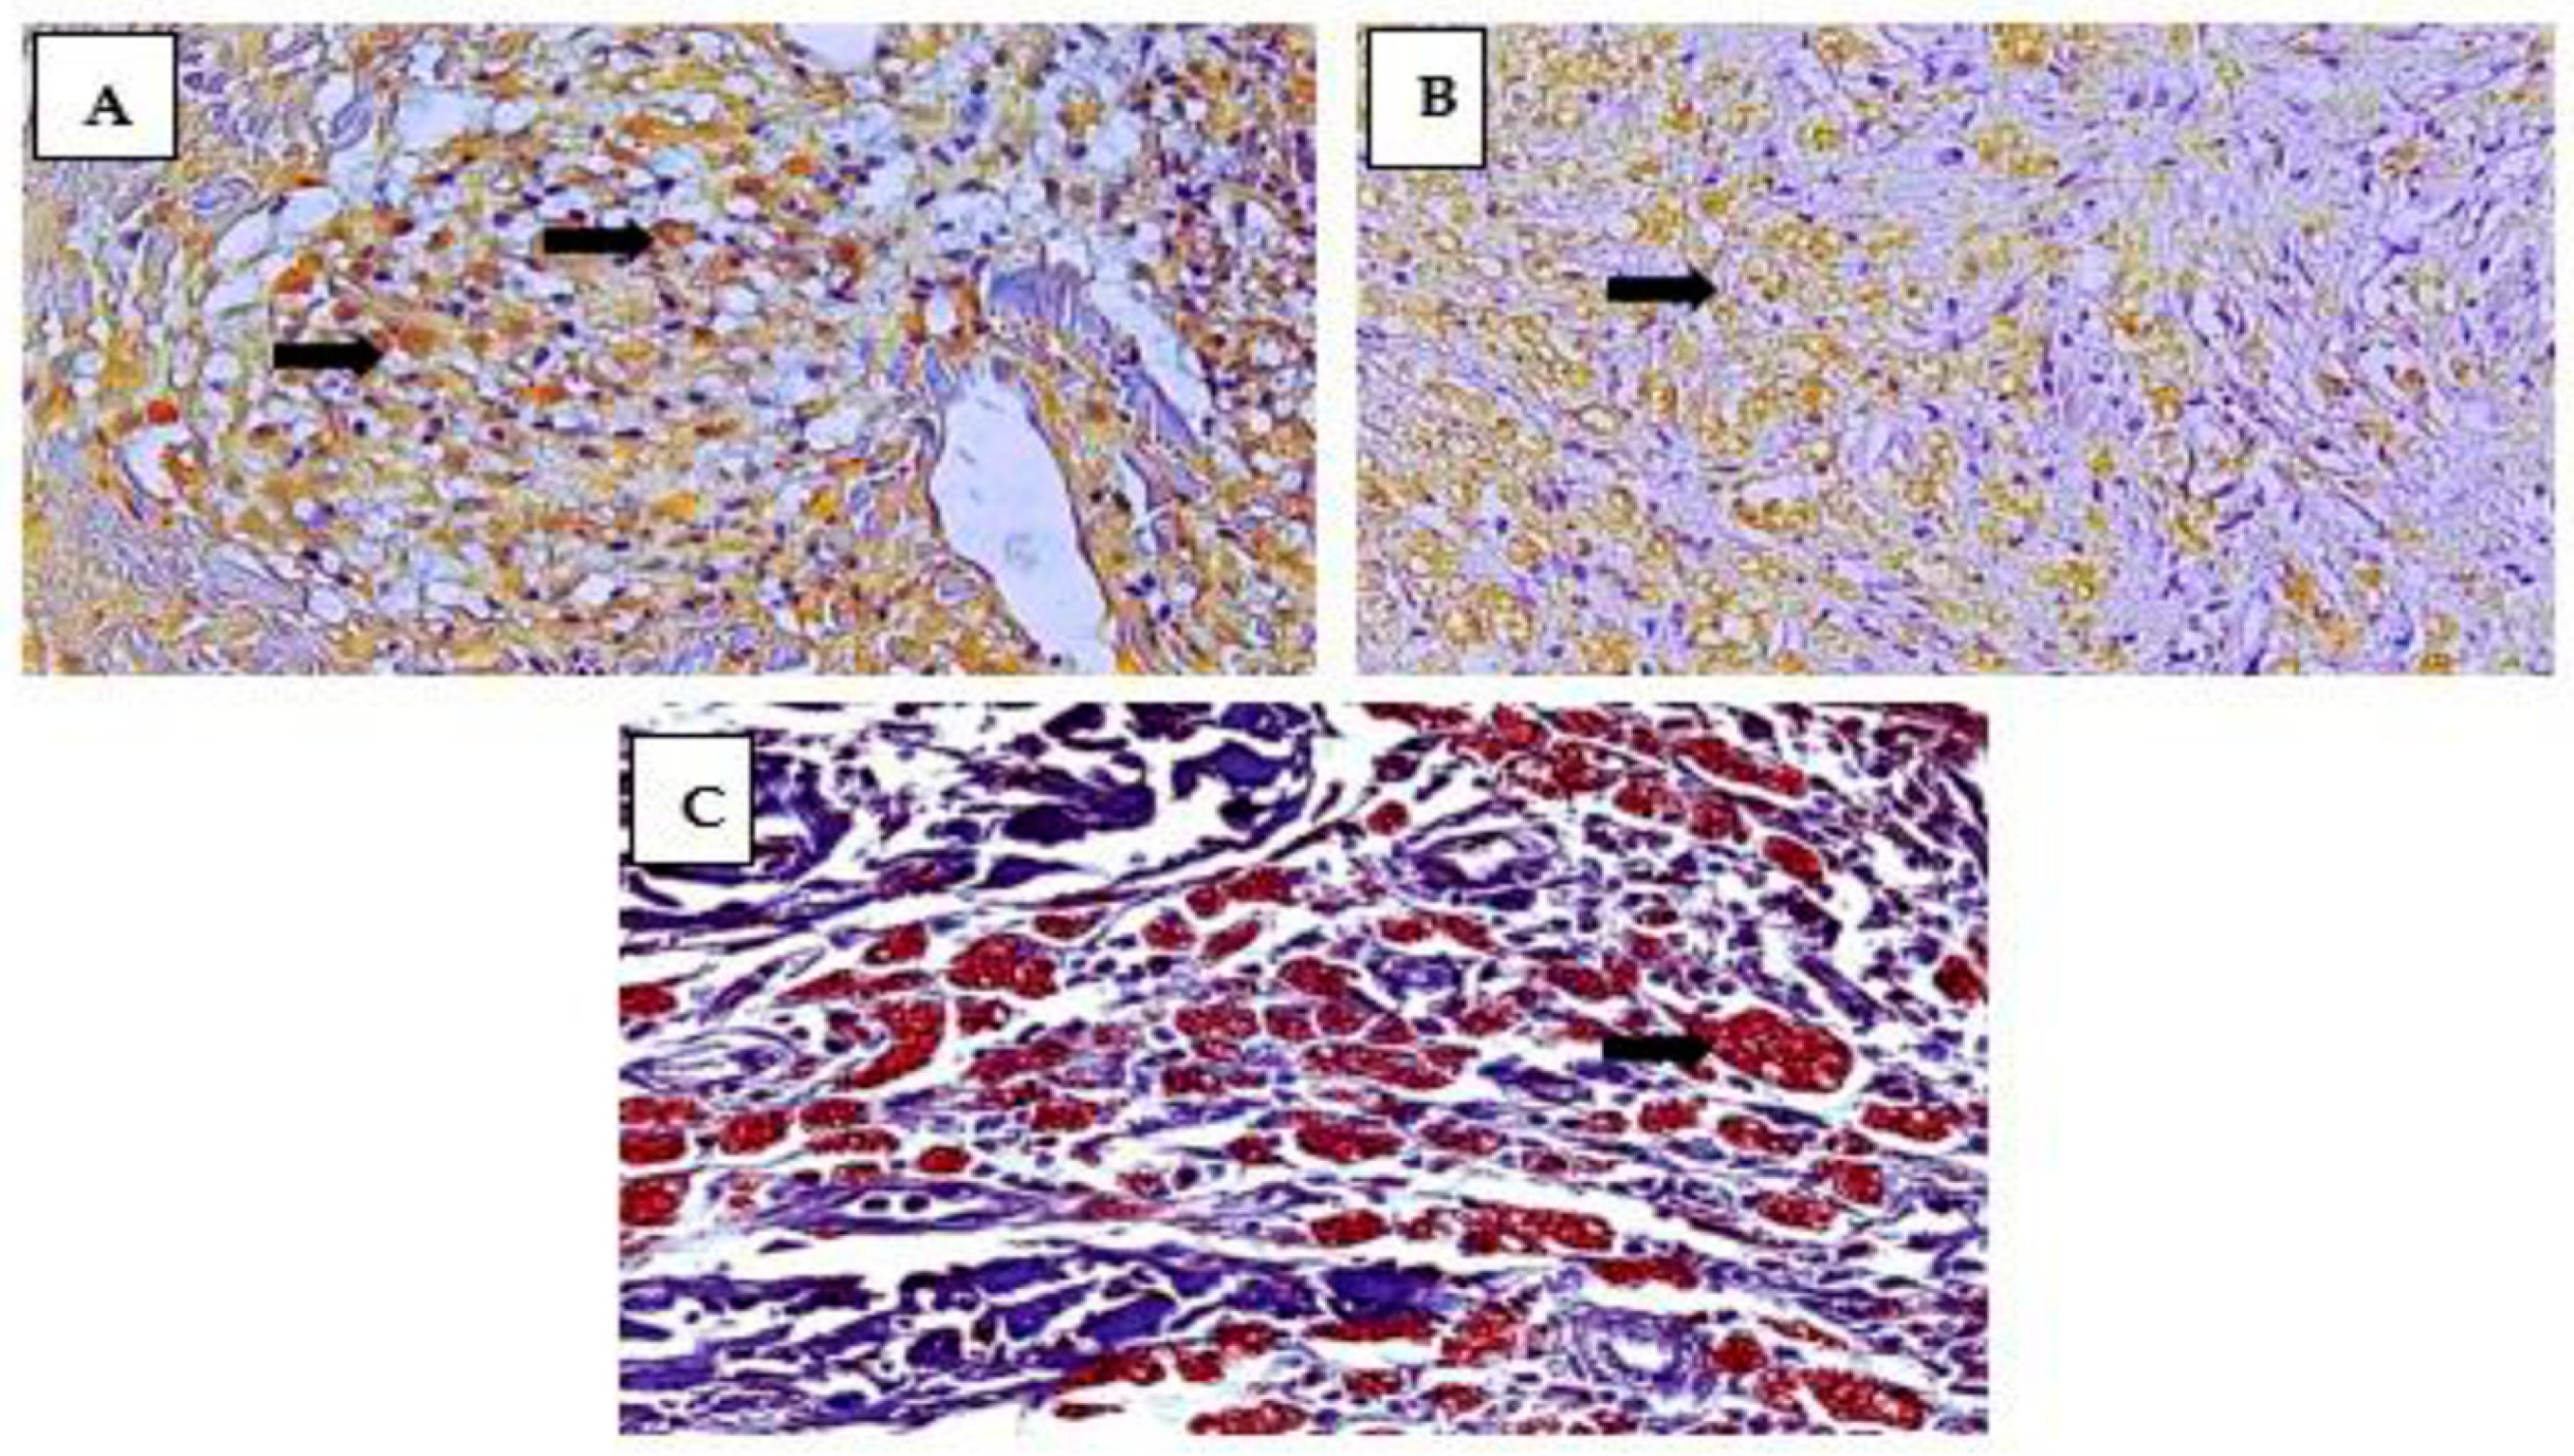
3. Results
4. Discussion
5. Conclusions
Author Contributions
Funding
Institutional Review Board Statement
Informed Consent Statement
Data Availability Statement
Acknowledgments
Conflicts of Interest
References
- Lastória, J.C.; Abreu, M.A.M.M. Etiopathogenic aspects—Part 1. Braz. Ann. Dermatol. 2014, 89, 205–218. [Google Scholar] [CrossRef] [PubMed]
- Woods, J.A.; Lu, Q.; Cedddia, M. Exercise-induced modulation of macrophage function. Immunol. Cell Biol. 2000, 78, 545–553. [Google Scholar] [CrossRef] [PubMed]
- Kedzierska, K.E.; Crowe, S.M. The role of Monocytes and Macrophages in the Pathogenesis of HIV-1 infection. Curr. Med. Chem. 2014, 9, 1893–1903. [Google Scholar] [CrossRef]
- Quaresma, J.A.S. Organization of the Skin Immune System and Compartmentalized Immune Responses in Infectious Diseases. Clin. Microbiol. Rev. 2019, 32, e00034-18. [Google Scholar] [CrossRef] [PubMed]
- Mège, J.L.; Mehraj, V.; Capo, C. Macrophage polarization and bacterial infections. Curr. Opin. Infect. Dis. 2011, 24, 230–234. [Google Scholar] [CrossRef]
- Huang, J.; Brumell, J.H. Bacteria–autophagy interplay: A battle for survival. Nat. Rev. Microbiol. 2014, 12, 101–114. [Google Scholar] [CrossRef]
- Liehl, P.; Zuzarte-Luis, V.; Mota, M.M. Unveiling the pathogen behind the vacuole. Nat. Rev. Microbiol. 2015, 13, 589–598. [Google Scholar] [CrossRef]
- Nathan, C. Secretory products of macrophages: Twenty-five years on. J. Clin. Investig. 2014, 122, 1189–1190. [Google Scholar] [CrossRef]
- Solinas, G.; Germano, G.; Montovani, A. Tumor-associated macrophages (TAM) as major player of cancer-related inflammation. J. Leukoc. Biol. 2009, 86, 1065–1073. [Google Scholar] [CrossRef]
- De Sousa, J.R.; Da Costa Vasconcelos, P.F.; Quaresma, J.A.S. Functional aspects, phenotypic heterogeneity, and tissue immune response of macrophages in infectious diseases. Infect. Drug Resist. 2019, 12, 2589–2611. [Google Scholar] [CrossRef]
- Quaresma, J.A.S.; Lima, L.W.; Fuzii, H.T.; Libonati, R.M.; Pagliari, C.; Duarte, M.I. Immunohistochemical evaluation of macrophage activity and its relationship with apoptotic cell death in the polar forms of leprosy. Microb. Pathog. 2010, 49, 135–140. [Google Scholar] [CrossRef] [PubMed]
- De Sousa, J.R.; De Sousa, R.P.; Aarão, T.L.; Dias, L.B.J.R.; Carneiro, F.R.; Fuzii, H.T.; Quaresma, J.A.S. In situ expression of M2 macrophage subpopulation in leprosy skin lesions. Acta Trop. 2016, 157, 108–114. [Google Scholar] [CrossRef] [PubMed]
- De Sousa, J.R.; Sotto, M.N.; Quaresma, J.A.S. Leprosy As a Complex Infection: Breakdown of the Th1 and Th2 Immune Paradigm in the Immunopathogenesis of the Disease. Front. Immunol. 2017, 8, 1635. [Google Scholar] [CrossRef] [PubMed]
- Murray, P.J.; Allen, J.E.; Biswas, S.K.; Fisher, E.A.; Gilroy, D.W.; Goerdt, S.; Gordon, S.; Hamilton, J.A.; Ivashkiv, L.B.; Lawrence, T.; et al. Macrophage Activation and Polarization: Nomenclature and Experimental Guidelines. Immunity 2014, 41, 14–20. [Google Scholar] [CrossRef]
- Hirai, K.E.; De Sousa, J.R.; Silva, L.M.; Junior, L.B.D.; Furlaneto, I.P.; Carneiro, F.R.O.; de Souza Aarão, T.L.; Sotto, M.N.; Quaresma, J.A.S. Endoplasmic Reticulum Stress Markers and Their Possible Implications in leprosy’s Pathogenesis. Dis. Markers 2018, 16, 7067961. [Google Scholar] [CrossRef]
- Jablonski, K.A.; Amici, S.A.; Webb, L.M.; Ruiz-Rosado, J.D.E.D.; Popovich, P.G.; Partida-Sanchez, S.; Guerau-de-Arellano, M. Novel Markers to Delineate Murine M1 and M2 Macrophages. PLoS ONE 2015, 10, e0145342. [Google Scholar] [CrossRef]
- Biagioli, M.; Carino, A.; Cipriani, S.; Francisci, D.; Marchianò, S.; Carpelli, P.; Sorcini, D.; Zampella, A.; Fiorucci, S. The Bile Acid Receptor GPBAR1 Regulates the M1/M2 Phenotype of Intestinal Macrophages and Activation of GPBAR1 Rescues Mice from Murine Colitis. J. Immunol. 2017, 199, 718–733. [Google Scholar] [CrossRef]
- Santos, D.O.; Miranda, A.; Suffys, P.; Rodrigues, C.R.; Bourguignon, S.C.; Castro, H.C. Current Understanding of the Role of Dendritic Cells and Their Co-Stimulatory Molecules in Generating Efficient T Cell Responses in Lepromatous leprosy. Curr. Immunol. Rev. 2007, 3, 77–85. [Google Scholar] [CrossRef]
- Okwor, I.; Uzonna, J.E. Pathways leading to interleukin-12 production and protective immunity in cutaneous leishmaniasis. Cell. Immunol. 2016, 309, 32–36. [Google Scholar] [CrossRef]
- Von Stebut, E.; Belkaid, Y.; Jakob, T.; Sacks, D.L.; Udey, M.C. Uptake of Leishmania major amastigotes results in activation and interleukin 12 release from murine skin-derived dendritic cells: Implications for the initiation of anti-Leishmania immunity. J. Exp. Med. 1988, 188, 1547–1552. [Google Scholar] [CrossRef]
- Von Stebut, E.; Ehrchen, J.M.; Belkaid, Y.; Kostka, S.L.; Molle, K.; Knop, J.; Sunderkotter, C.; Udey, M.C. Interleukin 1alpha promotes Th1 differentiation and inhibits disease progression in Leishmania major-susceptible BALB/c mice. J. Exp. Med. 2003, 198, 191–199. [Google Scholar] [CrossRef] [PubMed]
- Park, A.Y.; Hondowicz, B.D.; Scott, P. IL-12 is required to maintain a Th1 response during Leishmania major infection. J. Immunol. 2000, 165, 896–902. [Google Scholar] [CrossRef]
- Stobie, L.; Gurunathan, S.; Prussin, C.; Sacks, D.L.; Glaichenhaus, N.; Wu, C.Y.; Seder, R.A. The role of antigen and IL-12 in sustaining Th1 memory cells in vivo: IL-12 is required to maintain memory/effector Th1 cells sufficient to mediate protection to an infectious parasite challenge. Proc. Natl. Acad. Sei. USA 2000, 97, 8427–8432. [Google Scholar] [CrossRef] [PubMed]
- Park, A.Y.; Hondowicz, B.; Kopf, M.; Scott, P. The role of IL-12 in maintaining resistance to Leishmania major. J. Immunol. 2002, 168, 5771–5777. [Google Scholar] [CrossRef]
- Novoselov, V.V.; Sazonova, M.A.; Ivanova, E.A.; Orekhov, A.N. Study of the activated macrophage transcriptome. Exp. Mol. Pathol. 2015, 99, 575–580. [Google Scholar] [CrossRef] [PubMed]
- Sica, A.; Erreni, M.; Allavena, P.; Porta, C. Macrophage polarization in pathology. Cell. Mol. Life Sci. 2015, 72, 4111–4126. [Google Scholar] [CrossRef]
- Tomioka, H.; Tatano, Y.; Maw, W.W.; Sano, C.; Kanehiro, Y.; Shimizu, T. Characteristics of suppressor macrophages induced by mycobacterial and protozoal infections in relation to alternatively activated M2 macrophages. Clin. Dev. Immunol. 2012. [Google Scholar] [CrossRef]
- Ren, Y.; Khan, F.A.; Pandupuspitasari, N.S.; Zhang, S. Immune evasion strategies of pathogens in macrophages: The potential for limiting pathogen transmission. Curr. Issues Mol. Biol. 2017, 21, 21–40. [Google Scholar] [CrossRef]
- Borlace, G.N.; Jones, H.F.; Keep, S.J.; Butler, R.N.; Brooks, D.A. Helicobacter pylori phagosome maturation in primary human macrophages. Gut Pathog. 2011, 3, 3–14. [Google Scholar] [CrossRef]
- Teixeira, S.M. Evaluation of Macrophage Polarization in Patients Infected with Helicobacter pylori and in Relation to Host Susceptibility. Ph.D. Thesis, Federal University of Maranhão, São Luís, Brazil, 2021; 171p. Available online: https://tedebc.ufma.br/jspui/bitstream/tede/3187/2/SELMA-MALUF.pdf (accessed on 1 March 2020).
- Asim, M.; Chaturvedi, R.; Hoge, S.; Lewis, N.D.; Singh, K.; Barry, D.P.; Algood, H.S.; de Sablet, T.; Gobert, A.P.; Wilson, K.T. Helicobacter pylori induces ERK-dependent formation of a phospho-c-Fos c-Jun activator protein-1 complex that causes apoptosis in macrophages. J. Biol. Chem. 2010, 285, 20343–20357. [Google Scholar] [CrossRef]
- Algood, H.M.S.; Cover, T.L. Helicobacter pylori persistence: An overview of interactions between H. pylori and host immune defenses. Clin. Microbiol. Rev. 2006, 19, 597–613. [Google Scholar] [CrossRef]
- Matsumoto, Y.; Blanchard, T.G.; Drakes, M.L.; Basu, M.; Redline, R.W.; Levine, A.D.; Czinn, S.J. Eradication of Helicobacter pylori and resolution of gastritis in the gastric mucosa of IL-10-deficient mice. Helicobacter 2005, 10, 407–415. [Google Scholar] [CrossRef] [PubMed]
- Nakagawa, M.; Karim, M.R.; Izawa, T.; Kuwamura, M.; Yamate, J. Immunophenotypical Characterization of M1/M2 Macrophages and Lymphocytes in Cisplatin-Induced Rat Progressive Renal Fibrosis. Cells 2021, 10, 257. [Google Scholar] [CrossRef] [PubMed]
- Quaresma, J.A.S.; Almeida, F.A.; Aarão, T.L.S.; Miranda Soares, L.P.M.A.; Nunes, I.M.M.; Fuzii, H.T.; Feio Libonati, R.M.; Xavier, M.B.; Pagliari, C.; Seixas Duarte, M.I. Transforming growth factor β and apoptosis in leprosy skin lesions: Possible relationship with the control of the tissue immune response in the Mycobacterium leprae infection. Microbes Infect. 2012, 14, 696–701. [Google Scholar] [CrossRef]
- Aarão, T.L.S.; Esteves, N.R.; Esteves, N.; Soares, L.P.; Pinto, D.D.A.S.; Fuzii, H.T.; Quaresma, J.A. Relationship between growth factors and its implication in the pathogenesis of leprosy. Microb. Pathog. 2014, 77, 66–72. [Google Scholar] [CrossRef] [PubMed]
- Moura, D.F.; Mattos, K.A.; Amadeu, T.P.; Andrade, P.R.; Sales, J.S.; Schmitz, V.; Nery, J.A.; Pinheiro, R.O.; Sarno, E.N. CD163 favors Mycobacterium leprae survival and persistence by promoting anti-inflammatory pathways in lepromatous macrophages. Eur. J. Immunol. 2012, 42, 2925–2936. [Google Scholar] [CrossRef] [PubMed]
- Bobosha, K.; Wilson, L.; Van Meijgaarden, K.E.; Bekele, Y.; Zewdie, M.; van der Ploeg-van Schip, J.J.; Abebe, M.; Hussein, J.; Khadge, S.; Neupane, K.D.; et al. T-Cell Regulation in Lepromatous Leprosy. PLoS Neglected Trop. Dis. 2014, 8, 2773. [Google Scholar] [CrossRef]
- Cunha, L.D.; Yang, M.; Carter, R.; Guy, C.; Harris, L.; Crawford, J.C.; Quarato, G.; Boada-Romero, E.; Kalkavan, H.; Johnson, M.D.L.; et al. LC3-Associated Phagocytosis in Myeloid Cells Promotes Tumor Immune Tolerance. Cell 2018, 175, 429–441.e16. [Google Scholar] [CrossRef]
- Torchinsky, M.B.; Garaude, J.; Martin, A.P.; Blander, J.M. Innate immune recognition of infected apoptotic cells directs T(H)17 cell differentiation. Nature 2009, 458, 78–82. [Google Scholar] [CrossRef]
- Dejani, N.N.; Orlando, A.B.; Niño, V.E.; Penteado, L.A.; Verdana, F.F.; Bazzano, J.M.R.; Codo, A.C.; Salina, A.C.G.; Saraiva, A.C.; Avelar, M.R.; et al. Intestinal host defense outcome is dictated by PGE2 production during efferocytosis of infected cells. PNAS 2018, 115, E8469–E8478. [Google Scholar] [CrossRef]
- Ambrosio, A.R. Leishmania (Viannia) braziliensis: Interaction of mannose-binding lectin with surface glycoconjugates and complement activation. An antibody-independent defence mechanism. Parasite Immunol. 2005, 27, 333–340. [Google Scholar] [CrossRef] [PubMed]
- De Miranda Santos, I.K.F.; Costa, C.H.N.; Krieger, H.; Feitosa, M.F.; Zurakowski, D.; Fardin, B.; Gomes, R.B.; Weiner, D.L.; Harn, D.A.; Ezekowitz, R.A.; et al. Mannan-binding lectin enhances susceptibility to visceral leishmaniasis. Infect. Immun. 2001, 69, 5212–5215. [Google Scholar] [CrossRef] [PubMed]
- Carmo, R.F.; Neves, J.R.L.; Oliveira, P.R.S.; Vasconcelos, L.R.S.; Souza, C.D.F. The role of Mannose-binding lectin in leprosy: A systematic review. Infection. Genet. Evol. 2021, 93, 104945. [Google Scholar] [CrossRef] [PubMed]
- Forestier, C.L.; Gao, Q.; Boons, G.J. Leishmania lipophosphogly can: How to establish structure-activity relationships for this highly complex and multifunctional glycoconjugate? Front. Cell. Infect. Microbiol. 2014, 4, 193. [Google Scholar] [CrossRef]
- Brandonisio, O.; Panaro, M.A.; Marzio, R.; Marangi, A.; Faliero, S.M.; Jirillo, E. Impairment of the human fhagocyte oxidative responses cause by Leishmania lipophosphoglycan (LPG): In vitro studies. FEMS Immunol. Med. Microbiol. 1994, 8, 57–62. [Google Scholar] [CrossRef]
- Sales, J.S.; Lara, F.A.; Amadeu, T.P.; Fulco, T.O.; Nery, J.A.C.; Sampaio, E.P.; Pinheiro, R.O.; Sarno, E.N. The role of indoleamine 2, 3-dioxygenase in lepromatous leprosy immunosuppression. Clin. Exp. Immunol. 2011, 165, 251–263. Available online: https://www.arca.fiocruz.br/bitstream/icict/44255/2/mylena_pereira_ioc_mest_2020.pdf (accessed on 1 March 2020). [CrossRef]
- Mendonça, V.M.; Costa, R.D.; Melo, G.E.B.A.; Antunes, C.M.; Teixeira, A.L. Leprosy immunology. Review article. An. Bras. Dermatol. 2008, 83, 343–350. [Google Scholar] [CrossRef]
- Khadilkar, S.V.; Patil, S.B.; Shetty, V.P. Neuropathies of leprosy. J. Neurol. Sci. 2021, 420, 117288. [Google Scholar] [CrossRef]
- Save, M.P.; Shetty, V.P.; Shetty, K.T.; Antia, N.H. Alterations in neurofilament protein(s) in human leprous nerves: Morphology, immunohistochemistry and Western immunoblot correlative study. Neurophatol. Appl. Neurobiol. 2004, 30, 635–650. [Google Scholar] [CrossRef]
- Shetty, V.P.; Antia, N.H.; Jacobs, J.M. The pathology of early leprous neuropathy. J. Neurol. Sci. 1988, 88, 115–131. [Google Scholar] [CrossRef]
- Jacobs, J.M.; Shetty, V.P.; Antia, N.H. Teased fibre studies in leprous neuropathy. J. Neurol. Sci. 1987, 79, 301–313. [Google Scholar] [CrossRef] [PubMed]
- Vázquez, S.; Vallejo, R.; Espinosa, J.; Arteche, N.; Vega, J.A.; Pérez, V. Caracterização Imunohistoquímica de Macrófagos Associados a Tumores em Linfomas Caninos. Animals 2021, 11, 2301. [Google Scholar] [CrossRef] [PubMed]
- Salina, A.C.G. Activation of M1/M2 Macrophages by Epherocytosis of Infected Apoptotic Cells. Ph.D. Thesis, University of São Paulo, São Paulo, Brazil, 2020; 155p. Available online: https://www.teses.usp.br/teses/disponiveis/17/17147/tde-25082020-090635/publico/ANACAROLINAGUERTASALINAco.pdf (accessed on 1 March 2020).
- Moraco, A.H.; Kornfeld, H. Cell death and autophagy in tuberculosis. Semin. Immunol. 2014, 26, 497–511. [Google Scholar] [CrossRef]
- Silva, L.M.; De Sousa, J.R.; Hirai, K.E.; Dias, L.B., Jr.; Furlaneto, I.P.; Carneiro, F.R.O.; de Souza Aarão, T.L.; Sotto, M.N.; Quaresma, J.A.S. The inflammasome in leprosy skin lesions: An immunohistochemical evaluation. Infect. Drug Resist. 2018, 12, 2231–2240. [Google Scholar] [CrossRef] [PubMed]
- Fulco, T.O.; Andrade, P.R.; Barbosa, M.G.M.; Pinto, T.G.; Ferreira, P.F.; Ferreira, H.; da Costa Nery, J.A.; Real, S.C.; Borges, V.M.; Moraes, M.O.; et al. Effect of apoptotic cell recognition on macrophage polarization and mycobacterial persistence. Infect. Immun. 2014, 82, 3968–3978. [Google Scholar] [CrossRef]
- Nikiforov, N.G.; Kornienko, V.Y.; Karagodin, V.P.; Orekhov, A.N. Macrophage activation in atherosclerosis. Message 1: Activation of macrophages normally and in atherosclerotic lesions. Patol. Fiziol. Eksp. 2015, 3, 128–131. [Google Scholar]
- Luo, F.; Sun, X.; Qu, Z.; Zhang, X. Salmonella typhimurium-induced M1 macrophage polarization is dependent on the bacterial O antigen. World J. Microbiol. Biotechnol. 2016, 32, 22. [Google Scholar] [CrossRef]
- Gleissner, C.A. Macrophage phenotype modulation by CXCL4 in atherosclerosis. Front. Physiol. 2012, 3, 1. [Google Scholar] [CrossRef]
- Boyle, J.J.; Johns, M.; Lo, J.; Chiodini, A.; Ambrose, N.; Evans, P.C.; Mason, J.C.; Haskard, D.O. Heme Induces Heme Oxygenase 1 via Nrf2 Role in the Homeostatic Macrophage Response to Intraplaque Hemorrhage. Arterioscler. Thromb. Vasc. Biol. 2011, 31, 2685–2691. [Google Scholar] [CrossRef]
- Gleissner, C.A.; Shaked, I.; Little, K.M.; Ley, K. CXC chemokine ligand 4 induces a unique transcriptome in monocyte-derived macrophages. J. Immunol. 2010, 84, 4810–4818. [Google Scholar] [CrossRef]
- Reibel, F.; Cambau, E.; Aubry, A. Update on the epidemiology, diagnosis, and treatment of leprosy. Med. Mal. Infect. 2015, 45, 383–393. [Google Scholar] [CrossRef] [PubMed]
- Fonseca, A.B.L.; Simon, M.V.; Cazzaniga, R.A.; Moura, T.R.; Almeida, R.P.; Duthie, M.S.; Reed, S.G.; de Jesus, A.R. The influence of innate and adaptative immune responses on the differential clinical outcomes of leprosy. Infect. Dis. Poverty 2017, 6, 5. [Google Scholar] [CrossRef] [PubMed]
- Elamin, A.A.; Stehr, M.; Singh, M. Lipid Droplets and Mycobacterium leprae. Infection. J. Pathog. 2012, 2012, 361374. [Google Scholar] [CrossRef] [PubMed]
- Kaur, G.; Kaur, J. Multifaceted role of lipids in Mycobacterium leprae. Future Microbiol. 2017, 12, 315–335. [Google Scholar] [CrossRef]
- Mattos, K.A.; Lara, F.A.; Oliveira, V.G.; Rodrigues, L.S.; D’avila, H.; Melo, R.C.; Manso, P.P.; Sarno, E.N.; Bozza, P.T.; Pessolani, M.C. Modulation of lipid droplets by Mycobacterium leprae in Schwann cells: A putative mechanism for host lipid acquisition and bacterial survival in phagosomes. Cell. Microbiol. 2011, 13, 259–273. [Google Scholar] [CrossRef]
- Erbel, C.; Tyka, M.; Helmes, C.M.; Akhavanpoor, M.; Rupp, G.; Domschke, G.; Linden, F.; Lobo, A.; Dosch, A.; Lasitschka, F.; et al. CXCL4-induced plaque macrophages can be specifically identified by co-expression of MMP7+S100A8+ in vitro and in vivo. Innate Immun. 2015, 21, 255–265. [Google Scholar] [CrossRef]
- Rojas, J.; Salazar, J.; Martínez, M.S.; Palmar, J.; Bautista, J.; Chávez-Castillo, M.; Gómez, A.; Bermúdez, V. Macrophage Heterogeneity and Plasticity: Impact of Macrophage Biomarkers on Atherosclerosis. Scientifica 2015, 2015, 851252. [Google Scholar] [CrossRef]
- Brizzi, M.F.; Tarone, G.; Defilippi, P. Extracellular matrix, integrins, and growth factors as tailors of the stem cell niche. Curr. Opin. Cell Biol. 2012, 24, 645–651. [Google Scholar] [CrossRef]
- Mcmahan, R.S.; Birkland, T.P.; Smigiel, K.S.; Vandivort, T.C.; Rohani, M.G.; Manicone, A.M.; McGuire, J.K.; Gharib, S.A.; Parks, W.C. Stromelysin-2 (MMP10) Moderates Inflammation by Controlling Macrophage Activation. J. Immunol. 2016, 197, 899–909. [Google Scholar] [CrossRef]
- Koller, F.L.; Dozier, E.A.; Nam, K.T.; Swee, M.; Birkland, T.P.; Parks, W.C.; Fingleton, B. Lack of MMP10 exacerbates experimental colitis and promotes development of inflammation-associated colonic dysplasia. Lab. Investig. 2012, 92, 1749–1759. [Google Scholar] [CrossRef]
- Van Den Steen, P.E.; Husson, S.J.; Proost, P.; Van-Damme, J.; Opdenakker, G. Carboxyterminal cleavage of the chemokines MIG and IP-10 by gelatinase B and neutrophil collagenase. Biochem. Biophys. Res. Commun. 2003, 310, 889–896. [Google Scholar] [CrossRef]
- Manicone, A.M.; Mcguire, J.K. Matrix metalloproteinases as modulators of inflammation. Semin. Cell Dev. Biol. 2008, 19, 34–41. [Google Scholar] [CrossRef] [PubMed]
- Dalby, E.; Christensen, S.M.; Wang, J.Y.; Hamidzadeh, K.; Chandrasekaran, P.; Hughitt, V.K.; Tafuri, W.L.; Arantes, R.M.E.; Rodrigues, I.A.; Herbst, R.; et al. Immune Complex- Driven Generation of Human Macrophages with Anti-Inflammatory and Growth-Promoting Activity. J. Immunol. 2020, 205, 102–112. [Google Scholar] [CrossRef] [PubMed]
- Sousa, J.R.; Dias, F.; Neto, L.; Sotto, M.N.; Quaresma, J.A.S. Immunohistochemical characterization of the M4 macrophage population in leprosy skin lesions. BMC Infect. Dis. 2018, 18, 576. [Google Scholar] [CrossRef] [PubMed]
- Chiu, Y.H.; Ritchlin, C.T. DC-STAMP: A key regulator in osteoclast differentiation. J. Cell. Physiol. 2016, 231, 2402–2407. [Google Scholar] [CrossRef] [PubMed]
- Zeng, X.X.; Chu, T.J.; Yuan, J.Y.; Zhang, W.; Du, Y.M.; Ban, Z.Y.; Lei, D.M.; Cao, J.; Zhang, Z. Transmembrane 7 superfamily member 4 regulates cell cycle progression in breast cancer cells. Eur. Rev. Med. Pharmacol. Sci. 2015, 19, 4353–4361. Available online: https://www.europeanreview.org/article/9857 (accessed on 1 March 2020). [PubMed]
- Sawatani, Y.; Miyamoto, T.; Nagai, S.; Maruya, M.; Imai, J.; Miyamoto, K.; Fujita, N.; Ninomiya, K.; Suzuki, T.; Iwasaki, R.; et al. The role of DC-STAMP in maintenance of immune tolerance through regulation of dendritic cell function. Int. Immunol. 2008, 20, 1259–1268. [Google Scholar] [CrossRef]
- Sanecka, A.; Ansems, M.; Prosser, A.C.; Danielski, K.; Warner, K.; den Brok, M.H.; Jansen, B.J.; Eleveld-Trancikova, D.; Adema, G.J. DC-STAMP knock-down deregulates cytokine production and T-cell stimulatory capacity of LPS-matured dendritic cells. BMC Immunol. 2011, 12, 57. [Google Scholar] [CrossRef]
- Cardoso, C.C.; Pereira, A.C.; De Sales Marques, C.; Moraes, M.O. Leprosy susceptibility: Genetic variations regulate innate and adaptive immunity, and disease outcome. Future Microbiol. 2011, 6, 533–549. [Google Scholar] [CrossRef]
- Marin, A.; Huss, C.V.; Corbett, J.; Kim, S.; Mohl, J.; Hong, B.Y.; Cervantes, J. Human macrophage polarization in the response to Mycobacterium leprae genomic DNA. Curr. Res. Microb. Sci. 2021, 2, 10001. [Google Scholar] [CrossRef]
- Teles, R.M.; Graeber, T.G.; Kruitzik, S.R.; Montoya, D.; Schenk, M.; Lee, D.J.; Komisopoulou, E.; Kelly-Scumpia, K.; Chun, R.; Iyer, S.S.; et al. Type I interferon suppresses type II interferon-triggered human anti-mycobacterial responses. Sciense 2013, 3, 339–1448. [Google Scholar] [CrossRef] [PubMed]
- Cervantes, J.L.; Oak, E.; Garcia, J.; Liu, H.; Lorenzini, P.A.; Batra, D.; Chhabra, A.; Salazar, J.C.; Roca, X. Vitamin D modulates human macrophage response to Mycobacterium tuberculosis DNA. Tuberculosis 2019, 116, S131–S137. [Google Scholar] [CrossRef] [PubMed]


| Macrophage Phenotype | Clinical Forms | p Value * | ||
|---|---|---|---|---|
| Virchowian Mean ± SD (95% CI) | Borderline Mean ± SD (95% CI) | Tuberculoid Mean ± SD (95% CI) | ||
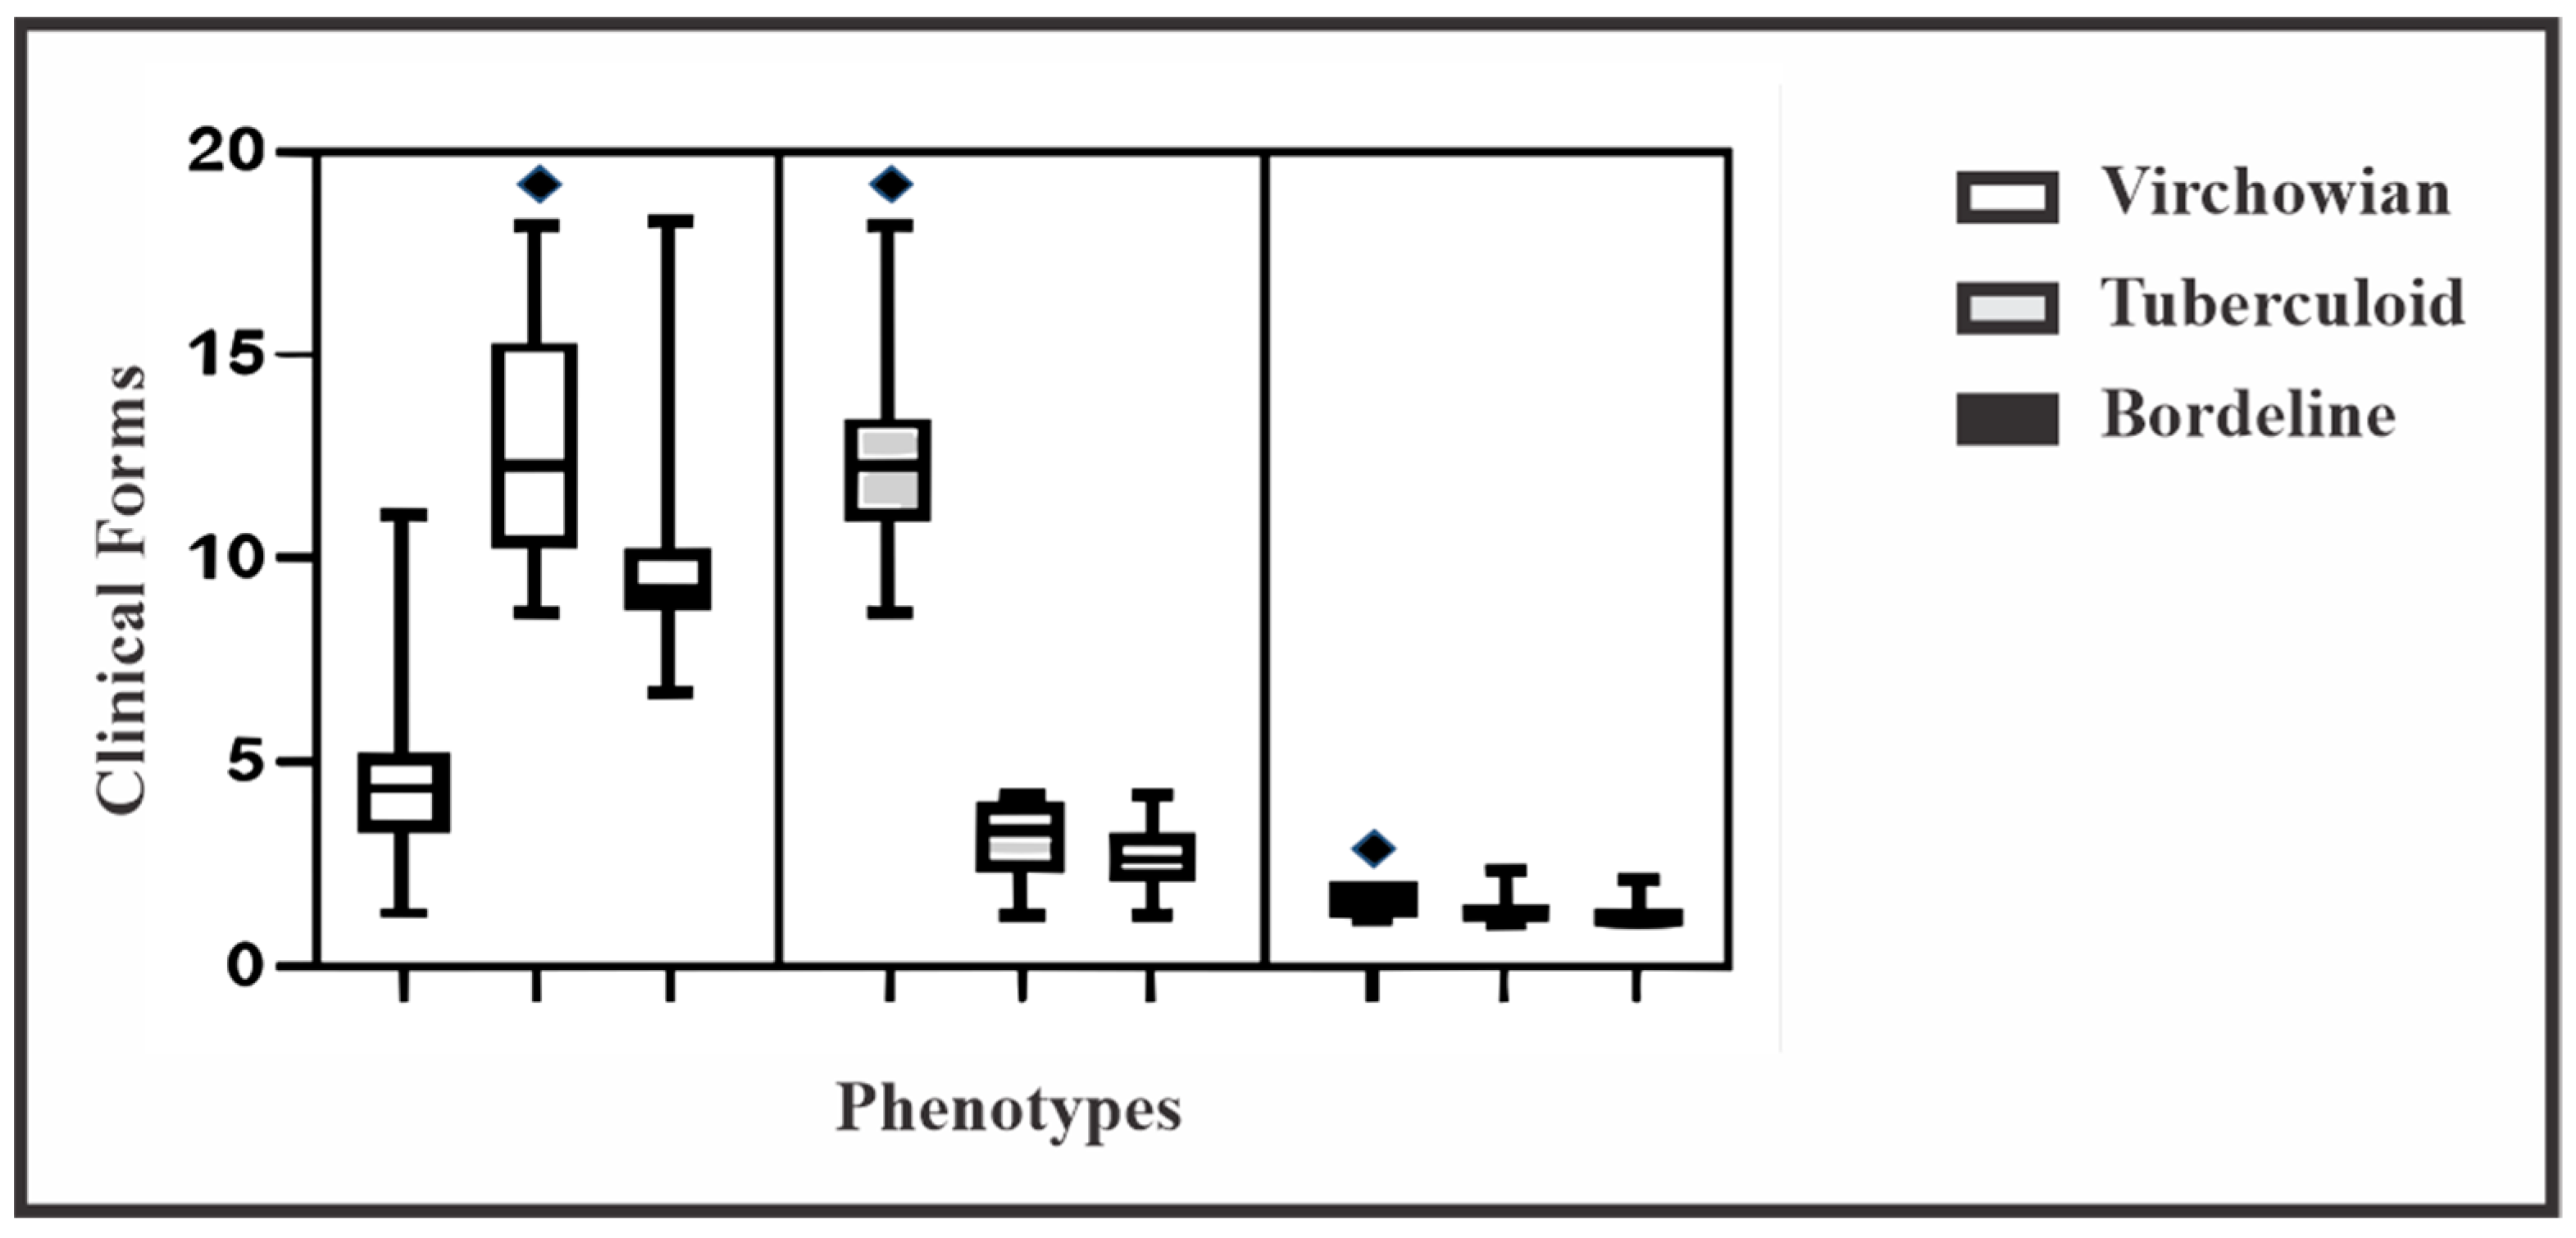
| M1 | 4.5 ± 1.3 (0.7–5.2) | 1.6 ± 0.4 (0.2–1.8) | 12.5 ± 1.8 (0.9–13.4) | <0.0001 |
| M2 | 12.5 ± 2.3 (1.2–13.7) | 1.3 ± 0.2 (0.1–1.5) | 3.2 ± 0.7 (0.3–3.5) | <0.0001 |
| M4 | 9.8 ± 1.7 (0.9–10.7) | 1.2 ± 0.2 (0.1–1.3) | 2.6 ± 0.7 (0.3–3.0) | <0.0001 |
| p value* | <0.0001 | <0.0001 | <0.0001 | |
| Cell Profile | r (Pearson) | p (Value) |
|---|---|---|
| M1V–M4V | 0.8712 | <0.0001 A |
| M2V–M1T | 0.8341 | 0.0002 A |
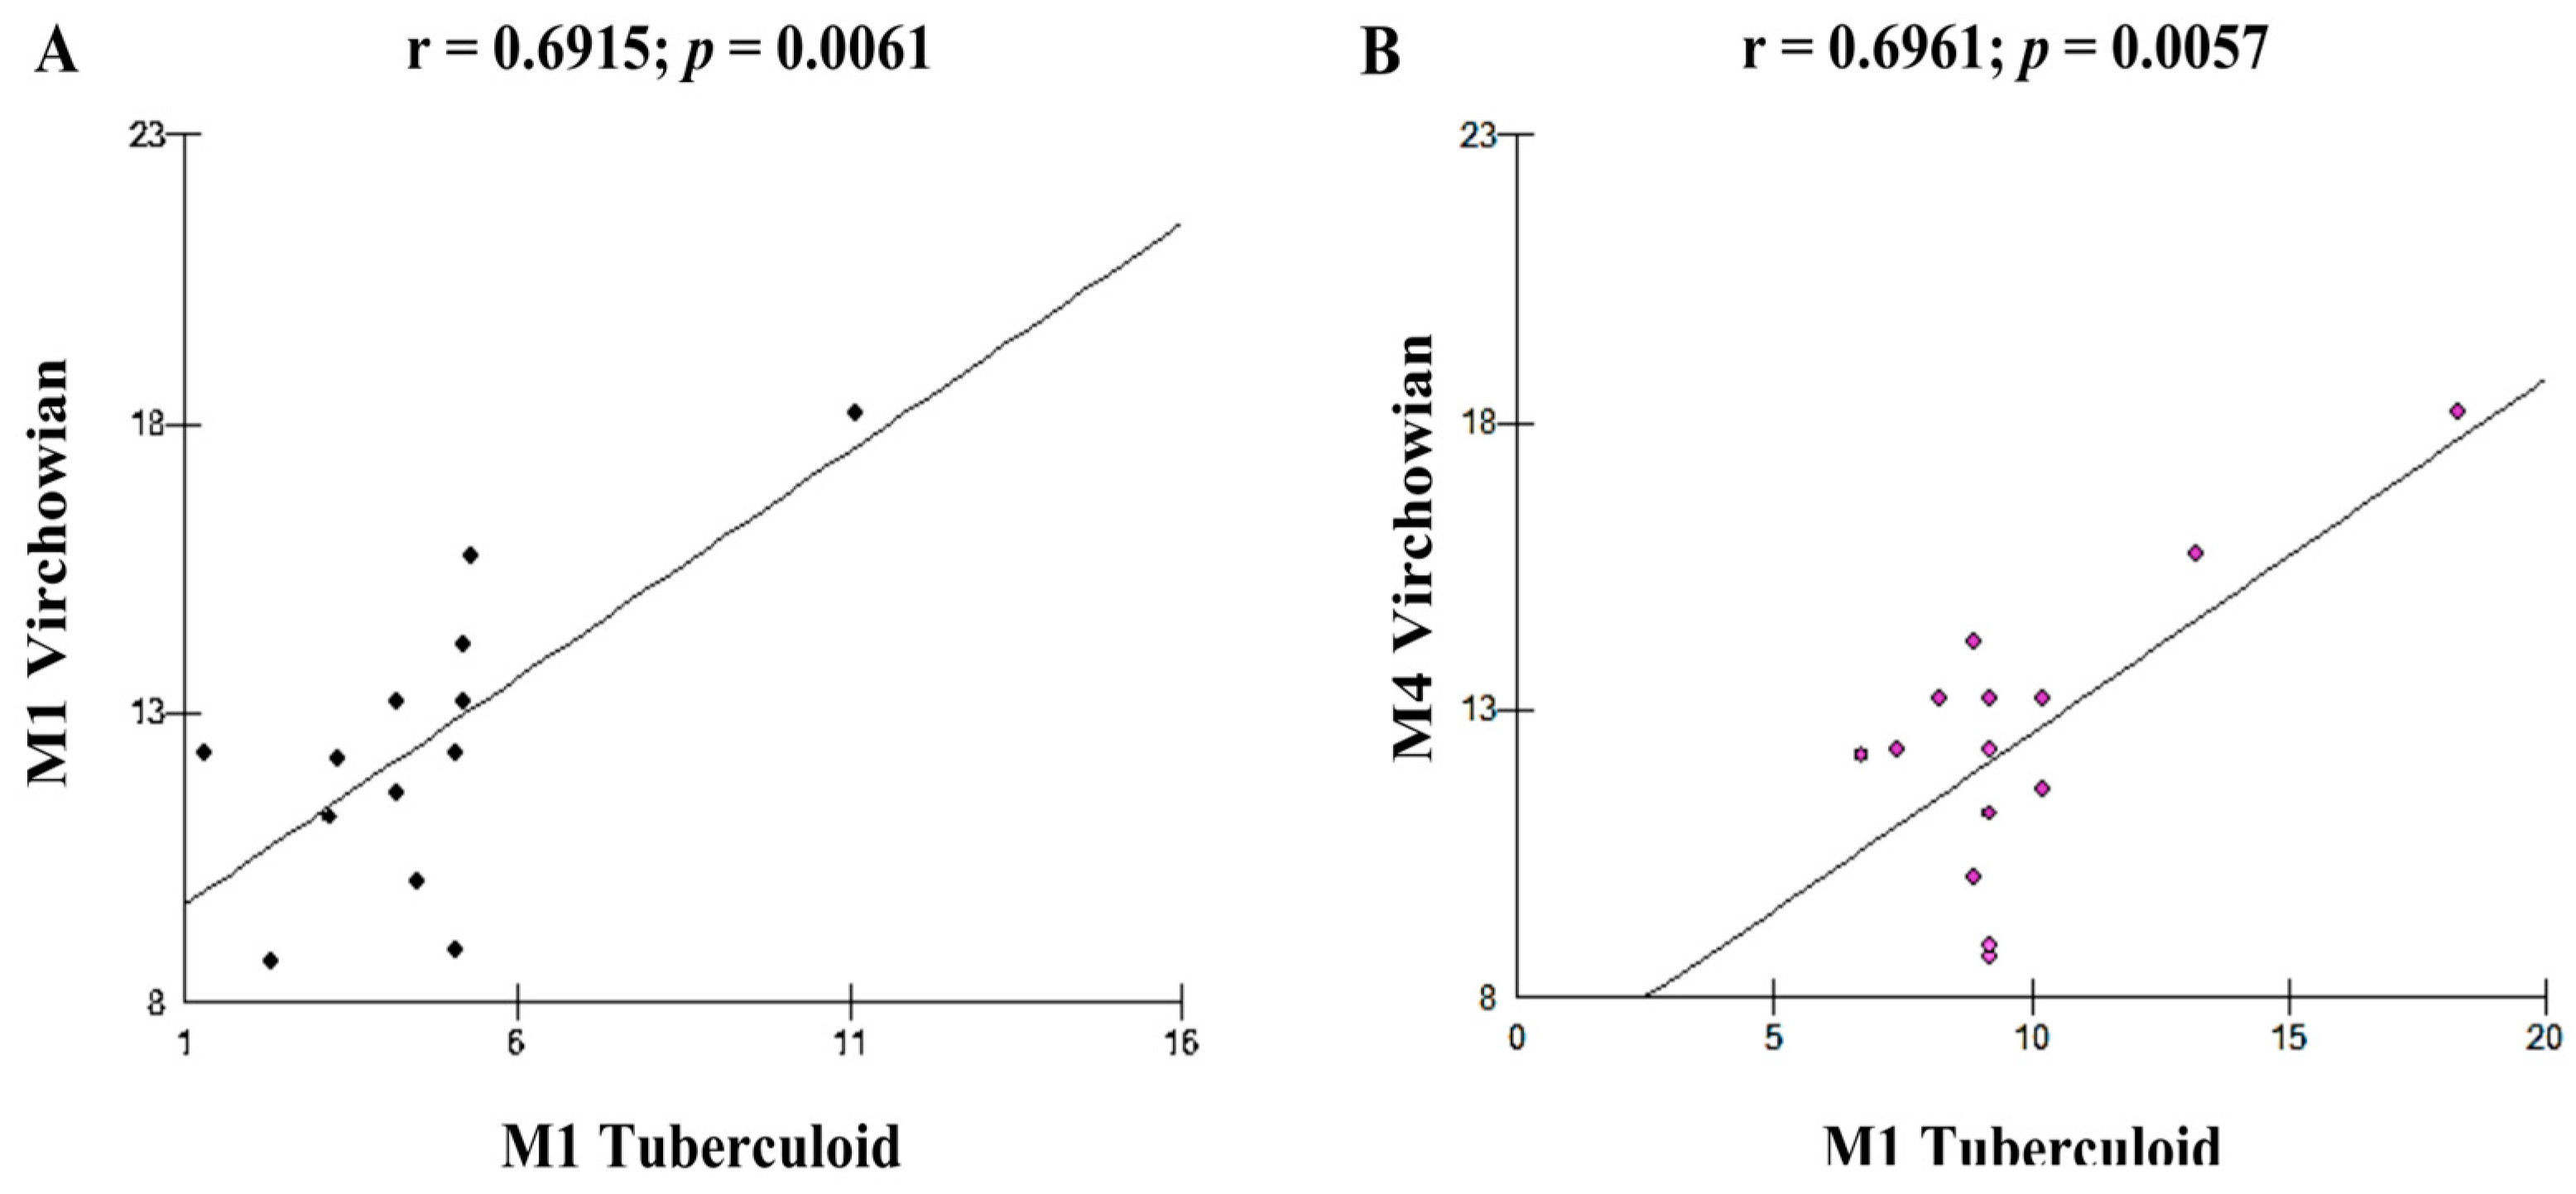
| M1V–M1T | 0.6915 | 0.0061 B |
| M4V–M1T | 0.6961 | 0.0057 B |
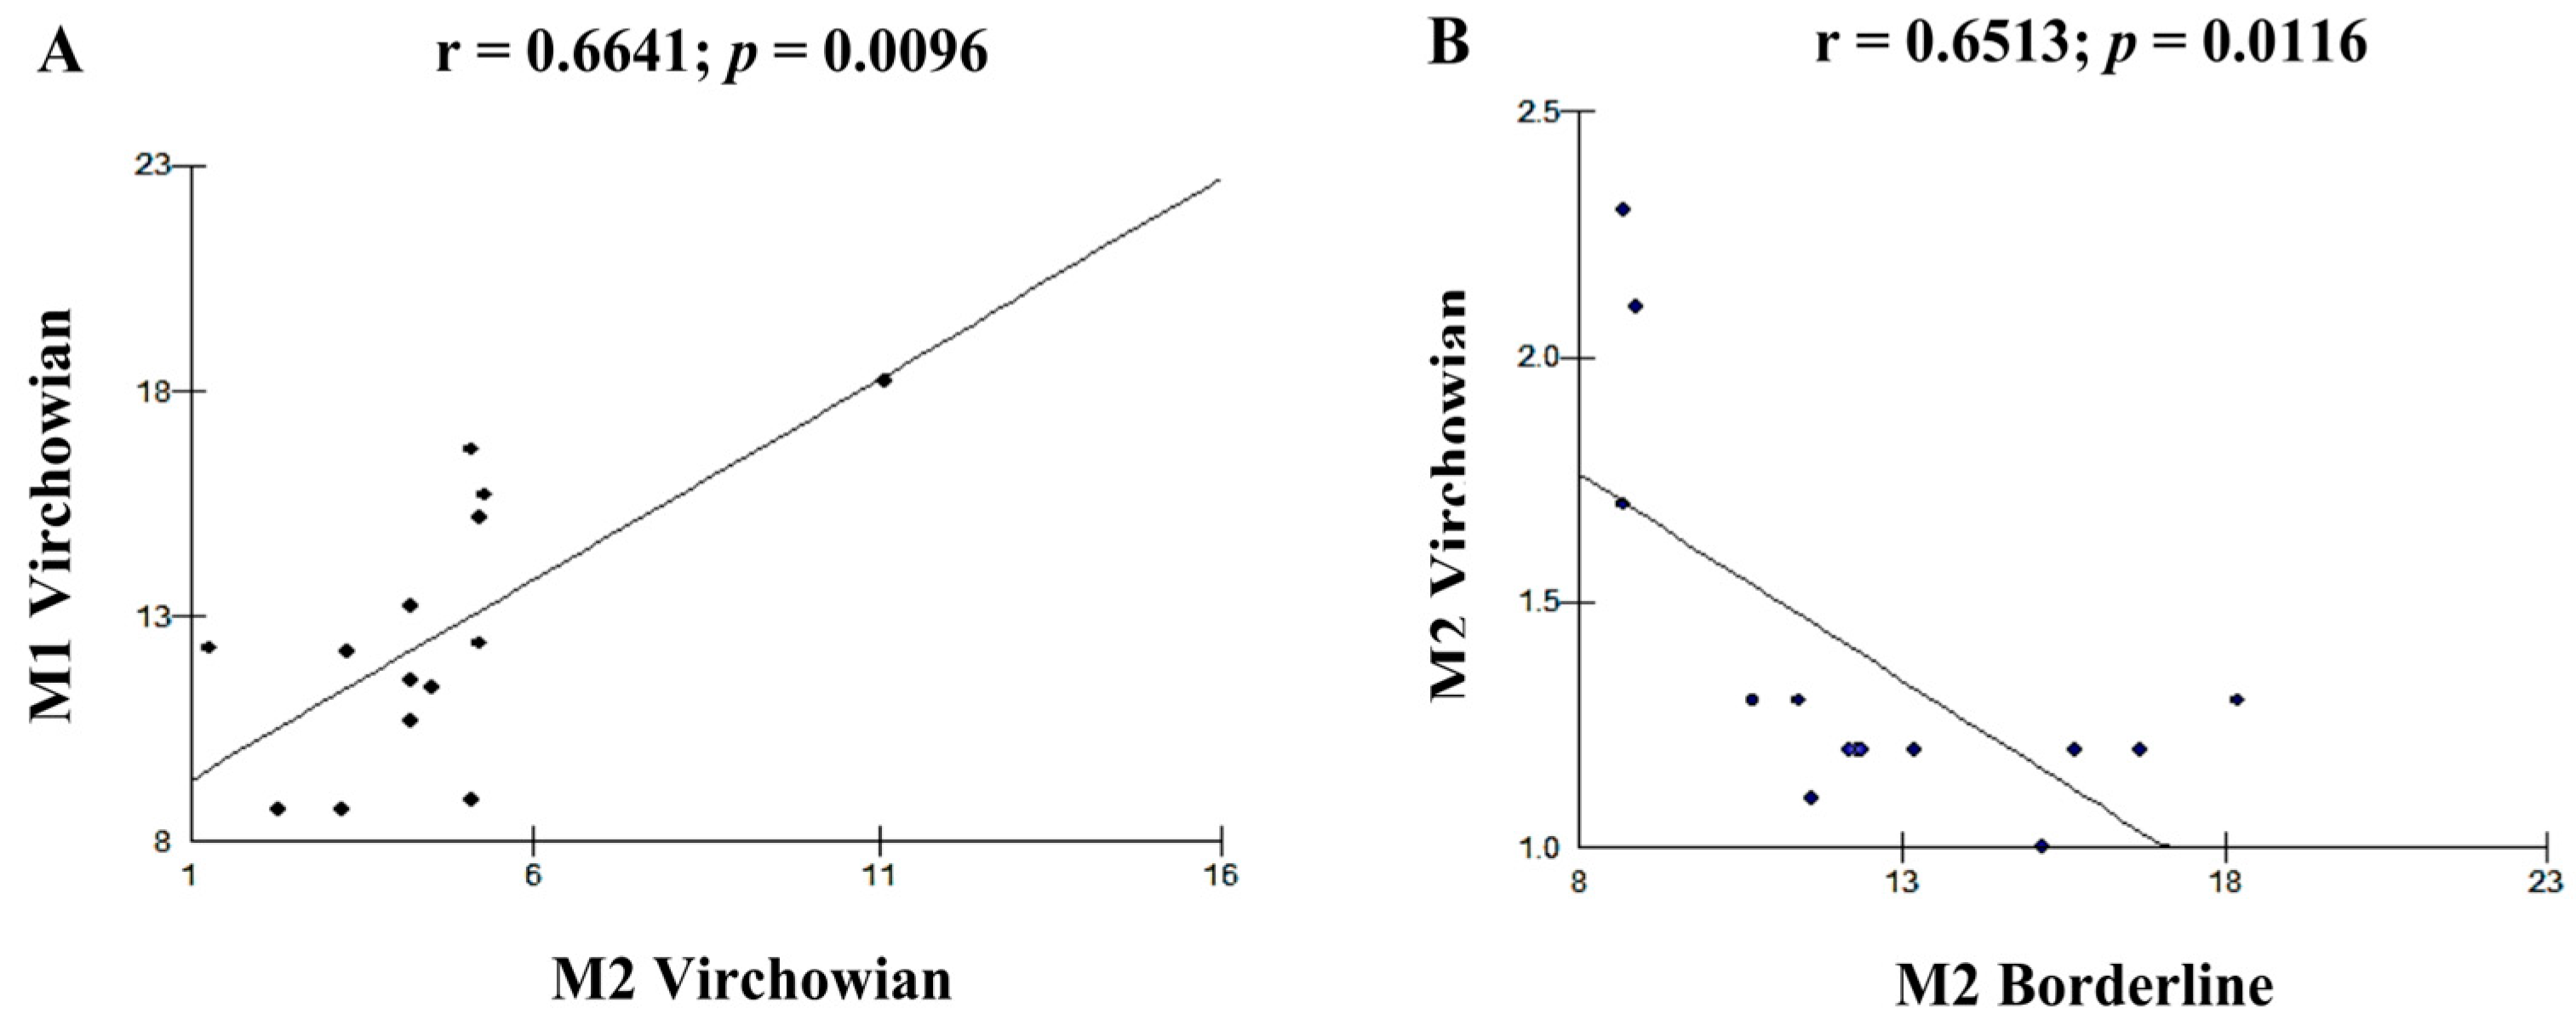
| M1V–M2V | 0.6641 | 0.0096 B |
| M2V–M2I | −0.6513 | 0.0116 B |
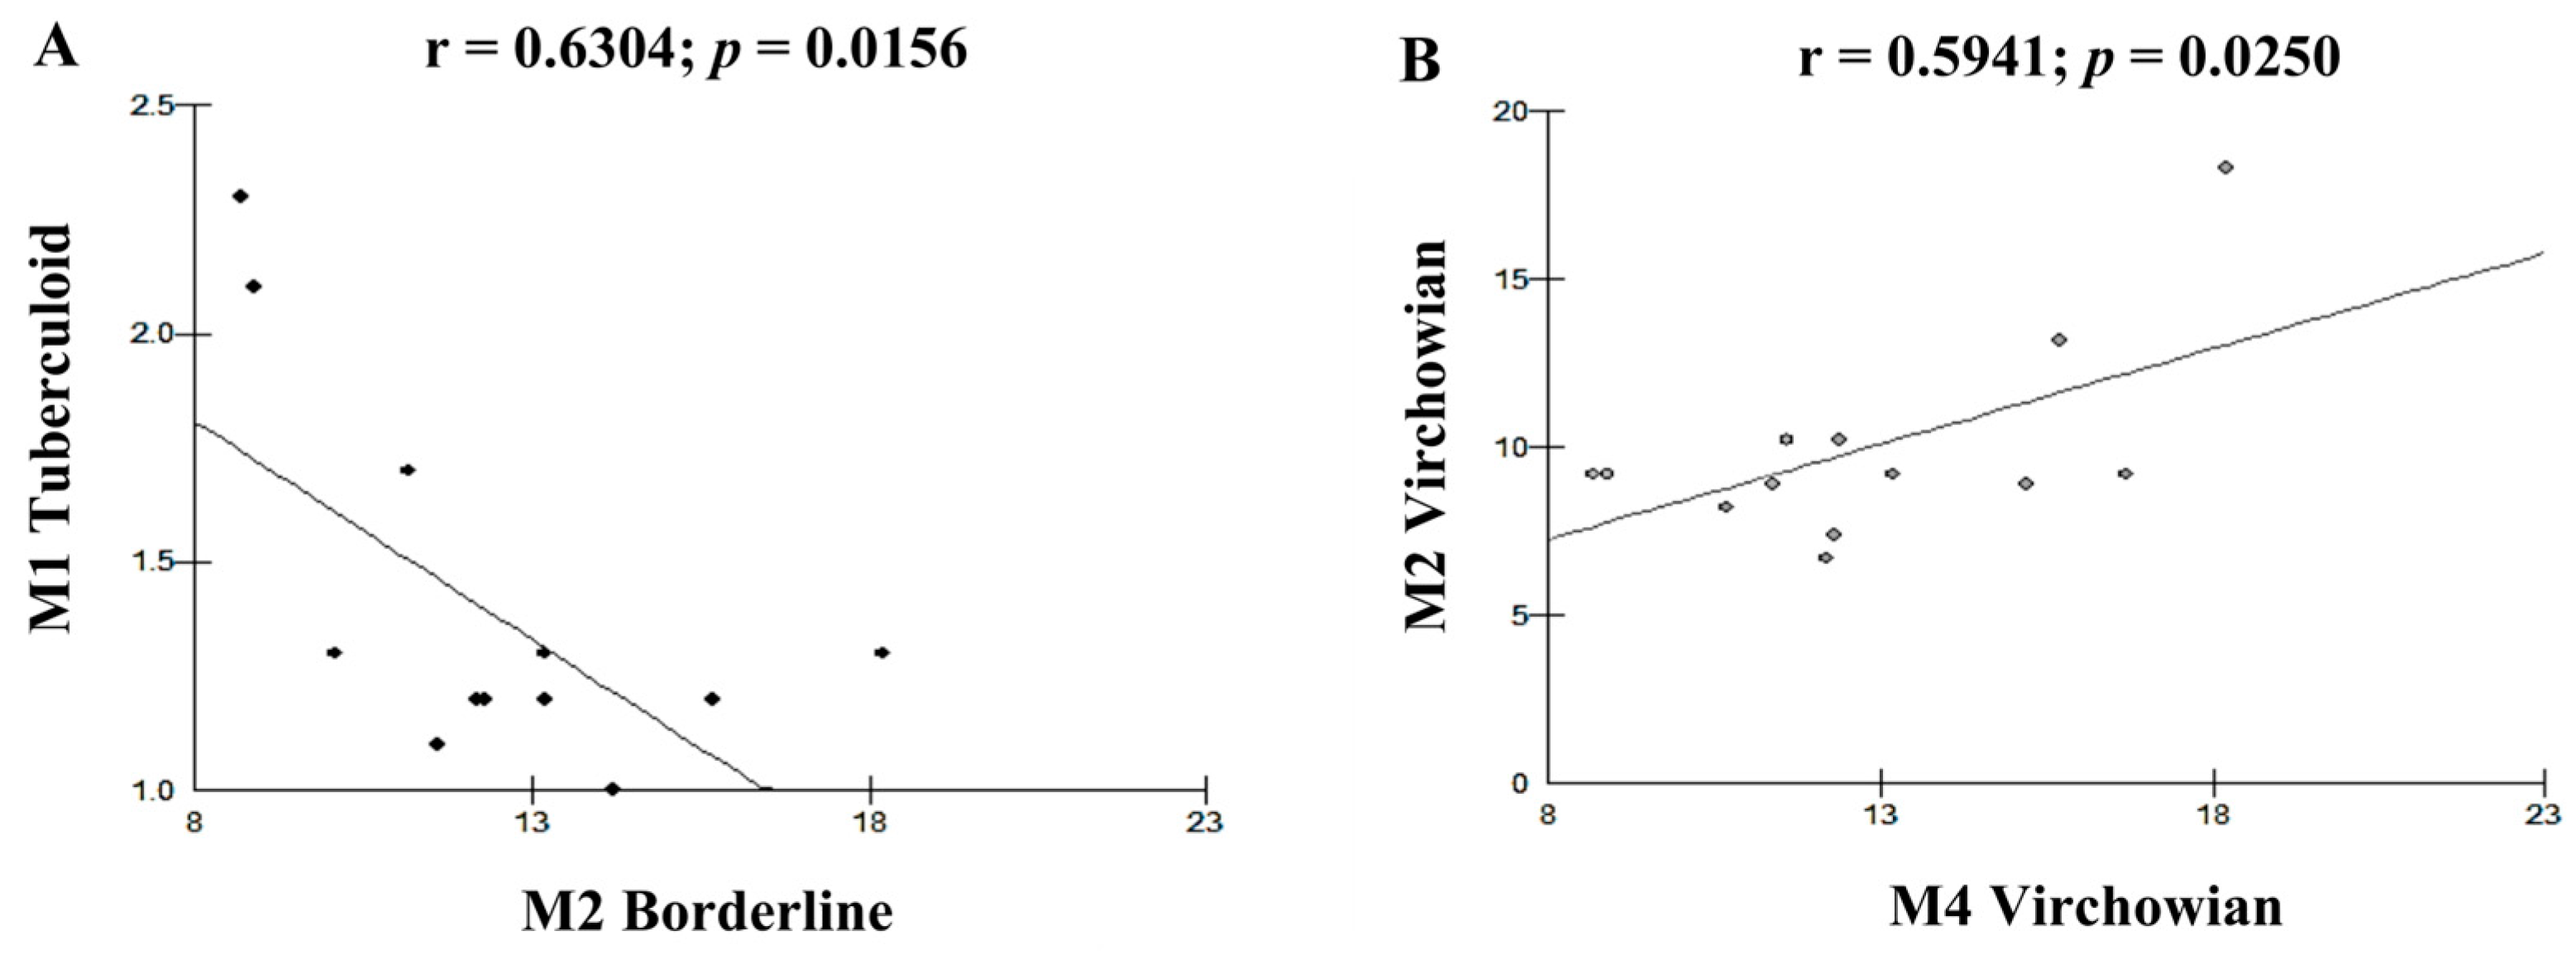
| M1T–M2I | −0.6304 | 0.0156 B |
| M2V–M4V | 0.5941 | 0.0250 B |
| M2T–M2I | −0.4505 | 0.1059 |
| M4T–M2I | −0.4471 | 0.1089 |
| M2I–M4I | 0.4299 | 0.1249 |
| M1T–M4T | 0.4111 | 0.1442 |
| M2V–M4T | 0.4014 | 0.1548 |
| M2V–M2T | 0.3398 | 0.2345 |
| M2V–M4I | −0.3367 | 0.2391 |
| M1T–M2T | 0.3249 | 0.2570 |
| M1V–M1I | 0.313 | 0.2758 |
| M2T–M4T | 0.2956 | 0.3048 |
| M1T–M4I | −0.2866 | 0.3204 |
| M1I–M4I | 0.2695 | 0.3514 |
| M1V–M2T | 0.2679 | 0.3544 |
| M2T–M1I | 0.2383 | 0.4120 |
| M2T–M4I | −0.2104 | 0.4703 |
| M4T–M4I | −0.2095 | 0.4723 |
| M1V–M2I | −0.2011 | 0.4906 |
| M1V–M4T | 0.188 | 0.5198 |
| M4V–M2T | 0.187 | 0.5221 |
| M4V–M1I | 0.1835 | 0.5301 |
| M4V–M4I | −0.1249 | 0.6704 |
| M2V–M1I | −0.1006 | 0.7322 |
| M4V–M4T | 0.0949 | 0.7470 |
| M1I–M2I | 0.0939 | 0.7495 |
| M4V–M2I | −0.0637 | 0.8286 |
| M1V–M4I | 0.046 | 0.8758 |
| M4T–M1I | −0.034 | 0.9081 |
| M1T–M1I | −0.0193 | 0.9477 |
Disclaimer/Publisher’s Note: The statements, opinions and data contained in all publications are solely those of the individual author(s) and contributor(s) and not of MDPI and/or the editor(s). MDPI and/or the editor(s) disclaim responsibility for any injury to people or property resulting from any ideas, methods, instructions or products referred to in the content. |
© 2023 by the authors. Licensee MDPI, Basel, Switzerland. This article is an open access article distributed under the terms and conditions of the Creative Commons Attribution (CC BY) license (https://creativecommons.org/licenses/by/4.0/).
Share and Cite
Quaresma, T.C.; de Aguiar Valentim, L.; de Sousa, J.R.; de Souza Aarão, T.L.; Fuzii, H.T.; Duarte, M.I.S.; de Souza, J.; Quaresma, J.A.S. Immunohistochemical Characterization of M1, M2, and M4 Macrophages in Leprosy Skin Lesions. Pathogens 2023, 12, 1225. https://doi.org/10.3390/pathogens12101225
Quaresma TC, de Aguiar Valentim L, de Sousa JR, de Souza Aarão TL, Fuzii HT, Duarte MIS, de Souza J, Quaresma JAS. Immunohistochemical Characterization of M1, M2, and M4 Macrophages in Leprosy Skin Lesions. Pathogens. 2023; 12(10):1225. https://doi.org/10.3390/pathogens12101225
Chicago/Turabian StyleQuaresma, Tatiane Costa, Lívia de Aguiar Valentim, Jorge Rodrigues de Sousa, Tinara Leila de Souza Aarão, Hellen Thais Fuzii, Maria Irma Seixas Duarte, Juarez de Souza, and Juarez Antônio Simões Quaresma. 2023. "Immunohistochemical Characterization of M1, M2, and M4 Macrophages in Leprosy Skin Lesions" Pathogens 12, no. 10: 1225. https://doi.org/10.3390/pathogens12101225
APA StyleQuaresma, T. C., de Aguiar Valentim, L., de Sousa, J. R., de Souza Aarão, T. L., Fuzii, H. T., Duarte, M. I. S., de Souza, J., & Quaresma, J. A. S. (2023). Immunohistochemical Characterization of M1, M2, and M4 Macrophages in Leprosy Skin Lesions. Pathogens, 12(10), 1225. https://doi.org/10.3390/pathogens12101225