
Quantification of DNA of Fusarium culmorum and Trichothecene Genotypes 3ADON and NIV in the Grain of Winter Wheat

 , , and
Abstract
1. Introduction
2. Materials and Methods
2.1. FHB Inoculation Experiment and Mycotoxin Analysis
- Winter wheat cultivars: Artist, Patras, and RGT Kilimanjaro.
- Breeding lines of wheat susceptible to FHB: KBP 14 16, NAD 10079, and SMH 8816
- Breeding lines/cultivars of wheat resistant to FHB: Fregata, NAD 13014, and NAD 13017
- Lines of wheat resistant to FHB that carry the Fhb1 resistance gene: UNG 136.6.1.1 and S32.
2.2. DNA Quantification
2.2.1. DNA Extraction
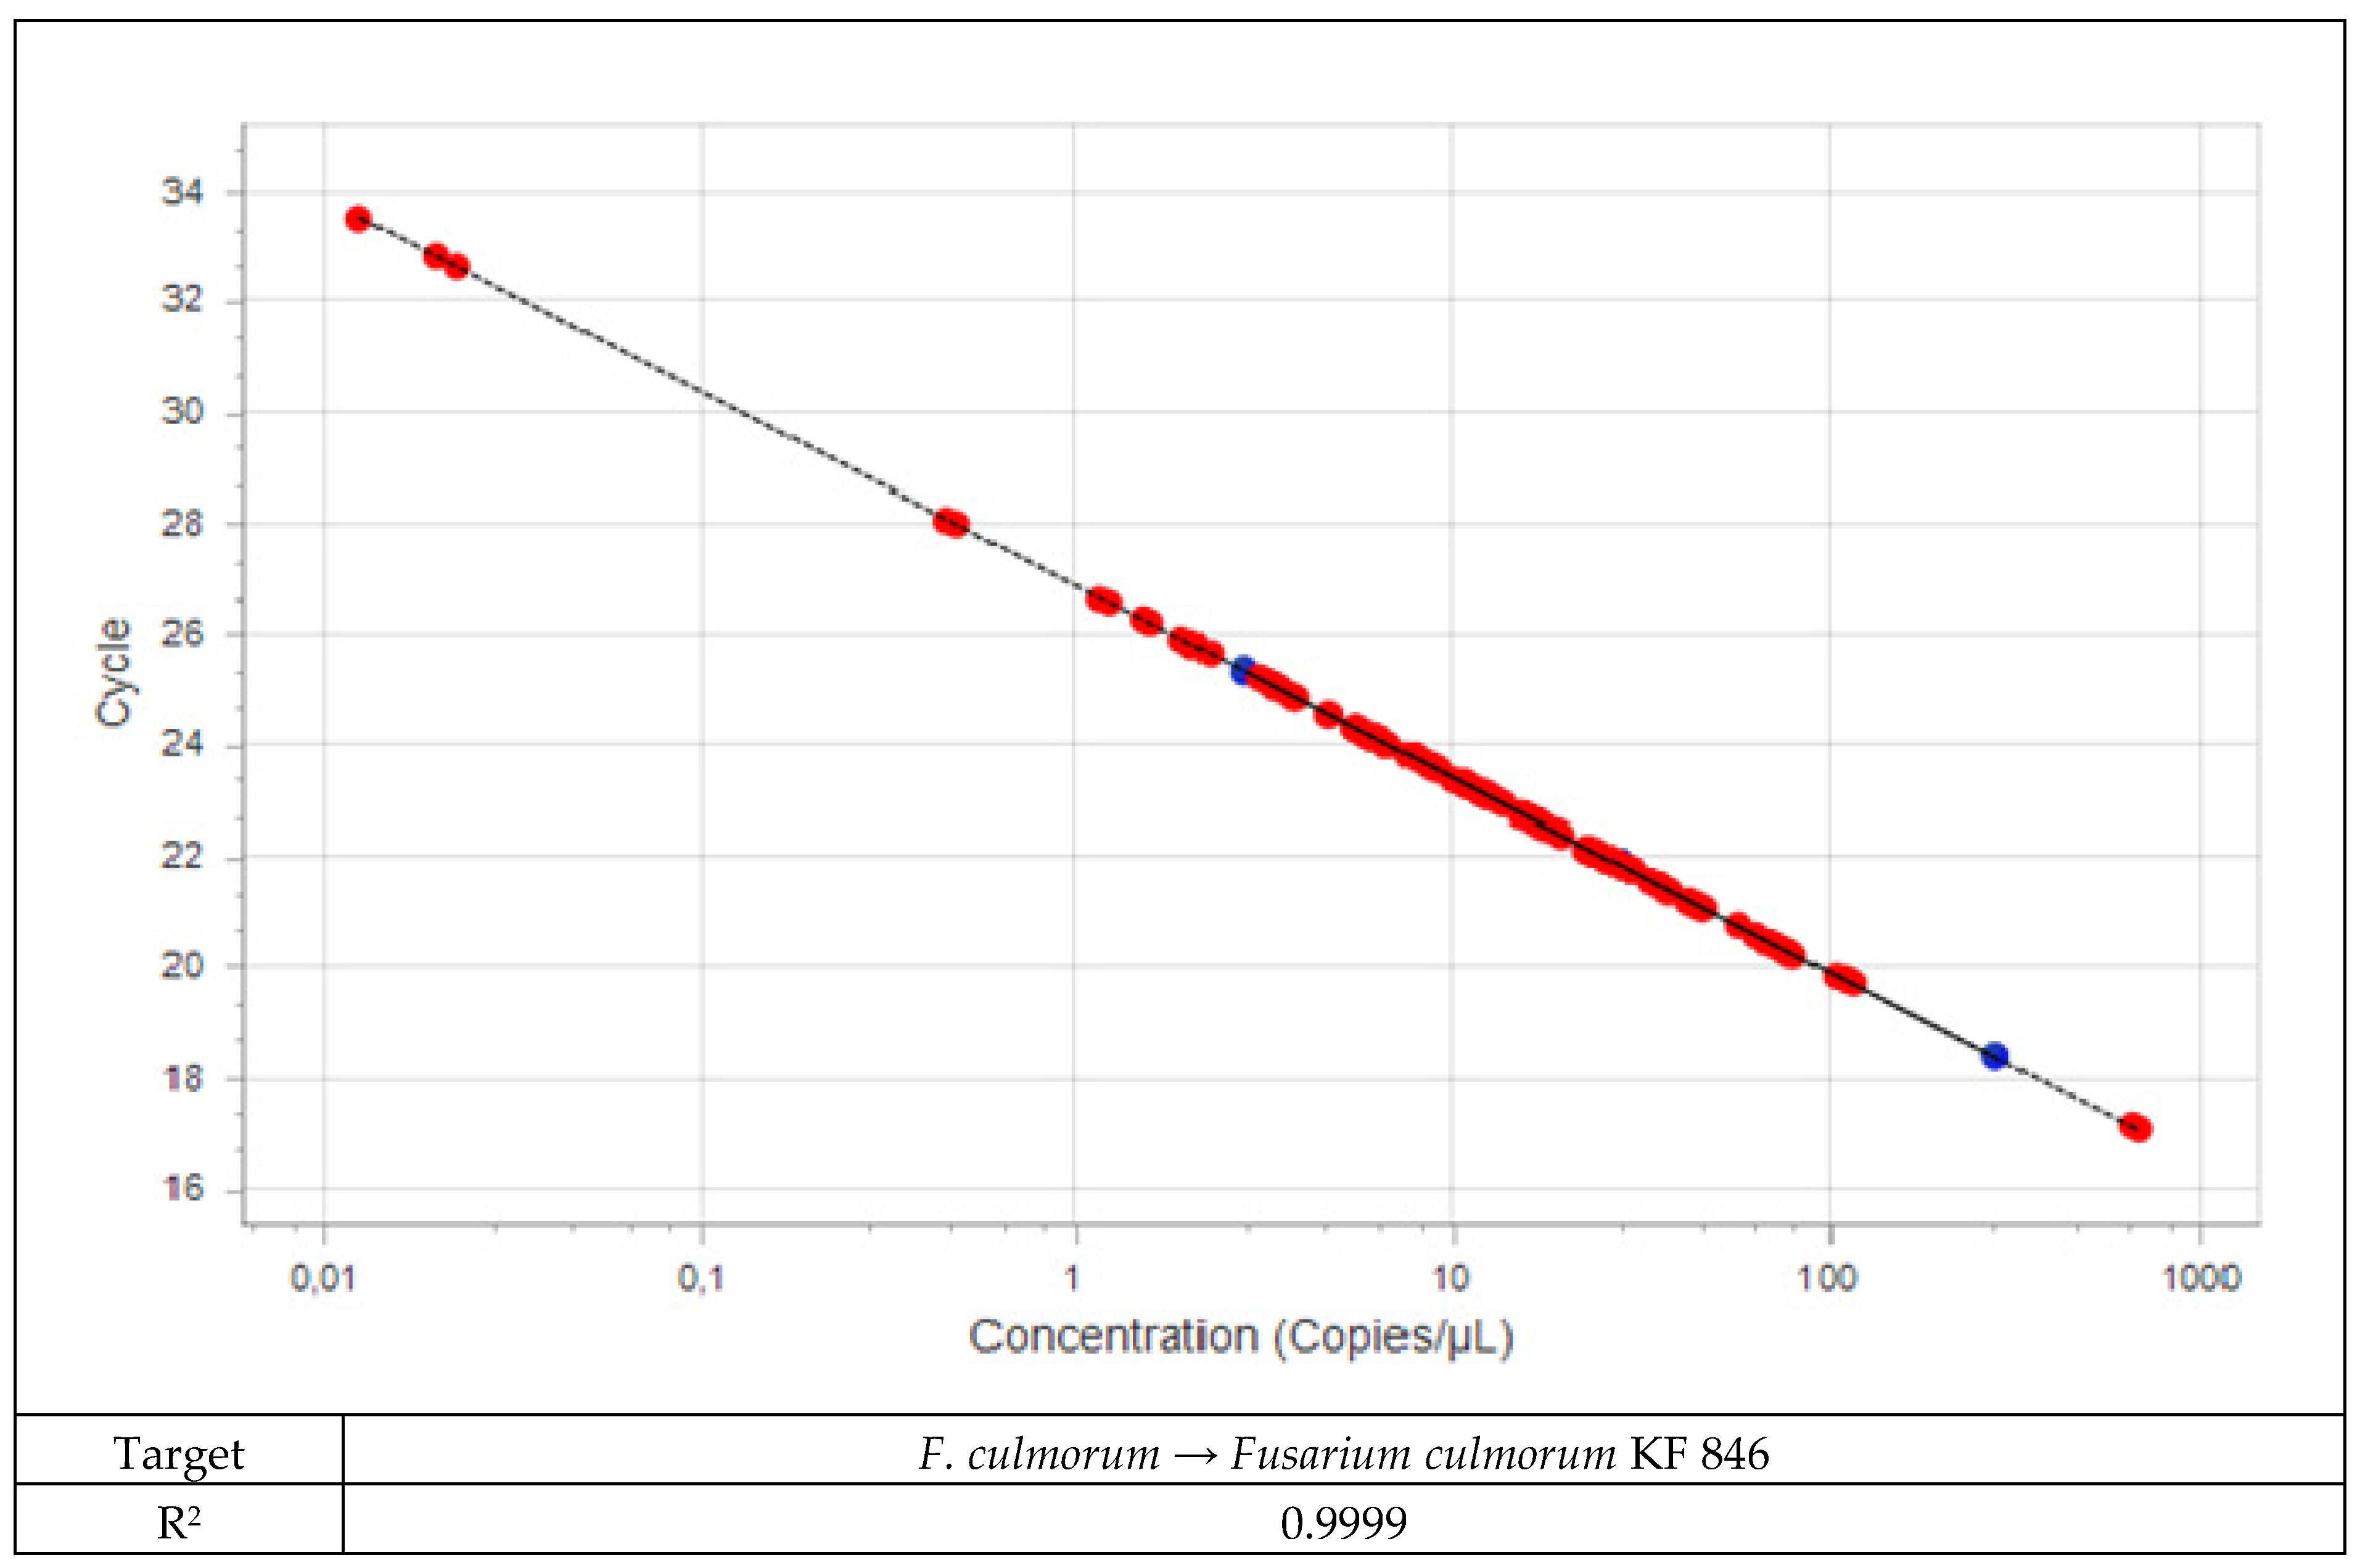
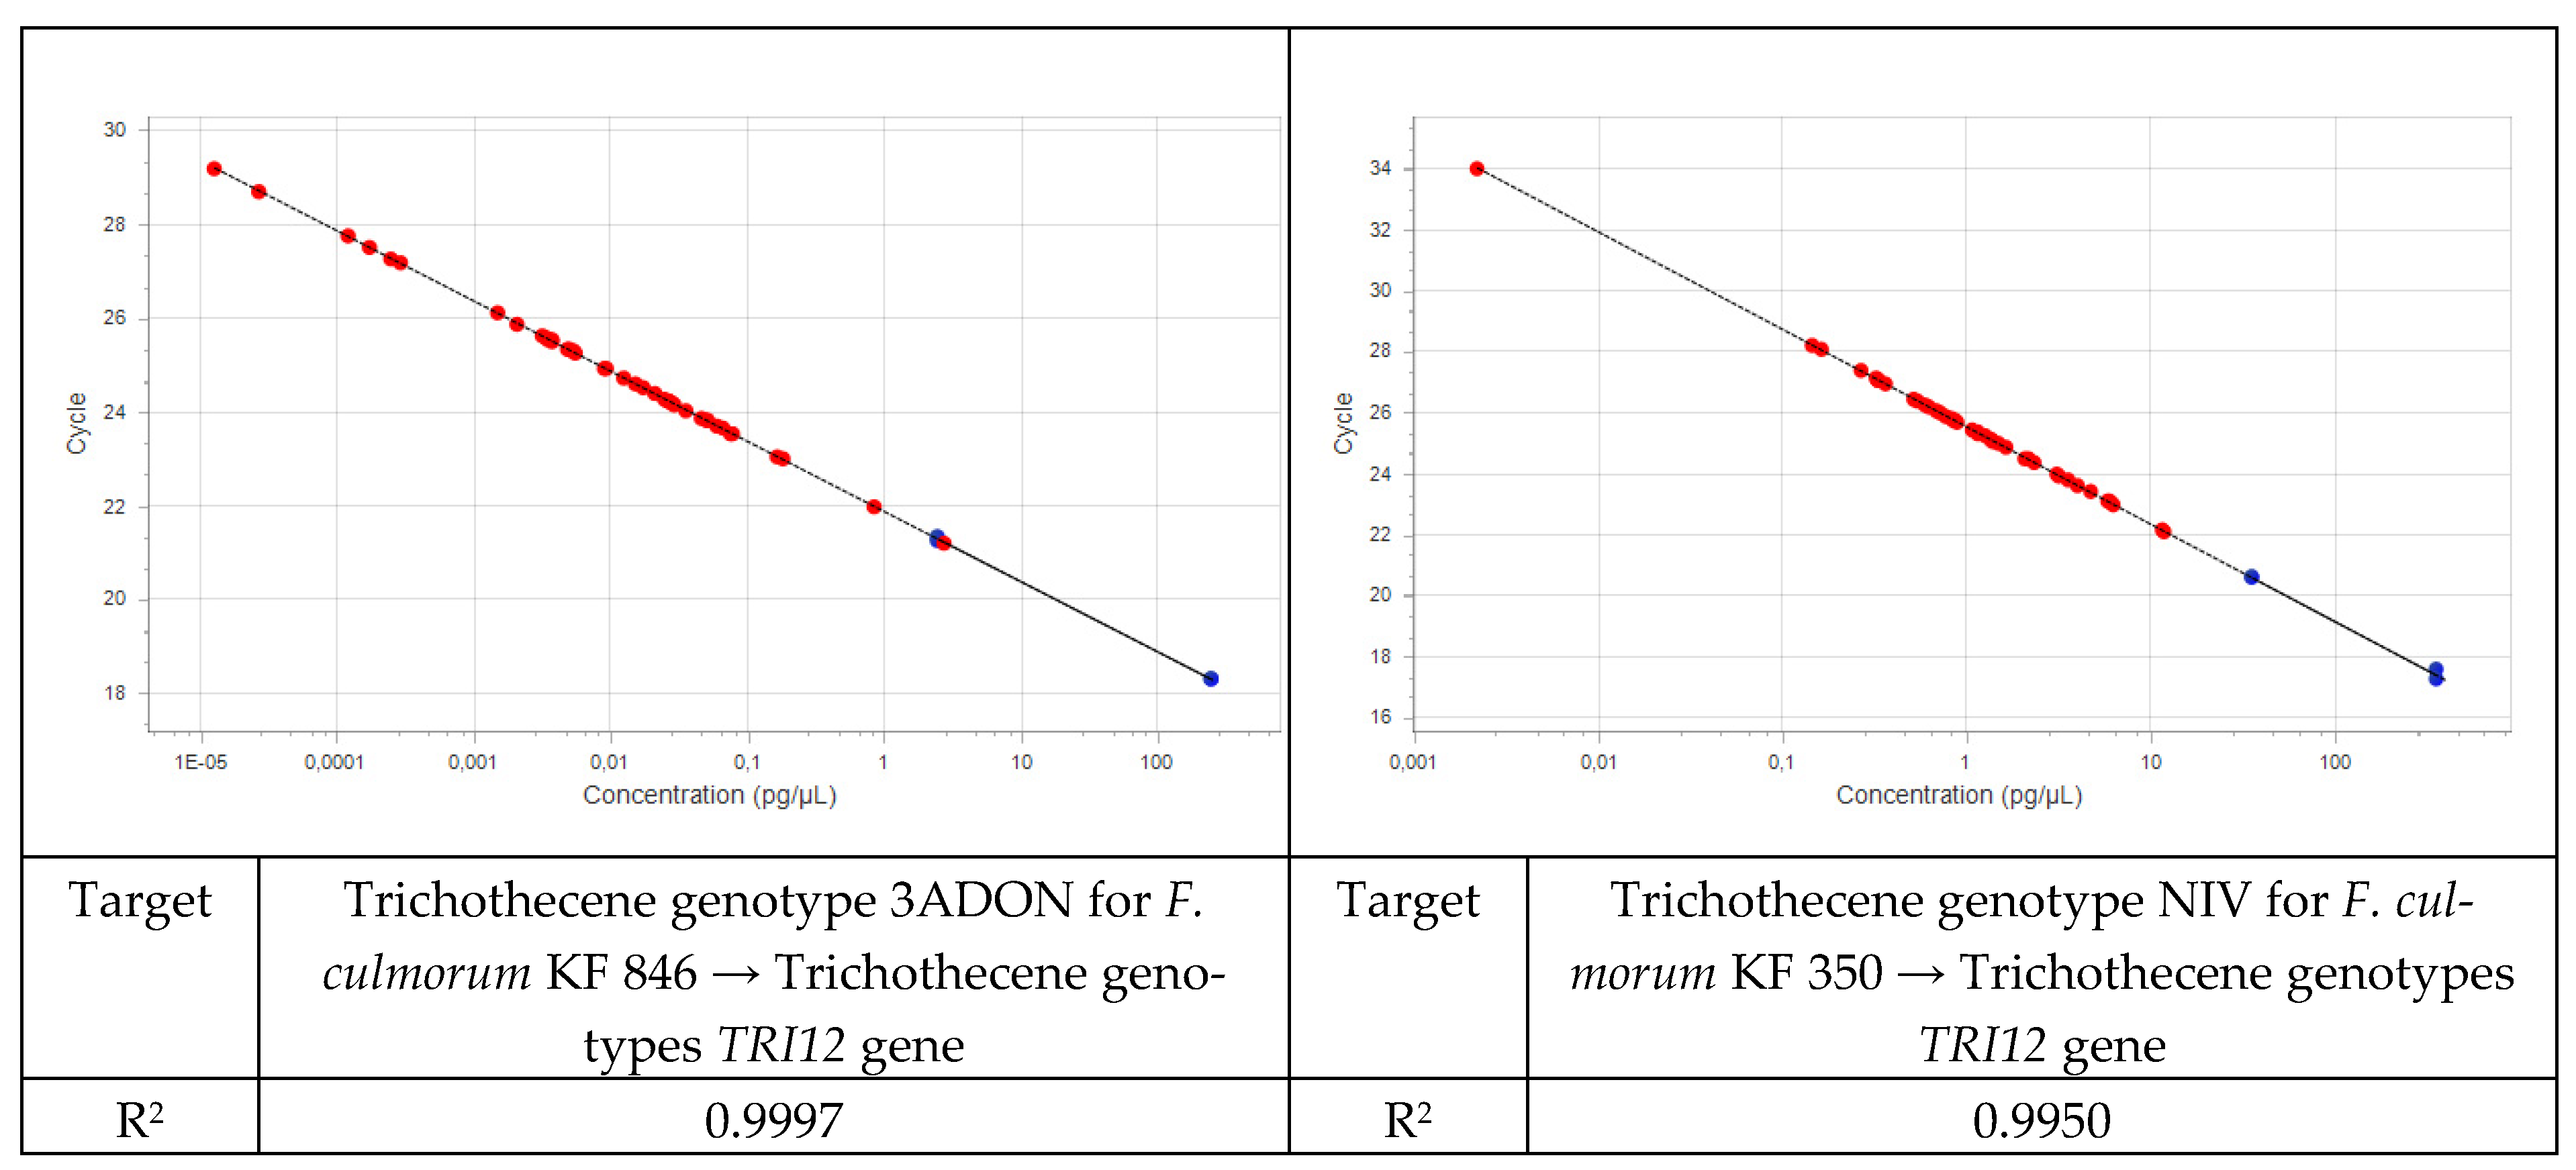
2.2.2. Real-Time PCR
2.2.3. Quantification of Fusarium DNA in Plant Material
2.3. Statistical Analysis
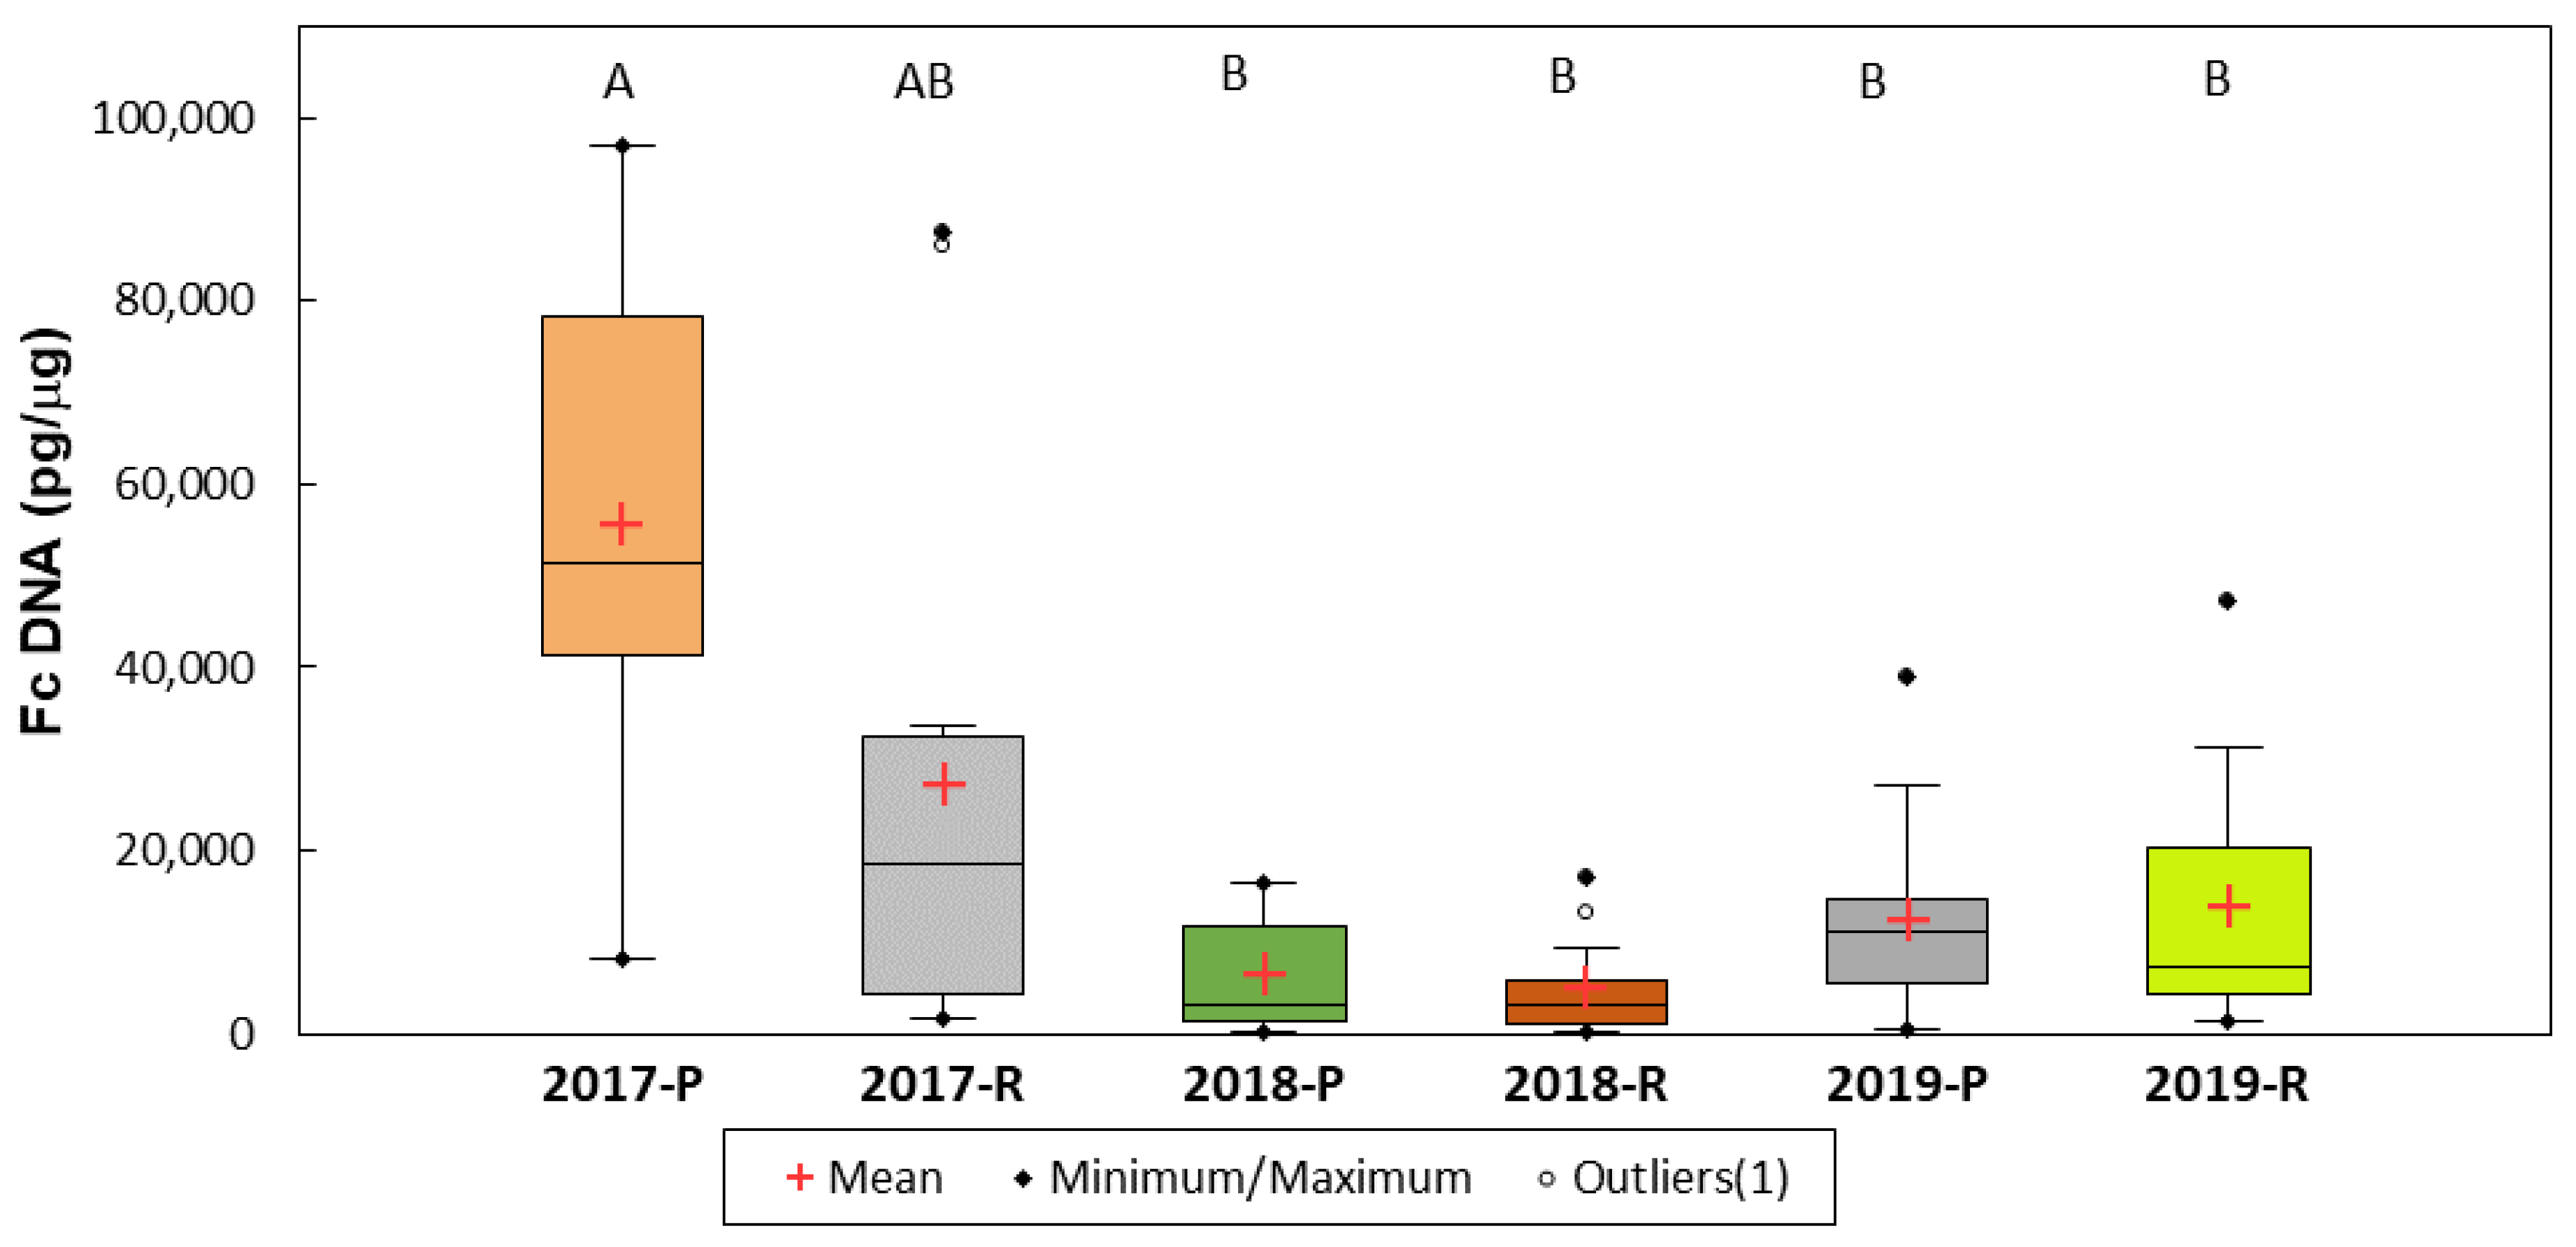
3. Results
4. Discussion
5. Conclusions
Supplementary Materials
Author Contributions
Funding
Data Availability Statement
Acknowledgments
Conflicts of Interest
References
- Snijders, C.H.A. Resistance in wheat to Fusarium infection and trichothecene formation. Toxicol. Lett. 2004, 153, 37–46. [Google Scholar] [CrossRef] [PubMed]
- Bottalico, A.; Perrone, G. Toxigenic Fusarium species and mycotoxins associated with head blight in small-grain cereals in Europe. Eur. J. Plant Pathol. 2002, 108, 611–624. [Google Scholar] [CrossRef]
- Nielsen, L.K.; Jensen, J.D.; Nielsen, G.C.; Jensen, J.E.; Spliid, N.H.; Thomsen, I.K.; Justesen, A.F.; Collinge, D.B.; Jørgensen, L.N. Fusarium head blight of cereals in Denmark: Species complex and related mycotoxins. Phytopathology 2011, 101, 960–969. [Google Scholar] [CrossRef] [PubMed]
- Uhlig, S.; Jestoi, M.; Parikka, P. Fusarium avenaceum—The North European situation. Int. J. Food Microbiol. 2007, 119, 17–24. [Google Scholar] [CrossRef] [PubMed]
- Yli-Mattila, T.; Paaavanen-Huhtala, P.; Parikka, P.; Hietaniemi, V.; Jestoi, M.; Rizzo, A. Real-time PCR detection and quantification of Fusarium poae as compared to mycotoxin production in grains in Finland. In Proceedings of the 2nd International Symposium on Fusarium Head Blight Incorporating the 8th European Fusarium Seminar, Orlando, FL, USA, 11–15 December 2004; Canty, S.M., Boring, T., Wardwell, J., Ward, R.W., Eds.; Michigan State University: East Lansing, MI, USA, 2004; pp. 422–425. [Google Scholar]
- Yli-Mattila, T.; Paavanen-Huhtala, S.; Jestoi, M.; Parikka, P.; Hietaniemi, V.; Gagkaeva, T.; Sarlin, T.; Haikara, A.; Laaksonen, S.; Rizzo, A. Real-time PCR detection and quantification of Fusarium poae, F. graminearum, F. sporotrichioides and F. langsethiae in cereal grains in Finland and Russia. Arch. Phytopathol. Plant Prot. 2008, 41, 243–260. [Google Scholar] [CrossRef]
- Amarasinghe, C.; Sharanowski, B.; Dilantha Fernando, W.G. Molecular phylogenetic relationships, trichothecene chemotype diversity and aggressiveness of strains in a global collection of Fusarium graminearum species. Toxins 2019, 11, 263. [Google Scholar] [CrossRef]
- O’Donnell, K.; Kistler, H.C.; Tacke, B.K.; Casper, H.H. Gene genealogies reveal global phylogeographic structure and reproductive isolation among lineages of Fusarium graminearum, the fungus causing wheat scab. Proc. Natl. Acad. Sci. USA 2000, 97, 7905–7910. [Google Scholar] [CrossRef]
- O’Donnell, K.; Ward, T.J.; Geiser, D.M.; Kistler, H.C.; Aoki, T. Genealogical concordance between the mating type locus and seven other nuclear genes supports formal recognition of nine phylogenetically distinct species within the Fusarium graminearum clade. Fungal Genet. Biol. 2004, 41, 600–623. [Google Scholar] [CrossRef]
- Starkey, D.E.; Ward, T.J.; Aoki, T.; Gale, L.R.; Kistler, H.C.; Geiser, D.M.; Suga, H.; Tóth, B.; Varga, J.; O’Donnell, K. Global molecular surveillance reveals novel Fusarium head blight species and trichothecene toxin diversity. Fungal Genet. Biol. 2007, 44, 1191–1204. [Google Scholar] [CrossRef]
- Talas, F.; Parzies, H.K.; Miedaner, T. Diversity in genetic structure and chemotype composition of Fusarium graminearum sensu stricto populations causing wheat head blight in individual fields in Germany. Eur. J. Plant Pathol. 2011, 131, 39–48. [Google Scholar] [CrossRef]
- O’Donnell, K.; Rooney, A.P.; Proctor, R.H.; Brown, D.W.; McCormick, S.P.; Ward, T.J.; Frandsen, R.J.N.; Lysøe, E.; Rehner, S.A.; Aoki, T.; et al. Phylogenetic analyses of RPB1 and RPB2 support a middle Cretaceous origin for a clade comprising all agriculturally and medically important fusaria. Fungal Genet. Biol. 2013, 52, 20–31. [Google Scholar] [CrossRef]
- Perincherry, L.; Lalak-Kańczugowska, J.; Stępień, Ł. Fusarium-produced mycotoxins in plant-pathogen interactions. Toxins 2019, 11, 664. [Google Scholar] [CrossRef]
- Munkvold, G.P. Mycotoxigenic Fungi. In Mycotoxigenic Fungi: Methods and Protocols, Methods in Molecular Biology; Moretti, A., Susca, A., Eds.; Humana Press: New York, NY, USA, 2017; Volume 1542, pp. 51–105. ISBN 9781493967056. [Google Scholar]
- Miller, J.D.; Greenhalgh, R.; Wang, Y.; Lu, M. Trichothecene chemotypes of three Fusarium species. Mycologia 1991, 82, 121–130. [Google Scholar] [CrossRef]
- Quarta, A.; Mita, G.; Haidukowski, M.; Santino, A.; Mulè, G.; Visconti, A. Assessment of trichothecene chemotypes of Fusarium culmorum occurring in Europe. Food Addit. Contam. 2005, 22, 309–315. [Google Scholar] [CrossRef]
- Tóth, B.; Mesterházy, Á.; Nicholson, P.; Téren, J.; Varga, J. Mycotoxin production and molecular variability of European and American isolates of Fusarium culmorum. Eur. J. Plant Pathol. 2004, 110, 587–599. [Google Scholar] [CrossRef]
- Jennings, P.; Coates, M.E.; Turner, J.A.; Chandler, E.A.; Nicholson, P. Determination of deoxynivalenol and nivalenol chemotypes of Fusarium culmorum isolates from England and Wales by PCR assay. Plant Pathol. 2004, 53, 182–190. [Google Scholar] [CrossRef]
- Kammoun, L.G.; Gargouri, S.; Barreau, C.; Richard-Forget, F.; Hajlaoui, M.R. Trichothecene chemotypes of Fusarium culmorum infecting wheat in Tunisia. Int. J. Food Microbiol. 2010, 140, 84–89. [Google Scholar] [CrossRef]
- Liu, Y.Y.; Sun, H.Y.; Li, W.; Xia, Y.L.; Deng, Y.Y.; Zhang, A.X.; Chen, H.G. Fitness of three chemotypes of Fusarium graminearum species complex in major winter wheat-producing areas of China. PLoS ONE 2017, 12, e0174040. [Google Scholar] [CrossRef]
- Goswami, R.S.; Kistler, H.C. Pathogenicity and in planta mycotoxin accumulation among members of the Fusarium graminearum species complex on wheat and rice. Phytopathology 2005, 95, 1397–1404. [Google Scholar] [CrossRef]
- Kumar, A.; Karre, S.; Dhokane, D.; Kage, U.; Hukkeri, S.; Kushalappa, A.C. Real-time quantitative PCR based method for the quantification of fungal biomass to discriminate quantitative resistance in barley and wheat genotypes to fusarium head blight. J. Cereal Sci. 2015, 64, 16–22. [Google Scholar] [CrossRef]
- Muthomi, J.; Schütze, A.; Dehne, H.-W.; Mutitu, E.W.; Oerke, E.-C. Characterization of Fusarium culmorum isolates by mycotoxin production and aggressiveness to winter wheat. J. Plant Dis. Prot. 2000, 107, 113–123. [Google Scholar]
- Shin, S.; Son, J.H.; Park, J.C.; Kim, K.H.; Yoon, Y.M.; Cheong, Y.K.; Kim, K.H.; Hyun, J.N.; Park, C.S.; Dill-Macky, R.; et al. Comparative pathogenicity of Fusarium graminearum isolates from wheat kernels in Korea. Plant Pathol. J. 2018, 34, 347. [Google Scholar] [CrossRef] [PubMed]
- Qu, B.; Li, H.P.; Zhang, J.B.; Huang, T.; Carter, J.; Liao, Y.C.; Nicholson, P. Comparison of genetic diversity and pathogenicity of fusarium head blight pathogens from China and Europe by SSCP and seedling assays on wheat. Plant Pathol. 2008, 57, 642–651. [Google Scholar] [CrossRef]
- Maier, F.J.; Miedaner, T.; Hadeler, B.; Felk, A.; Salomon, S.; Lemmens, M.; Kassner, H.; Schäfer, W. Involvement of trichothecenes in fusarioses of wheat, barley and maize evaluated by gene disruption of the trichodiene synthase (Tri5) gene in three field isolates of different chemotype and virulence. Mol. Plant Pathol. 2006, 7, 449–461. [Google Scholar] [CrossRef] [PubMed]
- Mesterházy, Á.; Bartók, T.; Mirocha, C.G.; Komoróczy, R. Nature of wheat resistance to Fusarium head blight and the role of deoxynivalenol for breeding. Plant Breed. 1999, 118, 97–110. [Google Scholar] [CrossRef]
- Carter, J.P.; Rezanoor, H.N.; Holden, D.; Desjardins, A.E.; Plattner, R.D.; Nicholson, P. Variation in pathogenicity associated with the genetic diversity of Fusarium graminearum. Eur. J. Plant Pathol. 2002, 108, 573–583. [Google Scholar] [CrossRef]
- Lemmens, M.; Koutnik, A.; Steiner, B.; Buerstmayr, H.; Berthiller, F.; Schuhmacher, R.; Maier, F.; Schäfer, W. Investigations on the ability of Fhb1 to protect wheat against nivalenol and deoxynivalenol. Cereal Res. Commun. 2008, 36, 429–435. [Google Scholar] [CrossRef]
- Proctor, R.H.; Desjardins, A.E.; McCormick, S.P.; Plattner, R.D.; Alexander, N.J.; Brown, D.W. Genetic analysis of the role of trichothecene and fumonisin mycotoxins in the virulence of Fusarium. Eur. J. Plant Pathol. 2002, 108, 691–698. [Google Scholar] [CrossRef]
- Gunupuru, L.R.; Perochon, A.; Doohan, F.M. Deoxynivalenol resistance as a component of FHB resistance. Trop. Plant Pathol. 2017, 42, 175–183. [Google Scholar] [CrossRef]
- Eudes, F.; Comeau, A.; Collin, S.R. Phytotoxicite de huit mycotoxines associees a la fusariose de l’epi chez le ble. Can. J. Plant Pathol. 2000, 22, 286–292. [Google Scholar] [CrossRef]
- Foroud, N.A.; McCormick, S.P.; MacMillan, T.; Badea, A.; Kendra, D.F.; Ellis, B.E.; Eudes, F. Greenhouse studies reveal increased aggressiveness of emergent canadian Fusarium graminearum chemotypes in wheat. Plant Dis. 2012, 96, 1271–1279. [Google Scholar] [CrossRef]
- Escrivá, L.; Font, G.; Manyes, L. In vivo toxicity studies of fusarium mycotoxins in the last decade: A review. Food Chem. Toxicol. 2015, 78, 185–206. [Google Scholar] [CrossRef]
- Alassane-Kpembi, I.; Puel, O.; Pinton, P.; Cossalter, A.M.; Chou, T.C.; Oswald, I.P. Co-exposure to low doses of the food contaminants deoxynivalenol and nivalenol has a synergistic inflammatory effect on intestinal explants. Arch. Toxicol. 2017, 91, 2677–2687. [Google Scholar] [CrossRef]
- Foroud, N.A.; Baines, D.; Gagkaeva, T.Y.; Thakor, N.; Badea, A.; Steiner, B.; Bürstmayr, M.; Bürstmayr, H. Trichothecenes in cereal grains—An update. Toxins 2019, 11, 634. [Google Scholar] [CrossRef]
- Argyris, J.; Van Sanford, D.; TeKrony, D. Fusarium graminearum infection during wheat seed development and its effect on seed quality. Crops Sci. 2003, 43, 1782–1788. [Google Scholar] [CrossRef]
- Perkowski, J.; Buśko, M.; Stuper, K.; Kostecki, M.; Matysiak, A.; Szwajkowska-Michałek, L. Concentration of ergosterol in small-grained naturally contaminated and inoculated cereals. Biologia 2008, 63, 542–547. [Google Scholar] [CrossRef]
- Horevaj, P.; Milus, E.A.; Bluhm, B.H. A real-time qPCR assay to quantify Fusarium graminearum biomass in wheat kernels. J. Appl. Microbiol. 2011, 111, 396–406. [Google Scholar] [CrossRef]
- Nielsen, L.K.; Jensen, J.D.; Rodríguez, A.; Jørgensen, L.N.; Justesen, A.F. TRI12 based quantitative real-time PCR assays reveal the distribution of trichothecene genotypes of F. graminearum and F. culmorum isolates in Danish small grain cereals. Int. J. Food Microbiol. 2012, 157, 384–392. [Google Scholar] [CrossRef]
- Sohlberg, E.; Virkajärvi, V.; Parikka, P.; Rämö, S.; Laitila, A.; Sarlin, T. Taqman qPCR quantification and Fusarium community analysis to evaluate toxigenic fungi in cereals. Toxins 2022, 14, 45. [Google Scholar] [CrossRef]
- Xu, X.; Parry, D.W.; Nicholson, P.; Thomsett, M.A.; Simpson, D.; Edwards, S.G.; Cooke, B.M.; Doohan, F.M.; Van Maanen, A.; Moretti, A.; et al. Is the amount of mycotoxins in cereal grains related to the quantity of Fusarium DNA? Asp. Appl. Biol. 2003, 68, 101–108. [Google Scholar]
- Góral, T.; Wiśniewska, H.; Ochodzki, P.; Nielsen, L.K.; Walentyn-Góral, D.; Stępień, Ł. Relationship between Fusarium head blight, kernel damage, concentration of Fusarium biomass, and Fusarium toxins in grain of winter wheat inoculated with Fusarium culmorum. Toxins 2019, 11, 2. [Google Scholar] [CrossRef]
- Schnerr, H.; Vogel, R.F.; Niessen, L. Correlation between DNA of trichothecene-producing Fusarium species and deoxynivalenol concentrations in wheat-samples. Lett. Appl. Microbiol. 2002, 35, 121–125. [Google Scholar] [CrossRef] [PubMed]
- Ochodzki, P.; Twardawska, A.; Wiśniewska, H.; Góral, T. Resistance to Fusarium head blight, kernel damage, and concentrations of Fusarium mycotoxins in the grain of winter wheat lines. Agronomy 2021, 11, 1690. [Google Scholar] [CrossRef]
- Nicolaisen, M.; Suproniene, S.; Nielsen, L.K.; Lazzaro, I.; Spliid, N.H.; Justesen, A.F. Real-time PCR for quantification of eleven individual Fusarium species in cereals. J. Microbiol. Methods 2009, 76, 234–240. [Google Scholar] [CrossRef] [PubMed]
- Hoheneder, F.; Biehl, E.M.; Hofer, K.; Petermeier, J.; Groth, J.; Herz, M.; Rychlik, M.; Heß, M.; Hückelhoven, R. Host genotype and weather effects on Fusarium head blight severity and mycotoxin load in spring barley. Toxins 2022, 14, 125. [Google Scholar] [CrossRef] [PubMed]
- Xu, X.-M.; Monger, W.; Ritieni, A.; Nicholson, P. Effect of temperature and duration of wetness during initial infection periods on disease development, fungal biomass and mycotoxin concentrations on wheat inoculated with single, or combinations of, Fusarium species. Plant Pathol. 2007, 56, 943–956. [Google Scholar] [CrossRef]
- Birr, T.; Hasler, M.; Verreet, J.-A.; Klink, H. Composition and predominance of Fusarium species causing Fusarium head blight in winter wheat grain depending on cultivar susceptibility and meteorological factors. Microorganisms 2020, 8, 617. [Google Scholar] [CrossRef]
- György, A.; Tóth, B.; Varga, M.; Mesterhazy, A. Methodical considerations and resistance evaluation against Fusarium graminearum and F. culmorum head blight in wheat. Part 3. Susceptibility window and resistance expression. Microorganisms 2020, 8, 627. [Google Scholar] [CrossRef]
- Kimura, M.; Tokai, T.; O’Donnell, K.; Ward, T.J.; Fujimura, M.; Hamamoto, H.; Shibata, T.; Yamaguchi, I. The trichothecene biosynthesis gene cluster of Fusarium graminearum F15 contains a limited number of essential pathway genes and expressed non-essential genes. FEBS Lett. 2003, 539, 105–110. [Google Scholar] [CrossRef]
- Leišová, L.; Kučera, L.; Chrpová, J.; Sýkorová, S.; Šíp, V.; Ovesná, J. Quantification of Fusarium culmorum in wheat and barley tissues using real-time PCR in comparison with DON content. J. Phytopathol. 2006, 154, 603–611. [Google Scholar] [CrossRef]
- Edwards, S.G.; Pirgozliev, S.R.; Hare, M.C.; Jenkinson, P. Quantification of trichothecene-producing Fusarium species in harvested grain by competitive PCR to determine efficacies of fungicides against Fusarium head blight of winter wheat. Appl. Environ. Microbiol. 2001, 67, 1575–1580. [Google Scholar] [CrossRef]
- Sarlin, T.; Yli-Mattila, T.; Jestoi, M.; Rizzo, A.; Paavanen-Huhtala, S.; Haikara, A. Real-time PCR for quantification of toxigenic Fusarium species in barley and malt. Eur. J. Plant Pathol. 2006, 114, 371–380. [Google Scholar] [CrossRef]
- Góral, T.; Łukanowski, A.; Małuszyńska, E.; Stuper-Szablewska, K.; Buśko, M.; Perkowski, J. Performance of winter wheat cultivars grown organically and conventionally with focus on Fusarium head blight and fusarium trichothecene toxins. Microorganisms 2019, 7, 439. [Google Scholar] [CrossRef]
- Góral, T.; Ochodzki, P.; Nielsen, L.K.; Walentyn-Góral, D. Species of the genus Fusarium and Fusarium toxins in the grain of winter and spring wheat in Poland. Biul. Inst. Hod. Aklim. Rośl. 2021, 296, 25–42. [Google Scholar] [CrossRef]
- Demeke, T.; Gräfenhan, T.; Clear, R.M.; Phan, A.; Ratnayaka, I.; Chapados, J.; Patrick, S.K.; Gaba, D.; Lévesque, C.A.; Seifert, K.A. Development of a specific TaqMan® real-time PCR assay for quantification of Fusarium graminearum clade 7 and comparison of fungal biomass determined by PCR with deoxynivalenol content in wheat and barley. Int. J. Food Microbiol. 2010, 141, 45–50. [Google Scholar] [CrossRef]
- Fredlund, E.; Gidlund, A.; Olsen, M.; Börjesson, T.; Spliid, N.H.H.; Simonsson, M. Method evaluation of Fusarium DNA extraction from mycelia and wheat for down-stream real-time PCR quantification and correlation to mycotoxin levels. J. Microbiol. Methods 2008, 73, 33–40. [Google Scholar] [CrossRef]
- Waalwijk, C.; Van Der Heide, R.; De Vries, I.; Van Der Lee, T.; Schoen, C.; Costrel-de Corainville, G.; Häuser-Hahn, I.; Kastelein, P.; Köhl, J.; Lonnet, P.; et al. Quantitative detection of Fusarium species in wheat using TaqMan. Eur. J. Plant Pathol. 2004, 110, 481–494. [Google Scholar] [CrossRef]
- Terzi, V.; Morcia, C.; Faccioli, P.; Faccini, N.; Rossi, V.; Cigolini, M.; Corbellini, M.; Scudellari, D.; Delogu, G. Fusarium DNA traceability along the bread production chain. Int. J. Food Sci. Technol. 2007, 42, 1390–1396. [Google Scholar] [CrossRef]
- Von der Ohe, C.; Miedaner, T. Competitive aggressiveness in binary mixtures of Fusarium graminearum and F. culmorum isolates inoculated on spring wheat with highly effective resistance QTL. J. Phytopathol. 2011, 159, 401–410. [Google Scholar] [CrossRef]
- Miedaner, T.; Schilling, A.G.; Geiger, H.H. Competition effects among isolates of Fusarium culmorum differing in aggressiveness and mycotoxin production on heads of winter rye. Eur. J. Plant Pathol. 2004, 110, 63–70. [Google Scholar] [CrossRef]


| Target | Primer Name | Sequence (5′-3′) |
|---|---|---|
| F. culmorum | Fcul F | CACCGTCATTGGTATGTTGTCACT |
| Fcul R | CGGGAGCGTCTGATAGTCG | |
| 3ADON | 3ADONf | AACATGATCGGTGAGGTATCGA |
| 3ADONr | CCATGGCGCTGGGAGTT | |
| NIV | NIVf | GCCCATATTCGCGACAATGT |
| NIVr | GGCGAACTGATGAGTAACAAAACC | |
| Plant EF1α | Hor1F | TCTCTGGGTTTGAGGGTGAC |
| Hor2R | GGCCCTTGTACCAGTCAAGGT |
| Line | F. culmorum DNA (pg/μg) | 3ADON Chemotype DNA (pg/μg) | NIV Chemotype DNA (pg/μg) | F.c. DNA/ TCT B # | 3ADON DNA/ DON #$ | NIV DNA/ NIV # |
|---|---|---|---|---|---|---|
| S 32 (Fhb1) | 2763 a | 1104 a | 662 a | 1.1 | 1.5 | 0.4 |
| Fregata | 8118 abc | 3094 a | 1189 a | 2.4 | 1.1 | 1.9 |
| UNG 136.6.1.1 (Fhb1) | 9438 ab | 1727 a | 2041 a | 1.9 | 1.0 | 0.6 |
| NAD 13017 | 9465 abc | 2437 a | 1641 a | 1.6 | 0.8 | 0.6 |
| NAD 13014 | 14,625 bcd | 2720 a | 2961 a | 3.1 | 1.0 | 1.6 |
| RGT Kilimanjaro | 17,674 bcd | 3068 a | 3208 a | 3.3 | 0.9 | 1.7 |
| Artist | 21,309 cde | 4207 a | 3362 a | 2.2 | 0.6 | 1.3 |
| NAD 10079 | 21,872 cde | 7768 a | 4574 a | 2.7 | 1.4 | 1.7 |
| Patras | 24,355 cde | 5010 a | 3701 a | 2.0 | 0.6 | 1.0 |
| SMH 8816 | 26,996 cde | 6841 a | 4476 a | 3.1 | 1.3 | 1.3 |
| DL 358/13/4 | 41,502 de | 11,236 a | 6130 a | 2.4 | 0.9 | 1.1 |
| KBP 1416 | 43,369 e | 9556 a | 6019 a | 3.5 | 1.2 | 1.4 |
| Mean | 20,124 | 4897 | 3330 | 2.4 | 1.0 | 1.2 |
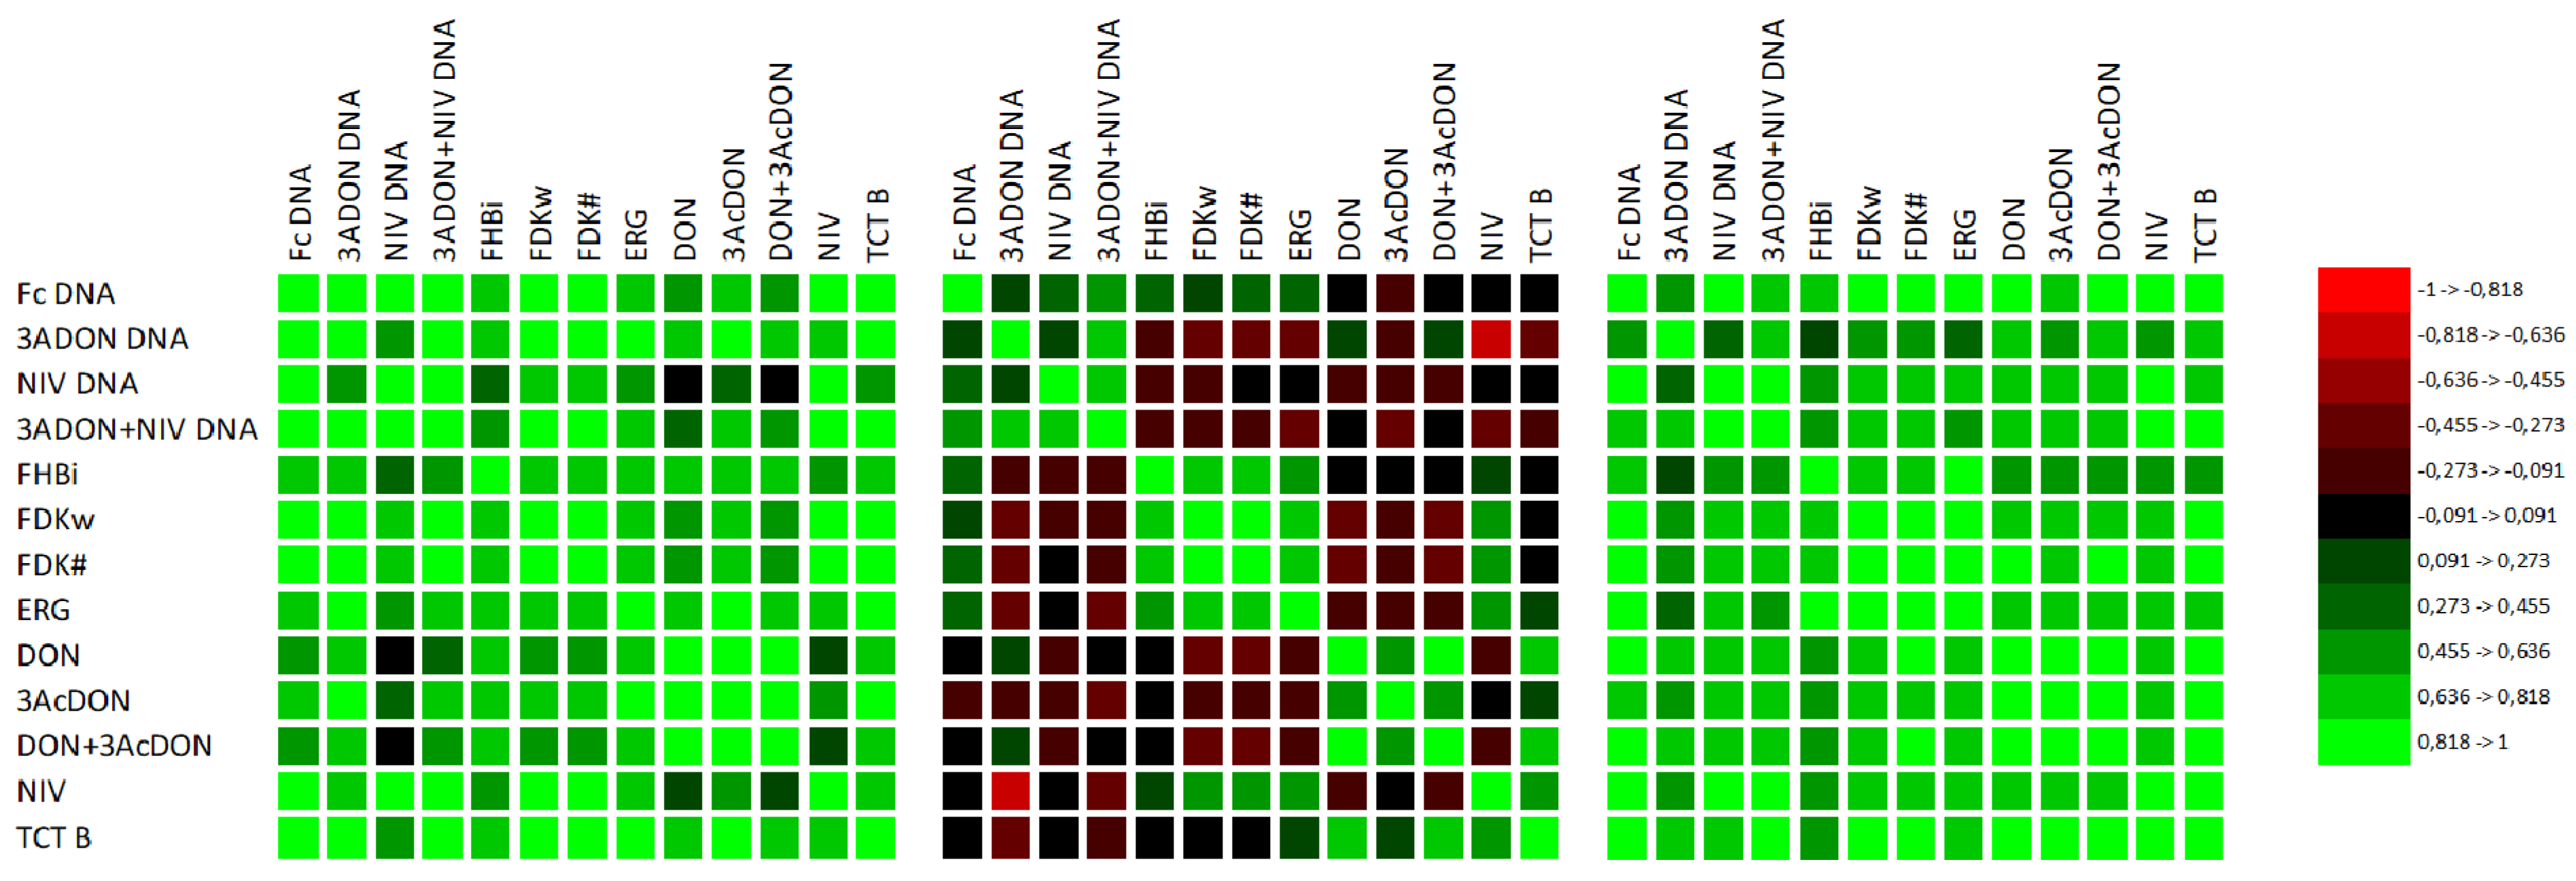
| Variables (n = 72) | Fc DNA | 3A DON DNA | NIV DNA | 3A DON+NIV DNA | FHBi $ | FDKw $ | FDK# $ | ERG $ | DON $ | 3Ac DON $ | DON+ 3Ac DON $ | NIV $ |
|---|---|---|---|---|---|---|---|---|---|---|---|---|
| 3ADON DNA | 0.533 | |||||||||||
| NIV DNA | 0.707 | 0.370 | ||||||||||
| 3ADON+NIV DNA | 0.767 | 0.801 | 0.769 | |||||||||
| FHBi | 0.602 | 0.268 * | 0.323 ** | 0.413 | ||||||||
| FDKw | 0.513 | 0.384 | 0.369 | 0.455 | 0.655 | |||||||
| FDK# | 0.538 | 0.376 | 0.404 | 0.454 | 0.677 | 0.985 | ||||||
| ERG | 0.619 | 0.436 | 0.352 | 0.477 | 0.716 | 0.813 | 0.829 | |||||
| DON | 0.531 | 0.552 | 0.295 * | 0.552 | 0.381 | 0.108ns | 0.112 ns | 0.344 ** | ||||
| 3AcDON | 0.609 | 0.459 | 0.400 | 0.549 | 0.426 | 0.209 ns | 0.216 ns | 0.396 | 0.790 | |||
| DON+ 3AcDON | 0.534 | 0.549 | 0.300 ** | 0.554 | 0.380 | 0.108 ns | 0.111 ns | 0.345 ** | 1.000 | 0.798 | ||
| NIV | 0.497 | 0.277 * | 0.514 | 0.460 | 0.411 | 0.625 | 0.665 | 0.669 | 0.368 | 0.494 | 0.373 | |
| TCT B | 0.519 | 0.488 | 0.422 | 0.541 | 0.417 | 0.427 | 0.452 | 0.608 | 0.806 | 0.618 | 0.808 | 0.755 |
Publisher’s Note: MDPI stays neutral with regard to jurisdictional claims in published maps and institutional affiliations. |
© 2022 by the authors. Licensee MDPI, Basel, Switzerland. This article is an open access article distributed under the terms and conditions of the Creative Commons Attribution (CC BY) license (https://creativecommons.org/licenses/by/4.0/).
Share and Cite
Góral, T.; Przetakiewicz, J.; Ochodzki, P.; Wiewióra, B.; Wiśniewska, H. Quantification of DNA of Fusarium culmorum and Trichothecene Genotypes 3ADON and NIV in the Grain of Winter Wheat. Pathogens 2022, 11, 1449. https://doi.org/10.3390/pathogens11121449
Góral T, Przetakiewicz J, Ochodzki P, Wiewióra B, Wiśniewska H. Quantification of DNA of Fusarium culmorum and Trichothecene Genotypes 3ADON and NIV in the Grain of Winter Wheat. Pathogens. 2022; 11(12):1449. https://doi.org/10.3390/pathogens11121449
Chicago/Turabian StyleGóral, Tomasz, Jarosław Przetakiewicz, Piotr Ochodzki, Barbara Wiewióra, and Halina Wiśniewska. 2022. "Quantification of DNA of Fusarium culmorum and Trichothecene Genotypes 3ADON and NIV in the Grain of Winter Wheat" Pathogens 11, no. 12: 1449. https://doi.org/10.3390/pathogens11121449
APA StyleGóral, T., Przetakiewicz, J., Ochodzki, P., Wiewióra, B., & Wiśniewska, H. (2022). Quantification of DNA of Fusarium culmorum and Trichothecene Genotypes 3ADON and NIV in the Grain of Winter Wheat. Pathogens, 11(12), 1449. https://doi.org/10.3390/pathogens11121449