Abstract
In contrast to the long-lasting taxonomic classification of Plenodomus lingam and P. biglobosus as one species, formerly termed Leptosphaeria maculans, both species form separate monophyletic groups, comprising sub-classes, differing considerably with epidemiology towards Brassicaceae plants. Considering the great differences between P. lingam and P. biglobosus, we hypothesized their metabolic capacities vary to a great extent. The experiment was done using the FF microplates (Biolog Inc., Hayward, CA, USA) containing 95 carbon sources and tetrazolium dye. The fungi P. lingam and P. biglobosus subclade ‘brassicae’ (3 isolates per group) were cultured on PDA medium for 6 weeks at 20 °C and then fungal spores were used as inoculum of microplates. The test was carried out in triplicate. We have demonstrated that substrate richness, calculated as the number of utilized substrates (measured at λ490 nm), and the number of substrates allowing effective growth of the isolates (λ750 nm), showed significant differences among tested species. The most efficient isolate of P. lingam utilized 36 carbon sources, whereas P. biglobosus utilized 60 substrates. Among them, 25–29 carbon sources for P. lingam and 34–48 substrates for P. biglobosus were efficiently used, allowing their growth. Cluster analysis based on Senath criteria divided P. biglobosus into two groups and P. lingam isolates formed one group (33% similarity). We deduce the similarities between the tested species help them coexist on the same host plant and the differences greatly contribute to their different lifestyles, with P. biglobosus being less specialized and P. lingam coevolving more strictly with the host plant.
1. Introduction
Two fungal species belonging to the genus Plenodomus (formerly Leptosphaeria) coexist in Brassicaceae plants, share similar life patterns and cause the disease called stem canker or blackleg [1,2,3]. For many years the isolates were classified as one species Leptosphaeria maculans (Desm.) Ces et de Not., but numerous researchers postulated their separation. Already in 1927, based on morphological characteristics and growth rate observed on agar media, Cunningham [4] described two forms of L. maculans. Some isolates were growing slowly, and the aerial mycelium was sparse, whereas the sporulation of the other isolates was less abundant, but the mycelium grew fast and the brownish pigment was excreted extracellularly. The finding did not lead to the description of the new species and it was forgotten until the widespread cultivation of oilseed rape (Brassica napus L.).
After brassica crop plants became more common, the symptoms of the stem canker started to appear more often, and L. maculans—the causal agent of the disease started to be studied widely again. A half-century after the pioneer studies of Cunningham [4], plant pathologists returned to the description of differences among the isolates of Leptosphaeria from infected oilseed rape plants [5]. Different terms were used to name isolates depending on the methodology of experimentation and the tools used for the studies. Growth rate and culture morphology were some of the methods implied to differentiate isolates. The slow-growing isolates that formed numerous pycnidia were referred to as ‘A-type’, whereas fast-growing isolates with abundant aerial mycelium but less pycnidia were termed ‘B-type’ [6]. Glasshouse inoculation experiments led to the conclusion that both groups of the isolates A and B have a different level of pathogenicity, with some being aggressive (type A) and the other nonaggressive (NA, corresponding to type B-type mycelium growth) when inoculated on the oilseed rape plants [5,7]. In parallel, other researchers used the terms highly virulent (HV) and weakly virulent (WV) [8].
To better understand the cause of higher aggressivity of some isolates, further studies were conducted to understand why a fast growth of the mycelium was not correlated with higher aggressivity. Based on biochemical studies, it was soon proven that the aggressive/virulent, slow-growing, abundantly sporulating isolates produced sirodesmins—nonspecific phytotoxic secondary metabolites [9]. That led to the introduction of new terms, such as Tox+ and Tox− [10], or Tox+ and Tox0 [11,12], referring to the production of sirodesmin PL, the main and most biologically active phytotoxin of L. maculans. Soon, the complex of several sirodesmins was described in L. maculans [13], whereas L. biglobosa and the isolates obtained from wasabi (called P. wasabiae, at that time) produced phomaligin A and other yellow pigments. Sippel and Hall [14] found polymorphisms between the enzymes produced by two sub-groups of L. maculans and proved that weakly and highly virulent strains produce two forms of glucose phosphate isomerase. Soon after, Kachlicki et al. [15] demonstrated that isolates unable to produce sirodesmins, produce benzoic acid that possesses phytotoxic activities. The authors concluded that Tox+ and Tox− terms are inappropriate. Following this path, names Siro+ and Siro0 were proposed as more relevant [16].
There had been some confusion related to the number of subsequent terms used for the isolates within one species. Moreover, some researchers referred to L. maculans by giving the species name only, which led to further questions about which sub-group or selection of the isolates was characterized in a particular study. It was only in 2001, 74 years after the first descriptions by Cunningham [4], that L. maculans was divided to two species based on differences between the morphology of fruiting bodies of the generative stage, called pseudothecia [17]. Since then, the scientific community quickly switched to the use of L. maculans, when referring to the more aggressive, virulent, slow-growing, abundantly sporulating and sirodesmin producing fungal strains. In contrast, the term L. biglobosa was commonly used for less-aggressive, less virulent, fast-growing, less abundantly sporulating strains. Recent re-disposition of Phoma-like anamorphs in Pleosporales proposed by de Gruyter et al. [18] led to further change in fungus taxonomy; L. maculans has been re-named as Plenodomus lingam, whereas L. biglobosa has been termed P. biglobosus.
Both species are further divided into sub-clades, based on colony morphology, supported by concatenated phylogenetic analyses of ITS rDNA, β-tubulin, and actin sequences [19,20]. The species P. lingam is divided to ‘brassicae’ and ‘lepidii’ sub-clades, whereas P. biglobosus is divided into seven sub-clades, including ‘americensis’, ‘australensis’, ‘brassicae’, ‘canadensis’, ‘erysimii’, ‘occiaustralensis’, and ‘thlaspi’ [19,21,22]. The species and sub-clade occurrence and frequency greatly depend on the region and host plant [23,24,25,26]. For example, wasabi plants are mainly infected by P. wasabiae [27], currently called P. biglobosus, with two sub-clades, ‘brassicae’ and ‘canadensis’, both found recently in Europe [28].
The division of Plenodomus biglobosus from P. lingam, originally based just on morphological traits, has a great phytopathological meaning. Although the species share a similar life cycle, they greatly differ in virulence to Brassica crops, with greater yield loss attributed to P. lingam/L. maculans [6]. The disease symptoms appear on plants of oilseed rape even at the seedling stage, but mostly on the first few leaves, depending on the time of ‘ascospore showers’ [29]. This, in turn, greatly depends on the cultural practices of the farmers [30] but primarily on weather conditions [31]. The large dataset of spore counts from air samples, studied in relation to the weather parameters over 17 years in the central-west part of Poland, has shown that increased average air temperature and rainfall shifted the detection of the first spores by 22 days and the day of the maximum spores by 50 days, which resulted in much earlier occurrence of disease symptoms and their higher impact on yield [32].
Considerable yield losses due to stem canker occur worldwide every year [11,31,33,34]. Usually, the annual yield loss reported in oilseed rape is 10%, but it may reach 50% [31], or even all plants may get infected in particular years or regions. In some areas of intensive oilseed rape cultivation in the world, such as the one located in China, the main losses are caused by P. biglobosus sub-clade ‘brassicae’ [25] and recently also by the sub-clade ‘canadensis’ [26], and not by P. lingam [35]. Scenarios describing the fast expansion of the stem canker into oilseed rape growing areas in North and Central China along the Yangtze River showed the great potential threat to the stability of oilseed rape production if the crop was attacked by P. lingam in the absence of resistant cultivars [36]. New breeding programs have been launched in search of traits with the potential to mitigate outbreaks of stem canker. Based on genome-wide association studies, the sources of resistance against P. lingam have been identified in Chinese and Canadian spring and winter oilseed rape cultivars [37,38].
Nowadays, the diversification of the species is not only based on morphological traits but it is supported by genetic characteristics, starting from the size and sequence of the ITS region [39], minisatellites [40], and (in P. lingam) also the presence of several avirulence genes [41,42]. In P. lingam the race composition of fungus populations greatly depends on the specific resistance genes present in oilseed rape [43]. In contrast, by now no resistance to P. biglobosus has been found. Plant infection by P. biglobosus leads to premature ripening and decreased plant yield [34,44]. On the other hand, it is presumed that the fungus occupies the same niche as P. lingam and, being less virulent, it contributes to stem canker control. The studies on P. lingam and P. biglobosus became a model for the investigations of genetic relationships between the pathogen and the host plant [39].
Both Plenodomus species are hemibiotrophic, which means they first develop in live plant organs and then subsequently colonize the senescing plants [45,46]. The colonization of identical plant tissues at the same time would require similar metabolic capacities. Aware of great differences of genotypic and phenotypic characteristics between P. lingam and P. biglobosus, we hypothesized their metabolic capacities also vary. The aim of this study was to check this hypothesis by comparing the metabolic capacities of P. lingam and P. biglobosus sub-clade ‘brassicae’.
2. Results
The metabolic capacities of Plenodomus isolates were tested using the FF microplates (Biolog) including 95 carbon sources. The values of substrate richness (R) calculated as the number of utilized substrates (A490 nm) and the number of substrates allowing effective growth of fungal isolates (A750 nm), demonstrated significant differences among tested species of Plenodomus. The pathogens were able to utilize from 36 (P. lingam—PL1) to 60 (P. biglobosus—PB1) of the tested carbon sources. Among them, from 25 to 29 carbon sources for P. lingam and from 34 to 48 substrates for P. biglobosus were efficiently used, allowing the growth of the fungi.
The average R values of utilized substrates for P. lingam and P. biglobosus were 40 and 57, respectively, as well as allowing for effective fungal growth were 28 and 41, respectively. The tested strains were not able to utilize and grow on all 95 carbon sources. The rates in the average well color development (AWCD) and average well-density development (AWDD) indices values were used to identify the differences in the response of tested fungal isolates on various consumption of carbon sources and growth response, respectively. The results indicated that both AWCD and AWDD values were significantly higher for all tested strains of P. biglobosus than P. lingam. This tendency was observed through most of the incubation period (Figure 1).
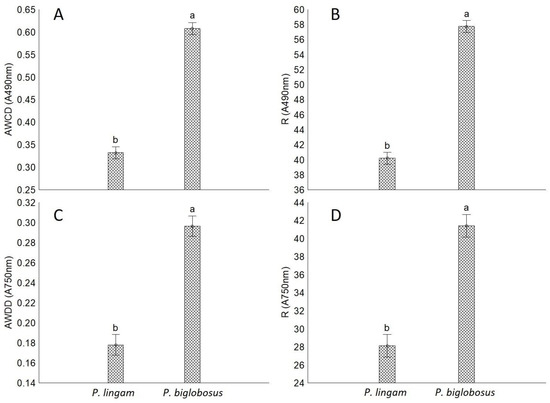
Figure 1.
The comparison of metabolic aptitudes and growth intensity of P. lingam and P. biglobosus on the basis of metabolic diversity indices calculated for absorbance reads at wavelengths 490 nm (A490 nm) and 750 nm (A750 nm). (A) Average well color development (AWCD, A490 nm), (B) metabolic diversity (substrate richness) (R, A490 nm), (C) average well density development (AWDD, A750 nm), (D) fungal growth intensity (substrate richness) (R, A750 nm), vertical bars denote 0.95 confidence intervals, different letters indicate significant differences (p < 0.05), (n = 9). The calculations were based on the utilization of 95 carbon sources belonging to amines and amides, amino acids, carbohydrates, carboxylic acids, polymers, and several other miscellaneous compounds. Different letters (a,b) indicate significant differences (p < 0.05), (n = 9).
The carbon assimilation profiles and growth intensity profiles of tested pathogens were obtained by analyses of substrate guilds and are summarized in Figure 2.
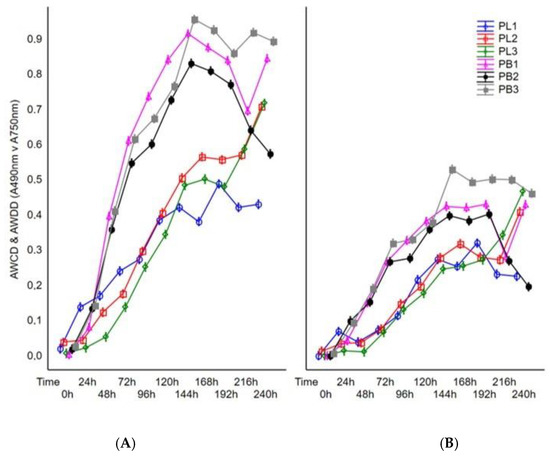
Figure 2.
Changes in AWCD and AWDD values calculated on the basis of the tested fungal isolates’ response to Filamentous Fungi (FF) Biolog® substrates during 240 h of incubation. Explanations: A490 nm—absorbance reads at wavelength 490 nm, A750 nm—absorbance reads at wavelength 750 nm, (A) average well color development (AWCD, A490 nm), (B) average well density development (AWDD, A750 nm).
Higher differences were observed for substrate utilization connected with fungal respiration and mitochondrial activity than that noted for growth response. Qualitative analysis of the proportions between the particular guilds of utilized substrates indicated that P. biglobosus was capable of metabolizing a defined group of compounds in almost equal proportions by all tested isolates (PB1, PB2, PB3), while substrate utilization and growth intensity responses of P. lingam varied little between tested isolates (PL1, PL2, PL3). P. biglobosus strains exhibited significantly higher metabolic preferences than P. lingam for amino acids, carboxylic acids, and miscellaneous categories of C-substrates (Figure 3).
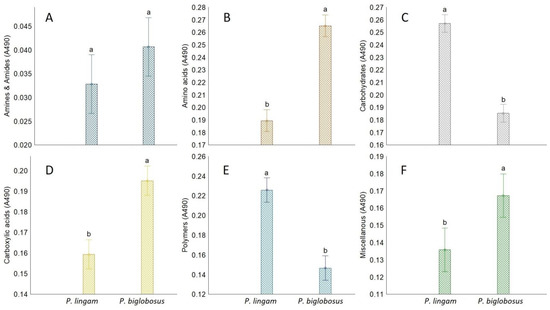
Figure 3.
The share of FF Biolog® substrate group response of P. lingam and P. biglobosus, calculated on the basis of consumption (A490 nm) of substrates belonging to different groups (y-axis labels), A490 nm—absorbance reads at wavelength 490 nm (A) Amines/amides, (B) Aminoacids, (C) Carbohydrates, (D) Carboxylic Acids, (E) Polymers, (F) Miscellanous. Vertical bars denote 0.95 confidence intervals, different letters (a,b) indicate significant differences (p < 0.05), (n = 9).
Plenodomus lingam preferentially utilized various carbon sources and polymers, while amides/amines were degraded at a very low level by all tested isolates belonging to both species of Plenodomus. Significant differences in growth responses of the two tested fungal pathogen species on various carbon sources guilds were observed only for amino acids, carboxylic acids, and polymers (Figure 4). Generally, amino acids and carboxylic acids were used the most by P. biglobosus, while polymers were preferred by P. lingam.
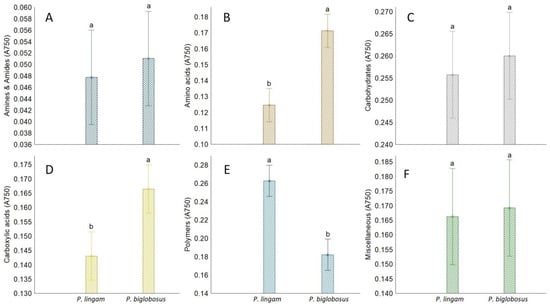
Figure 4.
The share of FF Biolog® substrate group response of P. lingam and P. biglobosus, calculated on the basis of growth potential (A750 nm) on substrates belonging to different groups (y-axis labels), A750 nm—absorbance reads at wavelength 750 nm. (A) Amines/amides, (B) Aminoacids, (C) Carbohydrates, (D) Carboxylic Acids, (E) Polymers, (F) Miscellanous. Vertical bars denote 0.95 confidence intervals, different letters (a,b) indicate significant differences (p < 0.05), (n = 9).
To reveal the differences in metabolic capacity and growth intensity of tested strains during incubation time, the average color development and density development in the wells of FF Biolog plates were calculated for each day of incubation through 10 days (240 h). The results showed significant diversity in fungal metabolism and growth intensity between the compared species of Plenodomus. It should be noted that during 240 h of fungal incubation, the highest catabolic activity of P. biglobosus was observed after 144 h of incubation, whereas the use of the substrates by P. lingam was the highest after 240 h of incubation. Moreover, all tested strains of P. lingam exhibited significantly lower metabolic potential and growth than P. biglobosus. Both fungal species were better characterized by metabolic capacity (carbon source utilization) than growth rate (Figure 2).
The results of metabolic potential obtained in this study allowed the grouping of the tested strains into two major clusters (Figure 5).
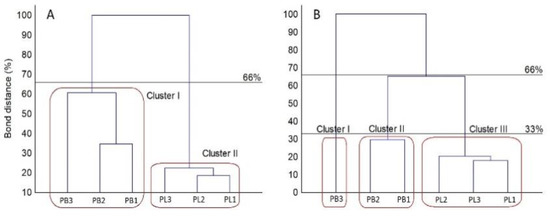
Figure 5.
Cluster analysis-based dendrogram showing similarity of the FF MicroPlate C-sources utilization profiles (A) and growth intensity (B) of the analyzed Plenodomus strains according to Sneath criteria (33 and 66%). Utilization was calculated based on absorbance values at 490 nm (A) and 750 nm (B), n = 3.
Strains classified as P. biglobosus constituted group A with higher metabolic capacity. The cluster denoted with B comprised strains belonging to P. lingam displaying weaker abilities to metabolize the carbon sources compared to L. biglobosa. The strains of P. lingam showing good growth on tested carbon sources clustered together, while L. biglobosa created two sub-clusters. This clustering was connected with the results of the metabolic profile of all tested substrates and growth intensity profile on various carbon sources. The patterns of carbon source utilization are presented in Figure 6.
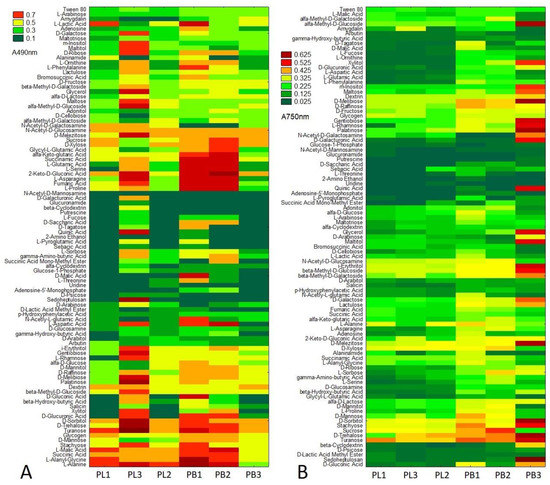
Figure 6.
Metabolic differences based on particular carbon source utilization between P. lingam (PL1, PL2, PL3) and P. biglobosus (PB1, PB2, PB3), expressed as the values of substrate consumption (A 490 nm) (A), A490 nm—absorbance reads at wavelength 490 nm, and growth intensity (A 750 nm) (B), A750 nm—absorbance reads at wavelength 750 nm. The color codes correspond with the level of utilization of/growth on carbon sources, n = 3.
Species-specific and strain-specific differences were observed for both P. lingam and P. biglobosus. It was found that all of the tested strains were extensively capable of metabolizing the carbon substrates at a relatively high level, especially carbohydrates (d-sorbitol, d-trehalose, turanose, d-mannose, stachyose), organic acids (l-malic acid, succinic acid), amino acids (l-alanine, l-alanyl-glycine) and one polymer (glycogen). Furthermore, it was found that substrates were utilized by P. biglobosus and not utilized or utilized at very low level by P. lingam, including l-proline, fumaric acid, l-asparagine, 2-keto-d-gluconic acid, l-serine, l-glutamic acid, succinamic acid, α-keto glutaric acid, glycyl l-glutamic acid, d-xylose and sucrose. N-acetyl -d-mannosamine was not utilized by all tested strains, while glucuronamide, β-cyclodextrin, putrescine, l-fucose, S-saccharic acid, d-tagatose, quinic acid, 2-amino ethanol, l-proglutamic acid, sebcic acid were utilized only by P. biglobosus and not used by P. lingam. Similarly, as metabolic capacity, the growth intensity of P. biglobosus was higher for almost all tested substrates compared to P. lingam (Figure 6 and Figures S1–S3). The highest growth intensity of P. biglobosus was observed on the following carbon sources: α-methyl-d_galactoside, xylitol, M-inositole, maltose, d-melibiose, gentiobiose, l-rhamnose, palationse, N-acetyl-d-galactosamine, d-galacturonic acid, quinic acid, glycerol, maltitol, i-erythritol, β-methyl-d-glucoside, β-methyl-d-galactoside, d-galactose, d-melezitose, and sedoheptulosan.
In general, all tested substrates groups such as: polyols, pentoses, glucosidases, oligosaccharides, polysaccharides, hexoses, sugar acids, l-amino acids, aliphatic organic, TCA-cycle intermediates, peptides, biogene, and heterocyclic amines, hexosamines, and other substrates were metabolized at a higher level by P. biglobosus than P. lingam (Figures S1–S3).
Additionally, the ratio between mitochondrial respiration (OD490 nm) and fungal growth (OD750 nm) calculated for the different groups of substrates showed the diverse metabolic efficiency of the fungal isolates (Figure 7).
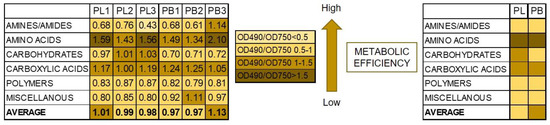
Figure 7.
Metabolic differences based on carbon sources utilization between P. lingam and P. biglobosus, expressed as the ratio values of substrates consumption (A 490 nm) and growth potentials (A 750 nm). A490 nm indicates absorbance reads at wavelength 490 nm, A750 nm indicates absorbance reads at wavelength 750 nm. The color codes correspond with the level of utilization of carbon sources, indicating stressful metabolic situations with higher obtained values according to the figure legend, n = 9 (right side), n = 3 (left side).
Substrates belonging to amino acids and carboxylic acids were the most stressful for both tested species showing lower metabolic efficiency on these organic sources. However, carbohydrates were more stressful for P. lingam than for P. biglobosus fungal strains. What is more, a stressful metabolic situation, indicated by the ratio of both AWCD to AWDD (Figure 8) was met using especially arbutin, l-glutamin acid and l-threonine by P. lingam and glucose-1-phosphate, salicin, bromosuccinic acid, ɣ-hydroxy butyric acid, l-malic acid, quinic acid, d-saccharic acid, l-alanyl glycine, l-aspartic acid, l-glutamic acid, l-serine and putrescine.
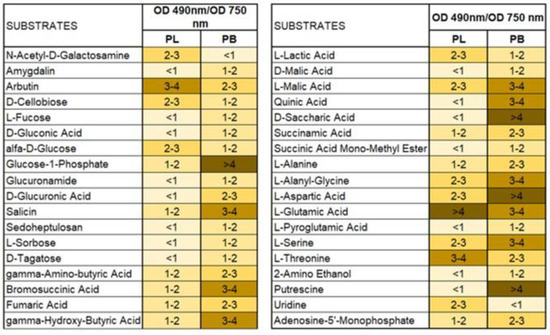
Figure 8.
The ratio between values of substrate use (A 490 nm) and biomass production (A 750 nm) defining theoretical metabolic efficiency of different species of Plenodomus fungi on different carbon sources, A490 nm indicates absorbance reads at wavelength 490 nm, A750 nm indicates absorbance reads at wavelength 750 nm, n = 9. Color codes are explained in Figure 7.
3. Discussion
The results of this study confirmed the working hypothesis about the differences in metabolic capacities between P. lingam and P. biglobosus sub-clade ‘brassicae’. Despite considerable variation in metabolic activities of individual isolates, both species formed two separate groups with distinct metabolic potential. According to the Sneath criteria, the FF MicroPlate C-sources utilization profiles, as well as the growth intensity of the analyzed strains, was distinct for P. lingam and P. biglobosus. The utilization calculated based on absorbance value at 490 nm divided the isolates of P. biglobosus into two clusters (with 66% similarity of the substrate utilization profiles) and one cluster for P. lingam (33% similarity). Moreover, the increase of fungal biomass calculated based on absorbance value at 750 nm showed identical results with the more stringent similarity (33%). This means that despite having identical host plants and life cycles [47], the species P. lingam and P. biglobosus maintain separate metabolic capacities. The differences partially explain why P. lingam and P. biglobosus manifest different ways of inhabiting oilseed rape plants, resulting in contrasting effects on plant health and yield. Based on our experiment, the species P. biglobosus uses numerous and variable sources of carbon and under natural conditions, it grows very quickly [34,44], whereas P. lingam is restricted to a narrower range of C-containing nutrients, which is the most likely reason for its slower growth. The response of both studied species to carbohydrates shows no statistical differences, but they tend to be in favor of P. biglobosus species. Moreover, P. biglobosus grows significantly better on carboxylic acids and amino acids.
Warm and humid weather increases the reproduction potential of P. biglobosus [48] and leads to fast colonization of oilseed rape stems [49], leading to severe stem canker symptoms [50]. High metabolic capacities help P. biglobosus species achieve quite spectacular success in inoculum production, reaching millions of pycnidiospores, that are able to colonize adjacent plants [51,52]. Moreover, the fungus increases its reproduction capacities by up to a few thousand of ascospores per cubic meter of the air [31,53], which incredibly increases the ecological success of this species.
To a great extent spore germination and mycelial growth [54] and hence, also the stem canker disease is controlled by plant resistance and fungicide application [55], especially when the latter are well-timed by the decision support systems [29,56]. However, naturally created mechanisms such as fast growth, abundant reproduction, and higher levels of resistance to commonly used fungicides are in favor of the survival of P. biglobosus. It was usually found as the first species on oilseed rape [1,33,37,46], and in some countries, out of the two species, only P. biglobosus has been reported on oilseed rape by now [57].
In contrast, P. lingam grows slowly, but we have demonstrated that it utilizes substrates more efficiently than P. biglobosus. Moreover, the number of substrates causing substrate stress is much lower as compared to P. biglobosus. Considering the ability to produce toxins contributing to the pathogenesis, this species achieved the ecological success in a different way than P. biglobosus.
Field populations of P. lingam display a high evolutionary potential and can overcome major resistance genes within a few years [58]. The most dramatic example was the break of resistance introduced to the Australian cultivar Surpass from B. rapa subsp. sylvestris, which was broken within one year [59]. Many other examples show the population of P. lingam may shift rapidly in response to the common use of oilseed rape cultivars carrying single resistance (Rlm) genes [60,61]. These genes exert strong selection pressure on corresponding avirulence effector genes of P. lingam [42].
The evolution of the pathogen toward virulence [62] resulted in a vast search for stable quantitative resistance (QR) loci to stem canker [63]. It was proved that QR resistance increases the durability of qualitative resistance of oilseed rape to P. lingam [64,65]. Recently, numerous significant quantitative trait loci (QTL) for QR were detected on several chromosomes belonging to A or C genomes, of which eight were repeatedly detected across diverse environments of oilseed rape cultivation, located in Australia, France, and the United Kingdom [66]. Association mapping confirmed the high number of genomic regions involved in oilseed rape QR to stem canker [67]. These stable QTLs can be used for enhancing QR in elite germplasm via marker-assisted or genomic selection strategies [66]. Additionally, comparative mapping pinpointed several R genes coding for nucleotide-binding leucine-rich repeat (LRR) receptors, which helps to combine QR and specific resistance to P. lingam, conferred by R genes. Similar to the other plant diseases, the control of P. lingam relying on resistant varieties is challenging and must be based on QR resistance as well as efficient working and diversified Rlm genes of various origins and their careful and well-planned deployment [58].
Great progress in resistance breeding over the last three decades has helped to control stem canker. The breakdown of resistance to stem canker reported in Australia has been averted in commercial cultivars of oilseed rape [68]. However, durable resistance based on several QTLs may bring questions about the fitness cost [69]. Decreased yield frequently encountered in resistant cultivars is not acceptable to farmers. The recent introduction of pro-ecological programs, such as the European Green Deal, with a toxic-free environment and zero pollution of water, air, and soil, will promote the further pursuit to utilize disease-resistant cultivars of crop plants. There is a hope the use of super parasites and natural products will reduce the pressure exerted on P. lingam and it will reduce its further spread and virulence towards Brassicaceae plants. An increased investigation of P. biglobosus influence on P. lingam is needed. Its results may help to exploit natural competition between these species in occupying oilseed rape plants. This, in turn, requires detailed studies of plant tissues composition to compare metabolic capacities of P. lingam and P. biglobosus with the availability of substrates in various plant organs, stages of plant development, and differences between the commercially used cultivars of oilseed rape. Ideally, the investigations should compare the results of metabolic capacities of all sub-clades within P. lingam and P. biglobosus, with a high number of isolates representing each of these taxonomic groups.
4. Materials and Methods
4.1. Fungal Strains
The studies were done using fungal strains from the collection of the Department of Pathogen Genetics and Plant Resistance, Institute of Plant Genetics, Polish Academy of Sciences. The fungi were isolated from the leaves of oilseed rape plants, single-spored and classified as Plenodomus lingam (formerly Leptosphaeria maculans) and P. biglobosus subclade ‘brassicae’ (formerly L. biglobosa subclade ‘brassicae’) based on their morphology and molecular characteristics, as described before [53,70]. There were three isolates of P. lingam (PL1, PL2, and PL3) and three isolates of P. biglobosus subclade ‘brassicae’ (PB1, PB2, and PB3) studied.
4.2. Filamentous Fungi (FF) Plates Assay
The metabolic capacity and profile of six Plenodomus isolates, including three isolates of P. lingam and three isolates of P. biglobosus subclade ‘brassicae’, was measured using filamentous fungi (FF) microplates (Biolog, Inc., Hayward, CA, USA) containing 95 different carbon sources and tetrazolium dye. The fungi were cultured on potato dextrose agar (PDA) for 6 weeks at 20 °C and then fungal spores were used as inoculum of microplates. The inoculation procedure was performed according to manufacturer protocol with modifications described by Frąc [71] and Oszust et al. [72] in triplicate using three separate plates for each fungal isolate. In brief, after homogenization of fungal spores in distilled sterile water with Pulsifier apparatus, the obtained fungal suspension in inoculating fluid (FF-IF, Biolog) containing Phytagel, Tween 40 and water was adjusted to 75% of transmittance using turbidimeter (Biolog, Inc., Hayward, CA, USA).
Then, 100 µL of the above-mentioned fungal spores suspension were added into each well of FF microplates and the plates were incubated at 27 °C in darkness within 240 h. The measurements of absorbance at wavelength 490 nm (substrate utilization) and 750 nm (fungal growth) were performed every 24-h using a microplate reader (Biolog Inc., Hayward, CA, USA).
4.3. Metabolic Capacity, Fungal Growth and Group of Substrates Use
Based on measurement at 490 nm and 750 nm, average well color development (AWCD) and average well density development (AWDD) indices were calculated, respectively [71,73]. The substrate richness indices presenting the number of different substrates utilized by the strain (490 nm) or used by fungi to grow (750 nm) were calculated as all positive readings with the threshold ≥0.25. The response of each tested fungal strain to individual 95 carbon substrates was assessed as a level of consumption of different substrates and growth intensity on substrates. The percentage of the use of six main groups of carbon sources (amines and amides, amino acids, carbohydrates, carboxylic acids, polymers, miscellaneous), as well as the fungal abilities to grow on them, were calculated to present the response of tested fungal pathogens to substrates. Moreover, the level of metabolic capacity and fungal growth intensity on those groups of carbon sources were calculated. To analyze deeper the carbon sources guild utilization, fifteen groups of substrates were evaluated according to Atanasova and Druzhinina [74], based on their chemical structure and properties. The following guilds of substrates were tested: heptoses, hexoses, pentoses, sugar acids, hexosamines, polyols, polysaccharides, oligosaccharides, glucosides, peptides, l-amino acids, biogenic and heterocyclic amines, TCA-cycle intermediates, aliphatic organic acids, and others. The ratio of AWCD and AWDD of substrate group [75,76] and the particular carbon sources for tested fungi was calculated to indicate the specific respiration rate for the mean values of each substrate group and shows catabolic capacity compared with fungal biomass production. The higher ratio indicates the higher stressful metabolic situation, showing lower biomass production and higher respiration rates [77,78].
4.4. Statistical Analysis
Data analysis was performed with the STATISTICA 13.0 (StatSoft Inc., Tulsa, OK, USA) software package. One-way analysis of variance ANOVA (with confidence interval 95%) was performed to compare the growth of selected strains on individual carbon sources and the level of substrate utilization, expressed as AWDD, AWCD, and R indices. Then, the indices were assessed by two-way ANOVA analysis regarding the effect of the incubation time and tested fungal isolates. ANOVA was followed by a post hoc analysis using Tukey’s HSD (Honestly Significant Difference) test. The summed data matrices also were evaluated following multidimensional scaling to detect additional relationships between variables. Cluster analysis was performed to detect groups in the data set. To illustrate the results, the similarities of the carbon utilization patterns between the strains were presented using heat maps graphs and the percentage of total carbon source utilization. As a function of the carbon utilization a dendrogram calculated with the Ward method [79] and Sneath dissimilarity criterion [80] was performed to indicate the dissimilarity of fungal groups based on their response to substrates tested.
Supplementary Materials
The following supporting information can be downloaded at: https://www.mdpi.com/article/10.3390/pathogens11010050/s1, Figure S1: Ribbon chart depicting the consumption response (A490 nm) of P. lingam and P. biglobosus to substrates located on Biolog® FF plates, shown as the following substrate groups: (A) polyols, (B) pentoses, (C) glucosides, (D) oligosaccharides, (E) polysaccharides. The analysis was performed on the basis of consumption (A490 nm) potentiates (A > 0.2, n = 3). Figure S2: Ribbon chart depicting the consumption response (A490 nm) of P. lingam and P. biglobosus to substrates located on Biolog® FF plates, shown as the following substrate groups: (A) hexoses, (B) sugar acids, (C) l-amino acids, (D) aliphatic organic acids, and (E) tricarboxylic acid (TCA) cycle-intermediates. The analysis was performed on the basis of consumption (A490 nm) potentiates (A > 0.2, n = 3). Figure S3: Ribbon chart depicting the consumption response (A490 nm) of P. lingam and P. biglobosus to substrates located on Biolog® FF plates, shown as the following substrate groups: (A) peptides, (B) biogenic and heterocyclic amines, (C) hexosamines and (D) others. The analysis was performed on the basis of consumption (490 nm) potentiates (A > 0.2, n = 3).
Author Contributions
Conceptualization, M.J. and M.F.; methodology, M.F.; software, M.F.; validation, M.F. and M.J.; formal analysis, M.F.; investigation, M.F. and J.K.; resources, J.K., M.J. and M.F.; data curation, M.F.; writing—original draft preparation, M.J. and M.F.; writing—review and editing, M.J. and J.K.; visualization, M.F.; supervision, M.J.; project administration, M.J.; funding acquisition, M.J. All authors have read and agreed to the published version of the manuscript.
Funding
The project was funded by the Ministry of Agriculture and Rural Development under the program ‘Biological Progress”, project for the years 2021–2026, task 25 ‘Resistance of oilseed rape to diseases caused by fungi and protists’.
Institutional Review Board Statement
Not applicable.
Informed Consent Statement
Not applicable.
Data Availability Statement
The data supporting the results of this study are available from the authors (M.F. or M.J.) upon reasonable request.
Acknowledgments
The authors would like to thank Mariola Beresniewicz-Kopcinski from Ingevity, North Charleston, SC, USA, for the proofreading of the manuscript. The analyses were done using Biolog® equipment (Biolog Inc., Hayward, CA, USA) purchased within the EU Operational Programme Eastern Poland 2007–2013—Regional Laboratory of Renewable Energy, Institute of Agrophysics, Polish Academy of Sciences.
Conflicts of Interest
The authors declare no conflict of interest.
References
- Gugel, R.K.; Petrie, G.A. History, occurrence, impact and control of blackleg of rapeseed. Can. J. Plant Pathol. 1992, 14, 36–45. [Google Scholar] [CrossRef]
- Fitt, B.D.L.; Huang, Y.J.; van den Bosch, F.; West, J.S. Coexistence of related pathogen species on arable crops in space and time. Annu. Rev. Phytopathol. 2006, 44, 163–182. [Google Scholar] [CrossRef] [PubMed]
- Kaczmarek, J.; Jedryczka, M. Characterization of two coexisting pathogen populations of Leptosphaeria spp., the cause of stem canker of brassicas. Acta Agrobot. 2011, 64, 3–14. [Google Scholar] [CrossRef]
- Cunningham, G.H. Dry rot of swedes and turnips: Its cause and control. N. Z. J. Agric. 1927, 35, 1–14. [Google Scholar]
- Koch, E.; Badawy, H.M.A.; Hoppe, H.H. Differences between aggressive and non-aggressive single spore lines of Leptosphaeria maculans in cultural characteristics and phytotoxin production. J. Phytopathol. 1989, 124, 52–62. [Google Scholar] [CrossRef]
- Williams, R.H.; Fitt, B.D.L. Differentiating A and B groups of Leptosphaeria maculans, causal agent of stem canker (blackleg) of oilseed rape. Plant Pathol. 1999, 48, 161–175. [Google Scholar] [CrossRef]
- Voigt, K.; Jędryczka, M.; Wöstemeyer, J. Strain typing of Polish Leptosphaeria maculans isolates supports at the genomic level the multi-species concept of aggressive and non-aggressive strains. Microbiol. Res. 2001, 156, 169–177. [Google Scholar] [CrossRef] [PubMed]
- Taylor, J.L.; Borgmann, I.; Séguin-Swartz, G. Electrophoretic karyotyping of Leptosphaeria maculans differentiates highly virulent from weakly virulent isolates. Curr. Genet. 1991, 19, 273–277. [Google Scholar] [CrossRef]
- Pedras, M.S.C.; Séguin-Swartz, G. The blackleg fungus: Phytotoxins and phytoalexins. Can. J. Plant Pathol. 1992, 1, 67–75. [Google Scholar] [CrossRef]
- Balesdent, M.-H.; Gall, C.; Robin, P.; Rouxel, T. Intraspecific variation in soluble mycelia protein and esterase patterns of Leptosphaeria maculans French isolates. Mycol. Res. 1992, 96, 677–684. [Google Scholar] [CrossRef]
- Jedryczka, M.; Fitt, B.D.L.; Kachlicki, P.; Lewartowska, E.; Balesdent, M.H.; Rouxel, T. Comparison between Polish and United Kingdom populations of Leptosphaeria maculans, cause of stem canker of winter oilseed rape. J. Plant Dis. Prot. 1999, 106, 608–617. [Google Scholar]
- West, J.S.; Balesdent, M.-H.; Rouxel, T.; Narcy, J.P.; Huang, Y.-J.; Roux, J.; Steed, J.M.; Fitt, B.D.L.; Schmit, J. Colonization of winter oilseed rape tissues by A/Tox+ and B/Tox0 Leptosphaeria maculans (phoma stem canker) in France and England. Plant Pathol. 2002, 51, 311–321. [Google Scholar] [CrossRef]
- Pedras, M.S.C.; Chumala, P.; Yu, Y. The phytopathogenic fungi Leptosphaeria maculans and Leptosphaeria biglobosa: Chemotaxonomical characterization of isolates and metabolite production in different culture media. Can. J. Microbiol. 2007, 53, 364–371. [Google Scholar] [CrossRef] [PubMed]
- Sippell, D.W.; Hall, R. Glucose Phosphate Isomerase polymorphisms distinguish weakly virulent from highly virulent-strains of Leptosphaeria maculans. Can. J. Plant Pathol. 1995, 17, 1–6. [Google Scholar] [CrossRef]
- Kachlicki, P.; Stobiecki, M.; Jędryczka, M. The benzoic acid—The phytotoxic metabolite of Tox0 strain of the fungus Phoma lingam. Oilseed Crop. 1996, 17, 193–198. (In Polish) [Google Scholar]
- Howlett, B.J.; Idnurm, A.; Pedras, M.S.C. Leptosphaeria maculans, the causal agent of blackleg disease of Brassicas. Fungal Genet. Biol. 2001, 33, 1–14. [Google Scholar] [CrossRef]
- Shoemaker, R.A.; Brun, H. The teleomorph of the weakly aggressive segregate of Leptosphaeria maculans. Can. J. Bot. 2001, 79, 412–419. [Google Scholar] [CrossRef]
- de Gruyter, J.; Woudenberg, J.H.C.; Aveskamp, M.M.; Verkley, G.J.M.; Groenewald, J.Z.; Crous, P.W. Redisposition of Phoma-like anamorphs in Pleosporales. Stud. Mycol. 2013, 75, 1–36. [Google Scholar] [CrossRef]
- Mendes-Pereira, E.; Balesdent, M.-H.; Brun, H.; Rouxel, T. Molecular phylogeny of the Leptosphaeria maculans–L. biglobosa species complex. Mycol. Res. 2003, 107, 1287–1304. [Google Scholar] [CrossRef]
- Voigt, K.; Cozijnsen, A.J.; Kroymann, J.; Pöggeler, S.; Howlett, B.J. Phylogenetic relationships between members of the crucifer pathogenic Leptosphaeria maculans species complex as shown by mating type (MAT1-2), actin, and β-tubulin sequences. Mol. Phylogenet. Evol. 2005, 37, 541–557. [Google Scholar] [CrossRef]
- Vincenot, L.; Balesdent, M.H.; Li, H.; Barbetti, M.J.; Sivasithamparam, K.; Gout, L.; Rouxel, T. Occurrence of a new subclade of Leptosphaeria biglobosa in Western Australia. Phytopathology 2008, 98, 321–329. [Google Scholar] [CrossRef]
- Zhou, Z.; Zhang, X.H.; Parks, P.; du Toit, L.J.; Van de Wouw, P.; Fernando, W.G.D. A new subclade of Leptosphaeria biglobosa identified from Brassica rapa. Int. J. Mol. Sci. 2019, 20, 1668. [Google Scholar] [CrossRef] [PubMed]
- Balesdent, M.H.; Barbetti, M.J.; Li, H.; Sivasithamparam, K.; Gout, L.; Rouxel, T. Analysis of Leptosphaeria maculans race structure in a worldwide collection of isolates. Phytopathology 2005, 95, 1061–1071. [Google Scholar] [CrossRef]
- Dilmaghani, A.; Balesdent, M.H.; Didier, J.P.; Wu, C.; Davey, J.; Barbetti, M.J.; Li, H.; Moreno-Rico, O.; Phillips, D.; Despeghel, J.P.; et al. The Leptosphaeria maculans–Leptosphaeria biglobosa species complex in the American continent. Plant Pathol. 2009, 58, 1044–1058. [Google Scholar] [CrossRef]
- Liu, Z.; Latunde-Dada, A.O.; Hall, A.M.; Fitt, B.D.L. Phoma stem canker disease on oilseed rape (Brassica napus) in China is caused by Leptosphaeria biglobosa ‘brassicae’. Eur. J. Plant Pathol. 2014, 140, 841–857. [Google Scholar] [CrossRef]
- Luo, T.; Li, G.; Yang, L. First report of Leptosphaeria biglobosa ‘canadensis’ causing blackleg on oilseed rape (Brassica napus) in China. Plant Dis. 2021. [Google Scholar] [CrossRef]
- Punja, Z.K.; Chandanie, W.A.; Chen, X.; Rodríguez, G. Phoma leaf spot of wasabi (Wasabia japonica) caused by Leptosphaeria biglobosa. Plant Pathol. 2017, 66, 480–489. [Google Scholar] [CrossRef]
- King, K.M.; West, J.S. Detection of the Phoma pathogens Plenodomus biglobosus subclades ‘brassicae’ and ‘canadensis’ on wasabi, and ‘canadensis’ in Europe. Eur. J. Plant Pathol. 2021. [Google Scholar] [CrossRef]
- Brachaczek, A.; Kaczmarek, J.; Jędryczka, M. Monitoring blackleg (Leptosphaeria spp.) ascospore release timing and quantity enables optimal fungicide application to improved oilseed rape yield and seed quality. Eur. J. Plant Pathol. 2016, 145, 643–657. [Google Scholar] [CrossRef][Green Version]
- McCredden, J.A.; Cowley, A.R.B.; Marcroft, B.S.J.; Van de Wouw, A.P. Changes in farming practices impact on spore release patterns of the blackleg pathogen, Leptosphaeria maculans. Crop Pasture Sci. 2017, 69, 1–8. [Google Scholar] [CrossRef]
- West, J.S.; Kharbanda, P.D.; Barbetti, M.J.; Fitt, B.D.L. Epidemiology and management of Leptosphaeria maculans (phoma stem canker) on oilseed rape in Australia, Canada and Europe. Plant Pathol. 2001, 50, 10–27. [Google Scholar] [CrossRef]
- Kaczmarek, J.; Kedziora, A.; Brachaczek, A.; Latunde-Dada, A.O.; Dakowska, S.; Karg, G.; Jedryczka, M. Effect of climate change on sporulation of the teleomorphs of Leptosphaeria species causing stem canker of brassicas. Aerobiologia 2016, 32, 39–51. [Google Scholar] [CrossRef]
- Fitt, B.D.L.; Brun, H.; Barbetti, M.J.; Rimmer, S.R. World-wide importance of phoma stem canker (Leptosphaeria maculans and L. biglobosa) on oilseed rape (Brassica napus). Eur. J. Plant Pathol. 2006, 114, 3–15. [Google Scholar] [CrossRef]
- Huang, Y.J.; Karandeni-Dewage, C.S.; Fitt, B.D.L. Importance of Leptosphaeria biglobosa as a cause of phoma stem canker on winter oilseed rape in the UK. Asp. App Biol. 2014, 127, 117–122. [Google Scholar]
- West, J.S.; Evans, N.; Liu, S.; Hu, B.; Peng, L. Leptosphaeria maculans causing stem canker of oilseed rape in China. Plant Pathol. 2000, 49, 800. [Google Scholar] [CrossRef][Green Version]
- Zhang, X.; White, R.P.; Demir, E.; Jedryczka, M.; Lange, R.M.; Islam, M.; Li, Q.; Huang, Y.J.; Hall, A.M.; Zhou, G.; et al. Leptosphaeria spp., phoma stem canker and potential spread of L. maculans on oilseed rape crops in China. Plant Pathol. 2014, 63, 598–612. [Google Scholar] [CrossRef]
- Raman, H.; Raman, R.; Coombes, N.; Song, J.; Diffey, S.; Kilian, A.; Lindbeck, K.; Barbulescu, D.M.; Batley, J.; Edwards, D.; et al. Genome-wide association study identifies new loci for resistance to Leptosphaeria maculans in canola. Front. Plant Sci. 2016, 7, 1513. [Google Scholar] [CrossRef]
- Fu, F.; Zhang, X.; Liu, F.; Peng, G.; Yu, F.; Fernando, F. Identification of resistance loci in Chinese and Canadian canola/rapeseed varieties against Leptosphaeria maculans based on genome-wide association studies. BMC Genom. 2020, 21, 501. [Google Scholar] [CrossRef]
- Plummer, K.M.; Dunse, K.; Howlett, B.J. Non-aggressive strains of the blackleg fungus, Leptosphaeria maculans, are present in Australia and can be distinguished from aggressive strains by molecular analysis. Aust. J. Bot. 1994, 42, 1–8. [Google Scholar] [CrossRef]
- Eckert, M.; Gout, L.; Rouxel, T.; Blaise, F.; Jędryczka, M.; Fitt, B.D.L.; Balesdent, M.H. Identification, molecular characterization and polymorphism of five minisatellites in the phytopathogenic ascomycete Leptosphaeria maculans. Curr. Genet. 2005, 47, 37–48. [Google Scholar] [CrossRef] [PubMed]
- Stachowiak, A.; Olechnowicz, J.; Jedryczka, M.; Rouxel, T.; Balesdent, M.H.; Happstadius, I.; Gladders, P.; Latunde-Dada, A.; Evans, N. Frequency of avirulence alleles in field populations of Leptosphaeria maculans in Europe. Eur. J. Plant Pathol. 2006, 114, 67–75. [Google Scholar] [CrossRef]
- Rouxel, T.; Balesdent, M.H. Life, death and rebirth of avirulence effectors in a fungal pathogen of Brassica crops, Leptosphaeria maculans. New Phytol. 2017, 214, 526–532. [Google Scholar] [CrossRef]
- Kutcher, H.R.; Balesdent, M.H.; Rimmer, S.R.; Rouxel, T.; Chèvre, A.M.; Delourme, R.; Brun, H. Frequency of avirulence genes in Leptosphaeria maculans in western Canada. Can. J. Plant Pathol. 2010, 32, 77–85. [Google Scholar] [CrossRef]
- Jedryczka, M. Epidemiologia i szkodliwość suchej zgnilizny kapustnych na rzepaku ozimym w Polsce. Rozpr. Monogr. IGR PAN 2006, 17, 1–150. (In Polish) [Google Scholar]
- Liu, S.Y.; Liu, Z.; Fitt, B.D.L.; Evans, N.; Foster, S.J.; Huang, Y.J.; Latunde-Dada, A.O.; Lucas, J.A. Resistance to Leptosphaeria maculans (phoma stem canker) in Brassica napus (oilseed rape) induced by L. biglobosa and chemical defense activators in field and controlled environments. Plant Pathol. 2006, 55, 401–412. [Google Scholar] [CrossRef]
- Travadon, R.; Marquer, B.; Ribulé, A.; Sache, I.; Masson, P.; Brun, H.; Delourme, R.; Bousset, L. Systemic growth of Leptosphaeria maculans from cotyledons to hypocotyls in oilseed rape: Influence of number of infection sites, competitive growth and host polygenic resistance. Plant Pathol. 2009, 58, 461–469. [Google Scholar] [CrossRef]
- Kuswinanti, T.; Koopmann, B.; Hoppe, H.H. Virulence pattern of aggressive isolates of Leptosphaeria maculans on an extended set of Brassica differentials. J. Plant Dis. Prot. 1999, 106, 12–20. [Google Scholar]
- Dawidziuk, A.; Kaczmarek, J.; Podlesna, A.; Kasprzyk, I.; Jedryczka, M. Influence of meteorological parameters on Leptosphaeria maculans and L. biglobosa spore release in central and eastern Poland. Grana 2012, 51, 240–248. [Google Scholar] [CrossRef]
- Toscano-Underwood, C.; Huang, Y.J.; Fitt, B.D.L.; Hall, A.M. Effects of temperature on maturation of pseudothecia of Leptosphaeria maculans and L. biglobosa on oilseed rape stem debris. Plant Pathol. 2003, 52, 726–736. [Google Scholar] [CrossRef]
- Brachaczek, A.; Kaczmarek, J.; Jedryczka, M. Warm and wet autumns favour yield losses of oilseed rape caused by phoma stem canker. Agronomy 2021, 11, 1171. [Google Scholar] [CrossRef]
- Barbetti, M.J. Role of pycnidiospores of Leptosphaeria maculans in spread of blackleg disease in rape. Aust. J. Environ. Res. 1976, 16, 911–914. [Google Scholar] [CrossRef]
- Guo, X.W.; Fernando, W.G.D. Seasonal and diurnal patterns of spore dispersal by Leptosphaeria maculans from canola stubble in relation to environmental conditions. Plant Dis. 2005, 89, 97–104. [Google Scholar] [CrossRef]
- Kaczmarek, J.; Jędryczka, M.; Fitt, B.D.L.; Lucas, J.A.; Latunde-Dada, A.O. Analyses of air samples for ascospores of Leptosphaeria maculans and L. biglobosa with light microscopic and molecular techniques. J. Appl. Genet. 2009, 50, 411–419. [Google Scholar] [CrossRef]
- Eckert, M.; Rossall, S.; Selley, A.; Fitt, B.D.L. Effects of fungicides on in vitro spore germination and mycelial growth of the phytopathogens Leptosphaeria maculans and L. biglobosa (phoma stem canker of oilseed rape). Pest Manag. Sci. 2010, 66, 396–405. [Google Scholar] [CrossRef]
- Fortune, J.A.; Qi, A.; Ritchie, F.; Karandeni Dewage, C.S.; Fitt, B.D.L.; Huang, Y.-J. Effects of cultivar resistance and fungicide application on stem canker of oilseed rape (Brassica napus) and potential interseasonal transmission of Leptosphaeria spp. inoculum. Plant Pathol. 2021, 70, 2115–2124. [Google Scholar] [CrossRef]
- Kaczmarek, J.; Latunde-Dada, A.O.; Irzykowski, W.; Cools, H.J.; Stonard, J.F.; Brachaczek, A.; Jedryczka, M. Molecular screening for avirulence alleles AvrLm1 and AvrLm6 in airborne inoculum of Leptosphaeria maculans and winter oilseed rape (Brassica napus) plants from Poland and the UK. J. Appl. Genet. 2014, 55, 529–539. [Google Scholar] [CrossRef]
- Mitrović, P.; Jeromela, A.M.; Trkulja, V.; Milovac, Ž.; Terzić, S. The first occurrence of stem canker on oilseed rape caused by Leptosphaeria biglobosa in Serbia. Ratar. Povrt. 2016, 53, 53–56. [Google Scholar] [CrossRef]
- Zhang, X.; Fernando, W.G.D. Insights into fighting against blackleg disease of Brassica napus in Canada. Crop Pasture Sci. 2018, 69, 40–47. [Google Scholar] [CrossRef]
- Li, H.; Sivasithamparam, K.; Barbetti, M.J. Breakdown of a Brassica rapa subsp. sylvestris single dominant blackleg resistance gne in B. napus rapeseed by Leptosphaeria maculans field isolates in Australia. Plant Dis. 2003, 87, 752. [Google Scholar] [CrossRef]
- Rouxel, T.; Penaud, A.; Pinochet, X.; Brun, H.; Gout, L.; Delourme, R.; Schmit, J.; Balesdent, M.H. A 10-year survey of populations of Leptosphaeria maculans in France indicates a rapid adaptation towards the Rlm1 resistance gene of oilseed rape. Eur. J. Plant Pathol. 2003, 109, 871–881. [Google Scholar] [CrossRef]
- Liban, S.H.; Cross, D.J.; Kutcher, H.R.; Peng, G.; Fernando, W.G.D. Race structure and frequency of avirulence genes in the western Canadian Leptosphaeria maculans pathogen population, the causal agent of blackleg in brassica species. Plant Pathol. 2016, 65, 1161–1169. [Google Scholar] [CrossRef]
- Zhang, X.; Peng, G.; Kutcher, H.R.; Balesdent, M.H.; Delourme, R.; Fernando, W.G.D. Breakdown of Rlm3 resistance in the Brassica napus–Leptosphaeria maculans pathosystem in western Canada. Eur. J. Plant Pathol. 2016, 145, 659–674. [Google Scholar] [CrossRef]
- Delourme, R.; Piel, N.; Horvais, R.; Pouilly, N.; Domin, C.; Vallée, P.; Falentin, C.; Manzanares-Dauleux, M.J.; Renard, M. Molecular and phenotypic characterization of near isogenic lines at QTL for quantitative resistance to Leptosphaeria maculans in oilseed rape (Brassica napus L.). Theor Appl Genet. 2008, 117, 1055–1067. [Google Scholar] [CrossRef]
- Rouxel, T.; Willner, E.; Coudard, L.; Balesdent, M.H. Screening and identification of resistance to Leptosphaeria maculans in Brassica napus accessions. Euphytica 2003, 133, 219–231. [Google Scholar] [CrossRef]
- Brun, H.; Chèvre, A.-M.; Fitt, B.D.; Powers, S.; Besnard, A.-L.; Ermel, M.; Huteau, V.; Marquer, B.; Eber, F.; Renard, M.; et al. Quantitative resistance increases the durability of qualitative resistance to Leptosphaeria maculans in Brassica napus. New Phytol. 2010, 185, 285–299. [Google Scholar] [CrossRef] [PubMed]
- Raman, H.; Raman, R.; Diffey, S.; Qiu, Y.; McVittie, B.; Barbulescu, D.M.; Salisbury, P.A.; Marcroft, S.; Delourme, R. Stable quantitative resistance loci to blackleg disease in canola (Brassica napus L.) over continents. Front Plant Sci. 2018, 9, 1622. [Google Scholar] [CrossRef]
- Kumar, V.; Paillard, S.; Fopa-Fomeju, B.; Falentin, C.; Deniot, G.; Baron, C.; Vallee, P.; Manzanares-Dauleux, M.J.; Delourme, R. Multi-year linkage and association mapping confirm the high number of genomic regions involved in oilseed rape quantitative resistance to blackleg. Theor. Appl. Genet. 2018, 131, 1627–1643. [Google Scholar] [CrossRef] [PubMed]
- Van de Wouw, A.P.; Marcroft, S.J.; Ware, A.; Lindbeck, K.; Khangura, R.; Howlett, B.J. Breakdown of resistance to the fungal disease, blackleg, is averted in commercial canola (Brassica napus) crops in Australia. Field Crops Res. 2014, 166, 144–151. [Google Scholar] [CrossRef]
- Pietravalle, S.; Lemarié, S.; van den Bosch, F. Durability of resistance and cost of virulence. Eur. J. Plant Pathol. 2006, 114, 107–116. [Google Scholar] [CrossRef]
- Jedryczka, M.; Burzyński, A.; Brachaczek, A.; Langwiński, W.; Song, P.; Kaczmarek, J. Loop-mediated Isothermal Amplification as a good tool to study changing Leptosphaeria populations in oilseed rape plants and air samples. Acta Agrobot. 2014, 67, 93–100. [Google Scholar] [CrossRef][Green Version]
- Frąc, M. Mycological evaluation of dairy sewage sludge and its influence on functional diversity of soil microorganisms. Acta Agrophysica Monogr. 2012, 1, 152. [Google Scholar]
- Oszust, K.; Panek, J.; Pertile, G.; Siczek, A.; Oleszek, M.; Frac, M. Metabolic and genetic properties of Petriella setifera precultured on waste. Front. Microb. 2018, 9, 115. [Google Scholar] [CrossRef]
- Jeszka-Skowron, M.; Oszust, K.; Zgoła-Grzeskowiak, A.; Frąc, M. Quality assessment of goji fruits, cranberries, and raisins using selected markers. Eur. Food Res. Technol. 2018, 244, 2159–2168. [Google Scholar] [CrossRef]
- Atanasova, L.; Druzhinina, I.S. Review: Global nutrient profiling by Phenotype MicroArrays: A tool complementing genomic and proteomic studies in conidial fungi. J. Zhejiang Univ. Sci. B 2010, 11, 151–168. [Google Scholar] [CrossRef] [PubMed]
- Pawlik, A.; Ruminowicz-Stefaniuk, M.; Frąc, M.; Mazur, A.; Wielbo, J.; Janusz, G. The wood decay fungus Cerrena unicolor adjusts its metabolism to grow on various types of wood and light conditions. PLoS ONE 2019, 14, e0211744. [Google Scholar] [CrossRef]
- Oszust, K.; Cybulska, J.; Frąc, M. How do Trichoderma genus fungi win a nutritional competition battle against soft fruit pathogens? A Report on niche overlap nutritional potentiates. Int. J. Mol. Sci. 2020, 21, 4235. [Google Scholar] [CrossRef] [PubMed]
- Pinzari, F.; Ceci, A.; Abu-Samra, N.; Canfora, L.; Maggi, O.; Persiani, A. Phenotype MicroArray system in the study of fungal functional diversity and catabolic versatility. Res. Microb. 2016, 167, 710–722. [Google Scholar] [CrossRef]
- Pinzari, F.; Maggi, O.; Lunghini, D.; Di Lonardo, D.P.; Persiani, A.M. A simple method for measuring fungal metabolic quotient and comparing carbon use efficiency of different isolates: Application to Mediterranean leaf litter fungi. Plant Biol. 2017, 151, 371–376. [Google Scholar] [CrossRef][Green Version]
- Ward, J.H. Hierarchical groupings to optimize an objective function. J. Am. Stat. Assoc. 1963, 58, 236–244. [Google Scholar] [CrossRef]
- Sneath, P.H.A.; Sokal, R.R. Numerical Taxonomy: The Principles and Practice of Numerical Classification, 1st ed.; W.H. Freeman & Co.: San Francisco, CA, USA, 1973. [Google Scholar]
Publisher’s Note: MDPI stays neutral with regard to jurisdictional claims in published maps and institutional affiliations. |
© 2022 by the authors. Licensee MDPI, Basel, Switzerland. This article is an open access article distributed under the terms and conditions of the Creative Commons Attribution (CC BY) license (https://creativecommons.org/licenses/by/4.0/).