Article

Phenotypic and Phylogenetic Characterization of Cu Homeostasis among Xylella fastidiosa Strains

1
Department of Entomology and Plant Pathology, Auburn University, Auburn, AL 36849, USA
2
Department of Biological Sciences, Auburn University, Auburn, AL 36849, USA
*
Author to whom correspondence should be addressed.
Pathogens 2021, 10(4), 495; https://doi.org/10.3390/pathogens10040495
Submission received: 30 March 2021 / Revised: 16 April 2021 / Accepted: 18 April 2021 / Published: 20 April 2021

Abstract

:
Xylella fastidiosa is a bacterial pathogen causing severe diseases and asymptomatic colonization in more than 600 plants worldwide. Copper (Cu) is a widely used antimicrobial treatment for various plant diseases, including those affecting X. fastidiosa hosts. Cu homeostasis among X. fastidiosa strains from different geographical locations and host species has not been characterized. Here, we assessed minimum inhibitory concentration (MIC) of Cu for 54 X. fastidiosa strains. We observed strain-level variation in MIC values within each subspecies. We hypothesized that these differences could be explained by sequence variation in Cu homeostasis genes. Phylogenies based on copA, copB, copL, and cutC were created using 74 genomes (including 43 strains used in vitro) of X. fastidiosa, showing that the phylogenetic clustering of Cu homeostasis associated with clustering was based on core genome phylogenies, rather than on pattern of MIC. No association was found among Cu MIC, subspecies classification, and host and location of isolation, probably due to uneven and limited group of strains whose genomes are available. Further analysis focused on a subgroup of isolates from Georgia’s vineyards that shared similar Cu-related phenotypes. Further research is needed to better understand the distribution of Cu homeostasis for this pathogen.

1. Introduction

Xylella fastidiosa, a gram-negative bacterial pathogen, can colonize and infect ~600 different host species, including agricultural crops, landscape trees, and weeds [1,2]. The pathogen has a wide geographical distribution; it has been reported in many countries such as the U.S., Brazil, Italy, and Spain, among others [3,4,5,6]. The spread of X. fastidiosa causes great damage to agricultural production and has a significant economic impact. Just in California (CA, U.S.), it results in the grape industry losses higher than $100 million every year [7]. The spread of X. fastidiosa in Europe would lead to future economic impact in the billions of Euros [8]. A study of X. fastidiosa isolates from different locations in CA suggested the importance of environmental factors on the adaption of the pathogen [9]. Xylella fastidiosa colonizes plants living in environments with history of Cu-based antimicrobial compounds application, like those used in vineyards and orchards [10,11,12]. Although X. fastidiosa, which lives in xylem vessels of host plants, is not directly in contact with these Cu-based antimicrobials, external treatment with Cu antimicrobials can result in increased Cu levels in the soil and therefore in the xylem. Moreover, X. fastidiosa virulence is influenced by the level of Cu inside the host plant [12].
Research in Xanthomonas spp. isolated from 12 different countries showed that Cu resistant strains were not distributed evenly in these locations [13]. Cu resistance developed in some strains of Xanthomonas spp. in relation to frequent sprays of Cu-based bactericides as well as horizontal transfer of Cu resistance genes [13,14]. A An important difference between Xanthomonas spp. and X. fastidiosa is that the homologues of Cu-related genes (copA, copB, copL, and cutC) are only found in the chromosome of X. fastidiosa and not in plasmids [15]. Since these genes are closely related to Cu homeostasis genes in Xanthomonas, these were classified as Cu homeostasis genes rather than Cu resistance genes [15,16]. Previous results from our group showed that these Cu homeostasis genes in X. fastidiosa played a key role in withstanding Cu stress under different conditions and influenced in planta virulence [12,15].
Based on these preliminary observations, we sought to determine whether there is an association between Cu homeostasis ability of X. fastidiosa isolates and their phylogenetic relationships, subspecies classification, geographical location, or host species. In this study, this question was investigated by assessing the Cu minimum inhibitory concentration (MIC) of X. fastidiosa strains and discussing the relationships between phylogeny of four Cu-related genes as well as geographical locations and host species of strains. Lastly, these relationships were studied in a small group of X. fastidiosa strains isolated form Georgia’s vineyards.

2. Results and Discussion

2.1. Cu Homeostasis Ability (Cu MIC) of X. fastidiosa Strains

The in vitro MIC of CuSO4 of X. fastidiosa was used as numerical estimator of Cu tolerance among X. fastidiosa strains. In total, 54 strains of X. fastidiosa from 4 different subspecies were used in this study. To compare strains from different subspecies, these strains were grown and treated under the same conditions with increments of 150 to 900 µM CuSO4. In general, the range of Cu MIC were between 250 to 450 µM for strains of X. fastidiosa subsp. fastidiosa, and between 100 to 350 µM for strains of X. fastidiosa subsp. multiplex (Figure 1A). Due to quarantine restrictions in the US, only one strain from X. fastidiosa subsp. pauca was available for our studies. The Cu MIC of X. fastidiosa subsp. pauca strain De Donno was 350 µM. The Cu MIC of X. fastidiosa subsp. sandyi strain MED PRI 047 and Ann-1 were 400 and 800 µM, respectively. Among subspecies, differences among strains were evident (Figure 1A). For instance, in X. fastidiosa subsp. fastidiosa strains M23 and TemeculaL were significantly higher than other strains from the same subspecies. Strain Oak 92-6 with Cu MIC of 100 µM is significantly lower than other stains from X. fastidiosa subsp. multiplex. Cu MIC of strain Ann-1 from X. fastidiosa subsp. sandyi was higher compared with the other strains. The Cu MIC values of X. fastidiosa strains were found to be clustered in several groups, as shown in the dendrogram (Figure 1B). In general, strains could be divided into three big clusters related to low, medium, and high Cu MIC. The strains in low and medium Cu MIC cluster were all from subsp. fastidiosa and subsp. multiplex. Notably, these clusters were composed of strains from different subspecies, and no association between subspecies and MIC was detected here.

2.2. Phylogenetical Relationships of Cu-Related Genes copA, copB, copL, and cutC Follows X. fastidiosa Subspecies Classification and Was Not Related with Cu MIC

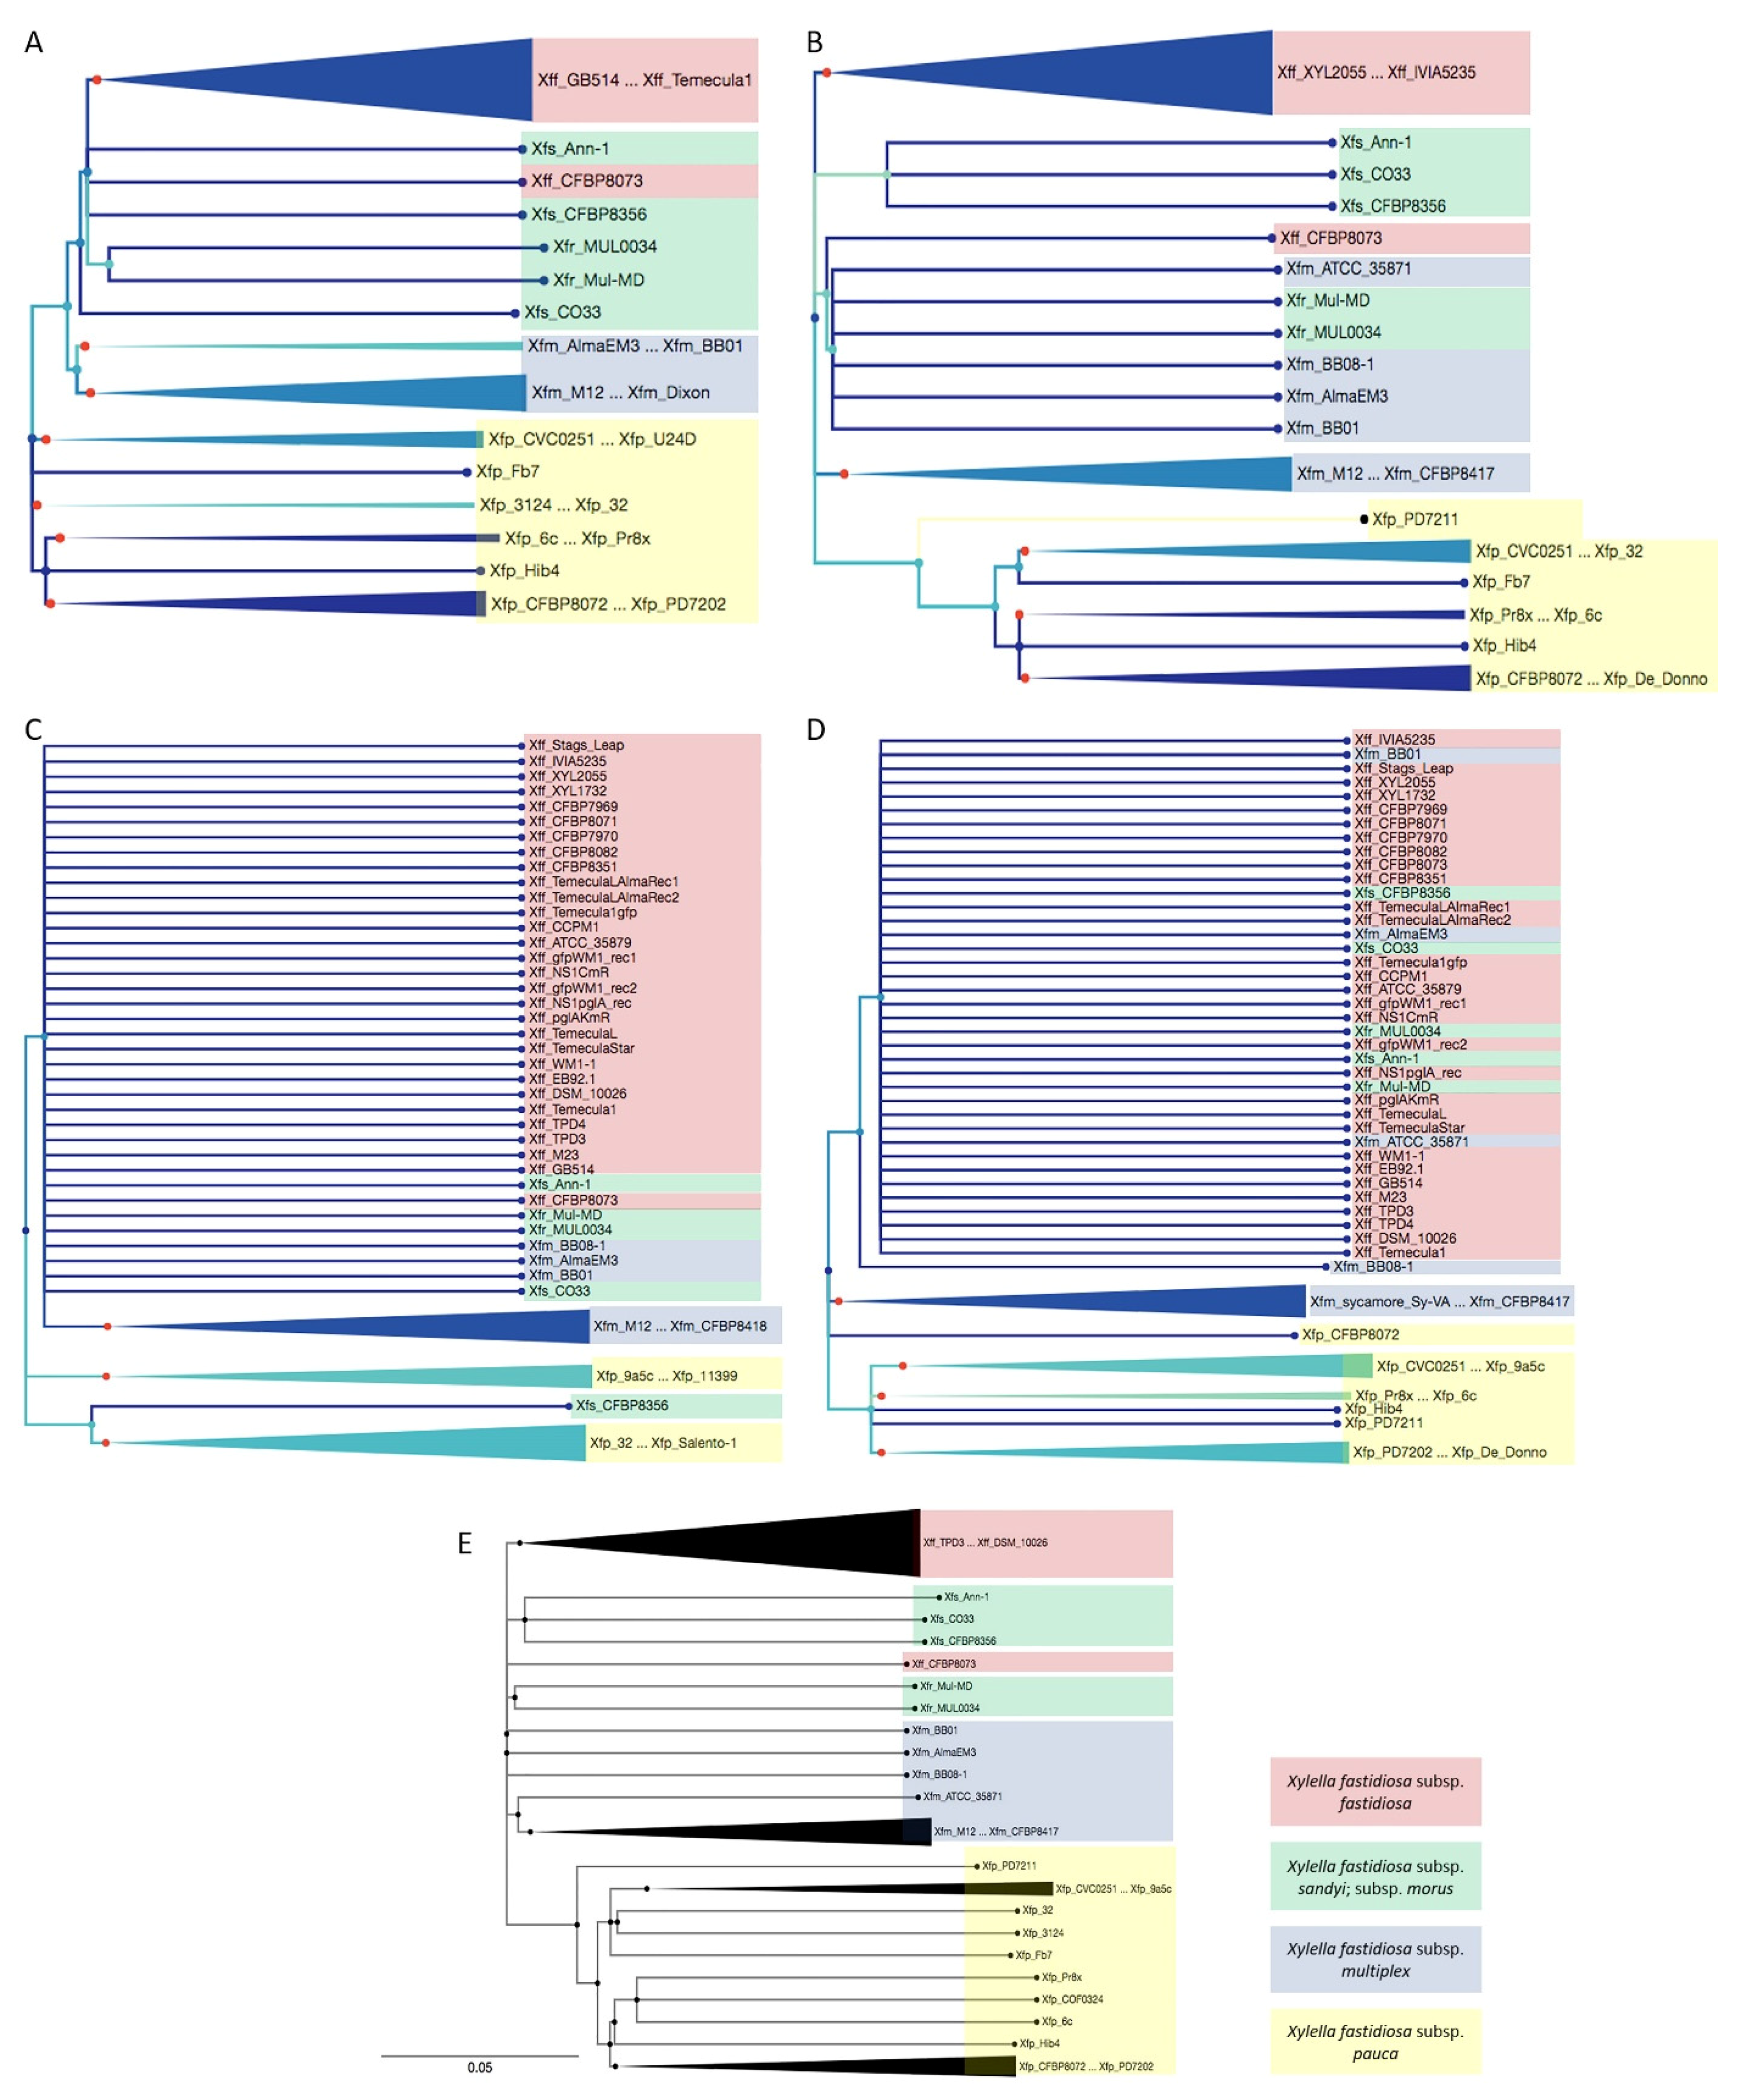
To understand the difference in Cu MIC among X. fastidiosa strains, we completed a phylogenetic analysis of the Cu-related genes (copA, copB, copL, and cutC) to assess differences at the gene sequence level among X. fastidiosa strains. The Cu-related genes (copA, copB, copL and cutC) were identified from genomes of 74 X. fastidiosa strains using nucleotide BLAST based on the annotated genes from type strain Temecula1. Phylogenetic trees were made by using the maximum-likelihood method [17] (Figure 2).
Overall, high DNA sequence identity of the Cu-related genes was identified among strains, with above 95% for copA, copL, and cutC; and above 90% for copB. This result was similar to that observed in Xanthomonas spp. with >90% DNA sequence identity in Cu resistance genes copL, copA, and copB [13]. Phylogenetic analysis highlighted the slight differences among the sequences of these genes among strains and separated them in different groups. The sequences for copL were highly conserved among the strains with the majority of sequence present in a polytomy. This conservation may suggest a tight homeostatic regulation of Cu across populations of X. fastidiosa. A previous study of homologues of copL in Xanthomonas spp., a gene related with transcriptional and translational regulation of copAB operon, also highlighted the expected conservation of copL in these related pathogens [18]. The sequences for cutC were also highly conserved among the isolates. copA and copB were less conserved compared with copL and cutC. The phylogeny analysis was also carried with copLAB genes concatenated together (Figure 2), which showed similar tree topology as phylogenetic trees for copA and copB genes. The phylogenetical relationships of these genes followed the X. fastidiosa subspecies classification with few exceptions.
To be more specific, similar grouping and cluster patterns of phylogenetic trees were found between copA and copB, copL and cutC. In copL and cutC phylogenetic trees, the strains from X. fastidiosa subsp. sandyi (Xfs), X. fastidiosa subsp. multiplex (Xfm), and X. fastidiosa subsp. morus (Xfr) were mixed with X. fastidiosa subsp. fastidiosa (Xff). However, the genes from these strains were closely related with Xff but separated in different clusters in copA and copB phylogenetic trees. Interestingly, an exception was the copL gene of Xfs strain CFBP8356 that was closely related to X. fastidiosa subsp. pauca (Xfp) instead of the other Xfs strains (Figure 2C); the other three genes analyzed of this strain were grouped with Xfs. However, when comparing Cu MIC values of the tested strains and their phylogeny here, it was noticed that strains within the same group did not follow the same clustering based on Cu MIC value (Figure 1B). For instance, strains TemeculaL, CCPM1, and EB92-1 were in the same group in all the phylogenetic trees, while, they had Cu MIC at 450, 400, and 350, respectively, which were not in the same cluster (Figure 1B). The Cu MIC value of Xfs strain CFBP8356, which was noticed for its special phylogenetic grouping, was not tested in this study as the strain was not available. Studies in Xanthomonas spp. showed that the phylogenetic analysis of Cu-resistant strains revealed a geographic-based grouping pattern [13]. Although X. fastidiosa is genetically closely related with Xanthomonas spp., the differentials of living environment and virulence characteristics may be responsible for the lack of unique phylogenetic groupings based on their Cu-related genes. The differences in Cu MIC values of X. fastidiosa strains could not be explained by the Cu-related genes phylogeny.
The sequence variation alone could not explain the difference in Cu MIC so we analyzed selection pressure and codon adaption index (CAI) assessment of the Cu-related genes. Datamonkey.org was used in this study to assess the strength of selection pressure on copA and copB, copL, and cutC genes. The rate of non-synonymous substitution (dN) and random synonymous substitution (dS) were assessed in each gene. Positive selection (dN/dS > 1) increases the diversity and fitness of genes in response to environmental pressure, while negative selection (dN/dS < 1) removes and purifies these changes [19]. The results of the analysis showed that when p-value threshold was set at 0.05, copA had one codon site (site 429) under significant positive selection, and 14 sites under significant negative selection. There were 10, 2, and 3 sites under significant negative selection in copB gene, copL gene and cutC gene, respectively, while none of them had any significant positive selected site (Table 1). Analysis results showed that the four genes were under negative selection, as there were more random synonymous substitutions (dS) than non-synonymous substitutions (dN) [19,20]. Negative selection can happen more often in functionally important genes to avoid changing the essential functions by non-synonymous substitution [21]. Therefore, the copA and copB, copL, and cutC genes that had lower dN/dS ratios and are undergoing purifying selection are believed to serve important roles in X. fastidiosa. CAI assessment is positively associated to gene expression level and therefore, we analyzed the four Cu-related genes by comparing their codon usage frequency with codon usage frequency of the reference gene [22,23,24]. Tu gene, which is highly expressed across many bacteria and unicellular eukaryotes, was used as the reference gene in this study [23,24]. Gene with CAI value higher than that of Tu gene was considered as being highly expressed [23]. CAI assessment results (Figure S1) of copA and copB, copL, and cutC genes showed that copA gene displayed slightly but significantly higher CAI value compared with Tu gene, which was considered a highly expressed gene. However, the other three genes had significantly lower CAI values compared with the reference gene. The higher CAI value of copA than the other three genes were consistent with the results of selection pressure analysis of the four genes, in which copA has more synonymous substitutions than the other three genes. The results of selection pressure analysis and CAI assessment indicated that copA and copB, copL, and cutC genes were functionally important for X. fastidiosa. However, there was no evidence indicating that the differences in gene level was associated with the difference of Cu homeostasis ability among different subspecies.

2.3. Cu MIC of X. fastidiosa Strains Is Not Significantly Associated with Subspecies, Host, or Location

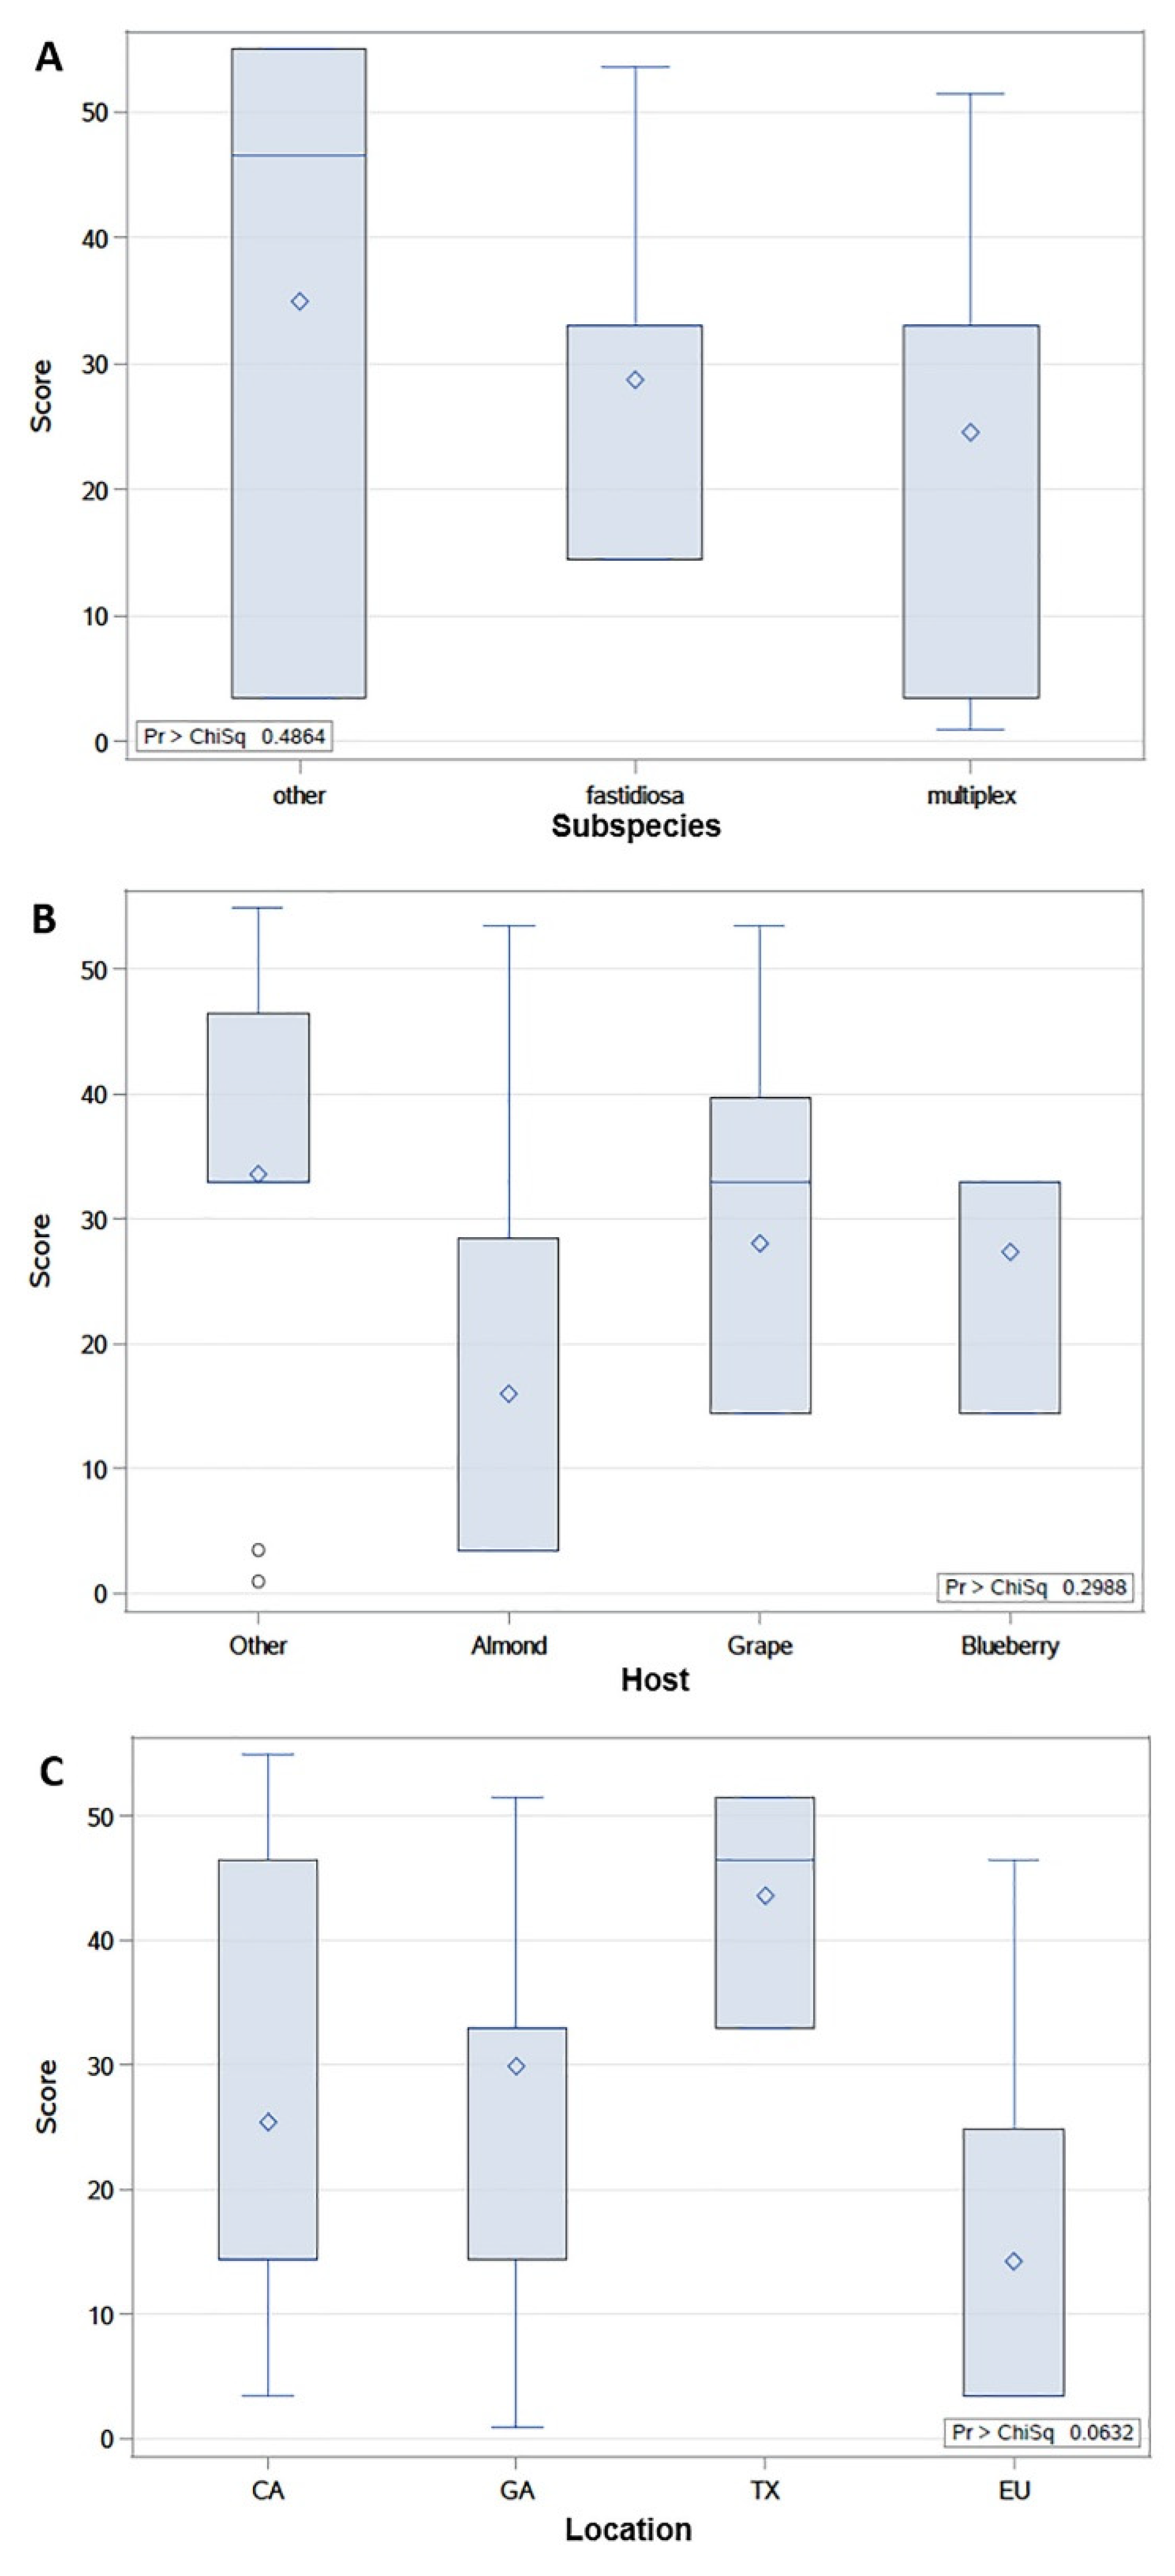
Although differences among Cu MIC in X. fastidiosa strains were not associated with phylogeny of Cu-related genes, their relationship with subspecies, host type, and geographical location were examined to understand if there were associations among them. Cu MIC values of X. fastidiosa strains were grouped based on their classification and origin (subspecies, host, or location). Strains with similar subspecies, host, or geographical origin were combined in the same group whenever few strains were available with the same characteristics. The differences of Cu MIC values distributions among each group, measured by scores from Wilcoxon tests, were used in this study to indicate if the grouping-based characteristic was associated with the Cu MIC value of X. fastidiosa strains. The results showed that Cu MIC in X. fastidiosa strains was not markedly different amongst subspecies, the mean rank scores from the test of the Cu MIC data in others (subsp. pauca and subsp. sandyi), subsp. fastidiosa and subsp. multiplex were 35, 28, and 24, respectively (Figure 3A). Mean rank scores were different in subspecies groups; however, there was no statistical difference (p = 0.48) (Figure 3A). Therefore, the distribution of Cu MIC in each group of subspecies of X. fastidiosa was not significantly differentiated from each other, which indicated that the subspecies classification of X. fastidiosa strains was not significantly associated with Cu MIC. Furthermore, the relationship between Cu MIC and X. fastidiosa strains features, including host and location, were studied (strains information is listed in Table S1). Based on the results of Wilcoxon test, similar conclusions could be drawn; different mean rank scores were found among the host and location groups (Figure 3B,C). However, in both cases, p-values were higher than 0.05; therefore, no significant differences were found. Host or location of X. fastidiosa strains was not significantly associated with Cu MIC.
Based on the results of the 54 strains tested in this study, no significant association was found between their Cu MIC and their features, including subspecies, host, or location. However, the limitation in this study was that the sample size in each group was uneven, due to the limited availability of X. fastidiosa strains from different groups. It is still possible that some relationships exist between the Cu homeostasis and isolates characteristics that could be revealed with a more comprehensive study. Previous research in Xanthomonas spp. indicated a possible location-based distribution pattern of Cu resistance strains, which might be a consequence of the application of Cu-based compounds and horizontal transfer of Cu resistance genes [13,14]. In addition, Cu contained in agricultural soil was believed to be positively associated with environmental antibiotic resistances [25,26]. Environmental Cu accumulation also could trigger the evolution of Cu resistance genes in pathogens [27]. Therefore, the soil Cu content in a region could be a dominant feature that influences Cu homeostasis of X. fastidiosa isolated from that region as well as the agriculture practices in use in different settings. However, lacking such information at the vineyard/farm level could be an obstacle to reveal patterns of Cu homeostasis among different X. fastidiosa strains.

2.4. X. fastidiosa Isolates from Georgia’s Vineyards Have Similar Responses of Cu Accumulation and Biofilm Formation under Cu Treatment

Although the above results did not indicate a significant association between Cu homeostasis ability and strains features, a further investigation on a smaller group of X. fastidiosa strains were carried out. X. fastidiosa isolated from grapevines grown in vineyards in the same county in Georgia (GA, USA) were selected to be studied. Copper levels in the isolates with or without Cu-amended treatments was assessed. X. fastidiosa type strain TemeculaL (isolated from grapevines in California) was used as a control. The isolates and the control strain were grown in Pierce’s Disease 2 (PD2) media, and PD2 media amended with 50 µM CuSO4. Cu accumulation in cells of each isolate was measured by Inductively Coupled Plasma with Optical Emission Spectroscopy (ICP-OES). Results (Figure 4A) indicated that most of the isolates from GA had slightly higher Cu accumulation in cells than TemeculaL, with two isolates (14B7 and 16B4) showing statistically significant differences (p < 0.05), compared with control strain when grown in PD2 media. The difference between the isolates and control strain was more pronounced under Cu-amended conditions. Cu accumulation in cells of the isolates were higher than that of control, with four isolates significantly different (p < 0.05) (Figure 4B). Overall, the isolates from Georgia’s vineyards accumulated more Cu than control strain both under normal condition (PD2 media) and Cu-amended condition (PD2 amended with 50 µM CuSO4). However, there were some exceptions; for example, WM1-1 had lower or similar Cu content in cells as control strain under the same conditions. WM1-1 [28] was isolated from the same region as the other GA isolates used here, but a few years earlier. Perhaps cultivation under laboratory conditions for several years could be a factor for leading this difference. Another possible reason could be the difference of antimicrobials and management methods used in vineyards, as WM1-1 was from Wolf Mountain Vineyard, and the others were from Blackstock Vineyard and Montaluce Vineyard.
When considering the Cu MIC results of the GA isolates (Figure 1), most of the isolates had Cu MIC ranging from 250 to 300 µM. Only 3 isolates with Cu MIC value were equal to 350 µM and 1 isolate Cu MIC was 400 µM. However, the Cu MIC of the control strain was 450 µM. Generally, the isolates from Georgia’s vineyards were more sensitive to Cu than control strain TemeculaL. The results of Cu accumulation and Cu MIC are consistent with each other, since more Cu accumulation in cells lead to a build-up of toxicity, and lower Cu MIC for the isolates. Moreover, TemeculaL comes from vineyards with longer history in CA, while vineyards in GA are newer. It is worth noticing that TemeculaL has been used in culture under laboratory conditions for many years, while strains from GA are not. Researchers have previously shown that Cu content in vine and soil are closely related with the age of vineyards [29,30]. It is possible that GA isolates were less exposed to Cu compared with TemeculaL, which makes them more sensitive to Cu. There are clear genomic difference and grouping between whole genomes of CA and GA isolates [31]. However, there was no significant differences between CA and GA isolates in the four Cu-related genes discussed in this study (Figure S2). Even though the CA and GA isolates had slightly difference in the phenotype of Cu MIC, it was not clearly associated with copA, copB, copL, and cutC genes phylogeny.
Biofilm formation is one of the key virulence factors of X. fastidiosa [32]. Therefore, biofilm formation of X. fastidiosa isolates from Georgia’s vineyards under Cu treatment was investigated. Biofilm formation of the isolates under PD2 and PD2 amended with 50 µM CuSO4 conditions were analyzed and compared with control strain TemeculaL (Figure 5). Most of the isolates had higher biofilm/total cells ratios when grown in PD2 media, except for isolates M2, 14B2, and 14B3, which had lower biofilm/total cells ratio. When grown in Cu-amended media, increase of biofilm/total cells ratios was observed in all the isolates, with 4 isolates showing significant increase (p < 0.05). 14B3 showed significantly lower biofilm/total cells ratio compared with other isolates and the control strain, even under the Cu-amended condition. However, isolate 14B3 was not significantly different from other strains in Cu MIC assessment or in the assessment of Cu accumulation in cells. The reason for its low biofilm/total cells ratio in all the tested conditions may not be related to Cu homeostasis, as it has the same response to Cu amendments as the other isolates. The results showed that Cu was able to not only induce biofilm cell growth (as shown in previous research [33]), but more importantly also increase the proportions of biofilm cells in comparison to total cells, which potentially increased X. fastidiosa in planta fitness and virulence [32,34]. Meanwhile, the overall increase of biofilm/total cells ratio may be related to the metabolic consequences of increased Cu accumulation in cells under the Cu-amended condition.

3. Materials and Methods

3.1. Cu MIC Measurements

Cu MIC measurements, considered here as the Cu concentration inhibiting 90% of growth or MIC90, were performed following protocols described in previous publications [35,36], with some modifications. Bacterial isolates and strains were streaked onto Periwinkle Wilt (PW) agar plates from -80 ℃ frozen glycerol (20%) stocks. After 5–7 days of first streaking, bacteria were re-streaked onto a new PW agar plate for another 5–7 days. After the second streaking, these bacterial cells were ready to use for later experiments. Bacterial cells were scraped from PW agar plates and suspended into PD2 liquid media. The optical density (OD600nm) of bacterial suspensions were adjusted to 0.2 for later use. 190 µL PD2 media or PD2 media amended with different concentrations of CuSO4 (0 µM, 150 µM, 200 µM, 250 µM, 300 µM, 350 µM, 400 µM, 450 µM, 500 µM, 600 µM, 700 µM, 800 µM, 900 µM) and 10 µL bacterial suspensions (OD600nm = 0.2) were added to each well of 96-well plate. The final concentration of bacteria in each well was OD600nm = 0.01. Bacteria cultured in 96-wells plates were incubated with 140 rpm shaking condition at 28 ℃. After 7-days incubation, 150 µl of bacterial culture was transferred to a new 96-wells plate, and OD600nm was measured for planktonic growth calculations. For biofilm growth measurements, original plates were rinsed with Milli-Q water twice to remove planktonic cells. Then, 230 μL of 0.1% crystal violet was added to each well and incubated at room temperature for 20 min with frequent shaking. After that, crystal violet was removed carefully from each well with pipettes. Plates were rinsed with Milli-Q water 2 to 3 times. Finally, each well was filled with 230 μL 95% ethanol and incubated for 5 to 10 min. OD600nm values were measured to calculate biofilm formation. All the procedures of adding and removing liquid were performed under gentle and carefully pipetting, to minimize the loss of biofilm cells. The minimal Cu concentration that significantly (p < 0.05) decreased 90% of total bacterial growth (total growth = planktonic growth + biofilm growth) was selected as Cu MIC. Dendrogram of Cu MIC showing the results of 54 X. fastidiosa strains after a hierarchical clustering analysis of Cu MIC values was carried with R 3.6.2 (Rstudio 1.1.442, Boston, MA, USA) using between-group linkage via Ward’s hierarchical clustering.

3.2. Phylogenetic Analysis

Phylogenetic trees were constructed using Molecular Evolutionary Genetics Analysis version 7.0 (MEGA7) software (Kumar, Stecher, and Tamura, PSU, PA, USA). Whole genomes of each isolate and strain were obtained from sequence results of our lab or Almeida’s lab [31], or from the National Center for Biotechnology Information (NCBI) database (Table S2). Then, the target gene sequences for each isolate were selected by blasting whole genomes with corresponding genes from Temecula1 by using Basic Local Alignment Search Tool for Nucleotides (BLASTN). After that, partial nucleotide sequences of Cu-related gene copL (PD0099), copA (PD0100), copB (PD0101), and cutC (PD0586) were aligned by default settings of MUSCLE in MEGA7. The alignments were assembled into a maximum-likelihood tree with 1000 bootstraps. The bootstrap values, as percentage out of 1000 replicates that the associated strains were clustered together in the bootstrap test, are shown next to the branches (Figure S3). Branches with bootstrap values below 70% were collapsed. Phylogenetic trees were further adjusted in Phylo.io (www.Phylo.io accessed 20 June 2020) to make it easier to view [17]. Branches were collapsed when all the strains in a cluster belong to the same subspecies.

3.3. Selective Pressure Analysis and Expression Prediction

To assess if copL, copA, copB, and cutC genes were under selective pressure, analysis were carried in Datamonkey adaptive evolution server (www.Datamonkey.org accessed on 19 August 2020) [20]. Alignment of each gene was obtained by using the default settings of MUSCLE in MEGA7. Stop codons in the alignment of each gene were removed as required by the instructions of the software [19]. Alignments were uploaded to the website as meg format. Selective pressure analysis of the genes was carried by the fixed effects likelihood (FEL) method with default settings. Positive (diversifying) selection for each codon was considered as non-synonymous substitution (dN) > random synonymous substitution (dS) (dN/dS > 1); while negative (purifying) selection was considered when dN < dS (dN/dS < 1), with p value < 0.05 [19]. Gene expression was predicted by CAI (codon adaption index) calculation, carried by CAIcal (www.ppuigbo.me/programs/CAIcal accessed on 15 September 2020) [23,37,38]. The Tu gene, an elongation factor gene that is highly expressed in many organisms, was used as the reference gene [24]. CAI value higher than the Tu gene was considered as a high gene expression level.

3.4. Cu Accumulation in Cells

Cu content in bacterial cells after Cu-amended treatments were measured by ICP-OES (Perkin Elmer 7100 DV, Waltham, MA, USA) as previously described [12,33], with some modifications. Bacteria were grown in 5 mL PD2 media or PD2 media amended with 50 μM CuSO4, with initial OD600nm equal to 0.01. Bacterial cells were collected after 7-day incubation and washed twice in Milli-Q water to remove media. In each tube, 100 μL of mineral-free concentrated nitric acid (OPTIMA, Fisher Scientific, Waltham, MA, USA) were added in each sample for digestion. The digestion was processed under 100 °C heat treatment for one hour. Later, samples were diluted with 200 μL Milli-Q water. The analysis was carried by ICP-OES with simultaneous measurement of Ca, Fe, Cu, Zn, Mn, S, Mg, K, Na, and P. Concentrations of mineral elements in each sample were determined by comparing emission intensities to certified standards curves (SPEXCertiprep, Metuchen, NJ, USA), which was confirmed by the reanalysis of standard solutions diluted in a matrix equivalent to the sample [12,33]. Two repetitions of individual readings (each individual reading is average of two intensity measurements) showed less than 5% variation.

3.5. Biofilm/Total Cells Ratio

Biofilm/total cells ratio was calculated using the sulfur (S) concentration obtained by ICP-OES as follows: S concentration in biofilm cells/S concentration total cells. Bacteria were prepared and cultured as described above for measurements of Cu accumulation. After 7-day incubation under PD2 media or PD2 media amended with 50 μM CuSO4, biofilm and planktonic cells were carefully separated with pipetting and collected by centrifugation. Cells were washed with Milli-Q water to remove media and measured by ICP-OES under the same conditions. The S content in cells was linearly associated with the cell number, and was used as an indicator of cell numbers [33]. Therefore, here biofilm/total cells ratio was represented by S content in biofilm cells/total cells.

3.6. Association Tests

To understand the relationship between Cu MIC values of X. fastidiosa strains (quantitative variables) and strains characteristics (qualitative variables), including subspecies, location and host, commonly used correlation tests were not applied since they require quantitative variables. In here, the association between Cu MIC values of X. fastidiosa strains and strains characteristics were performed by comparing the Cu MIC data distributions in each variable groups (comparisons happened when only one characteristic variable at a time). Scores from Wilcoxon test indicated the degree of the difference of Cu MIC data distribution among each variable groups. If scores were significantly different between groups, it means the grouping-based characteristic could be the factor that influences the distribution of Cu MIC values in the groups, which suggests the characteristic was associated with Cu MIC values of strains. p value (Pr > ChiSq) < 0.05 was considered as a threshold for statistical significance by Kruskal-Wallis test (nonparametric ANOVA). These analyses were carried by SAS 9.4 (SAS Institute, Inc., Cary, NC, USA). The Cu MIC value of strains were grouped based on their characteristics, and the groups with small samples size were combined. Strains were grouped based on subspecies: fastidiosa (X. fastidiosa subsp. fastidiosa), multiplex (X. fastidiosa subsp. multiplex), and other (X. fastidiosa subsp. pauca and X. fastidiosa subsp. sandyi); based on host: grape, blueberry, almond, and other (olive, oleander, elderberry, plum, giant ragweed, sunflower and oak); based on location: CA (California), GA (Georgia and Florida), TX (Texas) and EU (Spain and Italy).

4. Conclusions

In this study, Cu homeostasis in vitro (MIC) of a collection of 54 X. fastidiosa strains was found to not be related with either the strain geographic or plant host origin of isolation, or their phylogenetic relationships. Although no clear tendencies were found among these strains, the study of Cu-related characteristics on a small sub-group of X. fastidiosa isolates from Georgia indicated a possible connection between Cu homeostasis ability and their Cu-related phenotypes. The X. fastidiosa isolates, obtained from the similar host (grapevine varieties) and the similar locations (vineyards in Dahlonega, Georgia), mostly responded similarly to Cu amendments. These isolates had higher Cu accumulation in cells and lower Cu MIC than the control strain (TemeculaL). Based on the preliminary data from this study, the variability in Cu homeostasis ability is not explained by either phylogeny, subspecies, location, or host of X. fastidiosa strains. Limited and uneven sample size of each feature group, due to limited availability of X. fastidiosa strains, might have been a problem to answer our questions. Further research with more strains could help us better understand the importance of Cu homeostasis ability to the X. fastidiosa strains from different geographic locations or host species. This will help understand the adaptation of X. fastidiosa to different environments and provide novel ideas for worldwide X. fastidiosa control and its disease management.

Supplementary Materials

The following are available online at https://www.mdpi.com/article/10.3390/pathogens10040495/s1, Figure S1: Range of CAI of copA, copB, copL, and cutC genes, Figure S2: Phylogenetic trees of copA, copB, copL, and cutC genes from the strains used for Cu MIC assessment in vitro, Figure S3: Phylogenetic trees of copA, copB, copL, and cutC genes. Table S1: Information of X. fastidiosa isolates and strains for Cu MIC assessment, Table S2: Information of X. fastidiosa isolates and strains for phylogeny.

Author Contributions

Conceptualization, Q.G. and L.D.L.F.; methodology, Q.G. and P.A.C.; software, Q.G. and N.P.; validation, Q.G. and R.L.; formal analysis, Q.G.; resources, L.D.L.F.; data curation, Q.G.; writing—original draft preparation, Q.G.; writing—review and editing, Q.G., R.L., P.A.C., N.P. and L.D.L.F.; visualization, Q.G.; supervision, L.D.L.F.; project administration, L.D.L.F.; funding acquisition, L.D.L.F. All authors have read and agreed to the published version of the manuscript.

Funding

This work was funded by California Department of Food and Agriculture (CDFA), Pierce’s disease, glassy winged sharpshooter (PD/GWSS) program, Auburn University Internal Grant Program (P.C. and L.D.), Alabama Agricultural Experiment Station (AAES) (P.C., N.P. and L.D.), and China Scholarship Council (CSC) awarded to Q.G.

Data Availability Statement

Data is contained within the article or supplementary material.

Conflicts of Interest

The funders had no role in the design of the study; in the collection, analyses, or interpretation of data; in the writing of the manuscript, or in the decision to publish the results.

References

  1. EFSA. Update of the Xylella spp. host plant database–systematic literature search up to 30 June 2019. EFSA J. 2020, 18, e06114. [Google Scholar]
  2. Hopkins, D.; Purcell, A. Xylella fastidiosa: Cause of Pierce’s disease of grapevine and other emergent diseases. Plant Dis. 2002, 86, 1056–1066. [Google Scholar] [CrossRef] [Green Version]
  3. Hopkins, D. Xylella fastidiosa: Xylem-limited bacterial pathogen of plants. Annu. Rev. Phytopathol. 1989, 27, 271–290. [Google Scholar] [CrossRef]
  4. Almeida, R.P.; Nascimento, F.E.; Chau, J.; Prado, S.S.; Tsai, C.-W.; Lopes, S.A.; Lopes, J.R. Genetic structure and biology of Xylella fastidiosa strains causing disease in citrus and coffee in Brazil. Appl. Environ. Microbiol. 2008, 74, 3690–3701. [Google Scholar] [CrossRef] [Green Version]
  5. Cariddi, C.; Saponari, M.; Boscia, D.; De Stradis, A.; Loconsole, G.; Nigro, F.; Porcelli, F.; Potere, O.; Martelli, G. Isolation of a Xylella fastidiosa strain infecting olive and oleander in Apulia, Italy. J. Plant Pathol. 2014, 96, 425–429. [Google Scholar]
  6. Olmo, D.; Nieto, A.; Adrover, F.; Urbano, A.; Beidas, O.; Juan, A.; Marco-Noales, E.; López, M.M.; Navarro, I.; Monterde, A. First detection of Xylella fastidiosa infecting cherry (Prunus avium) and Polygala myrtifolia plants, in Mallorca Island, Spain. Plant Dis. 2017, 101, 1820. [Google Scholar] [CrossRef]
  7. Tumber, K.; Alston, J.; Fuller, K. Pierce’s disease costs California $104 million per year. Calif. Agric. 2014, 68, 20–29. [Google Scholar] [CrossRef]
  8. Schneider, K.; Van der Werf, W.; Cendoya, M.; Mourits, M.; Navas-Cortés, J.A.; Vicent, A.; Lansink, A.O. Impact of Xylella fastidiosa subspecies pauca in European olives. Proc. Natl. Acad. Sci. USA 2020, 117, 9250–9259. [Google Scholar] [CrossRef] [PubMed] [Green Version]
  9. Vanhove, M.; Sicard, A.; Ezennia, J.; Leviten, N.; Almeida, R.P. Population structure and adaptation of a bacterial pathogen in California grapevines. Environ. Microbiol. 2020. [Google Scholar] [CrossRef] [PubMed]
  10. Parat, C.; Chaussod, R.; Lévêque, J.; Dousset, S.; Andreux, F. The relationship between copper accumulated in vineyard calcareous soils and soil organic matter and iron. Eur. J. Soil Sci. 2002, 53, 663–670. [Google Scholar] [CrossRef]
  11. Romi, M.; Matijevi, L.; Baki, H.; Romi, D. Copper Accumulation in Vineyard Soils: Distribution, Fractionation and Bioavailability Assessment. In Environmental Risk Assessment of Soil Contamination; IntechOpen: London, UK, 2014. [Google Scholar] [CrossRef] [Green Version]
  12. Ge, Q.; Cobine, P.A.; De La Fuente, L. Copper supplementation in watering solution reaches the xylem but does not protect tobacco plants against Xylella fastidiosa infection. Plant Dis. 2020, 104, 724–730. [Google Scholar] [CrossRef]
  13. Behlau, F.; Hong, J.C.; Jones, J.B.; Graham, J.H. Evidence for acquisition of copper resistance genes from different sources in citrus-associated xanthomonads. Phytopathology 2013, 103, 409–418. [Google Scholar] [CrossRef] [Green Version]
  14. Graham, J.H.; Gottwald, T. Research perspectives on eradication of citrus bacterial diseases in Florida. Plant Dis. 1991, 75, 1193–1200. [Google Scholar] [CrossRef]
  15. Ge, Q.; Cobine, P.; De La Fuente, L. The influence of copper homeostasis genes copA and copB on Xylella fastidiosa virulence is affected by sap copper concentration. Phytopathology 2021. [Google Scholar] [CrossRef] [PubMed]
  16. Behlau, F. Risk Assessment of Copper and Streptomycin Resistance Developmentin Xanthomonas citri subsp. citri. Ph.D. Thesis, University of Florida, Gainesville, FL, USA, 2010. [Google Scholar]
  17. Robinson, O.; Dylus, D.; Dessimoz, C. Phylo.io: Interactive viewing and comparison of large phylogenetic trees on the web. Mol. Biol. Evol. 2016, 33, 2163–2166. [Google Scholar] [CrossRef] [Green Version]
  18. De Freitas, E.C.; Ucci, A.P.; Teixeira, E.C.; Pedroso, G.A.; Hilario, E.; Zocca, V.F.B.; De Paiva, G.B.; Ferreira, H.; Pedrolli, D.B.; Bertolini, M.C. The copper-inducible copAB operon in Xanthomonas citri subsp. citri is regulated at transcriptional and translational levels. Microbiology 2019, 165, 355–365. [Google Scholar]
  19. Poon, A.F.; Frost, S.D.; Pond, S.L.K. Detecting signatures of selection from DNA sequences using Datamonkey. In Bioinformatics for DNA Sequence Analysis; Springer: Berlin/Heidelberg, Germany, 2009; pp. 163–183. [Google Scholar]
  20. Delport, W.; Poon, A.F.; Frost, S.D.; Kosakovsky Pond, S.L. Datamonkey 2010: A suite of phylogenetic analysis tools for evolutionary biology. Bioinformatics 2010, 26, 2455–2457. [Google Scholar] [CrossRef] [PubMed] [Green Version]
  21. Nielsen, R. Molecular signatures of natural selection. Annu. Rev. Genet. 2005, 39, 197–218. [Google Scholar] [CrossRef] [Green Version]
  22. Zhou, M.; Guo, J.; Cha, J.; Chae, M.; Chen, S.; Barral, J.M.; Sachs, M.S.; Liu, Y. Non-optimal codon usage affects expression, structure and function of clock protein FRQ. Nature 2013, 495, 111–115. [Google Scholar] [CrossRef] [PubMed] [Green Version]
  23. Li, L.; Liu, Z.; Meng, D.; Liu, X.; Li, X.; Zhang, M.; Tao, J.; Gu, Y.; Zhong, S.; Yin, H. Comparative genomic analysis reveals the distribution, organization, and evolution of metal resistance genes in the genus Acidithiobacillus. Appl. Environ. Microbiol. 2019, 85. [Google Scholar] [CrossRef] [Green Version]
  24. Puigbo, P.; Romeu, A.; Garcia-Vallve, S. HEG-DB: A database of predicted highly expressed genes in prokaryotic complete genomes under translational selection. Nucleic Acids Res. 2007, 36, D524–D527. [Google Scholar] [CrossRef] [PubMed] [Green Version]
  25. Hu, H.W.; Wang, J.T.; Li, J.; Li, J.J.; Ma, Y.B.; Chen, D.; He, J.Z. Field-based evidence for copper contamination induced changes of antibiotic resistance in agricultural soils. Environ. Microbiol. 2016, 18, 3896–3909. [Google Scholar] [CrossRef]
  26. Kang, W.; Zhang, Y.-J.; Shi, X.; He, J.-Z.; Hu, H.-W. Short-term copper exposure as a selection pressure for antibiotic resistance and metal resistance in an agricultural soil. Environ. Sci. Pollut. Res. 2018, 25, 29314–29324. [Google Scholar] [CrossRef]
  27. Poole, K. At the nexus of antibiotics and metals: The impact of Cu and Zn on antibiotic activity and resistance. Trends Microbiol. 2017, 25, 820–832. [Google Scholar] [CrossRef] [PubMed]
  28. Parker, J.K.; Havird, J.C.; De La Fuente, L. Differentiation of Xylella fastidiosa strains via multilocus sequence analysis of environmentally mediated genes (MLSA-E). Appl. Environ. Microbiol. 2012, 78, 1385–1396. [Google Scholar] [CrossRef] [PubMed] [Green Version]
  29. Ruyters, S.; Salaets, P.; Oorts, K.; Smolders, E. Copper toxicity in soils under established vineyards in Europe: A survey. Sci. Total Environ. 2013, 443, 470–477. [Google Scholar] [CrossRef] [PubMed]
  30. Komárek, M.; Čadková, E.; Chrastný, V.; Bordas, F.; Bollinger, J.-C. Contamination of vineyard soils with fungicides: A review of environmental and toxicological aspects. Environ. Int. 2010, 36, 138–151. [Google Scholar] [CrossRef] [PubMed]
  31. Castillo, A.I.; Bojanini, I.; Chen, H.; Kandel, P.P.; De La Fuente, L.; Almeida, R.P.P. Allopatric Plant Pathogen Population Divergence following Disease Emergence. Appl. Environ. Microbiol. 2021, 87, e02095-20. [Google Scholar] [CrossRef] [PubMed]
  32. Marques, L.; Ceri, H.; Manfio, G.; Reid, D.; Olson, M. Characterization of biofilm formation by Xylella fastidiosa in vitro. Plant Dis. 2002, 86, 633–638. [Google Scholar] [CrossRef] [Green Version]
  33. Cobine, P.A.; Cruz, L.F.; Navarrete, F.; Duncan, D.; Tygart, M.; De La Fuente, L. Xylella fastidiosa differentially accumulates mineral elements in biofilm and planktonic cells. PLoS ONE 2013, 8, e54936. [Google Scholar] [CrossRef]
  34. Cruz, L.F.; Cobine, P.A.; De La Fuente, L. Calcium increases Xylella fastidiosa surface attachment, biofilm formation, and twitching motility. Appl. Environ. Microbiol. 2012, 78, 1321–1331. [Google Scholar] [CrossRef] [Green Version]
  35. Peterson, L.; Shanholtzer, C. Tests for bactericidal effects of antimicrobial agents: Technical performance and clinical relevance. Clin. Microbiol. Rev. 1992, 5, 420–432. [Google Scholar] [CrossRef] [PubMed]
  36. Naranjo, E.; Merfa, M.V.; Santra, S.; Ozcan, A.; Johnson, E.; Cobine, P.A.; De La Fuente, L. Zinkicide is a ZnO-based nanoformulation with bactericidal activity against Liberibacter crescens in batch cultures and in microfluidic chambers simulating plant vascular systems. Appl. Environ. Microbiol. 2020, 86. [Google Scholar] [CrossRef] [PubMed]
  37. Puigbò, P.; Bravo, I.G.; Garcia-Vallve, S. CAIcal: A combined set of tools to assess codon usage adaptation. Biol. Direct. 2008, 3, 1–8. [Google Scholar] [CrossRef] [PubMed] [Green Version]
  38. Carbone, A.; Zinovyev, A.; Képes, F. Codon adaptation index as a measure of dominating codon bias. Bioinformatics 2003, 19, 2005–2015. [Google Scholar] [CrossRef] [PubMed] [Green Version]
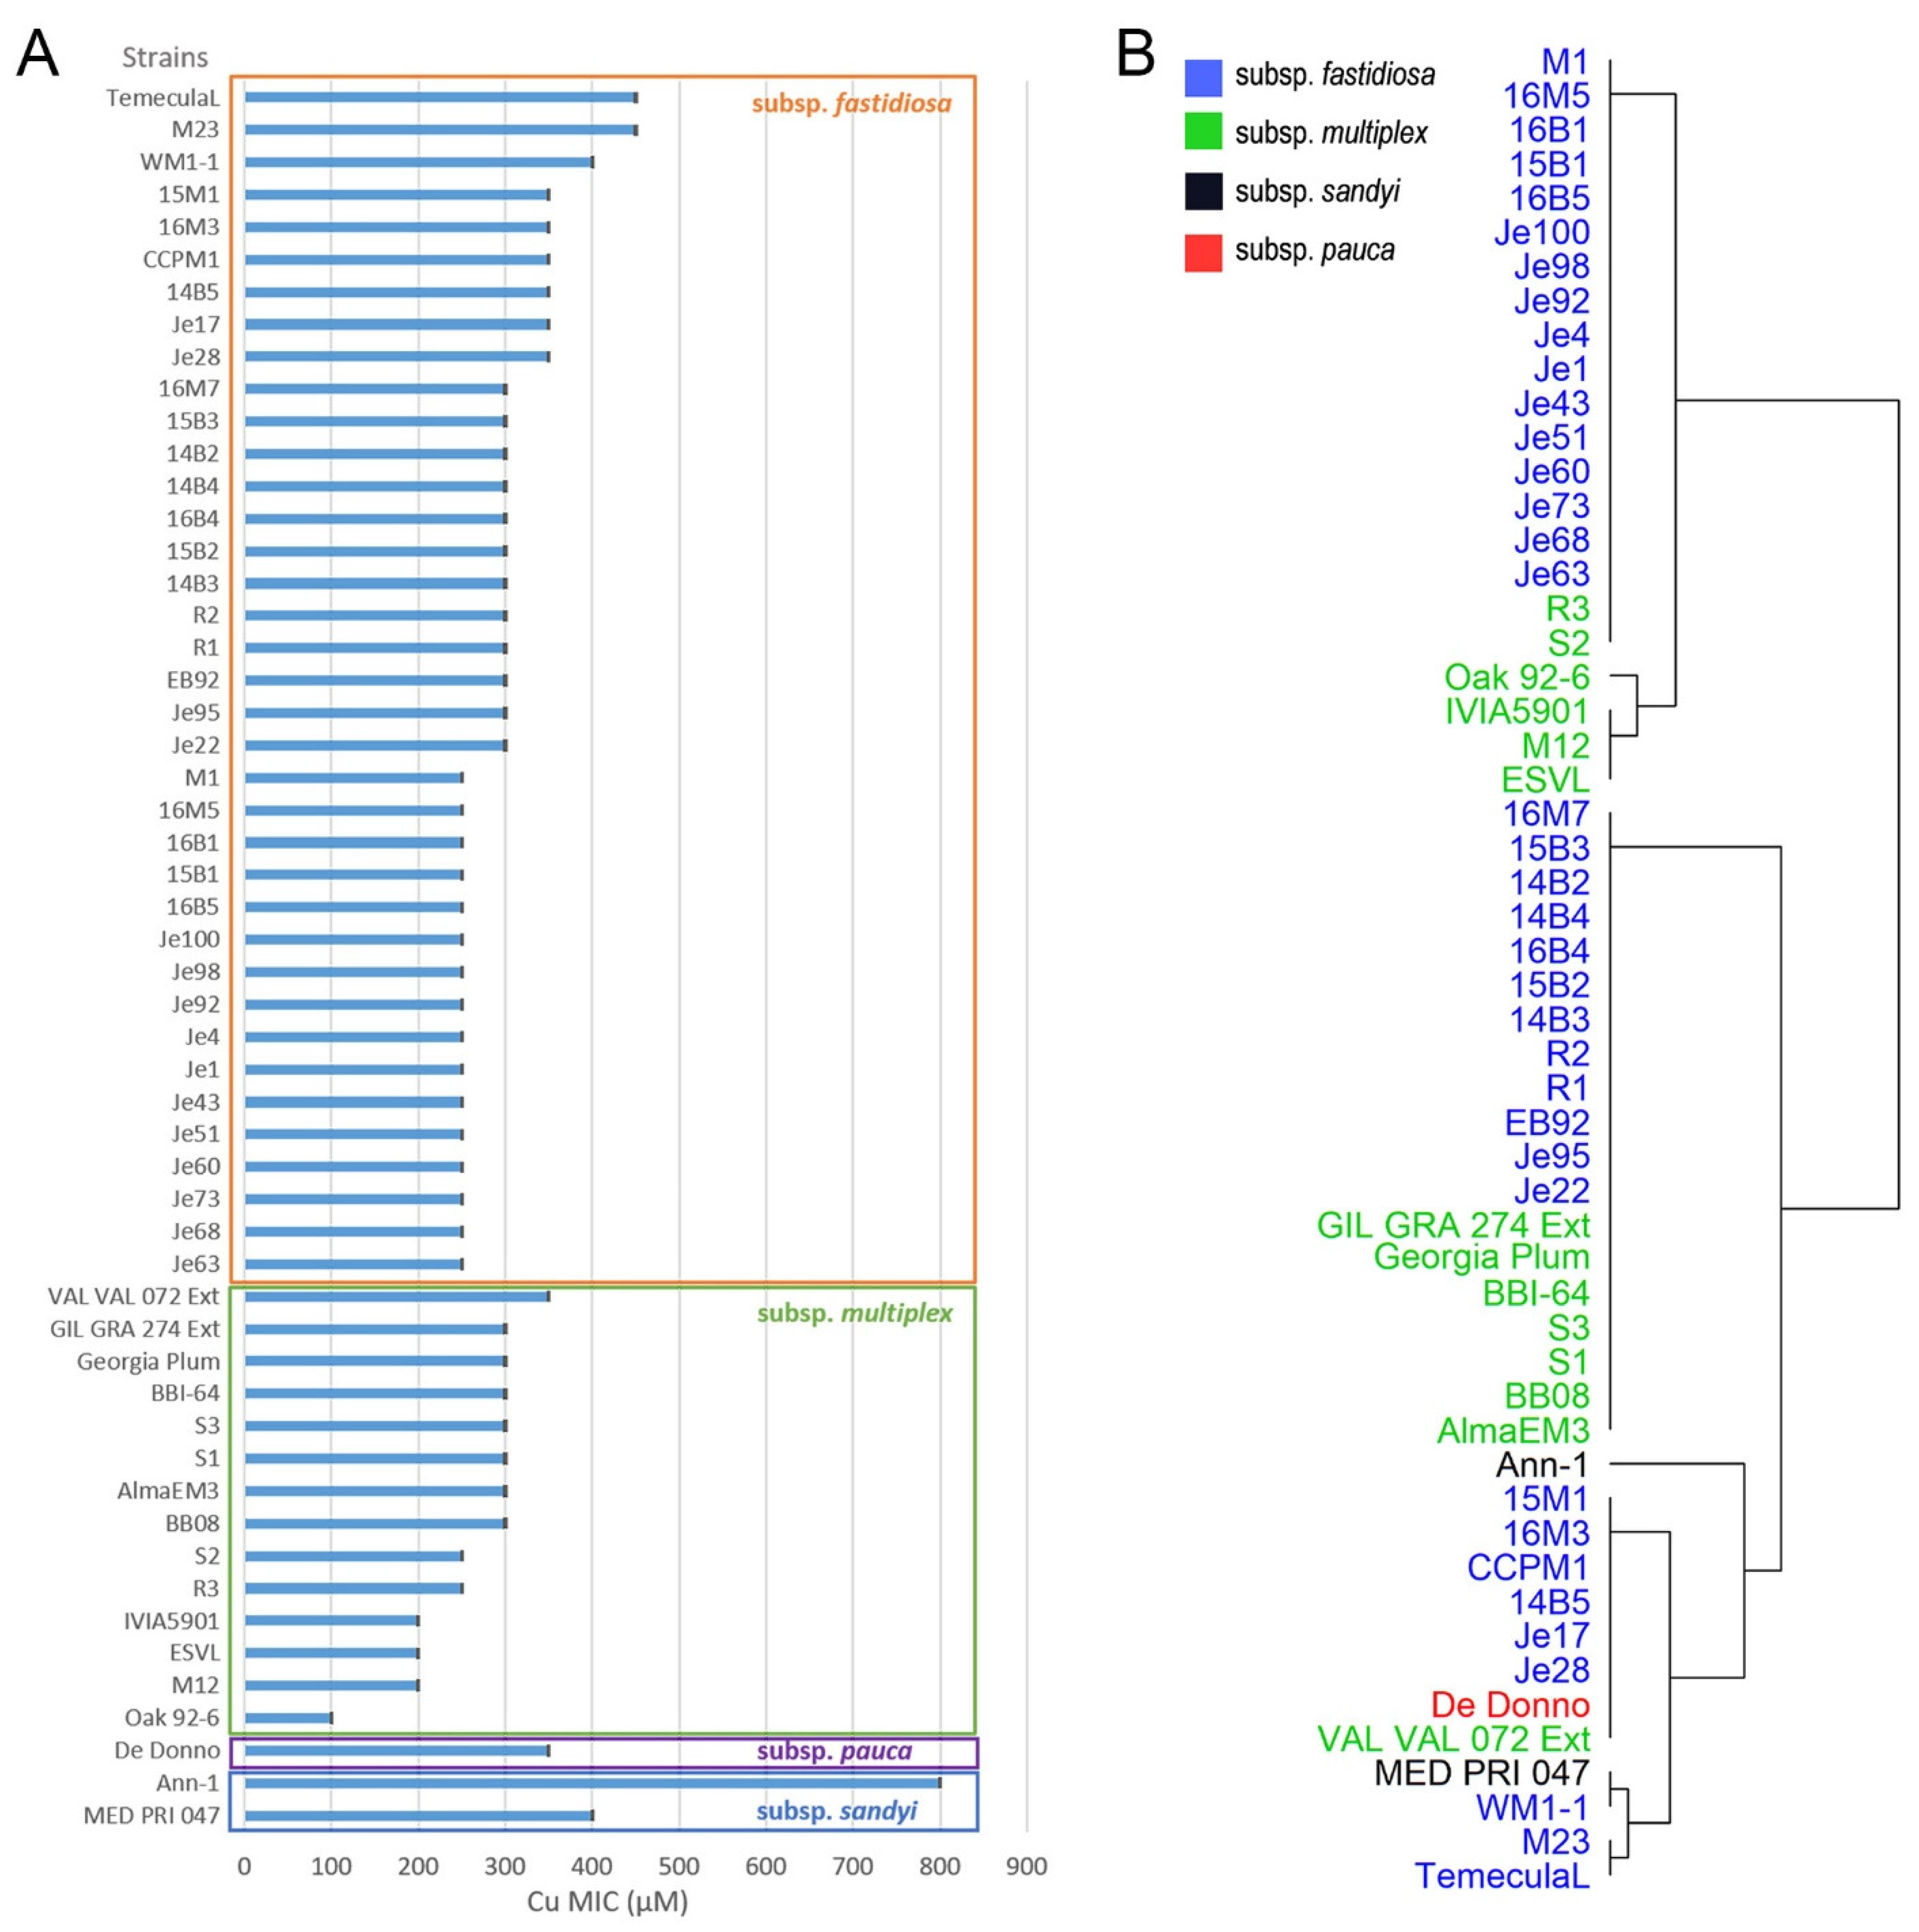
Figure 1. Cu MIC of X. fastidiosa strains. (A) Cu MIC values of strains, (B) Dendrogram of strains. Cu MIC assessment of X. fastidiosa strains were carried out in 96-well plates with PD2 media amended with different concentrations of CuSO4. The initial OD600nm of bacteria culture was set as 0.01. PD2 media without any bacteria was considered as blank. Growth of bacteria was determined by total growth as a summation of biofilm growth and planktonic growth, which was measured at OD600nm. The minimal Cu concentration that significantly (p < 0.05) inhibited 90% bacterial total growth compared with the growth under PD2 media without Cu amendment was selected as Cu MIC. Three independent experiments were carried in this study with a total of n = 9 replications. Data represents means and standard error of the mean.
Pathogens 10 00495 g001
Figure 2. Phylogenetic trees of Cu-related genes in X. fastidiosa. Phylogenetic trees of copA (A); copB (B); copL (C); cutC (D), and copLAB (E) genes. Maximum-likelihood phylogenetic trees were built using MEGA 7.0. Branches below 70% of bootstraps values were collapsed. The strains were named according to subspecies classification as follows: Xff: X. fastidiosa subsp. fastidiosa; Xfm: X. fastidiosa subsp. multiplex; Xfs: X. fastidiosa subsp. sandyi; Xfr: X. fastidiosa subsp. morus; Xfp: X. fastidiosa subsp. pauca. For representation purposes, branches were collapsed when the strains belong to same subspecies in a cluster, and genes were color-coded according to the subspecies classification of their strain.
Pathogens 10 00495 g002
Figure 3. Rank score of Wilcoxon test between Cu MIC and strains classification and origin. Rank scores of Wilcoxon test were used to indicate if the Cu MIC from each group were differently distributed from each other. Strains were grouped based on their (A) subspecies: fastidiosa (X. fastidiosa subsp. fastidiosa), multiplex (X. fastidiosa subsp. multiplex), and other (X. fastidiosa subsp. pauca and X. fastidiosa subsp. sandyi); (B) host: grape, blueberry, almond, and other (olive, oleander, elderberry, plum, giant ragweed, sunflower and oak); (C) location: CA (California), GA (Georgia and Florida), TX (Texas) and EU (Spain and Italy). p value (Pr > ChiSq) < 0.05 was considered as a threshold for statistical significance carried by the Kruskal-Wallis test.
Pathogens 10 00495 g003
Figure 4. Cu accumulation in the isolates from Georgia’s vineyards. Cu accumulation in cells when grown in (A) PD2 media and (B) PD2 media amended with 50 µM CuSO4. Cu content was measured by ICP-OES. Isolates were grown in test tubes for 7 days with PD2 media or PD2 amended with 50 µM CuSO4. Mean values were shown in graph, and error bars represented standard error of the mean (n = 6). Different Y scales were used in this figure since values in A were between 0–0.004; while values in B were between 0–0.08. Data used in the graph corresponded to one representative experiment, and three independent experiments performed under the same conditions showed similar tendencies. * and ** indicated significant differences (p < 0.05 and p < 0.01, respectively) compared with control strain TemeculaL (“Tem”) according to the two-tailed Student’s t-test.
Pathogens 10 00495 g004
Figure 5. Biofilm/total cells ratios of the isolates from Georgia’s vineyards. Biofilm/total cells ratio was measured by sulfur (S) concentration in biofilm cells divided by S concentration in total cells, as cellular S content is linearly associated with cell number. Bacteria were grown under PD2 media or PD2 amended with 50 µM CuSO4. After 7-day incubation in PD2 media or PD2 media amended with 50 μM CuSO4, the biofilm cells and planktonic cells were carefully separated with pipetting and collected by centrifugation. The data used in the graph corresponded to means and standard errors of the mean from one representative experiment, and three independent experiments performed under the same conditions showed similar tendencies. * and ** above the black line indicated significant differences (p < 0.05 and p < 0.01, respectively) of biofilm/total cells ration when grown in PD2 media and PD2 media amended with 50 μM CuSO4, according to the two-tailed Student’s t-test.
Pathogens 10 00495 g005
Table 1. Summary of selection in the Cu-related genes.
Gene# Positive Sites 1 # Negative Sites 2# Total Sites 3
copA114611
copB010250
copL02126
cutC03246
1 Positive sites is when non-synonymous substitution (dN) is significantly (p < 0.05) higher than random synonymous substitution (dS) (dN/dS > 1). 2 Negative sites is when dN is significantly (p < 0.05) lower than dS (dN/dS < 1). 3 Total sites is the total codon sites (including non-significant sites) that are possibly under selection searched by Fixed Effects Likelihood method (FEL) method carried with Datamonkey.org.
Publisher’s Note: MDPI stays neutral with regard to jurisdictional claims in published maps and institutional affiliations.