Article

Distribution of ermB, ermF, tet(W), and tet(M) Resistance Genes in the Vaginal Ecosystem of Women during Pregnancy and Puerperium

1
Institute of Biomedical Technologies, National Research Council, 20054 Segrate, Italy
2
Microbiology, Department of Experimental, Diagnostic and Specialty Medicine (DIMES), University of Bologna, 40128 Bologna, Italy
3
Family Advisory Health Centres, 48121 Ravenna, Italy
4
Unit of Microbiology, Greater Romagna Hub Laboratory, 47023 Cesena, Italy
*
Author to whom correspondence should be addressed.
Co-first: Marco Severgnini and Tania Camboni.
Pathogens 2021, 10(12), 1546; https://doi.org/10.3390/pathogens10121546
Submission received: 22 October 2021 / Revised: 17 November 2021 / Accepted: 25 November 2021 / Published: 26 November 2021

Abstract

:
The inhabitants of the vaginal ecosystem can harbor genetic determinants conferring antimicrobial resistance. However, detailed data about the distribution of resistance genes in the vaginal microbiome of pregnant women are still lacking. Therefore, we assessed the presence of macrolide (i.e., erm genes) and tetracycline (i.e., tet genes) resistance markers in the vaginal environment of Caucasian women at different gestational ages. Furthermore, the detection of resistance genes was related to the composition of the vaginal microbiota. A total of 228 vaginal samples, collected at different trimesters of pregnancy or during the puerperium, were tested for the presence of ermB, ermF, tet(W), and tet(M) by in-house end-point PCR assays. The composition of the vaginal microbiota was assessed through a microscopic evaluation (i.e., Nugent score) and by means of sequencing V3–V4 hypervariable regions of the bacterial 16 rRNA gene. Overall, the most detected resistance gene was tet(M) (76.7%), followed by ermB (55.2%). In 17% of women, mainly with a ‘normal’ vaginal microbiota, no resistance genes were found. Except for tet(W), a significant correlation between the positivity of resistance genes and a dysbiotic vaginal status (i.e., bacterial vaginosis (BV)) was noticed. Indeed, samples positive for at least one resistance determinant were characterized by a decrease in Lactobacillus spp. and an increase of BV-related genera (Prevotella, Gardnerella, Atopobium, Sneathia). A high predominance of vaginal Lactobacillus spp. (>85%) was associated with a lower risk of tet(W) gene detection, whereas the presence of Megasphaera (>1%) increased the risk of positivity for all analyzed genes. Different types of vaginal microbiota are associated with peculiar resistance profiles, being a lactobacilli-dominated ecosystem poor in or free of resistance genes. These data could open new perspectives for promoting maternal and neonatal health.

1. Introduction

In healthy reproductive-aged women, the vaginal microbiome is generally dominated by members of the Lactobacillus genus, able to promote the maintenance of the vaginal eubiosis, preventing the colonization and growth of adverse microorganisms [1,2,3,4].
The depletion of lactobacilli, combined with the increase in different species of anaerobic bacteria, can result in the switch from a normal vaginal consortium to a polymicrobial dysbiosis known as bacterial vaginosis (BV) [5,6]. This condition is characterized by higher levels of different anaerobes, including Gardnerella vaginalis, Atopobium, Prevotella, Mobiluncus, and Veillonella spp. [7,8].
The composition of the vaginal microbiome can vary throughout a woman’s life in response to various factors, such as diet, hormonal levels, sexual habits, pregnancy, pharmaceutical treatments, and urogenital infections [9,10]. In particular, during pregnancy, the vaginal microbiome undergoes significant changes, with a marked decrease in overall diversity and enrichment in Lactobacillus spp. [11,12].
It is known that the inhabitants of the vaginal microbiome can harbor several genetic determinants conferring antimicrobial resistance [13,14]. Among them, the ribosome protection type of tetracycline (i.e., tet genes) and the methylase type erythromycin resistance genes (i.e., erm genes) are the most common [15,16,17].
The tet(M), tet(W), ermB, and ermG genes are most often found in the Firmicutes, and the tet(Q) and ermF genes are found widely in the Bacteroidetes [13].
Both these families of resistance genes can be linked to DNA from known conjugative transposons (mobile elements), thus favoring horizontal transfer across genus and species lines [18]. In this way, commensal microorganisms can act as reservoirs of antibiotic resistance genes that can be ultimately transferred to pathogens.
The direct detection of tetracyclines and macrolide resistance genes have been performed mainly on the human gut or oral microbiota (i.e., fecal and saliva samples) or on food-borne specimens, whereas the distribution of tet and erm genes in the vaginal ecosystem is largely unexplored [19,20,21,22,23].
A decade ago, Jeters and colleagues assessed the presence of antibiotic resistance determinants in the vaginal microbiota of two populations of primates never exposed to antibiotics, demonstrating a high prevalence of tet(M) and tet(W) genes [13].
It is well known that the vaginal bacterial composition plays a crucial role in maternal-fetal health: indeed, a condition of vaginal dysbiosis and its related bacterial taxa are associated with several pregnancy complications and preterm birth [12,24,25].
Moreover, during delivery, the composition of the vaginal ecosystem can affect the newborn’s health, shaping the development of the infant’s bacterial communities and modulating the risk of disease susceptibility later in life [26].
Thus, studying the distribution of macrolide and tetracycline resistance genes and their association with vaginal bacterial communities in pregnant women could open new perspectives for the management of pregnancy and the care of newborn health.
Therefore, in this study, we assessed the presence of two markers of macrolide resistance, ermB and ermF, as well as two determinants of tetracycline resistance, tet(W) and tet(M), in the vaginal microbiota of Caucasian women at different gestational ages and during the puerperium. The detection of resistance genes was subsequently related to the characteristics of the vaginal microbiome in terms of bacterial composition obtained by sequencing of the bacterial 16S rRNA gene.

2. Results

2.1. Study Population and Samples

During the study period, a total of 228 vaginal samples were collected from 72 Caucasian women. In particular, 72 samples were collected during the first trimester of pregnancy, 63 during both the second and third trimester, and the remaining 30 during the puerperium. Over time, the drop-out of women from the study was mainly due to antibiotic treatments or Cesarean section.
At the beginning of pregnancy, the mean age of women was 31.2 ± 5.3 (range: 21–44 years), whereas the mean BMI was 23.6 ± 3.6 (range: 16.3–32.5 kg/m2).
Overall, based on Nugent score [27], 142 vaginal samples (62.3%) were characterized by a lactobacilli-dominated bacterial composition (Nugent score 0–3), 51 (22.4%) by an intermediate microbiota (Nugent score: 4–6), and the remaining 35 (15.3%) harbored a BV-associated microbial composition (Nugent score: 7–10). Cases of BV were mainly found during the first trimester of pregnancy (13/35; 37.1%) or during the puerperium (12/35; 34.3%) (Table S1).

2.2. Detection of Resistance Genes

The most detected resistance gene was tet(M), with 175 cases (76.7%), followed by ermB (126 cases, 55.2%), ermF (58 cases, 25.4%), and tet(W) (33 cases, 14.4%). It is worth noting that in 39 women (17.1%), the majority of which belonged to the “H” group (34/39; 87.2%), no resistance genes were found.
For all the four genes analyzed, the contemporary positivity of at least two of them in the same sample was more common than the detection of only one. Among the most common associations, we found ermB + tet(M) (55 cases) and ermB + tet(M) + ermF (31 cases) (see Table S2 for detailed results).
More than 80% of tet(M)-positive cases (147/175) were associated with the presence of the conjugative transposon tet(M)-tn916.
Interestingly, with the exception of tet(W), a significant correlation between the presence of resistance genes and a dysbiotic vaginal status was noticed (Table 1). In particular, for ermB, ermF, and tet(M), we found an increasing trend of positivity going from a normal vaginal flora to a condition of BV. Several cases of BV (10/35; 28.5%) were characterized by the contemporary positivity of ermB + tet(M) + ermF (Table S2).
Considering only the women enrolled at the first trimester of pregnancy, the presence of ermB was associated with a higher BMI (p = 0.003; BMI: 24.6 ± 3.9 vs. 22.1 ± 2.4). In this context, it is worth mentioning that no significant relationship was noticed between BMI and the vaginal status (H, I, or BV group; p = 0.49). On the other hand, the detection of resistance genes was not related to the age of subjects (data not shown). In agreement with the distribution of BV, we noticed that most cases of positivity for ermB, ermF, and tet(M) were found in women at the first trimester of pregnancy (Table S3).

2.3. Correlation between Resistance Genes and Vaginal Microbiota

Alpha-diversity evaluation showed a significant difference (p = 0.001) in the biodiversity of vaginal samples, stratified for the positivity/negativity of resistance genes, for all the metrics (i.e., chao1, observed species, phylogenetic diversity (PD) whole tree, Shannon, Good’s coverage). Overall, for all the four genes tested, we observed an increased biodiversity for samples positive to resistance determinants (Figure 1). Stratifying for vaginal status, differences were statistically significant for “H” women for all resistance genes and metrics (data not shown), whereas, when evaluating the combined presence of more resistance genes, a tendency (although not statistically significant) towards an increase of biodiversity following the number of resistance genes detected together was observed (Figure S1).
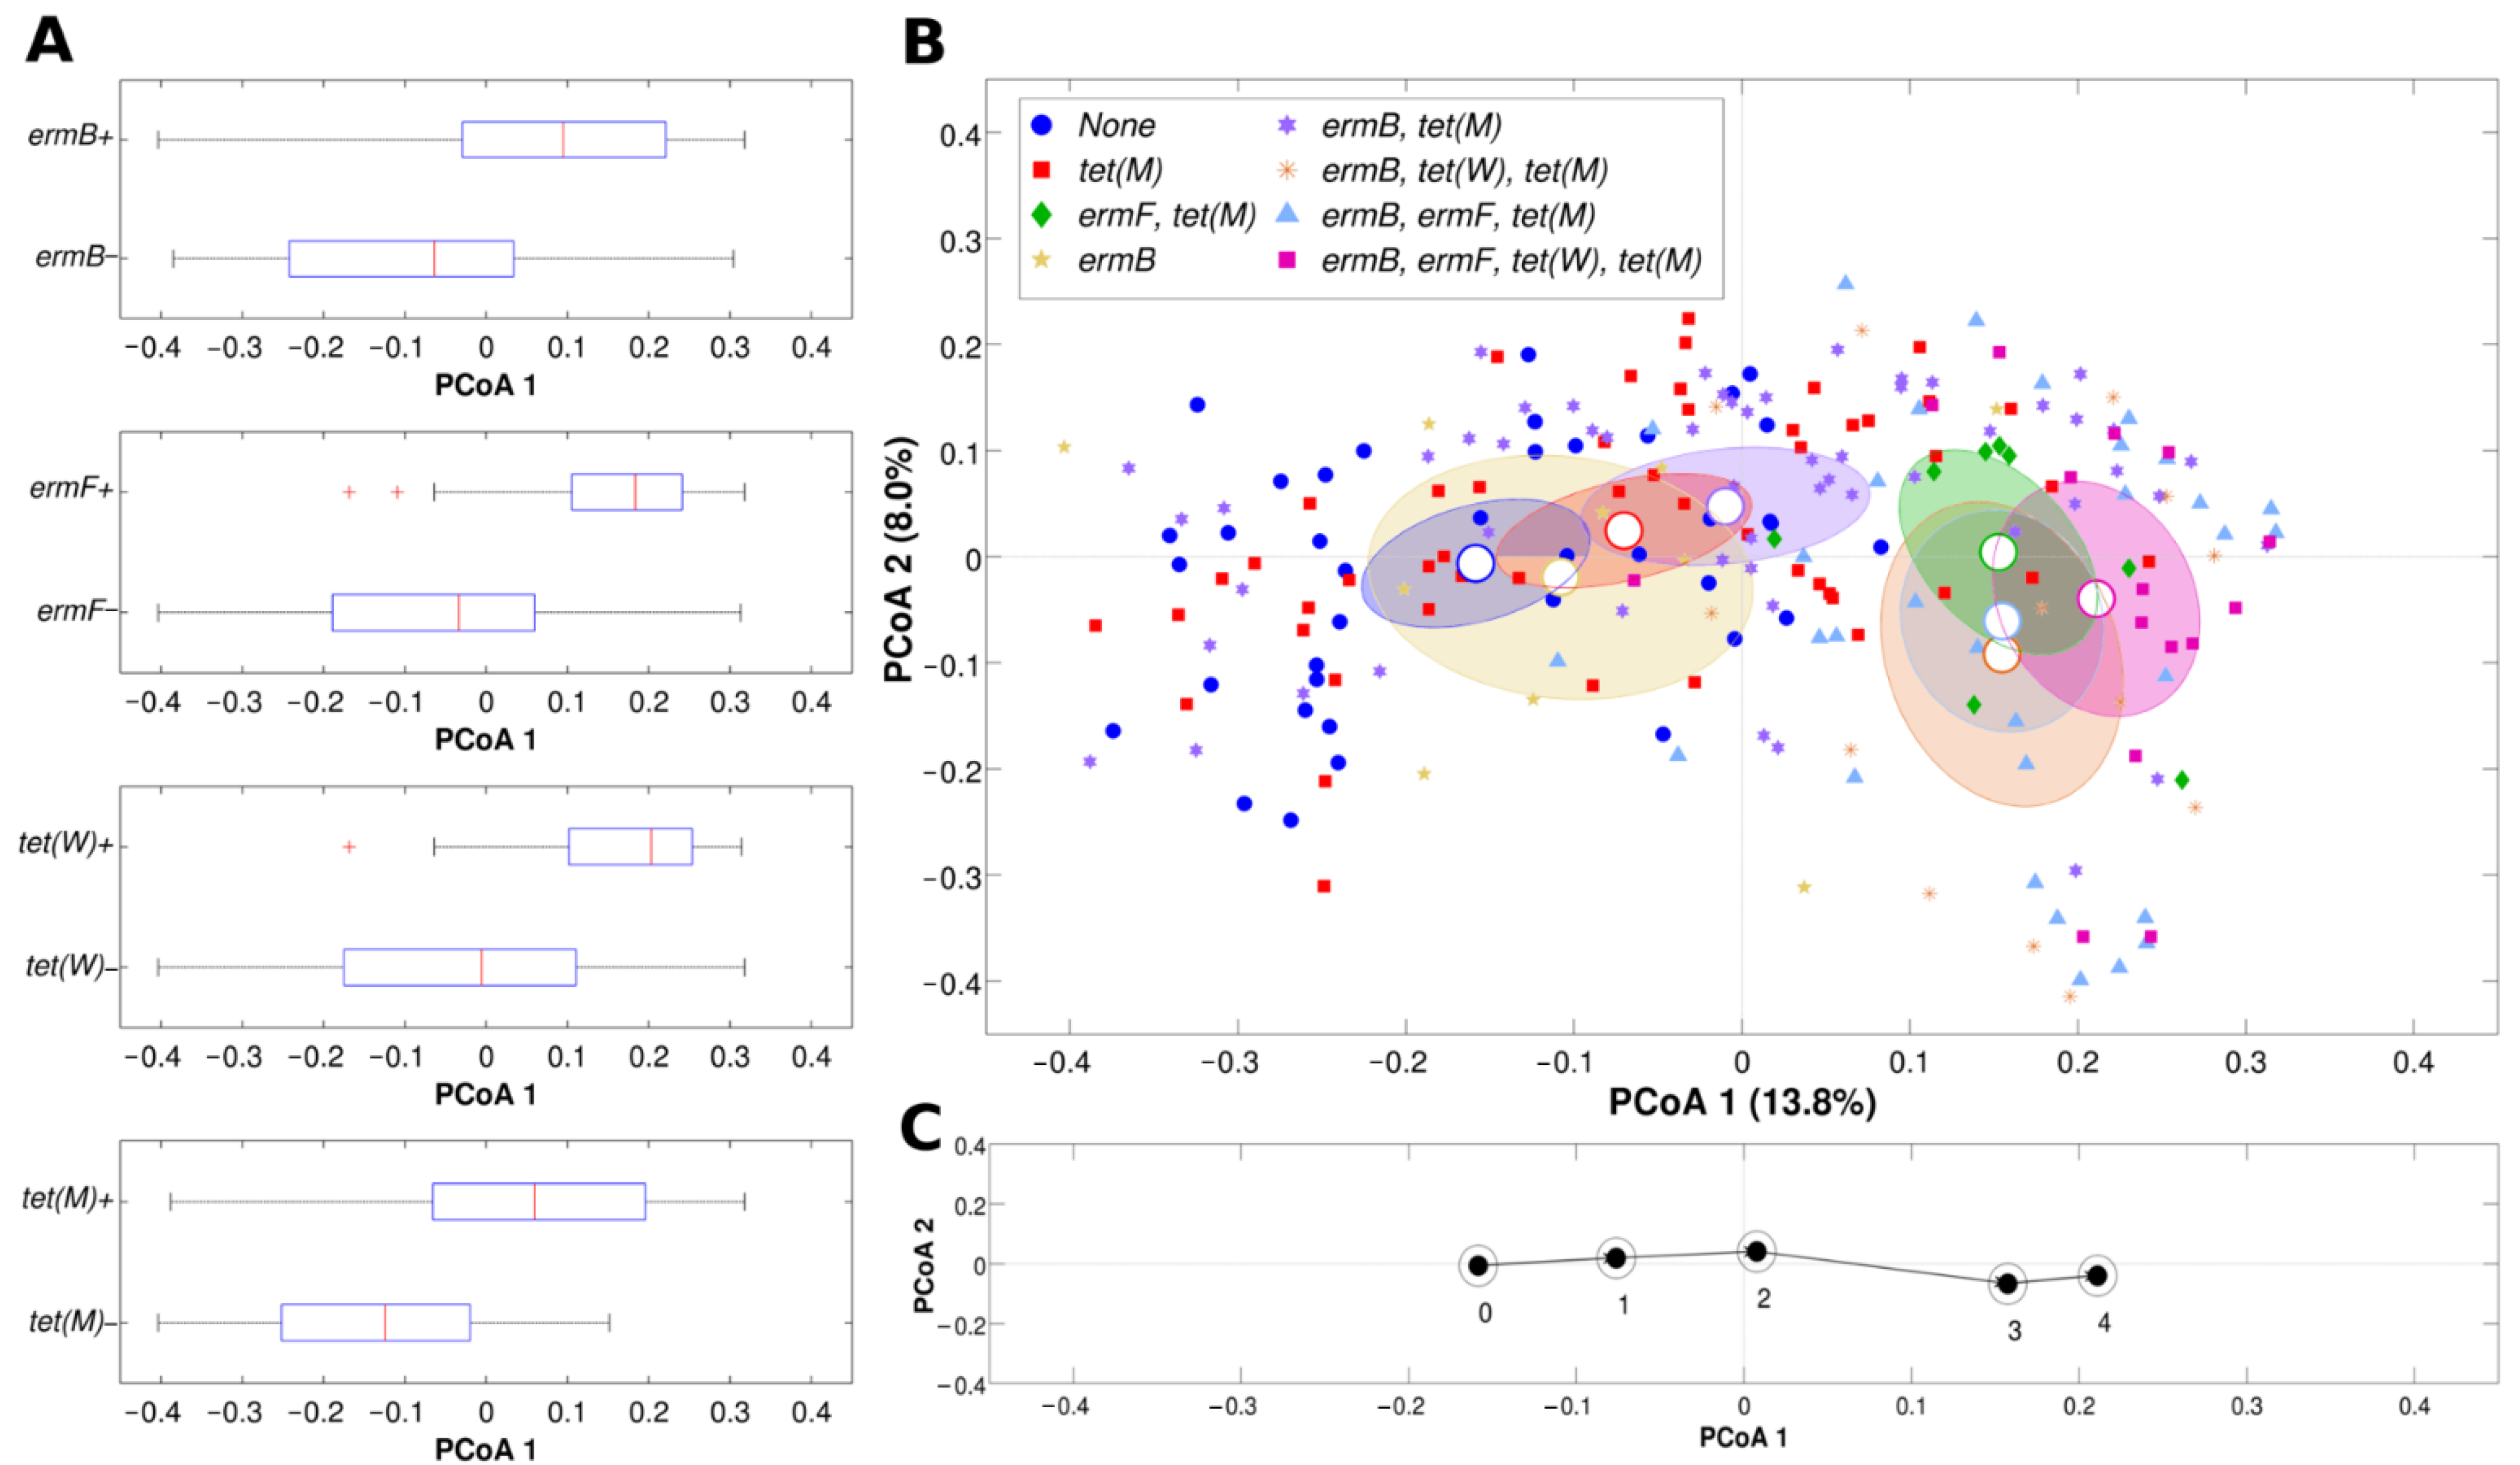
Evaluation of the microbial composition (beta-diversity analysis) confirmed the evidence suggested above, with samples displaying significant differences in composition based on the detection of resistance genes, for both unweighted and weighted Unifrac distances (Figure 2A).
When looking at the single or combined presence of more than one resistance gene per specimen (Figure 2B), we noticed that ermF and tet(M) seemed to be the determinants contributing most to the separation of the vaginal samples. All samples negative for ermF and tet(M) fell in the leftmost part of the Principal Coordinates Analysis (PCoA), whereas tet(M)-positive samples were in the rightmost part.
Interestingly, at the extreme left of the plot, we found samples negative to all four genes, whereas on the far right we had samples positive for all the resistance determinants, in a sort of ‘microbiota’ trajectory, shifting from left to right with increasing number of resistance genes (Figure 2C).
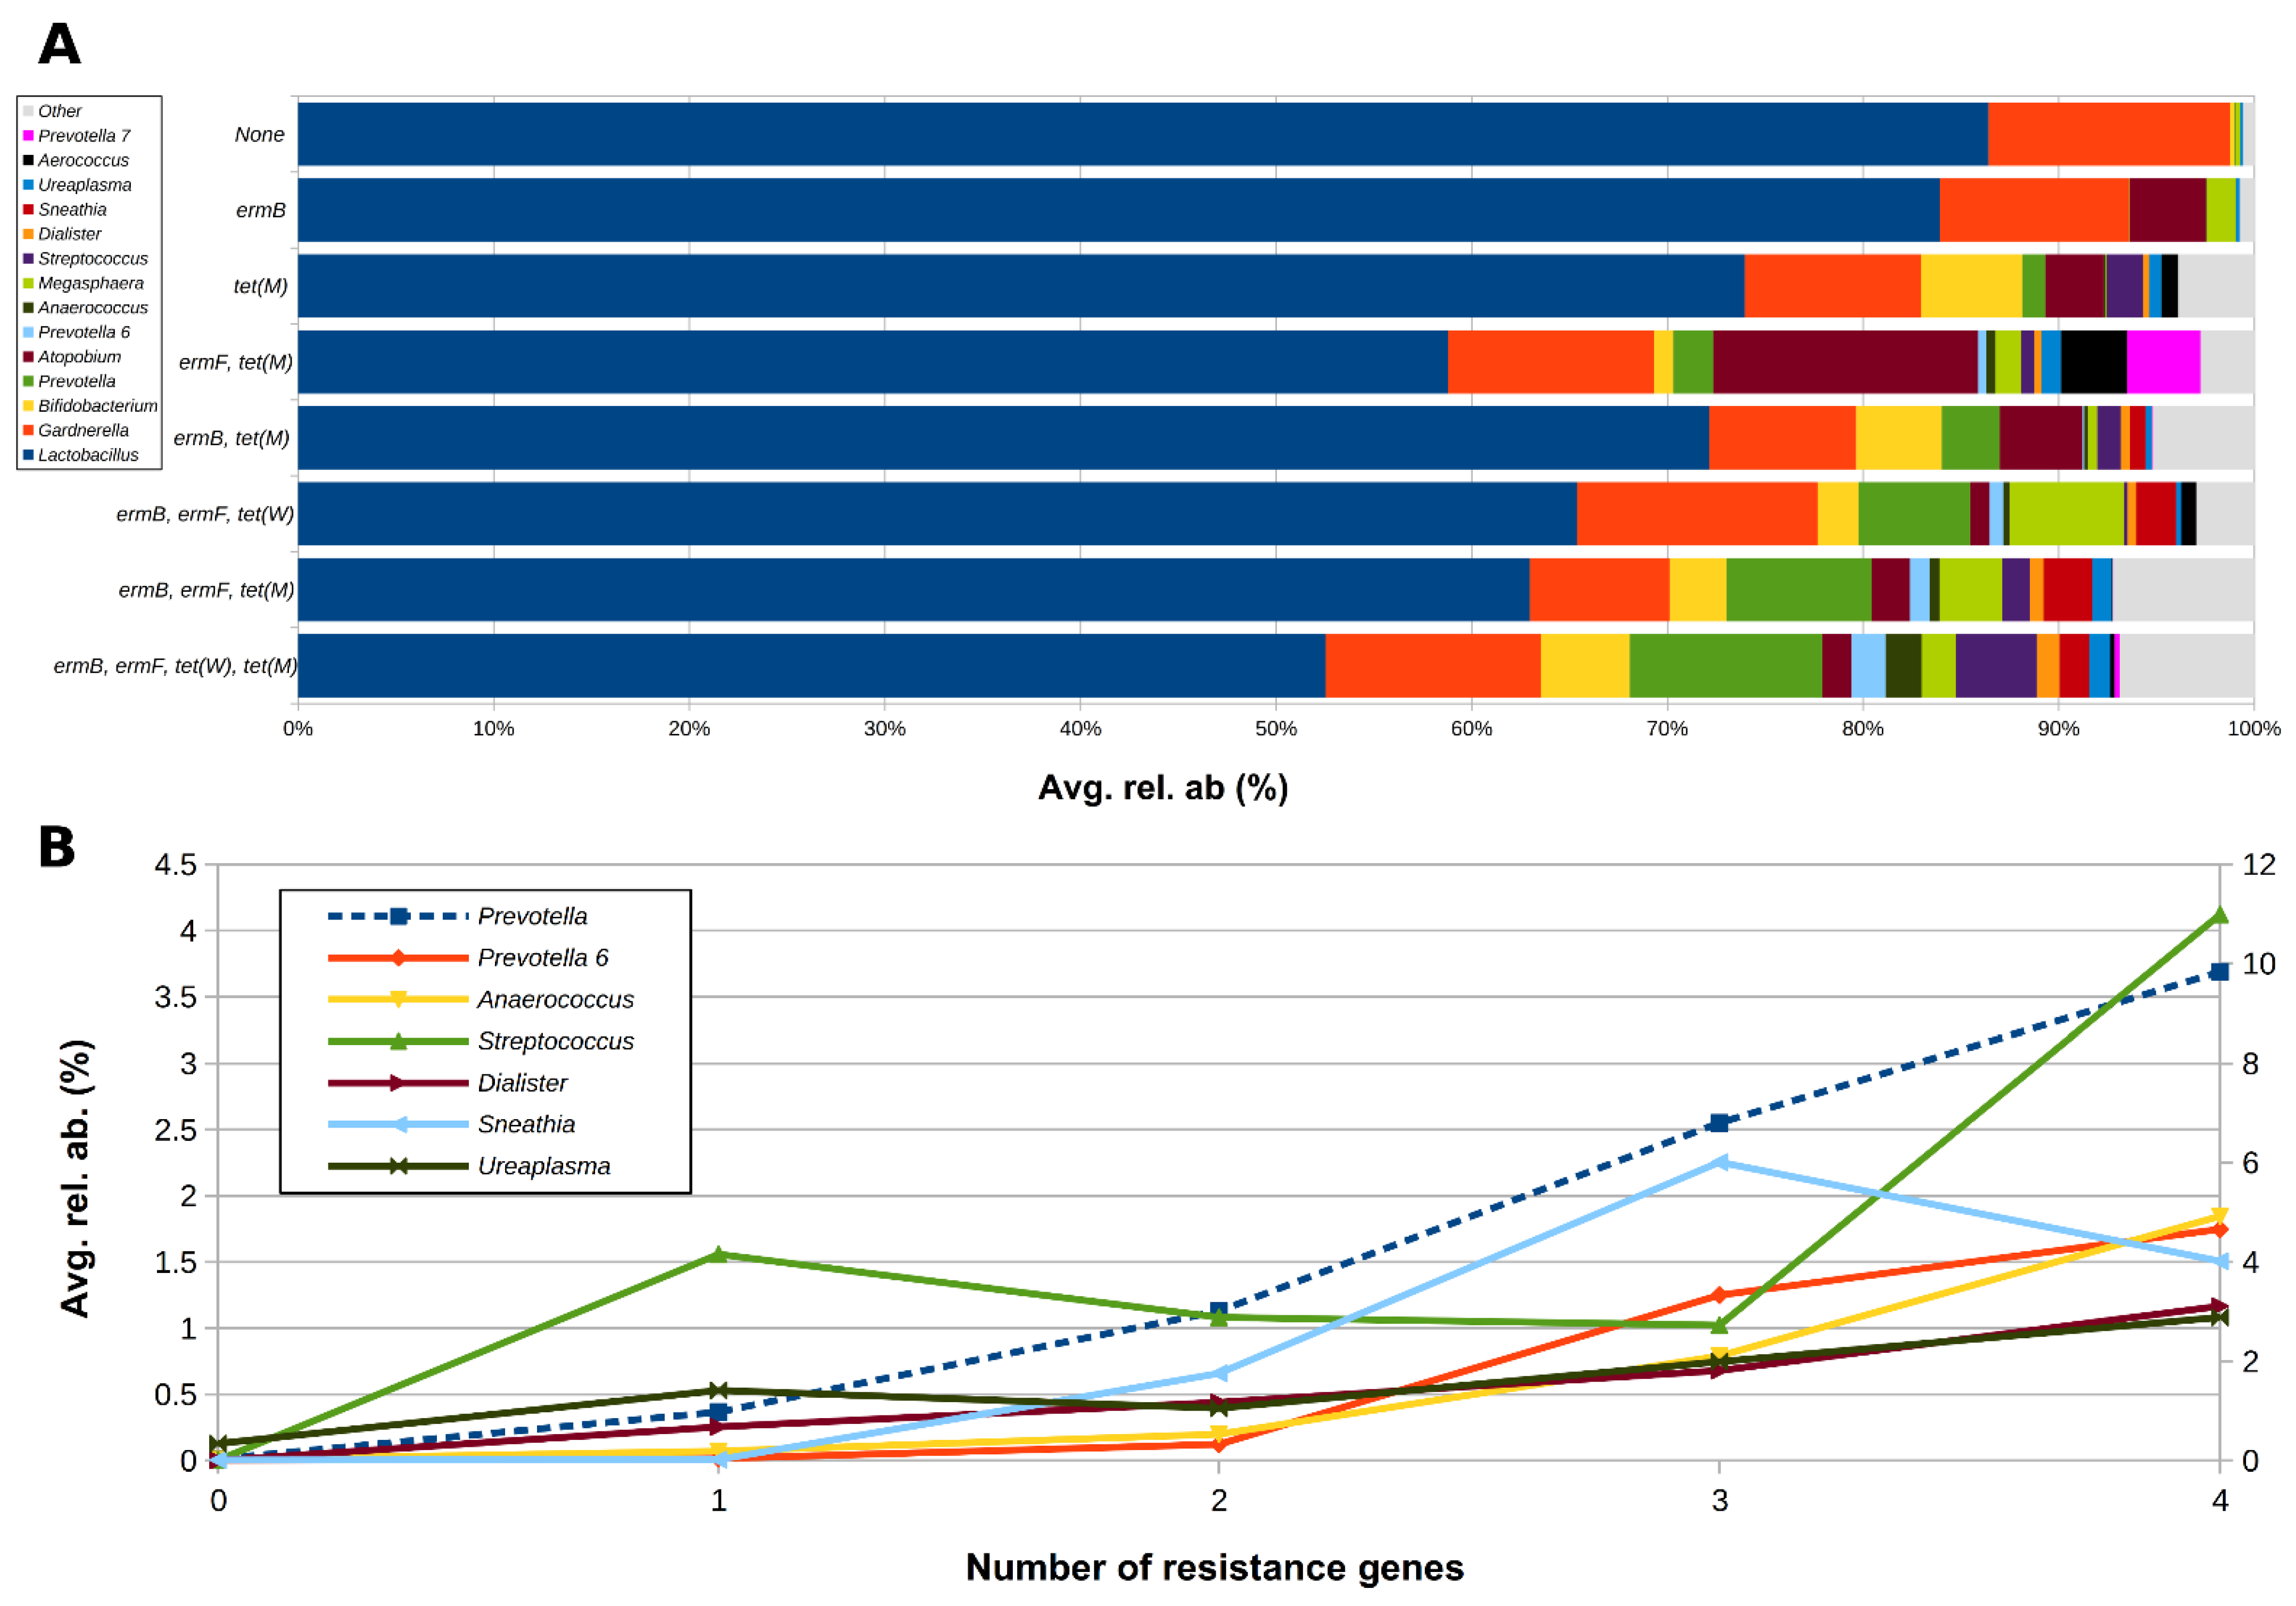
Overall, resistance genes seemed to be associated with a status of dysbiosis, since in samples positive for at least one resistance determinant, a general decrease in Lactobacillus spp. and an increase of BV-related genera (e.g., Prevotella, Gardnerella) was noticed. Average relative abundances of each taxa showing a significant difference between samples negative or positive for resistance genes are shown in Table 2.
Samples negative for all the analyzed genes showed the highest average abundance of Lactobacillus spp. (86.4%) and the lowest of BV-associated taxa, such as Prevotella, Atopobium, and Anaerococcus (Figure 3). In contrast, the abundance of Lactobacillus spp. dropped drastically (about 50%) in samples positive for all the four genes. It is worth noting that the levels of Prevotella, Anaerococcus, Streptococcus, Dialister, Sneathia, and Ureaplasma tended to increase progressively as the number of positive genes per sample increased (Figure 3).
Stratifying for the vaginal status (H, I, or BV), this tendency was confirmed, particularly for the “H” group: Lactobacillus tended to decrease in samples positive for the resistance genes, whereas Prevotella and Atopobium tended to increase (Table S4).
The alterations suggested by analyzing the relative abundance of bacterial genera were confirmed by performing point-biserial correlation between genus-level relative abundances and the presence/absence of resistance genes. As shown in Table 3, the positivity to any resistance gene was negatively correlated to Lactobacillus spp. abundance and positively to Prevotella, Dialister, and Anaerococcus. Higher levels of Atopobium were associated with the positivity of all genes, with the exception of tet(W), whereas Sneathia was positively related to ermB and tet(W). A positive association between Gardnerella, ermF, and tet(W) was also found. Interestingly, Bifidobacterium was positively associated with both the tetracycline resistance determinants.
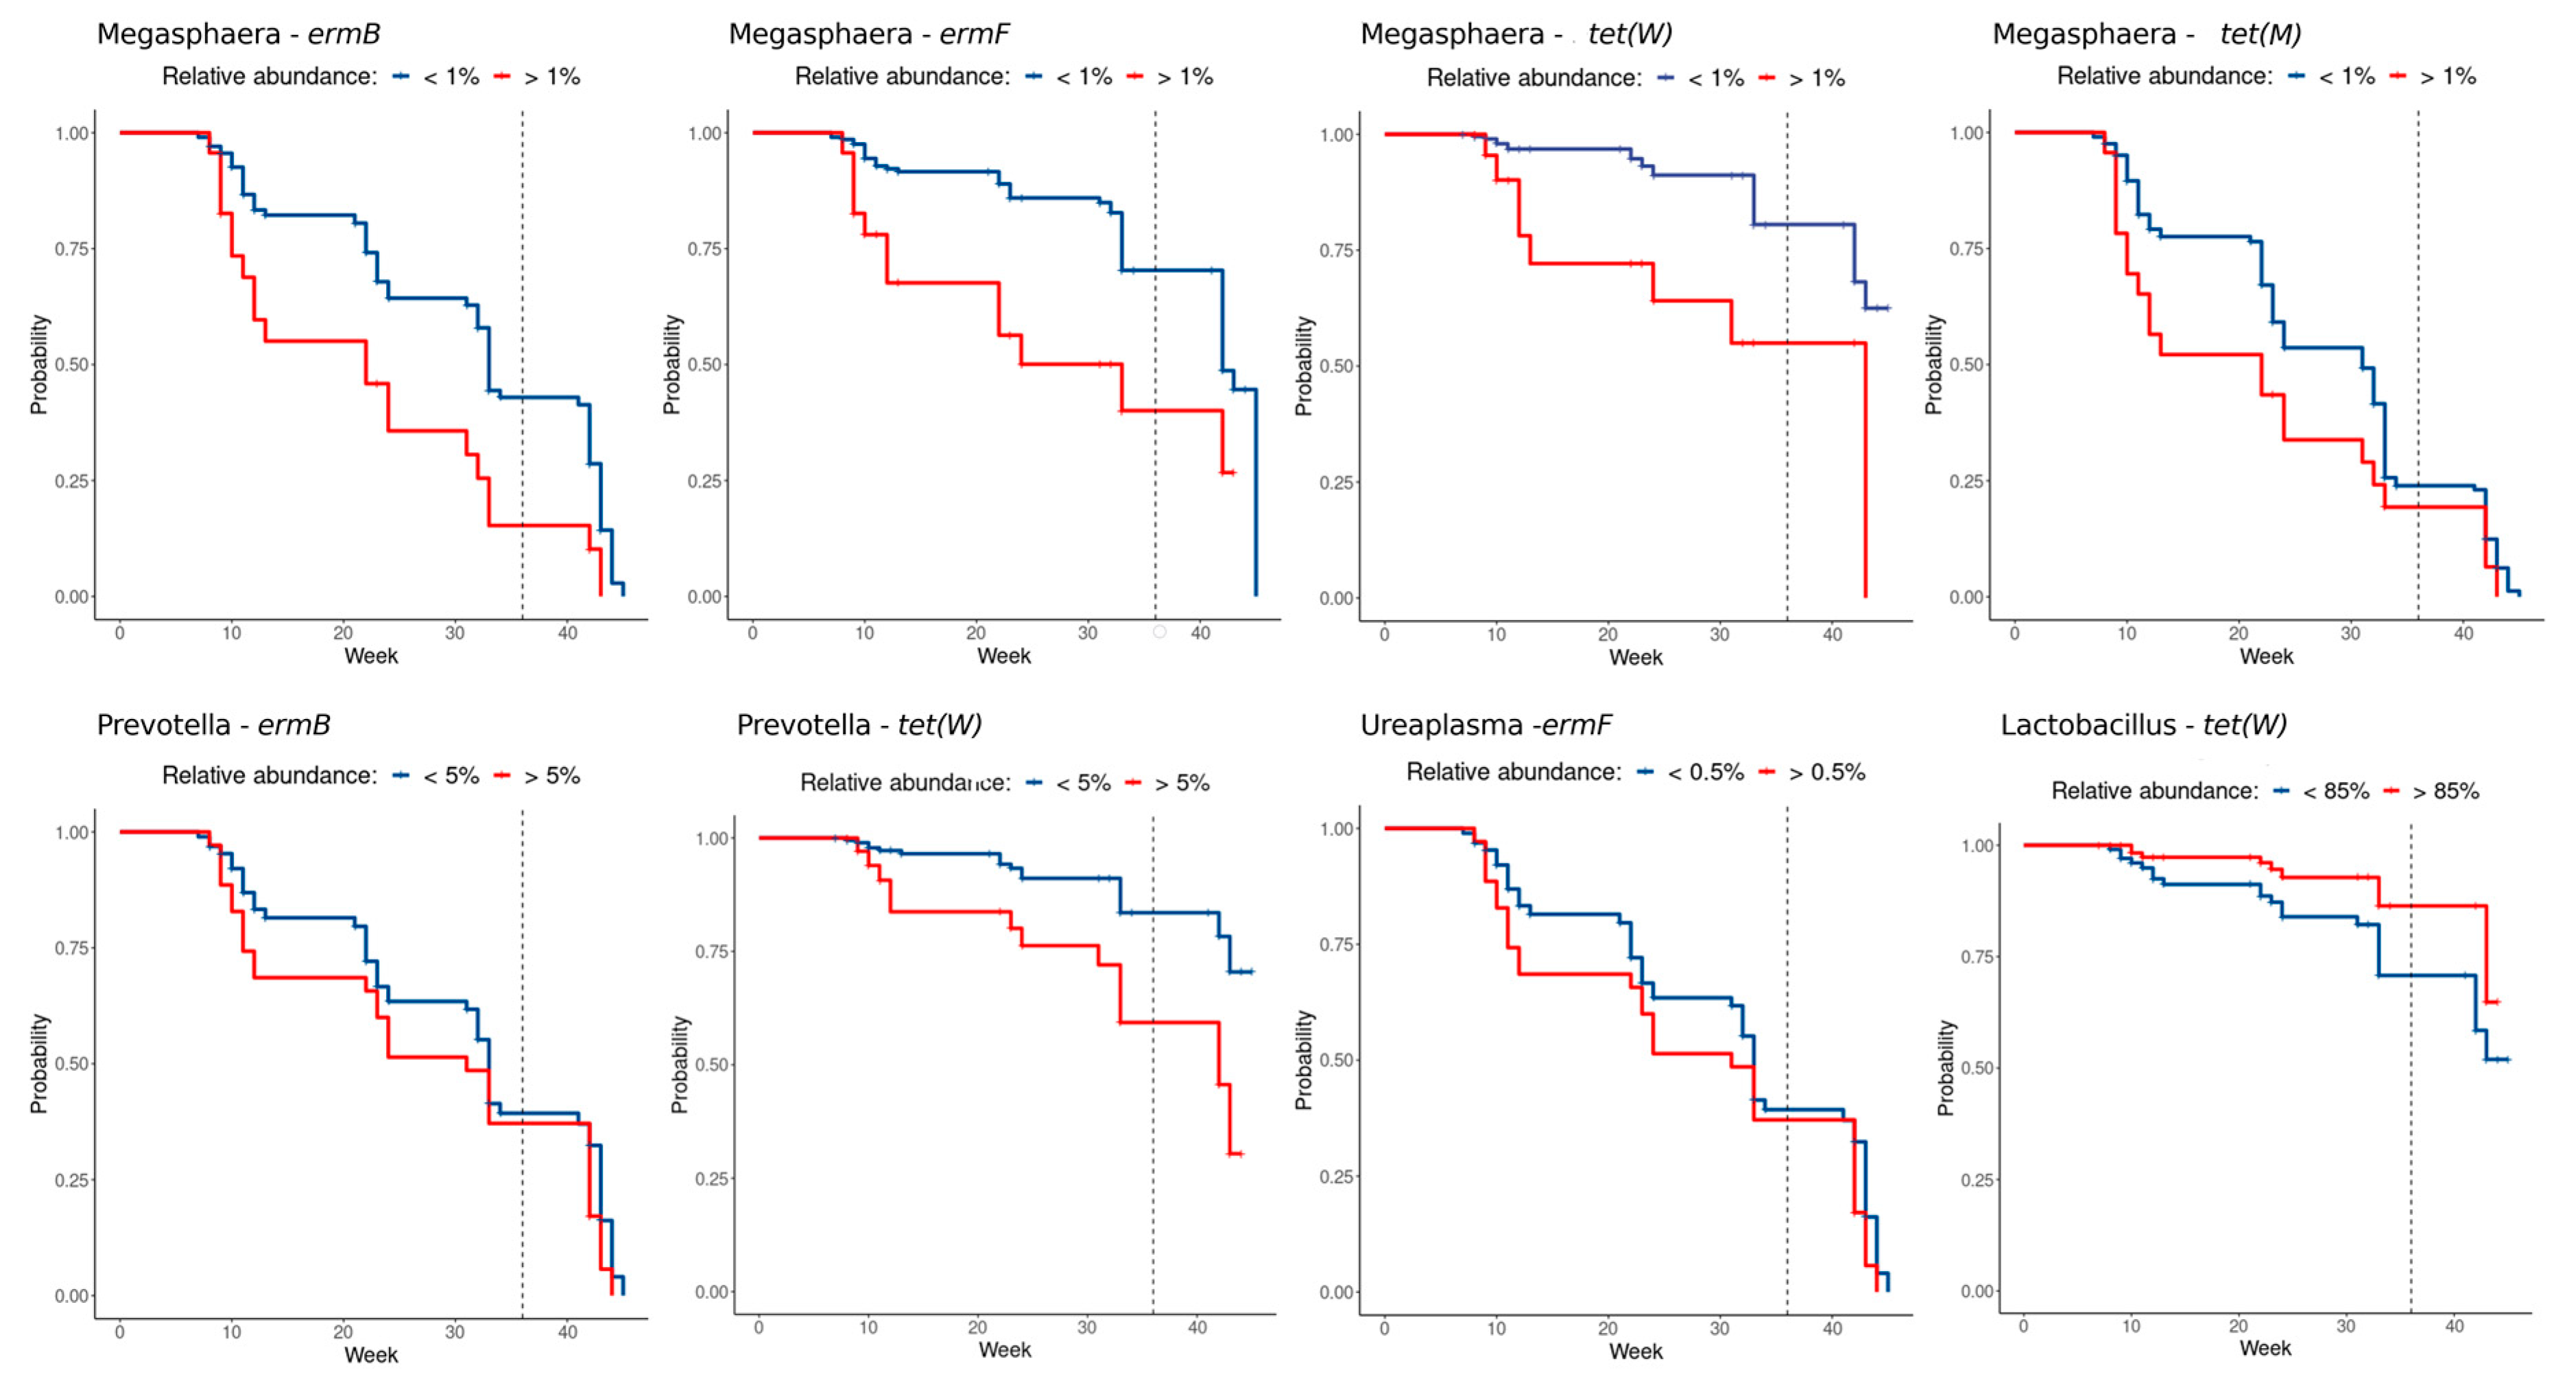
Since the positivity to a certain resistance gene could vary over time (Table S3), a survival analysis was performed over the gestation and post-partum weeks in order to further investigate how the bacterial groups identified contributed to the positivity status of women during pregnancy.
Higher abundances of the Lactobacillus genus seem to have a protective role towards the incidence of resistance genes (for tet(W) in particular), which appeared less frequently when the vaginal microbiome was dominated by it. In contrast, higher abundances of BV-related bacteria (such as Megasphaera, Prevotella, and Ureaplasma) (Figure 4) show an opposite trend: the higher the bacterial abundance, the higher the probability of manifesting resistance genes. Additional survival plots, showing the probabilities related to other bacterial genera and thresholds, are depicted in Figure S2.

2.4. Correlation between BMI and Vaginal Microbiota Composition

In general, only a few significant correlations were observed between BMI (considered only for women during the first trimester of pregnancy) and the composition of the vaginal microbiota. At the phylum level, there was a slightly negative correlation between BMI and Tenericutes abundance (r = −0.24). At the family and genus level, we found that BMI was negatively correlated with the Leptotrichaceae family (r = −0.28) and Sneathia genus (r = −0.31) and positively correlated with the Prevotella genus (r = 0.24).

3. Discussion

In this study we assessed the distribution of selected tetracycline and macrolide resistance genes in the vaginal microbiota of pregnant women at different gestational ages.
In particular, we analyzed the presence of ermB, ermF, tet(W), and tet(M) genes in the vaginal ecosystem of women during the three trimesters of pregnancy and puerperium, deciphering the correlations between the presence of resistance determinants and the abundance of vaginal bacterial taxa.
At first, we found that some resistance genes were very common in the vaginal environment of pregnant women, with the prevalence of tet(M) and ermB exceeding 55%. Other resistance determinants, namely ermF and tet(W), were less common, showing a 25% and 14% prevalence, respectively.
Recently, Roachford and colleagues assessed the cervicovaginal resistome in a cohort of Afro-Caribbean women by means of whole genome shotgun metagenomics. They confirmed that the most abundant resistance determinants are related to tetracyclines (tet; about 50%) and macrolides (erm; about 15%), with genes encoding for tetracycline-resistant ribosomal protection proteins being the most common [23].
The distribution of resistance genes found in our cohort is similar to the one described for the human gut microbiomes (i.e., fecal samples), with a significantly high prevalence of ermB and tet(M) genes [19,20,28]. Thus, we can speculate that the gastro-intestinal tract could serve as a reservoir of bacteria-related resistance genes, able to easily reach the vaginal environment by means of microbial translocation [29]. This aspect can partly explain the occurrence of resistance genes during puerperium, since a significant vaginal ‘contamination’ from intestinal-derived microbes occurs during labor and delivery.
Significant data emerged when the presence of resistance genes was related to the vaginal status (i.e., H, I, and BV groups based on Nugent score) and to the bacterial composition of the vaginal microbiota (i.e., 16S rRNA gene sequencing). We noticed that, except for tet(W), the detection of resistance determinants was significantly associated with BV status, with the prevalence of resistance genes increasing along with the worsening of the vaginal dysbiosis (i.e., going from H to I to BV status). Interestingly, we found that a higher number of combined resistance genes (i.e., more than one resistance gene in the same sample) was related to a greater distance from a normal microbiota. Thus, an increased polymicrobism, typical of severe BV conditions [30], led to an easier occurrence of multiple resistance genes at the same moment. In agreement with these results, the presence of resistance genes was more common when, during pregnancy, the conditions of vaginal dysbiosis are more frequent (i.e., first trimester and puerperium) [12,31].
As expected, the positivity of resistance genes was positively related with several BV-related taxa (e.g., Prevotella, Dialister, Anaerococcus, Atopobium, and Gardnerella) and negatively related to the abundance of vaginal Lactobacillus spp. In line with these findings, we demonstrated that a high predominance of Lactobacillus spp. in the vaginal environment (>85%) during pregnancy is associated with a lower risk of tet(W) gene detection, whereas the presence of several BV-associated bacteria significantly increase, in time, the chance of positivity of one or more resistance determinants (e.g., the presence of Megasphaera >1% increases the risk of positivity for all analyzed genes, whereas Prevotella >5% significantly increases the risk for erm(B) and tet(W)).
Even though culture-based approaches will be needed to assess the exact distribution of resistance genes among bacterial genera, we can speculate that each genus is characterized by a different antimicrobial resistance pattern, linked to a different bacterial plasticity and different responses to antibiotic selective pressure.
All these data strengthen the idea that a lactobacilli-dominated microbiota is associated with vaginal eubiosis and wellbeing, whereas a BV condition can negatively affect the women’s health, being a state that broadly correlates with increased risk of infection, disease, and poor reproductive and obstetric outcomes [32].
As indicated by our results (i.e., high association between tet(M) and the conjugative transposon tet(M)-tn916), macrolide and tetracycline resistance genes can be linked to mobile elements, thus favoring horizontal transfer of resistance determinants from commensal vaginal inhabitants to pathogens [16]. Moreover, during delivery, microbial communities can be transferred from the mother’s vaginal niche to the newborn gut, thus affecting the infant’s microbiome development and future health [33]. Along with microbial transfer, newborns can acquire bacteria-associated resistance genes [22,34]. As previously shown [22], newborns acquire tetracycline antibiotic resistance genes from mothers at birth, especially tet(M) and tet(O) in case of vaginal delivery.
Although the strongest correlations were found for BV-associated genera, it is worth mentioning that even ‘health-promoting’ microorganisms can harbor resistance determinants. In agreement with our results, it has been shown that resident bifidobacteria can possess genes conferring resistance to tetracyclines [35]. However, it should be remembered that Bifidobacteria are typical beneficial commensals inhabiting the human intestine and are only minority components of the vaginal consortium [36].
It is worth noting that the presence of the ermB gene was associated with a higher BMI at the beginning of pregnancy. Moreover, ermB was found to be specially correlated with higher vaginal levels of Prevotella genus, in turn associated with higher BMI levels. In this context, it has been shown that host obesity significantly increased the diversity of the vaginal microbiota in association with Prevotella, whose relative abundances are strongly associated with BV [37]. Thus, an adequate body weight, together with a pre-pregnancy correct dietary intake, seem protective factors against BV condition, for the maintenance of a healthy vaginal flora during pregnancy [10].
In conclusion, we were able to find a sort of ‘vaginal fingerprint’, being different types of microbiota composition associated with peculiar resistance profiles. If a ‘normal’ vaginal ecosystem is poor in or free of resistance genes, a condition of dysbiosis (i.e., BV) is strongly associated with the presence of more than one determinant of antimicrobial resistance. These data could open new perspectives for promoting vaginal health during pregnancy, with the aim of maintaining a lactobacilli-dominated vaginal ecosystem, in turn depleted of antimicrobial resistance genes.
Further studies are needed for a deeper comprehension of the potential origin and ‘sources’ of the antimicrobial resistance genes (e.g., food, water, past use of antibiotics, or microbiome ‘sharing’ with partner) [13,21,38,39]. Future perspectives include (i) collection of detailed and accurate medication history, to find correlations between resistance genes and past use of antimicrobials, (ii) analysis of a large panel of resistance determinants, (iii) bacterial isolation from vaginal swabs and assessment of resistance genes in each single strain, and (iv) study of mother-newborn couples to monitor the dynamics of resistance determinant transfer.

4. Materials and Methods

4.1. Study Population and Sample Collection

From April 2019, all the Caucasian pregnant women presenting to the Family Advisory Health Centers of Ravenna (Italy) for prenatal care were considered eligible for the study.
Exclusion criteria were the following: (i) age < 18 years; (ii) HIV positivity; (iii) body mass index (BMI) > 33; (iv) medically assisted procreation; (v) use of any antibiotics in the month preceding the sampling; (vi) use of vaginal douches or topical agents in the two weeks before sampling; (vii) presence of uncontrolled chronic diseases (e.g., diabetes, autoimmune disorders, malignancies); (viii) drug addiction or heavy smokers (>15 cigarettes/day). Moreover, women with urogenital infections due to sexually transmitted pathogens (i.e., Chlamydia trachomatis, Neisseria gonorrhoeae, Trichomonas vaginalis, and Mycoplasma genitalium), aerobic vaginitis, or symptomatic candidiasis were excluded after the laboratory testing.
Women underwent a clinical visit at different gestational ages (i.e., 9–13 weeks, first trimester; 20–24 weeks, second trimester; 32–34 weeks, third trimester) and during the puerperium (40–55 days after delivery). Demographic data and clinical information were recorded for each patient.
Two vaginal swabs were collected from each woman. The first one (collected by E-swab collection system, Copan, Brescia, Italy) was used for microbiological diagnostic tests and Nugent score assessment. The second one (collected by a sterile cotton bud swab) was employed for microbiota analysis and for the detection of resistance genes (see specific paragraphs below).
Written informed consent was obtained from all subjects, and the study protocol was approved by the Ethics Committee of Romagna (CEROM) (n° 2032 of 21 February 2018). This study was carried out in accordance with the Declaration of Helsinki, following the recommendations of the Ethics Committee.

4.2. Microbiological Investigations

A commercial nucleic acid amplification technique (NAAT) was used for the detection of sexually transmitted pathogens (i.e., C. trachomatis, N. gonorrhoeae, T. vaginalis, and M. genitalium; Seeplex STI Master Panel 1; Seegene, Seoul, Korea). Microscopic examination and cultures were performed for candidiasis and aerobic vaginitis diagnosis [40,41].
A Gram stain scoring system (Nugent score) was used for a preliminary assessment of the vaginal flora composition [27]. Based on this score, women were grouped as follows: “H” group (normal lactobacilli-dominated microbiota, score 0–3), “I” group (intermediate microbiota, score 4–7), “BV” group (dysbiosis condition, namely bacterial vaginosis, score 8–10) [42].

4.3. Detection of Resistance Genes

Nucleic acids were extracted from vaginal swabs by means of the Versant molecular system (Siemens Healthcare Diagnostics, Tarrytown, NY, USA), as previously described [43]. Starting from the obtained eluate, each sample underwent both the detection of resistance genes and the analysis of the vaginal microbiome composition (see paragraph below).
The presence of ermB, ermF, tet(W), and tet(M) genes was assessed by means of in-house end-point PCR assays. tet(W) and tet(M) genes confer antimicrobial resistance to tetracyclines by encoding for ribosome protection types of tetracycline resistance proteins, whereas ermB and ermF are methylase-type erythromycin resistance genes, conferring resistance to macrolides [44,45].
A PCR test targeting the conjugative transposon (mobile element) carrying the resistance gene tet(M), namely tet(M)-tn916, was performed as well [13].
Each reaction consisted of 45 µL of PCR mix (GoTaq® G2 Master Mix, Promega, Milan, Italy) and 5 µL of target. For each gene, primer sequences, PCR conditions, and amplicon size are reported in detail in Table S5. A sample was considered positive if the PCR test, after 35 cycles, gave an amplicon of the expected size.
Associations between the presence of resistance genes and available variables (e.g., Nugent score, BMI, age) were searched by t-test or Chi-square test, where appropriate.
A p value < 0.05 was considered as statistically significant.

4.4. Microbiota Analysis

The V3–V4 hypervariable regions of the bacterial 16S rRNA gene were amplified, according to the 16S metagenomic sequencing library preparation protocol (Illumina, San Diego, CA, USA). Final indexed libraries were prepared by equimolar (4 nmol/L) pooling, denaturation, and dilution to 6 pmol/L, before loading onto the MiSeq flow cell (Illumina). A 2 × 300 bp paired-end run was used.
Raw sequencing reads were processed, generating a single fragment covering the whole amplicon from the two overlapping pairs, using PandaSeq software (v2.5, [46]), keeping 250–900 base long fragments and filtering out those having more than 25% nucleotides with a Phred score ≤3.
Quality filtering, taxonomy assignments, and diversity analyses of the samples were performed using the QIIME suite (release 1.9.0, [47]). Filtered reads were de-duplicated and de-noised, creating zero-radius Operational Taxonomic Units (zOTUs), using the unoise3 algorithm [48] provided in the usearch pipeline (v. 11.0.667) and discarding those with less than 5 supporting reads. Taxonomic assignment was performed against the SILVA 16S rRNA database (release 132, https://www.arb-silva.de/fileadmin/silva_databases/qiime/Silva_132_release.zip accessed on 25 November 2021) through the RDP classifier at 0.5 confidence [49].
α-diversity evaluation was estimated according to several microbial diversity metrics (i.e., chao1, Shannon index, observed species, Good’s coverage, and Faith’s phylogenetic distance). β-diversity analysis was conducted using both weighted and unweighted Unifrac metrics [50] and through the Principal Coordinate Analysis (PCoA).
Survival analysis was performed on bacterial genera selected as among the most representative from the taxonomic classification, and the detection of positivity to one of the resistance genes in the single samples over time was considered as a censoring event.
Several thresholds of bacterial relative abundance were implemented as time-dependent covariates, which started at value 0 and changed to 1 once the relative abundance of the genus in the sample increased above a certain value. Bacterial thresholds were determined from the mean abundances of all 228 samples and pondering the number of samples that would fall in one of the sides (keeping 30 samples at the first time-point as minimum acceptable quantity). For a better analysis performance, the original four collection points, divided into trimesters and days after delivery, were subdivided into 20 time points according to the weeks of pregnancy and post-partum, with week 36 as an indicative delivery time point.

4.5. Statistical Method

Statistical evaluation of α-diversity indices was performed by non-parametric Monte Carlo-based tests through the QIIME pipeline. β-diversity differences were assessed by a permutation test with pseudo F-ratios using the “adonis” function from R package “vegan” (version 2.0-10, [51]). Pairwise relative abundance analysis was performed using a non-parametric Mann–Whitney U test with Benjamini-Hochberg False-Discovery Rate correction on the 15 most abundant genera. For comparing relative abundances across multiple categories, we applied a Kruskal-Wallis test, followed by Dunn’s post hoc test for pairwise comparisons.
Correlation between microbial composition at the genus level and presence/absence of each resistance gene was calculated using the point biserial correlation [52], whereas correlation between microbial profiles and BMI was performed using Spearman’s rank-based correlation coefficient. In both cases, only coefficients showing a p value of the linear model <0.05 were reported. Statistical evaluations were performed in Matlab (Software version 7.7.0, Natick, MA, USA).
Survival analysis was performed through the RStudio software (version 1.2.1335; R version 3.6.3) using a custom pipeline employing the packages “survival” (v 3.2-3) and “survminer” (v 0.4.9); statistical differences between Kaplan-Meyer curves were determined through a log-rank test.
A p value < 0.05 was considered as statistically significant for all analysis.

Supplementary Materials

The following are available online at https://www.mdpi.com/article/10.3390/pathogens10121546/s1, Table S1: Vaginal status, stratified by the gestational age, Table S2: Prevalence of resistance genes, Table S3: Distribution of macrolide and tetracycline resistance genes, stratified for the gestational age, Table S4: Bacterial genera statistically different (p < 0.05, Mann-Whitney U-test) between samples, Table S5: List of primers and PCR conditions used for the detection of resistance genes, Figure S1: Alpha diversity boxplots for the four resistance genes combination, Figure S2: All statistically significant survival curves

Author Contributions

Conceptualization, C.F. and A.M.; methodology, C.F., A.M., M.S., T.C. and C.C. (Clarissa Consolandi); software, M.S., C.C. (Camilla Ceccarani), C.C. (Clarissa Consolandi) and T.C.; validation, C.F., A.M. and M.S.; formal analysis, S.M., A.C., S.Z., G.P., M.F.P., C.C. (Camilla Ceccarani), C.C. (Clarissa Consolandi), T.C. and C.F.; investigation, S.M., A.C., C.C. (Camilla Ceccarani), C.C. (Clarissa Consolandi), T.C. and C.F.; resources, A.M. and V.S.; data curation, C.F. and M.S.; writing—original draft preparation, A.M., C.F., M.S., C.C. (Camilla Ceccarani) and C.C. (Clarissa Consolandi); supervision, A.M., C.F. and M.S.; project administration, A.M. and C.F.; funding acquisition, A.M. All authors have read and agreed to the published version of the manuscript.

Funding

This research was funded by ‘Fondazione del Monte di Bologna e Ravenna’ (Prot. N°329bis/2017). The funder had no role in study design, data collection and analysis, decision to publish, or preparation of the manuscript.

Institutional Review Board Statement

The study was conducted according to the guidelines of the Declaration of Helsinki and approved by the Ethics Committee of Romagna (CEROM) (No. 2032 of 21 February 2018).

Informed Consent Statement

Informed consent was obtained from all subjects involved in the study.

Data Availability Statement

Raw sequencing data of 16S rRNA gene are available at NCI SHort-reads Archive (SRA, https://www.ncbi.nlm.nih.gov/sra/ accessed on 25 November 2021) with BioProject accession number PRJNA766806. Other data presented in this study are available in the Supplementary Materials.

Acknowledgments

We are grateful to Oriana Gasperoni of the Family Advisory Health Centre in Ravenna for her skillful support during the study.

Conflicts of Interest

The authors declare no conflict of interest.

References

  1. Smith, S.B.; Ravel, J. The vaginal microbiota, host defence and reproductive physiology. J. Physiol. 2017, 595, 451–463. [Google Scholar] [CrossRef] [Green Version]
  2. van de Wijgert, J.H.; Borgdorff, H.; Verhelst, R.; Crucitti, T.; Francis, S.; Verstraelen, H.; Jespers, V. The vaginal microbiota: What have we learned after a decade of molecular characterization? PLoS ONE 2014, 9, e105998. [Google Scholar] [CrossRef] [Green Version]
  3. Parolin, C.; Marangoni, A.; Laghi, L.; Foschi, C.; Ñahui Palomino, R.A.; Calonghi, N.; Cevenini, R.; Vitali, B. Isolation of Vaginal Lactobacilli and Characterization of Anti-Candida Activity. PLoS ONE 2015, 10, e0131220. [Google Scholar] [CrossRef] [PubMed]
  4. Foschi, C.; Salvo, M.; Cevenini, R.; Parolin, C.; Vitali, B.; Marangoni, A. Vaginal lactobacilli reduce Neisseria gonorrhoeae viability through multiple strategies: An in vitro study. Front. Cell Infect. Microbiol. 2017, 7, 502. [Google Scholar] [CrossRef] [PubMed]
  5. Ling, Z.; Kong, J.; Liu, F.; Zhu, H.; Chen, X.; Wang, Y.; Li, L.; Nelson, K.E.; Xia, Y.; Xiang, C. Molecular analysis of the diversity of vaginal microbiota associated with bacterial vaginosis. BMC Genom. 2010, 11, 488. [Google Scholar] [CrossRef] [PubMed] [Green Version]
  6. Auriemma, R.S.; Scairati, R.; Del Vecchio, G.; Liccardi, A.; Verde, N.; Pirchio, R.; Pivonello, R.; Ercolini, D.; Colao, A. The Vaginal Microbiome: A Long Urogenital Colonization Throughout Woman Life. Front. Cell Infect. Microbiol. 2021, 11, 686167. [Google Scholar] [CrossRef] [PubMed]
  7. Parolin, C.; Foschi, C.; Laghi, L.; Zhu, C.; Banzola, N.; Gaspari, V.; D’Antuono, A.; Giordani, B.; Severgnini, M.; Consolandi, C.; et al. Insights Into Vaginal Bacterial Communities and Metabolic Profiles of Chlamydia trachomatis Infection: Positioning Between Eubiosis and Dysbiosis. Front. Microbiol. 2018, 9, 600. [Google Scholar] [CrossRef]
  8. Ceccarani, C.; Foschi, C.; Parolin, C.; D’Antuono, A.; Gaspari, V.; Consolandi, C.; Laghi, L.; Camboni, T.; Vitali, B.; Severgnini, M.; et al. Diversity of vaginal microbiome and metabolome during genital infections. Sci. Rep. 2019, 9, 14095. [Google Scholar] [CrossRef] [Green Version]
  9. Noyes, N.; Cho, K.C.; Ravel, J.; Forney, L.J.; Abdo, Z. Associations between sexual habits, menstrual hygiene practices, demographics and the vaginal microbiome as revealed by Bayesian network analysis. PLoS ONE 2018, 13, e0191625. [Google Scholar] [CrossRef] [PubMed] [Green Version]
  10. Dall’Asta, M.; Laghi, L.; Morselli, S.; Re, M.C.; Zagonari, S.; Patuelli, G.; Foschi, C.; Pedna, M.F.; Sambri, V.; Marangoni, A.; et al. Pre-Pregnancy Diet and Vaginal Environment in Caucasian Pregnant Women: An Exploratory Study. Front. Mol. Biosci. 2021, 8, 702370. [Google Scholar] [CrossRef]
  11. Gupta, P.; Singh, M.P.; Goyal, K. Diversity of Vaginal Microbiome in Pregnancy: Deciphering the Obscurity. Front. Public Health 2020, 8, 326. [Google Scholar] [CrossRef] [PubMed]
  12. Marangoni, A.; Laghi, L.; Zagonari, S.; Patuelli, G.; Zhu, C.; Foschi, C.; Morselli, S.; Pedna, M.F.; Sambri, V. New Insights into Vaginal Environment During Pregnancy. Front. Mol. Biosci. 2021, 8, 656844. [Google Scholar] [CrossRef] [PubMed]
  13. Jeters, R.T.; Rivera, A.J.; Boucek, L.M.; Stumpf, R.M.; Leigh, S.R.; Salyers, A.A. Antibiotic resistance genes in the vaginal microbiota of primates not normally exposed to antibiotics. Microb. Drug Resist. 2009, 15, 309–315. [Google Scholar] [CrossRef] [PubMed] [Green Version]
  14. Sirichoat, A.; Flórez, A.B.; Vázquez, L.; Buppasiri, P.; Panya, M.; Lulitanond, V.; Mayo, B. Antibiotic Susceptibility Profiles of Lactic Acid Bacteria from the Human Vagina and Genetic Basis of Acquired Resistances. Int. J. Mol. Sci. 2020, 21, 2594. [Google Scholar] [CrossRef] [Green Version]
  15. Roberts, M.C. Update on acquired tetracycline resistance genes. FEMS Microbiol. Lett. 2005, 245, 195–203. [Google Scholar] [CrossRef] [PubMed]
  16. Roberts, M.C. Update on macrolide-lincosamide-streptogramin, ketolide, and oxazolidinone resistance genes. FEMS Microbiol. Lett. 2008, 282, 147–159. [Google Scholar] [CrossRef] [Green Version]
  17. Munita, J.M.; Arias, C.A. Mechanisms of Antibiotic Resistance. Microbiol. Spectr. 2016, 4. [Google Scholar] [CrossRef] [Green Version]
  18. Reynolds, L.J.; Anjum, M.F.; Roberts, A.P. Detection of a Novel, and Likely Ancestral, Tn916-Like Element from a Human Saliva Metagenomic Library. Genes 2020, 11, 548. [Google Scholar] [CrossRef]
  19. Milanović, V.; Osimani, A.; Aquilanti, L.; Tavoletti, S.; Garofalo, C.; Polverigiani, S.; Litta-Mulondo, A.; Cocolin, L.; Ferrocino, I.; Di Cagno, R.; et al. Occurrence of antibiotic resistance genes in the fecal DNA of healthy omnivores, ovo-lacto vegetarians and vegans. Mol. Nutr. Food Res. 2017, 61, 1601098. [Google Scholar] [CrossRef]
  20. Hu, Y.; Yang, X.; Qin, J.; Lu, N.; Cheng, G.; Wu, N.; Pan, Y.; Li, J.; Zhu, L.; Wang, X.; et al. Metagenome-wide analysis of antibiotic resistance genes in a large cohort of human gut microbiota. Nat. Commun. 2013, 4, 2151. [Google Scholar] [CrossRef] [Green Version]
  21. Garofalo, C.; Vignaroli, C.; Zandri, G.; Aquilanti, L.; Bordoni, D.; Osimani, A.; Clementi, F.; Biavasco, F. Direct detection of antibiotic resistance genes in specimens of chicken and pork meat. Int. J. Food Microbiol. 2007, 113, 75–83. [Google Scholar] [CrossRef] [PubMed]
  22. Alicea-Serrano, A.M.; Contreras, M.; Magris, M.; Hidalgo, G.; Dominguez-Bello, M.G. Tetracycline resistance genes acquired at birth. Arch. Microbiol. 2013, 195, 447–451. [Google Scholar] [CrossRef]
  23. Roachford, O.S.E.; Alleyne, A.T.; Kuelbs, C.; Torralba, M.G.; Nelson, K.E. The cervicovaginal microbiome and its resistome in a random selection of Afro-Caribbean women. Hum. Microbiome J. 2021, 20, 100079. [Google Scholar] [CrossRef]
  24. Di Simone, N.; Santamaria Ortiz, A.; Specchia, M.; Tersigni, C.; Villa, P.; Gasbarrini, A.; Scambia, G.; D’Ippolito, S. Recent Insights on the Maternal Microbiota: Impact on Pregnancy Outcomes. Front. Immunol. 2020, 11, 528202. [Google Scholar] [CrossRef] [PubMed]
  25. Fox, C.; Eichelberger, K. Maternal microbiome and pregnancy outcomes. Fertil. Steril. 2015, 104, 1358–1363. [Google Scholar] [CrossRef] [Green Version]
  26. Wilson, B.C.; Butler, É.M.; Grigg, C.P.; Derraik, J.G.B.; Chiavaroli, V.; Walker, N.; Thampi, S.; Creagh, C.; Reynolds, A.J.; Vatanen, T.; et al. Oral administration of maternal vaginal microbes at birth to restore gut microbiome development in infants born by caesarean section: A pilot randomised placebo-controlled trial. EBioMedicine 2021, 69, 103443. [Google Scholar] [CrossRef] [PubMed]
  27. Nugent, R.P.; Krohn, M.A.; Hillier, S.L. Reliability of diagnosing bacterial vaginosis is improved by a standardized method of gram stain interpretation. J. Clin. Microbiol. 1991, 29, 297–301. [Google Scholar] [CrossRef] [PubMed] [Green Version]
  28. Card, R.M.; Warburton, P.J.; MacLaren, N.; Mullany, P.; Allan, E.; Anjum, M.F. Application of microarray and functional-based screening methods for the detection of antimicrobial resistance genes in the microbiomes of healthy humans. PLoS ONE 2014, 9, e86428. [Google Scholar] [CrossRef] [Green Version]
  29. Petricevic, L.; Kaufmann, U.; Domig, K.J.; Kraler, M.; Marschalek, J.; Kneifel, W.; Kiss, H. Rectal Lactobacillus species and their influence on the vaginal microflora: A model of male-to-female transsexual women. J. Sex. Med. 2014, 11, 2738–2743. [Google Scholar] [CrossRef]
  30. Lee, C.Y.; Cheu, R.K.; Lemke, M.M.; Gustin, A.T.; France, M.T.; Hampel, B.; Thurman, A.R.; Doncel, G.F.; Ravel, J.; Klatt, N.R.; et al. Quantitative modeling predicts mechanistic links between pre-treatment microbiome composition and metronidazole efficacy in bacterial vaginosis. Nat. Commun. 2020, 11, 6147. [Google Scholar] [CrossRef]
  31. Laghi, L.; Zagonari, S.; Patuelli, G.; Zhu, C.; Foschi, C.; Morselli, S.; Pedna, M.F.; Sambri, V.; Marangoni, A. Vaginal metabolic profiles during pregnancy: Changes between first and second trimester. PLoS ONE 2021, 16, e0249925. [Google Scholar] [CrossRef] [PubMed]
  32. Kroon, S.J.; Ravel, J.; Huston, W.M. Cervicovaginal microbiota, women’s health, and reproductive outcomes. Fertil. Steril. 2018, 11, 327–336. [Google Scholar] [CrossRef] [PubMed] [Green Version]
  33. Dominguez-Bello, M.G.; Costello, E.K.; Contreras, M.; Magris, M.; Hidalgo, G.; Fierer, N.; Knight, R. Delivery mode shapes the acquisition and structure of the initial microbiota across multiple body habitats in newborns. Proc. Natl. Acad. Sci. USA 2010, 107, 11971–11975. [Google Scholar] [CrossRef] [Green Version]
  34. Gueimonde, M.; Salminen, S.; Isolauri, E. Presence of specific antibiotic (tet) resistance genes in infant faecal microbiota. FEMS Immunol. Med. Microbiol. 2006, 48, 21–25. [Google Scholar] [CrossRef] [PubMed] [Green Version]
  35. Cao, L.; Chen, H.; Wang, Q.; Li, B.; Hu, Y.; Zhao, C.; Hu, Y.; Yin, Y. Literature-Based Phenotype Survey and In Silico Genotype Investigation of Antibiotic Resistance in the Genus Bifidobacterium. Curr. Microbiol. 2020, 77, 4104–4113. [Google Scholar] [CrossRef] [PubMed]
  36. Lugli, G.A.; Milani, C.; Turroni, F.; Duranti, S.; Ferrario, C.; Viappiani, A.; Mancabelli, L.; Mangifesta, M.; Taminiau, B.; Delcenserie, V.; et al. Investigation of the evolutionary development of the genus Bifidobacterium by comparative genomics. Appl. Environ. Microbiol. 2014, 80, 6383–6394. [Google Scholar] [CrossRef] [Green Version]
  37. Si, J.; You, H.J.; Yu, J.; Sung, J.; Ko, G. Prevotella as a Hub for Vaginal Microbiota under the Influence of Host Genetics and Their Association with Obesity. Cell Host Microbe 2017, 21, 97–105. [Google Scholar] [CrossRef] [Green Version]
  38. Patterson, A.J.; Colangeli, R.; Spigaglia, P.; Scott, K.P. Distribution of specific tetracycline and erythromycin resistance genes in environmental samples assessed by macroarray detection. Environ. Microbiol. 2007, 9, 703–715. [Google Scholar] [CrossRef]
  39. Murphy, A.; Barich, D.; Fennessy, M.S.; Slonczewski, J.L. An Ohio State Scenic River Shows Elevated Antibiotic Resistance Genes, Including Acinetobacter Tetracycline and Macrolide Resistance, Downstream of Wastewater Treatment Plant Effluent. Microbiol. Spectr. 2021, 1, e0094121. [Google Scholar] [CrossRef]
  40. Donders, G.; Bellen, G.; Rezeberga, D. Aerobic vaginitis in pregnancy. BJOG 2011, 118, 1163–1170. [Google Scholar] [CrossRef]
  41. Yano, J.; Sobel, J.D.; Nyirjesy, P.; Sobel, R.; Williams, V.L.; Yu, Q.; Noverr, M.C.; Fidel, P.L., Jr. Current patient perspectives of vulvovaginal candidiasis: Incidence, symptoms, management and post-treatment outcomes. BMC Womens Health 2019, 19, 48. [Google Scholar] [CrossRef] [Green Version]
  42. Zozaya-Hinchliffe, M.; Lillis, R.; Martin, D.H.; Ferris, M.J. Quantitative PCR assessments of bacterial species in women with and without bacterial vaginosis. J. Clin. Microbiol. 2010, 48, 1812–1819. [Google Scholar] [CrossRef] [Green Version]
  43. Marangoni, A.; Foschi, C.; Nardini, P.; Compri, M.; Cevenini, R. Evaluation of the Versant CT/GC DNA 1.0 assay (kPCR) for the detection of extra-genital Chlamydia trachomatis and Neisseria gonorrhoeae infections. PLoS ONE 2015, 10, e0120979. [Google Scholar] [CrossRef]
  44. Chopra, I.; Roberts, M. Tetracycline antibiotics: Mode of action, applications, molecular biology, and epidemiology of bacterial resistance. Microbiol. Mol. Biol. Rev. 2001, 65, 232–260. [Google Scholar] [CrossRef] [Green Version]
  45. Liu, B.; Pop, M. ARDB--Antibiotic Resistance Genes Database. Nucleic Acids Res. 2009, 37, D443–D447. [Google Scholar] [CrossRef] [PubMed] [Green Version]
  46. Masella, A.P.; Bartram, A.K.; Truszkowski, J.M.; Brown, D.G.; Neufeld, J.D. PANDAseq: Paired-end assembler for Illumina sequences. BMC Bioinform. 2012, 13, 31. [Google Scholar] [CrossRef] [PubMed] [Green Version]
  47. Caporaso, J.G.; Kuczynski, J.; Stombaugh, J.; Bittinger, K.; Bushman, F.D.; Costello, E.K.; Fierer, N.; Peña, A.G.; Goodrich, J.K.; Gordon, J.I.; et al. Correspondence QIIME allows analysis of high throughput community sequencing data Intensity normalization improves color calling in SOLiD sequencing. Nat. Methods 2010, 7, 335–336. [Google Scholar] [CrossRef] [Green Version]
  48. Edgar, R.C. UNOISE2: Improved error-correction for Illumina 16S and ITS amplicon sequencing. BioRxiv 2016, 081257. [Google Scholar] [CrossRef] [Green Version]
  49. Wang, Q.; Garrity, G.M.; Tiedje, J.M.; Cole, J.R. Naive Bayesian classifier for rapid assignment of rRNA sequences into the new bacterial taxonomy. Appl. Environ. Microbiol. 2007, 73, 5261–5267. [Google Scholar] [CrossRef] [Green Version]
  50. Lozupone, C.; Lladser, M.E.; Knights, D.; Stombaugh, J.; Knight, R. UniFrac: An effective distance metric for microbial community comparison. ISME J. 2011, 5, 169–172. [Google Scholar] [CrossRef] [Green Version]
  51. Oksanen, J.; Blanchet, F.G.; Kindt, R.; Legendre, P.; Minchin, P.R.; O’Hara, R.B.; Simpson, G.L.; Solymos, P.; Stevens, M.H.H.; Szoecs, E.; et al. Package “Vegan”. R Package Version 2.0–10. 2013. Available online: https://cran.r-project.org/src/contrib/Archive/vegan/vegan_2.0-10.tar.gz (accessed on 25 November 2021).
  52. Gupta, S.D. Point biserial correlation coefficient and its generalization. Psychometrika 1960, 25, 393–408. [Google Scholar] [CrossRef]
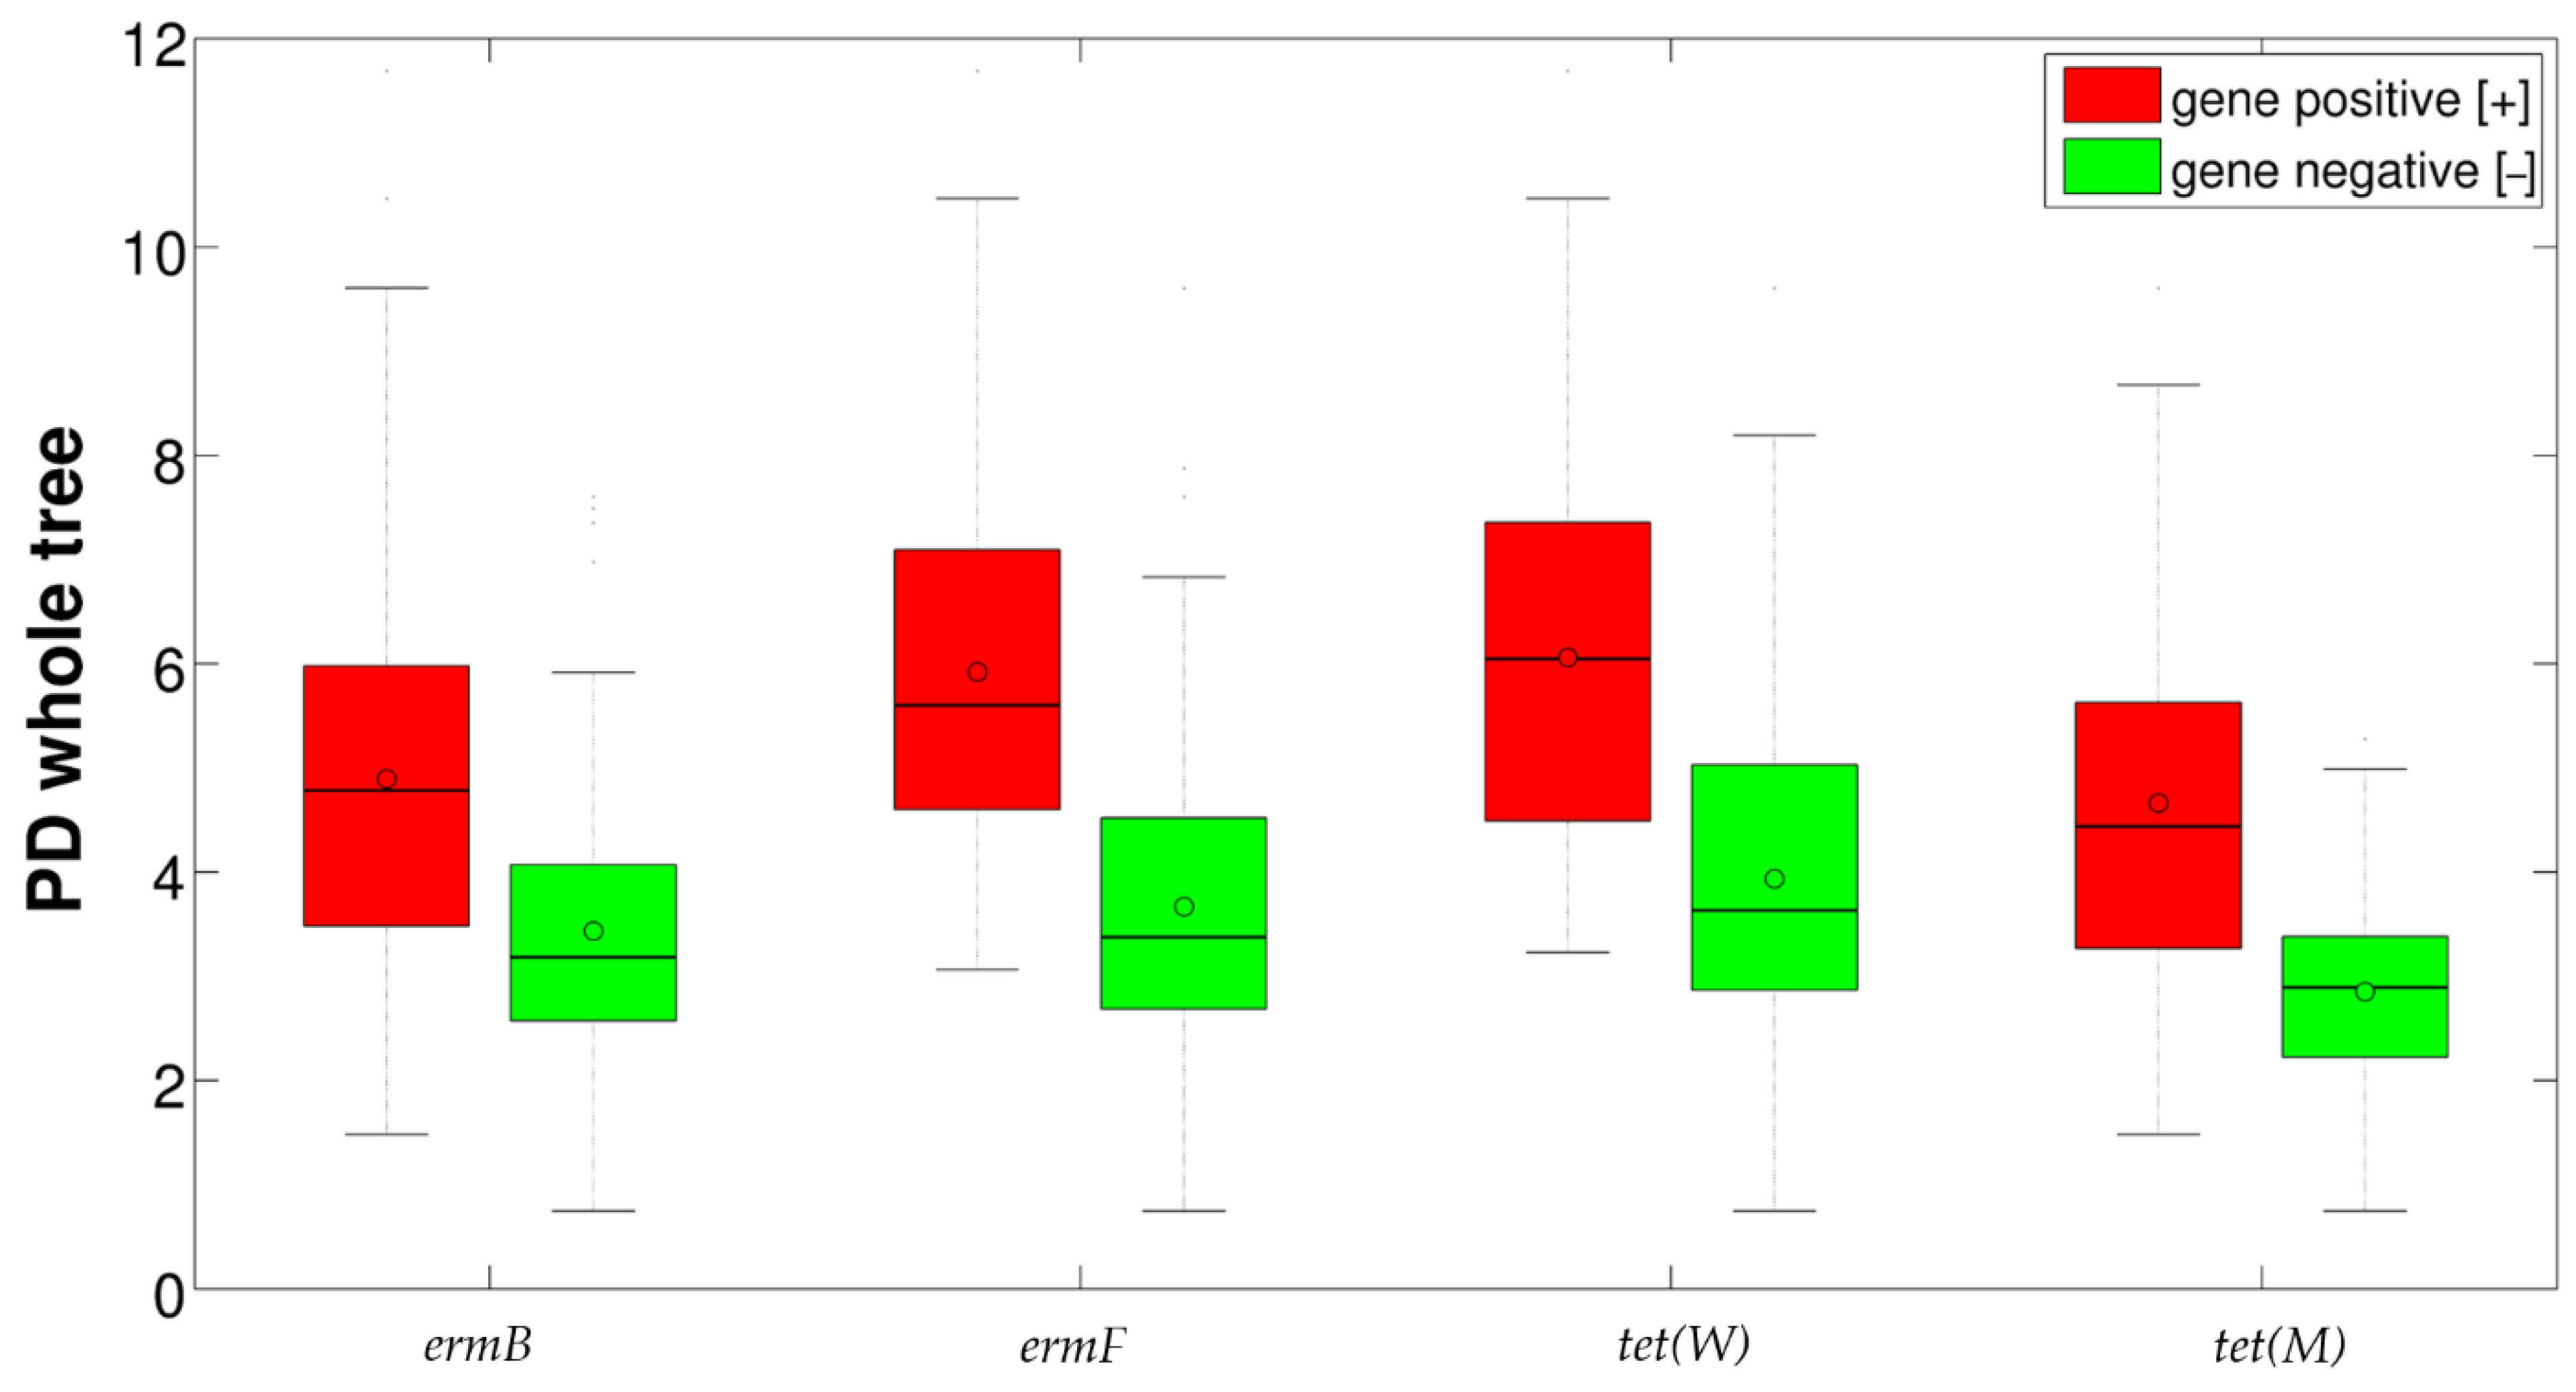
Figure 1. Boxplot of the alpha-diversities (Faith’s phylogenetic diversity metric) of samples positive and negative for the four resistance genes tested. Black lines represent median values; circles represent means.
Pathogens 10 01546 g001
Figure 2. Beta-diversity analysis of microbial profiles according to the presence of the four resistance genes. (A) Horizontal boxplots representing the distribution of the first component deriving from principal coordinate analysis (PCoA, unweighted Unifrac distance) for samples positive or negative for each of the four resistance genes tested. (B) PCoA of unweighted Unifrac distances among samples; each point represents a sample, centroids are positioned at the average coordinate per group, ellipses are 95% confidence estimates of the standard error of the mean; colors indicate a different combination of the presence of the four resistance genes; only combinations with >1 sample per group were considered; the first and second principal coordinate are represented. (C) Plot representing the centroids of the PCoA (unweighted Unifrac) of the samples grouped according to the number of resistance genes; the first and second principal coordinates are represented.
Pathogens 10 01546 g002
Figure 3. (A) Horizontal barplots of the average relative abundance of the main genera constituting the vaginal microbiota of the tested women, grouped according to the combination of the different resistance genes; only combinations with >1 sample per group and only genera with avg. rel. ab. >1% in at least one combination were considered. (B) Line plot of the average relative abundance of a selection of genera from the vaginal microbiota, showing an increasing trend with increasing number of resistance genes per sample; for graphical purposes, Prevotella abundance (dashed blue line) is represented on the secondary y-axis.
Pathogens 10 01546 g003
Figure 4. Kaplan-Meier curves of resistance gene positivity. Detection of a resistance gene was exploited as a survival event among samples above (red) or under (blue) bacterial relative abundance thresholds. Crosshairs represent censored observations. All curves reported have a significant log-rank separation (p-value < 0.05).
Pathogens 10 01546 g004
Table 1. Distribution of macrolide and tetracycline resistance genes, stratified for the vaginal status by Nugent score [27]. Statistical analysis was performed by Chi-square test.
GeneH %
(n = 142)
I %
(n = 51)
BV %
(n = 35)
p Value
ermB49.2% (70)58.8% (30)74.2% (26)0.024
ermF19.0% (27)29.4% (15)45.7% (16)0.003
tet(M)71.1% (101)82.3% (42)91.4% (32)0.021
tet(W)14.0% (20)11.7% (6)20.0% (7)0.553
Table 2. Bacterial genera statistically different between samples showing presence and absence of each resistance gene. “Gene positive [+]/negative [−]” refers to the average relative abundance of each genus on all samples positive/negative for the specified resistance gene.
GenePhylogenetic_NameAvg. Relative Abundance (%)Significance a
Gene Positive [+]Gene Negative [−]
ermBLactobacillus67.176.6*
Prevotella5.00.8***
Atopobium2.92.6***
Streptococcus1.41.0*
ermFLactobacillus57.276.2***
Gardnerella11.69.5*
Prevotella7.31.8***
Atopobium3.32.6***
Streptococcus1.91.0*
Prevotella 6b1.30.1***
Anaerococcus1.10.1***
tet(W)Lactobacillus57.473.7**
Bifidobacterium4.83.1**
Prevotella7.02.5***
Atopobium1.13.0**
Sneathia1.50.6**
Prevotella 61.60.2***
Anaerococcus1.50.2**
tet(M)Lactobacillus67.883.0***
Bifidobacterium4.20.8**
Prevotella4.00.4***
Atopobium3.40.7***
Streptococcus1.60.0***
ap-value of Mann-Whitney U-test, with Benjamini-Hochberg FDR correction. ***: p < 0.001; **: p < 0.01; *: p < 0.05. b Prevotella genus in SILVA database (release 132) was split into multiple groups according to sequence similarity. Prevotella 6 group includes the following species: Prevotella bergensis, P. colorans, P. corporis, and P. salivae, plus other non-species characterized strains and some uncultured bacteria.
Table 3. Correlation between the relative abundance of vaginal bacterial genera and presence of macrolide and tetracycline resistance genes. Only genera with an average relative abundance >0.4% were reported. “--” indicates that the p-value of the linear model for correlation calculation was >0.05.
GeneraResistance Gene
ermBermFtet(W)tet(M)
Lactobacillus−0.136−0.239−0.165−0.185
Gardnerella--0.0460.074--
Bifidobacterium----0.0510.123
Prevotella0.2640.3040.1990.192
Atopobium0.0160.029−0.0620.100
Streptococcus0.0290.066--0.104
Sneathia0.205--0.093--
Alloscardovia------0.105
Ureaplasma--0.175----
Dialister0.1540.2000.1530.201
Prevotella 60.0990.3060.2710.125
Aerococcus--0.0350.0030.076
Anaerococcus0.0670.2800.3000.125
Publisher’s Note: MDPI stays neutral with regard to jurisdictional claims in published maps and institutional affiliations.