
Interaction between M. tuberculosis Lineage and Human Genetic Variants Reveals Novel Pathway Associations with Severity of TB

 ,
,
Abstract
:1. Introduction
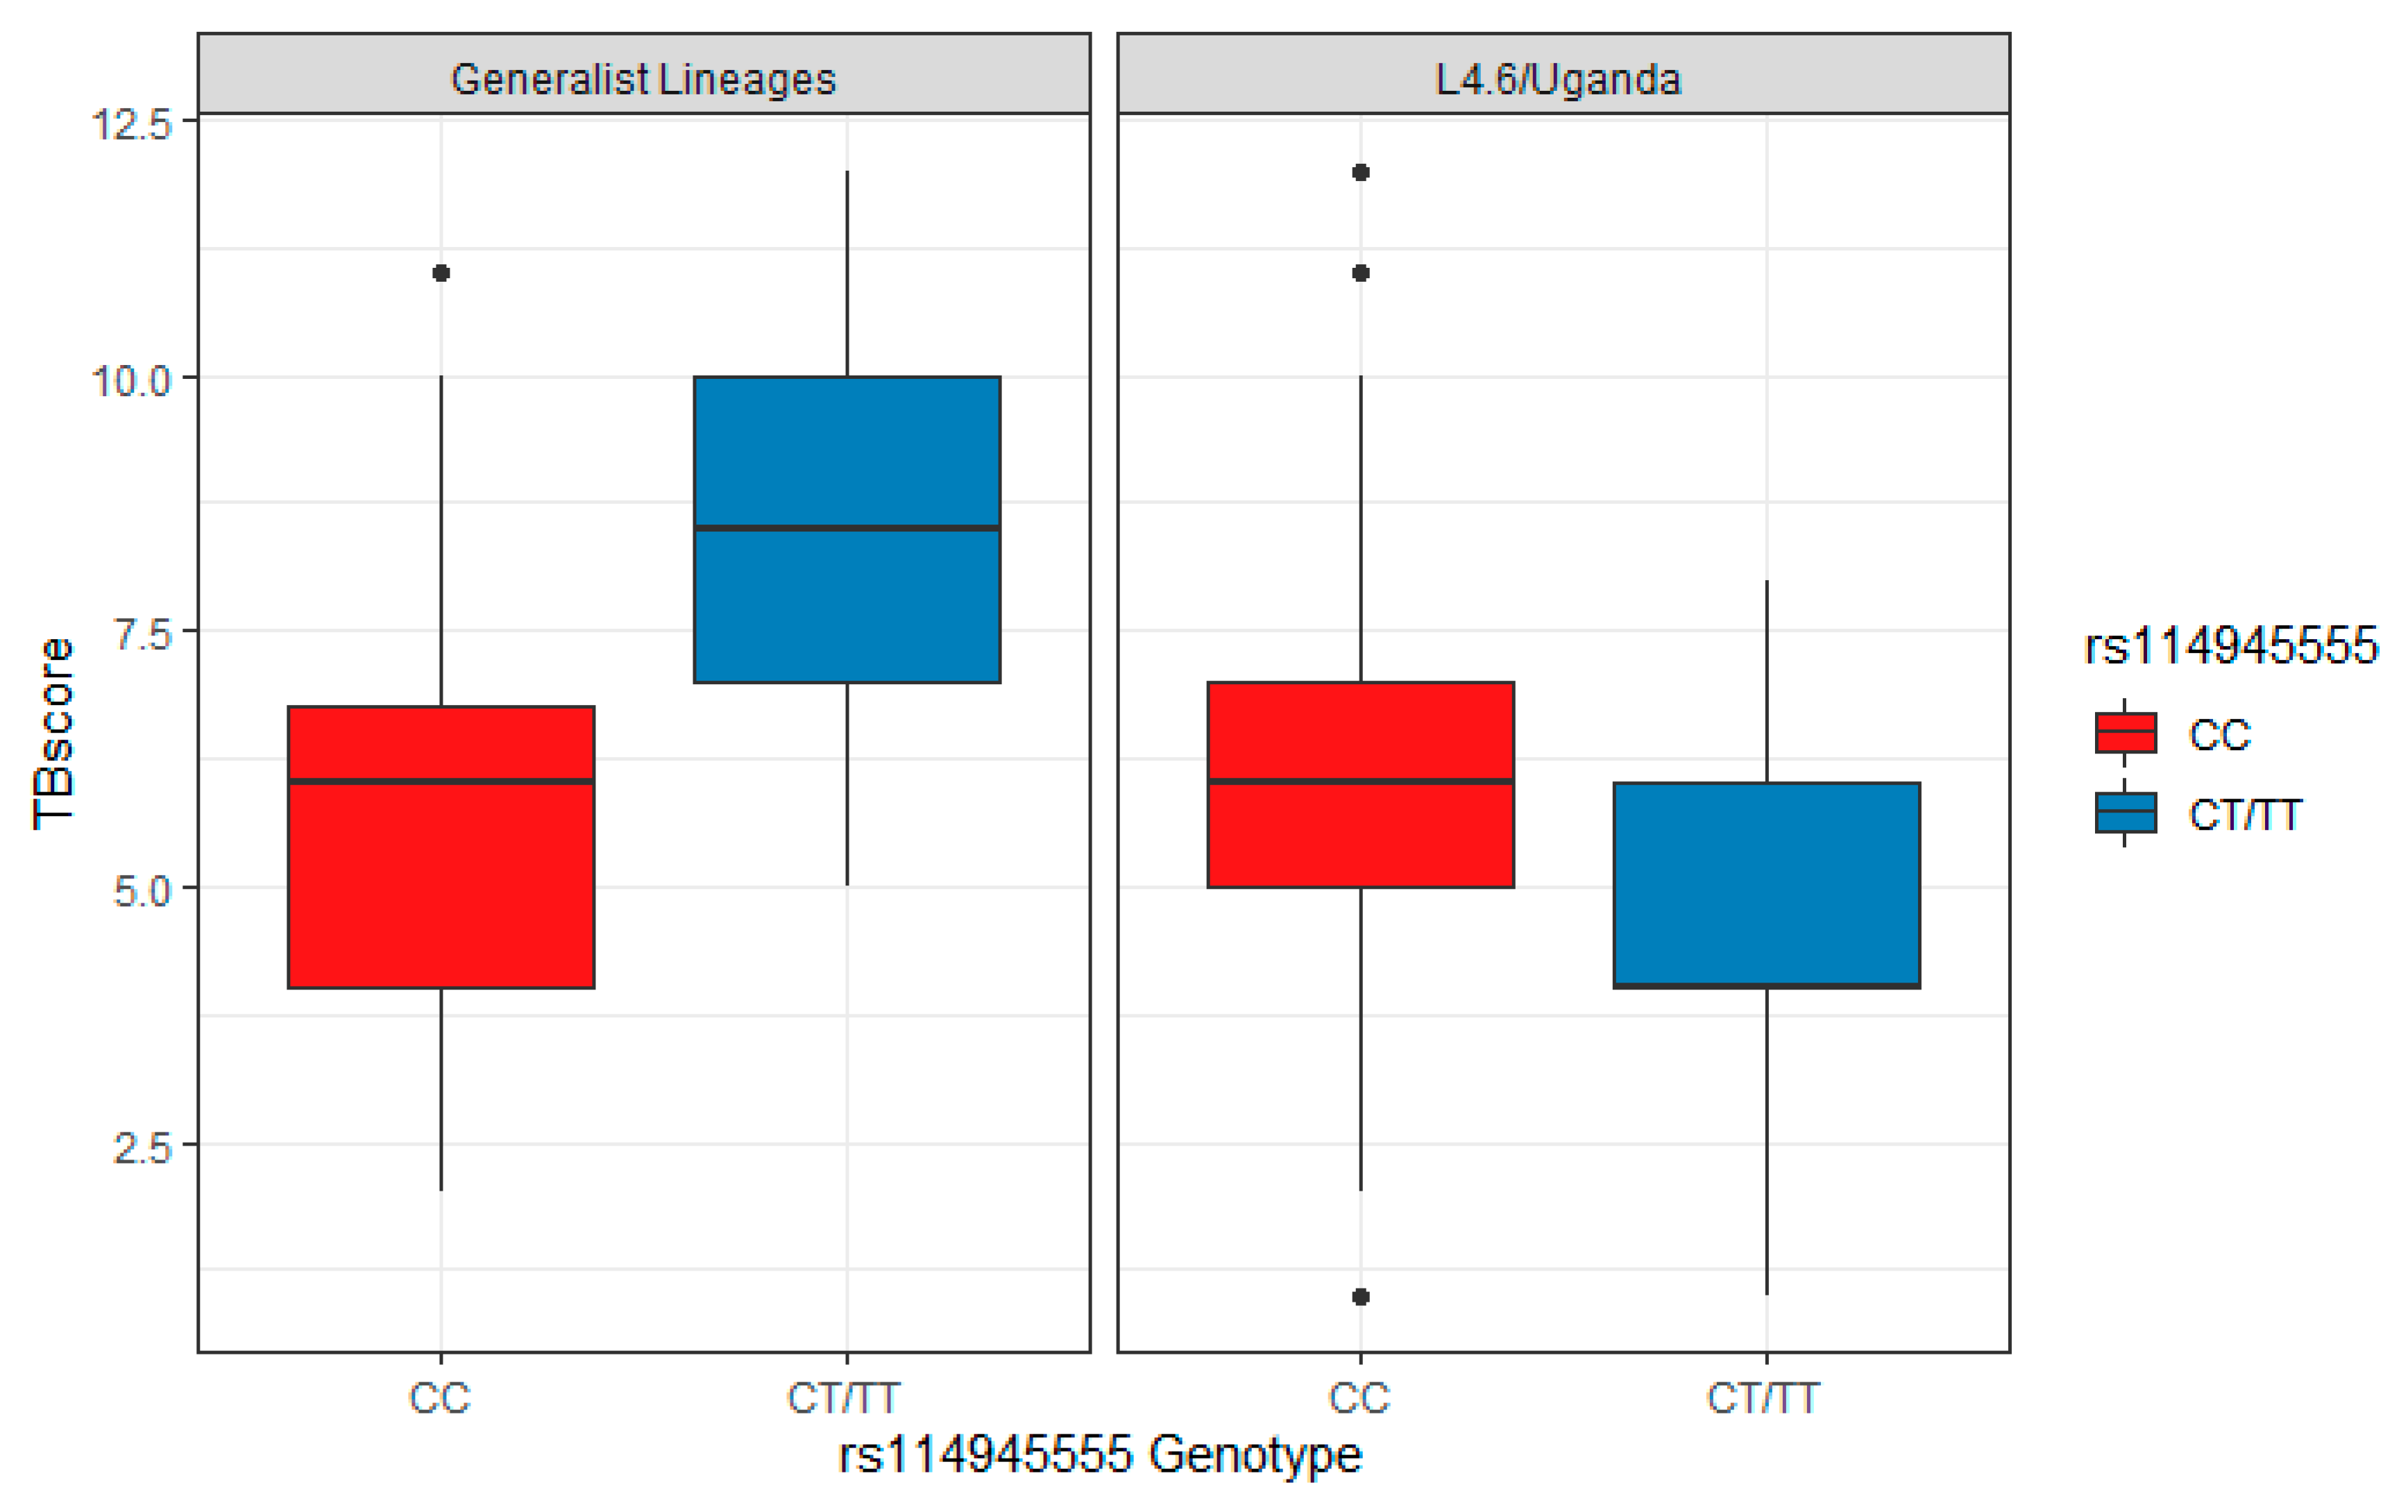
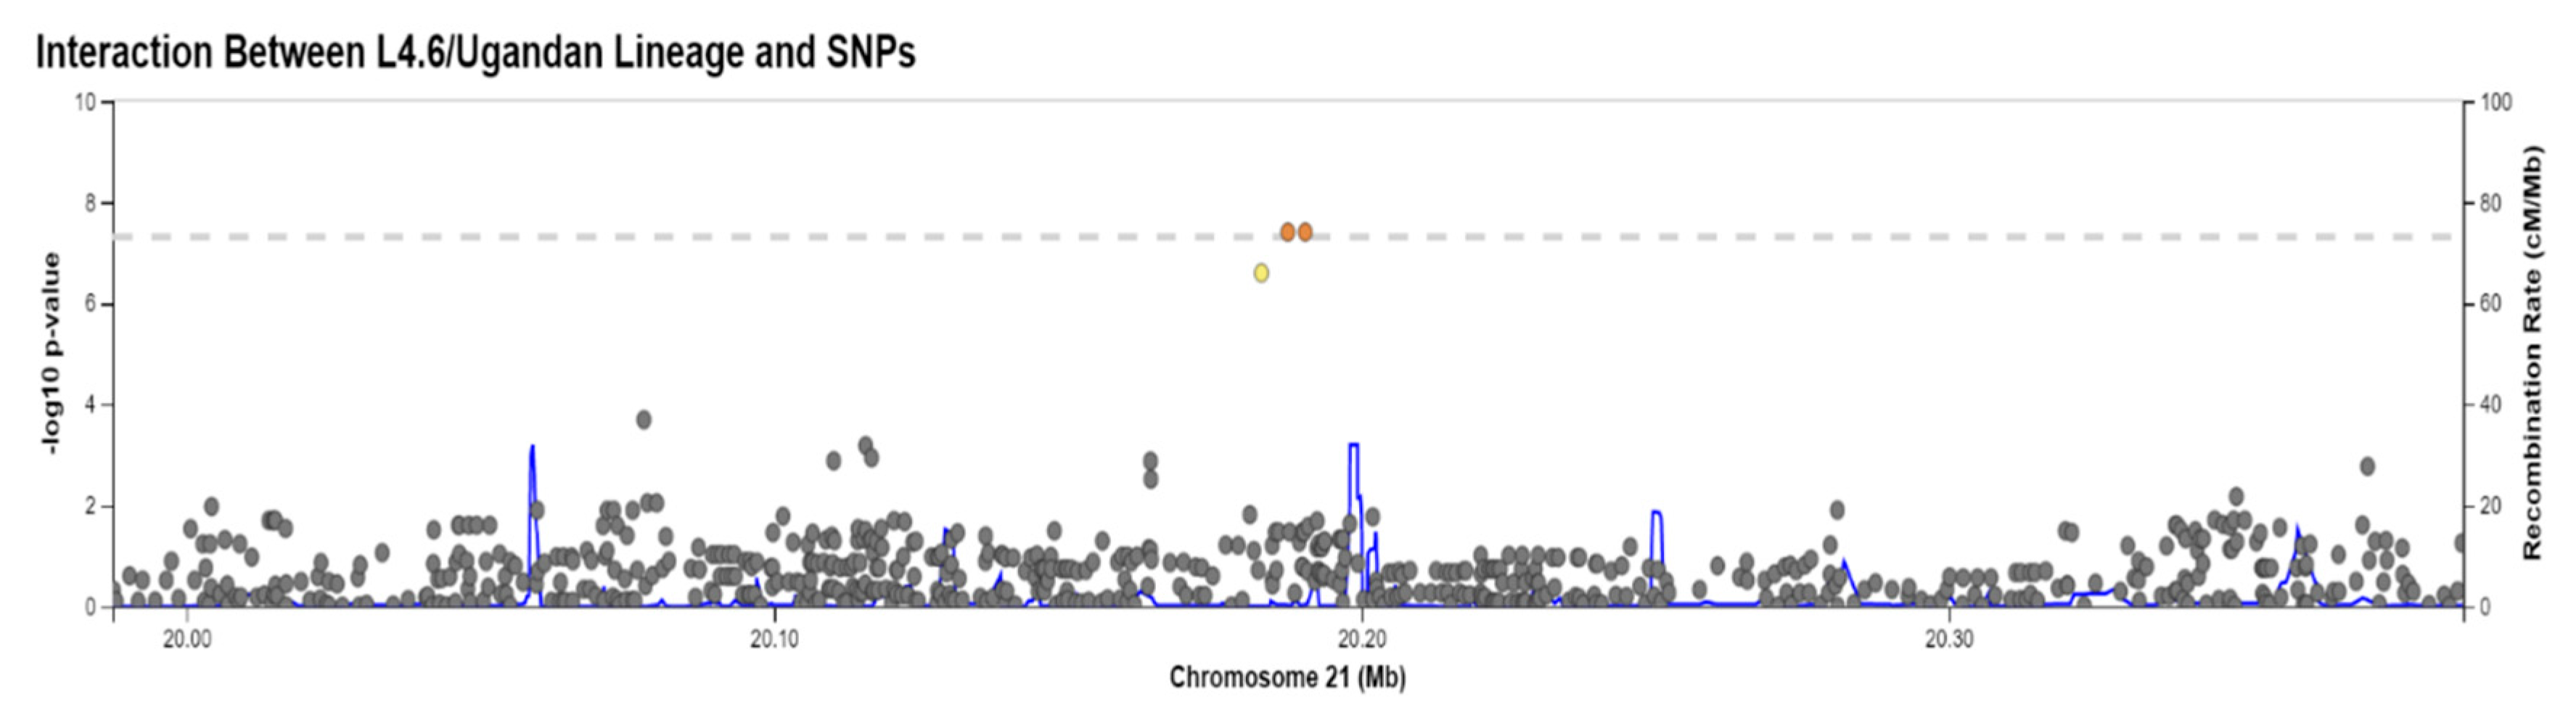
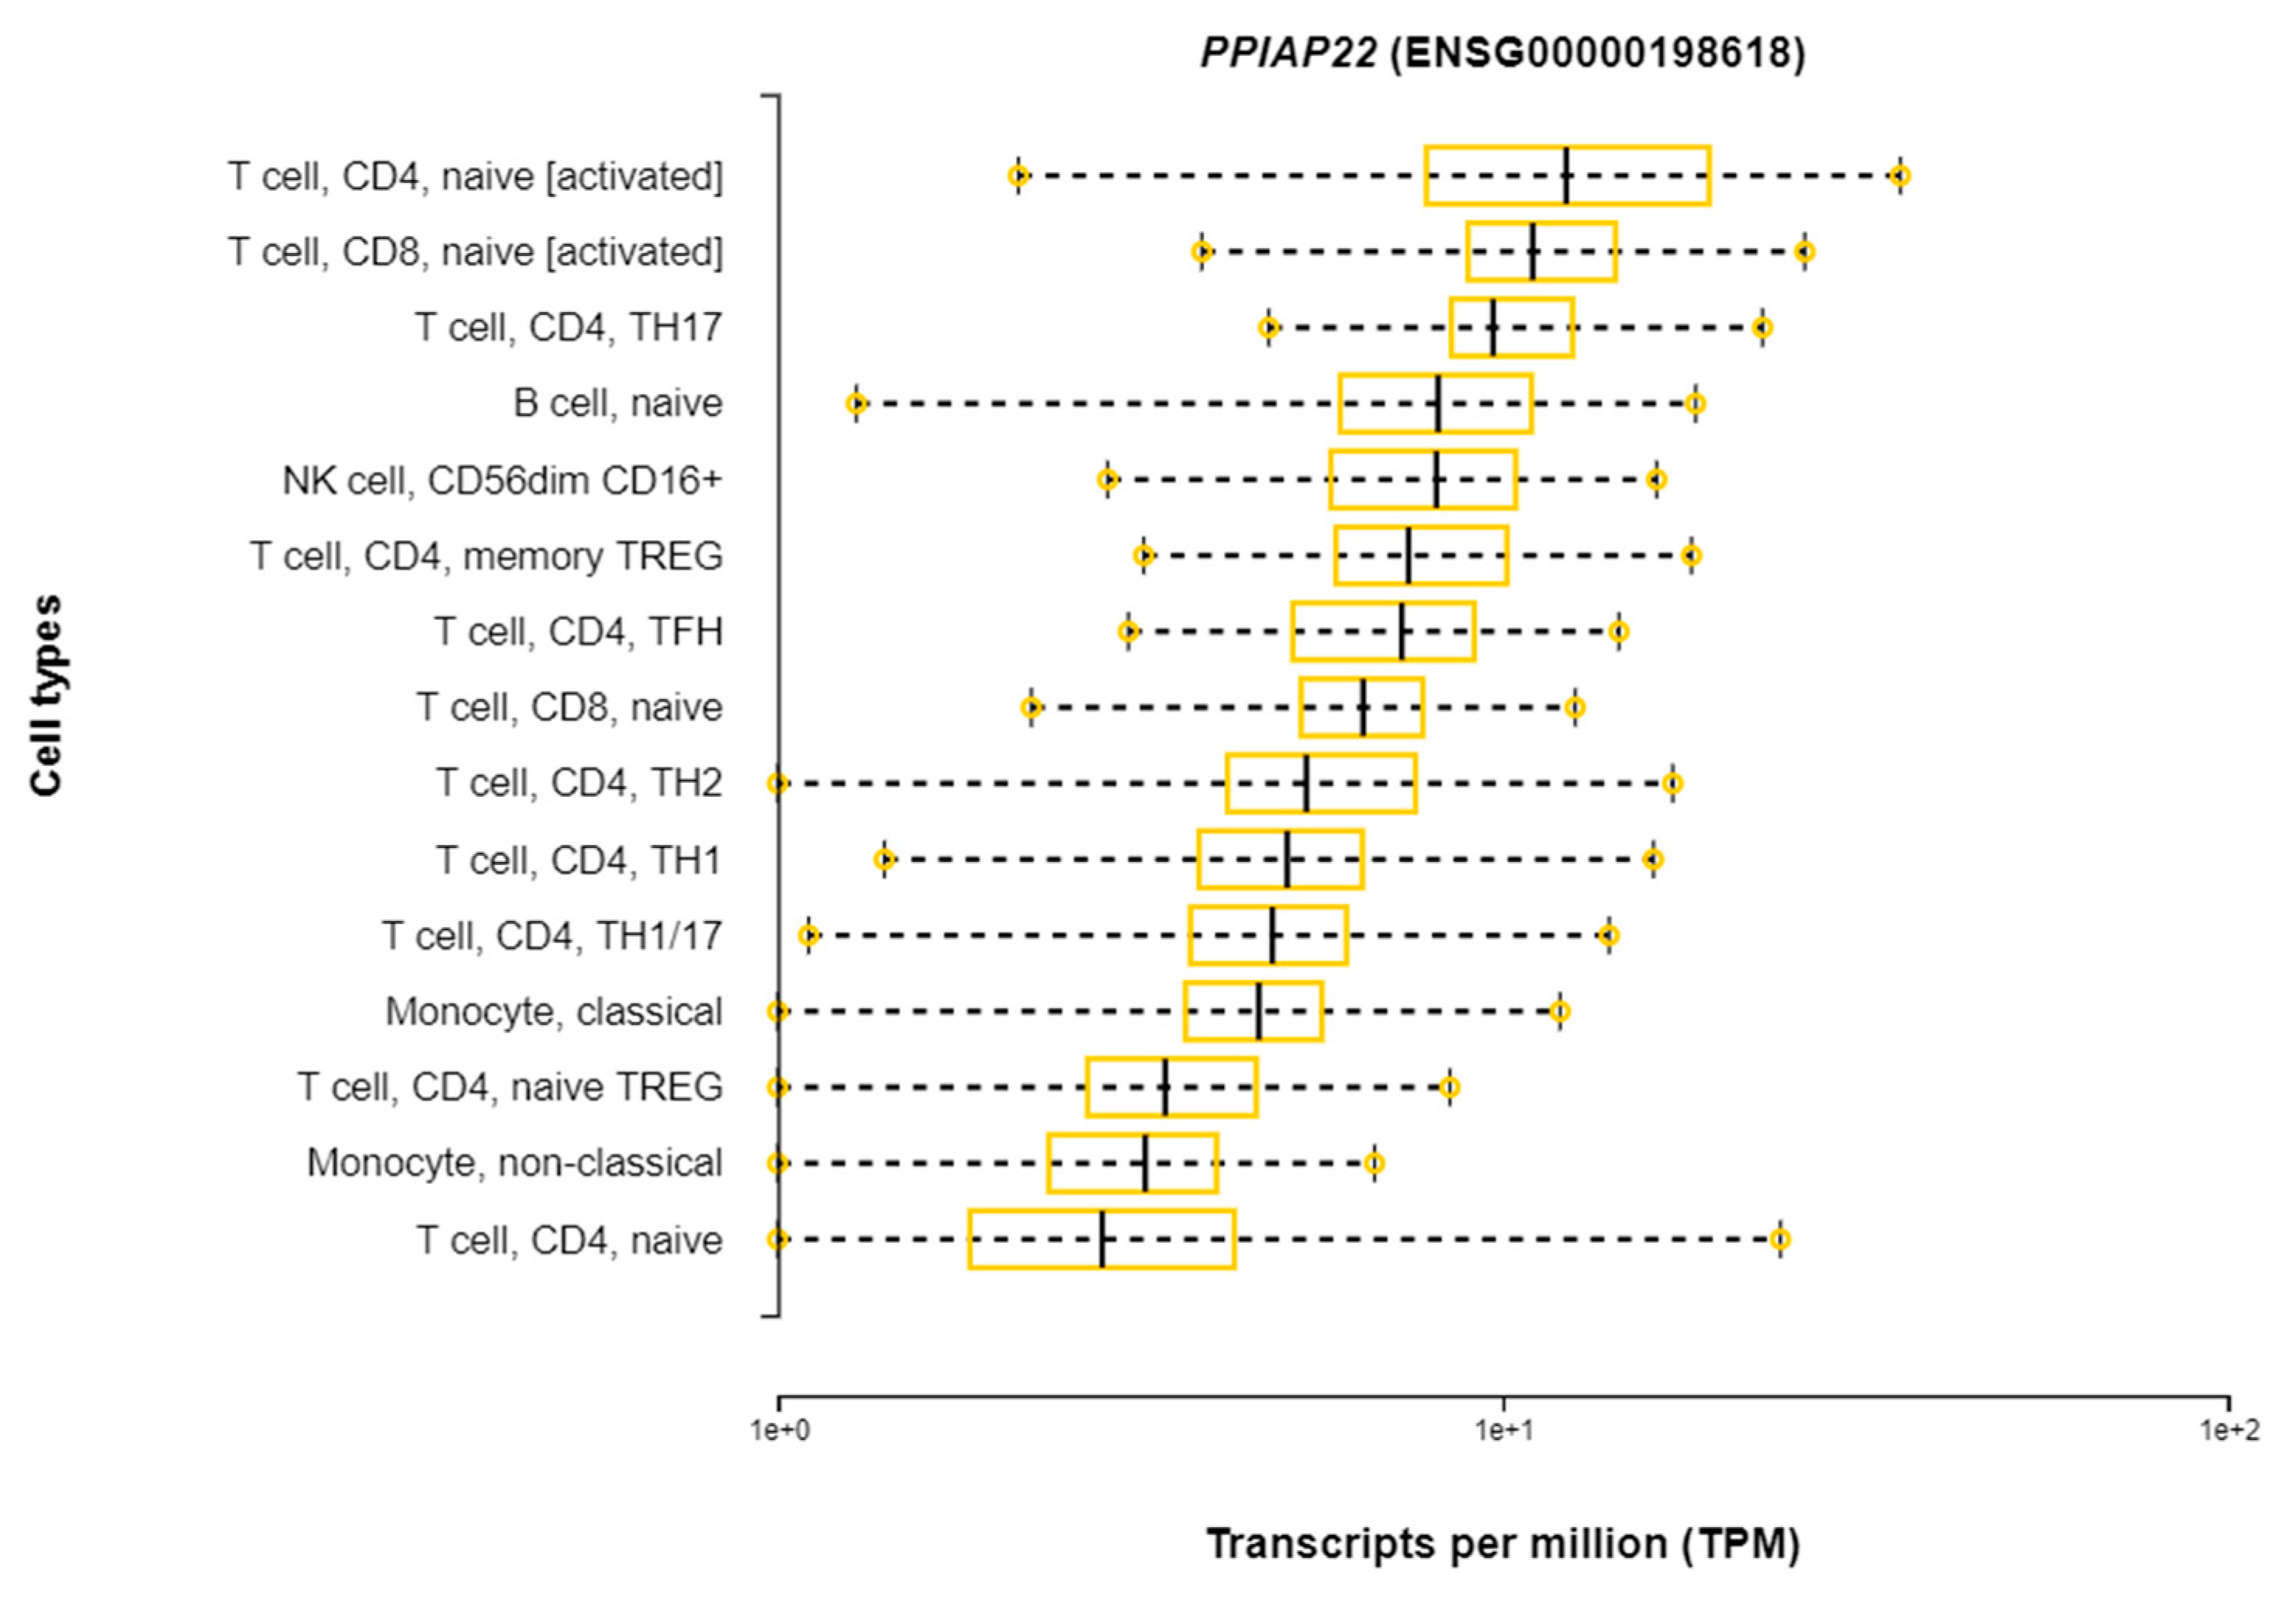
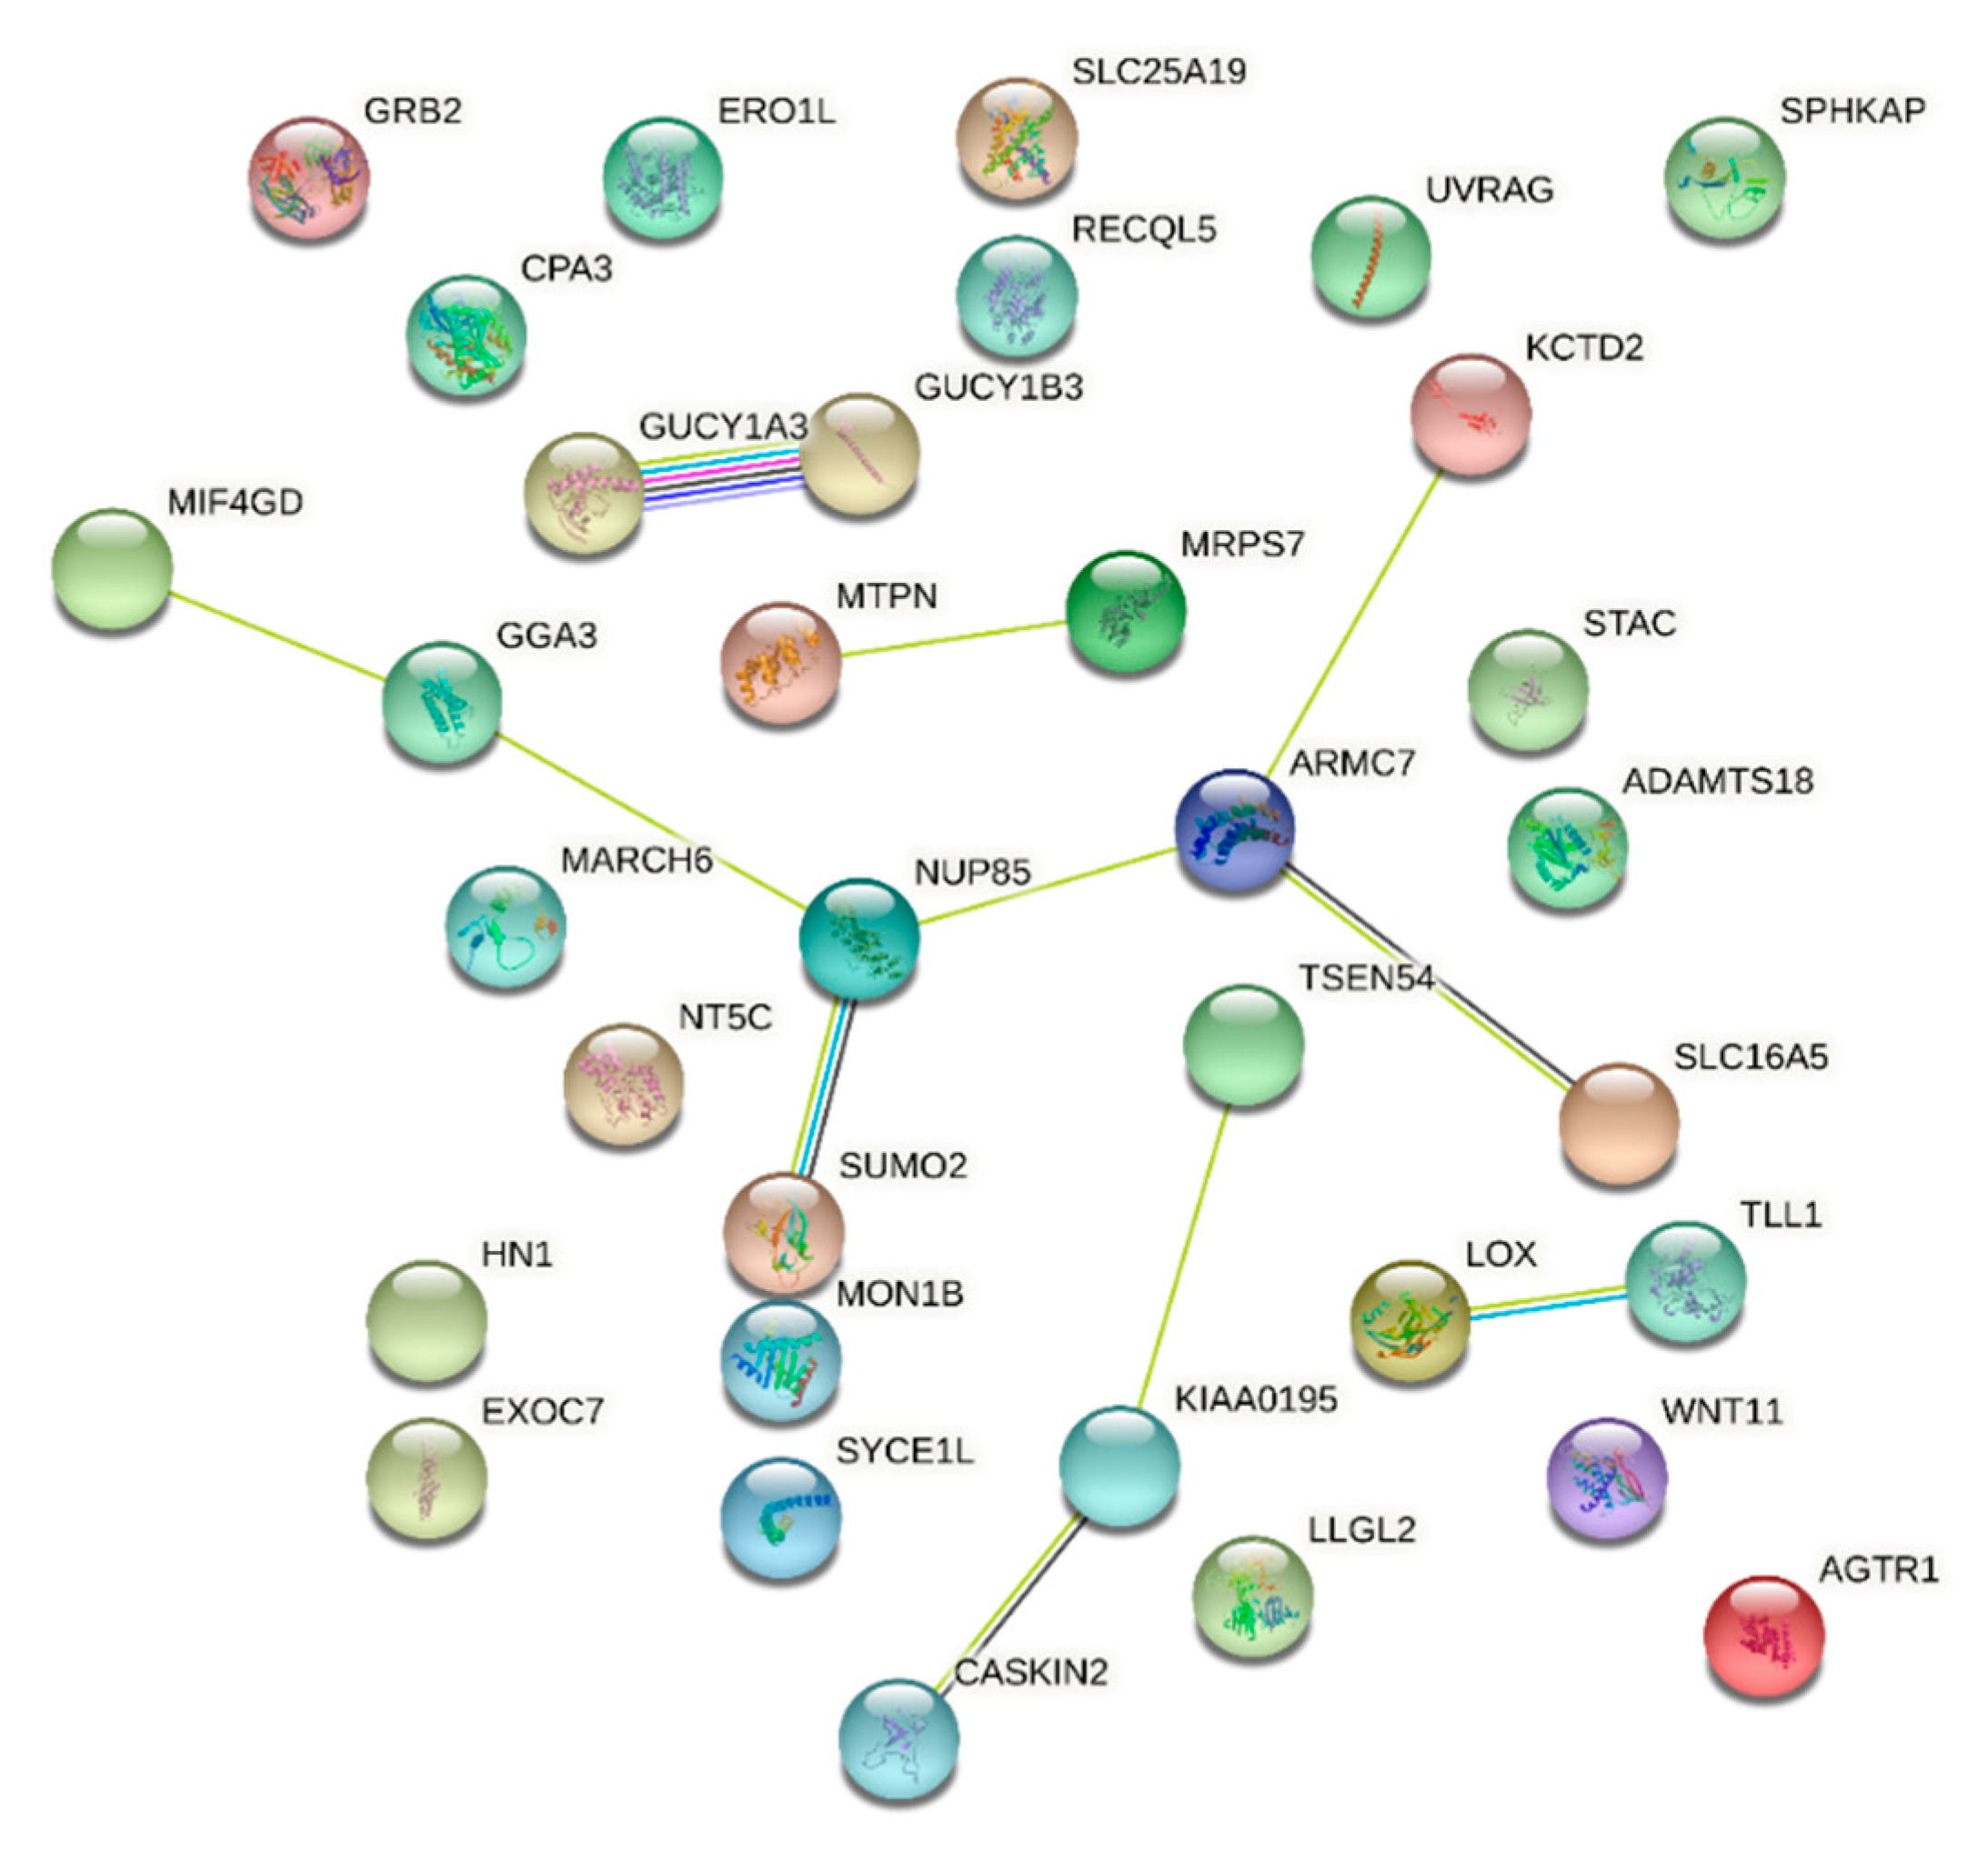
2. Results
3. Discussion
4. Materials and Methods
4.1. Study Participants
4.2. Human Genotyping and QC
4.3. Determination of MTB Lineage
4.4. Statistical Analysis
Supplementary Materials
Author Contributions
Funding
Institutional Review Board Statement
Informed Consent Statement
Data Availability Statement
Acknowledgments
Conflicts of Interest
References
- World Health Organization. WHO Tuberculosis Fact Sheet. 2020. Available online: https://www.who.int/news-room/fact-sheets/detail/tuberculosis (accessed on 30 September 2021).
- World Health Organization. Global Tuberculosis Report 2018 Factsheet; World Health Organization: Geneva, Switzerland, 2018; Available online: https://apps.who.int/iris/handle/10665/274453 (accessed on 30 September 2021).
- Bell, L.C.K.; Noursadeghi, M. Pathogenesis of HIV-1 and Mycobacterium tuberculosis co-infection. Nat. Rev. Microbiol. 2017, 16, 80. [Google Scholar] [CrossRef]
- Stucki, D.; Brites, D.; Jeljeli, L.; Coscolla, M.; Liu, Q.; Trauner, A.; Fenner, L.; Rutaihwa, L.; Borrell, S.; Luo, T.; et al. Mycobacterium tuberculosis lineage 4 comprises globally distributed and geographically restricted sublineages. Nat. Genet. 2016, 48, 1535–1543. [Google Scholar] [CrossRef]
- Ngabonziza, J.C.M.S.; Loiseau, C.; Marceau, M.; Jouet, A.; Menardo, F.; Tzfadia, O.; Antoine, R.; Niyigena, E.B.; Mulders, W.; Fissette, K.; et al. A sister lineage of the Mycobacterium tuberculosis complex discovered in the African Great Lakes region. Nat. Commun. 2020, 11, 2917. [Google Scholar] [CrossRef] [PubMed]
- Gagneux, S.; Small, P.M. Global phylogeography of Mycobacterium tuberculosis and implications for tuberculosis product development. Lancet Infect. Dis. 2007, 7, 328–337. [Google Scholar] [CrossRef]
- Gagneux, S. Ecology and evolution of Mycobacterium tuberculosis. Nat. Rev. Microbiol. 2018, 16, 202–213. [Google Scholar] [CrossRef] [PubMed]
- Coscolla, M.; Gagneux, S. Consequences of genomic diversity in Mycobacterium tuberculosis. Semin. Immunol. 2014, 26, 431–444. [Google Scholar] [CrossRef] [PubMed] [Green Version]
- Comas, I.; Coscolla, M.; Luo, T.; Borrell, S.; Holt, K.; Kato-Maeda, M.; Parkhill, J.; Malla, B.; Berg, S.; Thwaites, G.; et al. Out-of-Africa migration and Neolithic coexpansion of Mycobacterium tuberculosis with modern humans. Nat. Genet. 2013, 45, 1176–1182. [Google Scholar] [CrossRef] [PubMed]
- Gagneux, S. Host-pathogen coevolution in human tuberculosis. Philos. Trans. R. Soc. London. Ser. B Biol. Sci. 2012, 367, 850–859. [Google Scholar] [CrossRef] [PubMed] [Green Version]
- Kodaman, N.; Sobota, R.S.; Mera, R.; Schneider, B.G.; Williams, S.M. Disrupted human-pathogen co-evolution: A model for disease. Front Genet. 2014, 5, 290. [Google Scholar] [CrossRef] [PubMed]
- Wampande, E.M.; Mupere, E.; Debanne, S.M.; Asiimwe, B.B.; Nsereko, M.; Mayanja, H.; Eisenach, K.; Kaplan, G.; Boom, H.W.; Gagneux, S.; et al. Long-term dominance of Mycobacterium tuberculosis Uganda family in peri-urban Kampala-Uganda is not associated with cavitary disease. BMC Infect. Dis. 2013, 13, 484. [Google Scholar] [CrossRef] [PubMed] [Green Version]
- Wampande, E.M.; Naniima, P.; Mupere, E.; Kateete, D.P.; Malone, L.L.; Stein, C.M.; Mayanja-Kizza, H.; Gagneux, S.; Boom, W.H.; Joloba, M. Genetic variability and consequence of Mycobacterium tuberculosis lineage 3 in Kampala-Uganda. PLoS ONE 2019, 14, e0221644. [Google Scholar] [CrossRef] [PubMed] [Green Version]
- Stein, C.M.; Sausville, L.; Wejse, C.; Sobota, R.S.; Zetola, N.M.; Hill, P.C.; Boom, W.H.; Scott, W.K.; Sirugo, G.; Williams, S.M. Genomics of human pulmonary tuberculosis: From genes to pathways. Curr. Genet. Med. Rep. 2017, 5, 149–166. [Google Scholar] [CrossRef] [PubMed] [Green Version]
- Orlova, M.; Schurr, E. Human Genomics of Mycobacterium tuberculosis Infection and Disease. Curr. Genet. Med. Rep. 2017, 5, 125–131. [Google Scholar] [CrossRef]
- Nahid, P.; Jarlsberg, L.G.; Kato-Maeda, M.; Segal, M.R.; Osmond, D.H.; Gagneux, S.; Dobos, K.; Gold, M.; Hopewell, P.C.; Lewinsohn, D.M. Interplay of strain and race/ethnicity in the innate immune response to M. tuberculosis. PLoS ONE 2018, 13, e0195392. [Google Scholar] [CrossRef] [PubMed]
- Salie, M.; van der Merwe, L.; Moller, M.; Daya, M.; van der Spuy, G.D.; van Helden, P.D.; Martin, M.P.; Gao, X.J.; Warren, R.M.; Carrington, M.; et al. Associations between human leukocyte antigen class I variants and the Mycobacterium tuberculosis subtypes causing disease. J. Infect. Dis. 2014, 209, 216–223. [Google Scholar] [CrossRef] [PubMed] [Green Version]
- van Crevel, R.; Parwati, I.; Sahiratmadja, E.; Marzuki, S.; Ottenhoff, T.H.; Netea, M.G.; van der Ven, A.; Nelwan, R.H.; van der Meer, J.W.; Alisjahbana, B.; et al. Infection with Mycobacterium tuberculosis Beijing genotype strains is associated with polymorphisms in SLC11A1/NRAMP1 in Indonesian patients with tuberculosis. J. Infect. Dis. 2009, 200, 1671–1674. [Google Scholar] [CrossRef] [PubMed] [Green Version]
- Caws, M.; Thwaites, G.; Dunstan, S.; Hawn, T.R.; Lan, N.T.; Thuong, N.T.; Stepniewska, K.; Huyen, M.N.; Bang, N.D.; Loc, T.H.; et al. The influence of host and bacterial genotype on the development of disseminated disease with Mycobacterium tuberculosis. PLoS Pathog. 2008, 4, e1000034. [Google Scholar] [CrossRef] [PubMed] [Green Version]
- Schmid Hempel, P. Evolutionary Parasitologythe Integrated Study of Infections, Immunology, Ecology, and Genetics; Oxford University Press: Oxford, UK, 2011. [Google Scholar]
- Frank, S.A. Models of parasite virulence. Q. Rev. Biol. 1996, 71, 37–78. [Google Scholar] [CrossRef] [PubMed]
- Anderson, R.M.; May, R.M. Coevolution of hosts and parasites. Parasitology 1982, 85, 411–426. [Google Scholar] [CrossRef] [PubMed]
- Sorrell, I.; White, A.; Pedersen, A.B.; Hails, R.S.; Boots, M. The evolution of covert, silent infection as a parasite strategy. Proc. R. Soc. B. Biol. Sci. 2009, 276, 2217–2226. [Google Scholar] [CrossRef]
- Möller, M.; Kinnear, C.J.; Orlova, M.; Kroon, E.E.; van Helden, P.D.; Schurr, E.; Hoal, E.G. Genetic Resistance to Mycobacterium tuberculosis Infection and Disease. Front. Immunol. 2018, 9, 2219. [Google Scholar] [CrossRef] [PubMed]
- Kodaman, N.; Pazos, A.; Schneider, B.G.; Piazuelo, M.B.; Mera, R.; Sobota, R.S.; Sicinschi, L.A.; Shaffer, C.L.; Romero-Gallo, J.; de Sablet, T.; et al. Human and Helicobacter pylori coevolution shapes the risk of gastric disease. Proc. Natl. Acad. Sci. USA 2014, 111, 1455–1460. [Google Scholar] [CrossRef] [PubMed] [Green Version]
- McHenry, M.L.; Bartlett, J.; Igo, R.P., Jr.; Wampande, E.M.; Benchek, P.; Mayanja-Kizza, H.; Fluegge, K.; Hall, N.B.; Gagneux, S.; Tishkoff, S.A.; et al. Interaction between host genes and Mycobacterium tuberculosis lineage can affect tuberculosis severity: Evidence for coevolution? PLoS Genetics 2020, 16, e1008728. [Google Scholar] [CrossRef] [PubMed]
- Gagneux, S. Variable host-pathogen compatibility in Mycobacterium tuberculosis. Proc. Natl. Acad. Sci. USA 2006, 103, 2869–2873. [Google Scholar] [CrossRef] [Green Version]
- Abel, L.; Fellay, J.; Haas, D.W.; Schurr, E.; Srikrishna, G.; Urbanowski, M.; Chaturvedi, N.; Srinivasan, S.; Johnson, D.H.; Bishai, W.R. Genetics of human susceptibility to active and latent tuberculosis: Present knowledge and future perspectives. Lancet Infect Dis. 2018, 18, e64–e75. [Google Scholar] [CrossRef]
- Di Pietrantonio, T.; Schurr, E. Host-pathogen specificity in tuberculosis. Adv. Exp. Med. Biol. 2013, 783, 33–44. [Google Scholar] [PubMed]
- O’Garra, A.; Redford, P.S.; McNab, F.W.; Bloom, C.I.; Wilkinson, R.J.; Berry, M.P. The immune response in tuberculosis. Annu. Rev. Immunol. 2013, 31, 475–527. [Google Scholar] [CrossRef] [PubMed]
- Hoal, E.G.; Dippenaar, A.; Kinnear, C.; van Helden, P.D.; Moller, M. The arms race between man and Mycobacterium tuberculosis: Time to regroup. Infect. Genet. Evol. 2018, 66, 361–375. [Google Scholar] [CrossRef] [PubMed]
- Thuong, N.T.; Tram, T.T.; Dinh, T.D.; Thai, P.V.; Heemskerk, D.; Bang, N.D.; Chau, T.T.; Russell, D.G.; Thwaites, G.E.; Hawn, T.R.; et al. MARCO variants are associated with phagocytosis, pulmonary tuberculosis susceptibility and Beijing lineage. Genes Immun. 2016, 17, 419–425. [Google Scholar] [CrossRef] [PubMed] [Green Version]
- Tientcheu, L.D.; Koch, A.; Ndengane, M.; Andoseh, G.; Kampmann, B.; Wilkinson, R.J. Immunological consequences of strain variation within the Mycobacterium tuberculosis complex. Eur. J. Immunol. 2017, 47, 432–445. [Google Scholar] [CrossRef] [PubMed] [Green Version]
- Woolhouse, M.E.J.; Webster, J.P.; Domingo, E.; Charlesworth, B.; Levin, B.R. Biological and biomedical implications of the co-evolution of pathogens and their hosts. Nat. Genet. 2002, 32, 569–577. [Google Scholar] [CrossRef] [PubMed] [Green Version]
- Wejse, C.; Gustafson, P.; Nielsen, J.; Gomes, V.F.; Aaby, P.; Andersen, P.L.; Sodemann, M. TBscore: Signs and symptoms from tuberculosis patients in a low-resource setting have predictive value and may be used to assess clinical course. Scand J. Infect. Dis. 2008, 40, 111–120. [Google Scholar] [CrossRef]
- Stelzer, G.; Rosen, N.; Plaschkes, I.; Zimmerman, S.; Twik, M.; Fishilevich, S.; Stein, T.I.; Nudel, R.; Lieder, I.; Mazor, Y.; et al. The GeneCards Suite: From Gene Data Mining to Disease Genome Sequence Analyses. Curr. Protoc. Bioinform. 2016, 54, 1.30.1–1.30.33. [Google Scholar] [CrossRef] [PubMed]
- Ha, B.; Greenbaum, J.A.; Shmiedel, B.J.; Singh, D.; Madrigal, A.; Valdovino-Gonzalez, A.G.; White, B.M.; Zapardiel-Gonzalo, J.; Altay, G.; McVicker, G.; et al. Database of Immune Cell EQTLs, Expression, Epigenomics. J. Immunol. 2019, 202 (Suppl. 1), 131.18. [Google Scholar]
- Portier, I.; Campbell, R.A. Role of Platelets in Detection and Regulation of Infection. Arterioscler. Thromb. Vasc. Biol. 2021, 41, 70–78. [Google Scholar] [CrossRef] [PubMed]
- McDonald, B.; Dunbar, M. Platelets and Intravascular Immunity: Guardians of the Vascular Space During Bloodstream Infections and Sepsis. Front. Immunol. 2019, 10, 2400. [Google Scholar] [CrossRef]
- Pober, J.S.; Sessa, W.C. Inflammation and the blood microvascular system. Cold Spring Harb. Perspect. Biol. 2014, 7, a016345. [Google Scholar] [CrossRef] [PubMed]
- Pober, J.S.; Tellides, G. Participation of blood vessel cells in human adaptive immune responses. Trends Immunol. 2012, 33, 49–57. [Google Scholar] [CrossRef] [PubMed] [Green Version]
- Speth, C.; Löffler, J.; Krappmann, S.; Lass-Flörl, C.; Rambach, G. Platelets as immune cells in infectious diseases. Future Microbiol. 2013, 8, 1431–1451. [Google Scholar] [CrossRef] [PubMed]
- Pink, R.C.; Wicks, K.; Caley, D.P.; Punch, E.K.; Jacobs, L.; Carter, D.R.F. Pseudogenes: Pseudo-functional or key regulators in health and disease? RNA (New York, NY, USA) 2011, 17, 792–798. [Google Scholar] [CrossRef] [PubMed] [Green Version]
- Roberts, T.C.; Morris, K.V. Not so pseudo anymore: Pseudogenes as therapeutic targets. Pharmacogenomics 2013, 14, 2023–2034. [Google Scholar] [CrossRef] [PubMed] [Green Version]
- Seshadri, C.; Sedaghat, N.; Campo, M.; Peterson, G.; Wells, R.D.; Olson, G.S.; Sherman, D.R.; Stein, C.M.; Mayanja-Kizza, H.; Shojaie, A.; et al. Transcriptional networks are associated with resistance to Mycobacterium tuberculosis infection. PLoS ONE 2017, 12, e0175844. [Google Scholar] [CrossRef] [PubMed] [Green Version]
- Oliveira, C.J.; Schindler, F.; Ventura, A.M.; Morais, M.S.; Arai, R.J.; Debbas, V.; Stern, A.; Monteiro, H.P. Nitric oxide and cGMP activate the Ras-MAP kinase pathway-stimulating protein tyrosine phosphorylation in rabbit aortic endothelial cells. Free. Radic. Biol. Med. 2003, 35, 381–396. [Google Scholar] [CrossRef]
- Isidori, A.M.; Giannetta, E.; Pofi, R.; Venneri, M.A.; Gianfrilli, D.; Campolo, F.; Mastroianni, C.M.; Lenzi, A.; d’Ettorre, G. Targeting the NO-cGMP-PDE5 pathway in COVID-19 infection. The DEDALO project. Andrology 2021, 9, 33–38. [Google Scholar] [CrossRef] [PubMed]
- Wentowski, C.; Mewada, N.; Nielsen, N.D. Sepsis in 2018: A review. Anaesth. Intensive Care Med. 2019, 20, 6–13. [Google Scholar] [CrossRef]
- Alfano, G.; Guaraldi, G.; Fontana, F.; Ferrari, A.; Magistroni, R.; Mussini, C.; Cappelli, G. The Role of the Renin-Angiotensin System in Severe Acute Respiratory Syndrome-CoV-2 Infection. Blood Purif. 2021, 50, 263–267. [Google Scholar] [CrossRef]
- Friebe, A.; Sandner, P.; Schmidtko, A. cGMP: A unique 2nd messenger molecule–recent developments in cGMP research and development. Naunyn-Schmiedeberg’s Arch. Pharmacol. 2020, 393, 287–302. [Google Scholar] [CrossRef] [Green Version]
- Gnipp, S.; Mergia, E.; Puschkarow, M.; Bufe, A.; Koesling, D.; Peters, M. Nitric oxide dependent signaling via cyclic GMP in dendritic cells regulates migration and T-cell polarization. Sci. Rep. 2018, 8, 10969. [Google Scholar] [CrossRef] [Green Version]
- Caccamo, N.; Dieli, F. Inflammation and the coagulation system in tuberculosis: Tissue Factor leads the dance. Eur. J. Immunol. 2016, 46, 303–306. [Google Scholar] [CrossRef] [Green Version]
- Kothari, H.; Keshava, S.; Vatsyayan, R.; Mackman, N.; Rao, L.V.M.; Pendurthi, U.R. Role of tissue factor in Mycobacterium tuberculosis-induced inflammation and disease pathogenesis. PLoS ONE 2014, 9, e114141. [Google Scholar]
- Stein, C.M.; Zalwango, S.; Malone, L.L.; Thiel, B.; Mupere, E.; Nsereko, M.; Okware, B.; Kisingo, H.; Lancioni, C.; Whalen, C.C.; et al. Resistance and susceptibility to Mycobacterium tuberculosis infection and disease in tuberculosis households in Kampala, Uganda. Am. J. Epidemiol. 2018, 187, 1477–1489. [Google Scholar] [CrossRef] [PubMed]
- Stein, C.M.; Zalwango, S.; Malone, L.L.; Won, S.; Mayanja-Kizza, H.; Mugerwa, R.D.; Leontiev, D.V.; Thompson, C.L.; Cartier, K.C.; Elston, R.C. Genome scan of M. tuberculosis infection and disease in Ugandans. PLoS ONE 2008, 3, e4094. [Google Scholar]
- Igo, R.P., Jr.; Hall, N.B.; Malone, L.L.; Hall, J.B.; Truitt, B.; Qiu, F.; Tao, L.; Mupere, E.; Schnell, A.; Hawn, T.R.; et al. Fine-mapping analysis of a chromosome 2 region linked to resistance to Mycobacterium tuberculosis infection in Uganda reveals potential regulatory variants. Genes Immun. 2018, 20, 473–483. [Google Scholar] [CrossRef] [PubMed]
- Purcell, S.; Neale, B.; Todd-Brown, K.; Thomas, L.; Ferreira, M.A.; Bender, D.; Maller, J.; Sklar, P.; De Bakker, P.I.; Daly, M.J.; et al. PLINK: A tool set for whole-genome association and population-based linkage analyses. Am. J. Hum. Genet. 2007, 81, 559–575. [Google Scholar] [CrossRef] [Green Version]
- Wampande, E.M.; Hatzios, S.K.; Achan, B.; Mupere, E.; Nsereko, M.; Mayanja, H.K.; Eisenach, K.; Boom, W.H.; Gagneux, S.; Joloba, M.L. A single-nucleotide-polymorphism real-time PCR assay for genotyping of Mycobacterium tuberculosis complex in peri-urban Kampala. BMC Infect. Dis. 2015, 15, 396. [Google Scholar] [CrossRef] [Green Version]
- Hammond, R.K.; Pahl, M.C.; Su, C.; Cousminer, D.L.; Leonard, M.E.; Lu, S.; Doege, C.A.; Wagley, Y.; Hodge, K.M.; Lasconi, C.; et al. Biological constraints on GWAS SNPs at suggestive significance thresholds reveal additional BMI loci. eLife 2021, 10, e62206. [Google Scholar] [CrossRef]
- Deeks, J.J.; Higgins, J.P.; Altman, D.G. Analysing Data and Undertaking Meta-Analyses. In Cochrane Handbook for Systematic Reviews of Interventions; Wiley: Hoboken, NJ, USA, 2008; pp. 243–296. [Google Scholar]
- Wang, X.; Tucker, N.R.; Rizki, G.; Mills, R.; Krijger, P.H.L.; de Wit, E.; Subramanian, V.; Bartell, E.; Nguyen, X.-X.; Ye, J.; et al. Discovery and validation of sub-threshold genome-wide association study loci using epigenomic signatures. eLife 2016, 5, e10557. [Google Scholar] [CrossRef] [Green Version]
- Williams, S.M.; Haines, J.L. Correcting away the hidden heritability. Ann. Hum. Genet. 2011, 75, 348–350. [Google Scholar] [CrossRef] [PubMed]
- Watanabe, K.; Taskesen, E.; van Bochoven, A.; Posthuma, D. Functional mapping and annotation of genetic associations with FUMA. Nat. Commun. 2017, 8, 1826. [Google Scholar] [CrossRef] [Green Version]


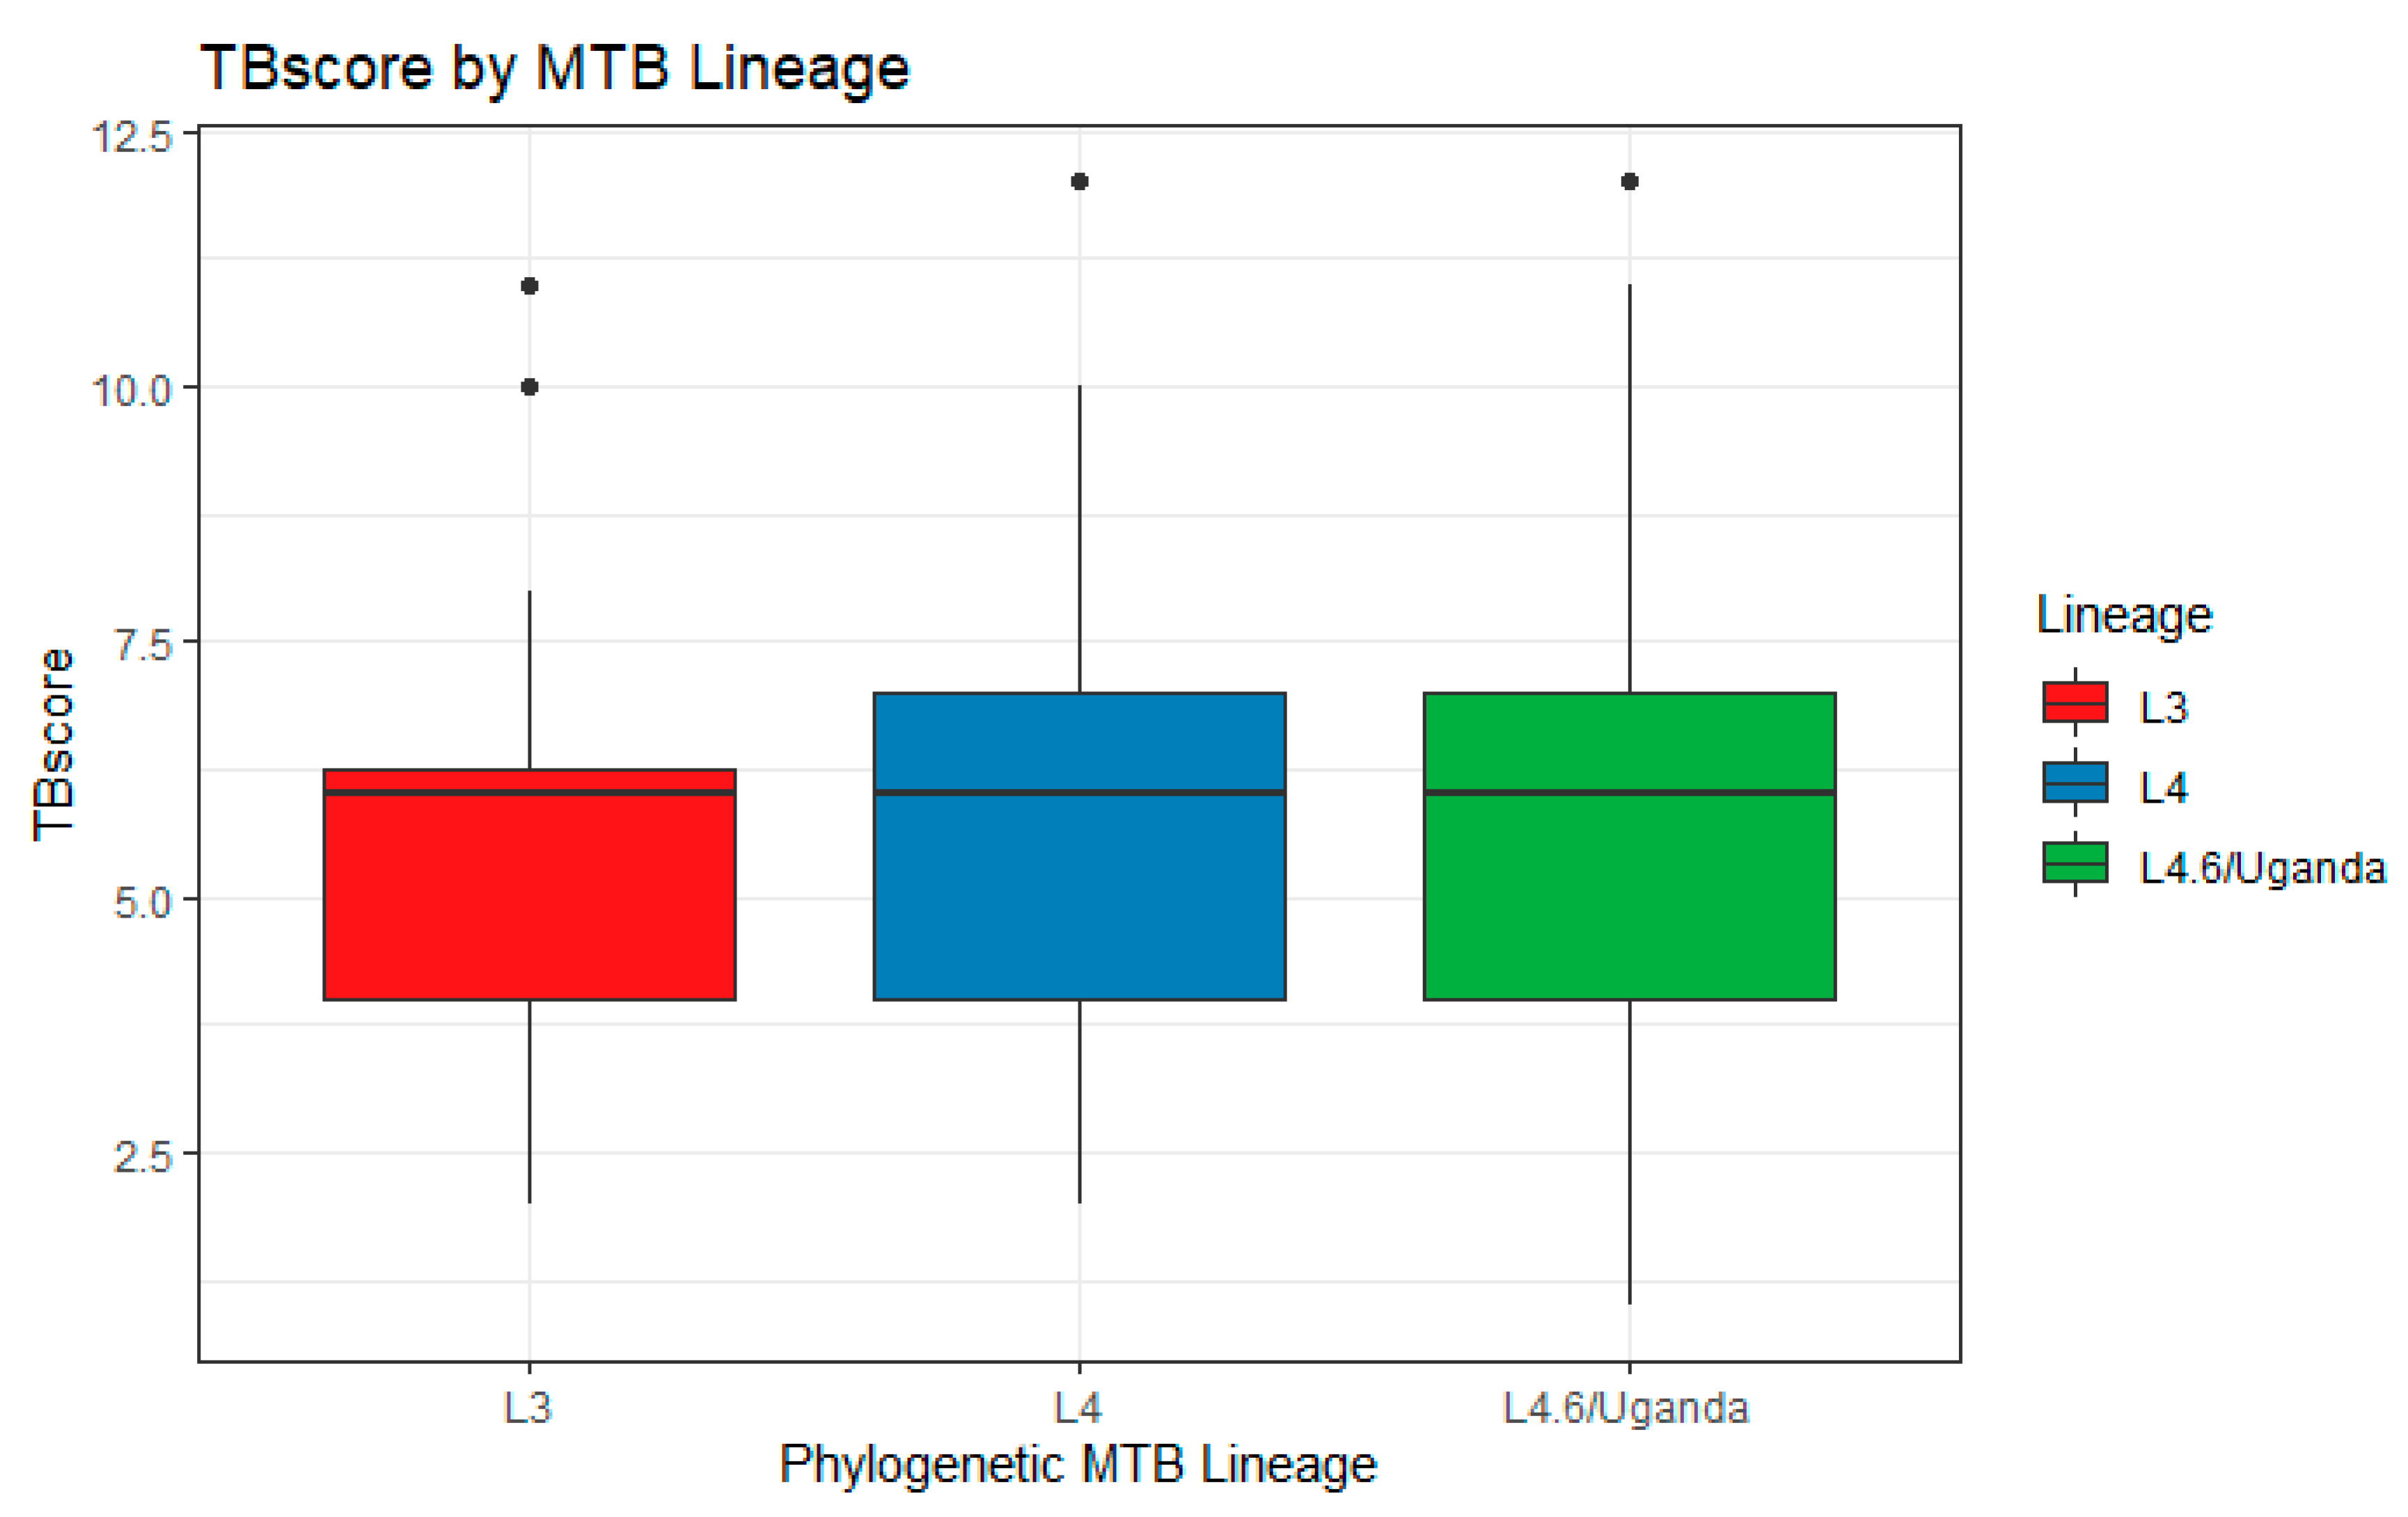
| Cohort 1 n = 149 | Cohort 2 n = 127 | Total | p | |
|---|---|---|---|---|
| Mean Age (SD) | 28.7 (8.1) | 28.7 (9.8) | 28.7 (9.0) | 0.99 |
| # Male (%) | 81 (54.4) | 73 (57.5) | 154 (55.8) | 0.69 |
| # HIV+ (%) | 31 (24.4) | 15 (10.1) | 46 (16.7) | 0.0025 |
| Mean TBscore (SD) | 6.2 (2.1) | 5.4 (2.2) | 5.8 (2.2) | 0.0032 |
| # L4.6/Ugandan (%) | 93 (62.4) | 75 (59.1) | 168 (60.9) | 0.66 |
| # L4 (%) | 15 (10.1) | 17 (13.4) | 32 (11.6) | |
| # L3 (%) | 39 (26.2) | 31 (24.4) | 70 (25.3) |
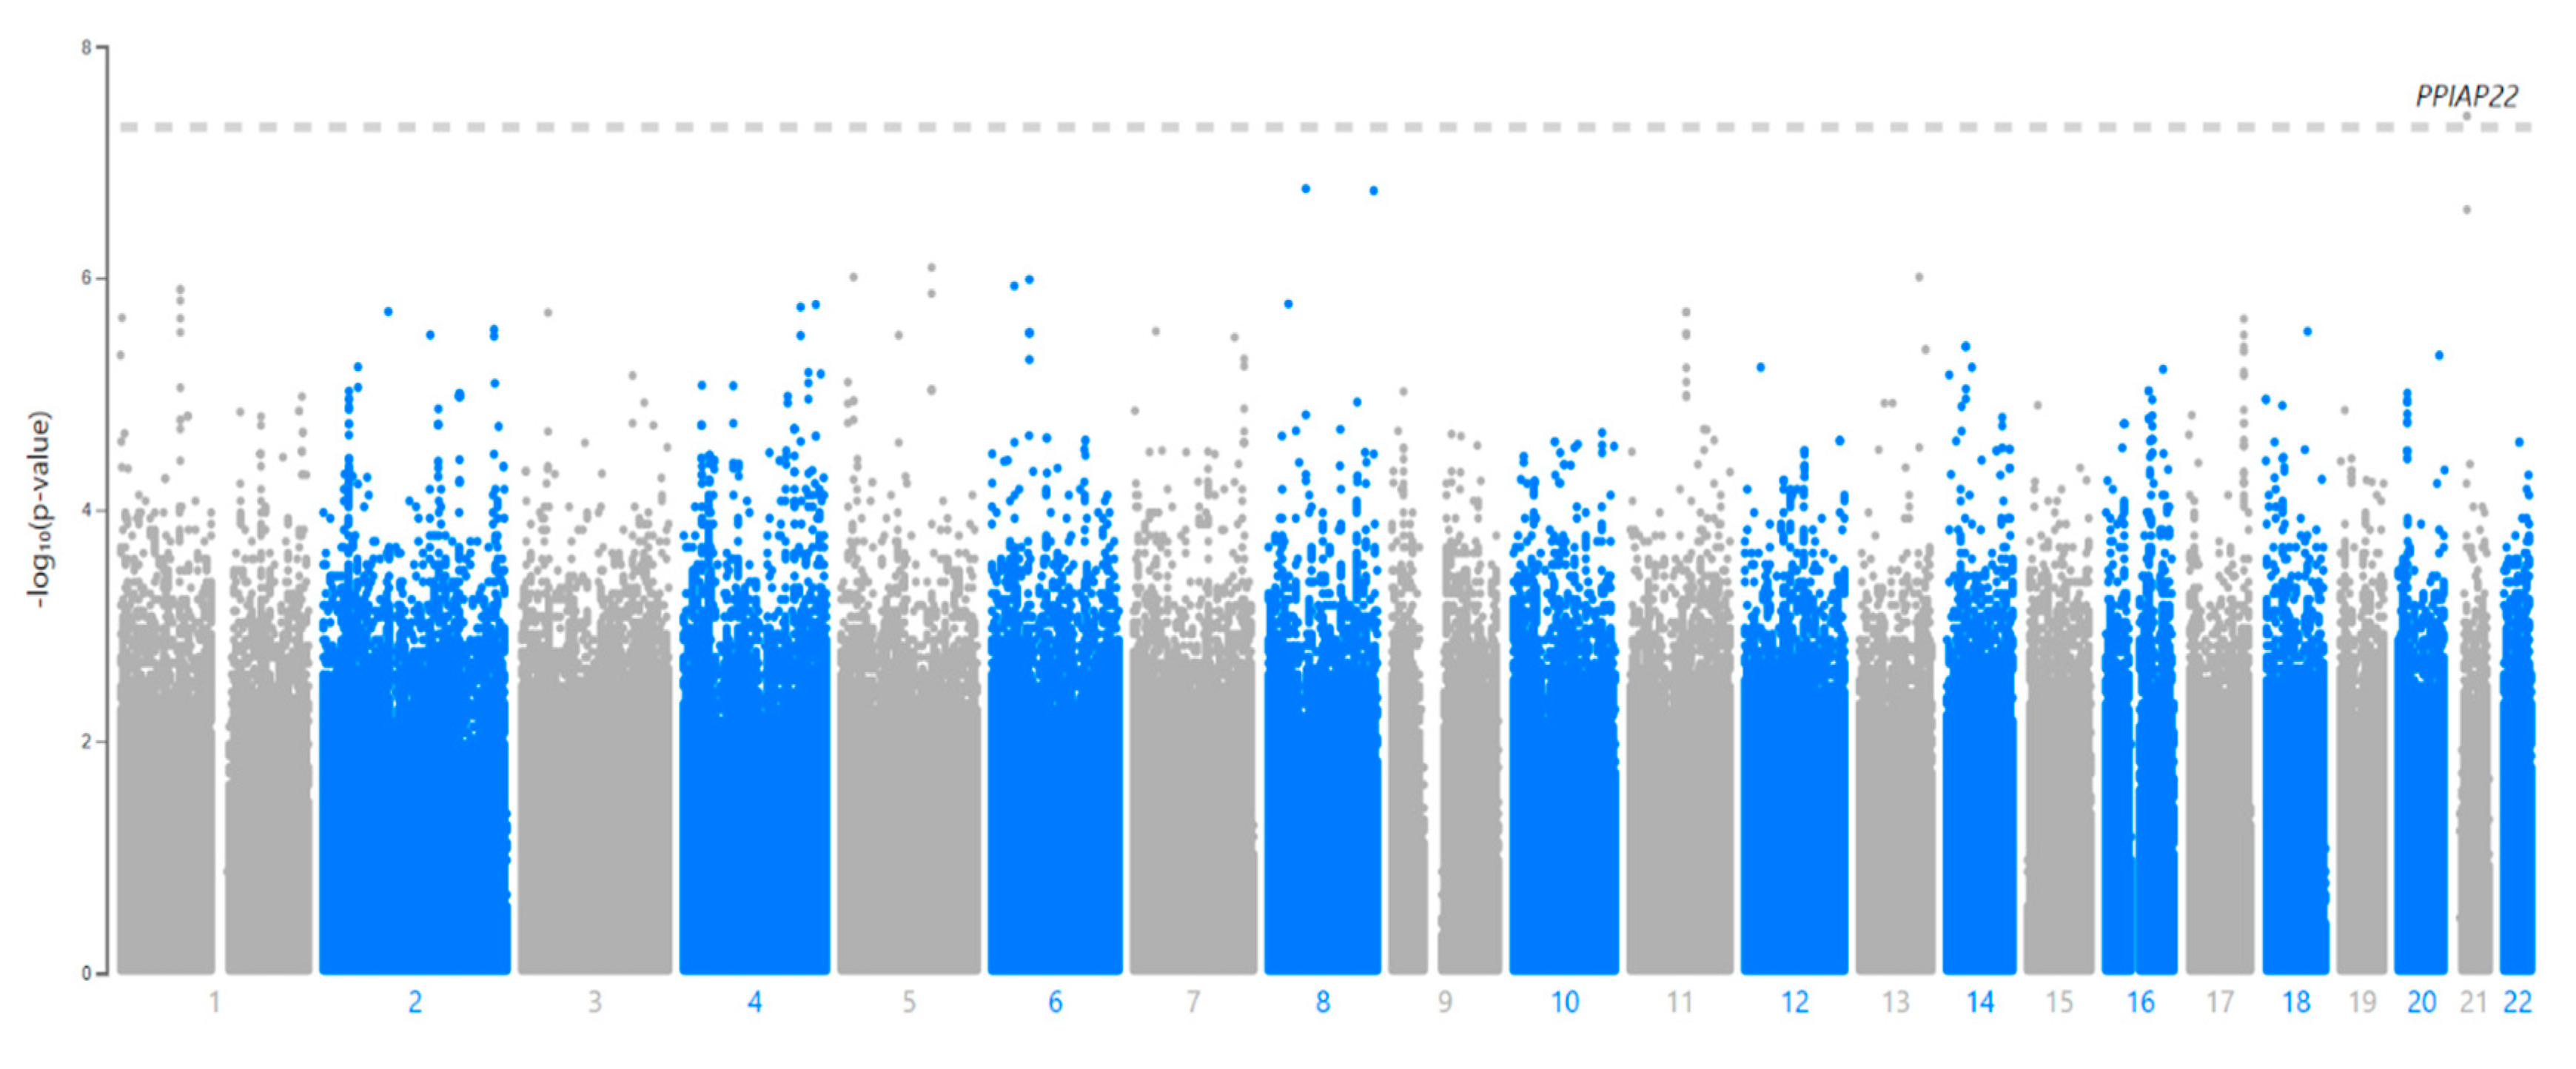
| SNP | CHR:BP | Ref/Alt | Gene * | Location | MAF (LWK) | p-Value |
|---|---|---|---|---|---|---|
| rs114945555 | 21:20187488 | C/T | PPIAP22 | Intergenic | 7% | 4.0 × 10⁻⁸ |
| Cohort 1 | Cohort 2 | Combined | ||||
|---|---|---|---|---|---|---|
| β | p | β | p | β | p | |
| rs11945555 s119 (β3) | 1.98 (0.28,3.68) | 0.024 | 2.94 (1.27,4.61) | 7 × 10⁻⁴ | 2.47 | 4.80 × 10⁻⁵ |
| L.4.6/Ugandan (β2) | 0.59 (−0.13,1.3) | 0.11 | 0.57 (−0.24,1.38) | 0.17 | 0.58 | 0.03 |
| Sex (β4) | 0.49 (−0.17,1.14) | 0.15 | 1.09 (0.32,1.85) | 0.0061 | 0.75 | 0.012 |
| HIV+ status (β1) | 0.60 (−0.48,1.69) | 0.28 | −0.14 (−1.02,0.74) | 0.75 | 0.16 | 0.66 |
| rs11945555 × L4.6/Ugandan (combination of CT/TT and L4.6 Ugandan) (β5) † | −3.77 (−5.79,−1.75) | 3.62 × 10⁻⁴ | −4.53 (−6.68,−2.38) | 6.79 × 10⁻⁵ | −4.13 | 4.00 × 10⁻⁸ |
| Chr | Bp | SNP | p | β | Gene | Location |
|---|---|---|---|---|---|---|
| 5 | 17775271 | rs369093426 | 9.82 × 10⁻⁷ | 3.2095 | LOC105374666 | Intron |
| 5 | 121258204 | rs76190408 | 8.14 × 10⁻⁷ | 3.0447 | None | Intergenic |
| 8 | 50958714 | rs203964 | 1.70 × 10⁻⁷ | 2.7085 | SNTG1 | Intron |
| 8 | 141085471 | rs56990580 | 1.77 × 10⁻⁷ | −3.3244 | TRAPPC9 | Intron |
| 13 | 985899842 | rs8000063 | 9.82 × 10⁻⁷ | 2.6203 | None | Intergenic |
| 21 | 20182990 | rs112560854 | 2.58 × 10⁻⁷ | −3.7805 | None | Intergenic |
| GeneSet | N | n | p-Value | Adjusted p | Genes | Database |
|---|---|---|---|---|---|---|
| Breast Cancer Amplicon | 329 | 24 | 3.5 × 10⁻²³ | 1.15 × 10⁻¹⁹ | GPRC5C, TMEM104, GRIN2C, FADS6, CDR2L, KCTD2, ATP5H, SLC16A5, ARMC7, NT5C, HN1, SUMO2, NUP85, GGA3, MRPS7, MIF4GD, SLC25A19, GRB2, KIAA0195, CASKIN2, TSEN54, LLGL2, RECQL5, EXOC7 | Chemical and Genetic Perturbations (MsigDB c2) |
| Neuroblastoma Copy Number Up | 181 | 9 | 8.92 × 10⁻⁸ | 0.000147 | GPRC5C, ATP5H, ARMC7, HN1, SUMO2, NUP85, MRPS7, SLC25A19, TSEN54 | |
| Nephrolithiasis | 8 | 3 | 4.33 × 10⁻⁶ | 7.87 × 10⁻³ | INMT, FAM188B, AQP1, AQP1 | GWAS Catalog |
| Urolithiasis | 17 | 3 | 5.12 × 10⁻⁵ | 0.046 | TFAP2B, INMT, FAM188B |
| KEGG Pathway | # Genes | # In Set | Strength | FDR | Matching Proteins |
|---|---|---|---|---|---|
| Renin secretion | 3 | 63 | 1.44 | 0.0166 | GUCY1B3, GUCY1A3, AGTR1 |
| Gap junction | 3 | 87 | 1.3 | 0.0207 | GUCY1B3, GUCY1A3, GRB2 |
| Renin-angiotensin system | 2 | 23 | 1.7 | 0.0234 | CPA3, AGTR1 |
| Vascular smooth muscle contraction | 3 | 119 | 1.16 | 0.0251 | GUCY1B3, GUCY1A3, AGTR1 |
| cGMP-PKG signaling pathway | 3 | 160 | 1.03 | 0.0459 | GUCY1B3, GUCY1A3, AGTR1 |
| Purine metabolism | 3 | 173 | 1 | 0.0474 | NT5C, GUCY1B3, GUCY1A3 |
Publisher’s Note: MDPI stays neutral with regard to jurisdictional claims in published maps and institutional affiliations. |
© 2021 by the authors. Licensee MDPI, Basel, Switzerland. This article is an open access article distributed under the terms and conditions of the Creative Commons Attribution (CC BY) license (https://creativecommons.org/licenses/by/4.0/).
Share and Cite
McHenry, M.L.; Wampande, E.M.; Joloba, M.L.; Malone, L.L.; Mayanja-Kizza, H.; Bush, W.S.; Boom, W.H.; Williams, S.M.; Stein, C.M. Interaction between M. tuberculosis Lineage and Human Genetic Variants Reveals Novel Pathway Associations with Severity of TB. Pathogens 2021, 10, 1487. https://doi.org/10.3390/pathogens10111487
McHenry ML, Wampande EM, Joloba ML, Malone LL, Mayanja-Kizza H, Bush WS, Boom WH, Williams SM, Stein CM. Interaction between M. tuberculosis Lineage and Human Genetic Variants Reveals Novel Pathway Associations with Severity of TB. Pathogens. 2021; 10(11):1487. https://doi.org/10.3390/pathogens10111487
Chicago/Turabian StyleMcHenry, Michael L., Eddie M. Wampande, Moses L. Joloba, LaShaunda L. Malone, Harriet Mayanja-Kizza, William S. Bush, W. Henry Boom, Scott M. Williams, and Catherine M. Stein. 2021. "Interaction between M. tuberculosis Lineage and Human Genetic Variants Reveals Novel Pathway Associations with Severity of TB" Pathogens 10, no. 11: 1487. https://doi.org/10.3390/pathogens10111487
APA StyleMcHenry, M. L., Wampande, E. M., Joloba, M. L., Malone, L. L., Mayanja-Kizza, H., Bush, W. S., Boom, W. H., Williams, S. M., & Stein, C. M. (2021). Interaction between M. tuberculosis Lineage and Human Genetic Variants Reveals Novel Pathway Associations with Severity of TB. Pathogens, 10(11), 1487. https://doi.org/10.3390/pathogens10111487