Article

Opinion Mining and Sentiment Analysis in Marketing Communications: A Science Mapping Analysis in Web of Science (1998–2018)

by
Pablo Sánchez-Núñez
1,*,
Carlos de las Heras-Pedrosa
2 and
José Ignacio Peláez
3
1
Doctorate Program in Communication by Universidad de Cádiz, Universidad de Huelva, Universidad de Málaga and Universidad de Sevilla, 29071 Malaga, Spain
2
Department of Audiovisual Communication and Advertising, Faculty of Communication Sciences, Universidad de Málaga, 29071 Malaga, Spain
3
Department of Languages and Computer Sciences, Higher Technical School of Computer Engineering, Universidad de Málaga, 29071 Malaga, Spain
*
Author to whom correspondence should be addressed.
Soc. Sci. 2020, 9(3), 23; https://doi.org/10.3390/socsci9030023
Submission received: 20 January 2020 / Revised: 20 February 2020 / Accepted: 24 February 2020 / Published: 28 February 2020

Abstract

:
Opinion mining and sentiment analysis has become ubiquitous in our society, with applications in online searching, computer vision, image understanding, artificial intelligence and marketing communications (MarCom). Within this context, opinion mining and sentiment analysis in marketing communications (OMSAMC) has a strong role in the development of the field by allowing us to understand whether people are satisfied or dissatisfied with our service or product in order to subsequently analyze the strengths and weaknesses of those consumer experiences. To the best of our knowledge, there is no science mapping analysis covering the research about opinion mining and sentiment analysis in the MarCom ecosystem. In this study, we perform a science mapping analysis on the OMSAMC research, in order to provide an overview of the scientific work during the last two decades in this interdisciplinary area and to show trends that could be the basis for future developments in the field. This study was carried out using VOSviewer, CitNetExplorer and InCites based on results from Web of Science (WoS). The results of this analysis show the evolution of the field, by highlighting the most notable authors, institutions, keywords, publications, countries, categories and journals.

1. Introduction

Sentiment analysis and opinion mining are an automatic mass classification of textual and visual information, which focuses on cataloguing and classifying data according to the polarity—the positive or negative connotation—of the language used in them (Pang and Lee 2008; Prabowo and Thelwall 2009). These positive or negative connotations of the language are reflected in opinions, attitudes and emotions expressed by Internet users (Mostafa 2013) in online mentions on digital ecosystems (Kennedy 2012; Mäntylä et al. 2018).
Knowing what others think and feel can be fundamental to most of us during the decision-making process (Bericat 2016; Saaty and Vargas 2012). User opinions not only help people make informed decisions, but also help organizations identify customer opinions, attitudes and emotions about the products and services they offer (Peláez et al. 2019a).
In this context, Opinion Mining and Sentiment Analysis in Marketing Communications (OMSAMC) are extremely important when it comes to analyzing consumer buying patterns (Peláez et al. 2018; Sebastian 2014), collecting customer feedback from social media, websites or online forms (Liu and Ji 2018), as well as knowing what types of stimuli impact people (Baraybar-Fernández et al. 2017), understanding the reasons that motivates people to like a product/service (Peláez et al. 2019b), conducting market research (Wereda and Woźniak 2019), categorizing customer service requests and predicting consumer behavior, among others (Baron et al. 2017).
The way of researching in this field has varied considerably over the last few years. There are many different approaches in the field of opinion mining and sentiment analysis. Some of them provide new frameworks for measuring customer-specific variables (Kang and Park 2014), as well as systematic reviews with bibliometric indicators of productivity, impact and collaboration (Martínez-López et al. 2018), Altmetrics (Thelwall et al. 2013) or scientific mapping analysis (Piryani et al. 2017).
In this last case, the study of scientific mapping allows us to study the impact and visibility of scientific publications. The study of scientific collaboration plays a decisive role in the expansion, visibility, specialization, consolidation and emergence of the results of scientific production. Being able to identify their topological structure is a key and disruptor element for the study of the reception and transmission of knowledge (Newman 2000).
This article aims to trace the evolution of OMSAMC by asking the following questions in different academic research scenarios:
  • How has scientific research at OMSAMC progressed from 1998 to 2018?
  • In which countries and organizations has most of the research on OMSAMC been carried out?
  • What are the main sources of publication (journals) that publish research on OMSAMC?
  • Who are the most productive and cited authors in OMSAMC research during the study period?
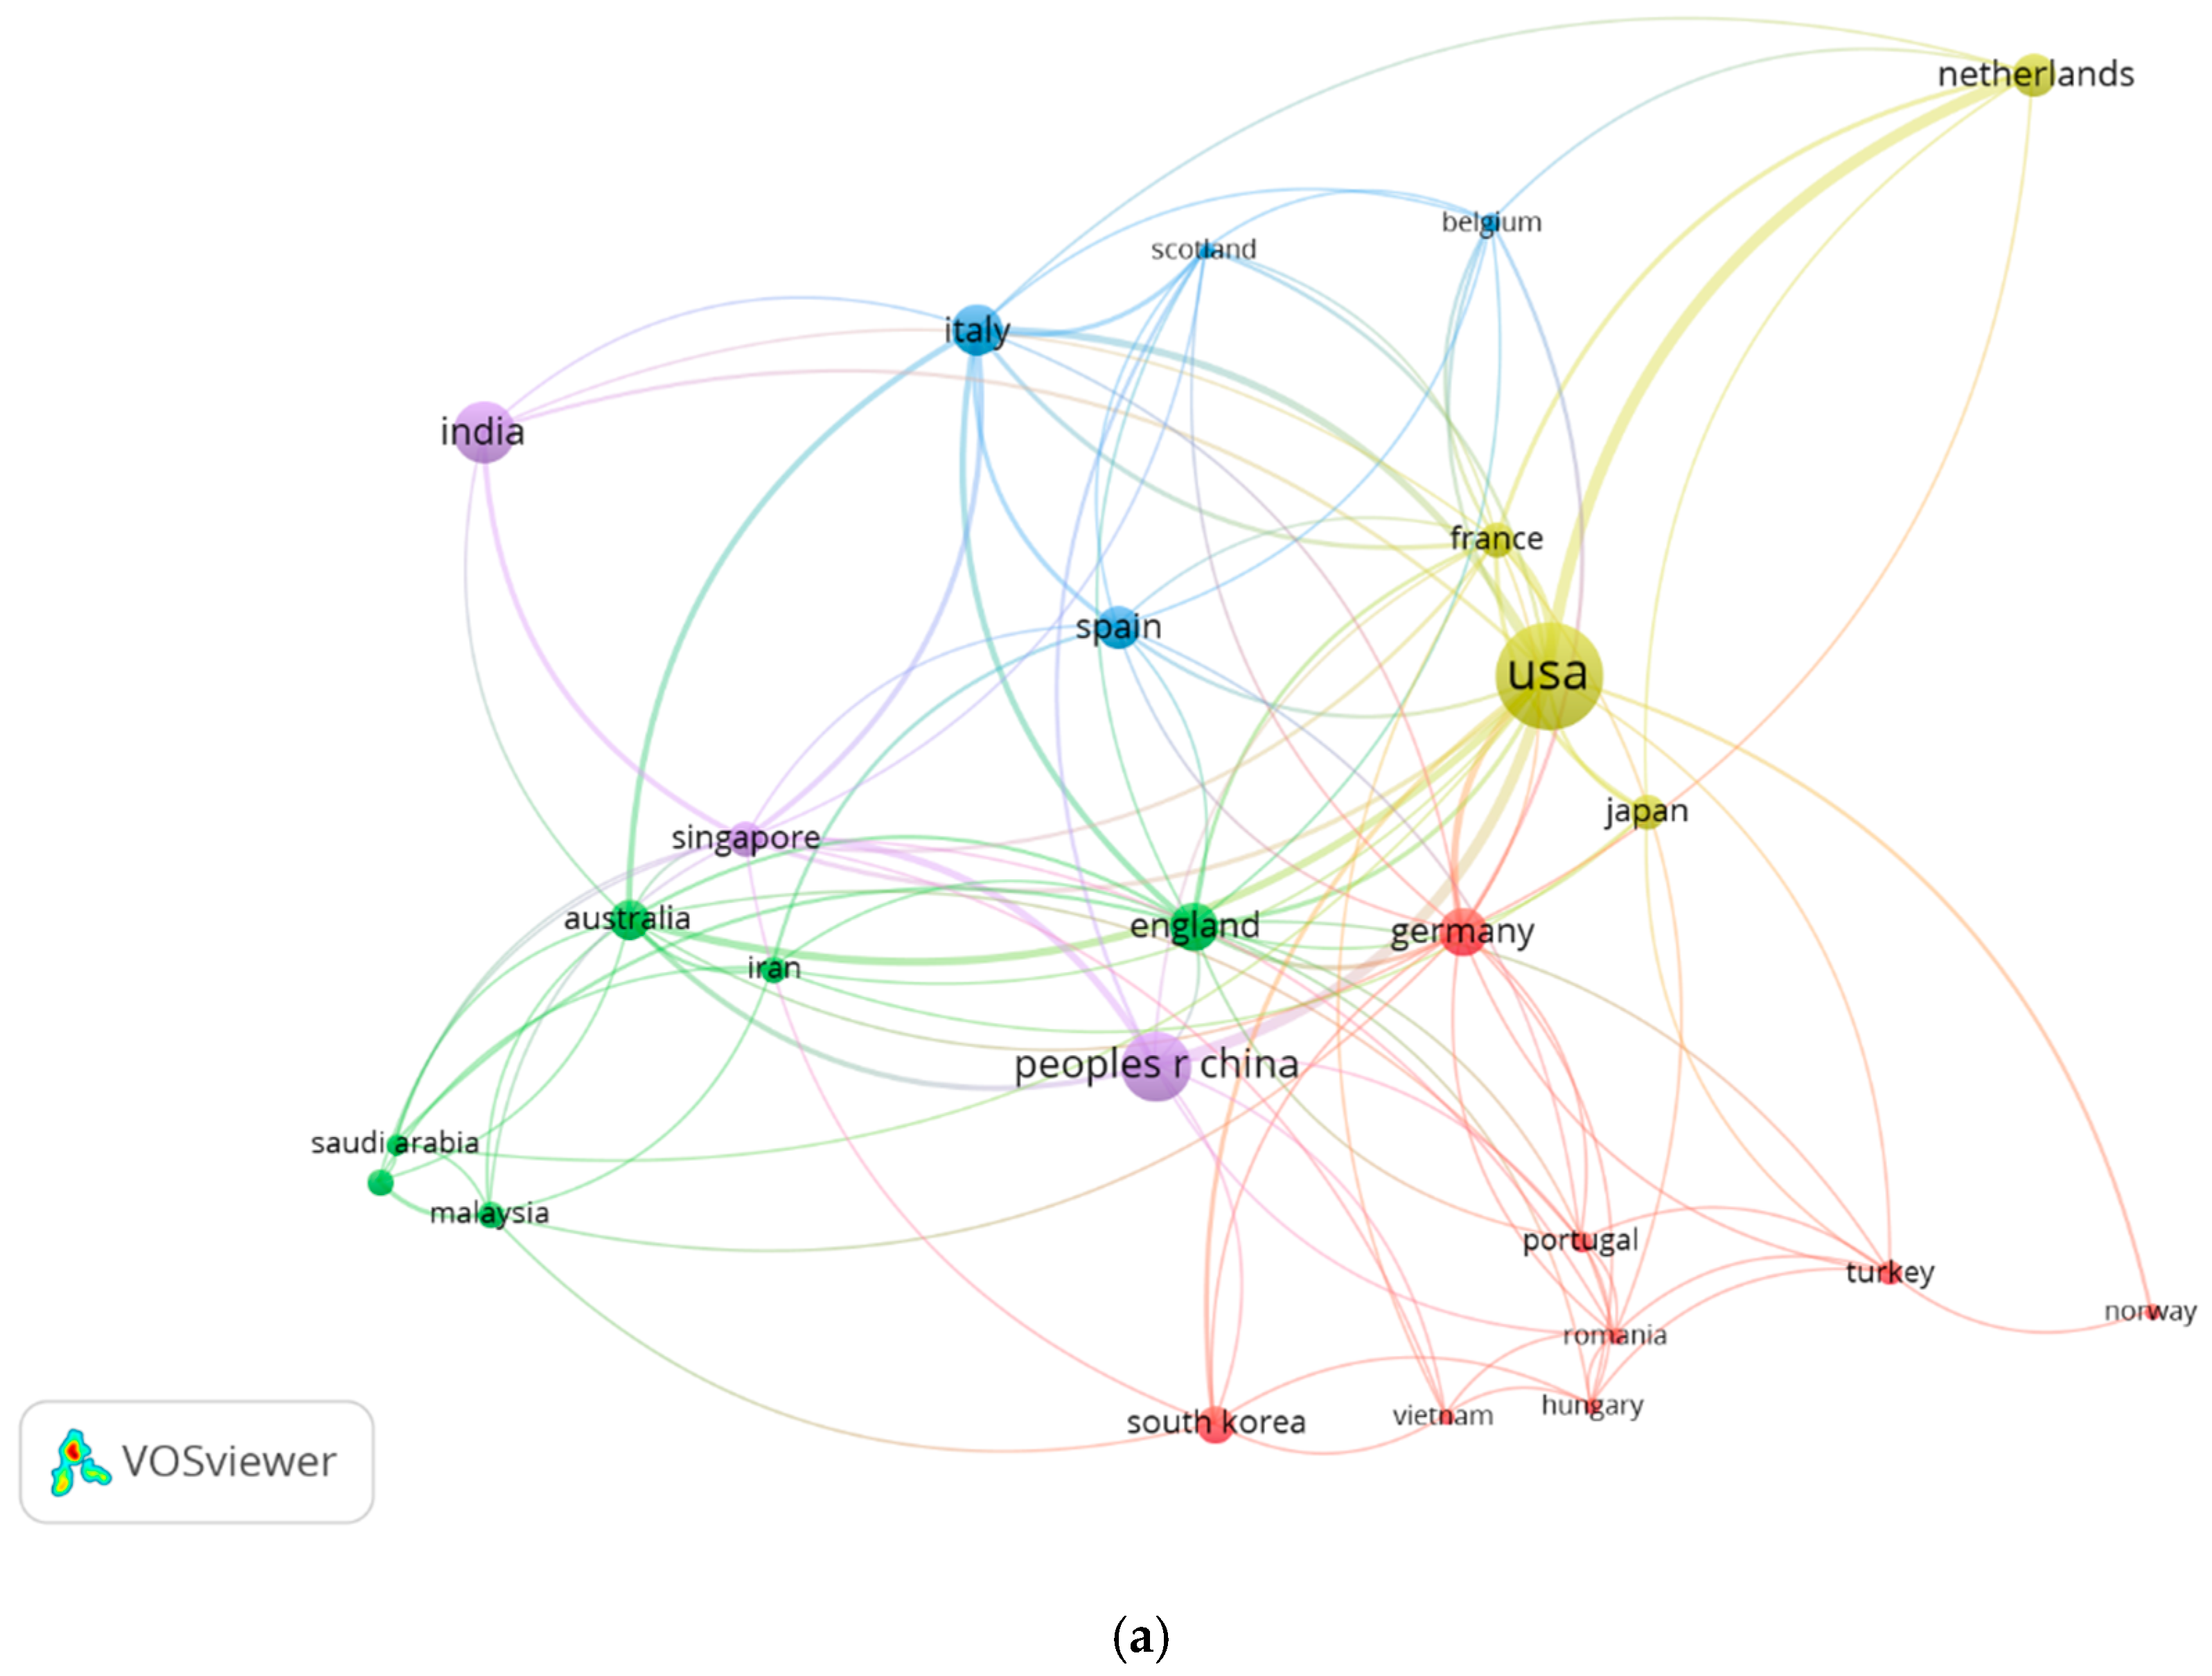
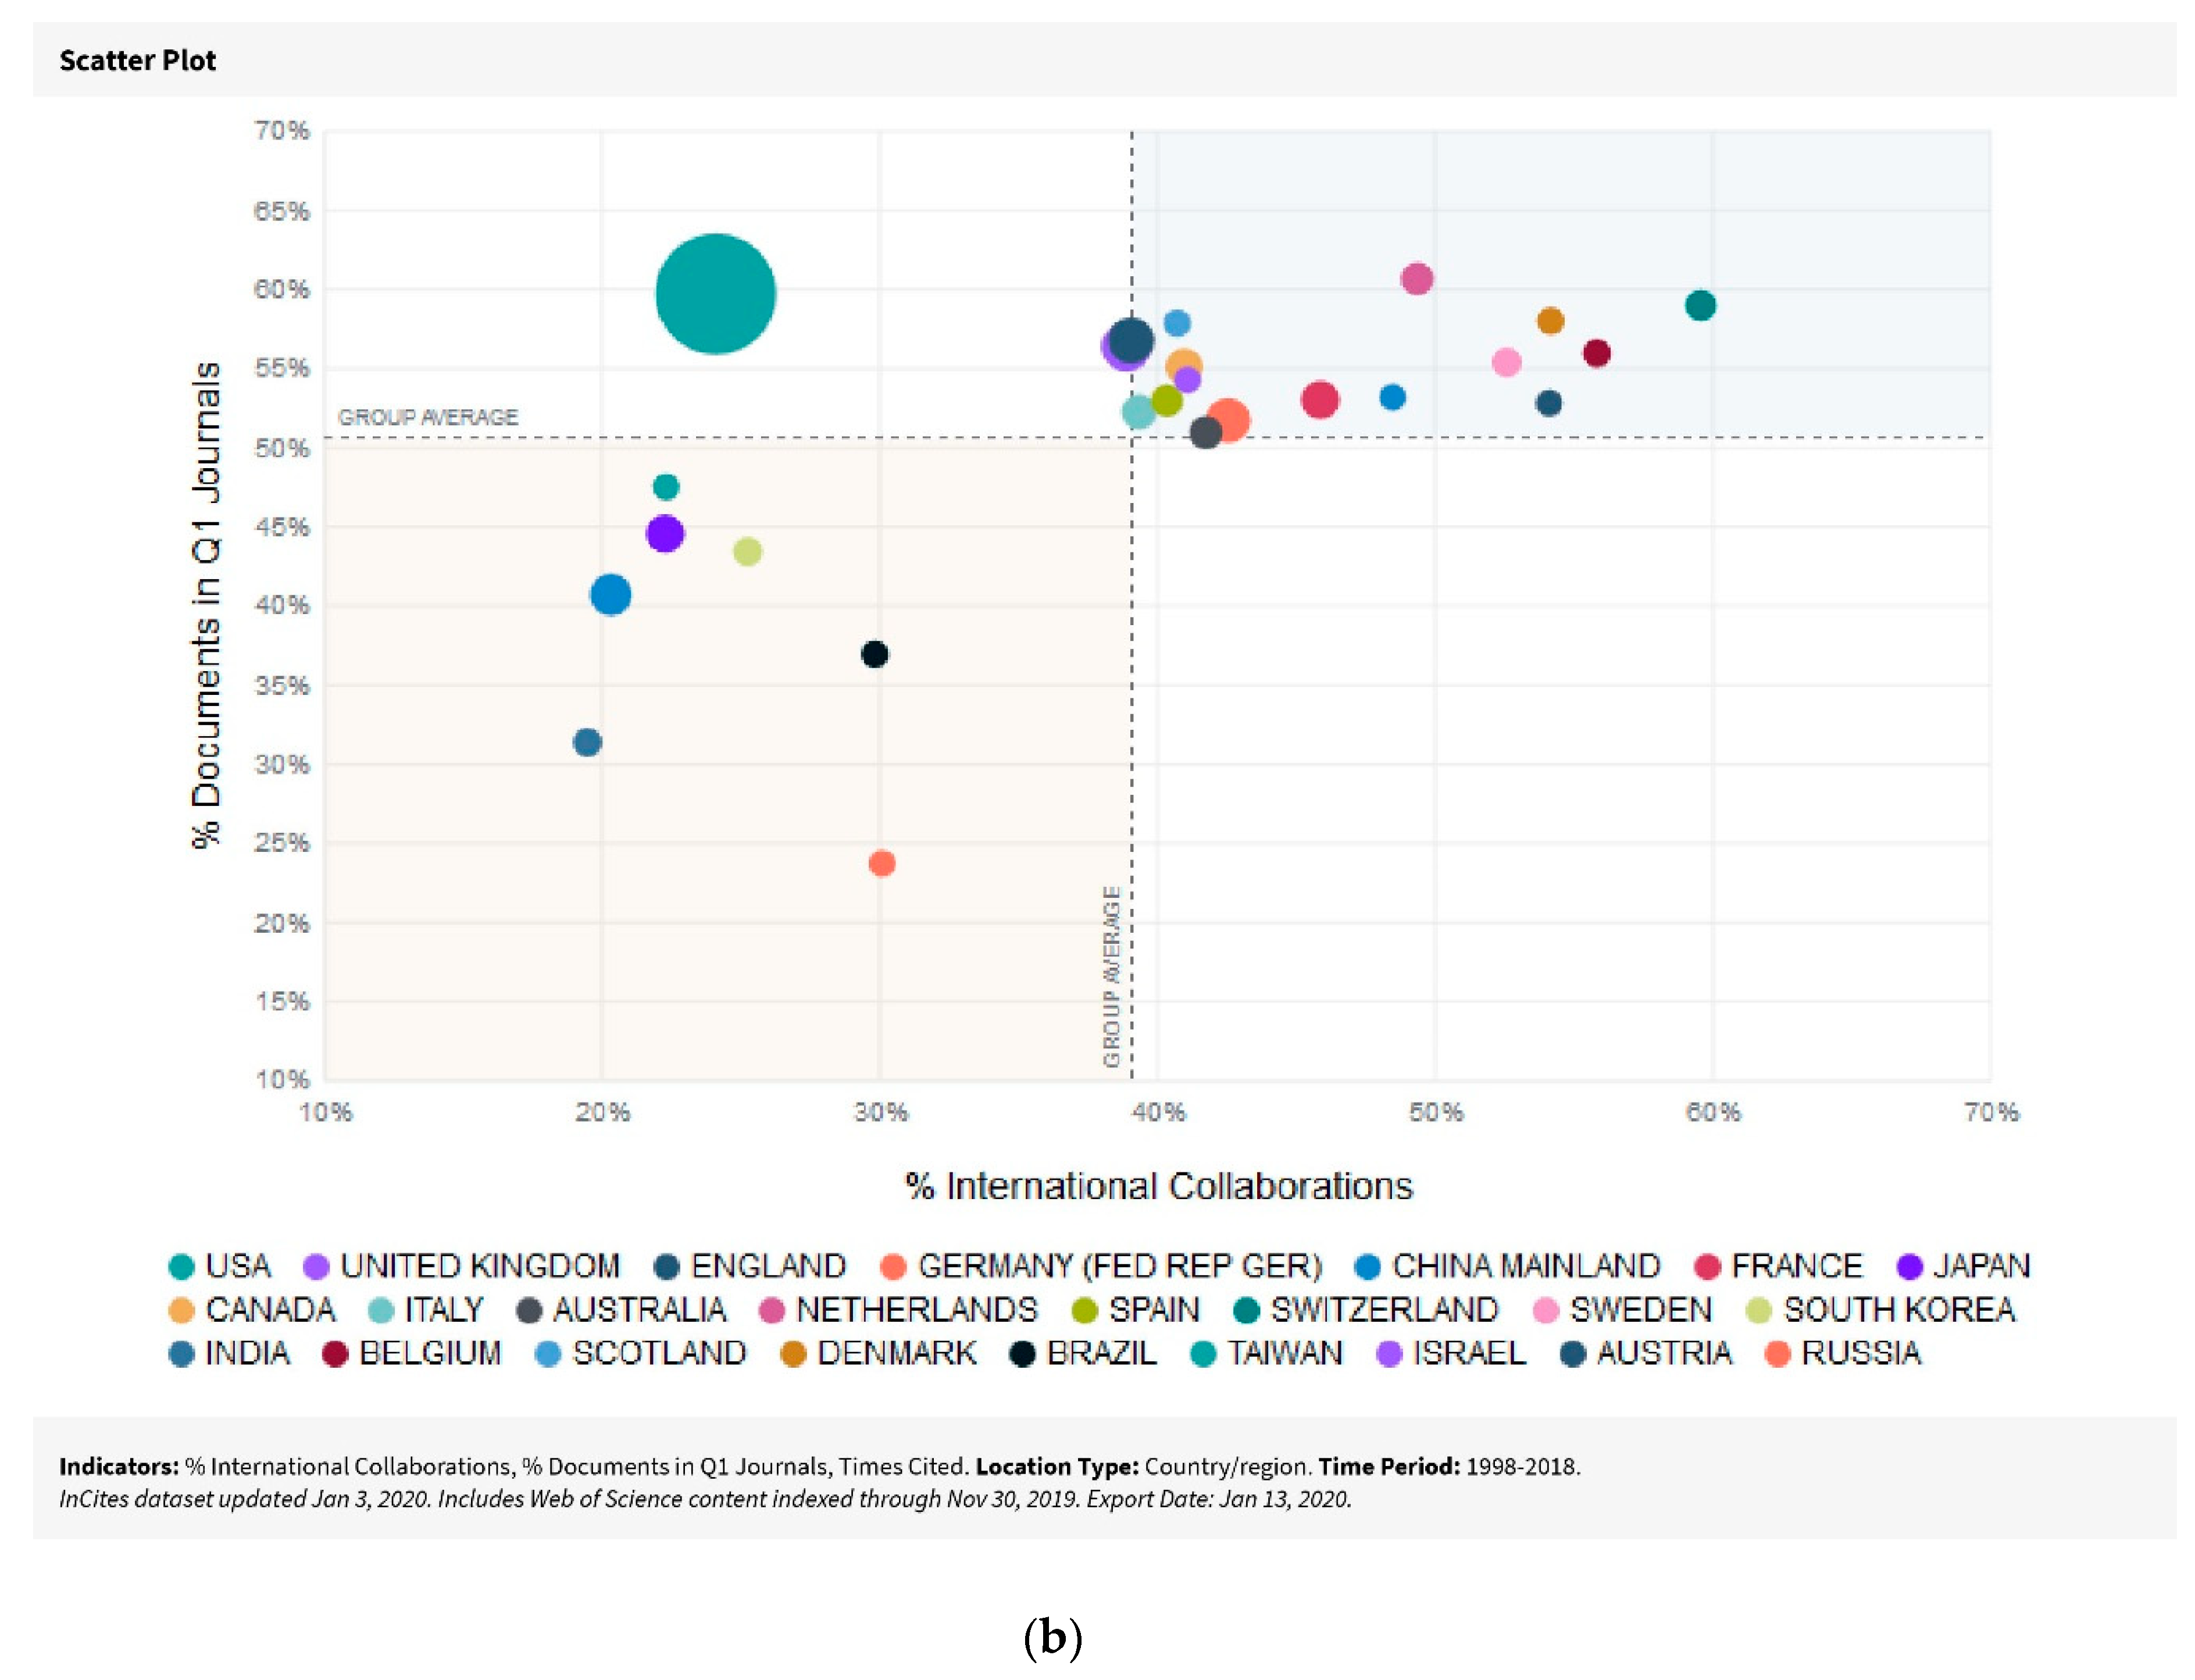
  • What is the degree of international scientific collaboration in OMSAMC research?
  • What type of authoring patterns are observed in the results of OMSAMC research?
  • What are the main concepts that appear in OMSAMC research publications?
  • What are the main themes, approaches and methods of OMSAMC?
  • What are the main areas of application of OMSAMC research?
This work offers a science mapping analysis that studies the development of OMSAMC during the period 1998–2018. We have used both manual and computational analysis for this purpose. The collected data obtained from Web of Science (WoS) database is analyzed computationally with the aim to identify the year-wise number and rate of growth of proceedings, articles, reviews and book chapters, as well as the different types of authorships on OMSAMC, collaboration and citation patterns, the most productive authors, journals, keywords, institutions and countries during the period. Thereafter a detailed manual analysis of the research publication data is performed to identify popular trends, patterns, approaches and possible application areas of OMSAMC.
To the best of our knowledge, this is the first work of its kind, differing from the rest of the science mapping analysis works and scientometric studies in opinion mining and sentiment analysis (Piryani et al. 2017) due to the research focused in marketing communications (MarCom).
This perspective change from previous works makes this study more targeted towards marketing communications scholars, therefore allowing a more precise analysis on the topic while taking into consideration its particularities. This results in a set of scientific network and research productivity clusters that describe very concisely the current interactions and research areas within this field. For this reason, this study may be useful for experts in information processing and scientific communication, specialists in research policy formulation as well as for students and researchers in the fields of communication, computer science, psychology, marketing or artificial intelligence.
The research has been organized as follows: Section 2 is the results section and presents in an analytical way the data obtained from the analysis of scientific maps on sentiment analysis and opinion mining in marketing communications. Section 3 is the discussion and debates the results, presenting the different approaches and levels of OMSAMC, the main sources of data, the areas of application as well as the possible future lines of research. Section 4 is the Materials and Methods section, describing the data collection and the methodology.

2. Results

In this section, we present the science mapping and scientometric indicators computed through computational analysis of the data. The subsections below present details of different indicators computed and figures and tables illustrating the resultant values of the analysis.
The results are derived from bibliometric analysis obtained from the Web of Science (WoS) database. To date, the 845 studies (1998–2018) that were found and that will form the basis of this analysis is presented. In addition, it limited the analyzing to the document types “Articles”, “Reviews”, “Book Chapter” and “Proceedings paper” written in English.

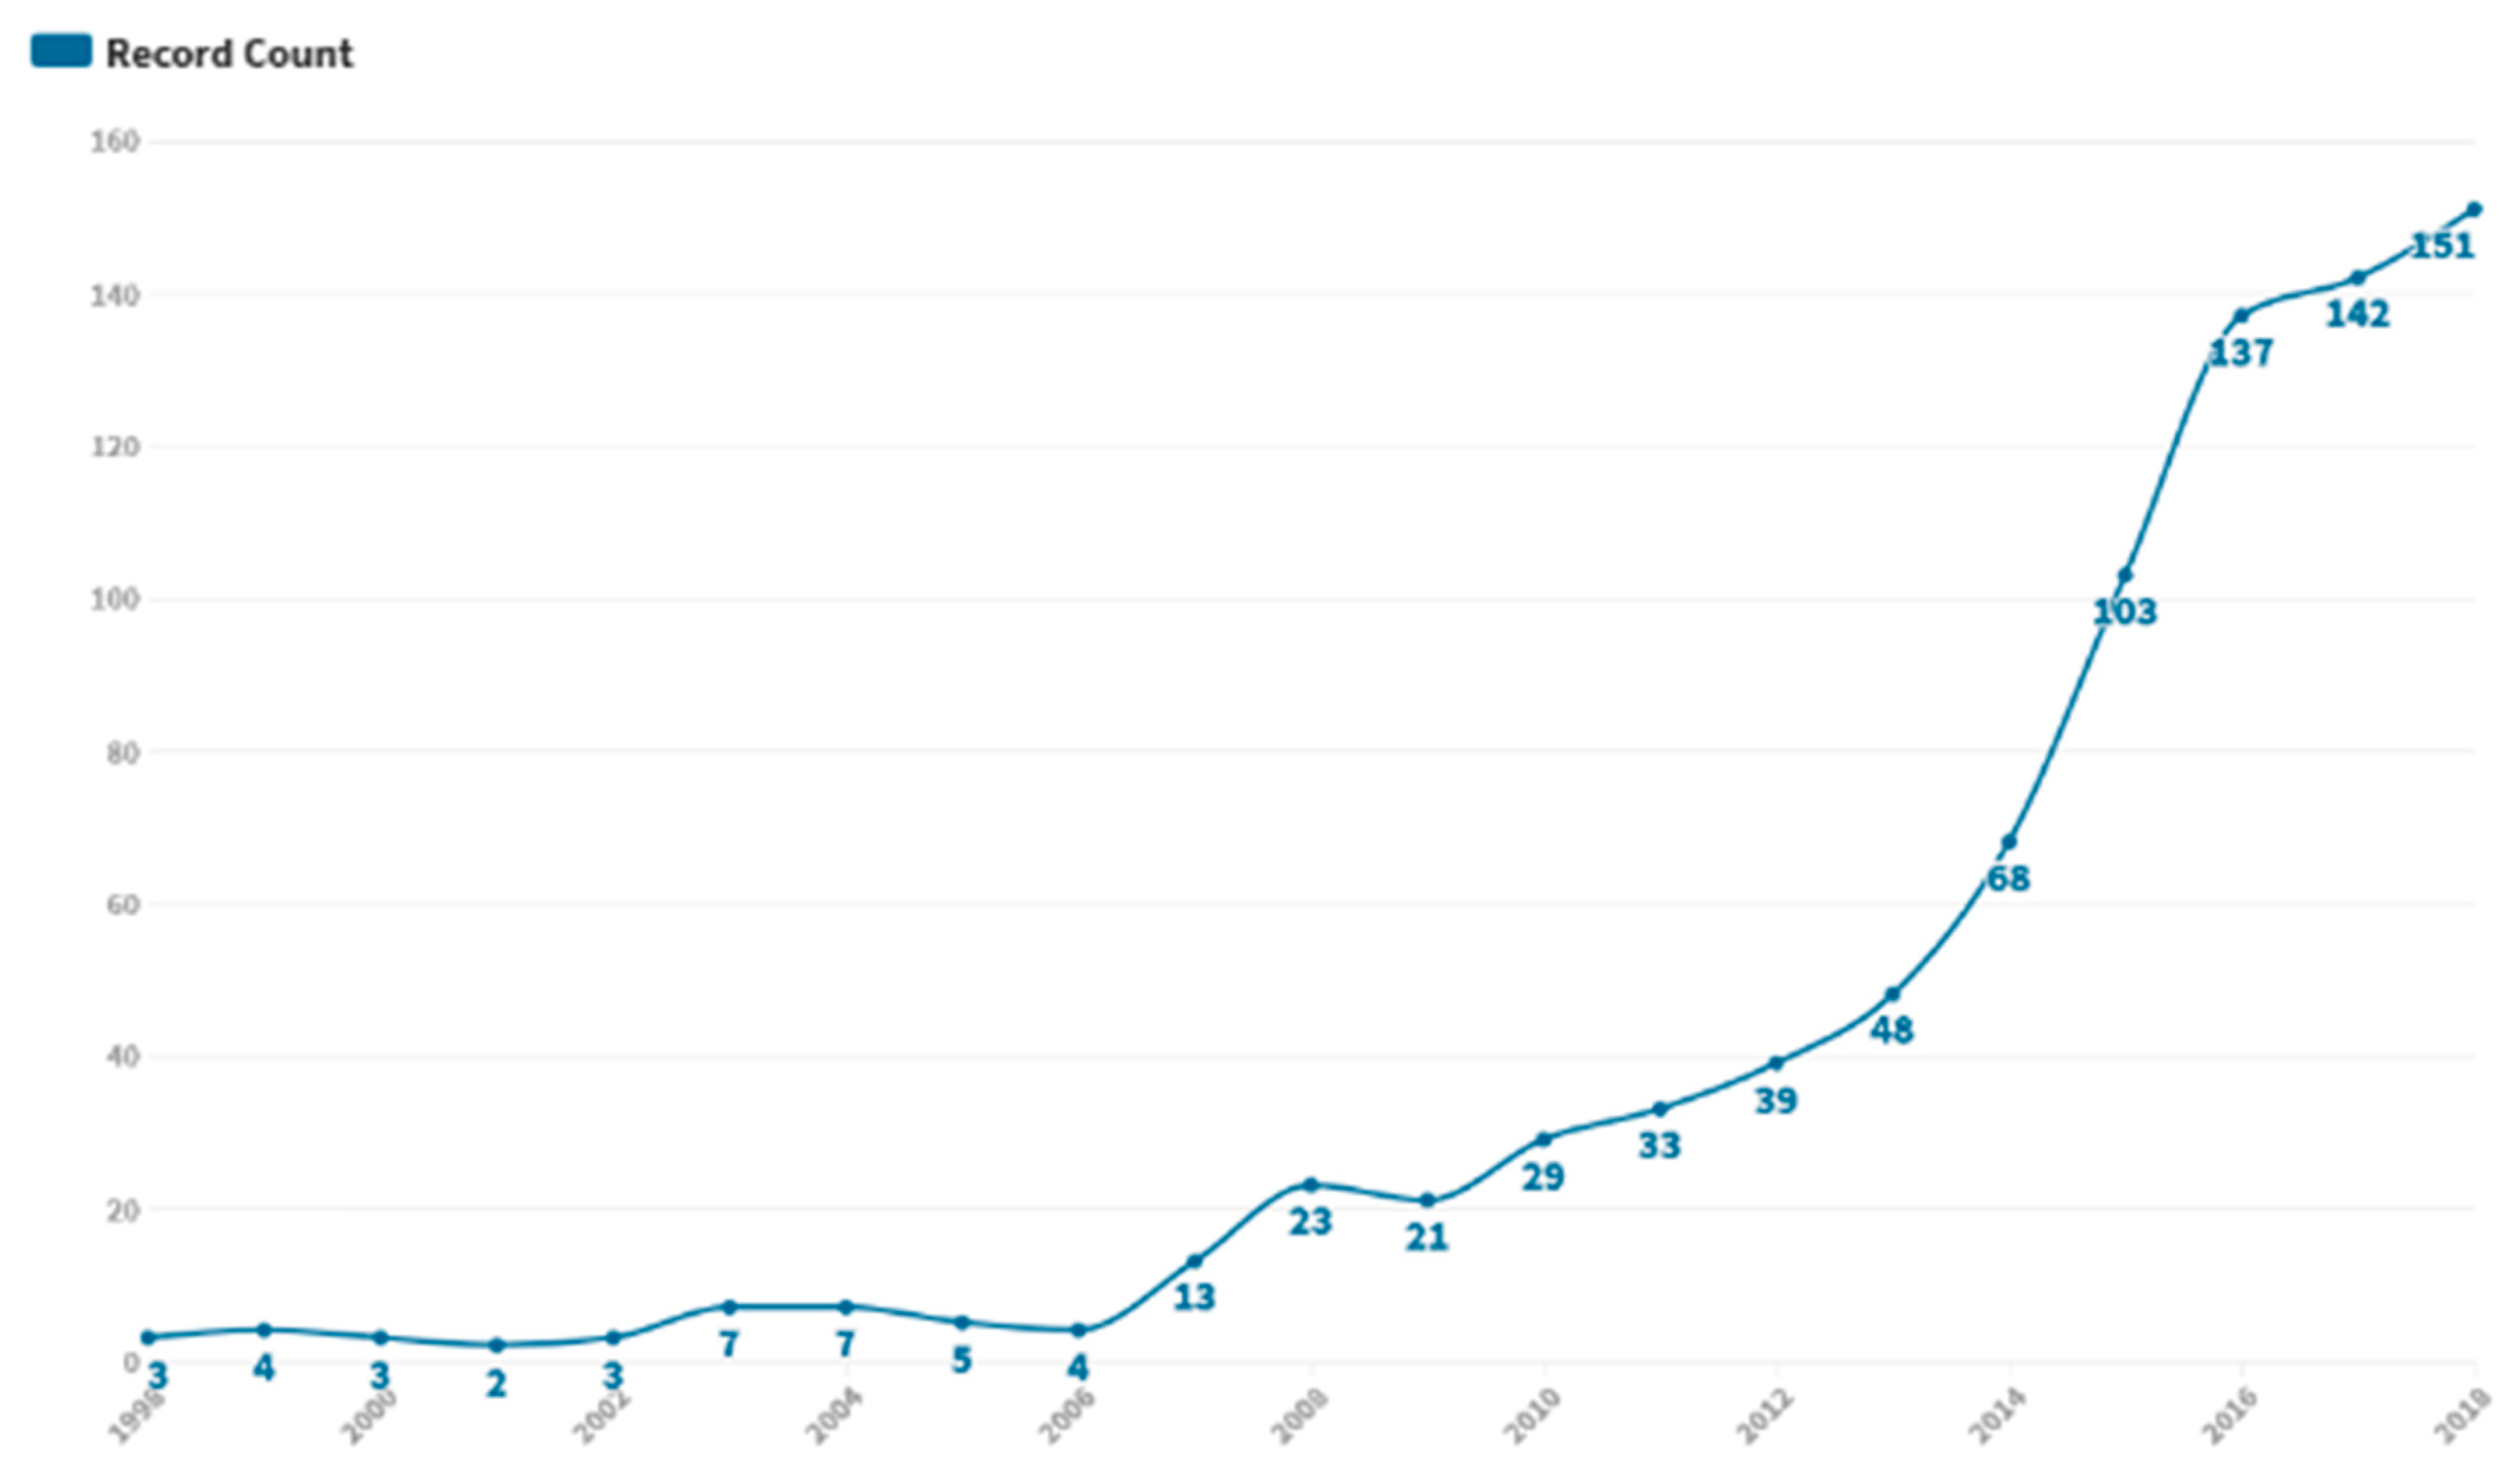
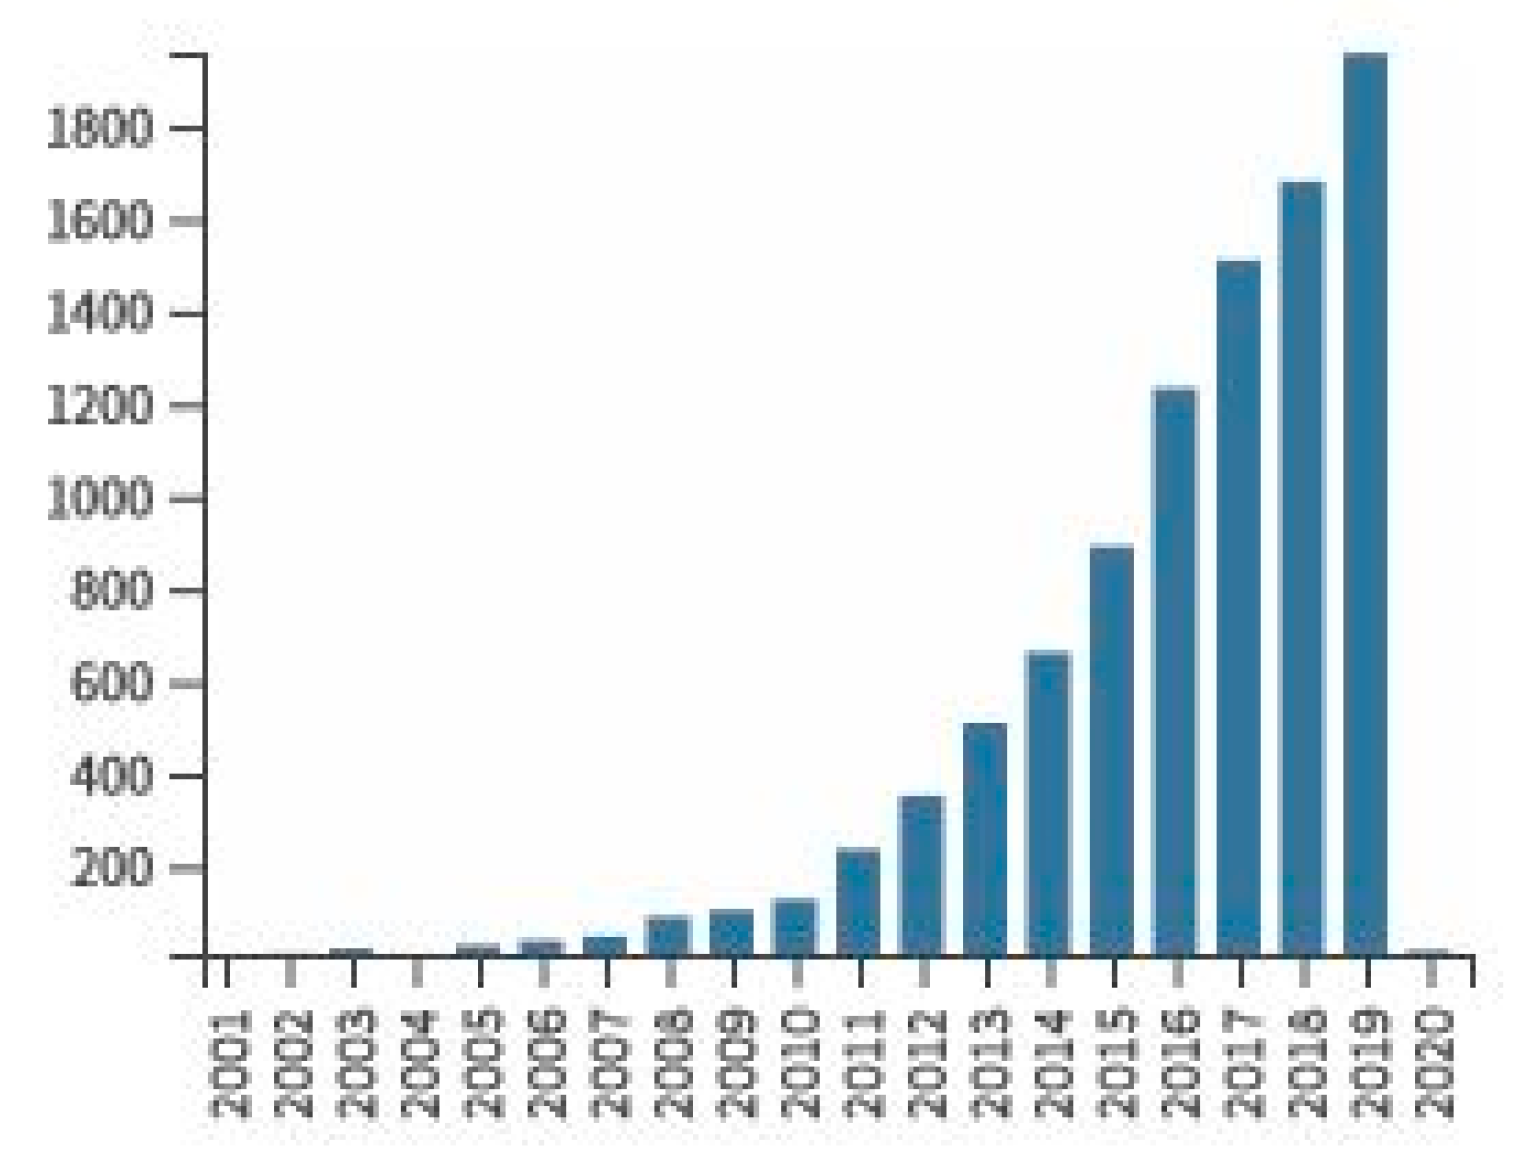
2.1. Distribution of Documents by Year (1998–2018)

The distribution of publications during the period 1998–2018 is shown in Figure 1. During the first decade (1998–2007) of studies, a sustained growth of publications (51) is observed while in the second decade (2008–2018) it was detected that OMSAMC has shown exponential growth in the number of investigations (794).

2.2. Citation Report

The total publications retrieved (Table 1) combined had a sum of 9557 citations (Figure 2), making an average of 11.31 citations per paper. The H-index is 49, which means that there are 49 studies that have received at least 49 citations.

2.3. Top 25 Co-Authorship Analysis (Authors and Record Count)

The 25 most productive international collaborations can be seen in Table 2, which presents a ranking of the 25 most influential authors for OMSAMC, along with the number of international collaboration documents produced, the sum of citations and the total link strength.
A citation network (1998–2018) is shown in Figure 3, where we find four clusters: a 1st group of 136 publications, 2nd group of 55 publications, 3rd group of 21 publications and 4th group of 15 publications. Additionally, there are 618 publications that do not belong to any cluster. The citation visualization network is based in 60 publications (based on their citation score).
The authors Beijer and Crundall are founded but they are isolated from the rest of the literature. Pieter’s publication is not only included in the main network but also originates it.

2.4. Group Authors and Record Count

A Group Author is an organization or institution that is credited with authorship of an article by the source publication. OMSAMC Group Authors and Record Count are shown in Figure 4. We observed that in the Top 5 Group Authors, IEEE has the biggest number of corporate authors with 140, followed by ACM with 14, Association for Computer Machinery with 3 and towards the end ASME and DEStech Publications, Inc., both with 3.

2.5. Top 25 Co-Authorship Analysis (Countries/Regions and Record Count)

This section presents the results of the most influential Co-Authorship countries in OMSAMC publications (Figure 5a), as well as the document and citation details of the first Top 10 countries in OMSAMC Co-Authorship.
The first place is occupied by the USA (211 documents and 4939 citations), followed by The Netherlands (36 documents and 1623 citations), Italy (50 documents and 824 citations), China (90 documents and 670 citations), England (45 documents and 590 citation), Germany (44 documents and 460 citations), France (24 documents and 452 citations), Australia (32 documents and 374 citations), Singapore (25 documents and 361 citations) and towards the end by Spain (37 documents and 344 citations).
InCites regional analysis (Figure 5b) allows us to view and compare indicators at the country level, seeing the geographical distribution of the top producing regions, authors in publications in each research area and identification research trends in countries of interest (Fonseca et al. 2016; Luukkonen et al. 1992). InCites Regional Indicators measure Productivity (% Documents in Q1 Journals, count of documents in Q1 Journals), Collaboration (% International Collaborations, percentage of publications that have international co-authors) and Impact (Times-Cited, number of times the set of publications has been cited).

2.6. Top 25 Co-Authorship Analysis (Organizations and Record Count)

Table 3 presents a ranking of the most influential international collaborations through universities along with several documents and sum citations indicators; two indicators of global university ranking according to the 2019 Quacquarelli Symonds (QS) World University Rankings and 2019 Academic Ranking of World Universities (ARWU) that allow us to measure the relative position in which we find the most influential institutions in OMSAMC.
Within the first 10 universities, 50% are in the United States, followed by institutions in The Netherlands (1), Singapore (5), Hong Kong (6), Denmark (7) and United Kingdom (8). Further down the rankings are other institutions in Korea, China, Australia, Malaysia and Italy. The first institution in the ranking in terms of international collaboration is Tilburg University with a total of 14 documents published in OMSAMC, where 14 of these studies have received 1085 citations. As for the relative position of the University, Tilburg University is located within the first 501–600 ARWU 2019 and 319 QS 2019. The following university is University of Michigan, with a total of 7 articles published, of which 7 have been cited at least 739 times. The following one is the University of Pennsylvania, with 5 papers published and a ratio of 461 citation.
Only 12 of the Top 25 rankings of universities are in the Top 100 ranking according to ARWU: University of Michigan, University of Pennsylvania, The University of Maryland, Nanyang Technological University, University of California San Diego, Pennsylvania State University, University of Florida, University of Minnesota, University of Pittsburgh, The Australian National University, Zhejiang University and National University of Singapore. Of these, 8 are in the United States while only 8 are part of the Top 100 according to QS: University of Michigan, University of Pennsylvania, Nanyang Technological University, University of California San Diego, Pennsylvania State University, The Australian National University, Zhejiang University and National University of Singapore.

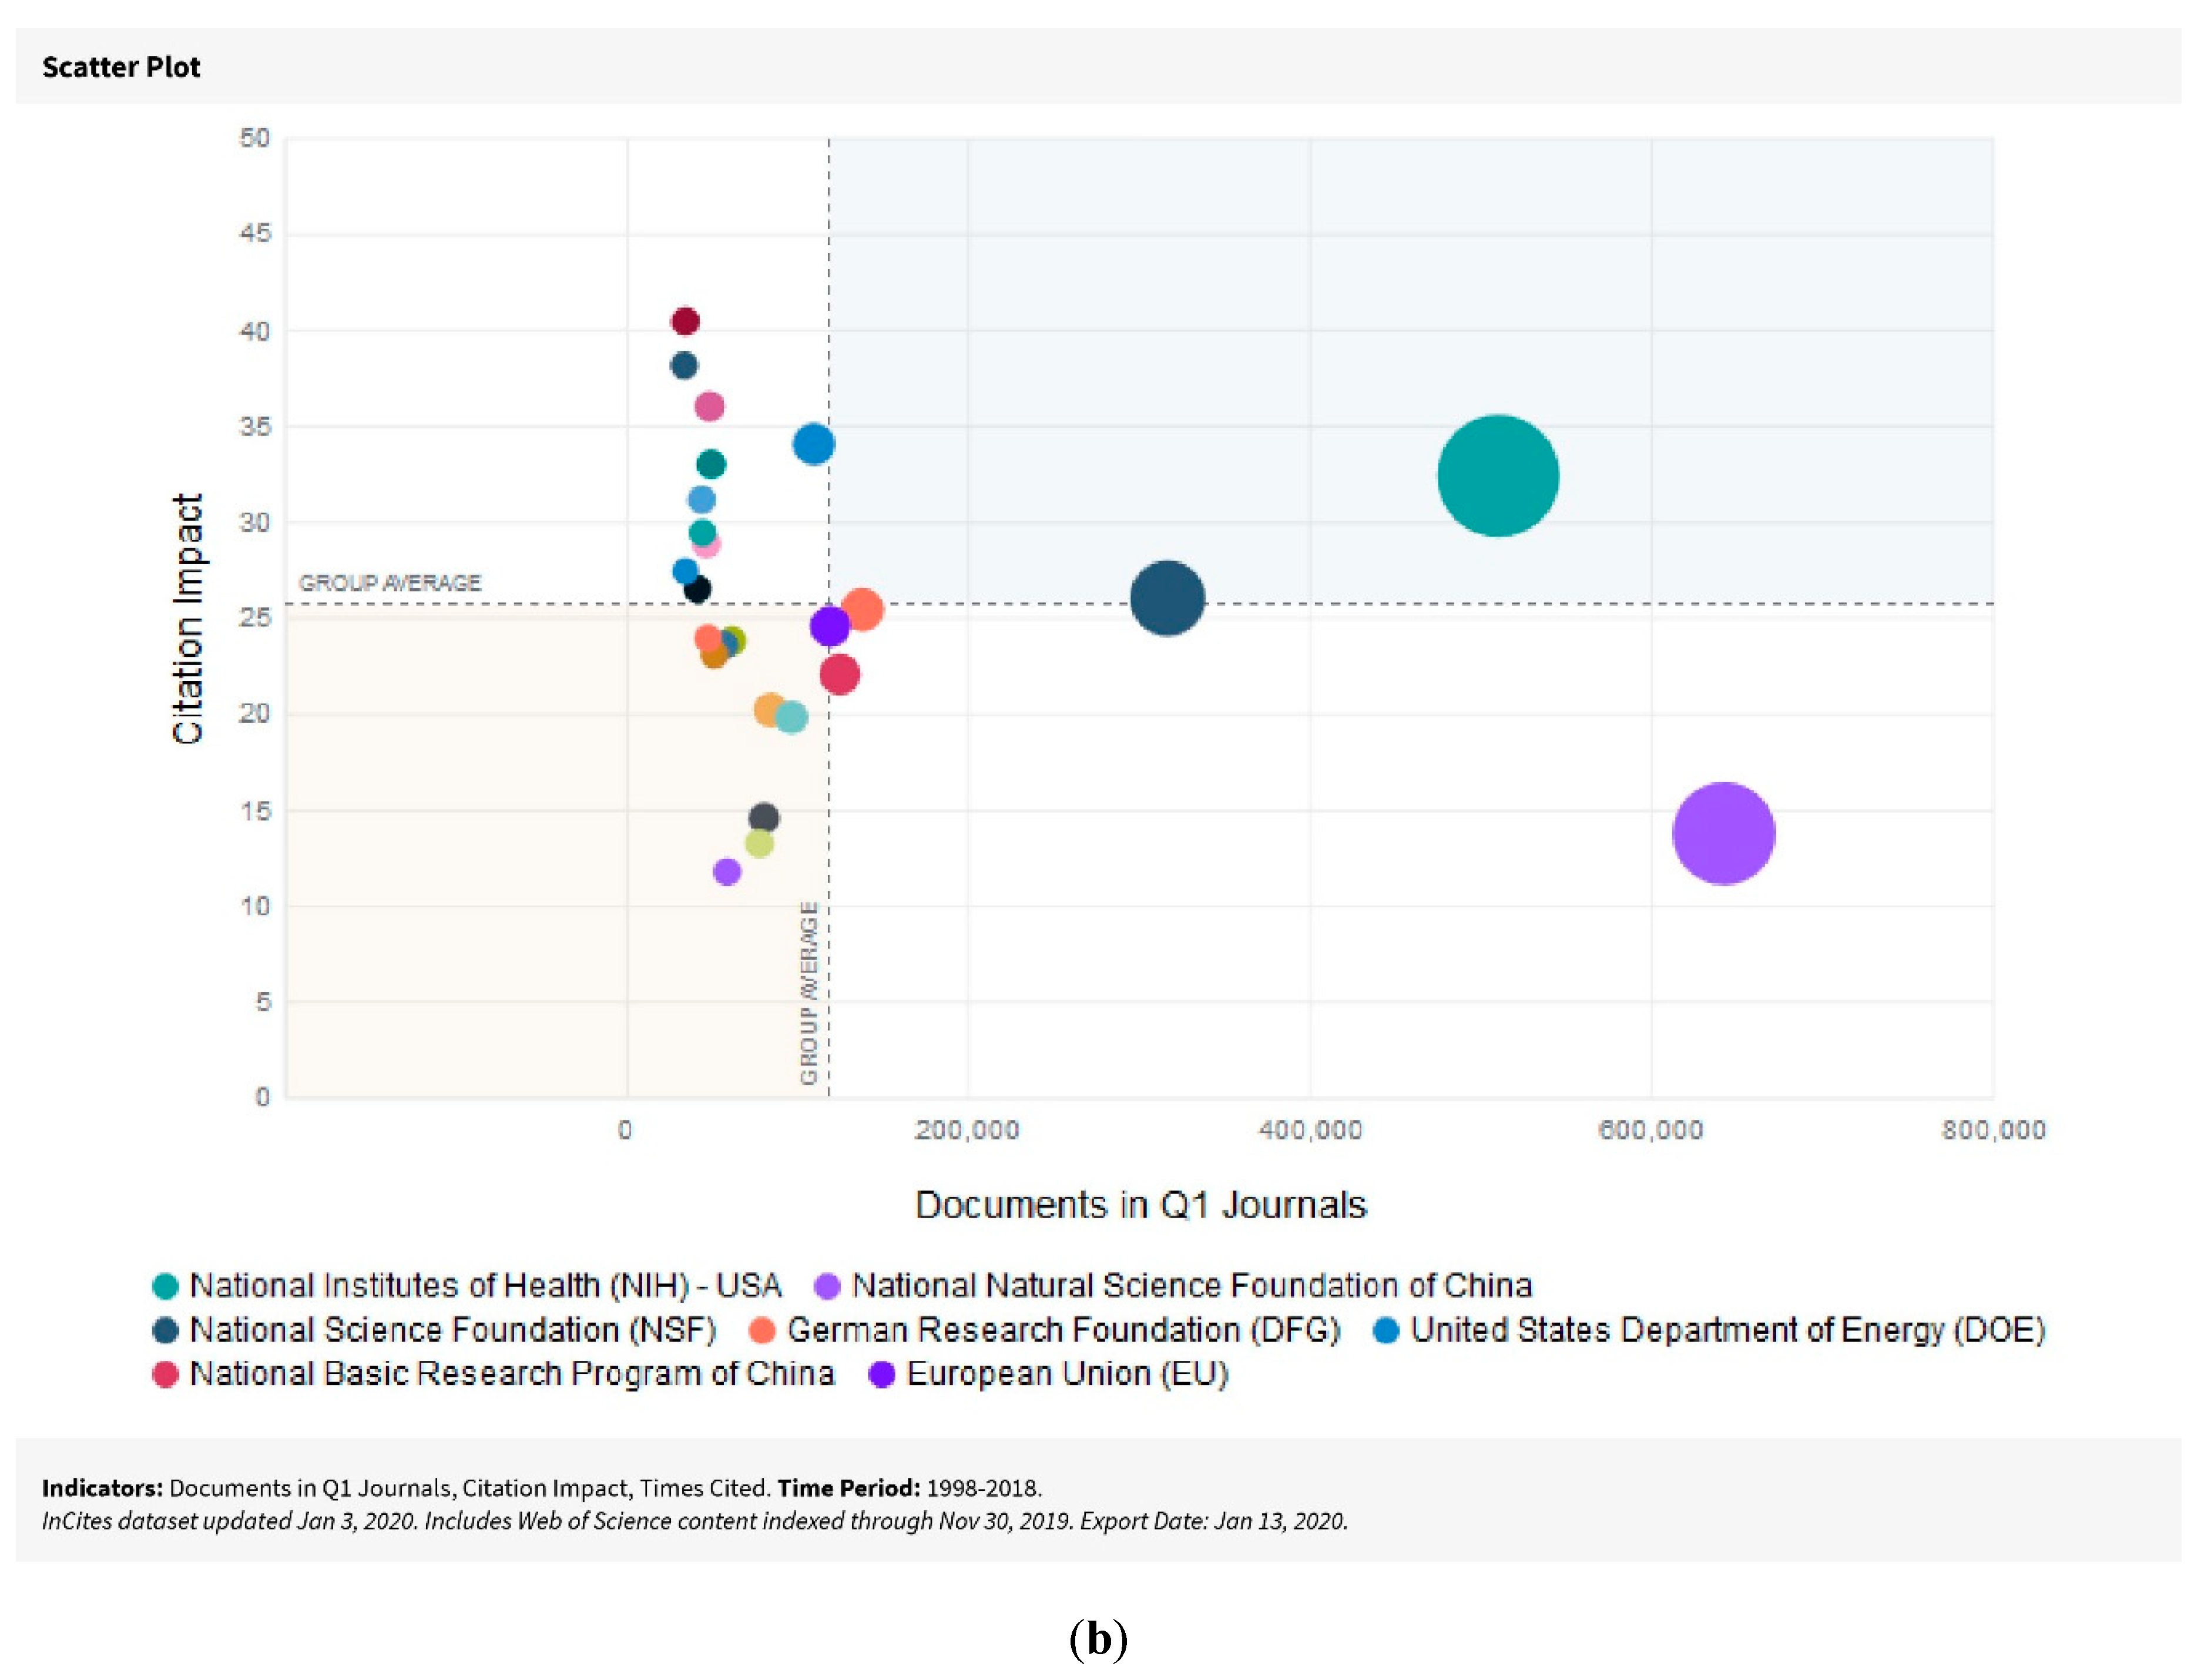
2.7. Top 25 OMSAMC Funding Agencies and Top 25 InCites Funding Agencies and Record Count

In this section we analyze the impact of OMSAMC research that has been funded and/or published by funding agencies. We assess this by leveraging unified funding acknowledgment data from the Web of Science (Figure 6a), with the aim to understand whether these funds were spent in studies that made a disruptive scientific advance (Álvarez-Bornstein et al. 2017).
InCites Funding Indicators (Figure 6b) measure Productivity (% Documents in Q1 Journals, count of documents in Q1 Journals) and Impact (Citation Impact, average number of citations per paper).

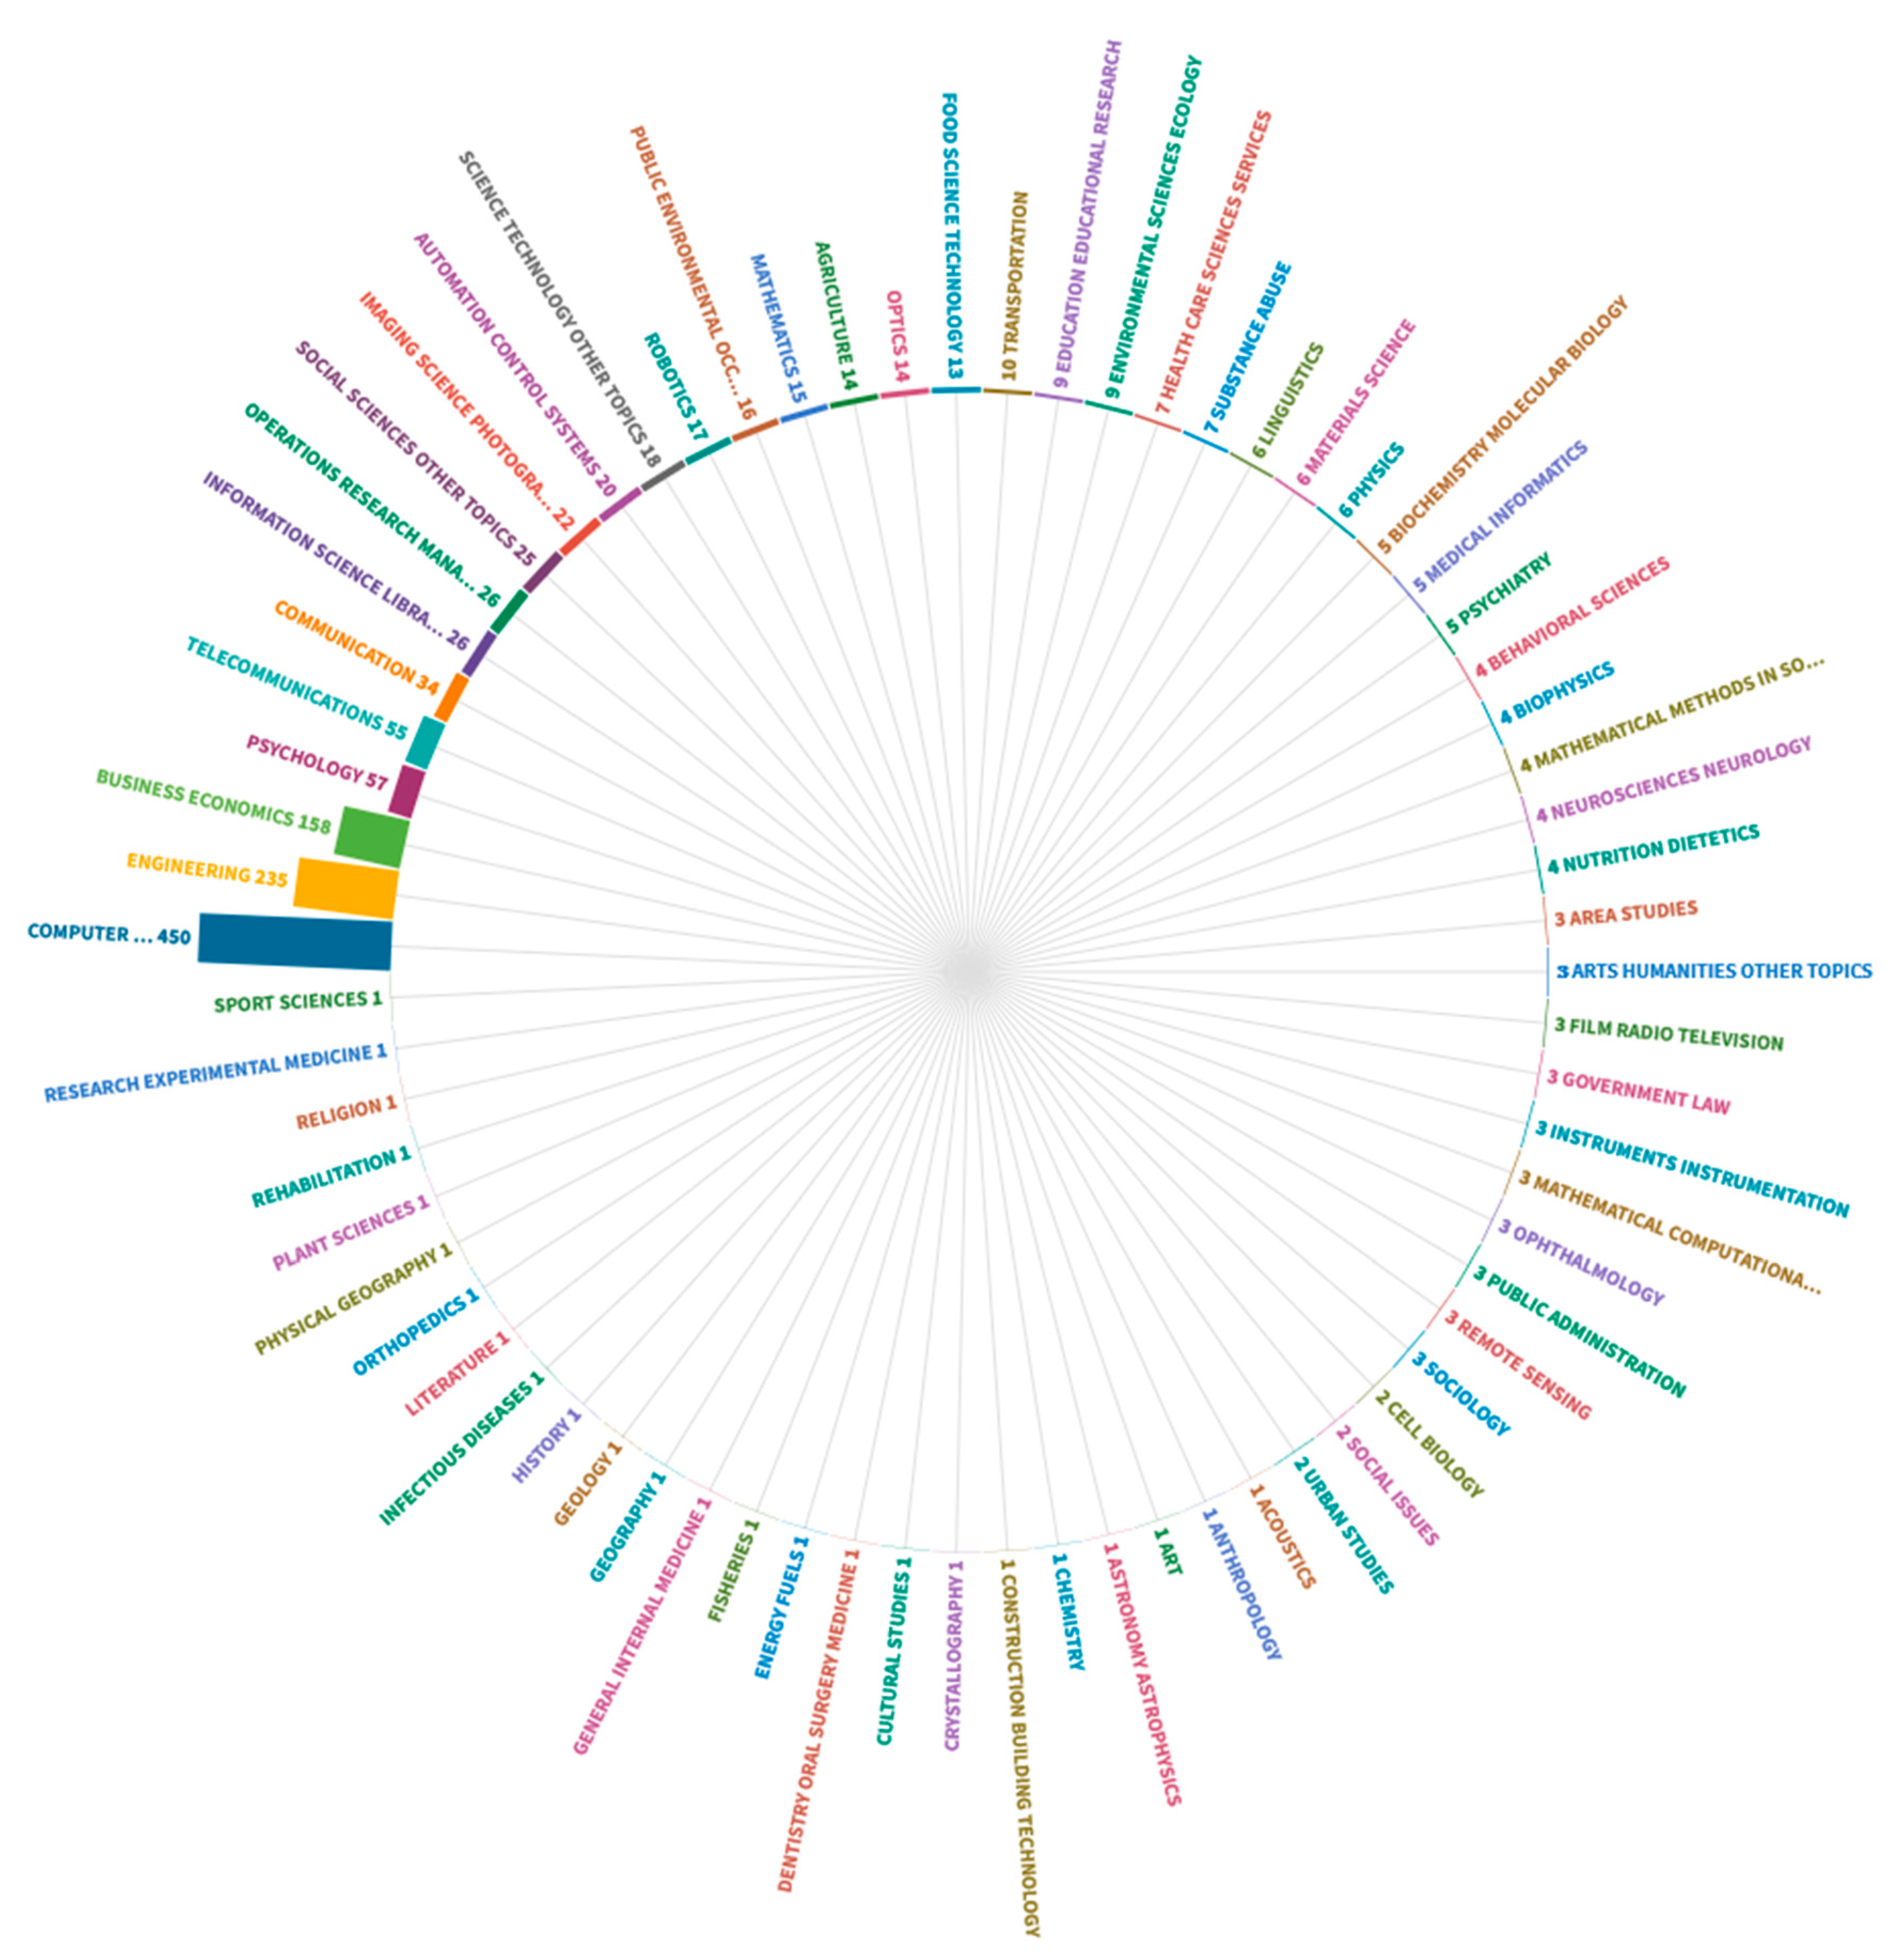
2.8. Research Areas and Record Count

There is a total of 5 general categories on the Web of Science (Arts and Humanities, Life Sciences and Biomedicine, Physical Sciences, Social Sciences and Technology). Within these 5 general categories there are 71 different sub-categories. Figure 7 shows the abovementioned sub-categories. Among the Top 10 most representative categories in OMSAMC we find the following: Computer Science (450 registers and 53.254% of 845), Engineering (235 registers and 27.811% of 845), Business Economics (158 registers and 18.698% of 845), Psychology (57 registers and 6.746% of 845), Telecommunications (55 registers and 6509% of 845), Communication (34 registers and 4.024% of 845), Information Science and Library Science (26 registers and 3.077% of 845), Operations Research and Management Science (26 registers and 3.077% of 845), Social Science and Other Topics (25 registers and 2.959% of 845); towards the end we find Imaging Science and Photographic Technology (22 registers and 2.604% of 845).

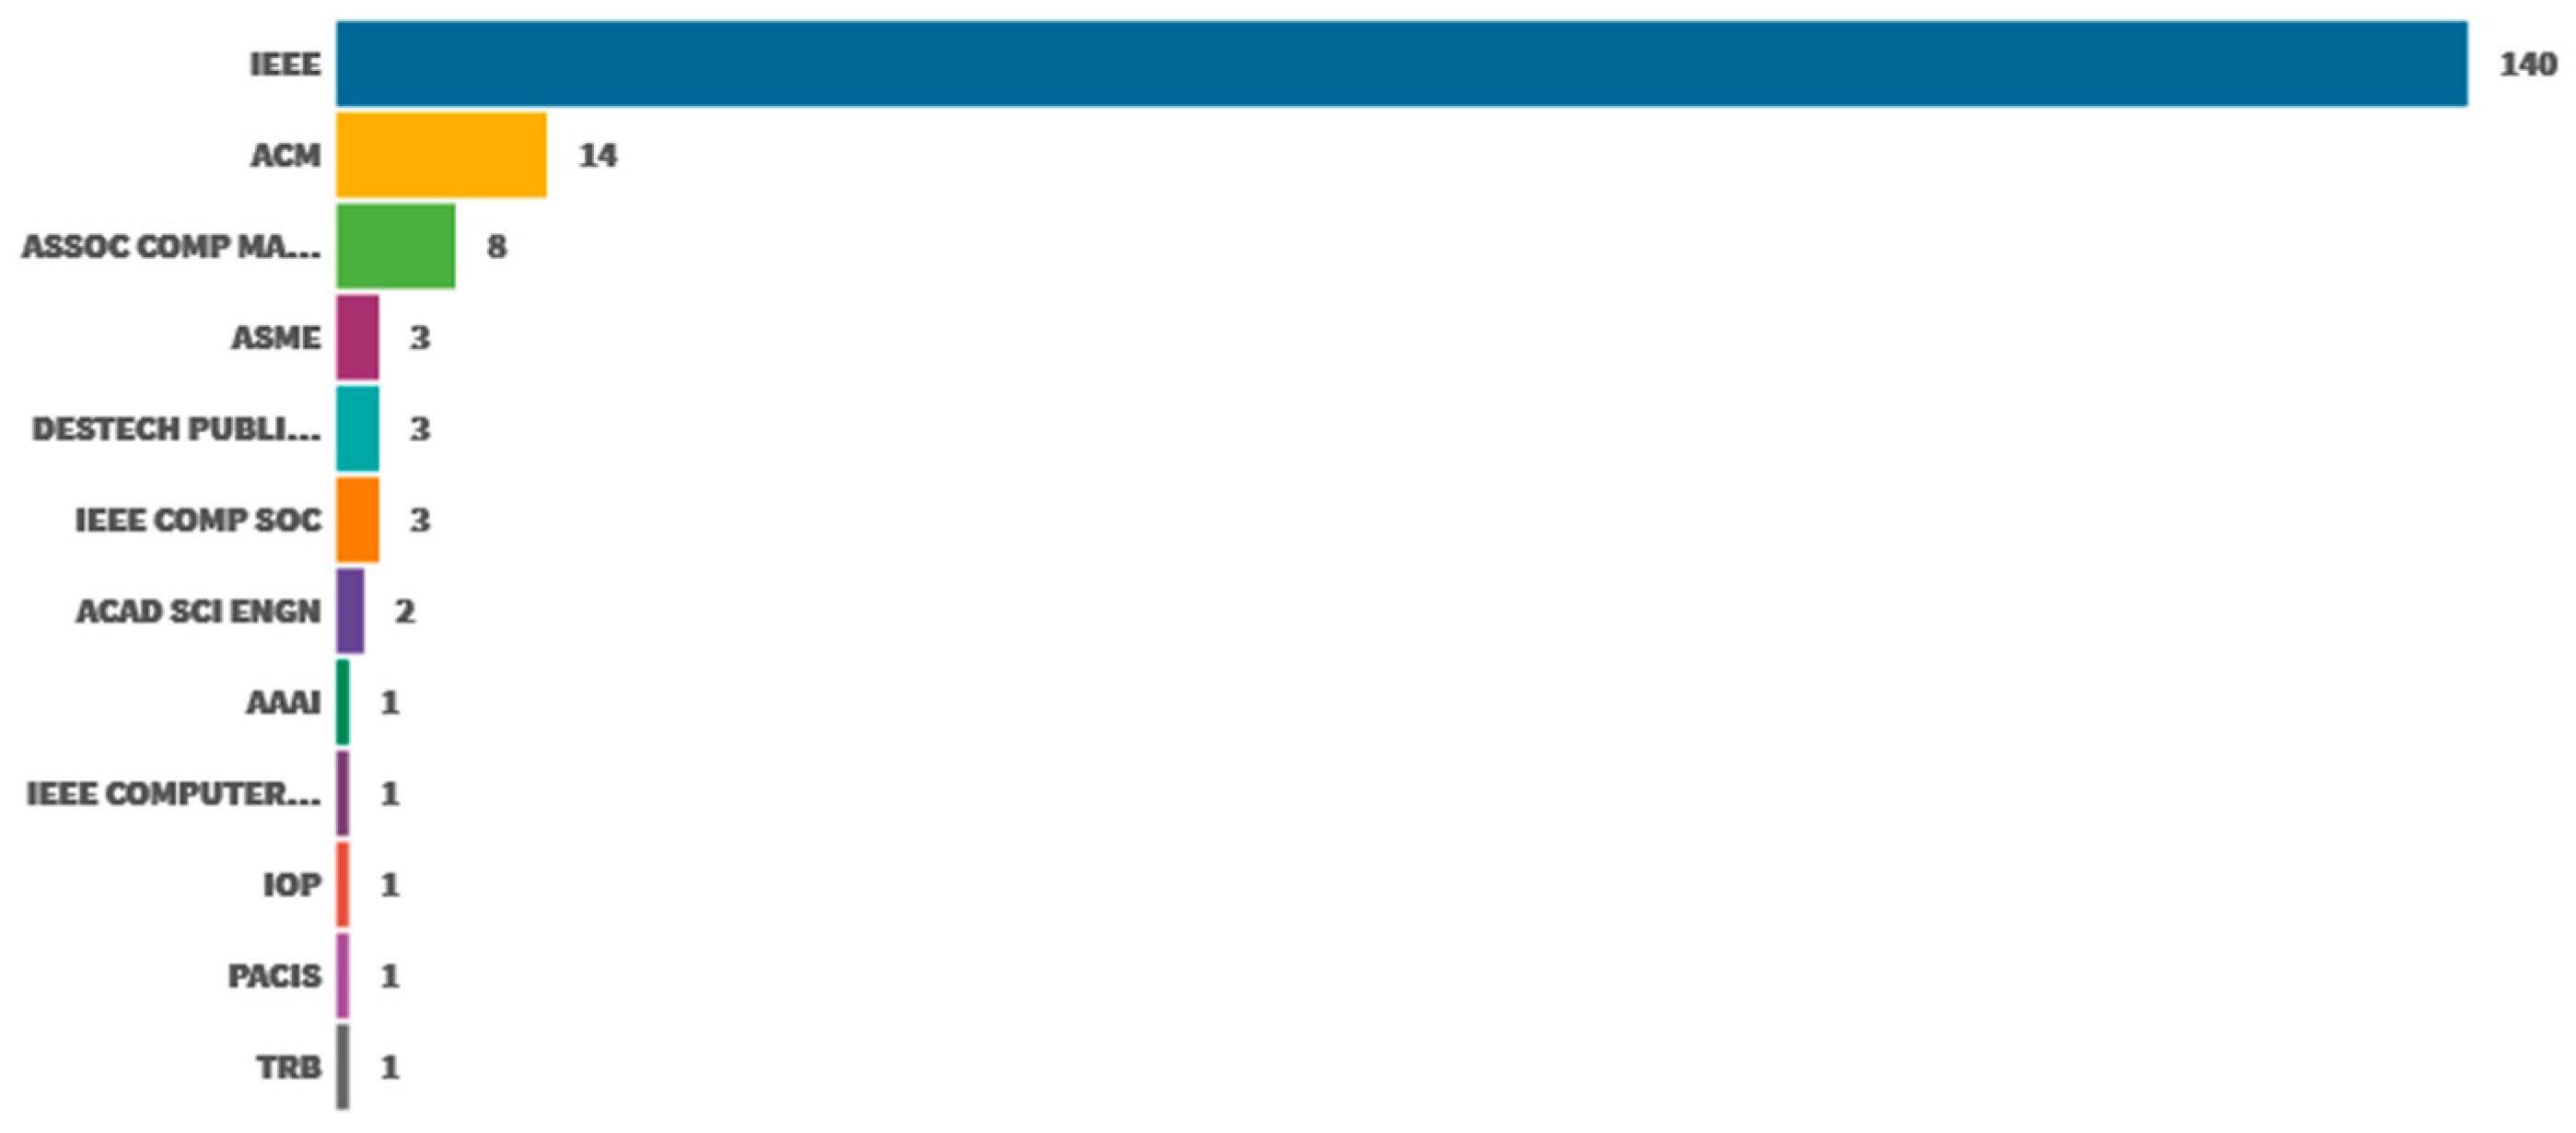
2.9. Top 25 Co-Citation Analysis (Sources)

As shown in Table 4, the most cited journals in OMSAMC have a clear focus on marketing since they prominently cited marketing magazines. Journal of Consumer Research (1st ranked with a sum of 521 citations), Journal of Marketing Research (2nd ranked with a sum of 371 citations), Journal of Marketing (3rd ranked with a sum of 316 citations), Lecture Notes in Computer Science LNCS (4th ranked with a sum of 296 citations) and Journal of Advertising (5th ranked with a sum of 279 citations) are the most cited journals in OMSAMC. The first, second and third are usually regarded as the three most influential magazines in consumerism and marketing, while the fourth and fifth magazine shows its clear thematic connection (computer science and advertising journals) with OMSAMC.

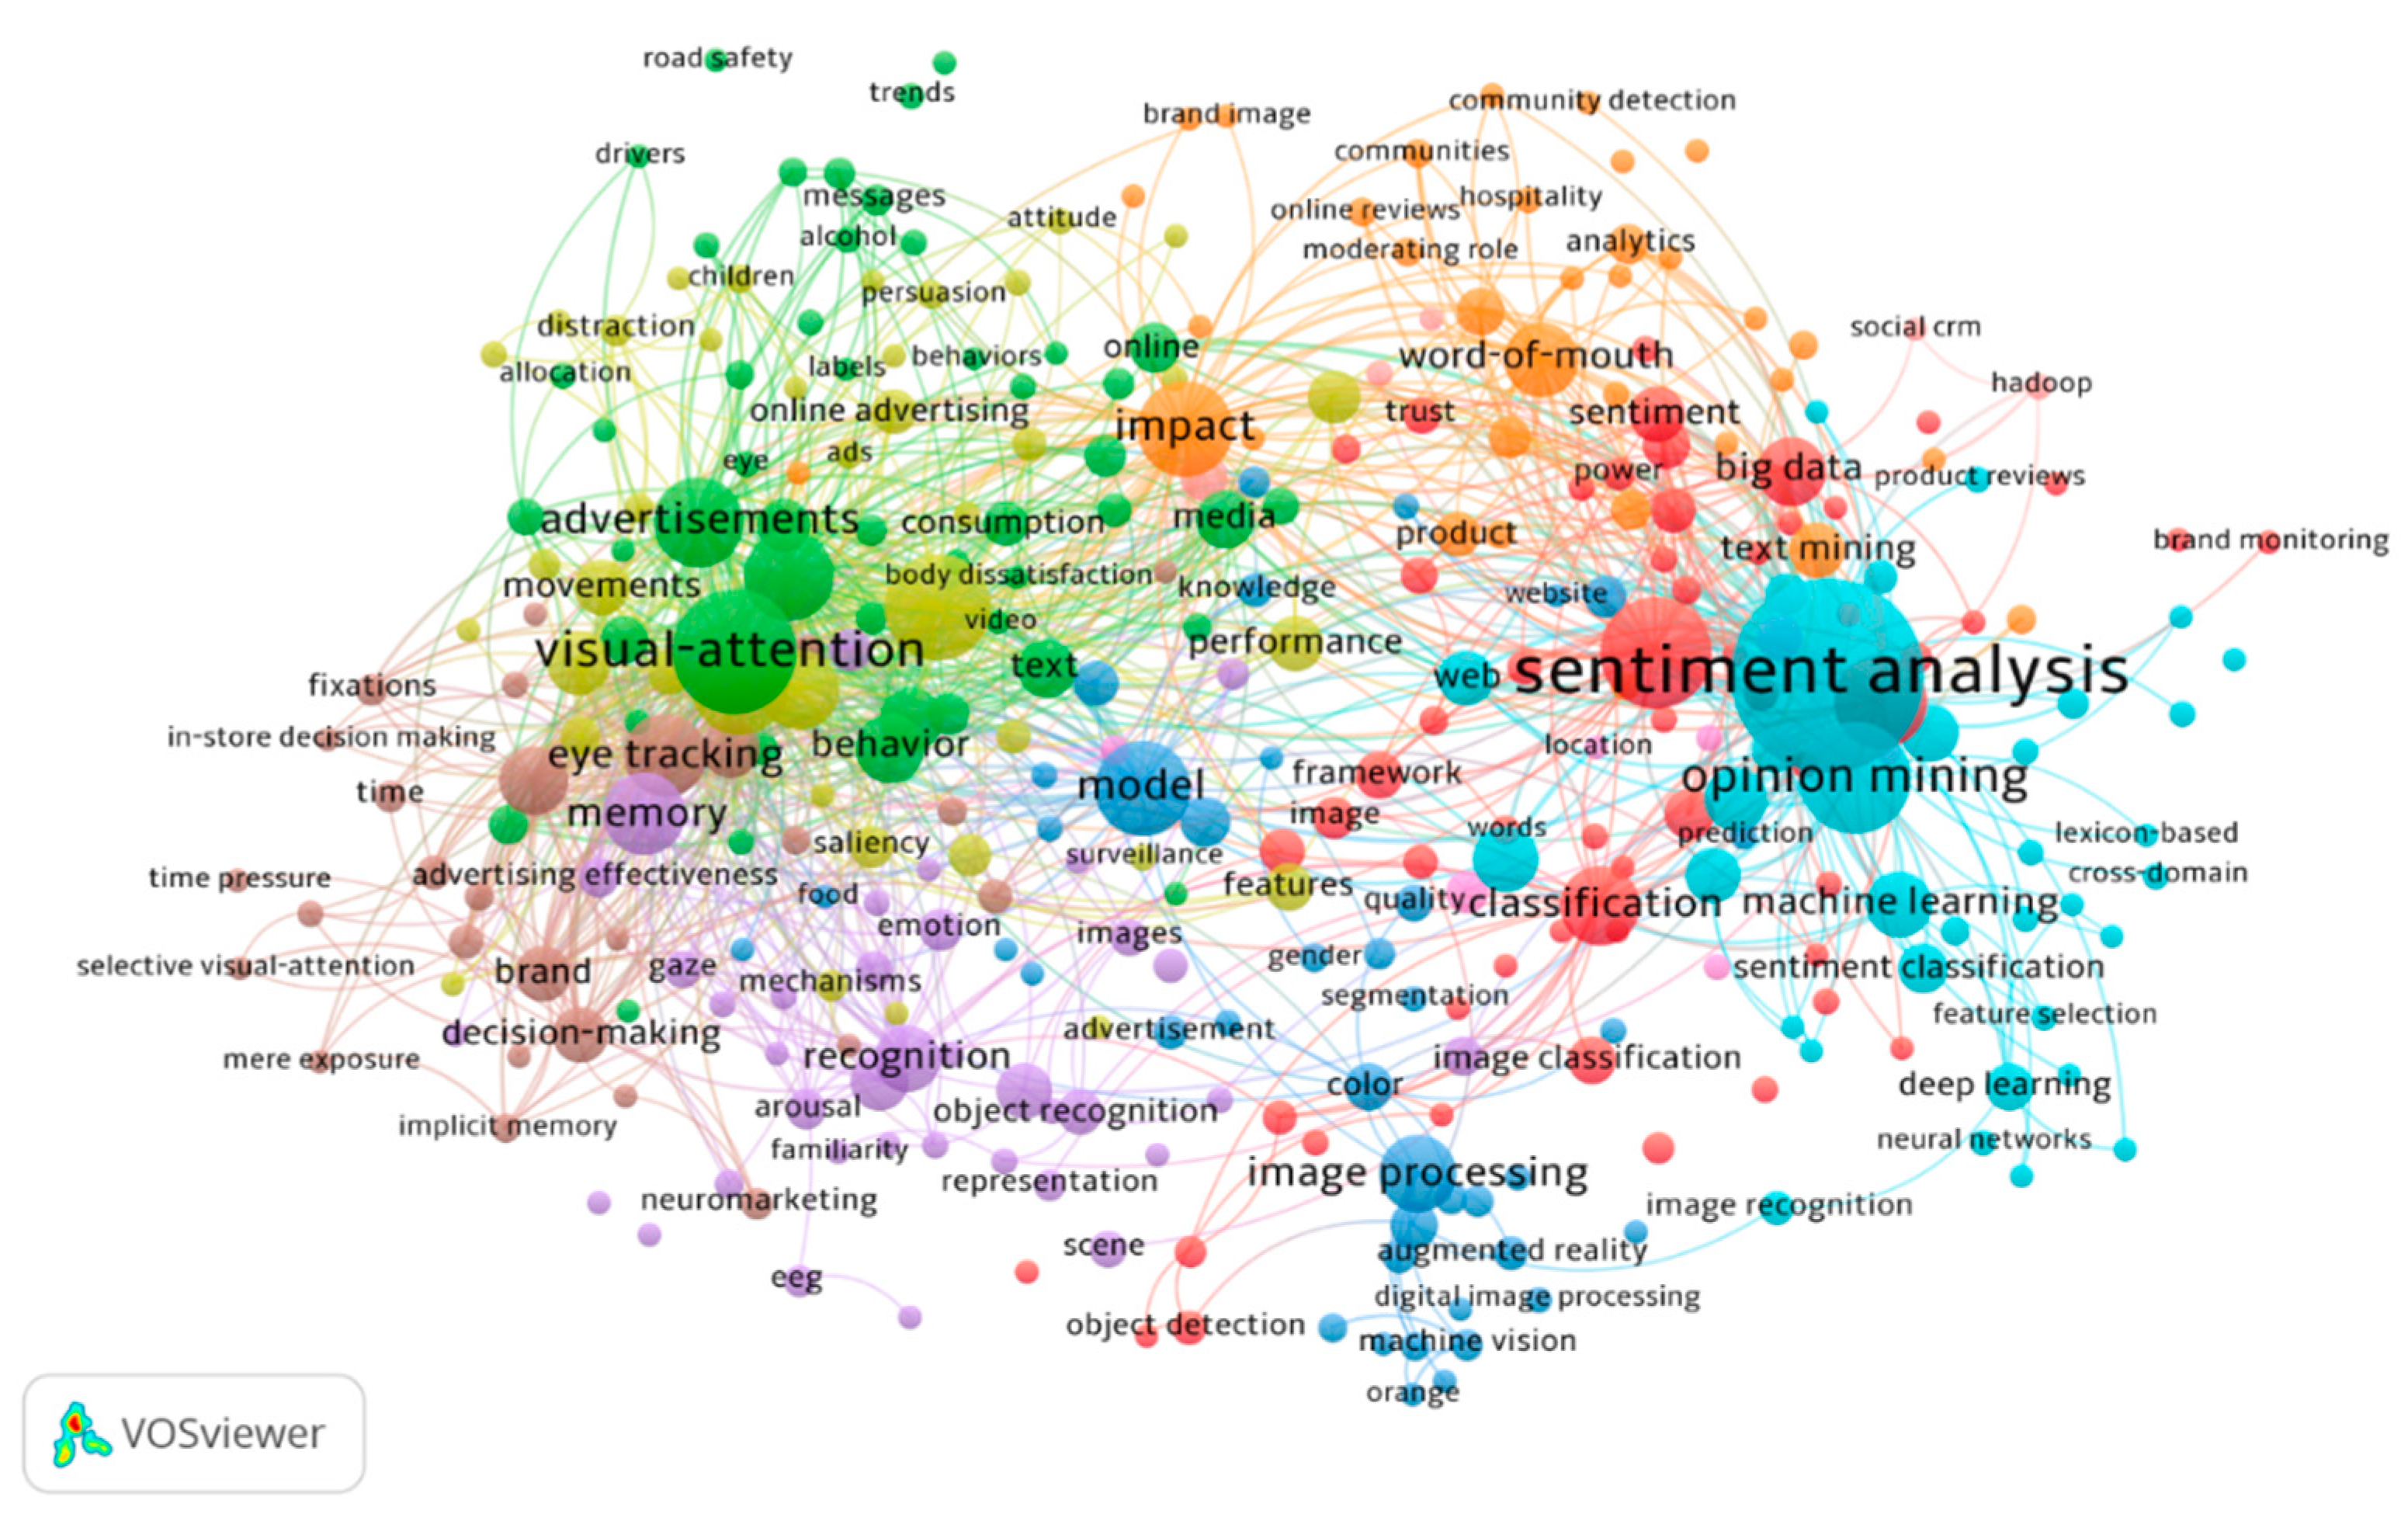
2.10. Co-Occurrence Analysis

The use of cooccurrence data is very common in scientometric and cooccurrences of words may be used to construct so-called co-word maps, which are maps that provide a visual representation of the structure of a scientific field (Van Eck and Waltman 2009). In Figure 8 is shown the relatedness of items determined based on the number of documents in which they occur together (all keywords). The minimum number of occurrences of a keyword was 3. Of the 3094 keywords, 332 met the threshold. We identified 10 different clusters:
  • Cluster 1 Social Media, Machine Learning and Artificial Intelligence: algorithms, antecedents, behavior analysis, big data, blogosphere, brand monitoring, business intelligence, classification, cluster analysis, clustering, community, deep neural networks, emotions, engagement, eye tracking technology, face recognition, Facebook, framework, identification, image, image classification, in-game advertising, influence, information technology, Instagram, intelligence, k-means, literature review, marketing intelligence, models, naive Bayes, network, object detection, opinion, pattern recognition, power, retrieval, satisfaction, sentiment, small business, social influence, social media, social media analytics, social media mining, social media monitoring, social network, social network analysis, support vector machines, systems, technology, text classification, tourism, trust, twitter, visual analytics, visualization, words.
  • Cluster 2 Product Design: advertisement, advertising, alcohol, allocation, avoidance, behavior, bias, body dissatisfaction, brand recall, brands, commercials, communication, consumption, drivers, experience, exposure, eye, eye fixation, eye movement, eye tracking, health, health warnings, interactivity, labels, media, messages, nonsmokers, online, patterns, perceptions, perspective, pictorial, pictures, products, recall, road safety, smokers, television, smoking, text, tobacco, trends, tv, united states, video, visual attention, warning labels, working memory.
  • Cluster 3 Design Techniques: advertisement, algorithm, attitudes, augmented reality, color, computer vision, customer satisfaction, design, digital image processing, food, gender, grading, hidden Markov model, image processing, image segmentation, integration, knowledge, machine, machine vision, methodology, model, neural network, objects, optimization, orange, prediction, purchase intention, quality, regression, segmentation, sex differences, sorting, support vector machines, surface area, system, user experience, vision, website.
  • Cluster 4 Advertising and Message Impact: ads, animation, attention, attitude, capacity, capture, children, cognitive load, context, contextual advertising, distraction, features, human-computer interaction, information, internet, internet use, involvement, looking, mechanisms, motion, movement, older drivers, online advertising, people, performance, persuasion, saliency, search, selective attention, strategies, surveillance, tracking, visual attention, visual behavior, visual saliency, visual search, web design, websites, world wide web.
  • Cluster 5 Advertising and Neuroscience: advertising effectiveness, affective computing, arousal, biometrics, brain, consumer, cortex, cues, destination, digital signage, EEG, emotion recognition, face, familiarity, feature extraction, galvanic skin response, gaze, gender classification, images, interferences, memory, object recognition, perception, preference, recognition, representation, responses, scale, scenes, selection, stimuli, television commercials, valence, warnings, young.
  • Cluster 6 Social Network Analysis (SNA): approximation, artificial intelligence, convolutional neural networks, corpus, cross domain, customer reviews, data mining, deep learning, e-commerce, emotion analysis, feature selection, image recognition, information extraction, lexicon based, machine learning, marketing, natural language processing, networks, neural networks, NLP, ontology, opinion mining, product review, security, semantic web, sentiment analysis, sentiment classification, text analysis, text categorization, topic modelling, tweets, web, word embedding.
  • Cluster 7 Consumer behavior: analytics, brand image, communities, community detection, congruity, consumer reviews, dynamics, experience, field, helpfulness, hospitality impact, knowledge discovery, lexicon, management, moderating role, news, online products review, online reputation management, online reviews, persuasion knowledge, product, reputation, saccades, sales, semantics, sentiments, social media marketing, support, text mining, user-generated content, word of mouth.
  • Cluster 8 Brand Analysis and Retail: brand, brand attention, brand choice, branding, choice, consumer behavior, consumer choice, consumer neuroscience, decision making, display, eye tracking, eye movement, facial expression, fixations, gaze bias, implicit memory, in-store decision making, mere exposure, neuromarketing, nutrition information, print advertisement, promotion, selective visual attention, time, time-pressure, willingness to pay.
  • Cluster 9 Social Networks and Spam Detection: crowdsourcing, location, retailing, social networks, spam detection, web 2.0, web mining.
  • Cluster 10 Consumer Relationship Management: consumer, customer engagement, Hadoop, CRM, social media.

2.11. Top 25 Times-Cited Works in Opinion Mining and Sentiment Analysis in Marketing Communication

The distribution of the most cited articles by year in OMSAMC is shown in Table 5. The first 25 studies are done according to their year publication, author, study title, total number of citations and ranking. There are 19 studies that have been cited at least 100 times.
The study with the most citations (565) of OMSAMC is “In the Eye of the Beholder: A Survey of Models for Eyes and Gaze”, published in 2010, and reviews the current progress in and state-of-the-art of video-based eye detection and tracking in order to identify promising techniques as well as issues to be further addressed. The study presents a detailed review of recent eye models and techniques for eye detection and tracking and survey methods for gaze estimation, comparing them based on their geometric properties and reported accuracies. The ratio of number of citations per year is approximately 56.9 citations.
“Attention capture and transfer in advertising: Brand, pictorial, and text-size effects” published in 2004, follows, and because of the paper studies how the three key ad elements (brand, pictorial and text) each have unique superiority effects on attention to advertisements, which are on par with many commonly held ideas in marketing practice—the main conclusion of an analysis of 1363 print advertisements tested with infrared eye-tracking methodology on more than 3600 consumers. The pictorial is superior in capturing attention, independent of its size. The authors discuss how their findings can be used to render more effective decisions in advertising. This study has been cited 304 times and has a ratio equal to 19 citations per year.
Within the Top 3 is “Does In-Store Marketing Work? Effects of the Number and Position of Shelf Facings on Brand Attention and Evaluation at the Point of Purchase”, published in 2009, which, like other studies within the table, covers the topic of interplay between in-store and out-of-store factors on consumer attention to and evaluation of brands displayed on supermarket shelves. The results underscore the importance of combining eye-tracking and purchase data to obtain a full picture of the effects of in-store and out-of-store marketing at the point of purchase. This study has been cited 249 times and has a ratio equal to 22.64 citations per year.
The following studies cover other issues such as text mining for consumer brand sentiments, design for ranking systems, user generated content and advertising or advertising and memory.

3. Discussion

Sentiment analysis and opinion mining in marketing communications (OMSAMC) is a promising and growing research field. OMSAMC has been acquiring a crucial role in both research and commercial applications because of their probable applicability to numerous diverse fields, such as the identification of brand awareness, reputation and popularity at a specific moment or over time, the tracking of consumer reception of new products or features, the pinpoint targeting of an audience or the evaluation performance success of a marketing campaign.
OMSAMC has experienced an exponential growth in the number of investigations (794) in the recent years, with a sum of citations of 9557 and with an average of 11.31 citations per paper. The H-index reveals a result of 49 (49 studies that have received at least 49 citations). To explain this development there are two main topics that are illustrious: the increase of researchers worldwide (United Nations 2015) and the development of information technology and the Internet (Jasanoff and Pinch 2019) that permits one to rapidly acquire a greater volume of information connected to OMSAMC and all global issues.
The study shows which are the most prolific authors in the field of OMSAMC in terms of scientific collaboration: Pieters, R. (6 documents, 775 citations and total link strength of 6), Wedel, M. (6 documents, 775 citations and total link strength of 6) and Cambria, E. (8 documents, 306 citations and total link strength of 4).
When analyzing the citation network, it was shown that although there are two distinct clusters, there is no real strong cluster structure within that citation network except for a group of more recent publications. Most of the group authors belongs to IEEE with a sum of 140 corporate authors.
The research study has shown that in terms of OMSAMC international co-authorship productivity the first place is for USA (211 documents and 4939 citations), followed by The Netherlands (36 documents and 1623 citations) and Italy (50 documents and 824 citations).
It is paradoxical because if we study international scientific collaboration in all areas of knowledge, we observe that the United States is one of the most productive countries in terms of quality publications (Q1 journals), but it is one of the least productive in terms of international collaborations, since its tendency continues to be towards national collaborations. It is also interesting to talk about countries like the United Kingdom, Spain, Italy, France, Holland, Finland or Israel, with a lower volume of publications in Q1 journals, which are the countries that make more international collaborations.
The study of international collaboration in organizations has shown that the University of Tilburg (The Netherlands), followed by the University of Michigan (USA) and the University of Pennsylvania (USA), are the three institutions that carry out research in OMSAMC that have had more documents and citations.
The funding agencies that have funded more studies in OMSAMC have been the National Natural Science Foundation of China, followed by the National Institute of Health of NIH-USA and the United States Department of Health Human Services. If we compare the funding agencies that have invested in research in OMSAMC with the funding agencies that have invested in research in all industries and scientific areas we see that the United States is the country that has produced the most documents that are located in Q1 journals and with the highest citation impact while China has produced many papers located in Q1 but has not had the same influence in terms of citation impact.
Results prove that the three most representative categories of OMSAMC works in Web of Science are Computer Science (450 registers and 53.254% of 845), Engineering (235 registers and 27.811% of 845) and Business Economics (158 registers and 18.698% of 845), and the most cited journals in OMSAMC has a clear focus on marketing since it mostly cites marketing journals. We have the Journal of Consumer Research (1st ranked with a sum of 521 citations), Journal of Marketing Research (2nd ranked with a sum of 371 citations) and Journal of Marketing (3rd ranked with a sum of 316 citations).
The results of the keyword analysis determine different clusters in which we find that the major areas of expertise in OMSAMC are opinion mining and sentiment analysis in computer science and neuroscience research areas.
The most used computational intelligence techniques to analyze sentiment and opinion in marketing are k-means algorithms, Bayesian networks, clustering techniques, deep neural networks, convolutional neural networks, support vector machines, hidden Markov models as well as natural language processing and ontology developments. From the neuroscience field, the most used techniques are eye tracking, EEG and galvanic skin response. On the one hand, there is a deep interest in the study and monitoring of brands, corporate reputation as well as the design of visual content and advertising message. Several studies reveal that there is new research in areas of consumer experience such as the impact and effect of alcohol and tobacco on buyers. On the other hand, the studies reflect that the most studied and analyzed social networks in OMSAMC research have been Instagram, Facebook and Twitter.
Finally, the research demonstrates that the studies that have had the greatest repercussion on OMSAMC in terms of times cited and impact citation have been “In the Eye of the Beholder: A Survey of Models for Eyes and Gaze “(565), which reviews the current progress in and the state-of-the-art of video-based eye detection and tracking in order to identify promising techniques as well as issues to be further addressed. “Attention capture and transfer in advertising: Brand, pictorial, and text-size effects” (304) follows, and this paper studies how the three key ad elements (brand, pictorial, and text) each have unique superiority effects on attention to advertisements, which are on par with many commonly held ideas in marketing practice. And towards the end, “Does In-Store Marketing Work?” (249), which covers the topic of interplay between in-store and out-of-store factors on consumer attention to and evaluation of brands displayed on supermarket shelves.
In future lines of research, it would be interesting to continue deepening in the OMSAMC cluster analysis, the dynamization of synergies in OMSAMC scientific collaboration networks, the increase of the research in OMSAMC by alternative metrics, the study of opinion mining and sentiment analysis in brand monitoring, political management, or sectorial analysis, as well as the study of OMSAMC distribution resources and industrial collaborations by countries and organizations.

4. Materials and Methods

We gathered research publications indexed in Web of Science (WoS) on OMSAMC for a significantly large timespan of 20 years (1998–2018), which almost covers the whole period of beginning and development of OMSAMC research. We downloaded data for publications (article, book chapter, proceeding or review) on OMSAMC written in English. Table 6 illustrates the query, the selected inclusion and exclusion criteria used, and the indexes, timespan and date of the data downloaded. We obtained a total of 845 papers as a result of the query. Keywords and terms associated with opinion mining, sentiment analysis and emotion understanding were utilized in the subject search in blend with derived terms of advertising/marketing.
The methodology followed the science mapping analysis approach (Chen 2017), a generic process of domain analysis and scientometric visualization (Egghe 1994). The scope of a scientific mapping study can be a research field, a scientific discipline or a thematic area related to specific investigation issues (Katz and Hicks 1997; Moya-Anegón et al. 2013). The study presents several components, a selection of highlighted scientific works, a set of scientometric and visual mapping analytical tools, some indicators and metrics that can highlight potentially significant trends and patterns, and theories of scientific change that can lead the interpretation and exploration of visualized dynamic patterns and intellectual structures (Ahlgren et al. 2013; Beaver 2001; De las Heras-Pedrosa et al. 2018; Glänzel 2001).
All the publications were assessed in terms of following aspects: distribution of languages and publication year, distribution of countries, co-authorship relations among countries, distribution of journals and subject categories, distribution of author keywords, distribution analysis of authors and institutions, authorship pattern analysis and co-authorship relations among authors. All analyses and data visualizations referring to the document type, language, journal, country, institutes and author were performed using:
  • VOSviewer, a software tool for constructing and visualizing bibliometric networks (including individual publications, researchers, journals); being those constructed based on co-authorship relations, co-citation, bibliographic coupling, citation and co-occurrence networks of important terms extracted from a body of scientific literature (Van Eck and Waltman 2010).
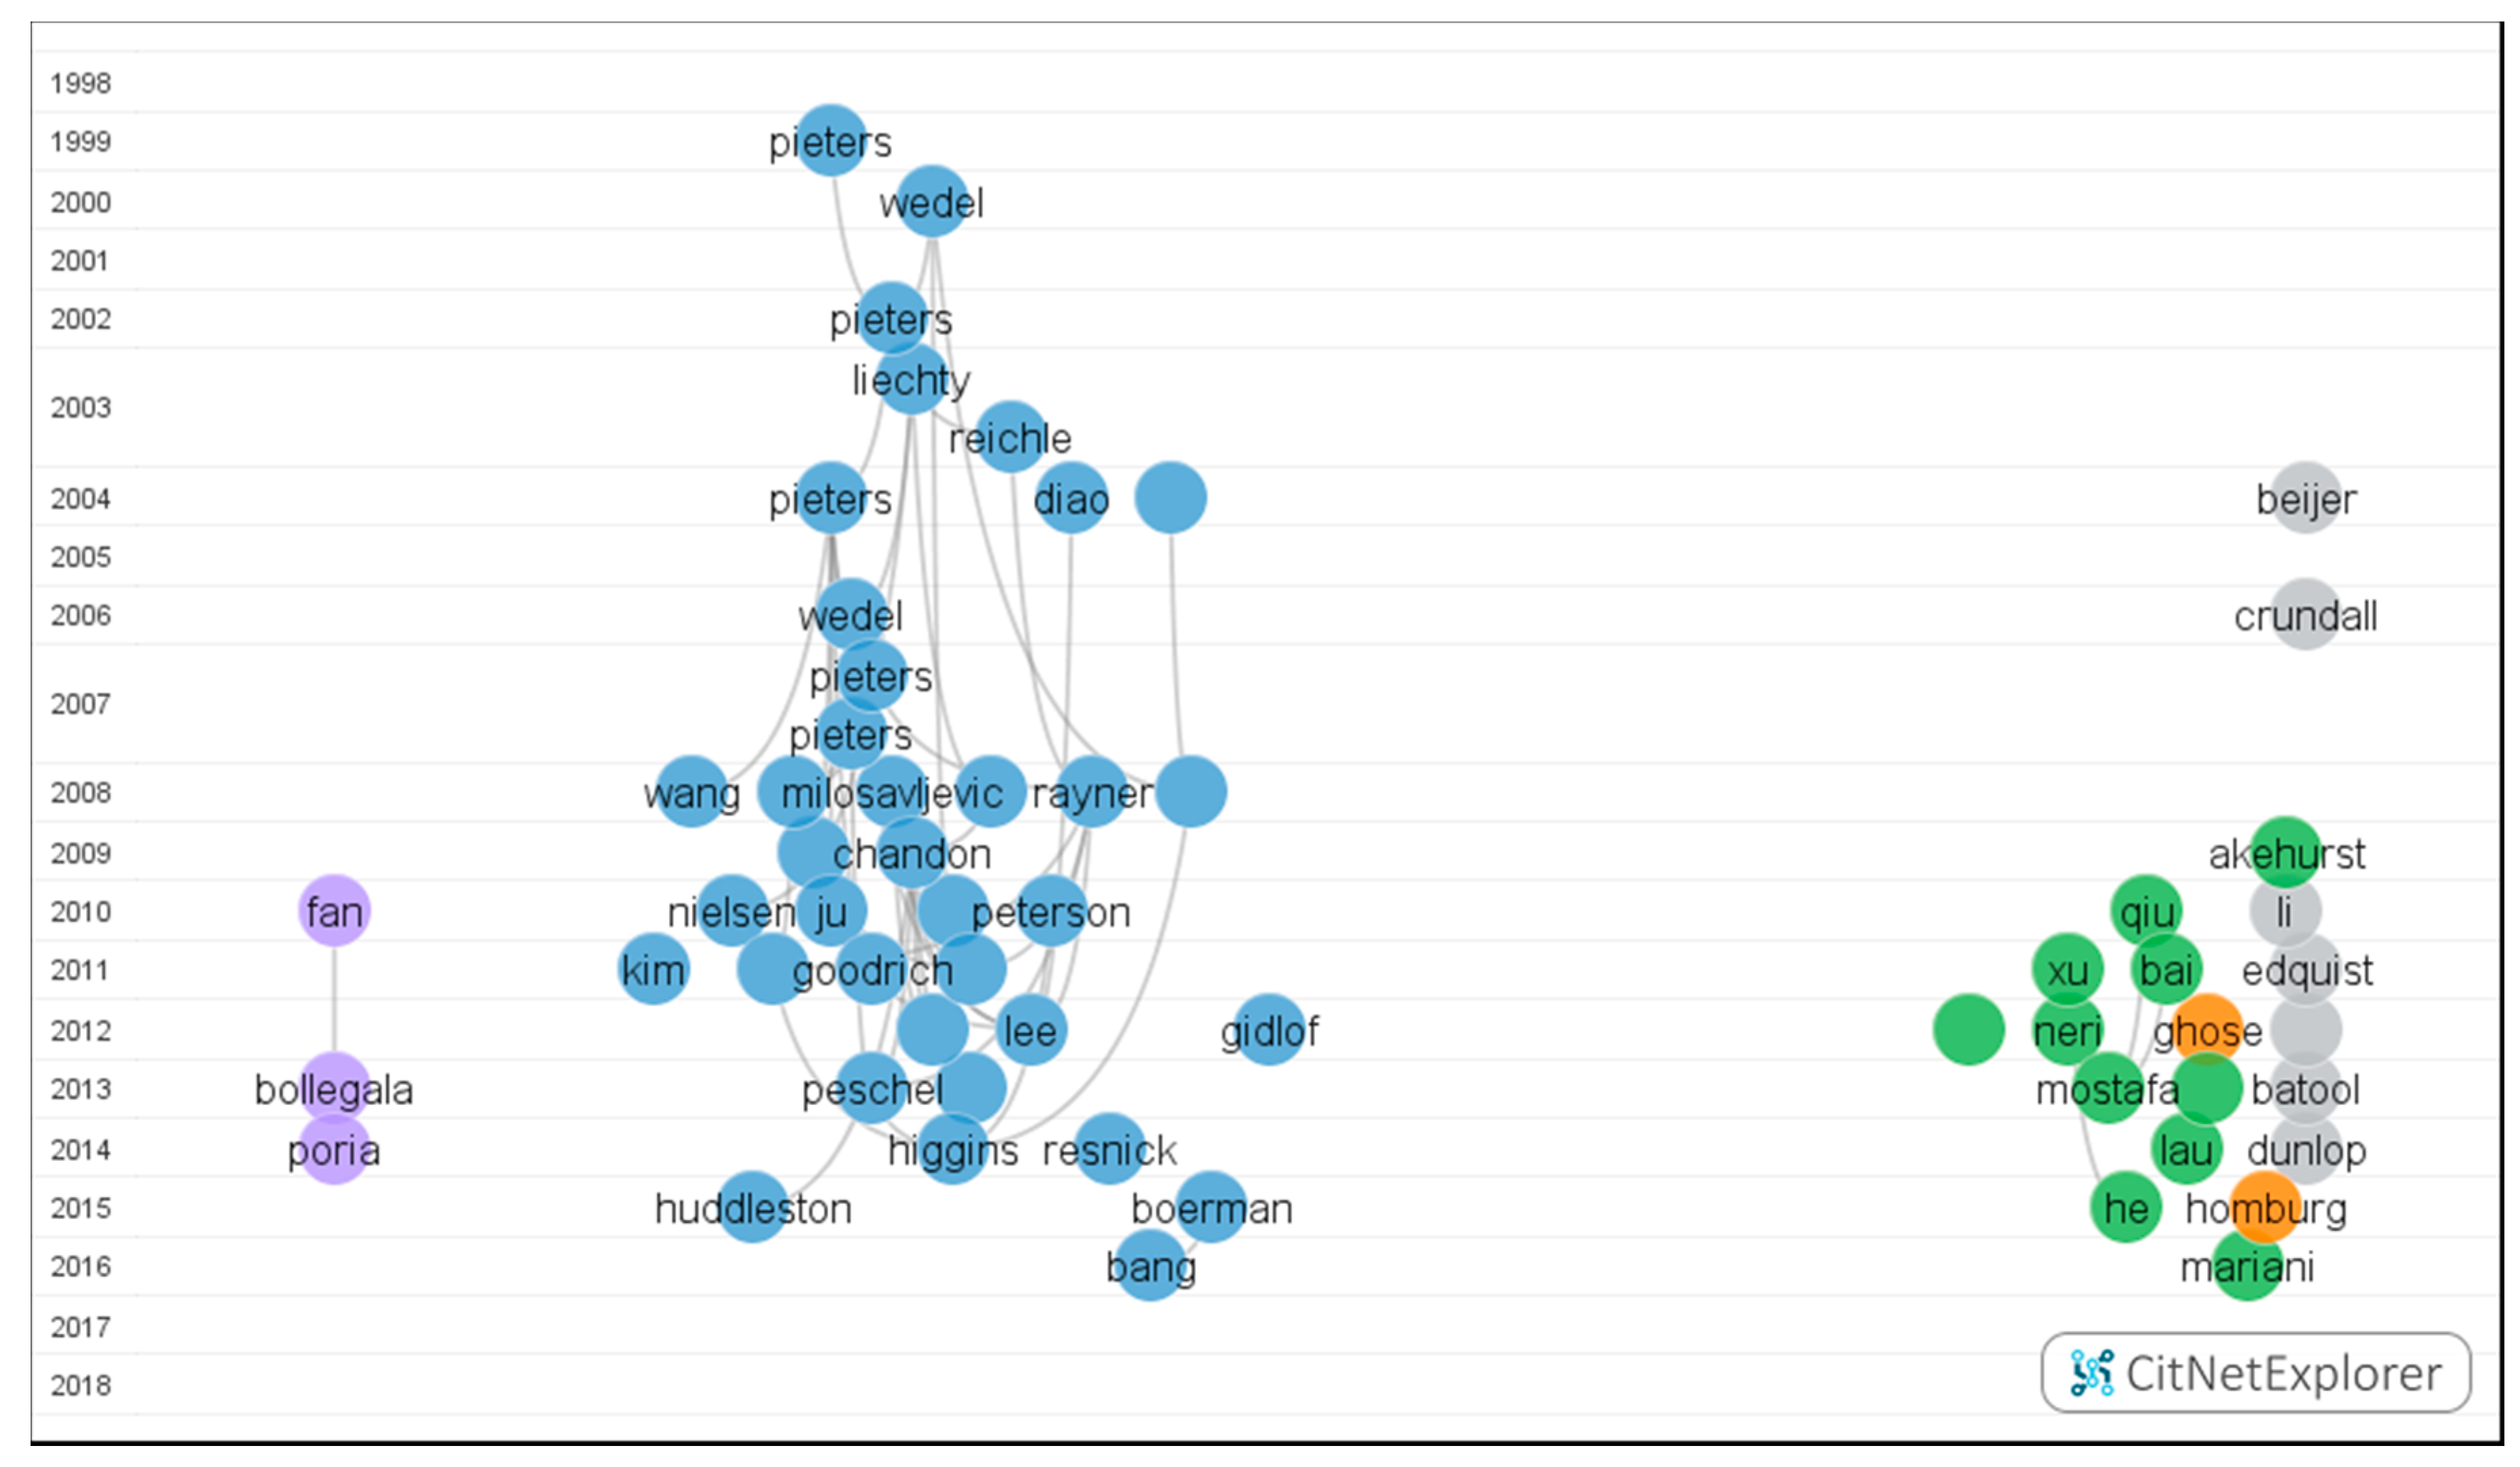
  • CitNetExplorer, a software tool for visualizing and analyzing citation networks of scientific publications by allowing us to identify clusters of closely related publications (Van Eck and Waltman 2014).
  • InCites|Clarivate Analytics is a bibliometric analysis tool that gathers all the scientific production of an institution included in the Web of Science from 1981 to the present. The tool allows to analyze the productivity of an institution, compare the performance of researchers with other scientists in the world as well as determine emerging trends in research.

Author Contributions

Conceptualization, P.S.-N.; Data curation, P.S.-N.; Formal analysis, P.S.-N.; Funding acquisition, C.d.l.H.-P. and J.I.P.; Investigation, P.S.-N.; Methodology, P.S.-N.; Project administration, C.d.l.H.-P. and J.I.P.; Resources, C.d.l.H.-P. and J.I.P.; Software, C.d.l.H.-P. and J.I.P.; Supervision, C.d.l.H.-P. and J.I.P.; Validation, C.d.l.H.-P. and J.I.P.; Visualization, P.S.-N.; Writing—original draft, P.S.-N.; Writing—review & editing, C.d.l.H.-P. and J.I.P. All authors have read and agreed to the published version of the manuscript.

Funding

The research was funded by Programa Operativo FEDER Andalucía 2014-2020, grant number “La reputación de las organizaciones en una sociedad digital. Elaboración de una Plataforma Inteligente para la Localización, Identificación y Clasificación de Influenciadores en los Medios Sociales Digitales (UMA18-FEDERJA-148)” and The APC was funded by the same research grant.

Conflicts of Interest

The authors declare no conflict of interest. The funders had no role in the design of the study; in the collection, analyses, or interpretation of data; in the writing of the manuscript, or in the decision to publish the results.

References

  1. Ahlgren, Per, Olle Persson, and Robert Tijssen. 2013. Geographical Distance in Bibliometric Relations within Epistemic Communities. Scientometrics 95: 771–84. [Google Scholar] [CrossRef]
  2. Álvarez-Bornstein, Belén, Fernanda Morillo, and María Bordons. 2017. Funding Acknowledgments in the Web of Science: Completeness and Accuracy of Collected Data. Scientometrics 112: 1793–812. [Google Scholar] [CrossRef]
  3. Baraybar-Fernández, Antonio, Miguel Baños-González, Óscar Barquero-Pérez, Rebeca Goya-Esteban, and Alexia De-la-Morena-Gómez. 2017. Evaluation of Emotional Responses to Television Advertising through Neuromarketing. Comunicar 25: 19–28. [Google Scholar] [CrossRef]
  4. Baron, Andrew Scott, Gerald Zaltman, and Jerry Olson. 2017. Barriers to Advancing the Science and Practice of Marketing. Journal of Marketing Management 33: 893–908. [Google Scholar] [CrossRef]
  5. Beaver, Donald De B. 2001. Reflections on Scientific Collaboration (and Its Study): Past, Present, and Future. Scientometrics 52: 365–77. [Google Scholar] [CrossRef]
  6. Bericat, Eduardo. 2016. The Sociology of Emotions: Four Decades of Progress. Current Sociology 64: 491–513. [Google Scholar] [CrossRef]
  7. Chen, Chaomei. 2017. Science Mapping: A Systematic Review of the Literature. Journal of Data and Information Science 2: 1–40. [Google Scholar] [CrossRef] [Green Version]
  8. Van Eck, Nees Jan, and Ludo Waltman. 2009. How to Normalize Cooccurrence Data? An Analysis of Some Well-Known Similarity Measures. Journal of the American Society for Information Science and Technology 60: 1635–51. [Google Scholar] [CrossRef] [Green Version]
  9. Van Eck, Nees Jan, and Ludo Waltman. 2010. Software Survey: VOSviewer, a Computer Program for Bibliometric Mapping. Scientometrics 84: 523–38. [Google Scholar] [CrossRef] [Green Version]
  10. Van Eck, Nees Jan, and Ludo Waltman. 2014. CitNetExplorer: A New Software Tool for Analyzing and Visualizing Citation Networks. Journal of Informetrics 8: 802–23. [Google Scholar] [CrossRef] [Green Version]
  11. Egghe, L. 1994. Little Science, Big Science … and Beyond. Scientometrics 30: 389–92. [Google Scholar] [CrossRef]
  12. Fonseca, Bruna de Paula Fonseca e, Ricardo Barros Sampaio, Marcus Vinicius de Araújo Fonseca, and Fabio Zicker. 2016. Co-Authorship Network Analysis in Health Research: Method and Potential Use. Health Research Policy and Systems 14: 34. [Google Scholar] [CrossRef] [PubMed] [Green Version]
  13. Glänzel, Wolfgang. 2001. National Characteristics in International Scientific Co-Authorship Relations. Scientometrics 51: 69–115. [Google Scholar] [CrossRef]
  14. Jasanoff, Sheila, and Trevor Pinch. 2019. Springer Handbook of Science and Technology Indicators. Edited by Wolfgang Glänzel, Henk F. Moed, Ulrich Schmoch and Mike Thelwall. Springer Handbooks. Cham: Springer International Publishing. [Google Scholar] [CrossRef]
  15. Kang, Daekook, and Yongtae Park. 2014. Review-Based Measurement of Customer Satisfaction in Mobile Service: Sentiment Analysis and VIKOR Approach. Expert Systems with Applications 41: 1041–50. [Google Scholar] [CrossRef]
  16. Katz, J. Sylvan, and Diana Hicks. 1997. How Much Is a Collaboration Worth? A Calibrated Bibliometric Model. Scientometrics 40: 541–54. [Google Scholar] [CrossRef]
  17. Kennedy, Helen. 2012. Perspectives on Sentiment Analysis. Journal of Broadcasting & Electronic Media 56: 435–50. [Google Scholar] [CrossRef]
  18. De las Heras-Pedrosa, Carlos, Telva Martel-Casado, and Carmen Jambrino-Maldonado. 2018. Análisis de Las Redes Académicas y Tendencias Científicas de La Comunicación En Las Universidades Españolas. Prisma Social 22: 229–46. [Google Scholar] [CrossRef]
  19. Liu, Wenlong, and Rongrong Ji. 2018. Examining the Role of Online Reviews in Chinese Online Group Buying Context: The Moderating Effect of Promotional Marketing. Social Sciences 7: 141. [Google Scholar] [CrossRef] [Green Version]
  20. Luukkonen, Terttu, Olle Persson, and Gunnar Sivertsen. 1992. Understanding Patterns of International Scientific Collaboration. Science, Technology, & Human Values 17: 101–26. [Google Scholar] [CrossRef] [Green Version]
  21. Mäntylä, Mika V., Daniel Graziotin, and Miikka Kuutila. 2018. The Evolution of Sentiment Analysis—A Review of Research Topics, Venues, and Top Cited Papers. Computer Science Review 27: 16–32. [Google Scholar] [CrossRef] [Green Version]
  22. Martínez-López, Francisco J., José M. Merigó, Leslier Valenzuela-Fernández, and Carolina Nicolás. 2018. Fifty Years of the European Journal of Marketing: A Bibliometric Analysis. European Journal of Marketing 52: 439–68. [Google Scholar] [CrossRef]
  23. Mostafa, Mohamed M. 2013. More than Words: Social Networks’ Text Mining for Consumer Brand Sentiments. Expert Systems with Applications 40: 4241–51. [Google Scholar] [CrossRef]
  24. Moya-Anegón, Félix, Vicente P. Guerrero-Bote, Lutz Bornmann, and Henk F. Moed. 2013. The Research Guarantors of Scientific Papers and the Output Counting: A Promising New Approach. Scientometrics 97: 421–34. [Google Scholar] [CrossRef] [Green Version]
  25. Newman, Mark E. J. 2000. The Structure of Scientific Collaboration Networks. Proc. Natl. Acad. Sci. USA 98: 404–9. [Google Scholar] [CrossRef]
  26. Pang, Bo, and Lillian Lee. 2008. Opinion Mining and Sentiment Analysis. Foundations and Trends® in Information Retrieval 2: 1–135. [Google Scholar] [CrossRef] [Green Version]
  27. Peláez, J. I., E. A. Martínez, and L. G. Vargas. 2019a. Products and Services Valuation through Unsolicited Information from Social Media. Soft Computing 3. [Google Scholar] [CrossRef]
  28. Peláez, José I., Eustaquio A. Martínez, and Luís G. Vargas. 2019b. Decision Making in Social Media with Consistent Data. Knowledge-Based Systems 172: 33–41. [Google Scholar] [CrossRef]
  29. Peláez, Jose Ignacio, Francisco E Cabrera, and L. G. Vargas. 2018. Estimating the Importance of Consumer Purchasing Criteria in Digital Ecosystems. Knowledge-Based Systems 162: 252–64. [Google Scholar] [CrossRef]
  30. Piryani, R., D. Madhavi, and V.K. Singh. 2017. Analytical Mapping of Opinion Mining and Sentiment Analysis Research during 2000–2015. Information Processing & Management 53: 122–50. [Google Scholar] [CrossRef]
  31. Prabowo, Rudy, and Mike Thelwall. 2009. Sentiment Analysis: A Combined Approach. Journal of Informetrics 3: 143–57. [Google Scholar] [CrossRef]
  32. Saaty, Thomas L, and Luis G Vargas. 2012. Models, Methods, Concepts & Applications of the Analytic Hierarchy Process. International Series in Operations Research & Management Science. Boston: Springer US, vol. 175. [Google Scholar] [CrossRef]
  33. Sebastian, Vlăsceanu. 2014. New Directions in Understanding the Decision-Making Process: Neuroeconomics and Neuromarketing. Procedia Social and Behavioral Sciences 127: 758–62. [Google Scholar] [CrossRef] [Green Version]
  34. Thelwall, Mike, Stefanie Haustein, and Vincent Larivie. 2013. Do Altmetrics Work? Twitter and Ten Other Social Web Services. PLoS ONE 8: e64841. [Google Scholar] [CrossRef] [PubMed]
  35. United Nations. 2015. UNESCO Science Report: Towards 2030. Available online: https://en.unesco.org/unescosciencereport (accessed on 28 February 2020).
  36. Wereda, Wioletta, and Jacek Woźniak. 2019. Building Relationships with Customer 4.0 in the Era of Marketing 4.0: The Case Study of Innovative Enterprises in Poland. Social Sciences 8: 177. [Google Scholar] [CrossRef] [Green Version]
Figure 1. Publication years and record count.
Socsci 09 00023 g001
Figure 2. Citations by years and record count.
Socsci 09 00023 g002
Figure 3. Citation network (1998–2018).
Socsci 09 00023 g003
Figure 4. Group Authors and Record Count (669 records (79.172%) do not contain data in the field being analyzed).
Socsci 09 00023 g004
Figure 5. (a) Top 25 Co-authorship analysis (countries). The relatedness of items is determined based on their number of co-authored documents. Minimum number of documents of a country (5) and minimum number of citations of a country (5). (b) InCites Top 25 Locations and Record Count.
Socsci 09 00023 g005aSocsci 09 00023 g005b
Figure 6. (a) Top 25 OMSAMC Funding Agencies and Record Count. (b) InCites Top 25 Funding Agencies and Record Count.
Socsci 09 00023 g006aSocsci 09 00023 g006b
Figure 7. Research areas and record count.
Socsci 09 00023 g007
Figure 8. Co-Occurrence analysis. The relatedness of items is determined based on the number of documents in which they occur together (all keywords). Minimum number of occurrences of a keyword was 3. Of the 3094 keywords, 332 met the threshold.
Socsci 09 00023 g008
Table 1. Citation report.
Citation Report
Total publications845
Sum of times cited9557
Average citations per item 11.31
H-index49
Table 2. Top 25 Co-authorship analysis (authors). The relatedness of items is determined based on their number of co-authored documents. Minimum number of documents of an author (3) and minimum number of citations of an author (1). Of the 2505 authors, 38 met the thresholds.
RankingAuthorDocumentsCitationsTotal Link Strength
1.Pieters, R67756
2.Wedel, M67756
3.Cambria, Erik83064
4.Wedel, Michel82926
5.Pieters, Rik62886
6.Poria, Soujanya32053
7.Wojdynski, Bartosz W.41233
8.Bang, Hyejin3353
9.Bodendorf, Freimut4313
10.Kaiser, Carolin3313
11.Holmberg, Nils3183
12.Sandberg, Helena3183
13.Recupero, Diego Reforgiato3102
14.Dragoni, Mauro471
15.Farkas, Richard353
16.Hangya, Viktor353
17.Oliveira, Eugenio359
18.Reis, Luis Paulo359
19.Teixeira, Jorge359
20.Vinhas, Vasco359
21.Lu, Hanqing341
22.Xu, Changsheng341
23.Kincl, Tomas326
24.Novak, Michal426
25.Pribil, Jiri326
Table 3. Top 25 International Collaborations/Organizations and Record Count. Minimum number of documents of a country (5) and minimum number of citations of a country (5).
RankingOrganizationDocumentsCitationsTotal Link StrengthARWU 2019QS 2019
1.Tilburg University14108514501–600319
2.University of Michigan773982020
3.University of Pennsylvania546111719
4.The University of Maryland12372946126
5.Nanyang Technological University1030237312
6.City University of Hong Kong72862201–30055
7.Copenhagen Business School51930701–800-
8.University of Nottingham71580101–15082
9.University of California San Diego715151841
10.The University of Georgia91506201–300431
11.Michigan State University61385101–150141
12.Pennsylvania State University612979895
13.The University of Arizona61004101–150246
14.Korea Advanced Institute of Science and Technology5851201–30040
15.University of Amsterdam5740101–15057
16.University of Florida858595180
17.University of Minnesota548541156
18.Microsoft Research Asia5421--
19.University of Pittsburgh639189136
20.The Australian National University63457624
21.Zhejiang University53417068
22.University of Malaya5221301–40087
23.National University of Singapore71936711
24.Chinese Academy of Sciences8182--
25.Politecnico di Milano5171201–300156
Table 4. The Top 25 Co-Citation analysis (sources). The relatedness of items is determined based on the number of times they are cited together. Minimum number of citations of a source (75). Of the 11,186 sources, 34 met the threshold.
RankingSourceCitationsTotal Link Strength
1.Journal of Consumer Research52110,340
2.Journal of Marketing Research3719258
3.Journal of Marketing3167353
4.Lecture Notes in Computer Science LNCS2961707
5.Journal of Advertising2795370
6.Journal of Advertising Research2766244
7.IEEE Transactions on Pattern Analysis and Machine Intelligence2491748
8.Expert Systems with Applications2466128
9.Marketing Science2397223
10.Decision Support Systems2135198
11.IEEE Conference on Computer Vision and Pattern Recognition1611015
12.Management Science1555277
13.Journal of Interactive Marketing1383716
14.Psychology & Marketing1383651
15.Psychological Bulletin1352116
16.Vision Research1251835
17.Journal of Personality and Social Psychology1212377
18.Computers in Human Behavior1202656
19.Journal of Business Research1144262
20.Journal of the Association for Information Science and Technology112880
21.International Journal of Research in Marketing1012990
22.Psychological Review1001739
23.Advances in Consumer Research922420
24.Journal of Experimental Psychology: Human Perception and Performance921731
25.Tourism Management921592
Table 5. The Top 25 Times-Cited Works analysis. The relatedness of items is determined based on the number of times they are cited (publications).
TitleAuthorsSourcePublication YearsCitationsAverage Citation/Year
1. In the Eye of the Beholder: A Survey of Models for Eyes and GazeHansen, Dan Witzner; Ji, QiangIEEE TRANSACTIONS ON PATTERN ANALYSIS AND MACHINE INTELLIGENCE201056556.5
2. Attention capture and transfer in advertising: Brand, pictorial, and text-size effectsPieters, R; Wedel, MJOURNAL OF MARKETING200430419
3. Does In-Store Marketing Work? Effects of the Number and Position of Shelf Facings on Brand Attention and Evaluation at the Point of PurchaseChandon, Pierre; Hutchinson, J. Wesley; Bradlow, Eric T.; Young, Scott H.JOURNAL OF MARKETING200924922.64
4. More than words: Social networks’ text mining for consumer brand sentimentsMostafa, Mohamed M.EXPERT SYSTEMS WITH APPLICATIONS201318826.86
5. Designing Ranking Systems for Hotels on Travel Search Engines by Mining User-Generated and Crowdsourced ContentGhose, Anindya; Ipeirotis, Panagiotis G.; Li, BeibeiMARKETING SCIENCE201217722.13
6. Eye fixations on advertisements and memory for brands: A model and findingsWedel, M; Pieters, RMARKETING SCIENCE20001738.65
7. User generated content: the use of blogs for tourism organisations and tourism consumersAkehurst, GarySERVICE BUSINESS200916815.27
8. Breaking through the clutter: Benefits of advertisement originality and familiarity for brand attention and memoryPieters, R; Warlop, L; Wedel, MMANAGEMENT SCIENCE20021437.94
9. Understanding Transit Scenes: A Survey on Human Behavior-Recognition AlgorithmsCandamo, Joshua; Shreve, Matthew; Goldgof, Dmitry B.; Sapper, Deborah B.; Kasturi, RangacharIEEE TRANSACTIONS ON INTELLIGENT TRANSPORTATION SYSTEMS201014014
10. Shape Analysis of Agricultural Products: A Review of Recent Research Advances and Potential Application to Computer VisionCosta, Corrado; Antonucci, Francesca; Pallottino, Federico; Aguzzi, Jacopo; Sun, Da-Wen; Menesatti, PaoloFOOD AND BIOPROCESS TECHNOLOGY201113915.44
11. Sentic patterns: Dependency-based rules for concept-level sentiment analysisPoria, Soujanya; Cambria, Erik; Winterstein, Gregoire; Huang, Guang-BinKNOWLEDGE-BASED SYSTEMS201413222
12. Using Twitter to Examine Smoking Behavior and Perceptions of Emerging Tobacco ProductsMyslin, Mark; Zhu, Shu-Hong; Chapman, Wendy; Conway, MikeJOURNAL OF MEDICAL INTERNET RESEARCH201312517.86
13. Branding the brain: A critical review and outlookPlassmann, Hilke; Ramsoy, Thomas Zoega; Milosavljevic, MilicaJOURNAL OF CONSUMER PSYCHOLOGY201212115.13
14. The impact of social and conventional media on firm equity value: A sentiment analysis approachYu, Yang; Duan, Wenjing; Cao, QingDECISION SUPPORT SYSTEMS201311816.86
15. Survey on mining subjective data on the webTsytsarau, Mikalai; Palpanas, ThemisDATA MINING AND KNOWLEDGE DISCOVERY201211814.75
16. A flexible model of consumer country-of-origin perceptions - A cross-cultural investigationKnight, GA; Calantone, RJINTERNATIONAL MARKETING REVIEW20001165.8
17. Affective News: The Automated Coding of Sentiment in Political TextsYoung, Lori; Soroka, StuartPOLITICAL COMMUNICATION201211314.13
18. Mining comparative opinions from customer reviews for Competitive IntelligenceXu, Kaiquan; Liao, Stephen Shaoyi; Li, Jiexun; Song, YuxiaDECISION SUPPORT SYSTEMS201111312.56
19. Visual attention to repeated print advertising: A test of scanpath theoryPieters, R; Rosbergen, E; Wedel, MJOURNAL OF MARKETING RESEARCH19991034.9
20. Building models for marketing decisions: Past, present and futureLeeflang, PSH; Wittink, DRINTERNATIONAL JOURNAL OF RESEARCH IN MARKETING2000924.6
21. Goal control of attention to advertising: The Yarbus implicationPieters, Rik; Wedel, MichelJOURNAL OF CONSUMER RESEARCH2007906.92
22. What Do You See When You’re Surfing? Using Eye Tracking to Predict Salient Regions of Web PagesBuscher, Georg; Cutrell, Edward; Morris, Meredith RingelCHI2009: PROCEEDINGS OF THE 27TH ANNUAL CHI CONFERENCE ON HUMAN FACTORS IN COMPUTING SYSTEMS, VOLS 1–42009898.09
23. Going Native: Effects of Disclosure Position and Language on the Recognition and Evaluation of Online Native AdvertisingWojdynski, Bartosz W.; Evans, Nathaniel J.JOURNAL OF ADVERTISING20168822
24. H-ATLAS: PACS imaging for the Science Demonstration PhaseIbar, Edo; Ivison, R. J.; Cava, A.; Rodighiero, G.; Buttiglione, S.; Temi, P.; Frayer, D.; Fritz, J.; Leeuw, L.; Baes, M.; Rigby, E.; Verma, A.; Serjeant, S.; Mueller, T.; Auld, R.; Dariush, A.; Dunne, L.; Eales, S.; Maddox, S.; Panuzzo, P.; Pascale, E.; Pohlen, M.; Smith, D.; de Zotti, G.; Vaccari, M.; Hopwood, R.; Cooray, A.; Burgarella, D.; Jarvis, M.MONTHLY NOTICES OF THE ROYAL ASTRONOMICAL SOCIETY2010878.7
25. Predicting consumer sentiments from online textBai, XueDECISION SUPPORT SYSTEMS2011859.44
Table 6. Details of dataset.
IndexesTimespanSearchResultsDate
Web of Science
Core Collection:
SCI-EXPANDED,
SSCI, A&HCI,
CPCI-S, CPCISSH,
BKCI-S,
BKCI-SSH, ESCI.
1998–2018((((((TS = (((“Sentiment Analysis”) OR (“Sentiment of Images”) OR (“Sentiment Classification”) OR (“Opinion Mining”) OR (“Opinion Classification”) OR (“Image Sentiment”) OR (“Image Emotion”) OR (“Image Processing”) OR (“Image Recognition”) OR (“Mining sentiment”) OR (“Visual Content”) OR (“Visual Attention”) OR (“Object Recognition”) OR (“Object Detection”) OR (“Image Classification”) OR (“Affect Analysis”) OR (“Affective Computing”)) AND (Advert* OR “Marketing”)))))))) AND LANGUAGES: (English) AND DOCUMENT TYPES: (Article OR Book Chapter OR Proceedings Paper OR Review)84503.12.2019

