Article

The Trade Impact of EU Tariff Margins: An Empirical Assessment

1
Department of Economics, University of Molise, 86100 Campobasso, Italy
2
Department of Economics, University of Roma Tre, 00145 Rome, Italy
*
Author to whom correspondence should be addressed.
Soc. Sci. 2019, 8(9), 261; https://doi.org/10.3390/socsci8090261
Submission received: 31 May 2019 / Revised: 3 September 2019 / Accepted: 9 September 2019 / Published: 12 September 2019
(This article belongs to the Special Issue The Analysis of EU Trade Policies)

Abstract

:
This article provides an assessment of how the EU trade policies affect EU imports. The main contribution is that we compute a theoretically consistent measure of the EU tariff margin and estimate the elasticities of substitution at the sectoral level, using a structural gravity model that includes domestic trade flows. Our analysis is related to the most recent gravity literature and the identification strategy is based on the existence of a sufficient variation of the tariffs applied by the EU to different markets of origin. We use cross-section data (more than 5000 tariff lines and 188 exporters, including the EU28 Member States, in the year 2017), to obtain structural gravity estimates of trade substitution elasticities. Since tariffs greatly differ by product, an in-depth analysis should take place at the tariff line. Moreover, we use the information provided by the Eurostat Comext database on the tariff regime of imports, so we distinguish the Most Favored Nation (MFN) from the preferential trade flows. The estimated elasticities can be used to calculate the counterfactual change in total EU imports that would follow either from the removal of trade preferences or from the removal of trade policies.

1. Introduction

The main goal of this paper is to assess the impact of EU trade policies on imports to the EU. We consider a sample of 188 countries, including intra-EU trade flows, and discuss the most relevant issues, from a methodological point of view, that are important for analyzing the trade-creating impacts of trade policies. The analysis is based on the gravity model, starting from the theoretical model (see Anderson 1979; Anderson and Van Wincoop 2003), and we compute an explicit measure of the bilateral tariff margin at a disaggregated level. We focus on EU trade for several reasons. It is the biggest player in the world trade even if tariffs are still significant in specific sectors, e.g., agriculture, though over time a large number of preferential trade agreements have been concluded between EU and many developing countries.
Our paper refers to recent studies using the gravity model that argue that regressions should be estimated with data that include also intra-national sales (Heid et al. 2017; Feenstra et al. 2018). Our paper also refers to the recent literature that use updated econometric methods to estimate the elasticity of substitution using disaggregated data (Baier and Bergstrand 2001; Caliendo and Parro 2015; Romalis 2007; Imbs and Méjean 2009; Corbo and Osbat 2013). This analysis contributes to the strand of the related literature in two ways. The first contribution is the estimation of the impact of tariff margins in a theoretically grounded gravity model that includes domestic trade flows. In particular, we measure the bilateral tariff margin as the advantage or disadvantage of each exporter with respect to other competitors, for disaggregated data producers (as defined by Low et al. 2009; Cipollina et al. 2017) and argue that the intra-national trade is indeed necessary to properly assess the trade policies impact. The second contribution of our analysis is to define an empirical strategy that considers both international and intra-national trade data, and this implies that the tariff margin computation takes into account the domestic competitors and the fact that intra-EU trade flows are duty-free. In particular, we argue that there is not such a thing as a non-discriminatory trade policy: Trade policies introduce additional costs but these costs only matter in relative terms, i.e., with respect to the costs paid by each exporter to reach the importing markets. The main reason for including both domestic and foreign goods is represented by the possibility to assess the effects of trade policies taking into account trade creation as well as trade diversion impact. Therefore, we attempt to assess both the liberalization and protectionist nature of EU trade policies by measuring the effects of multilateral, bilateral, and unilateral agreements on international trade relative to intra-EU trade.
The empirical strategy developed in this article is based on the variation of margins across 5388 tariff lines and 188 exporters (including the EU28 Member States) to the EU market in the year 2017. Working at a disaggregated level involves a very large number of observations that raises the problem of zeros in trade flows and leads to a computational problem. Therefore, we opt to take advantage of the cross-section dimension, rather than panel since trade policies are likely to vary across products and exporters. Specifically, using data cross-section we obtain structural gravity estimates of trade substitution elasticities taking into account all available information available regarding (1) the preference utilization, since we distinguish Most Favored Nation (MFN) and preferential trade flow; (2) domestic and international trade flows. Finally, the estimated elasticities are used to calculate the counterfactual change in total EU imports that would follow either from the removal of trade preferences or from the removal of trade policies. The article is structured as follows. Section 2 provides a brief literature review; Section 3 introduces the theoretical gravity model and discusses the empirical methodology; Section 4 includes data and descriptive analyses; Section 5 presents and discusses the results; finally, Section 6 concludes.

2. A Brief Literature Review

Since the early 1960s, the European Union (EU) is actively engaged in a wide range of negotiations to strengthen existing measures within the strategic partnership, especially with developing countries, in order to enhance their integration in the world trading system and to promote a process of economic development and industrialization. The EU’s trade policy is part of Strategic Plan 2016–2020 with the aim of boosting employment and creating a more sustainable economy (European Commission 2016).
Trade preferences are the common instrument of trade policy. They include reduction or, in many cases, elimination of tariff barriers on imports from beneficiary countries. Nowadays, most developing countries can export to the EU with preferential market access under various preferential schemes.
This paper is most closely related to the more recent literature testing the impact of EU preferential agreements on trade volume using highly disaggregated data (Cipollina et al. 2017; Scoppola et al. 2018). Even if the expectation of the positive impact of preferences on trade is by far and large confirmed, such impact is affected by the presence of complex rules that often accompany preferential schemes. The higher the preferential margin, the higher the probability should be that preference is used, but for various reasons not all imports of products that are nominally eligible for preferential treatment enter the granting country at the preferential rate. Costs related to fulfilling rules of origin requirements, and other formalities that can be specific to each shipment are often attached to using a preference, so that preferences may not be used unless volumes are important enough to result in substantial duty savings. Furthermore, the complexities of rules of origin are part and parcel of all preferential agreements. As a result, available preferences are not always fully utilized. Although preferences might be considered rather generous, other complex rules (including non-compliance with the relevant rule of origin) are an important obstacle for exporters of goods (De Melo and Nicita 2018). Since we do not know the utilization rates of different schemes, we used the available information on tariff regime (MFN or preferential flow) and applied tariff to each trade flow accounting that the importing country will apply the MFN tariff if the product fails to meet the country’s rules that determine the product’s country of origin.
With respect to the recent literature, our research attempts to examine the trade impacts of EU policies accounting for intra-national sales. Recent works (Heid et al. 2017; Feenstra et al. 2018) using the gravity model, argue that regressions should be estimated with data that include not only international trade but also intra-national sales. There are three tiers of aggregation in the CES framework (Feenstra et al. 2018): (i) The disaggregation is across goods in the upper-tier; (ii) across home and foreign products in the middle-tier; (iii) and across foreign sources in the lower-tier. Feenstra et al. (2018) call their middle-tier elasticity (across home and foreign products) the “macro” elasticity, while they call their lower-tier elasticity (across foreign source countries) the “micro” elasticity. Evaluating the difference between the elasticity of substitution between home and foreign goods and between varieties of foreign goods, requires two ingredients: A model that allows for such a nested CES structure and a data set that has both home and foreign supplies at exactly the same level of disaggregation. Feenstra et al. (2018) provide both ingredients. Cipollina et al. (2017) focus on elasticity among foreign suppliers. In this article, we estimate the macro elasticity across home and foreign products, and therefore the few results provided in the literature are not readily comparable with ours.

3. Structural Gravity Model

3.1. The Gravity Equation

Gravity models utilize the gravitational force concept as an analogy to explain the volume of trade (Tinbergen 1962). The ability to correctly approximate bilateral trade flows makes the gravity equation one of the most successful “empirical fact” in the international trade literature.
Following Anderson (1979) and Anderson and Van Wincoop (2003) theoretically grounded gravity model, we start from the well-known gravity equation:
i m i k = α i k M k ( P i k ) σ ( Π k ) ( 1 σ ) ,
where α i k is the consumer preference parameter, M k is the expenditure on import, Π k and P i k are, respectively, the product k import price index computed across all exporters i and the domestic price of imported good k from the country i, while σ represents the elasticity of substitution between varieties and it is greater than 1.
The domestic price is given by:
P i k = p i k c i k ( 1 + t i k ) ,
with p i k representing the fixed free-on-board (FOB) export price of a physical unit, c i k > 1 capturing the transport costs that differ by destination and product, and t i k that is the bilateral applied ad valorem tariff.
In the spirit of Cipollina et al. (2017), the assumption of the separation of tariffs from other trade cost components allows the computation of the price index Π k as a weighted average tariff factor ( 1 + T k ) applied to product k computed as a CES aggregator:
Π k = [ i α i k ( p i k c i k ( 1 + t i k ) ) ( 1 σ ) ] 1 1 σ = 1 + T k .
In our model, the Equation (3) is crucial because for each product it measures the overall incidence of the EU’s trade policies. Furthermore, being aggregated across all exporters, it also represents an explicit measure of the multilateral trade resistance.
Substituting Equation (1) becomes:
i m i k = α i k M k ( p i k ( 1 + t i k ) ) σ ( 1 + T k ) ( 1 σ ) ,
and defining the bilateral tariff margin ( b t m i k ) as the ratio between the reference tariff factor (1+ T k ) and the applied tariff factors faced by each exporter:
b t m i k = ( 1 + T k ) ( 1 + t i k ) ,
we can estimate the following gravity equation:
i m i k = α i k M k ( 1 + T k ) ( p i k β i γ k b t m i k ) σ .
The bilateral tariff margin depends both on the higher rates and on the share of exporters paying those rates, then incorporates the “multilateral nature” of trade policies. The main idea is that the bilateral tariff margin is not confined to the country-specific structure of tariffs but it depends on the whole structure of applied tariffs. Therefore the “reference tariff” used to compute it takes into account the competitive advantage, or disadvantage, that each exporter faces with respect to other competitors.
In this article, we compute the actual tariff margin in relative terms and on a bilateral basis taking into account the multilateral nature of trade policies. When the reference tariff is lower than the applied, the margin is between “0” and “1” and signals the existence of negative margins, depending on the disadvantage of the country with respect to other competing exporters.

3.2. Econometric Approach

Working at a disaggregated level, the presence of many zero trade flows create obvious problems in the log-linear form of the gravitational equation. These zeros may be the result of rounding errors, that are more likely to occur for small or distant countries and, therefore, the probability of rounding down will depend on the value of the covariates, leading to the inconsistency of the estimators. Many “zeros” may also be due to missing observations which are wrongly recorded as zero. This problem is more likely to occur when small countries are considered and, again, measurement error will depend on the covariates.
There has been a long debate concerning what is the best econometric approach in order to avoid the bias that would be implied by eliminating the observations with zero flows. Tobit models rely on rather restrictive assumptions that are not likely to hold since the censoring at zero is not a ‘simple’ consequence of the fact that trade cannot be negative: Zero flows, as a matter of fact, do not reflect unobservable trade values but they are the result of economic decision making based on the potential profitability of engaging in bilateral trade at all.
Zero trade flows could be the result of economic decisions based on the potential profitability of engaging in bilateral trade at all, so they should be treated properly in order to overcome a sample selection problem. Several authors consider the Heckman two-step estimator (Heckman 1979) as the best procedure (Helpman et al. 2008; Martin and Pham 2016). Nevertheless, the bilateral trade flows are collected from multiple countries and heteroskedasticity may be a challenge especially in the common practice of logarithmic transformation. Recent empirical analyses argue that because of the presence of heteroskedasticity, gravity type models should be estimated in multiplicative form and recommend maximum likelihood estimation techniques based on the Poisson specification of the model suggested by Silva and Tenreyro (2006). They showed that the estimation of the gravity model by the Pseudo Poisson Maximum Likelihood (PPML) specification are consistent in the presence of heteroskedasticity and are reasonably efficient, especially in large samples.
As recent empirical analyses (Fally 2015; Yotov et al. 2016) we estimate the gravity model in multiplicative form, using the PPML estimator, for the following reasons:
-
We could not accept the null hypothesis of homoskedasticity, and the PPML estimator is generally well behaved even when the conditional variance is far from being proportional to the conditional mean;
-
The fact that the dependent variable has a large proportion of zeros does not affect the performance of the estimator;
-
Estimation of gravity with PPML including exporter and product (HS6 digit), that enables to control for any other observable and unobservable characteristics that vary over exporters and sectors, respectively, is consistent with the ‘structural approach’ to gravity analyses.
Accordingly, we estimate the following regression
i m i , k = exp { σ l n ( b t m i k ) + γ E X P i + δ P R O D H S 6 } + ε i k .
Note that the fixed effects absorb all country-specific and time-invariant controls (such as GDP, distance, colonial status, and common language) usually included in gravity estimations. Since they are not of particular interest here, it is preferable to use the large set of fixed effects described above (as argued by Ornelas and Ritel 2018) that are also controls for all unobservable trade costs. We estimate regression (7) for 21 sectors defined according to the EU Sections of the Harmonized Commodity Description and Coding System (the full list of the commodity classification is available from the authors upon request, or for more detail see: https://trade.ec.europa.eu/tradehelp/eu-product-classification-system).
For each sector, we obtain an estimated coefficient of the elasticity of substitution, σ ^ , allowing elasticities to differ across HS sections. In a first step, we estimate our gravity Equation (7) using a relative bilateral tariff margin, computed taking the applied MFN duty as reference tariff. Once estimating each parameter σ ^ , we compute the CES tariff margins. Then, we iterate the process (in the spirit of Head and Mayer 2014; and Cipollina et al. 2017) to obtain a new set of elasticities with the CES margins, we stop until the estimated coefficient does not change at the second-decimal digit.
Finally, following Lai and Zhu (2004) we consider two possible scenarios computing the percentage change due to the hypothetical elimination of trade policies:
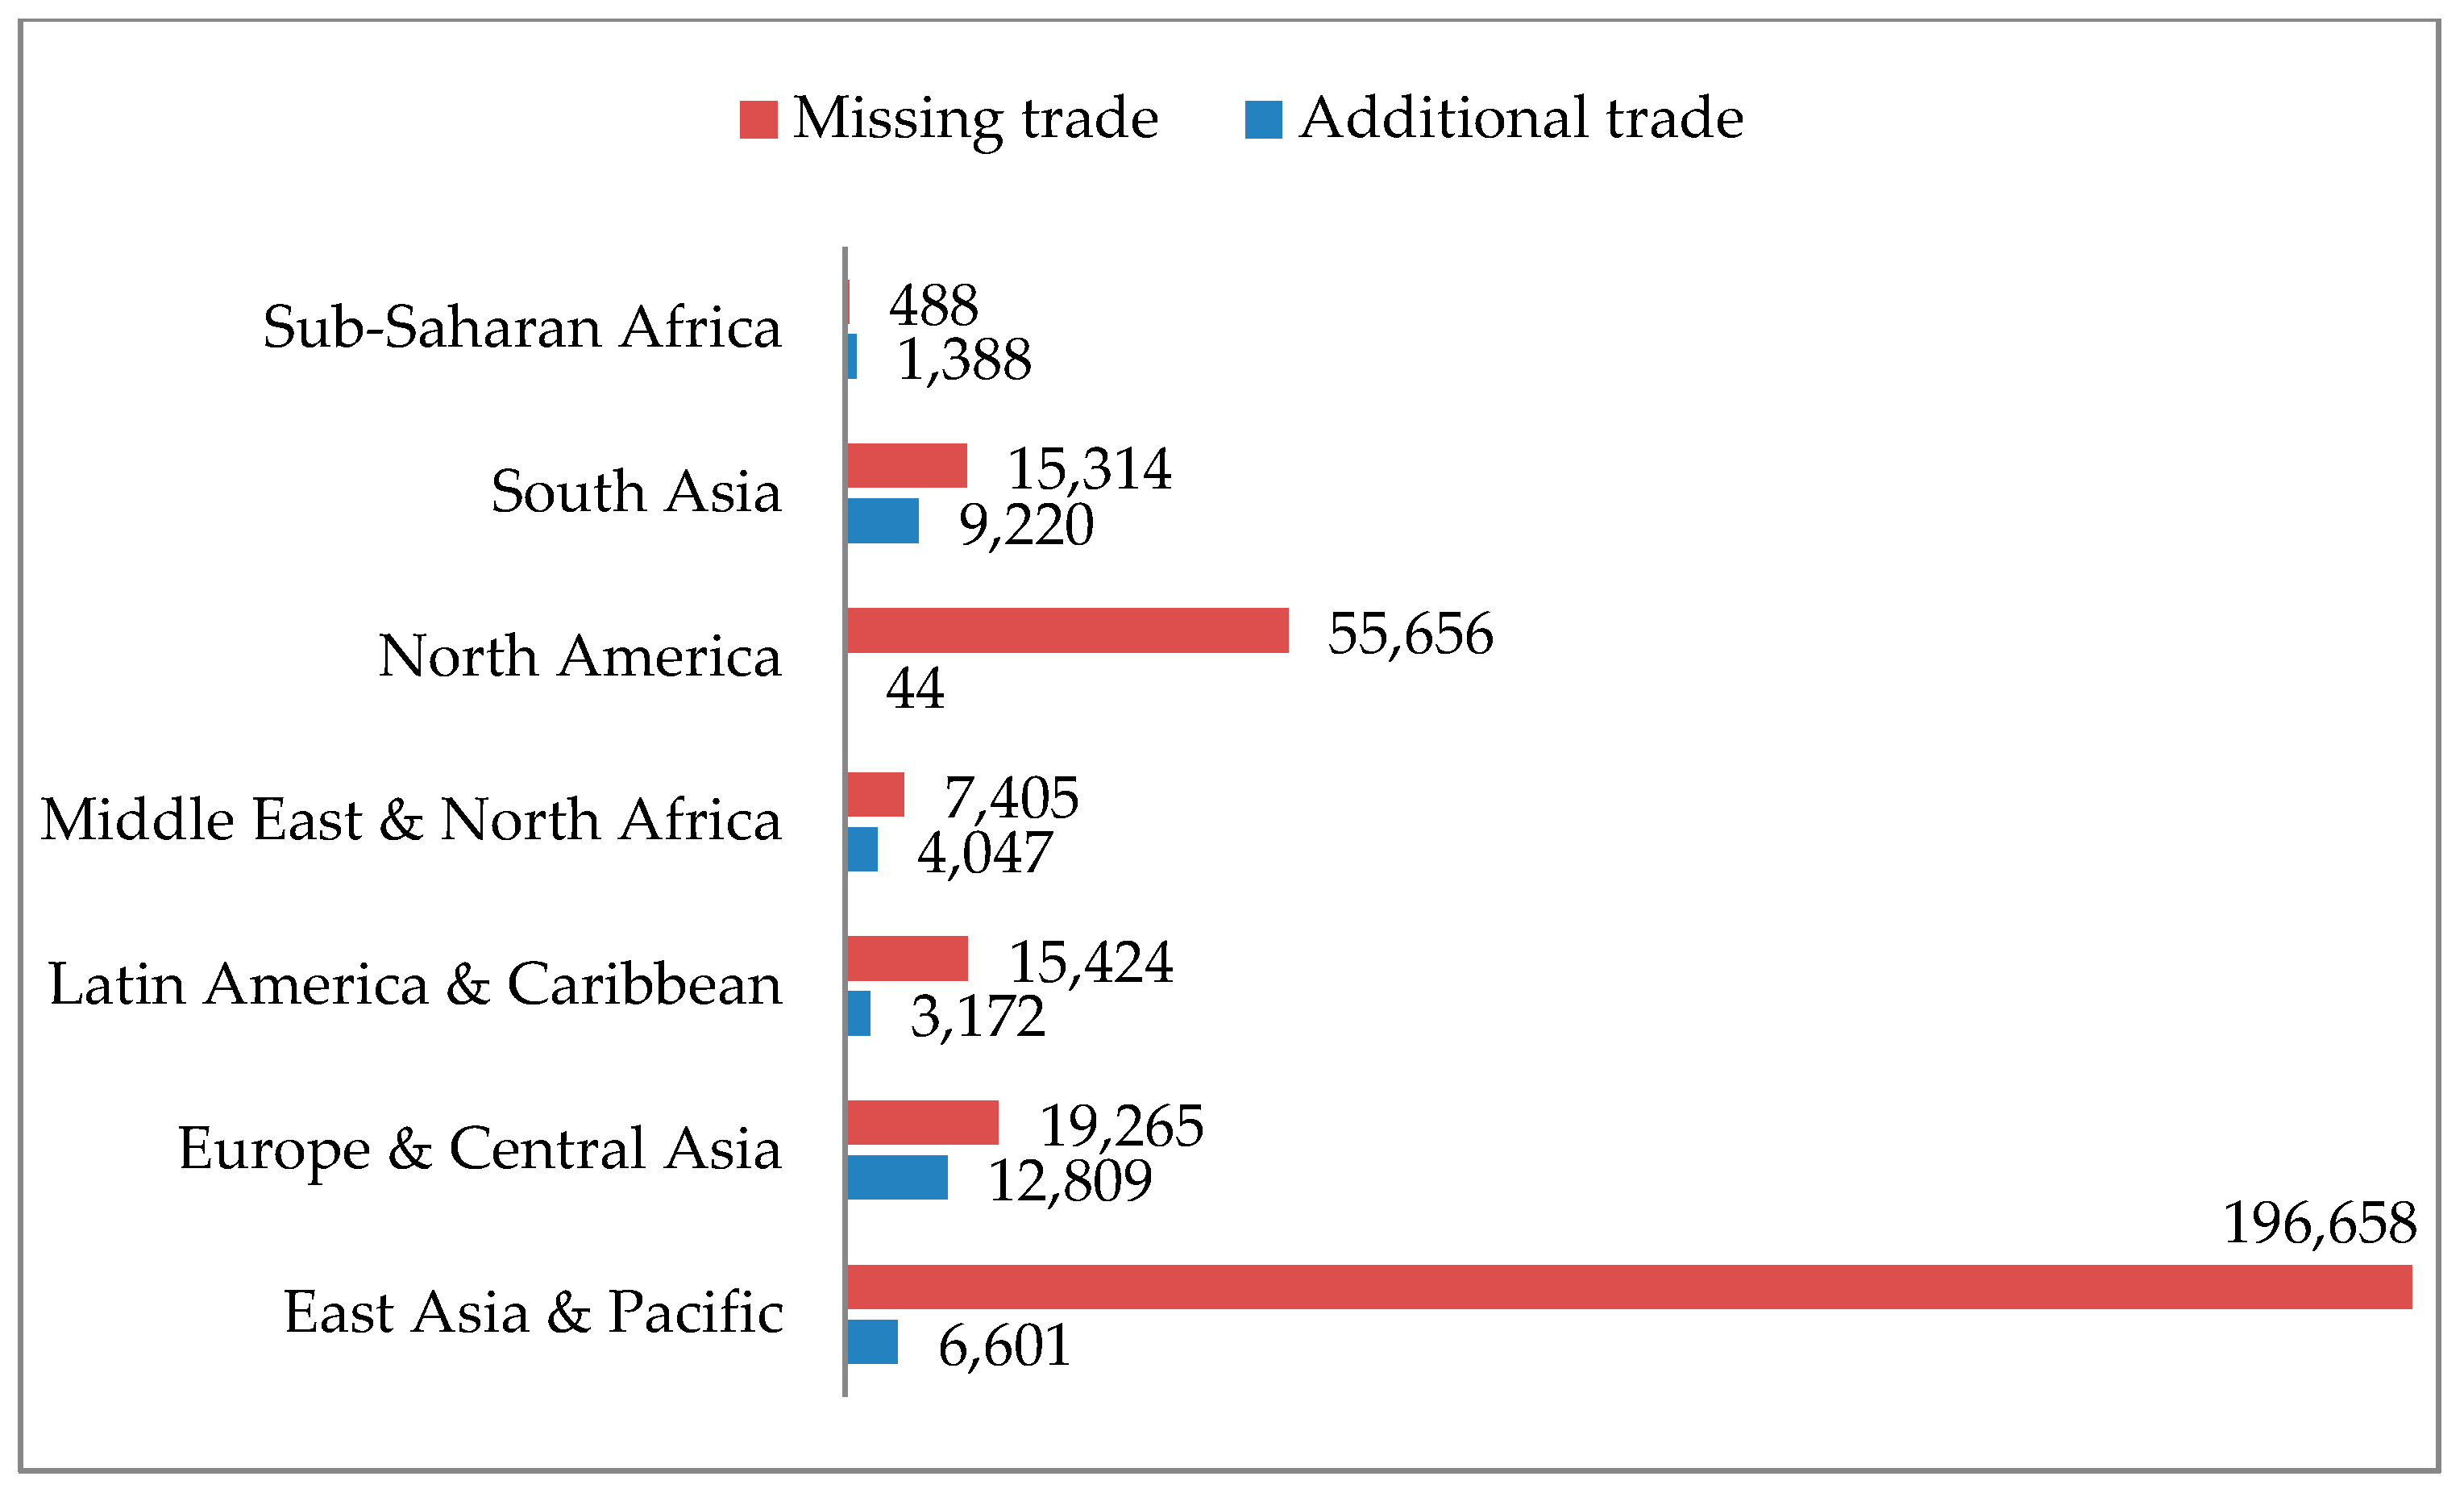
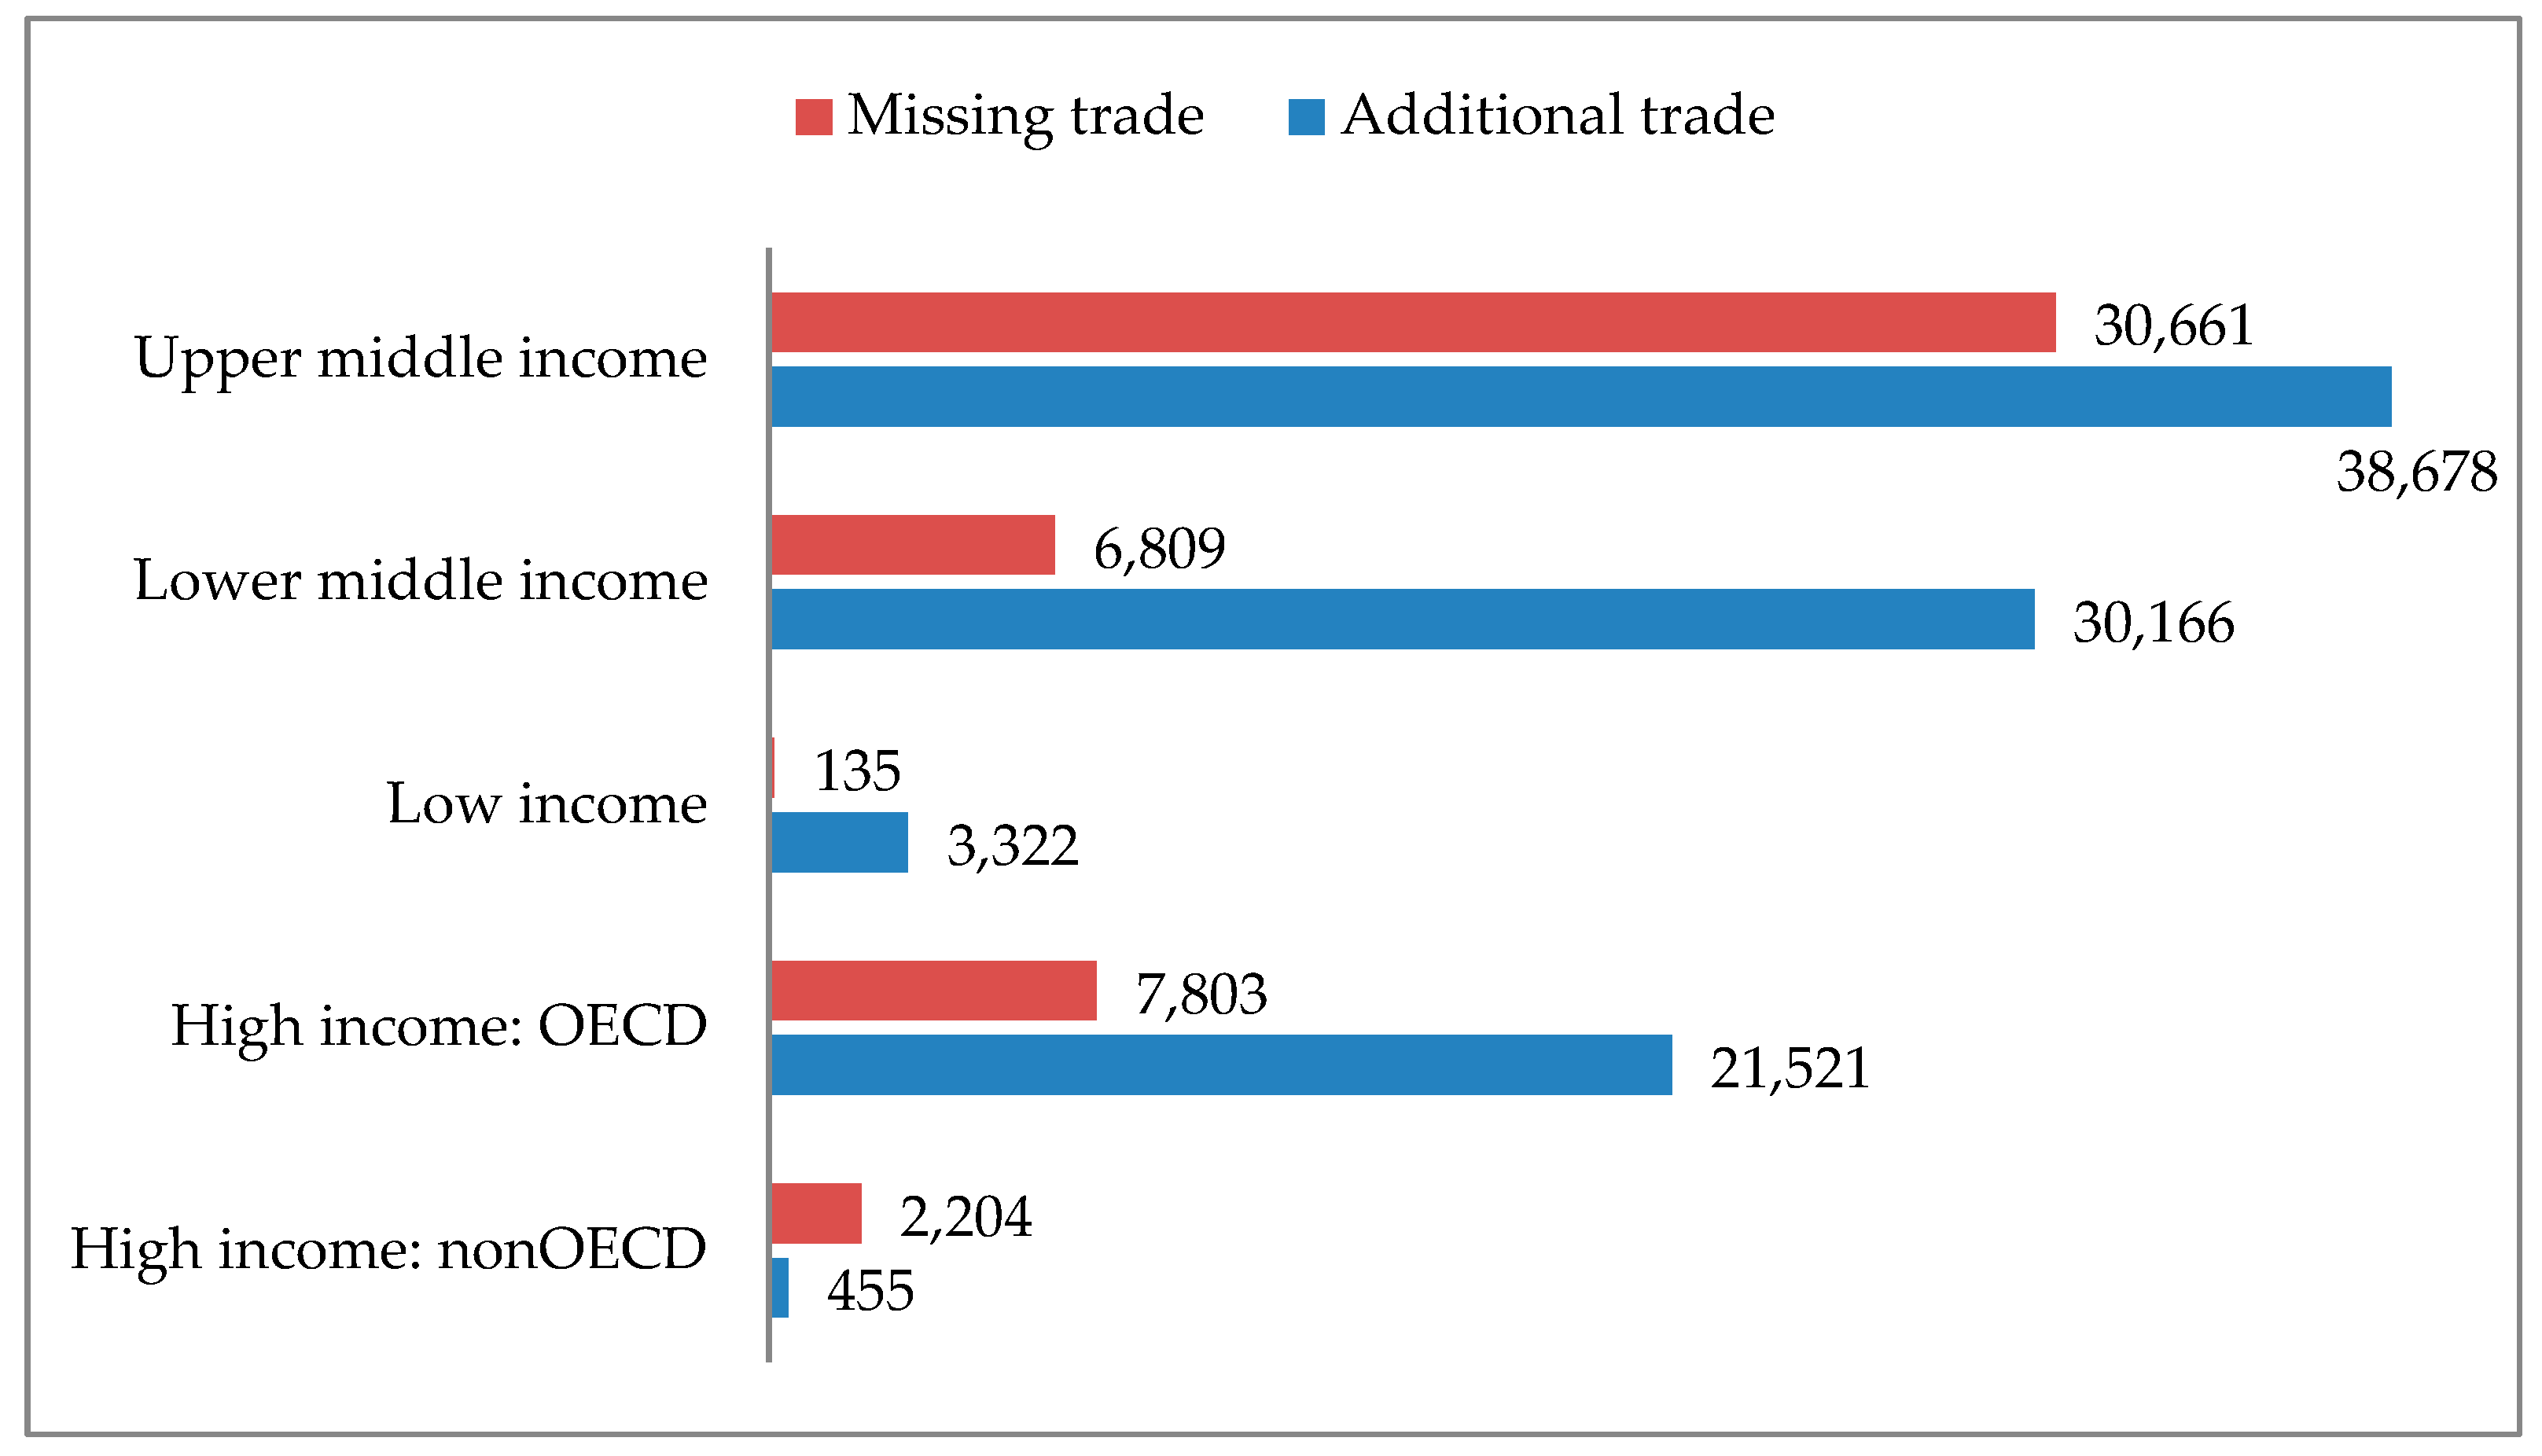
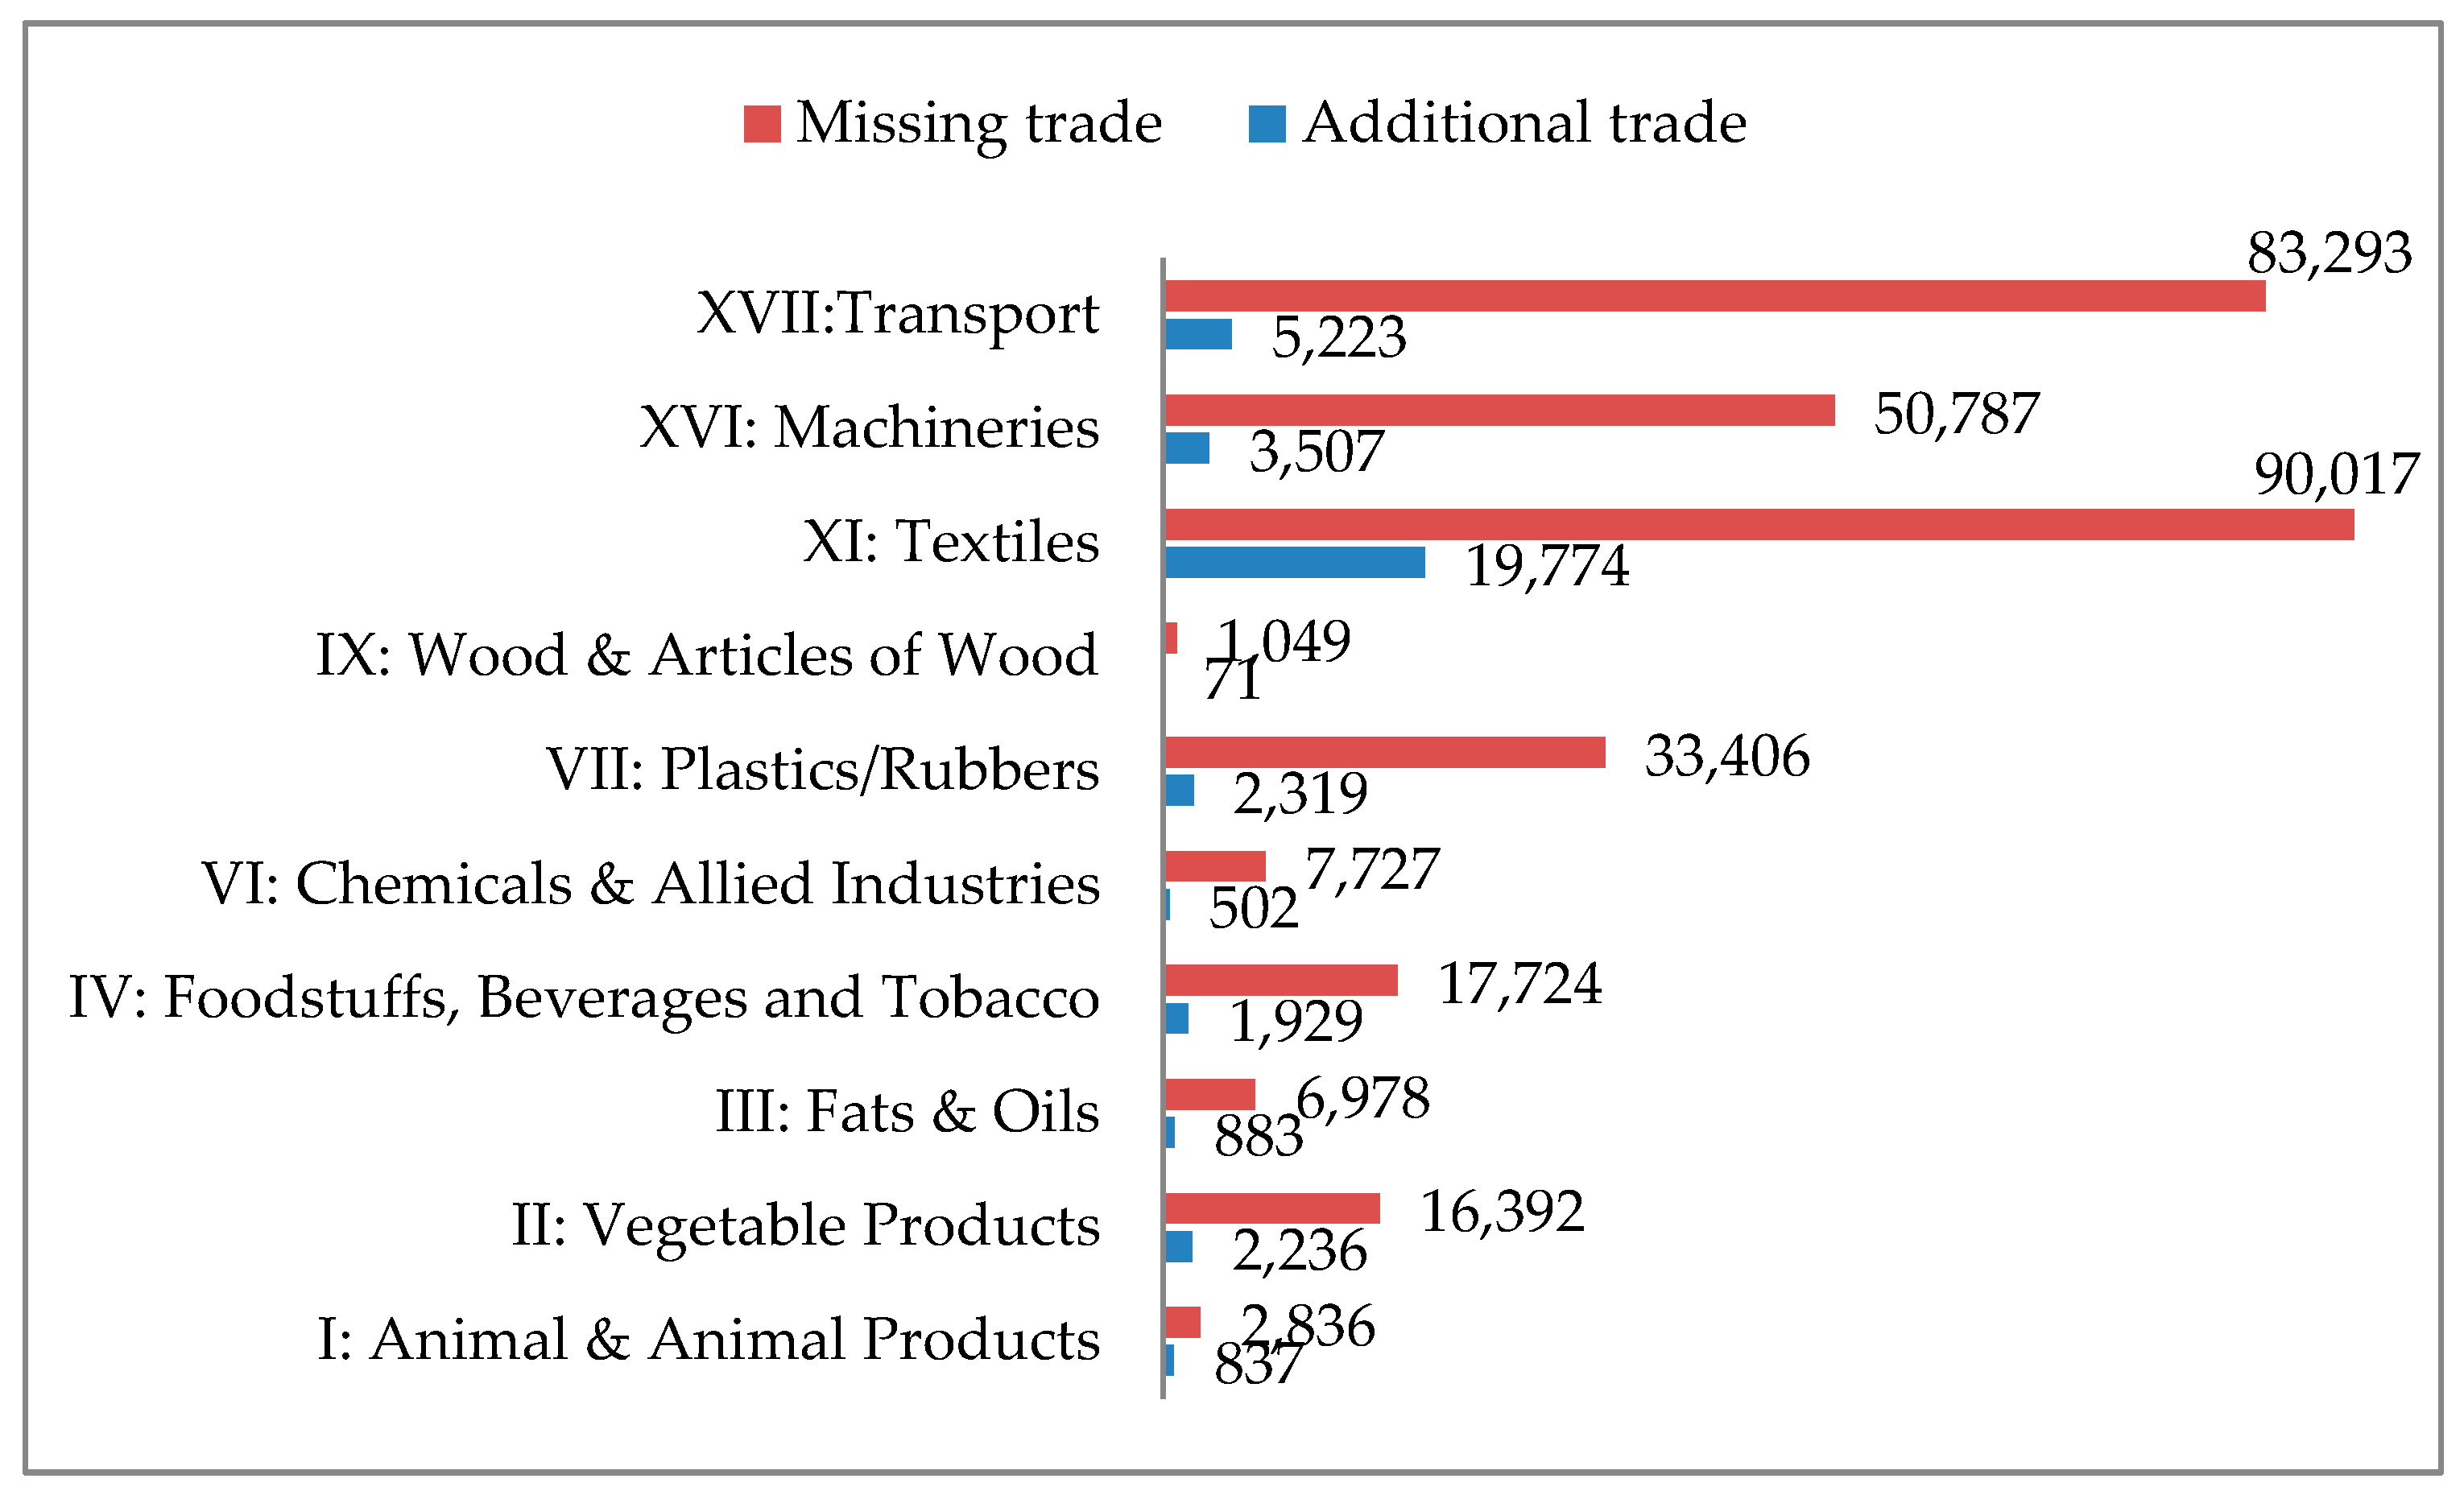
  • We remove the preferential policies setting all tariffs equal to “zero” and estimate the counterfactual EU imports. The difference between the counterfactual (i.e., free-trade) and predicted flows represents the trade decrease resulting from the protectionist impact of EU tariffs. When all tariffs are removed, the numerator (i.e., the reference tariff T) decreases faster than the denominator (i.e., the bilateral tariff ti). This increases to 1 the p r e f i k values of the extra-EU countries facing negative margins (i.e., p r e f i k < 1 ). Accordingly, their export to the EU will increase at the expense of intra-EU trade flows and exports originating from extra-EU countries facing positive margins (i.e., p r e f i k > 1 ). The reduction in exports suffered by the preferred countries corresponds to the value of preference erosion in the case of unilateral liberalization by the EU. However, it is worth emphasizing that preference erosion is ubiquitous: Even the change of bilateral tariff will affect the CES aggregator modifying the margins of each exporter;
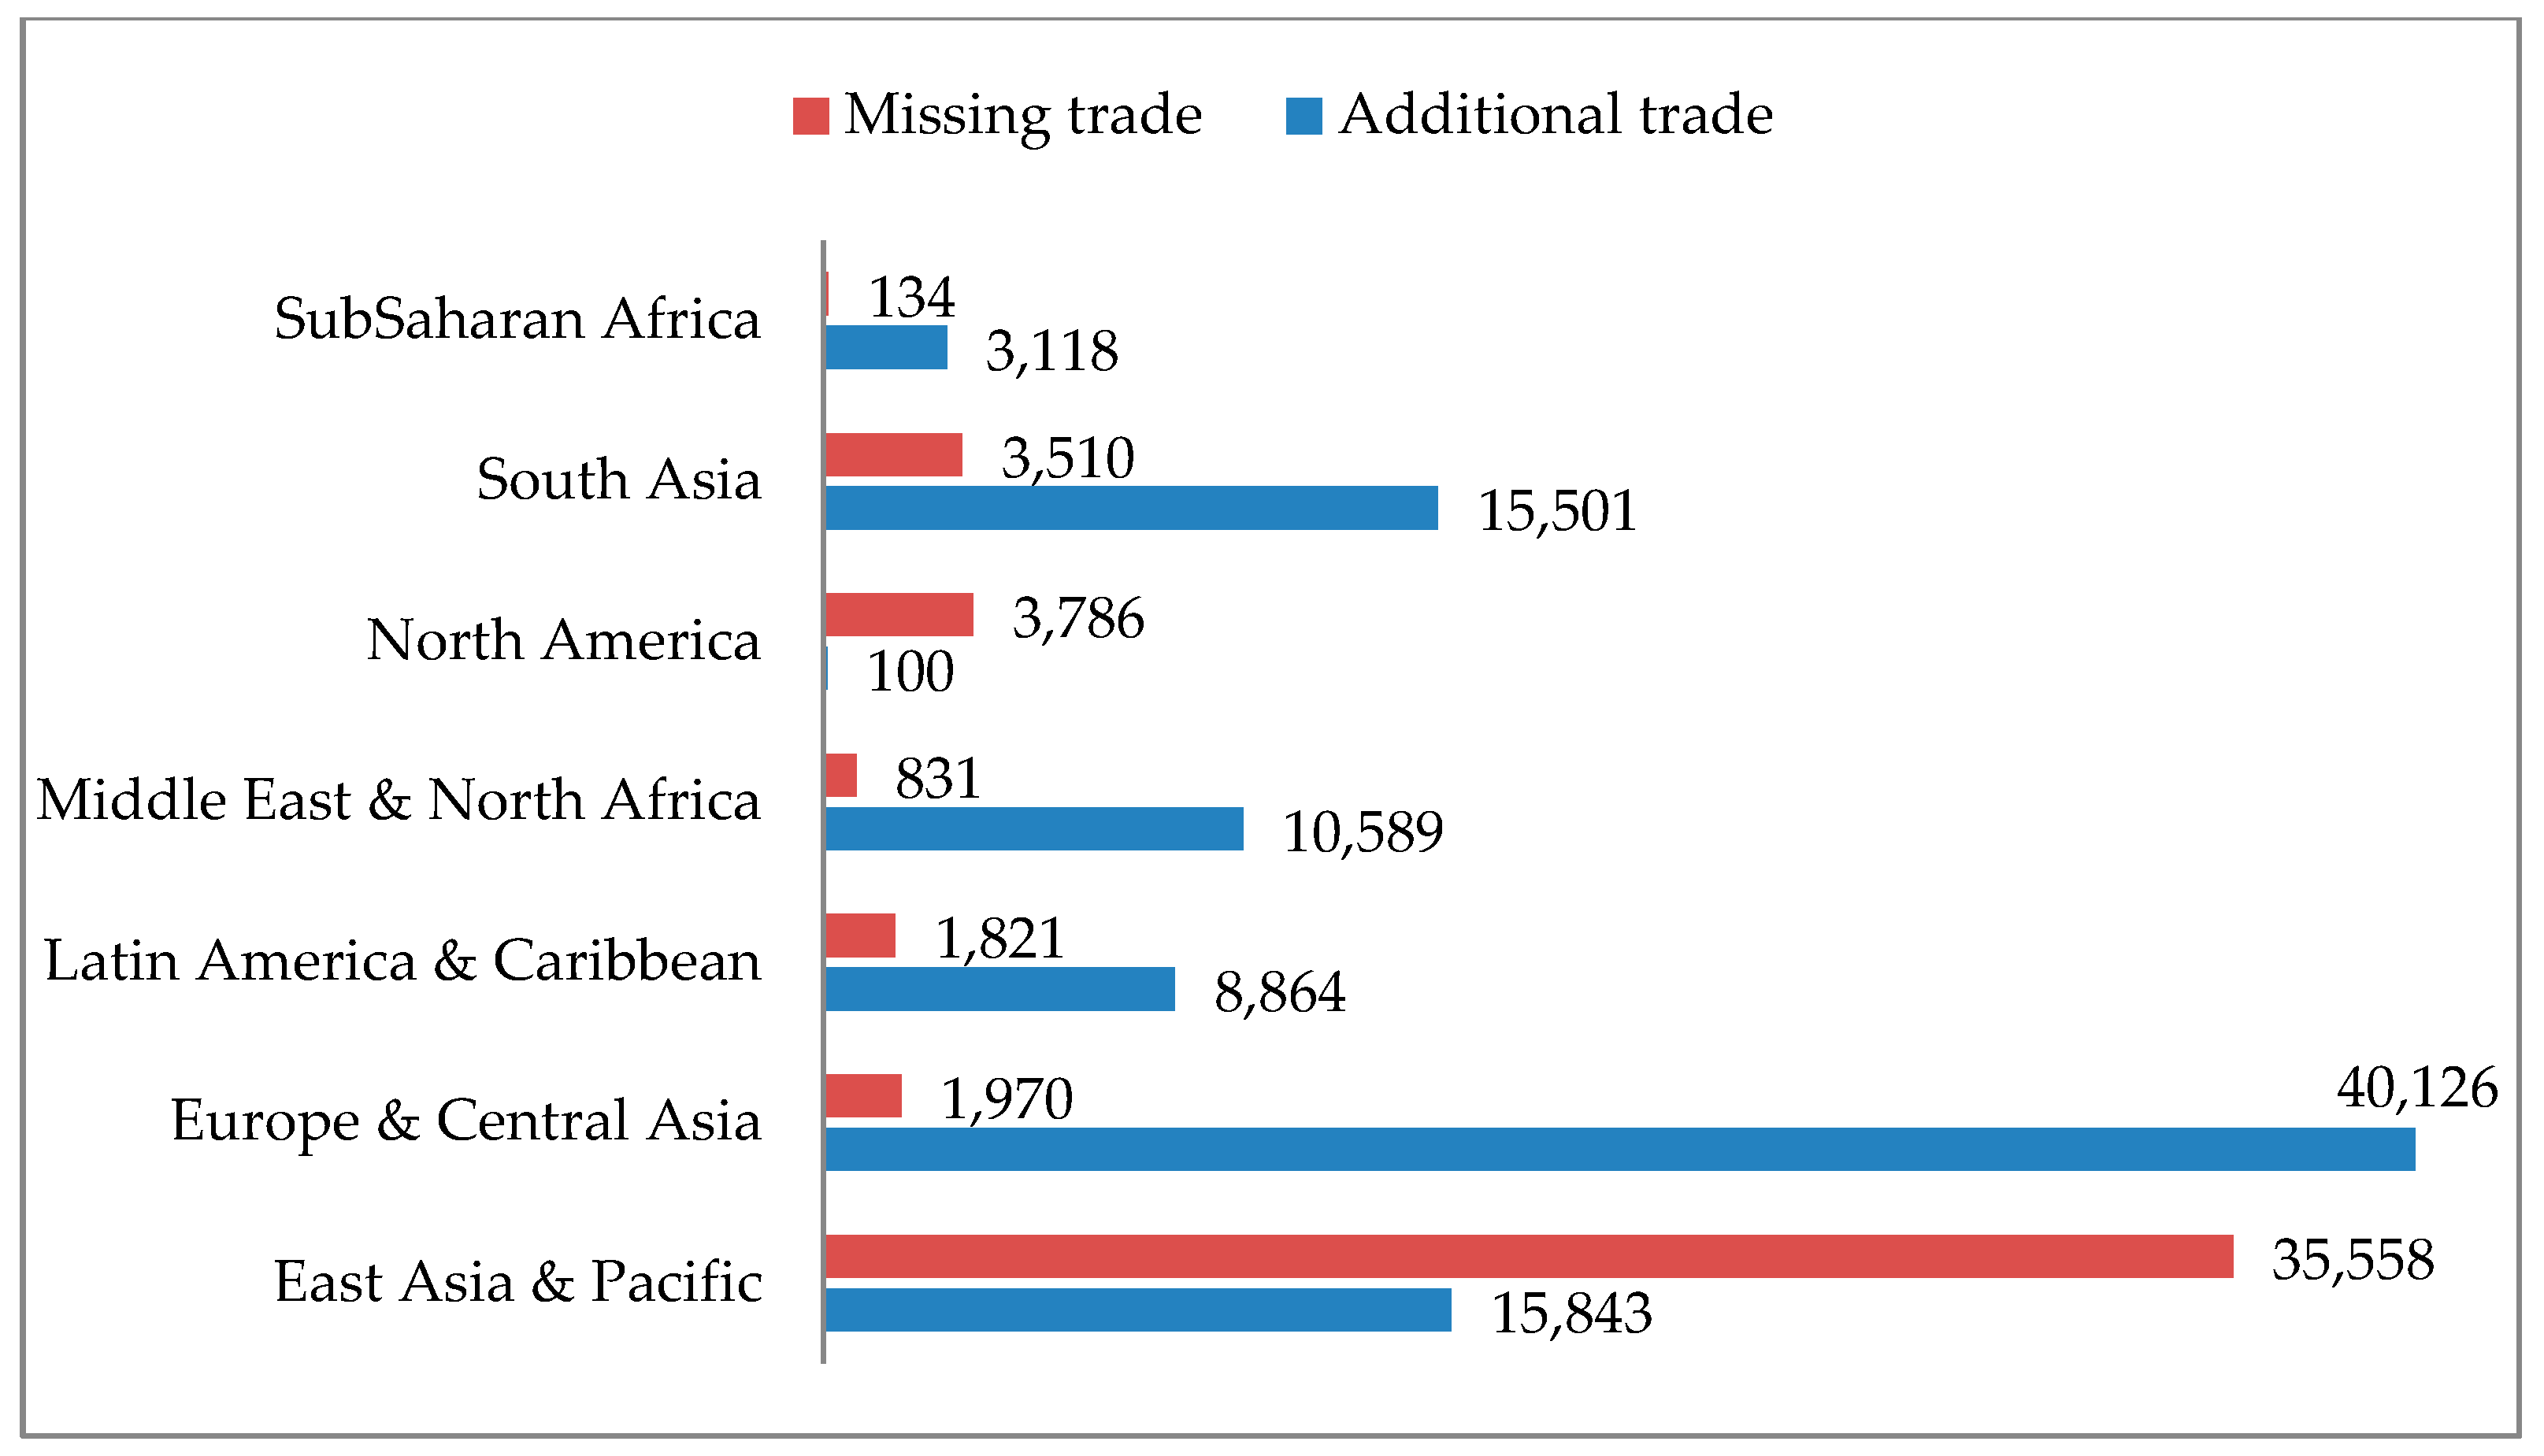
  • We remove the preferential policies setting all bilateral tariffs equal to the MFN rate and estimate the counterfactual EU imports. In this case, the difference between the counterfactual (i.e., non-discriminatory protection) and predicted flows represents trade flows that either would or would not take place without preferences. The former represents the trade diversion (Viner 1950). As far as the latter is concerned, unlike Cipollina et al. (2017), the CES reference tariff takes into account extra- as well as intra-EU trade. Hence, the trade flows generated by the EU trade preferences include both trade creation and trade diversion.

4. Data Sources

To perform the empirical analysis, a data set was built including intra-national EU trade flows (as proxy for domestic sales) and international EU imports. We estimate a panel model, covering imports of 5388 commodities based on the WTO definition, from 188 countries (including the EU) to EU28 in the year 2017. The number of observations is 1,006,180 rather than 1,012,944 (1 importer×188 exporters*5388 products*1 year) since for each exporter all goods that are never exported and therefore not produced were eliminated from the sample. Data on trade at the HS6 level of detail are taken from the Eurostat Comext database (see http://fd.comext.eurostat.cec.eu.int/xtweb/) and data on tariffs are from TRAINS database (see http://r0.unctad.org/trains/) which is integrated into the WITS software (see http://wits.worldbank.org/witsweb/default.aspx). We use the information on preferential and non-preferential (MFN) trade flows, provided by the Comext database, and we set the level of duty used for the computation of the bilateral tariff margins equal to the applied MFN tariff when the flow is registered as MFN trade and to the preferential applied tariff otherwise. In this way, we associate to each flow the duty effectively paid and focus on the flows that effectively benefit from the preferences. Figure 1 shows the percentage of imports associated with the tariff regime and intra-EU members for each sector. Most imports (64%) take place among EU members, whereas the rest is divided between duty-free imports (17%) and imports paying positive MFN duties (19%). The section that accounts for the lowest share of intra-EU trade, Section XIV (natural and precious metals), also shows the highest percentage of duty-free imports (64%). At the other extreme in Section I (animal products) the intra-EU trade share reaches 75% and only 2% benefits from duty-free treatment. Sections as X (paper and paperboard and articles thereof) and XXI (works of art) enter in the EU market under an MFN duty-free regime.
In our analysis we exclude sections where trade policies depend on political rather than economic motivations, this is the case of excluding Section XIX (arms and ammunition), and all sections where there is no room for preferences because all tariffs are equal to “zero”, or sections that present trivial percentages of preferential trade flows, e.g., Sections V (mineral products) and XIV (natural and precious metals).
Figure 2 shows the MFN and applied tariffs for the sections included in our analysis. We present both the simple and trade-weighted averages: Instances when the latter is higher than the former indicate that higher tariffs are associated with inelastic import demand curves. Only 15% of extra-EU imports are preferential trade. Using the MFN rates as a benchmark, the most protected sectors are animal products, foodstuffs and beverages, textiles and footwear (Sections I, IV, XI, and XII). Animals, foodstuff, and beverages products present high shares of intra-EU trade, while in the case of the textile sector all EU imports are subject to positive duty.

5. The Results

5.1. Elasticities of Substitutions by Sections

Table 1 reports the econometric results of Equation (7) for the 16 sections under investigation.
Results show very different elasticities across sectors, almost all sections show significant estimates, with the exception of Sections VIII (raw hides and skins, leather, fur skins, and articles thereof) and XII (footwear, headgear, umbrellas, and other textile articles), XIII (ceramic and glassware), XV (metals), XVIII (instruments and apparatus), and XX (miscellaneous manufactured articles). Sections VIII and XII seem to be characterized by an inelastic demand as confirmed by the observation that the trade-weighted average tariffs are higher than simple averages (Sections VIII and XII) and by a low share of preferential trade (Sections XVIII and XX). The most of imports of Sections XIII and XV are among EU countries and preferences seem to be not relevant for the international trade.
In Sections II (vegetable products) and III (oils and fats), the estimates for the elasticity of substitutions reach quite a high value (respectively, 19 and 20) showing high substitutability among country varieties. This is also true for Sections VII (plastics), XVI (machinery), and XVII (transport equipment), with an estimated coefficient equal to 14. Indeed, from this perspective, the most differentiated sectors seem to be those where estimates are not significant.
The few results provided in the literature are not readily comparable with ours since they only consider substitutability among foreign suppliers, because the observations on intra-EU trade are not included in the sample. However, as expected, our macro elasticities between home and import goods are smaller than the micro elasticity between foreign sources of imports.
Table 2 shows the structure of EU imports based on the CES preference margins and preferential status. More than 18 percent of preferential imports, corresponding to €189,929 million, are actually associated with a positive margin. Whereas, for the two percent of preferential imports, the exporters face tariffs that, despite being lower than MFN duties, are not lower than those faced by their competitors. This is especially relevant in the case of agricultural products (Sections I–IV). However, this does not imply that the preferences are necessarily irrelevant since export flows may be lower without preferences (due to trade creation or diversion) or under free trade (due to preference erosion).
In some cases, when particularly high bilateral unit values lower the value of the bilateral ad valorem equivalent, the bilateral ad valorem equivalent MFN tariff could be lower than those faced by competitors (the trade flow corresponds to €11,108 million). This is especially relevant in the case of Sections VI (chemicals) and XVI (machinery and mechanical appliances).

5.2. Trade Effect

The focus of our analysis is the impact of the EU tariff schedule. Differences among bilateral tariffs lead both to a protectionist and a preferential impact, and it is not possible to distinguish them unless the whole tariff structure is considered. The inclusion of intra-EU trade allows us to compute two counterfactual scenarios. In both cases, preferences are removed but in one case this is the consequence of free trade (all duties are removed), and in the other, it is the consequence of increased protection since all imports are subject to MFN duty.
When we compute trade by setting all tariffs equal to the MFN duties, extra-EU exporters will export less due to the higher protection faced.
Taking into account the sectors for which we got statistically significant estimates, Figure 3 shows that EU preferences generate additional imports, that is, trade that would not take place without preferences, for €94,142 million (representing 9% of predicted trade). Since we consider intra-EU trade flows, this includes both trade creation and trade diversion impact.
On the other hand, imports that would take place if preferences were removed are equal to €47,612 million (around 5% of predicted trade): This represents the trade diversion impact of EU trade policies. The net effect, corresponding to the trade creation effect, is equal to €46,530 million (that is 4% of predicted trade).
The trade effect due to preferences differs greatly across sectors. If we focus on the agricultural sector (Sections I–IV), we can say that even if agricultural goods are particularly protected by non-tariff measures (animal products are likely covered by Sanitary and Phytosanitary rules, while beverages are covered by several regulations and internal taxes that restrict trade) the presence of preferences may be relevant and have a positive effect on the level of trade. Indeed, the large trade effect for vegetable products (Section II) and oils and fats (Section III) is not surprising, considering that they have by very elastic import demand (see Table 1) and, in general, the agricultural sector also shows a large share of preferential trade (see Figure 1).Other sections that present a high trade creation effect are plastic (VII) and transport (XVII), these are sections where there might be room for further liberalization on a preferential basis (see Figure 1).
Figure 4 and Figure 5 present the impact of trade preferences for country groups of countries defined according to income levels. Low and lower middle income countries, defined according to the World Bank classification, are the ones with the largest trade increase in relative terms (especially Asian countries, such as Bangladesh, Pakistan, Cambodia, Philippines, Indonesia, and Sub-Saharan Africa countries, such as Côte d’Ivoire, Ghana, Madagascar, Ethiopia, Uganda). However, it is worth noting that the highest trade flows from high-income OECD that would not take place without preferences concerns imports from Korea, Switzerland, Israel, and Chile, under specific preferential treatment and free trade agreements.
The upper middle-income countries benefit significantly from EU preferences both in relative and absolute terms. This result is due to the existing trade agreements with countries in Latin America, in particular to the EU-Mercosur (Argentina, Brazil, Paraguay, and Uruguay) free trade agreement and the agreement with Mexico, though some trade barriers still remain; and to the Stabilization and Association Agreement between the EU and the Western Balkan partners from which the EU mainly imports machinery and appliances, metals, and chemicals.
On the other hand, the middle-income group of countries in Asia and the Pacific (especially, China) are those most negatively affected by the existing preferential schemes. Actually, these are countries with higher trade flows than would have been the case if preferences were removed.
Figure 6 shows the trade effect of the actual EU trade policies through the computation of the counterfactual trade flows that would be recorded if all tariffs were removed. The overall protectionist impact of EU trade policies is quite large and amounts to €310,210 million, around 30% of predicted trade. These are imports that would take place under free trade. Larger decrease of trade due to protection is registered for textile products (XI), so that the major exporters of textiles (such as China, India, and Vietnam) should be particularly affected by a liberalization policy. Other sections that might suffer from trade liberalization are the agriculture (Sections I–IV) and the plastic sector (VII). Comparing results so far, notwithstanding the existence of several preferential schemes, the overall stance of the EU trade policy seems to remain quite protectionist.
Results show that €37,282 million (around 4% of predicted trade) of imports would disappear under free trade. These are exports lost by countries actually enjoying an advantage due to the preferential treatment and represents what developing countries may lose as a consequence of multilateral liberalization (preference erosion). If we look at the results for different products, the most protected sections appear to be textiles (XI), vegetables (Section II), and oils and fats (Section IV), whereas the lowest protection impact is found for cereals (Section V).
Figure 7 and Figure 8 show the protectionist impact of EU tariffs for different country groups. Exports from the high-income OECD countries group are the most negatively affected (first of all, North America, i.e., US and Canada), followed by those from upper middle-income countries. In terms of preference erosion, low-income and lower middle-income countries are the groups that risk more. This is especially the case for Asian countries such as India, Indonesia, Vietnam, Sri Lanka, and Bangladesh.

6. Conclusions

The aim of this article was to provide a thorough empirical analysis of the EU’s tariffs, estimating their effects on bilateral trade flows while controlling for their multilateral impact and including a full set of fixed effects. Estimating the impact of trade policies involves complex issues due to the difficulty in correctly specifying the gravity equation. Here, we carried out a simple but theoretically consistent gravity analysis of EU tariffs using a complete, well-documented dataset. We ran estimations at the disaggregated level of individual tariff lines and identified relationships on the basis of the extensive variation available in bilateral trade data. That is to say, a variation in trade costs across exporters provides the price variation needed to trace the slope of the EU import demand curves.
This characteristic should be acknowledged, as the literature of international trade has recognized years ago the existence of a multilateral component of resistance, catching the fact that exports from country A to country B depend on the commercial costs of all possible suppliers. In other words, focusing on absolute costs means that other important general equilibrium effects that operate through the price index are often ignored.
A crucial feature is the measurement of trade policy treatment. In particular, the policy variable must take into account the relative changes in bilateral tariff in relation to duties paid by other exporters. This allows accounting for the multilateral resistance component capturing the fact that exports from country i to country j depend on trade costs across all possible suppliers. In this article we presented a general framework in which the magnitude of trade policies’ impacts on trade was structurally estimated, using very detailed data including intra-national flows. We computed the bilateral tariff margin as the ratio between a reference tariff factor and the applied tariff factor faced by each exporter. Such a choice is consistent with the observation that bilateral trade depends also on the market conditions applied to other countries and not only on direct market conditions. The result of the trade policy can be an advantage or a disadvantage with respect to other countries, and the greater is the relative advantage (disadvantage) the higher (lower) is the expected trade flows.
Whereas Cipollina et al. (2017) assess the impact of EU preferences considering only extra-EU trade flows, we developed a model with both extra and intra-EU trade flows at the most disaggregate tariff line level. The use of intra-national trade flow data is consistent with gravity theory (Yotov 2012; Yotov et al. 2016) and the most recent literature has pointed out that it allows a consistent identification of multilateral (Heid et al. 2017) as well as bilateral trade policies (Dai et al. 2014; Bergstrand et al. 2015). Moreover, since intra-EU trade is substantial, it is important to allow foreign and domestic producers to be active in the same sector producing similar goods.
Cipollina et al. (2017) show that preference margins can be positive or negative when they are computed with regard to the tariffs paid by other exporters. These points to a renewed interpretation of the trade creation and trade diversion concepts, through multilateral resistance terms, of changes in tariffs included in Tk. A decrease in t i k is directly increasing bilateral imports from i, while also changing the relative trade costs through its impact on the reference tariff. EU consumers, therefore, reallocate demand according to new relative prices, diverting trade from non-preferred countries and reducing demand for domestic producers. Since we took into account the intra-EU duty-free trade, the reference tariffs turned out to be much lower. This led to a significant reduction, or disappearance, of the preference margins, though they are likely to have a larger impact since they affect total consumption rather than imports only.
An important byproduct of our approach is that it can be used to obtain estimates of the elasticity of substitution which is the single most important parameter in the international trade literature. Since tariffs are a direct price-shifter, gravity theory can be used to recover the elasticity of substitution directly from the estimate of the coefficient on bilateral margins. Although bilateral measures of bilateral tariffs have previously been used to identify the trade elasticity in structural gravity frameworks, e.g., Cipollina et al. (2017), we were able to estimate a more comprehensive elasticity by also taking into account the impact on domestic goods.
Our model allows differences in trade elasticities between the various sectors, which means that consumers can react differently to price changes in different sectors. This is quite significant as tariffs vary substantially across the various sectors, and this means that the failure to take into account this heterogeneity between the various sectors can lead to distorted results. We find that the impact of the community policy, in terms of protection, is much stronger than the increase in extra-EU trade due to the preferential policy. In the debate on how effective the EU preferences are, our analysis shows that, even if the EU seems to lean towards trade liberalization through a proliferation of preferential agreements, the preferences do not seem to be very effective in incrementing trade. Nonetheless, preferences play a significant role in specific products or exporters.

Author Contributions

Conceptualization, M.C. and L.S.; Data curation, M.C.; Formal analysis, M.C. and L.S.; Investigation, M.C. and L.S.; Methodology, M.C. and L.S.; Supervision, L.S.; Writing—original draft, M.C. and L.S.; Writing—review & editing, M.C. and L.S.

Funding

This research received no external funding.

Acknowledgments

We would like to thank participants to the session “Trade policy relevance of CGE parameters” at the 22nd Annual Conference on Global Economic Analysis “Challenges to Global, Social, and Economic Growth”, GTAP Conference, 19–21 June 2019, Warsaw (Poland).

Conflicts of Interest

The authors declare no conflict of interest.

References

  1. Anderson, James E. 1979. A Theoretical Foundation for the Gravity Equation. The American Economic Review 69: 106–16. Available online: http://www.jstor.org/stable/1802501 (accessed on 10 September 2018).
  2. Anderson, James E., and Eric Van Wincoop. 2003. Gravity with Gravitas: A Solution to the Border Puzzle. The American Economic Review 93: 170–92. [Google Scholar] [CrossRef]
  3. Baier, Scott L., and Jeffrey H. Bergstrand. 2001. The growth of world trade: tariffs, transport costs, and income similarity. Journal of International Economics 53: 1–27. [Google Scholar] [CrossRef]
  4. Bergstrand, Jeffrey H., Mario Larch, and Yoto V. Yotov. 2015. Economic Integration Agreements, Border Effects, and Distance Elasticities in the Gravity Equation. European Economic Review 78: 307–27. [Google Scholar] [CrossRef]
  5. Caliendo, Lorenzo, and Fernando Parro. 2015. Estimates of the trade and welfare effects of Nafta. Review of Economic Studies 82: 1–44. [Google Scholar] [CrossRef]
  6. Cipollina, Maria, David Laborde Debucquet, and Luca Salvatici. 2017. The tide that does not raise all boats: An assessment of EU preferential trade policies. Review of World Economics 153: 199–31. [Google Scholar] [CrossRef]
  7. Corbo, Vesna, and Chiara Osbat. 2013. Trade Adjustment in the European Union. A Structural Estimation Approach, European Central Bank Working Paper Series, no. 1535; Frankfurt: ECB Working Paper. [Google Scholar]
  8. Dai, Mian, Yoto V. Yotov, and Thomas Zylkin. 2014. On the Trade-Diversion Effects of Free Trade Agreements. Economic Letters 122: 321–25. [Google Scholar] [CrossRef]
  9. De Melo, Jaime, and Alessandro Nicita, eds. 2018. Non-Tariff Measures: Economic Assessment and Policy Options for Development. Geneva: United Nations Conference on Trade and Development. [Google Scholar]
  10. European Commission. 2016. Strategic Plan 2016-2020, DG Trade. Available online: https://trade.ec.europa.eu/doclib/docs/2016/august/tradoc_154919.pdf (accessed on 1 June 2019).
  11. Fally, Thibault. 2015. Structural Gravity and Fixed Effects. Journal of International Economics 97: 76–85. [Google Scholar] [CrossRef]
  12. Feenstra, Robert C., Philip Luck, Maurice Obstfeld, and Katheryn N. Russ. 2018. In Search of the Armington Elasticity. The Review of Economics and Statistics 100: 135–50. [Google Scholar] [CrossRef]
  13. Head, Keith, and Thierry Mayer. 2014. Gravity equations: Workhorse, toolkit, and cookbook. In Handbook of International Economics. Amsterdam: Elsevier, vol. 4, pp. 131–95. [Google Scholar]
  14. Heckman, James J. 1979. Sample selection bias as a specification error. Econometrica 47: 153–61. [Google Scholar] [CrossRef]
  15. Heid, Benedikt, Mario Larch, and Yoto Yotov. 2017. Estimating the Effects of Non-discriminatory Trade Policies within Structural Gravity Models. CESifo Working Paper no. 6735. München: CESifo Working Paper Series. [Google Scholar]
  16. Helpman, Elhanan, Marc Melitz, and Yona Rubinstein. 2008. Estimating trade flows: Trading partners and trading volumes. Quarterly Journal of Economics 123: 441–87. [Google Scholar] [CrossRef]
  17. Imbs, Jean, and Méjean Isabelle. 2009. Elasticity Optimism. International Monetary Fund Working Paper Series, 09/279; Washington: IMF. [Google Scholar]
  18. Lai, Huiwen, and Susan Chun Zhu. 2004. The Determinants of Bilateral Trade. Canadian Journal of Economics 37: 459–83. [Google Scholar] [CrossRef]
  19. Low, Patrick, Roberta Piermartini, and Jürgen Richtering. 2009. Multilateral solutions to the erosion of nonreciprocal preferences in nonagricultural market access. In Trade Preference Erosion: Measurement and Policy Response. Edited by Bernard Hoekman, Will Martin and Carlos A. Primo Braga. Washington: World Bank, pp. 219–67. [Google Scholar]
  20. Ornelas, Emanuel, and Marcos Ritel. 2018. The Not-So-Generalized Effects of the Generalized System of Preferences. CEP Discussion Paper No 1578. London: Centre for Economic Policy Research. [Google Scholar]
  21. Martin, Will, and Cong S. Pham. 2016. Estimating the Gravity Model When Zero Trade Flows are Frequent and Economically Determined. World Bank Policy Research Working Paper No. 7308. Washington: World Bank. [Google Scholar]
  22. Romalis, John. 2007. Nafta’s and cusfta’s impact on international trade. Review of Economics and Statistics 89: 416–35. [Google Scholar] [CrossRef]
  23. Silva, JMC Santos, and Silvana Tenreyro. 2006. The log of gravity. The Review of Economics and Statistics 88: 641–58. [Google Scholar] [CrossRef]
  24. Scoppola, Margherita, Valentina Raimondi, and Alessandro Olper. 2018. The impact of EU trade preferences on the extensive and intensive margins of agricultural and food products. In Agricultural Economics. Milwaukee: International Association of Agricultural Economists, vol. 49, pp. 251–63. [Google Scholar]
  25. Tinbergen, Jan J. 1962. Shaping the World Economy: Suggestions for an International Economic Policy. The Twentieth New York: Century Fund. [Google Scholar]
  26. Viner, Jacob. 1950. The Customs Union Issue. New York: Carnegie Endowment for International Peace. [Google Scholar]
  27. Yotov, Yoto V. 2012. A Simple Solution to the Distance Puzzle in International Trade. Economics Letters 117: 794–98. [Google Scholar] [CrossRef]
  28. Yotov, Yoto V., Roberta Piermartini, José-Antonio Monteiro, and Mario Larch. 2016. An Advanced Guide to Trade Policy Analysis: The Structural Gravity Model. Geneva: World Trade Organization. [Google Scholar]
Figure 1. Structure of EU28 imports by section. Source: Elaboration on data by COMEXT and TRAINS; 2017.
Socsci 08 00261 g001
Figure 2. Tariffs (%, trade-weighted mean). Source: Elaboration on data by COMEXT and TRAINS; 2017.
Socsci 08 00261 g002
Figure 3. Trade effect due to preferences: Results for sectors with significant preference impact (CES reference tariff). At world prices; millions of €. Source: Elaboration on data by COMEXT and TRAINS; 2017.
Socsci 08 00261 g003
Figure 4. Trade effect due to preference: Results by countries based on income levels (CES reference tariff). At world prices; millions of €. Source: Elaboration on data by COMEXT and TRAINS; 2017.
Socsci 08 00261 g004
Figure 5. Trade effect due to preference: Results by countries according to regions (CES reference tariff). At world prices; millions of €. Source: Elaboration on data by COMEXT and TRAINS; 2017.
Socsci 08 00261 g005
Figure 6. Trade effect due to protection: Results for sectors with significant preference impacts (CES reference tariff). At world prices; millions of €. Source: Elaboration on data by COMEXT and TRAINS; 2017.
Socsci 08 00261 g006
Figure 7. Trade effect due to protection: Results by countries according to income levels (CES reference tariff). At world prices; millions of €. Source: Elaboration on data by COMEXT and TRAINS; 2017.
Socsci 08 00261 g007
Figure 8. Trade effect due to protection: Results by countries according to income levels (CES reference tariff). At world prices; millions of €. Source: Elaboration on data by COMEXT and TRAINS; 2017.
Socsci 08 00261 g008
Table 1. Estimated elasticities of substitution by section.
SectionsSigma ( σ ^ )N. of Obs.
I: Animal and Animal Products5.2 ***4.5798
II: Vegetable Products19.5 ***45.545
III: Fats and Oils20.2 ***7.024
IV: Foodstuffs, Beverages, and Tobacco9.4 ***28.676
VI: Chemicals and Allied Industries3.3 **152.831
VII: Plastics/Rubbers14.3 ***39.659
VIII: Raw Hides, Skins, Leather, and Furs−0.912.471
IX: Wood and Articles of Wood7.3 **19.865
XI: Textiles12.8 ***160.859
XII: Footwear/Headgear1.49.001
XIII: Stone/Glass−0.824.829
XV: Metals2.5105.729
XVI: Machineries14.1 ***151.063
XVII: Transport14.8 ***26.398
XVIII: Instruments2.636.007
XX: Misc. Manufactured Articles5.5423.304
1 Robust standard errors, clustered by country-product, are shown in parentheses. Data refer to 2017. All specifications include exporter and product fixed effects. ** significant at 5 per cent level; *** significant at 1 per cent level. Source: Elaboration on data by COMEXT and TRAINS; Software Stata/SE 13.1.
Table 2. Trade flows based on the CES tariff margins, preferential status, and shares with respect to total EU imports.
SectionsPreferential Trade FlowsMFN Flows
Margin > 1Margin = 1Margin < 1Margin > 1Margin = 1Margin < 1
Overall189,92946817,92611,108340,979477,131
(18)(0)(2)(1)(33)(46)
I: Animal and Animal Products6423727254414516515
(37)(0)(16)(0)(8)(38)
II: Vegetable Products12,118402465960324,7838099
(24)(1)(9)(1)(49)(16)
III: Fats and Oils371202610756281
(36)(0)(3) (1)(61)
IV: Foodstuffs, Beverages, and Tobacco945859130156013,2177927
(29)(0)(4)(2)(41)(24)
VI: Chemicals and Allied Industries13,0910568448282,31361,502
(8) (0)(3)(51)(38)
VII: Plastics/Rubbers16,3900737342431337,748
(28) (1)(1)(7)(63)
IX: Wood and Articles of Wood954017719557654878
(8) (1)(2)(48)(41)
XI: Textiles49,8360734538137452,759
(45) (7)(0)(1)(47)
XVI: Machineries42,0940214842205,692195,021
(9) (0)(1)(46)(44)
XVII: Transport35,85301322199496,400
(27) (0)(0)(1)(72)
Millions of €; shares of total EU imports (in parenthesis). Source: Elaboration on data by COMEXT and TRAINS; 2017.

