1. Introduction
1.1. Definition of Culture
Culture is a common characteristic of a society in which artists and creative thinkers describe reality of their citizens with an “interpretation code” (
Van der Borg and Russo 2005). Reflection of common attitudes, values, beliefs, and behaviors can be defined as culture (
Ashmore et al. 2017). Culture is accumulated, experienced, and rooted in the DNA of a community not only as tangible items, but also as traditions of public life, rituals, food, conviviality, fests, landmarks, and symbols (
Van der Borg and Russo 2005). However, it is still an open question, what exactly culture is. Some studies related to explaining the culture phenomenon have been conducted with genetics science, shared heritage, and social conditioning (
Ashmore et al. 2017).
1.2. Quantification of Culture
There are two major global analyses based on cross-cultural variation by the most cited social scientists: Geert Hofstede (
Hofstede 1980) and Ronald Inglehart (
Inglehart 1997). Hofstede is known for six basic culture dimensions that come to term with society’s needs in order to organize itself. Meanwhile, Inglehart’s work focuses on two main dimensions that explain the dynamic change of culture. Hofstede’s culture dimensions prevail on analysis of cross-cultural psychology and international management while Inglehart’s work is generally used in politics and sociology (
Beugelsdijk and Welzel 2018). In this paper, we analyze the role of Hofstede’s culture dimensions as travel behaviors are more related to human psychology and Hofstede’s culture consideration is multi-dimensional. Hofstede’s research (
Hofstede 1979,
1980,
2001;
Hofstede and Bond 1988;
Hofstede et al. 2010) has been conducted with one hundred billion employees of IBM from fifty countries, with wider multi-national corporation based on a specific global survey of the value system. As a result of factor analyses, worldwide survey examination has been refined, and Hofstede described six culture dimensions such as “power distance (POD)”, “uncertainty avoidance (UNC)”, “individualism versus collectivism (IND/COL)”, “masculinity versus femininity (MAS/FEM)”, “long-term orientation (LTO)’’, and “indulgence (INDG)”. Hofstede’s culture dimensions shed light on the embedded values of diverse cultures. Culture dimensions proposed in Hofstede’s works are described as follows. The IND/COL dimension of culture is the degree of interdependence a society maintains among its members. Hofstede stated the IND/COL dimension to be the fundamental dimension of culture, called as patterns of the me or we sense. The fundamental issue addressed by the power distance (POD) dimension in community culture is a tendency level of equalities or a centralization degree of power where higher power distance means high inequalities in the community. Low score cultures with POD would not admit inequalities as easily. IND/COL and POD are strongly correlated with each other. Collectivist cultures have low POD. When POD is high, a community can emphasize the citizens’ status. The fundamental issue addressed by the uncertainty avoidance (UNC) dimension is the level of built-in worry of community culture. Communities with a high UNC have a high level of anxiety in an uncertainty situation. The MAS/FEM dimension demonstrates the level of competition in a community. A masculine culture would be less concerned with the quality of life. The long-term orientation (LTO) dimension shows the level in culture of how every society must maintain some links with its own past while dealing with the challenges of the present and future. Lastly, the indulgence dimension (INDG) can be described as the degree of socialization or control over impulses and desires in a society.
1.3. Literature Review
National culture, a subset of culture, increasingly explored over recent decades, has been defined by Hofstede as ‘the collective programming of the mind that distinguishes the members of one national group from another’ (
Ashmore et al. 2018). Different cultural conditions lead to different choice evaluations because of varying ‘value associations’ (
Ashmore et al. 2017). Social value associations and culture scarcely pronounced on travel behavior analysis bring along a gap in the literature.
Paulssen et al. (
2014) analyzed the role of Schwartz’s theory of human values on travel mode choices. The results show that the hierarchical value-based model of cognition brings a better understanding of how to increase public transport patronage for urban planners and policy-makers. One study tested Hofstede’s culture dimensions (HCD) to explain travel behavior differences on perceptions of and feelings about security, as well as how actual experiences affect people’s patronage of public transport (
Syam et al. 2011). The results have demonstrated that HCD can be used to explain travel behavior differences based on ethnic background. Another research using Hofstede’s cross-cultural indices power differential and individualism in 14 cities from different nations, investigated whether qualitative cultural differences influenced individual or group choices to procure and use hybrid and electric cars (
Ashmore et al. 2018). A recent study (
Syam 2014) examined the role of culture in the mode choice for different migrant groups within Auckland. The results showed that national culture was a strong motivator of how public transport is perceived differently by different national groups within a city.
1.4. Aim of Study
Understanding how cities are shaped by setting the appropriate transport priorities can help to achieve terms of sustainable mobility objectives or policies (
European Environment Agency 2009;
Prashker et al. 2008;
Newman 2015). To date, no research studies have analyzed the role of culture on urban travel patterns in a holistic way. The present analysis is to evaluate the effect of culture on urban travel patterns in 87 urban areas from 41 countries. Some policy and urban transport strategies can be drawn by answering this question: which alternative transport systems can be sustained under which cultural conditions? The relationship between HCD and some urban travel patterns such as the mode choices (individual transportation and public transportation), car ownership, and infrastructure accessibility (road infrastructure per capita) is demonstrated. In addition, the relationship between culture and some demographic indicators (population density and GDP per capita) closely associated with travel choices is checked. The following section motivates data collection for this work and explains the principle data processing steps. The analysis and results are presented and discussed in
Section 3, while the discussions and conclusions in
Section 4 summarize the main findings.
2. Data Collection and Processing
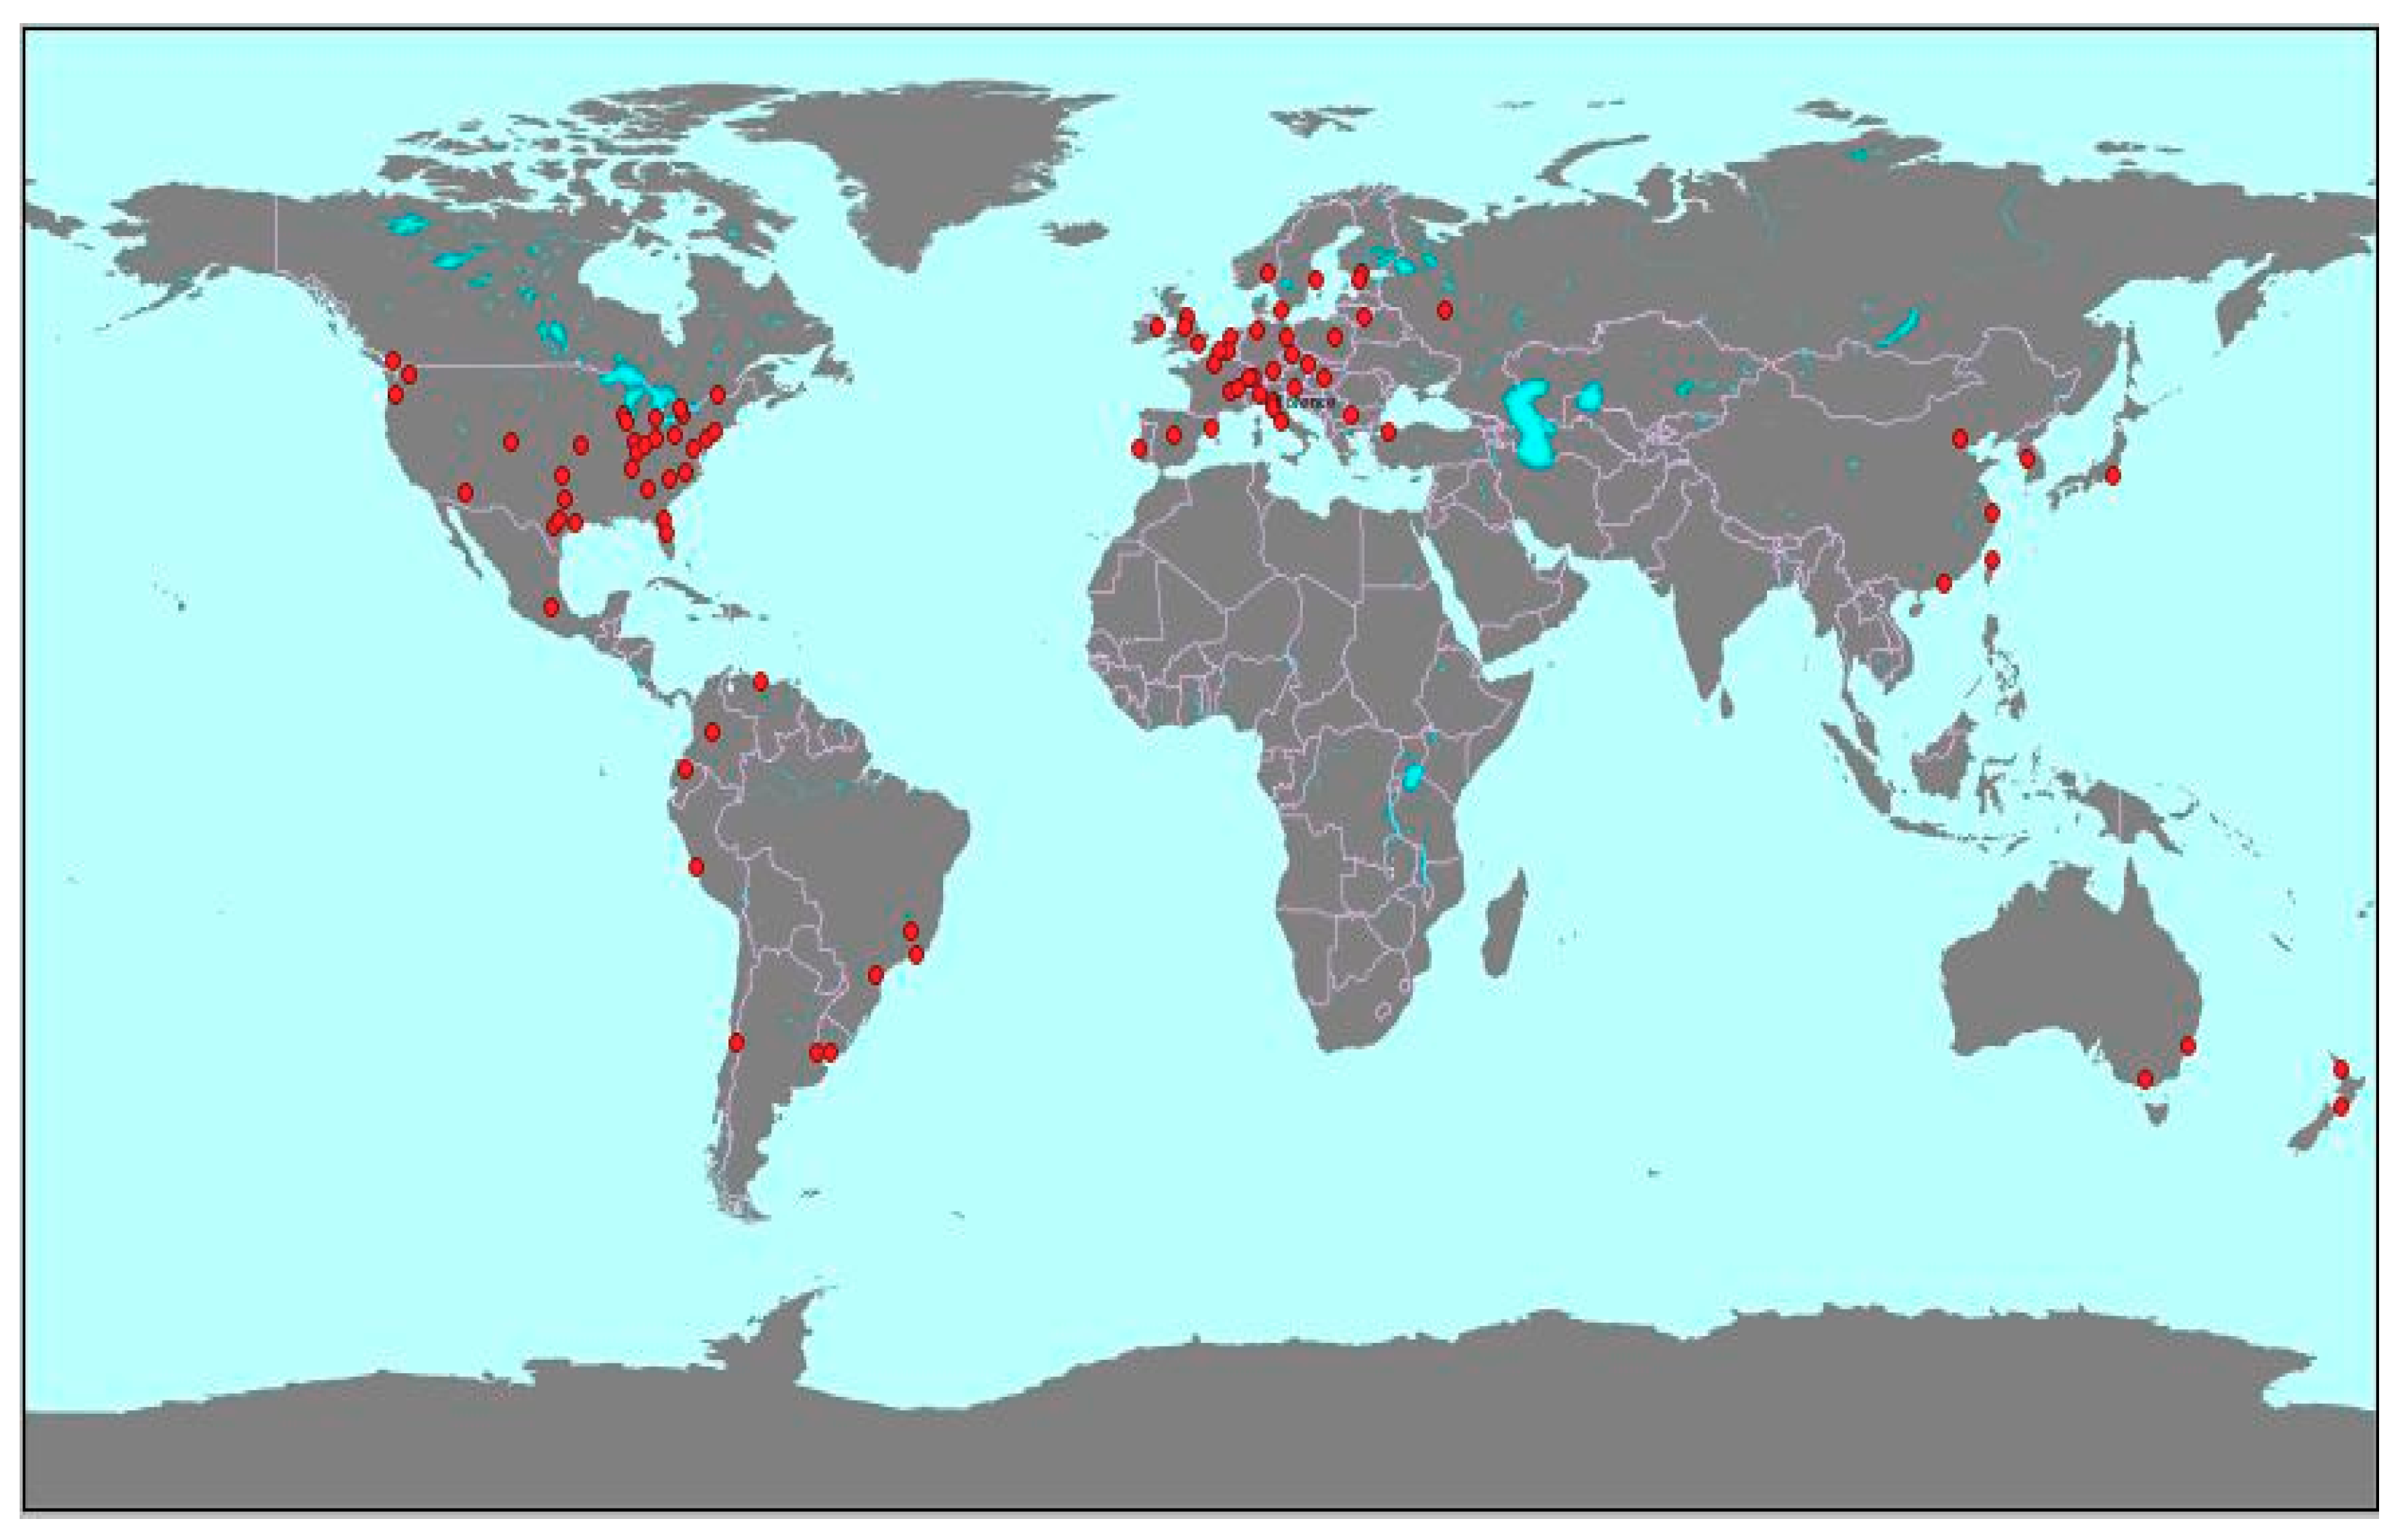
The general approach of this work was to collect, process, correlate, and model publicly available and comparable data from a large number of cities around the world. A variety of 87 sample cities from 41 countries were examined. The worldwide distribution of sample cities is shown in
Figure 1. In this section, the sources, the collection method, and pre-processing steps of all necessary information are explained.
2.1. Mobility-Related Data
Commuting mode choices for the cities were collected from a variety of different sources. Data for private car mode share and public transport mode share in percentages were extracted from the sources (
American Fact Finder 2018;
Development Bank of Latin America 2019;
Eurostat 2018;
LTA Academy 2011,
2014;
Sootfreecities 2018;
Urban Land Institute 2011;
Urbanage 2018;
EPOMM 2018;
Fietsberaad 2009;
APA-OTS 2018;
Brno Municipality 2012;
Vilnius Gediminas Technical University 2011;
Australian Bureau of Statistics, Australian Government 2016;
Statistics Canada 2018;
Dipartimento Programmazione Settore Statistica, Comune di Bologna 2014) for 57 cities between 2008–2016. Modal split data were extracted as the most recent national mobility survey from regional and governmental open sources. Data stemming from different years can lead to compatibility problems. However, the specific data are not available for same years for such a large and diverse sample of cities. On the other hand, travel behavior is not likely to change in short-term periods as transformations of urban form and infrastructure take a long time. For this reason, it is assumed that the mobility data can be collected within an 8-year period, without running into severe compatibility problems. Actual car ownership (CO) data for cities were collected from regional STATISTICAL offices and governmental sources (
Development Bank of Latin America 2019;
Eurostat 2018;
New Zealand Stats 2018;
Fietsberaad 2009;
Vilnius Gediminas Technical University 2011;
Statistics Canada 2018) and all is expressed as car ownership per 1000 inhabitants for 87 cities. For US cities, car ownership data were sourced per household and converted to private car ownership per 1000 inhabitants using an average household inhabitants’ database (
American Fact Finder 2018). Road infrastructure accessibility was sourced from a recent study (
Dingil et al. 2018) for the majority of cities. Some of the cities’ data, where road infrastructure length was missing, were completed by extracting road lengths from Openstreetmap (OSM) using the OSMNx software package (
Boeing 2017). Road infrastructure accessibility (RIA) was calculated using the population database in (
Citypopulation 2018), in meter infrastructure per inhabitant.
2.2. Demographics-Related Data
After collecting the mobility-related data, population density for 2017 and GDP per capita were sourced from (
Dingil et al. 2018) for the majority of cities. Some of the cities’ data, where population density and GDP per capita were missing, were completed from other sources (
Citypopulation 2018;
Brookings Institute 2018;
OECD 2018). All GDP per capita values are expressed in American dollars, with an average value of the years 2010–2014.
2.3. Culture-Related Data
The value of five different culture dimensions (IND/COL, POD, UNC, MAS/FEM, LTO, and INDG) of countries based on Hofstede’s cultural dimensions theory were sourced from Hofstede-insights.com for 41 countries. HCD was scored on a scale of 0–100. However, cities from the same country have similar travel patterns; an average value of variants was taken summing the cities’ data from the same countries. All countries represent an average indicator value of their cities in availability of data.
3. Analysis and Results
This section describes the analysis of the effect of culture dimensions on travel patterns in the investigated cities. First, correlations between culture dimensions and mobility indicators were checked with the collected data. Thereafter, travel patterns were modeled based on culture indicators.
3.1. Correlations
As the database is original numeric, which shows normal distribution, the Pearson correlation was used in this section. The Pearson correlation coefficients between different indicators are shown in
Table 1 and
Table 2. The software IBM SPSS 25 was used for Pearson correlation analyses of variables, while the 95% confidence level over 0.2 correlation was taken into account.
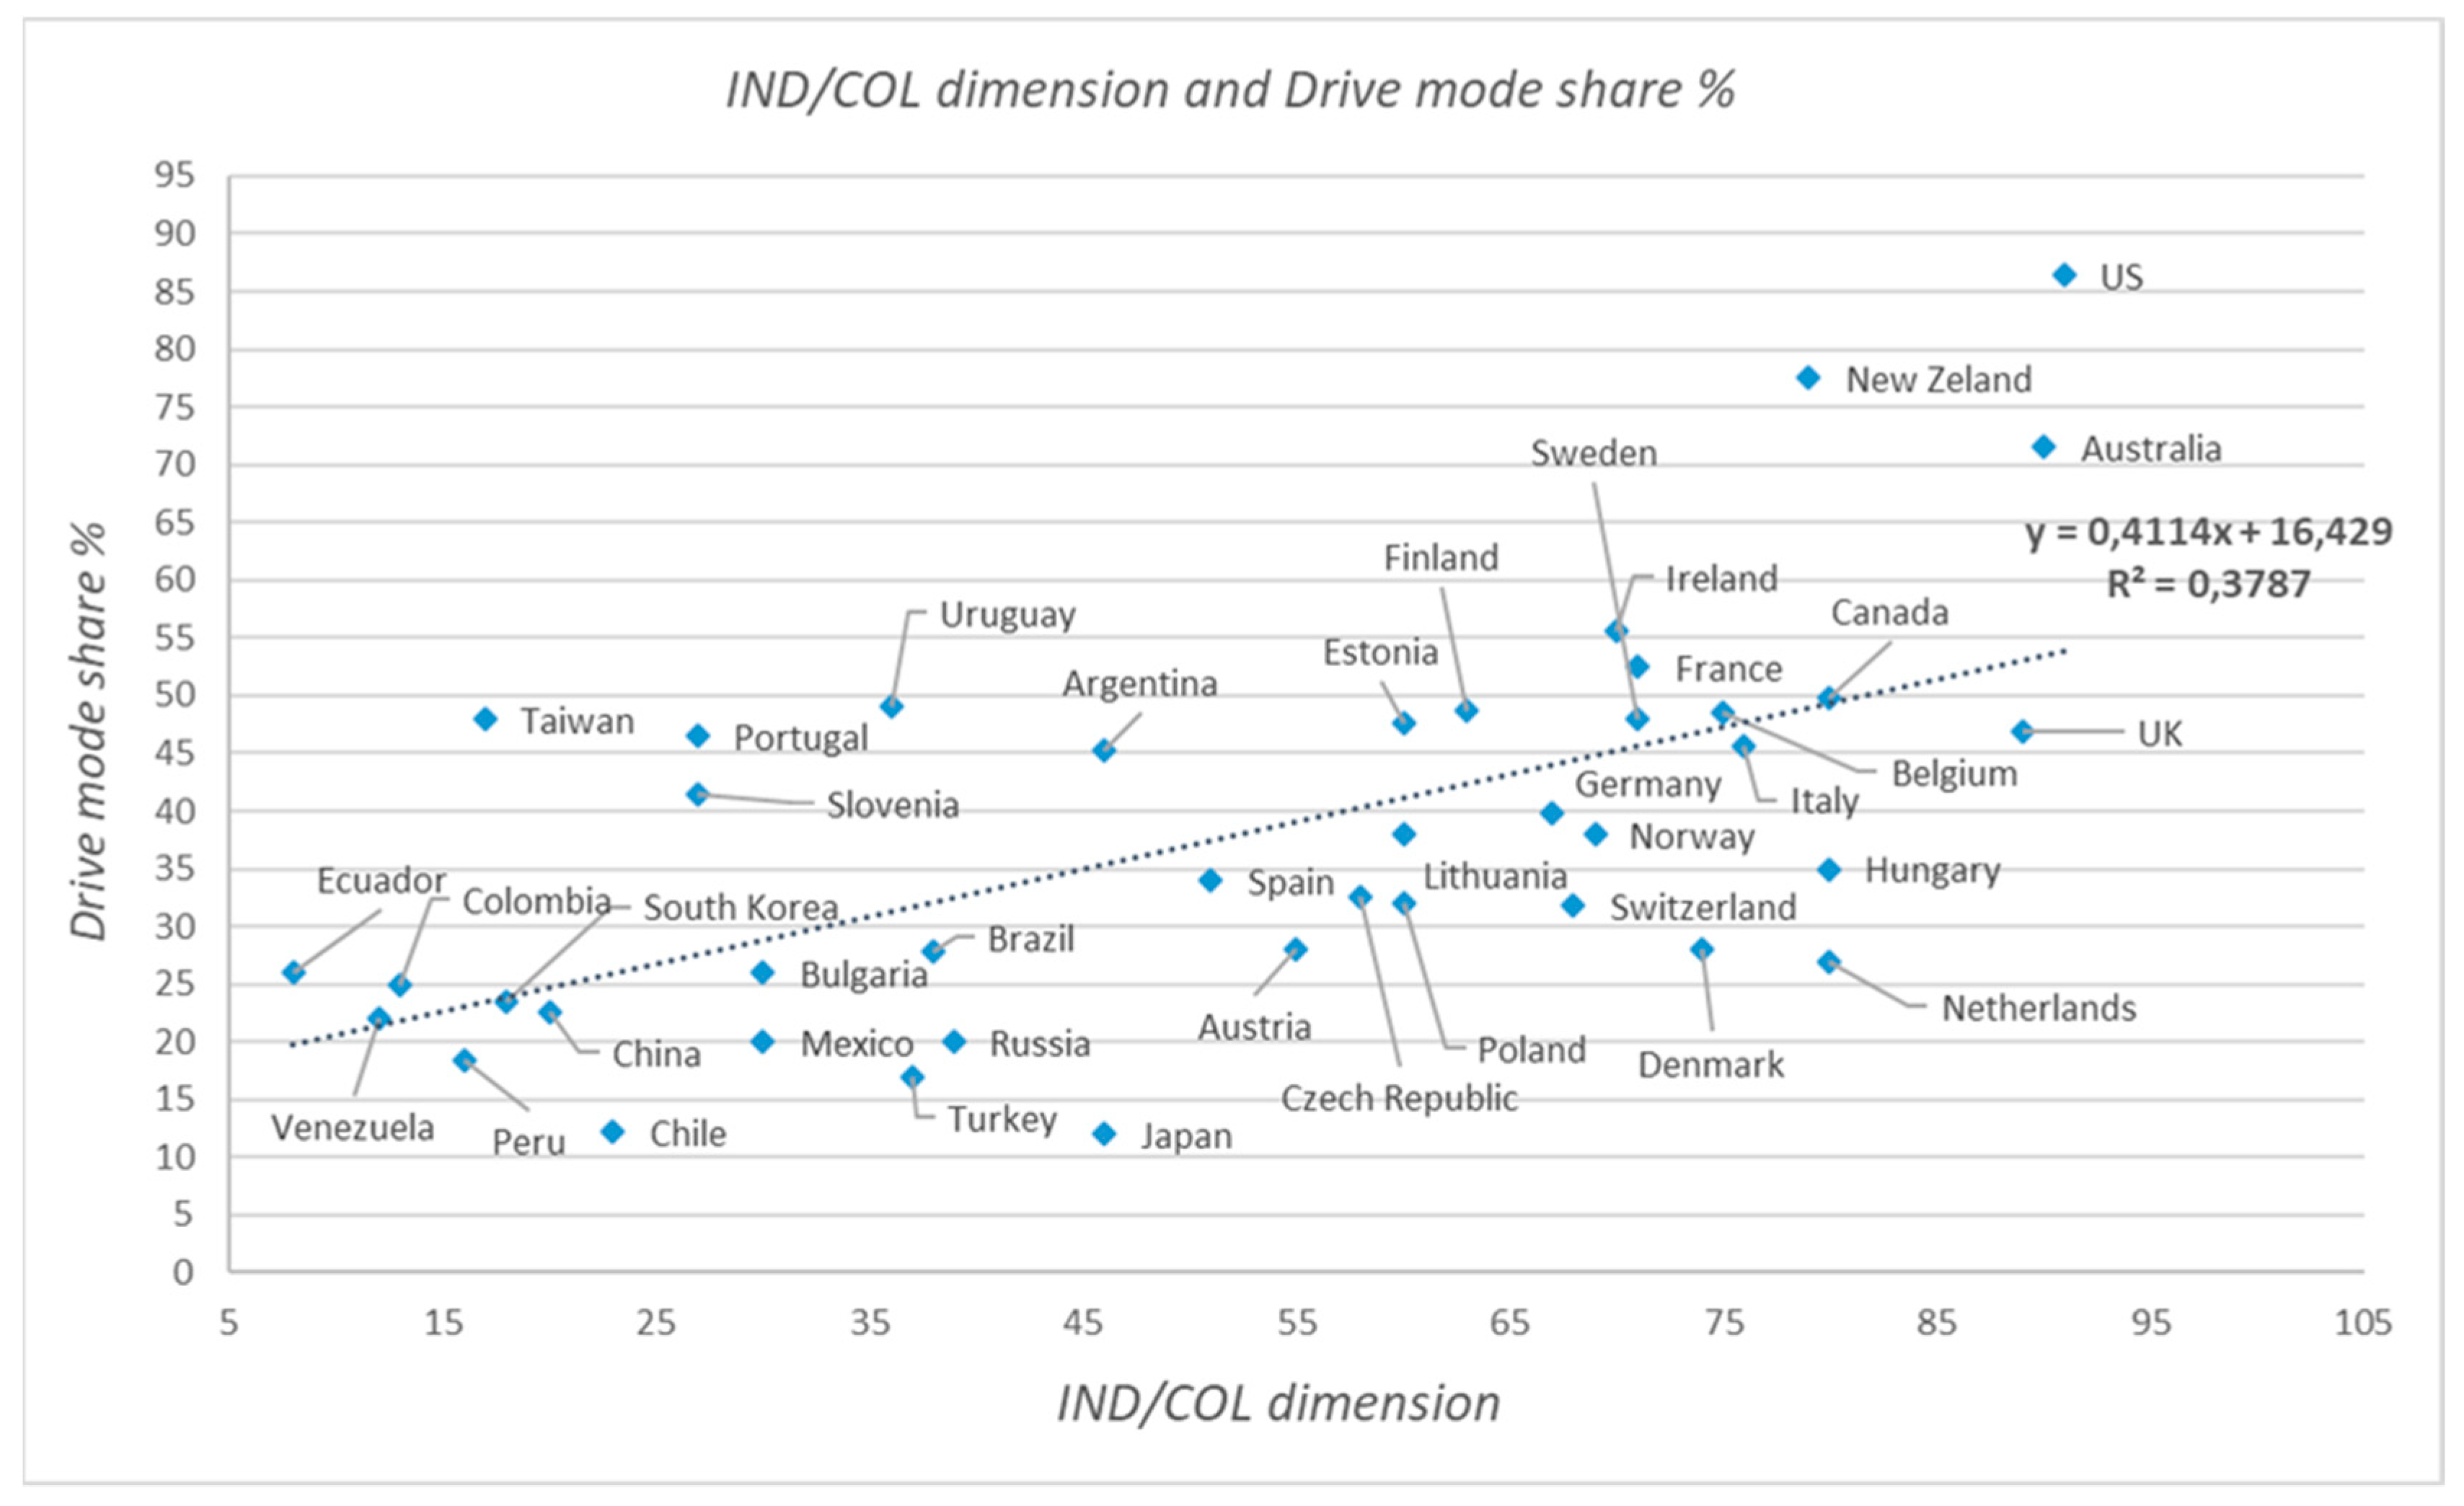
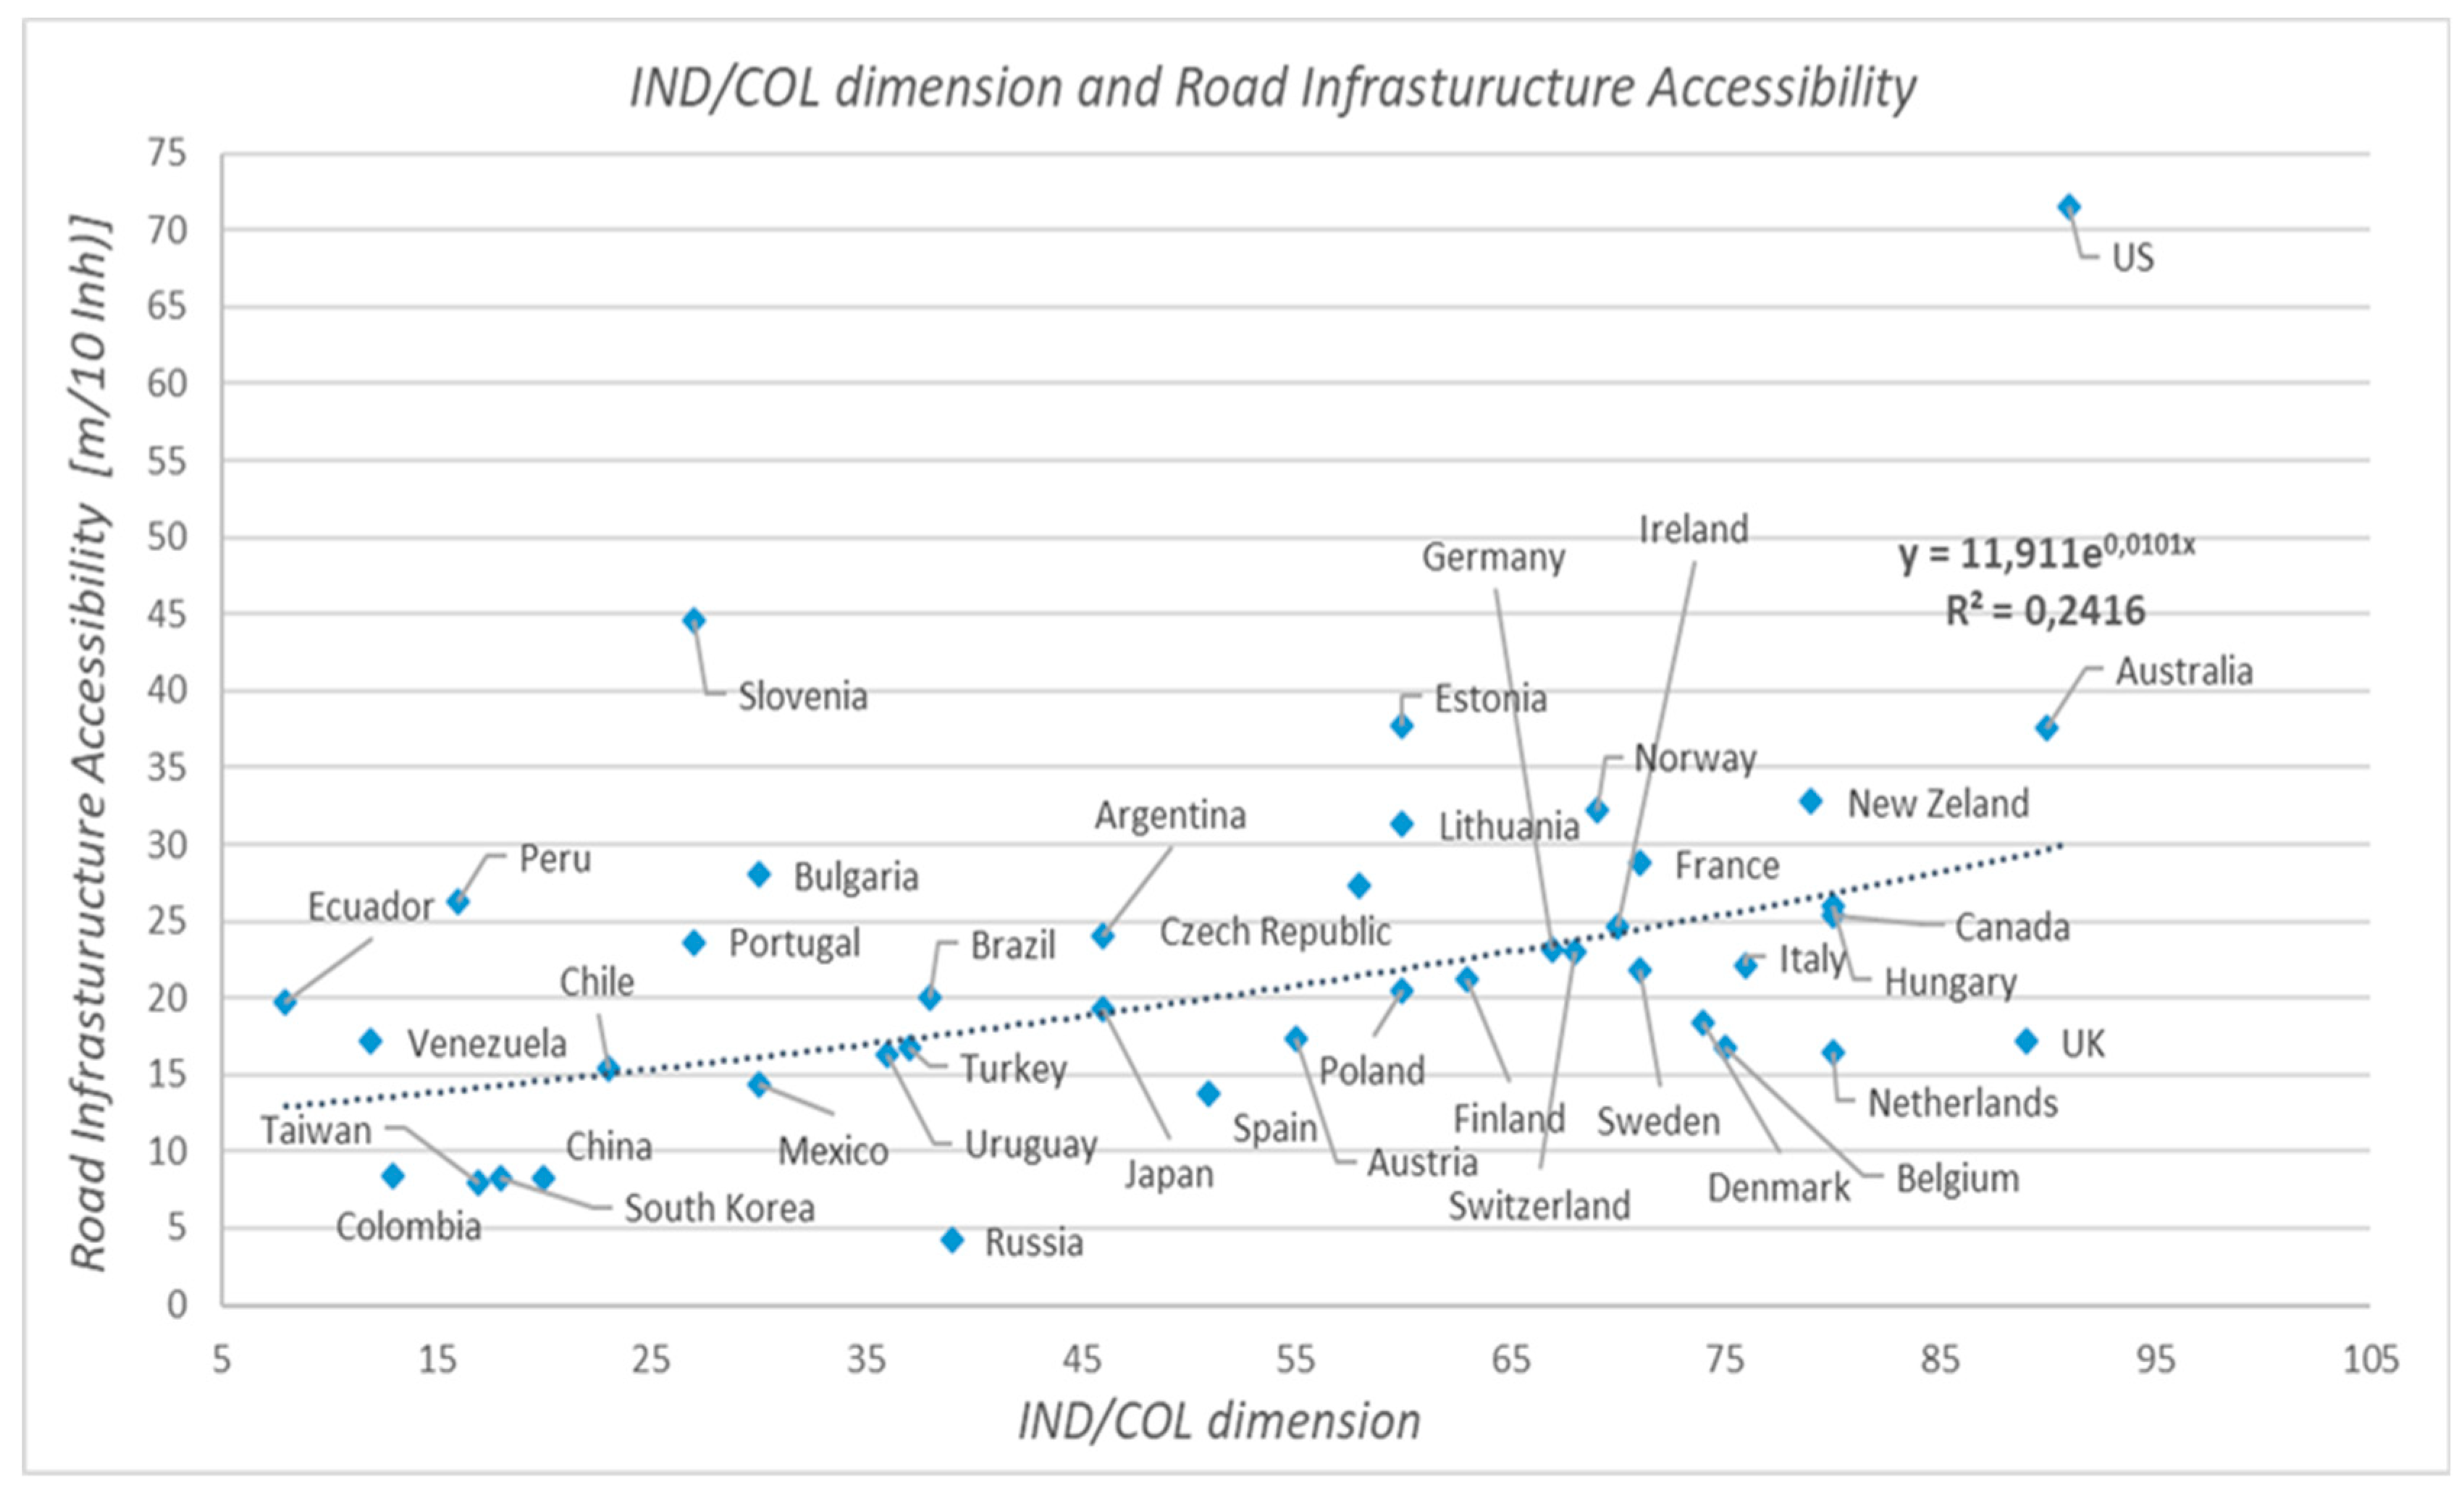
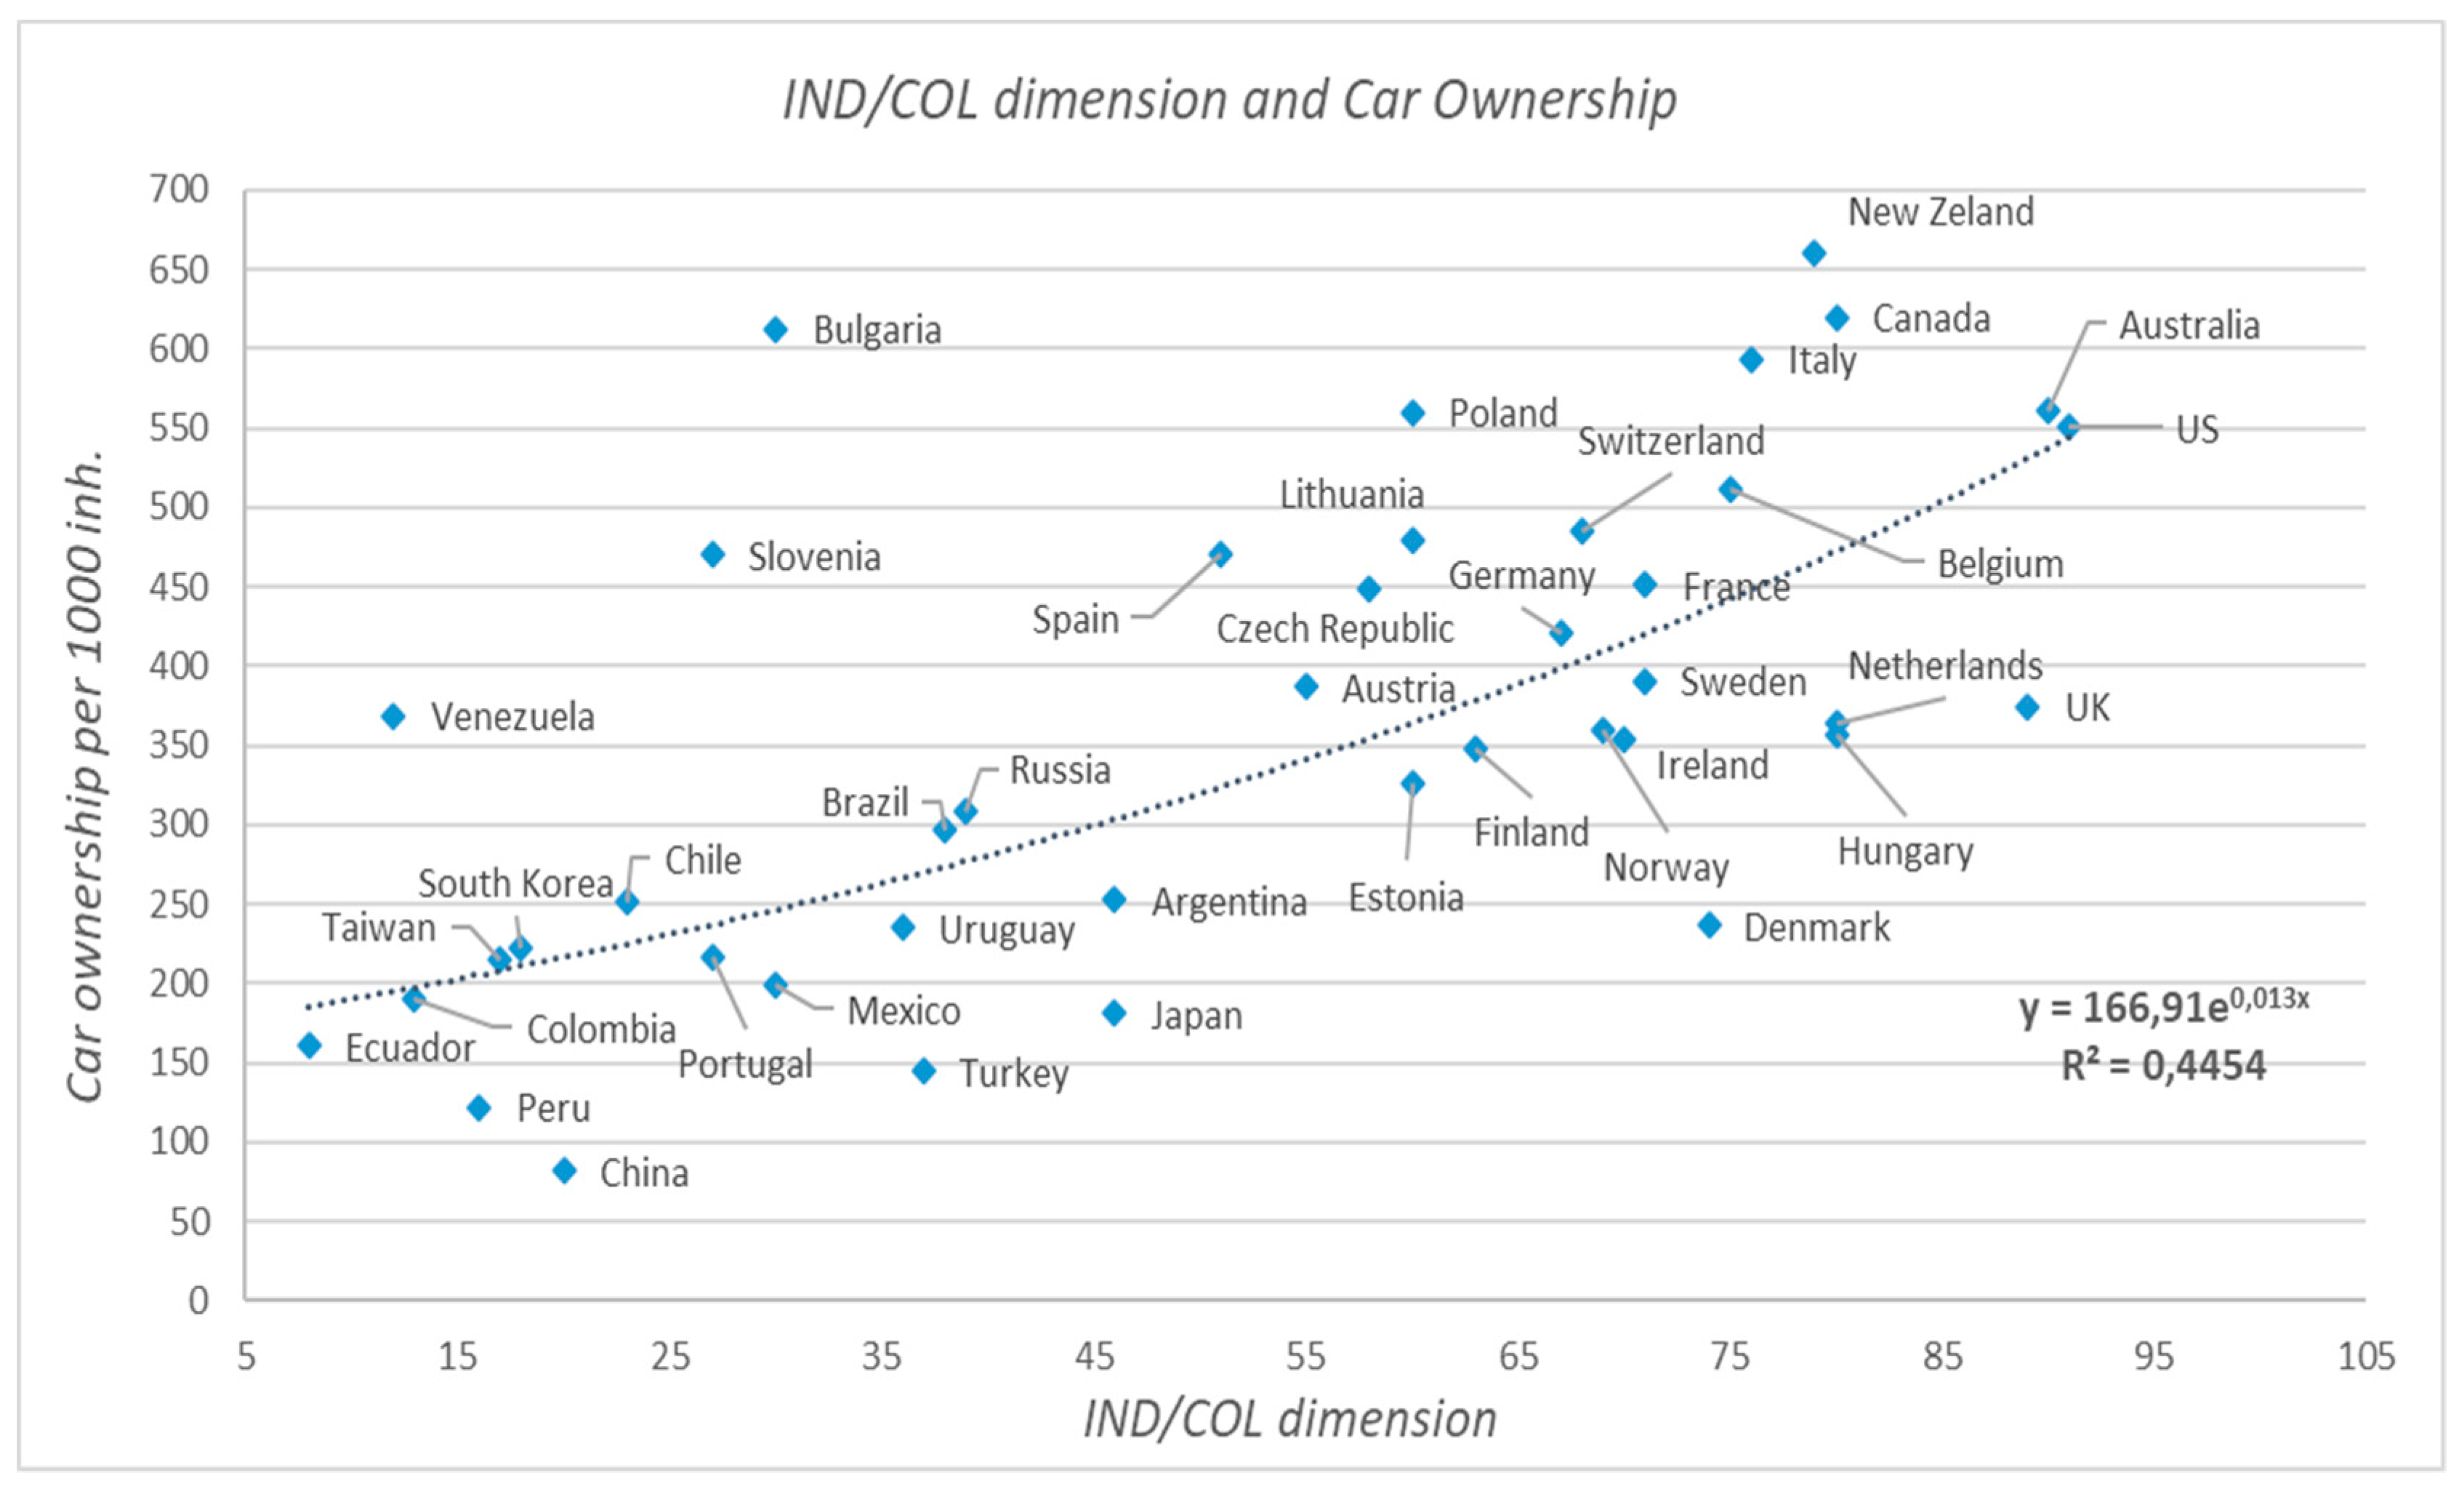
Table 1 shows that some cultural dimensions have a high influence on urban travel patterns. Correlations suggest that culture can be a valuable tool to understand why societies shape, use, and interact with their environment in different patterns. There is a strong positive relationship between individualism and GDP per capita, and a negative relationship between population density and individualism at a moderate level. It can be hypothesized that individualist communities have a higher income and prefer to live in sprawl cities at moderate levels. There is also a positive moderate relationship between individualism and road network accessibility, which suggests that individualistic societies build more roads. As seen, car ownership is higher in individualistic communities with a strong correlation (normalized correlation coefficient = 0.646). Furthermore, a strong correlation between individualism and urban travel mode choices is demonstrated for the driving mode as 0.615 and for public transit usage as −0.634. These findings suggest that individualistic societies prefer driving while collective places tend to use more public transport services.
Countries such as the US, Australia, Canada, Italy, New Zealand, and the UK have the highest individualism, while they also have the highest car mode share (%). Countries such as South Korea, Hong Kong, China, Thailand, Peru, Colombia, and Brazil have the highest collectivism, yet they have the highest public transport usage. However, it can be noticed that there are some incompatible countries such as the Netherlands and Denmark that also have high individualism but where driving and public transport mode shares are low compared to other countries. However, these countries have the highest bike usage among all countries (
Eurostat 2018). Cycling can be called as an environmentally friendly individual travel mode that may explain why it is adopted in these nations as the main mode choice. Furthermore, Hungary has high individualism and at the same time has high public transport mode share. Note that the uncertainty dimension is highly correlated with public transport usage (0.558). Hungary has one of the highest uncertainty indices with the value of 82 among all countries. As expected, power distance negatively correlated with GDP at significant levels. Inequalities in society may result in decreasing overall welfare and affect people’s choices. Power distance was also negatively correlated with car ownership, driving, and road accessibility, and positively correlated with public transport usage at a high level. Note that power distance and individualism are negatively correlated here at a very high level with the value of −0.705 as stated in Hofstede’s works. Thus, we take into account the fundamental culture dimension; IND/COL, for statistical models in the next section. LTO and indulgence dimensions did not show any significant correlation with any indicators.
Table 2 demonstrates the correlations between some transport-associated indicators and urban travel mode choices. As expected, there is a high positive correlation between GDP per capita and the drive mode share while a negative correlation is seen between public transportation usage and GDP per capita. There is a strong correlation between the drive mode share and individual transport needs (car ownership and road accessibility). On the other hand, a strong negative correlation between the public transport mode share and individual transport needs is seen. A strong correlation between mode choices and urban population density is also demonstrated. These results suggest that communities both shape their cities and in turn are shaped by them. Presumably, national culture could be the reason behind it.
3.2. Statistical Models
As the IND/COL dimension and individualistic transport indicators are well correlated, some statistical models were calibrated with the entire set of samples. The best fit between the drive mode share and the IND/COL dimension of all samples is achieved with a linear function of the shape:
The best fit between car ownership and IND/COL as well as between RIA and IND/COL of all samples is achieved with an exponential function of the shape:
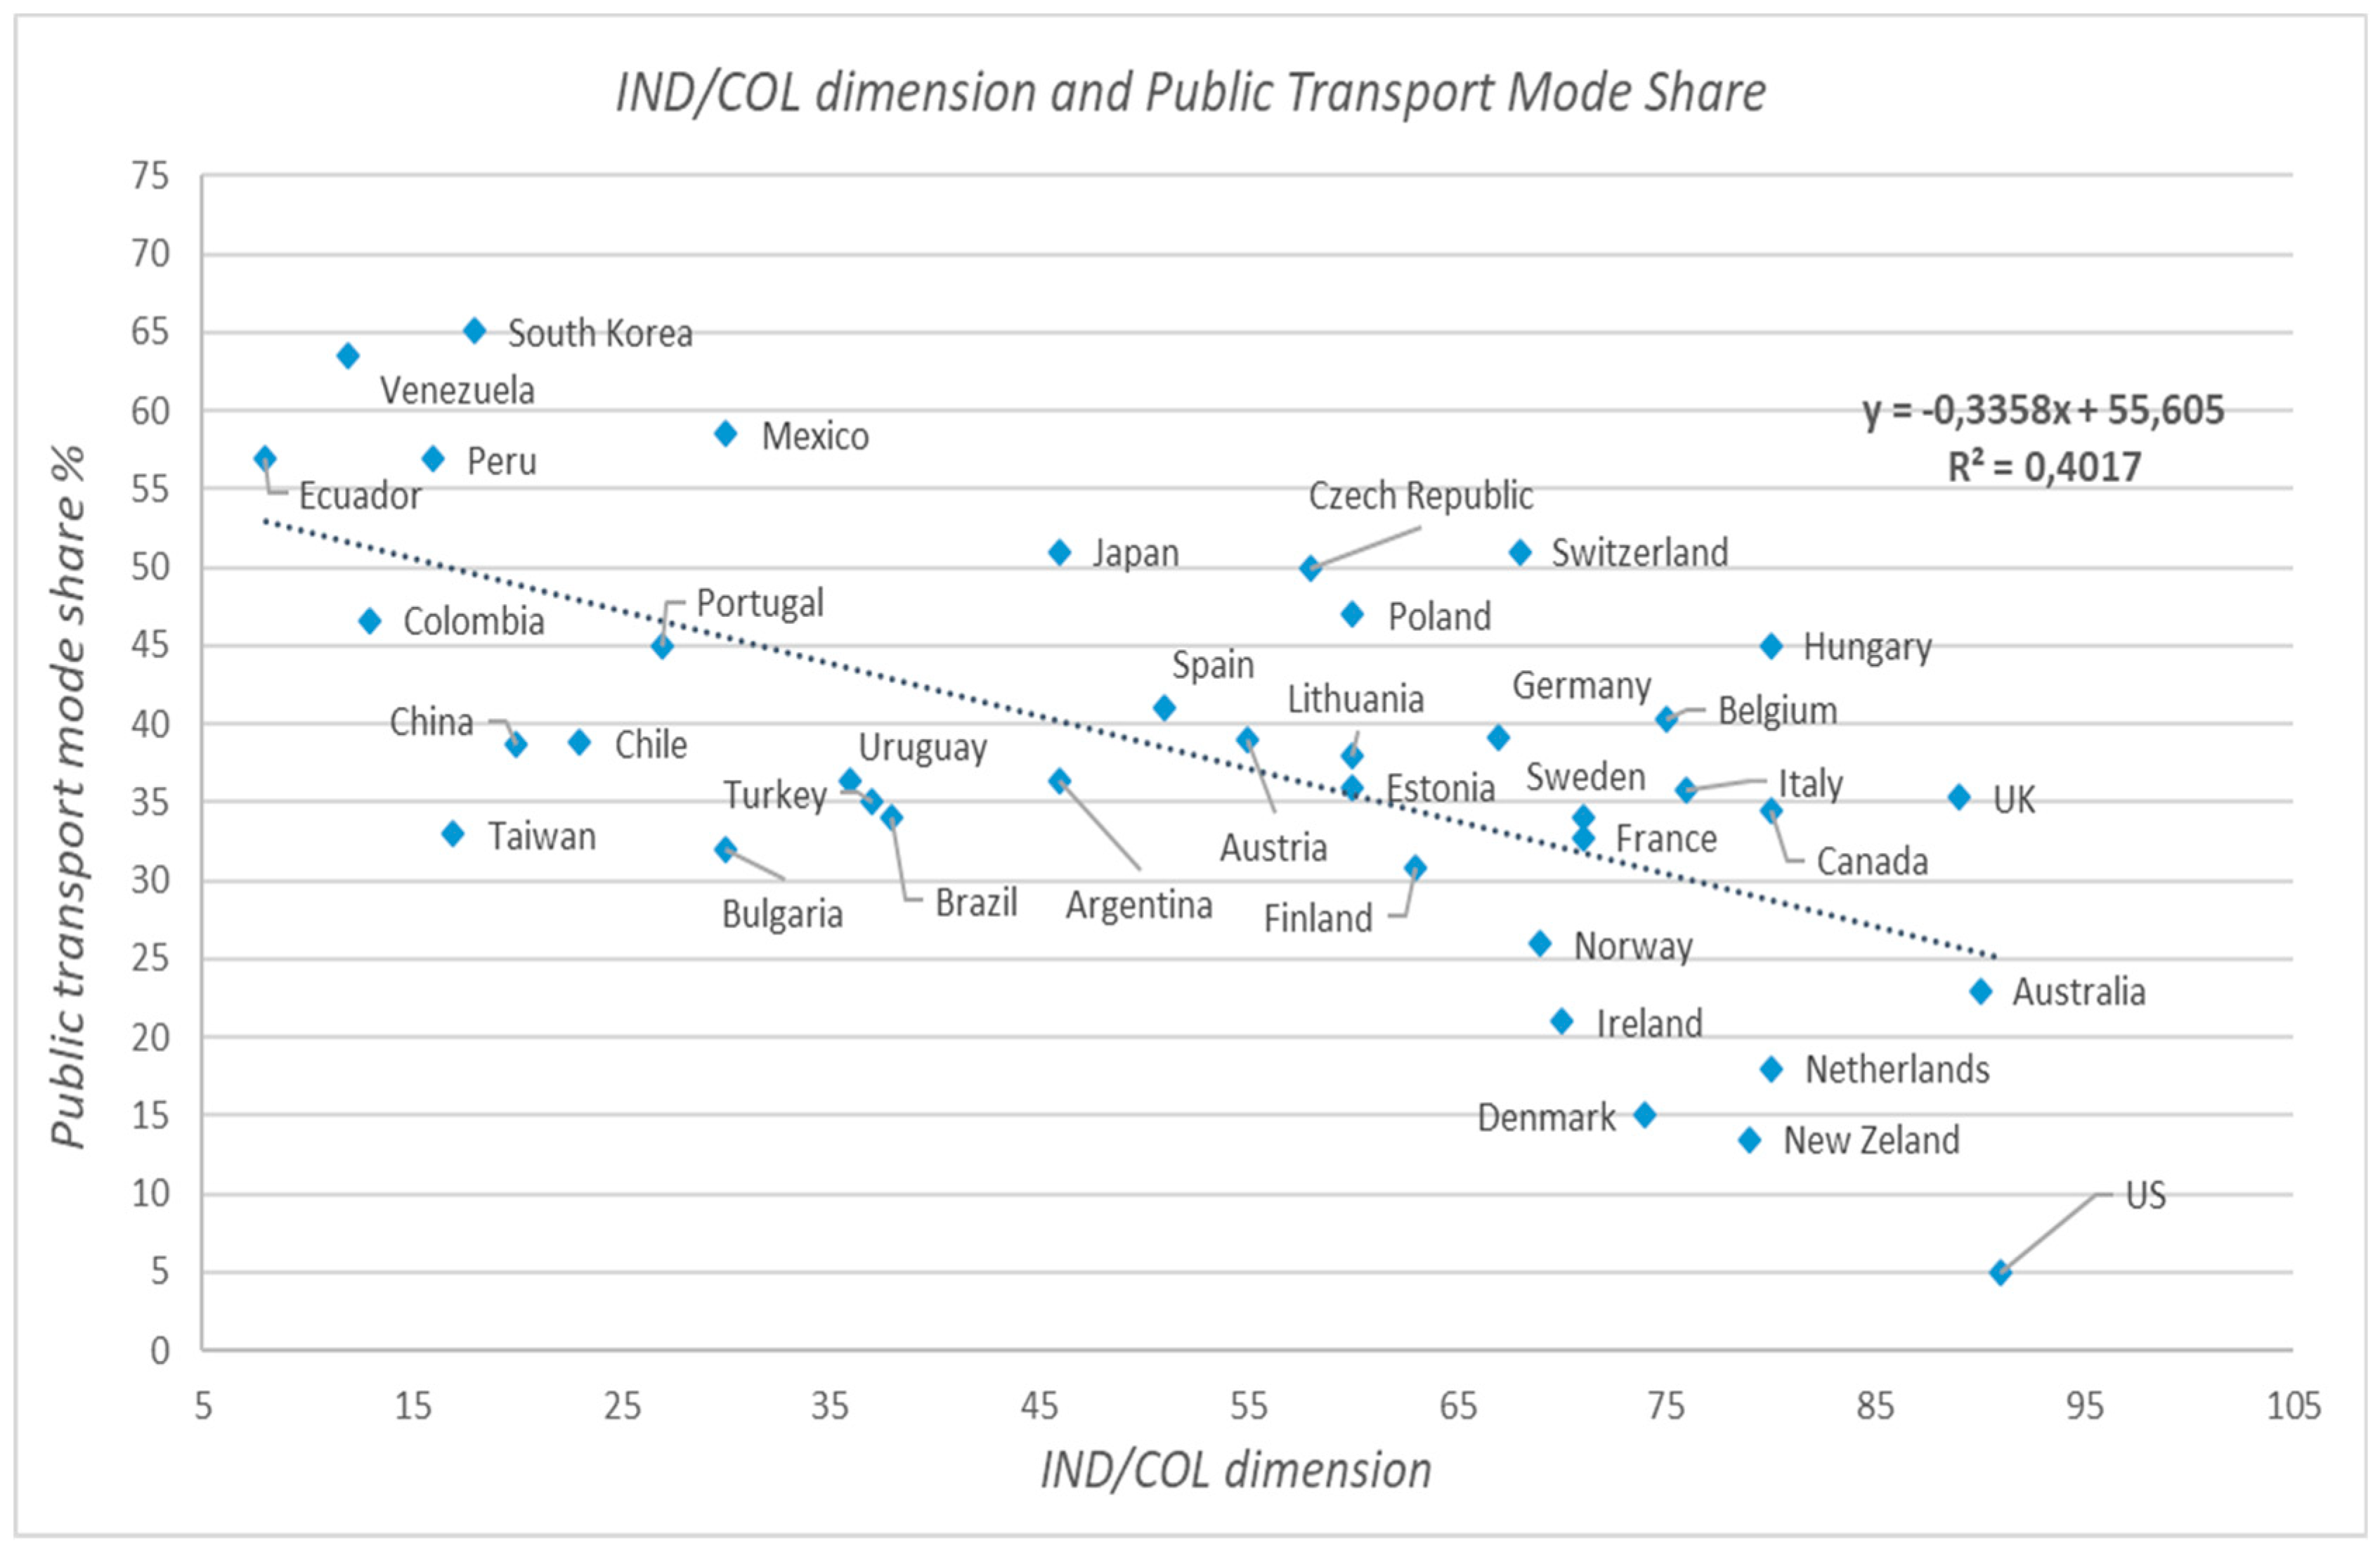
However, the fitting errors with a linear model are only slightly superior. The IND/COL dimension and public transport also share are negatively well correlated, as well as public transport share is considerably correlated with the uncertainty dimension and moderately correlated with masculinity compared with individual travel indicators. The best fit between public transport mode share and IND/COL of all samples is achieved with a linear function of the shape:
To better explain public transport choices in societies, a further model was built with the entire set of samples, which includes individualism, uncertainty, and masculinity that do have a significant effect on public transport usage:
The coefficients d, e, and f quantify the effects on public transport usage due to an increase/decrease in independent variables.
Table 3,
Table 4,
Table 5,
Table 6 and
Table 7 demonstrate quantifications as the results of
t-tests for linear regression models.
As seen from
Table 3,
Table 4,
Table 5,
Table 6 and
Table 7, the IND/COL dimension has a high influence on urban travel patterns at perfect significance. The highest influence of individualism is seen on car ownership. Communities with high individualism shape travel environments for individual transportation and in turn, these areas are developed by individualistic travel needs. A decrease in individualism means an increase in collectivism in society. It is seen in
Table 6 that an increase in collectivism results in greater usage of public transport.
Table 7 demonstrates the results of the multiple linear regression model on the prediction of public transport mode share.
is higher than linear function model Equation (4) and all coefficients are significant.
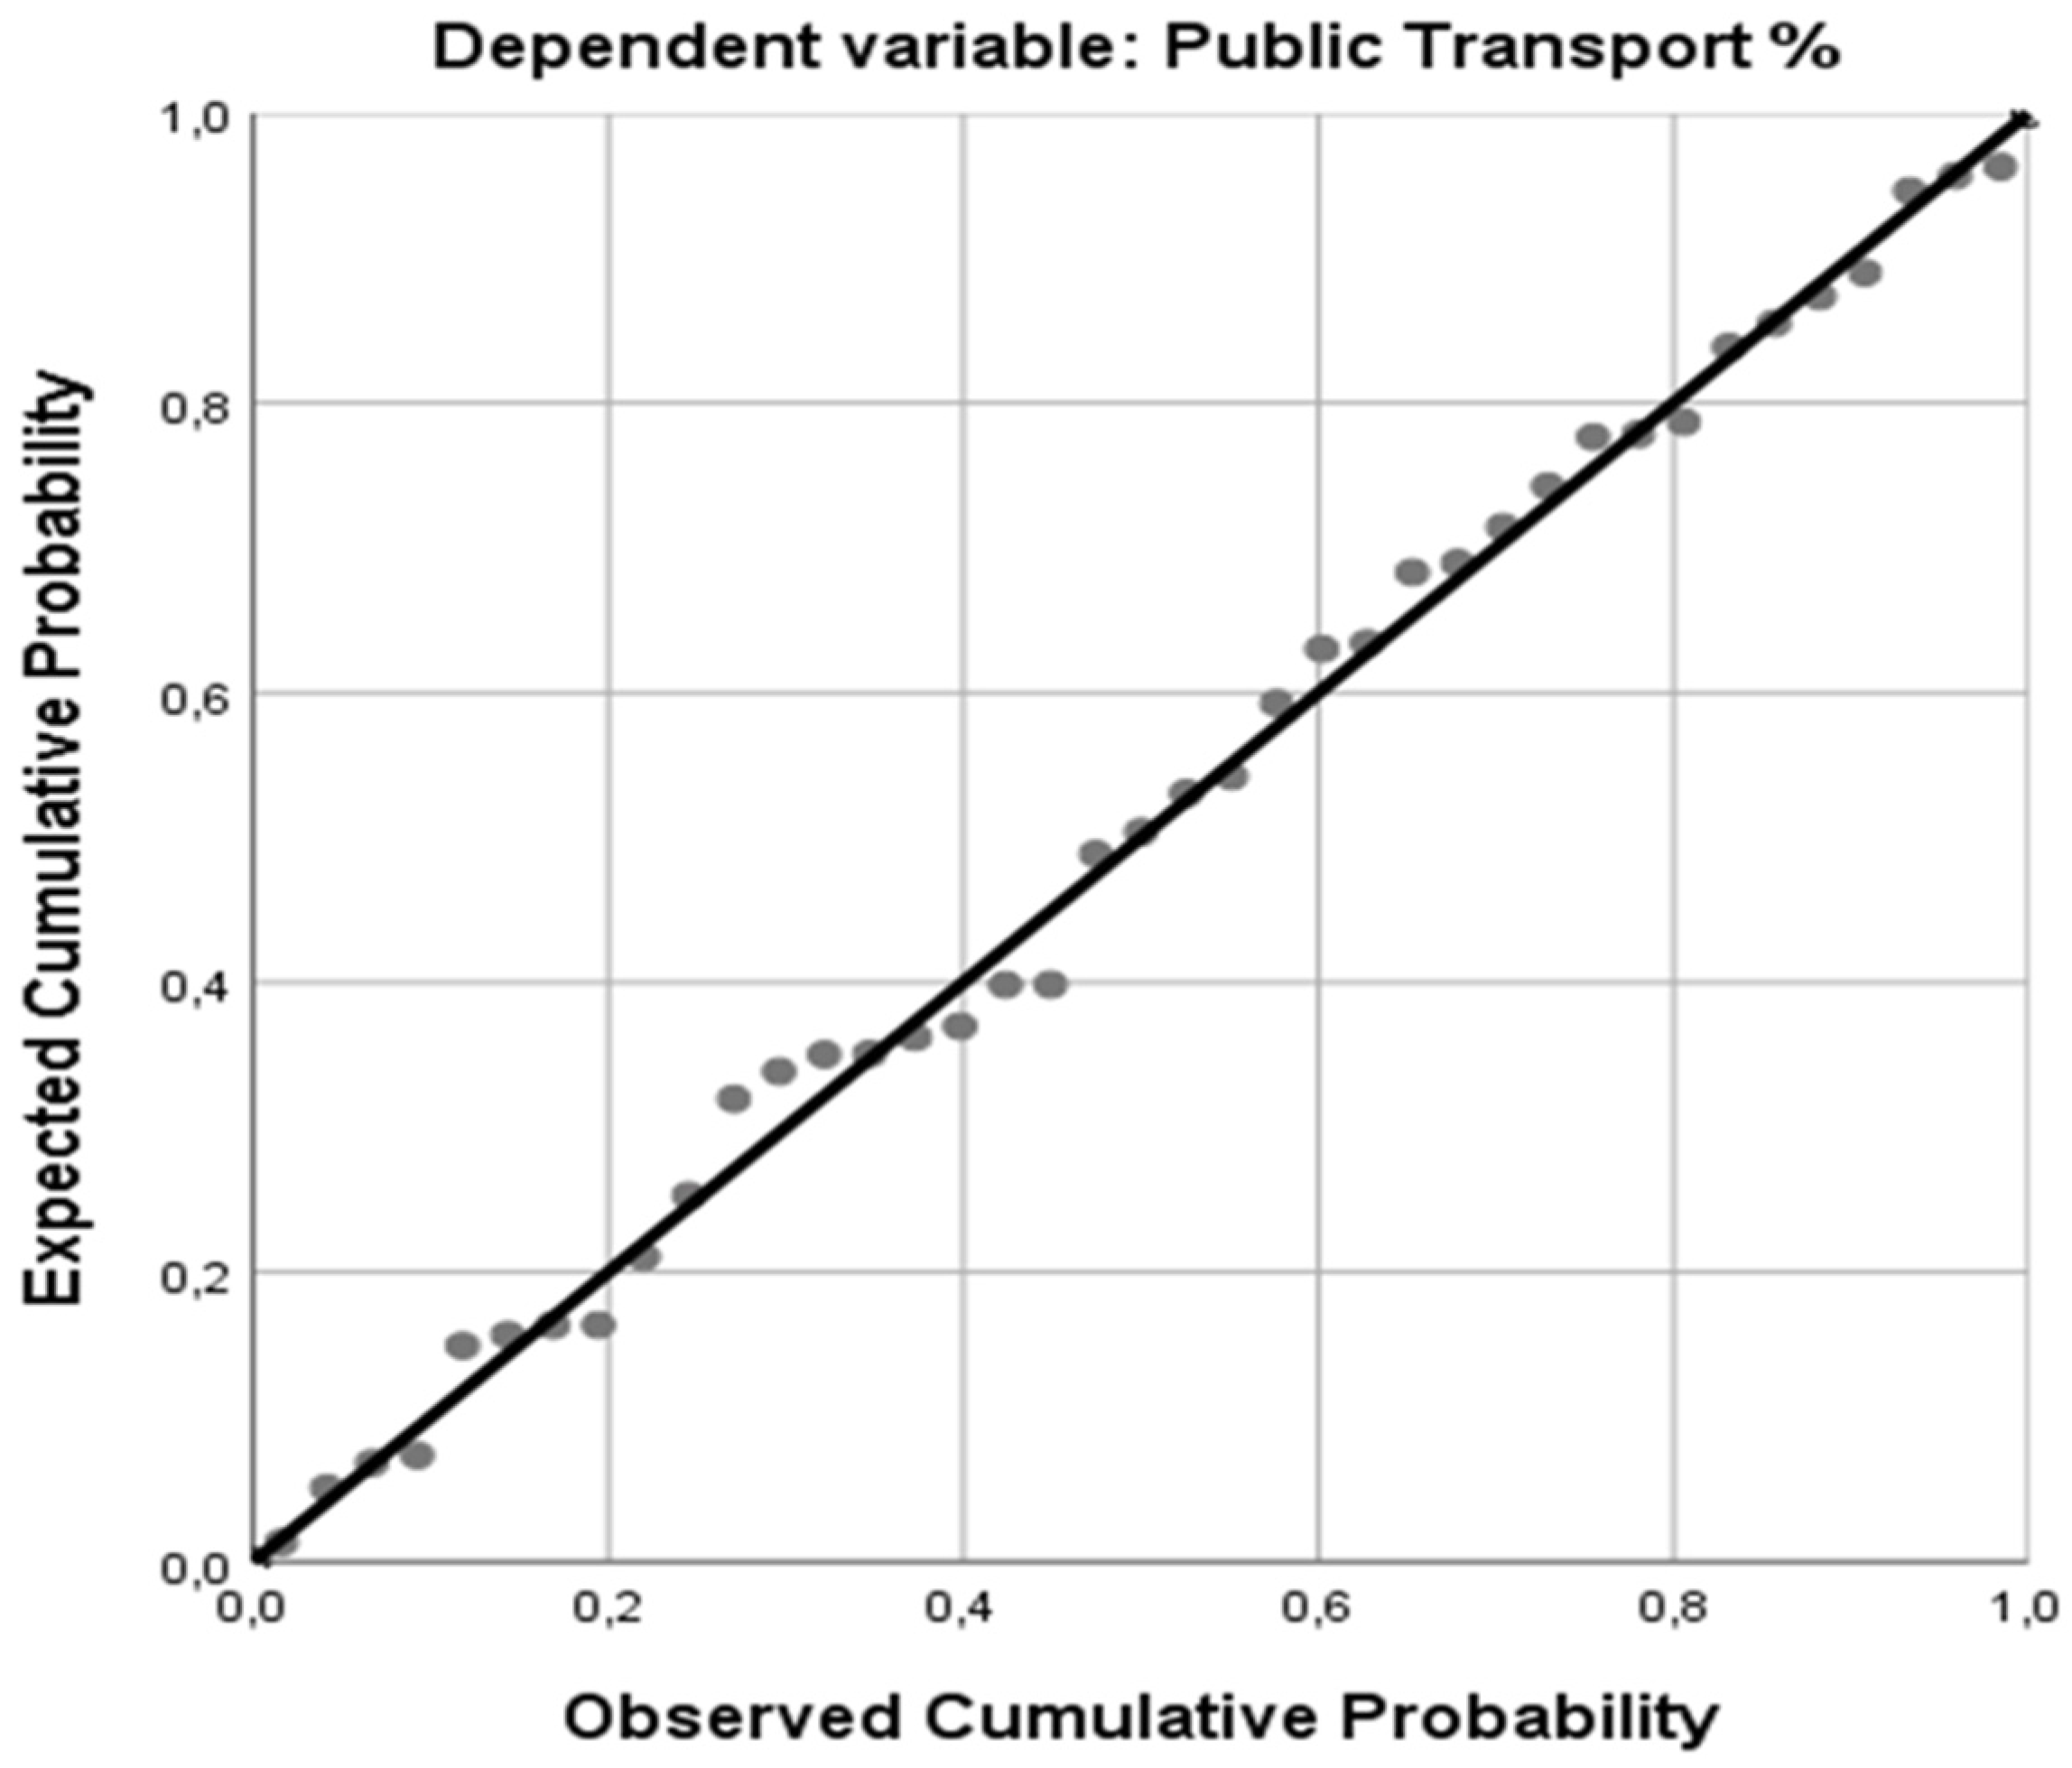
Figure 6 shows a normal P-P plot of regression standardized residual for linear function model Equation (5). The plot demonstrates that the residuals of multiple regression follow a normal distribution. The results of the model indicate that in case of nations, an increase in tree culture dimensions: collectivism, uncertainty, and masculinity results in greater usage of public transport. Masculinity and uncertainty dimensions have a similar level of influence on public transport usage, which is less than an increase in individualism does decrease public transport usage.
4. Discussions and Conclusions
The limited literature availability about the culture effect on travel behavior analysis generates a gap. No macroscopic analyses of the relationship between national culture and urban travel patterns have been previously conducted. In this study, 87 cities distributed over 41 countries have been analyzed to investigate the relationship between culture dimensions and urban travel patterns. Furthermore, the relationship between culture and some demographic indicators (population density and GDP per capita) closely associated with travel choices was demonstrated. In addition, the relations between urban travel mode choices (drive and public transport) and some transport-associated indicators are shown.
Some countries showed very high individualism and very low driving such as the Netherlands, Denmark, and Hungary. The Netherlands and Denmark have adopted biking for urban transportation for a long time already. Cycling can be called an environmental friendly individual travel mode. This suggests that urban planners and policy makers should consider adaptation of the biking infrastructure to reduce car-dependent transportation in countries with high individualism. Perhaps, culture may explain why public transportation is unsuccessful on patronage in places with high individualism. However, the study has not covered quantitatively the role of cycling and bicycle infrastructure as the bike share has not been available for most cities, which impede to draw a certain conclusion. Hungary has one of the highest uncertainties among all countries with high usage of public transport. Uncertainty has the second highest influence on public transport usage after collectivism. This result suggests that investments in public transportation can be a good option for places with high collectivism and high uncertainty to prevent car-dependent mobility.
One limitation of the presented models is surely the use of culture on a country level. Describing culture on a country level is the only choice for now, while there is not any culture scale for cities. Errors may occur due to possible issues related to group effects where several cities from the same country are included, thus this situation impedes more refined analysis. Errors may also happen for that a representative selection of the population may be diverse in terms of the nation as some cities have multinational community. Compatibility problems related to data stemming from different years and mixing data from several open sources are other limitations.
Considering the many error sources and limitations mentioned, good correlation values have been obtained between Hofstede’s fundamental culture dimensions: IND/COL and travel patterns were demonstrated with a reasonably good fit. The analysis shows that countries with higher individualism scores have built more individualistic transport-related environments, which in turn result in more driving. On the other hand, collective nations tend to use more public transportation. It is also seen that uncertainty and masculinity culture dimensions have a considerable effect on public transportation usage. There is significant evidence that, in case of nations, an increase in tree culture dimensions: collectivism, uncertainty, and masculinity results in greater usage of public transport. However, the highest influence on public transportation usage is via the IND/COL dimension. Lastly, this study demonstrates that culture could be a key tool in urban transportation planning. If we can predict which alternative transport systems could be adopted in a city at peace, we can achieve sustainability in urban transportation.
Author Contributions
Conceptualization, A.E.D. and F.R.; Methodology, A.E.D. Software, A.E.D.; Validation, A.E.D.; Analysis, A.E.D.; Investigation, A.E.D.; K.A.; Data Curation, A.E.D.; Writing—Original Draft Preparation, A.E.D.; K.A.; Writing—Review & Editing, F.R.; J.S. and Z.S.; Visualization, A.E.D.; Supervision, F.R.; J.S. and Z.S.
Funding
This research received no external funding.
Conflicts of Interest
The authors declare no conflict of interest.
References
- American Fact Finder. 2018. Database. Available online: https://factfinder.census.gov/faces/nav/jsf/pages/searchresults.xhtml?refresh=t (accessed on 13 February 2019).
- APA-OTS. 2018. Dataset. Available online: https://www.ots.at/presseaussendung/OTS_20150210_OTS0091/modal-split-2014-radfahren-in-wien-immer-beliebter (accessed on 13 February 2019).
- Ashmore, David, Nicola Christie, and Nicholas Tyler. 2017. Symbolic transport choice across national cultures: Theoretical considerations for research design. Transportation Planning and Technology 40: 875–900. [Google Scholar] [CrossRef]
- Ashmore, D. P., D. Pojani, R. Thoreau, N. Christie, and N. A. Tyler. 2018. The symbolism of ‘eco cars’ across national cultures: Potential implications for policy formulation and transfer. Transportation Research Part D: Transport and Environment 63: 560–75. [Google Scholar] [CrossRef]
- Australian Bureau of Statistics, Australian Government. 2016. Available online: http://stat.data.abs.gov.au/ (accessed on 15 January 2019).
- Beugelsdijk, S., and C. Welzel. 2018. Dimensions and Dynamics of National Culture: Synthesizing Hofstede with Inglehart. Journal of Cross-Cultural Psychology 49: 1469–505. [Google Scholar] [CrossRef] [PubMed]
- Boeing, G. 2017. OSMnx: New Methods for Acquiring, Constructing, Analyzing, and Visualizing Complex Street Networks. Computers, Environment and Urban Systems 65: 126–39. [Google Scholar] [CrossRef]
- Brno Municipality. 2012. Available online: https://www.brno.cz/fileadmin/user_upload/sprava_mesta/magistrat_mesta_brna/OD/dokumenty_OKD/delba_prepravni_prace/Delba_prepravni_prace_2012.pdf (accessed on 12 December 2018).
- Brookings Institute. 2018. Global Metro Monitor. Available online: https://www.brookings.edu/research/global-metro-monitor/ (accessed on 14 February 2019).
- Citypopulation. 2018. Database. Available online: www.citypopulation.de (accessed on 14 February 2019).
- Development Bank of Latin America (CAF). 2019. Database. Available online: https://www.caf.com/es/conocimiento/datos (accessed on 13 February 2019).
- Dingil, A. E., J. Schweizer, F. Rupi, and Z. Stasiskiene. 2018. Transport indicator analysis and comparison of 151 urban areas, based on open source data. European Transport Research Review (ETRR) 10: 58. [Google Scholar] [CrossRef]
- Dipartimento Programmazione Settore Statistica, Comune di Bologna. 2014. Gli spostamenti quotidiani per studio e lavoro. Available online: http://www.comune.bologna.it/iperbole/piancont/dati_statistici. (accessed on 10 February 2019).
- EPOMM. 2018. Database. Available online: http://www.epomm.eu/tems/result_city.phtml?city=341&list=1 (accessed on 10 February 2019).
- European Environment Agency (EEA). 2009. TERM 2008: Indicators Tracking Transport and Environment in the European Union. Copenhagen: EEA. [Google Scholar]
- Eurostat. 2018. Database. Available online: http://ec.europa.eu/eurostat/web/cities/data/database?p_p_id=NavTreeportletprod_WAR_NavTreeportletprod_INSTANCE_KhPDfq283AOB&p_p_lifecycle=0&p_p_state=normal&p_p_mode=view&p_p_col_id=column-2&p_p_col_count=1 (accessed on 15 February 2019).
- Fietsberaad. 2009. Bicycle Policies of the European Principals: Continuous and Integral. Available online: http://nia1.me/hc (accessed on 1 March 2019).
- Hofstede, G. 1979. Value System in Forty Countries: Interpretation, Validation, and Consequences for Theory. In Cross-Cultural Contributions to Psychology. Edited by L. H. Eckensberger, W. J. Lonner and Y. H. Poortinga. Lisse: Swets and Zeitlinger. [Google Scholar]
- Hofstede, G. 1980. Culture’s Consequences: International Differences in Work-Related Values. Beverly Hills: Sage. [Google Scholar]
- Hofstede, G. 2001. Culture’s Consequences, 2nd ed.Thousand Okas: Sage Publications. [Google Scholar]
- Hofstede, G., and M. H. Bond. 1988. The Confucius Connection: From Cultural Roots to Economic Growth. Organizational Dynamics 16: 5–21. [Google Scholar] [CrossRef]
- Hofstede, G., G. J. Hofstede, and M. Minkov. 2010. Cultures and Organizations: Software of the Mind, 3rd ed. New York: McGraw-Hill. [Google Scholar]
- Inglehart, R. 1997. Modernization and Postmodernization: Cultural, Economic, and Political Change in 43 Societies. Princeton: Princeton University Press. [Google Scholar]
- LTA (Land Transport Authority) Academy. 2011. Passenger Transport Mode Shares in World Cities. In Journeys—Sharing Urban Transport Solutions. Singapore: Land Transport Authority, Issue 7. [Google Scholar]
- LTA Academy. 2014. Passenger Transport Mode Shares in World Cities. JOURNEYS. Available online: http://www.lta.gov.sg/ltaacademy/doc/J14Nov_p54ReferenceModeShares.pdf (accessed on 15 November 2018).
- New Zealand Stats. 2018. Transport Database. Available online: http://nzdotstat.stats.govt.nz/wbos/Index.aspx (accessed on 10 February 2019).
- Newman, P. W. 2015. Transport infrastructure and sustainability: A new planning and assessment framework. Smart and Sustainable Built Environment 4: 140–53. [Google Scholar] [CrossRef]
- OECD. 2018. Regions and Cities Database. Available online: https://stats.oecd.org/Index.aspx?DataSetCode=CITIES (accessed on 2 February 2019).
- Paulssen, M., D. Temme, A. Vij, and J. L. Walker. 2014. Values, attitudes and travel behavior: A hierarchical latent variable mixed logit model of travel mode choice. Transportation 41: 873. [Google Scholar] [CrossRef]
- Prashker, J., Y. Shiftan, and S. Hershkovitch. 2008. Residential choice location, gender and the commute trip to work in Tel Aviv. Journal of Transport Geography 16: 332–41. [Google Scholar] [CrossRef]
- Sootfreecities. 2018. Dataset. Available online: http://www.sootfreecities.eu/sootfreecities.eu/public/measure/traffic-mobility (accessed on 15 January 2019).
- Statistics Canada. 2018. Database. Available online: http://www12.statcan.gc.ca/census-recensement/2016/dp-pd/prof/index.cfm?Lang=E&TABID=1 (accessed on 1 March 2019).
- Syam, A. 2014. Cultural Values: A New Approach to Explain People’s Travel Behaviour and Attitudes toward Transport Mode. Ph.D. thesis, University of Auckland, Auckland, New Zealand. [Google Scholar]
- Syam, A., D. Reeves, and A. Khan. 2011. The effects of cultural dimension on people’s perception about security on public transport. WIT Transactions on The Built Environment 116: 575–86. [Google Scholar]
- Urban Land Institute. 2011. A ULI Advisory Services Panel Report. Moscow: Urban Land Institute, pp. 4–9. [Google Scholar]
- Urbanage. 2018. LSE Cities Database. Available online: https://urbanage.lsecities.net/data (accessed on 8 December 2018).
- Van der Borg, Jan, and Antonio Paolo Russo. 2005. The Impacts of Culture on the Economic Development of Cities, Rotterdam: European Institute for Comparative Urban Research (EURICUR). Rotterdam: Erasmus University Rotterdam. [Google Scholar]
- Vilnius Gediminas Technical University. 2011. Report. Naujų transporto rūšių diegimo Vilniaus mieste specialusis planas. Available online: http://old.vilnius.lt/transportas/koncepcija/vilniaus_koncepcija_2011.09.15.pdf (accessed on 10 December 2018).
© 2019 by the authors. Licensee MDPI, Basel, Switzerland. This article is an open access article distributed under the terms and conditions of the Creative Commons Attribution (CC BY) license (http://creativecommons.org/licenses/by/4.0/).

 ,
, 


