1. Introduction
The increasing population of cities creates excessive transport demand. Today, 54% of the world’s population lives in urban areas, a proportion that is expected to increase to 66% by 2050 (
UNDESA 2014). This demand can be met only by utilizing large scale transport systems capable of transferring large numbers of people during peak-hours. As theoretically proven (
Mackett et al. 2004) it can be efficiently achieved only by designing and operating public transport systems. At the same time users seem to be highly attached to using private cars for transport purposes (
Gärling and Schuitema 2007). This results in more congested transport and high emissions. This modal change can only be achieved if more users are attracted to public transport.
That means transport users need to be discouraged (i.e., by administrative and regulatory measures) from using a private car or enticed to use public transport. There is reportedly a change of behavior visible among young users in recent years, with some of them preferring public transport (
Blumenberg et al. 2015). On the other hand, young people are not a homogenous group, and the observed decline in youth driving has not been accompanied by a corresponding increase in travel by non-auto modes (
McDonald 2015). As a result, the attitude towards car use might be more dependent on lifestyle choices rather than anything else. Yet transport related lifestyle choices are also subject to different available options availability and can be shaped through new technologies.
Information and Communication Technologies (ICTs) can be introduced even in cities which are not fully digitalized, however some enablers need to be in place. First, there is technology that allows for ICT to be in operation and for users to access it. With the development of the smartphone the main access mode to ICTs was firmly established (i.e., although for many ICTs, the smartphone offers only ease of use and is not a strict requirement since ICT solutions can be based on tools located in public transport stops or inside vehicles, e.g., electronic information boards). Second, there must be a certain acceptance level among users. While the first condition can be now easily met with mobile phones and telecommunication, being an everyday feature of urban life, the second is not that obvious, especially regarding transport users. Research indicates that there seems to be a surprisingly large group of users who are not interested in any form of ICT. There is as well a certain group of users who are not willing to switch to public transport regardless of what improvements are made. The common belief is that it is caused either by their preference of use of the private car or due to public transport quality being simply inadequate. Some of these users are inclined to use a private car due to laziness, medical purposes (
Dobbs 2005), or simply comfort (i.e., the first and the last group could be possible influenced to shift to public transport). This results in a tendency that cannot be met by even the most perfect public transport system (
Steg, Vlek, and Slotegraaf 2001). Yet, at least a part of these users might be willing to share travel with other people—increasing occupancy rates. ICTs can therefore also influence more rational use of car- based transport solutions (e.g., higher occupancy rate). The target group of ICT based policies are those users who actually can be attracted to public transport by a better offer. ICTs can be a tool in making public transport sufficiently good to meet the demand of those users.
It has already been observed that users expect transport ICTs to be free of charge (
Bak and Borkowski 2015). For this reason, the economic potential of ICTs for transport providers is unclear. On the one hand, ICTs should help to better manage transport networks and vehicle fleets, on the other hand they are not cost free. In urban transport, the most direct positive effects on cost’s reduction yet to have been reported include: cargo transport (
Mason et al. 2003) and fleet management (
Button, Doyle, and Stough 2001) but not passenger transport. Outside of the service provider cost-benefit analysis, from a societal point of view, benefits point to urban sustainability that considers the many positive effects due to ICTs in transport, including:
to make public transport more efficient from the user perspective by minimizing waiting time, adding the ability to catch a connection and to plan one’s journey ahead of time,
to reduce activities required from passengers who uses public or shared transport (e.g., automated billing and integrating ticketing instead of waiting in line for the purchase of a ticket or a comprehensive smartphone application for bike-sharing enabling reservations and on-line payments),
to induce the total abandonment of mechanized transport, and
to make the use of the private car more efficient.
This research explores the acceptance and possibility of attracting young users (i.e., 20–24 yr.) to passenger transport. ICTs are considered a useful tool that permits behavioral travel change by inducing use of public transport more frequently.
2. Literature Review
Many empirical studies have been already conducted on the impact of ICT on social activity and travel patterns in different parts of the world, for example in the Netherlands (
Eindhoven 2012), China (
Yuan, Raubal, and Liu 2012), and India (
Lila and Anjaneyulu 2016). Additionally, some conceptual studies explored how ICT influences geographical accessibility (
Van Wee et al. 2013 or
Dijst 2004) and leisure activities (
Mokhtarian, Salomon, and Handy 2006). Moreover, research has been done on the conceptualization of interrelationship of ICT with transport behavior (
Gössling 2017). This indicates that a high level of integration of ICT in an urban context is necessary to achieve sustainable development of the urbanized area. As the International Telecommunication Union put it “a smart sustainable city is a city that leverages ICT infrastructure in an adoptable, reliable, scalable, accessible, secure, safe, and resilient manner” (
ITU 2014). The core element of this definition is the association between ICT and the sustainable mobility paradigm. ICTs can be perceived as a tool which makes public transport or non-motorized transport options more usable and more user-friendly (it concerns especially bike-sharing systems). In order to increase their use, the service should be designed in a way that accommodates the levels of service required by customers (
Beirão and Sarsfield Cabral 2007). New technologies can offer answers to customer needs and allow users to use transport options more efficiently. For car user to consider public transport, a certain basic accessibility and reliability needs to be provided. ICTs can be helpful, for example, by providing access to direct on-line information reducing the risk of unforeseen delays and by providing new opportunities to procure means of transport, particularly in rural areas. Car users expect additional value from public transport. The habit-interrupting transport policy measures can succeed in encouraging car users to try public transport (PT) services initially while latter attributes connected to the individual perceptions, motivations, and contexts must be maintained (
Redman et al. 2013). An important research question is can ICTs provide these attributes? A more environment-friendly urban transport means that at least part of the transport flows needs to be transferred into non-mechanized means of movement (e.g., biking and walking). Modern ICTs unlock these modes as well. Finally, most of the car traffic is made by single users. The average occupancy rate of a car is less than two (
European Environment Agency 2015) and ICT solutions used in car-pooling systems may help to increase this rate. Since single occupancy car use is recognized as a major policy problem, the search for tools which might help to induce more car drivers to public transport is one of the more important issues in transport decision making as indicated by international institutions (
Dender and Clever 2013;
Transport & Environment 2018). Hence, the possibility to influence the modal structure of transport given by ICTs should not be overlooked.
The change in the modal structure of transport is universally recognized as a key objective of transport policy. On the international level it is visible for instance in the EU’s commitment to reduce use of road transport as presented in the European Commission White Paper on transport (
EC 2011). This problem of overuse of passenger cars is however mostly not in long distances but in short legged urban travels.
Existing urban transport systems for decades seem to be persistently resistant to modal shift with dominating road transport prevailing (
Khisty and Ayvalik 2003). The share of road-transport in transport activities has not been reduced during the past decade regardless of the policies applied, for example pricing and taxation adjustments or infrastructure investments in railways (
ECMT/OECD 2003). However, new ICT technologies could be perceived as disruptive technologies threatening major change (
Kane and Whitehead 2017) and as such can enable what has not been achievable before.
While existing transport contribution is 25% of the total emissions, it is obvious that to achieve a stabilization of greenhouse gas emissions from transport, behavioral change brought about by policy is required (
Chapman 2007). The expected profit of ICT use in urban areas is mainly visible through change in transport use patterns with resulting diminished emissions and congestion. The experience of a few European regions where parts of ICT were introduced (Bucharest–Ilfov in Romania, Centro Region in Portugal, and Extremadura in Spain) shows that emission savings could be as substantial as 15%–20% of the total emission costs (
Tafidis et al. 2017). While congestion costs could be sometimes considered beneficial in inducing change in behavior there are also considerable business costs caused by congestion (
Weisbrod, Vary, and Treyz 2003) which might be eliminated if ICTs effectively reduce car traffic. The success in re-orienting urban transport can only be achieved through persistent long term commitment to promoting environment friendly transport modes. So far this has been achievable only over long periods of time and only when external forces outside the remit of the city authorities exercised their power to enforce change. (
Bratzel 1999). We argue the necessary time can be substantially reduced with ICT implementation. Moreover, it could be argued, ICTs might offer usability making them the preferred choice for users.
Some of the sustainable transport concepts were initially introduced over a 100 years ago (i.e., metro, transit oriented development plans date back to London or New York in the late 1800s) but surprisingly many ideas are relatively new developments.
Hidalgo and Zeng (
2013) composed a list of sustainability developments in cities around the world. Accordingly, low emissions zones were introduced in Tokyo in 2003, congestion pricing in Singapore in 1975, followed by vehicle quota systems in 1990. Bus rapid transit originated in Curitiba in 1974 and two-way car-sharing in 1987 in Lucerne and Zurich. Bike sharing is a very young idea introduced in Amsterdam in 1965 (and supplemented by ICT only in 1998 in Rennes). Smart ticketing originated in several cities (mainly Swiss) in the early 1990s. Integrated public transport information even later—in 2005 in Portland. Those sustainable solutions could be brought to new levels of efficiency if overlaid with transport ICTs. The list of ICTs which could be used as such as enablers in public transport is given in
Table 1.
Travel planners are a direct extension of printed timetables. Trip planners providing cross- service information have been widely used by booking agents from at least the 1960s. In public urban transport they were used in paper format from the very beginning when transport services were introduced. Currently, we witness a proliferation of electronic integrating platforms offering information on en route planning. The first public transport travel planner was introduced by Transport for London in 2001.
The basic ICTs are those providing information. Travel information plays a significant role in the travel decisions of individuals, since it can reduce uncertainty in decision making (
Avineri and Prashker 2006). For instance, many cities use bus-stop electronic boards. Therefore, electronic information boards are currently very common in which most users treat them not as an innovation but rather as a regular part of their travel experience. Although public transport information en route is often valuable, it can be questioned as to what extent dynamic panels at stops are accurate. Such panels are also used extensively at rail stations—but quite frequently are used in interconnections with many communiques displayed at the same time so users might be simply overwhelmed by the quantity of information. Nevertheless, the contribution of electronic info-boards into increasing ridership has been empirically confirmed (
Tang and Thakuriah 2012).
Mobile ticketing (i.e., e-ticket or electronic ticket also known as smart ticket) has proliferated across Europe and North America. Smart ticketing requires a relatively expensive IT infrastructure. The UK Government for instance introduced investments of 80 million GBP to introduce smart ticketing across England and Wales by the end of 2018 with the goal of providing every passenger with the choice of travelling without a paper ticket (
DoT 2017). In terms of application to urban transport, so far, the railways and metros have been the most successful adapters of smart ticketing systems with a high number of transactions. The payments include either a special SIM card (e.g., OV-chipkaart from the Dutch public transport chip card) or a prepaid account accessible by smartphone (
Fontes et al. 2017).
Automated billing is based on a technology allowing for automated fare collection without the need to manually pay for each separate transport operation. The first instance of use of this ICT in urban public transport is the octopus card introduced in Hong Kong in 1997. Automated fare collection offers not only convenience to passengers but is extremely useful in planning and optimizing services (
Trépanier et al. 2007;
Reddy et al. 2009). Currently this application is based on a smart card but direct payment through mobile phone applications is being introduced. Usually automated billing is also considered a prerequisite for intermodal ticket integration.
Integrated intermodal ticketing is technically the next step in the development of e-tickets. Integrated ticketing is made possible by electronic ticketing technologies such as magnetic stripe cards or smart cards. However, there are very few cities which apply integrated ticketing (e.g., London, Paris, Dublin, Auckland, Sydney, Singapore). The main problem with this solution is that an application is a complex process requiring the activity of many heterogeneous actors (administrative authorities, public transport operators, tourism operators, intermediaries (telecommunication operators, and financial service providers), as well as existing and potential end- users (
Puhe 2014). There are critical problems with revenue distribution among the different service providers (
Matas 2004). Moreover implementation of an integrated e-ticketing scheme might change established transport patterns (
Sharaby and Shiftan 2012). In the end, investing in technology that bears the risk of reducing market share in the long run is a serious concern to the operators (
Turner and Wilson 2010). A major obstacle for integrated system implementation is also the high initial investment costs.
On-line tracking (i.e., localization applications) allow for real time tracking of bus, tram, and train location. Those systems come in two varieties. One is when the user boards the vehicle and his/her location is updated in a constant manner as the vehicle moves. This kind of upgrade is one offered for instance by Google maps. It has limited usefulness because it helps to determine proximity to destination—a useful feature mostly while traveling or living in an unfamiliar city. More useful is the second option—whereas the application reports the location of public transport vehicles (refer to the examples in the
Table 1), a solution most useful while waiting for a bus or tram or when switching transport modes is required. This system requires that the vehicle communicates with the infrastructure either through GPS or road sensors. The major limiting factor preventing widespread use of this type of application is that in some places it is not known which bus is on which route, let alone where the bus is at any time. Nonetheless, all this could be done automatically. Participating users install an application on their smartphone. With the help of the built-in sensors, such as GPS, Wi-Fi, and accelerometer, the application automatically detects when the user is riding in a transit vehicle and data is transmitted to the application (
Thiagarajan et al. 2010). Online tracking has a real impact on time savings; a study (
Watkins et al. 2011) shows that mobile real-time information reduces not only the perceived wait time, but also the actual wait time experienced by customers.
Municipal authorities in Europe, Asia, and to a lesser extent in the Americas have been developing bike-sharing systems for a number of decades. The first bike-sharing scheme was introduced in Amsterdam in 1965, while first one utilizing ITC was that of Rennes in 1998. There are two major systems available around the world, dockable and dockless bike-sharing. The first one dominates in Europe while the Chinese bike-sharing companies operate without docking stations, using GPS systems. The second option that is more convenient for users has already being disseminated throughout the entire world. Both versions utilize mobile applications. In China at the end of 2017, 77 bicycle rental companies combined with a total of 23 million bikes in more than 200 cities. In Europe the pace of bicycle transport development exceeds that of automobile transport (
Martens 2007). Bike sharing supported by ICT interfaces has a huge potential in reducing private car use in urban areas (
Fishman, Washington, and Haworth 2014).
3. Methodology
3.1. Method
For this study, data was collected using a questionnaire. The justification for questionnaires is to review behavior based on the presumption that ICTs change demand for transport and influence a shift to PT. We should start by stating the obvious that a more sustainable city is the one where transport demands are met at the lowest social cost of a transport system. This is a direct function of predominance of emission intensive transport modes in urban areas. The more vehicle distance travelled the more emissions congestion, and time consumed for travel. Externalities lead to non- sustainability and are a function of the volume of traffic (
Black and Geenhuizen 2006).
While ICTs can address several issues in modern transport system (e.g., excessive driving, congestion relief, and fatality reduction (
Van Geenhuizen 2009), it is their potential for changing the modal structure of transport which matters most. Thus, the questionnaire was constructed in a way to allow for the study to answer the question about user acceptance of different ICTs and their willingness to use them.
The following research questions (RQ) were defined:
RQ1: What is the relationship between the access to private car and the use of public transport?
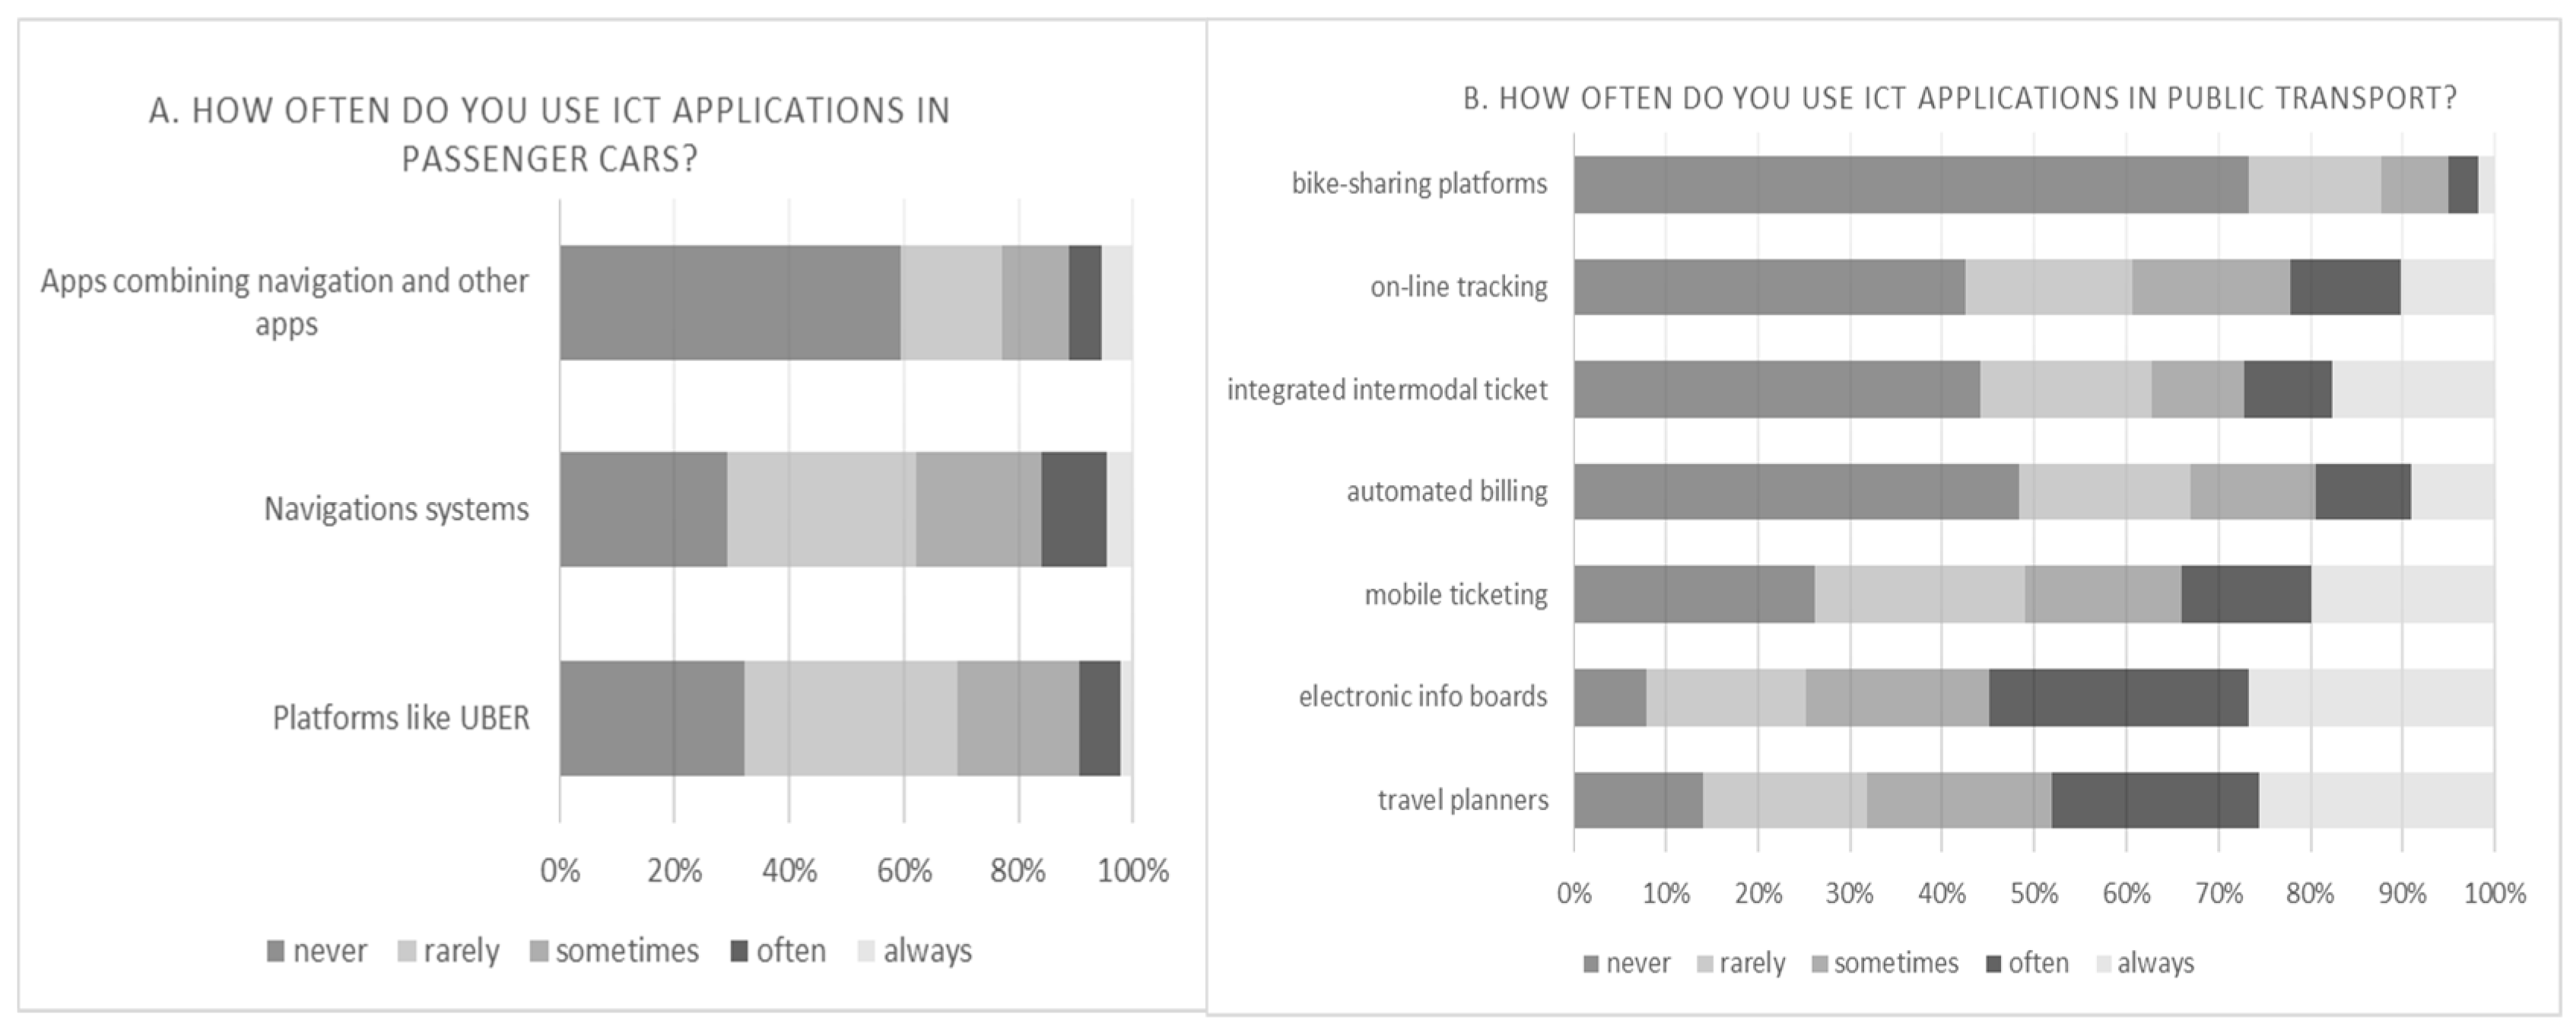
RQ2: How often do young respondents use ICT applications developed in/for passenger cars (i.e., navigation systems, apps combining navigation, and other applications and platforms like UBER)?
RQ3: How often do young respondents use ICT applications developed for PT (i.e., travel planners, electronic info boards, mobile ticketing, automated billing, integrated intermodal ticket, on-line tracking, and bike-sharing platforms)?
RQ4: What is the relationship between specific ICT usage (i.e., for PT and car applications) use and place of residence (i.e., inside the agglomeration/outside agglomeration)?
RQ5: Do ICT users perceive a given ICT as a solution encouraging the usage of different transport modes?
RQ6: What is the difference between the perception of how ICTs encourage PT use between car- users and non-users?
The questionnaire was divided into three parts; with the first, providing basic metrics about respondent (i.e., age, gender, place of living, and ownership (or lack thereof) of the private car). Second, it addressed the frequency of use of different modes of transport for each of the options: public transport, bike, UBER or similar platforms, GPS navigation in car, other systems based on GPS (e.g., CB radio), and ICT applications promoting non-mechanized means of transport like applications for runners or cyclists. Five different levels of use for frequency were selectable: never, rarely (less than once per 2 weeks), sometimes (several times per 2 weeks), often (1–5 times per week), and regularly (almost every day). This allowed for the establishment of the frequency of use of motorized means of travel. Third, we addressed specific ICTs presently in use within PT: public transport travel planners, electronic information boards, e-ticketing by smartphones/internet, automated payments (e.g., prepaid tickets etc.), integrated ticketing (e.g., one ticket for different modes), bus/tram/city train localization tracking, and bike-sharing systems.
All users were asked to answer how often was the particular tool (i.e., applying the same scale as the second part). Then for each tool an additional question was given: Do you think that this particular ICT can convince you to use public transport (i.e., bus/tram/trolley/city train)? This was followed by a similar question in which willingness to use intermodal travel if assisted by a particular ICT was tested. The answers were in the range of: definitely not, rather not, don’t know, rather yes, and definitely yes. This last set of questions allows checking whether owning a car matters. It could be especially beneficial to establish what car users vs non-users think in regard to using a particular ICT. Since our data is ordinal we compared car users and non-car users as well as agglomeration and out-of agglomeration transport users’ attitudes towards each ICT separately by employing a series of Mann–Whitney U tests in order to verify whether the tested groups’ attitudes show similarity (i.e., null hypothesis equates with attitudes that are similar among tested groups). We assumed a 5% significance level. Since our sample was large (N >30) normal approximations and z-value to verify the null hypothesis with single tail and two tail (with continuity correction and ties correction) procedures could be used. Hence, when the z-score was below −1.96 or above 1.96 we could reject the null hypothesis indicating lack of similarity between tested groups for each checked ICT tested.
3.2. Data Scope
The study uses a large sample of young transport users (i.e., 20–24 years old, based on Eurostat statistics broken down with a medium level of detail in which AGE.M is blocked into five year groups (
EUROSTAT 2019) interviewed at the access and egress points of different transport modes. We employed a face-to-face survey instead of a web-based questionnaire. The former approach is treated as more reliable in surveying travel behaviors (
de Abreu e Silva, Papaix, and Chen 2018). There are some studies that qualify both qualitative and quantitative approaches to assess young users behaviors (
Line et al. 2011 or Padayhag and Fukuda 2011). Data collection was conducted in Sopot, Poland in five locations near PT access points (i.e., bus, city train, tram) located near car parks during the last week of May 2018. This allowed for the capture of varied transport users. As expected, young users seemed to be more inclined to use ICTs partially due to easy acceptance of changes, including, in part their computer and smartphone literacy. The use of young users as a sample is, however, justified by at least two additional observations. First, it is young users who can be enticed to use ICTs. The use of the smartphones’ advanced applications makes it a necessary enabler for the use of many ICT-oriented applications. Admittedly there are groups of transport users (i.e., especially older people) who cannot be convinced to use ICTs because they are not willing to share their personal details and reveal their preferences (
Pawlak et al. 2014). The effects of ICTs on behavior of this group is, however, out of the scope of this research. Second, today’s young users are predominant users of future transport systems, therefore in planning a future transport system, this group’s preferences need to be taken into consideration.
3.3. Study Area
The Gdansk Metropolitan Area (GMA or Tri-City) is an urban area in the northern part of Poland situated on the Baltic Sea. It consists of three major cities, Gdansk, Gdynia, and Sopot, and several smaller orbiting urbanized areas. It is plagued with typical problems of urban areas encountered in other cities of the world: congestion, overuse of private passenger cars, and imbalanced transport needs in time (i.e., peak and off-peak hours) and space.
To add to the congestion problem, GMA is located in a narrow pass limited by the seacoast on the one side and a natural forest preserve on the other. This has meant that while there are only about a million inhabitants, the magnitude of the transport problem is more like that of a much more populated city due to the nature of the main transport corridors. There is only one linear axis with the majority of transport activities located alongside this axis. Moreover, the area is one of the top tourist destinations more than doubling the number of inhabitants during summer months. Geographical landform (i.e., elevation differences) is also an important factor in determining usage of bicycles for everyday mobility.
4. Findings
The targeted respondents of the survey were inhabitants of the Tri-City region. The basic information is presented in
Table 2.
The majority of respondents are residents of Gdansk, which is the largest city in the region. Only 14% of respondents live in cities outside of the Tri-City. Surprisingly, many respondents indicated that they have their own car or have a car at their disposal (37%). At a similar level, the possession of a bicycle was acknowledged.
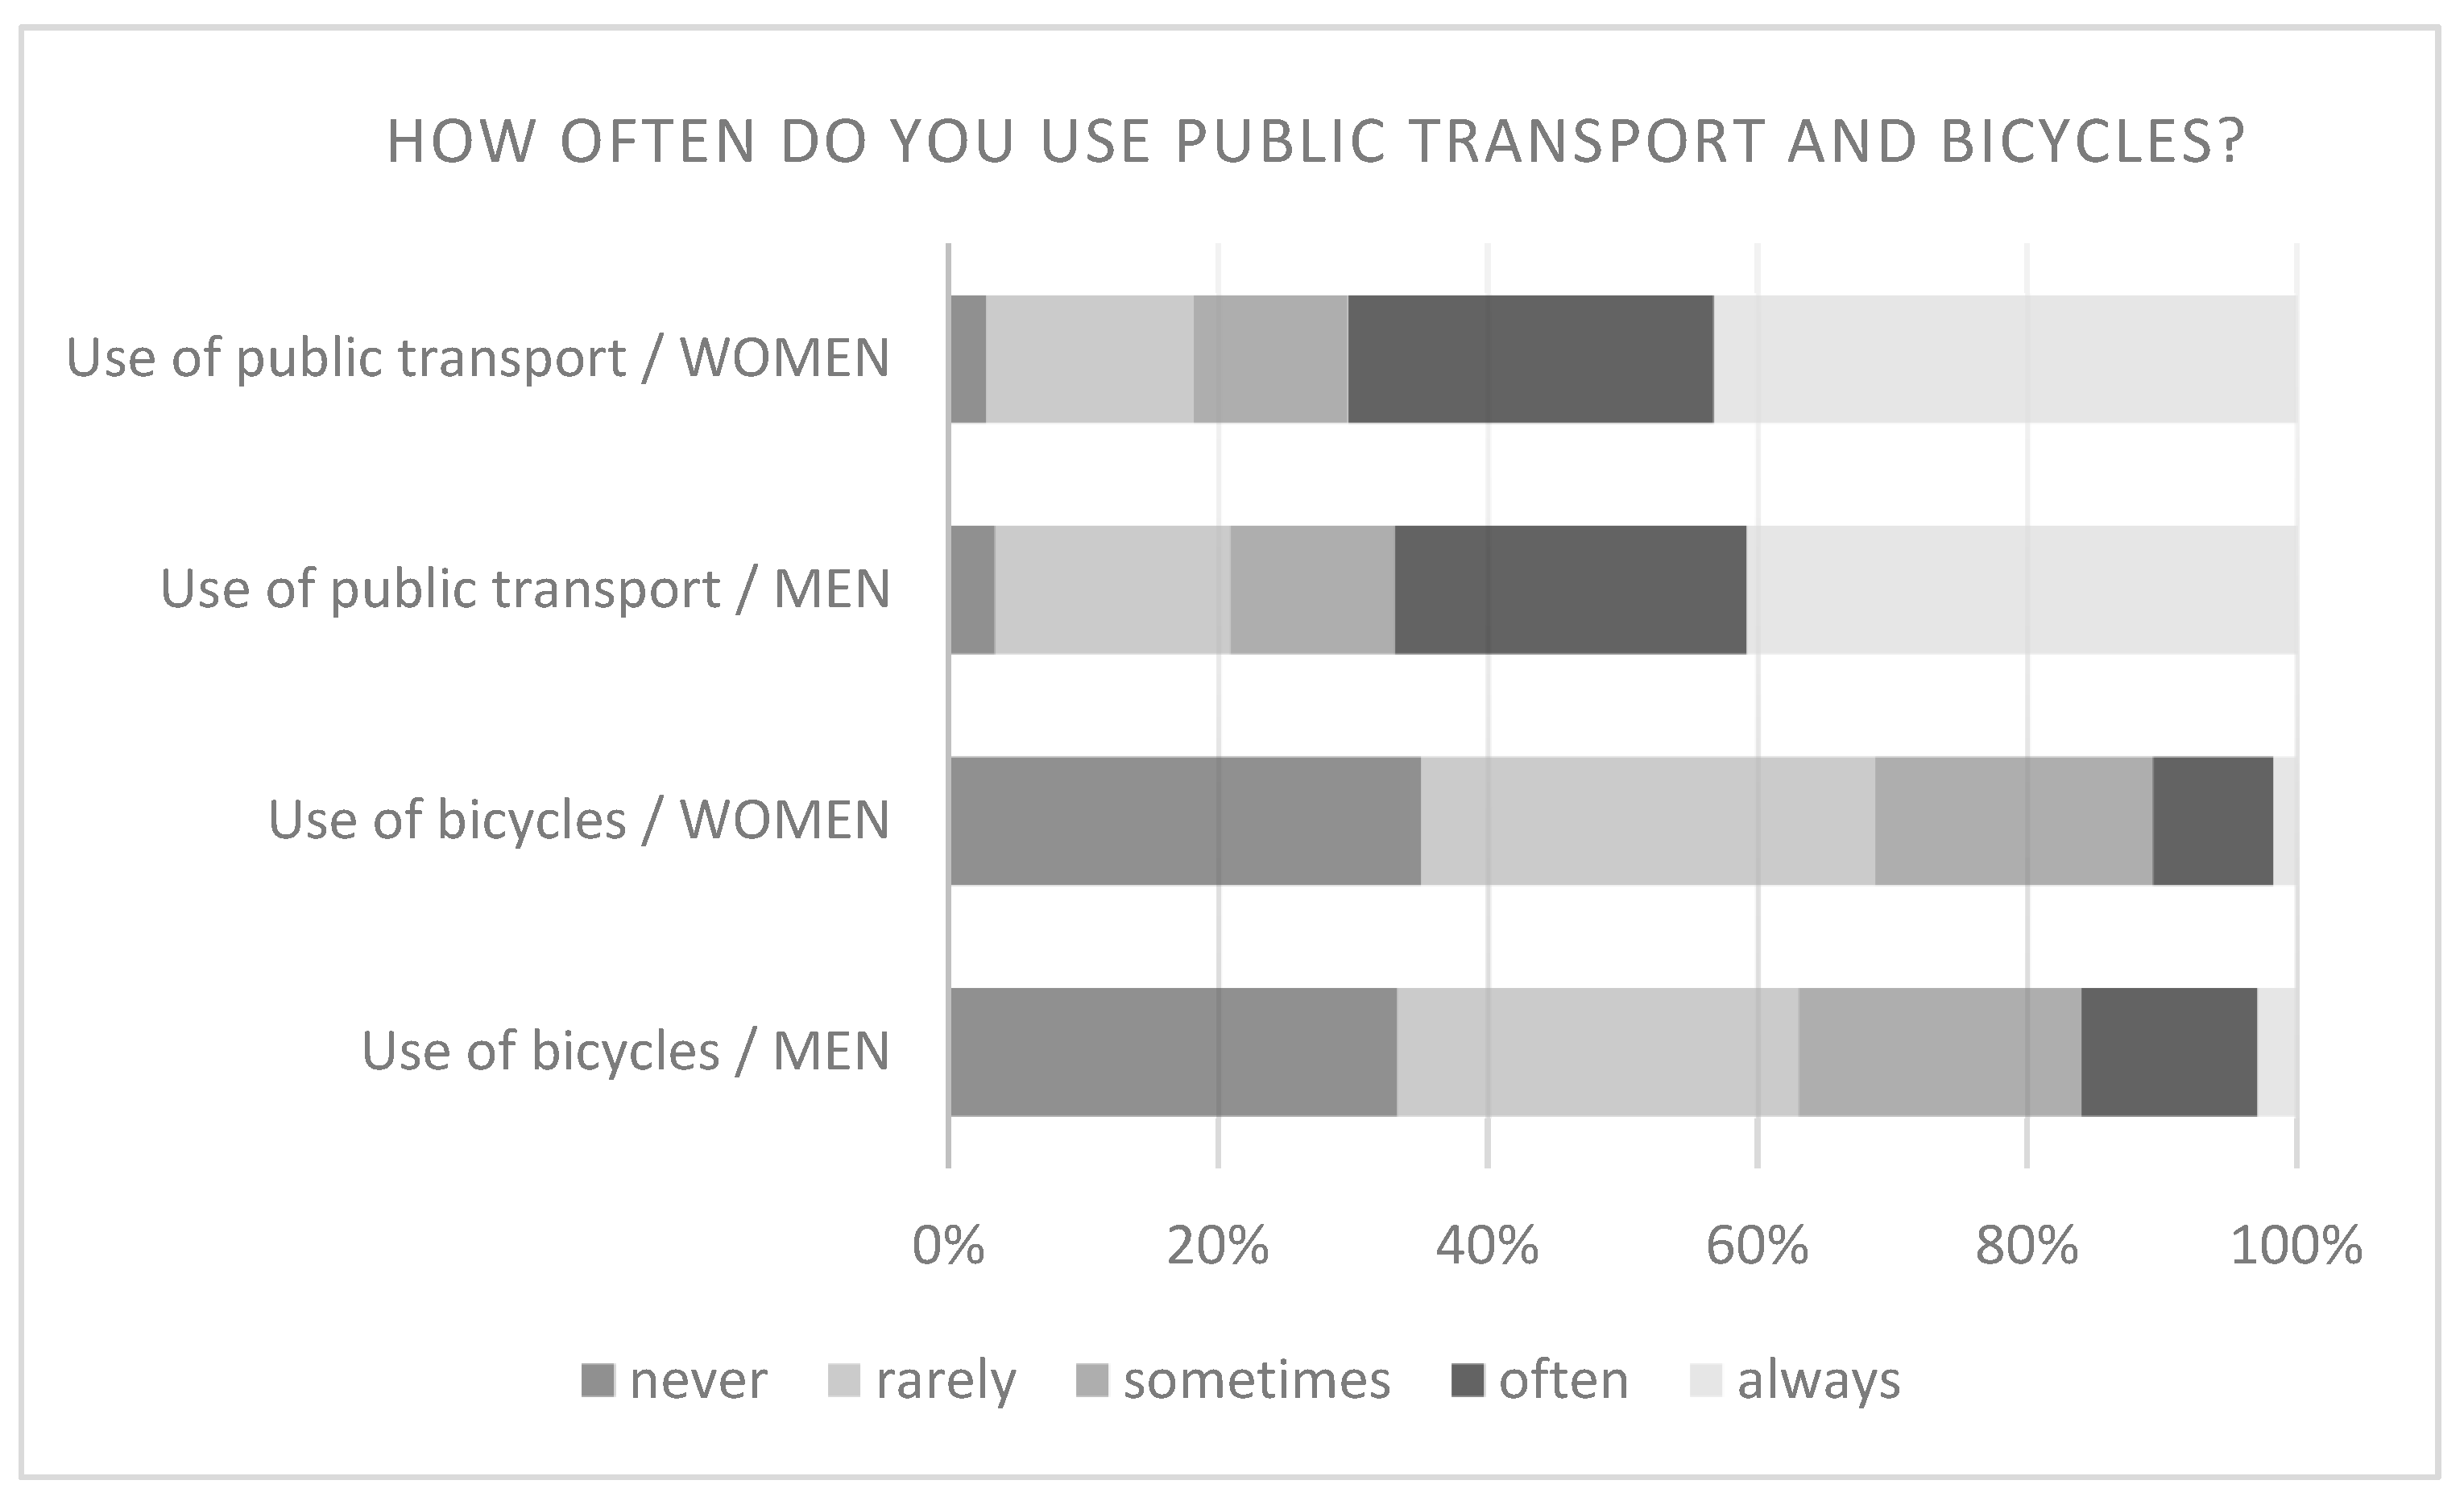
As shown in
Figure 1, nearly 70% of respondents declared frequent use of PT which is slightly more women-centric than men, with over one third of respondents responding that they never use bicycles. These results are regional—characterized by geography, climate, and infrastructure features—in which it is evident the use of bicycles for everyday mobility is not favorable.
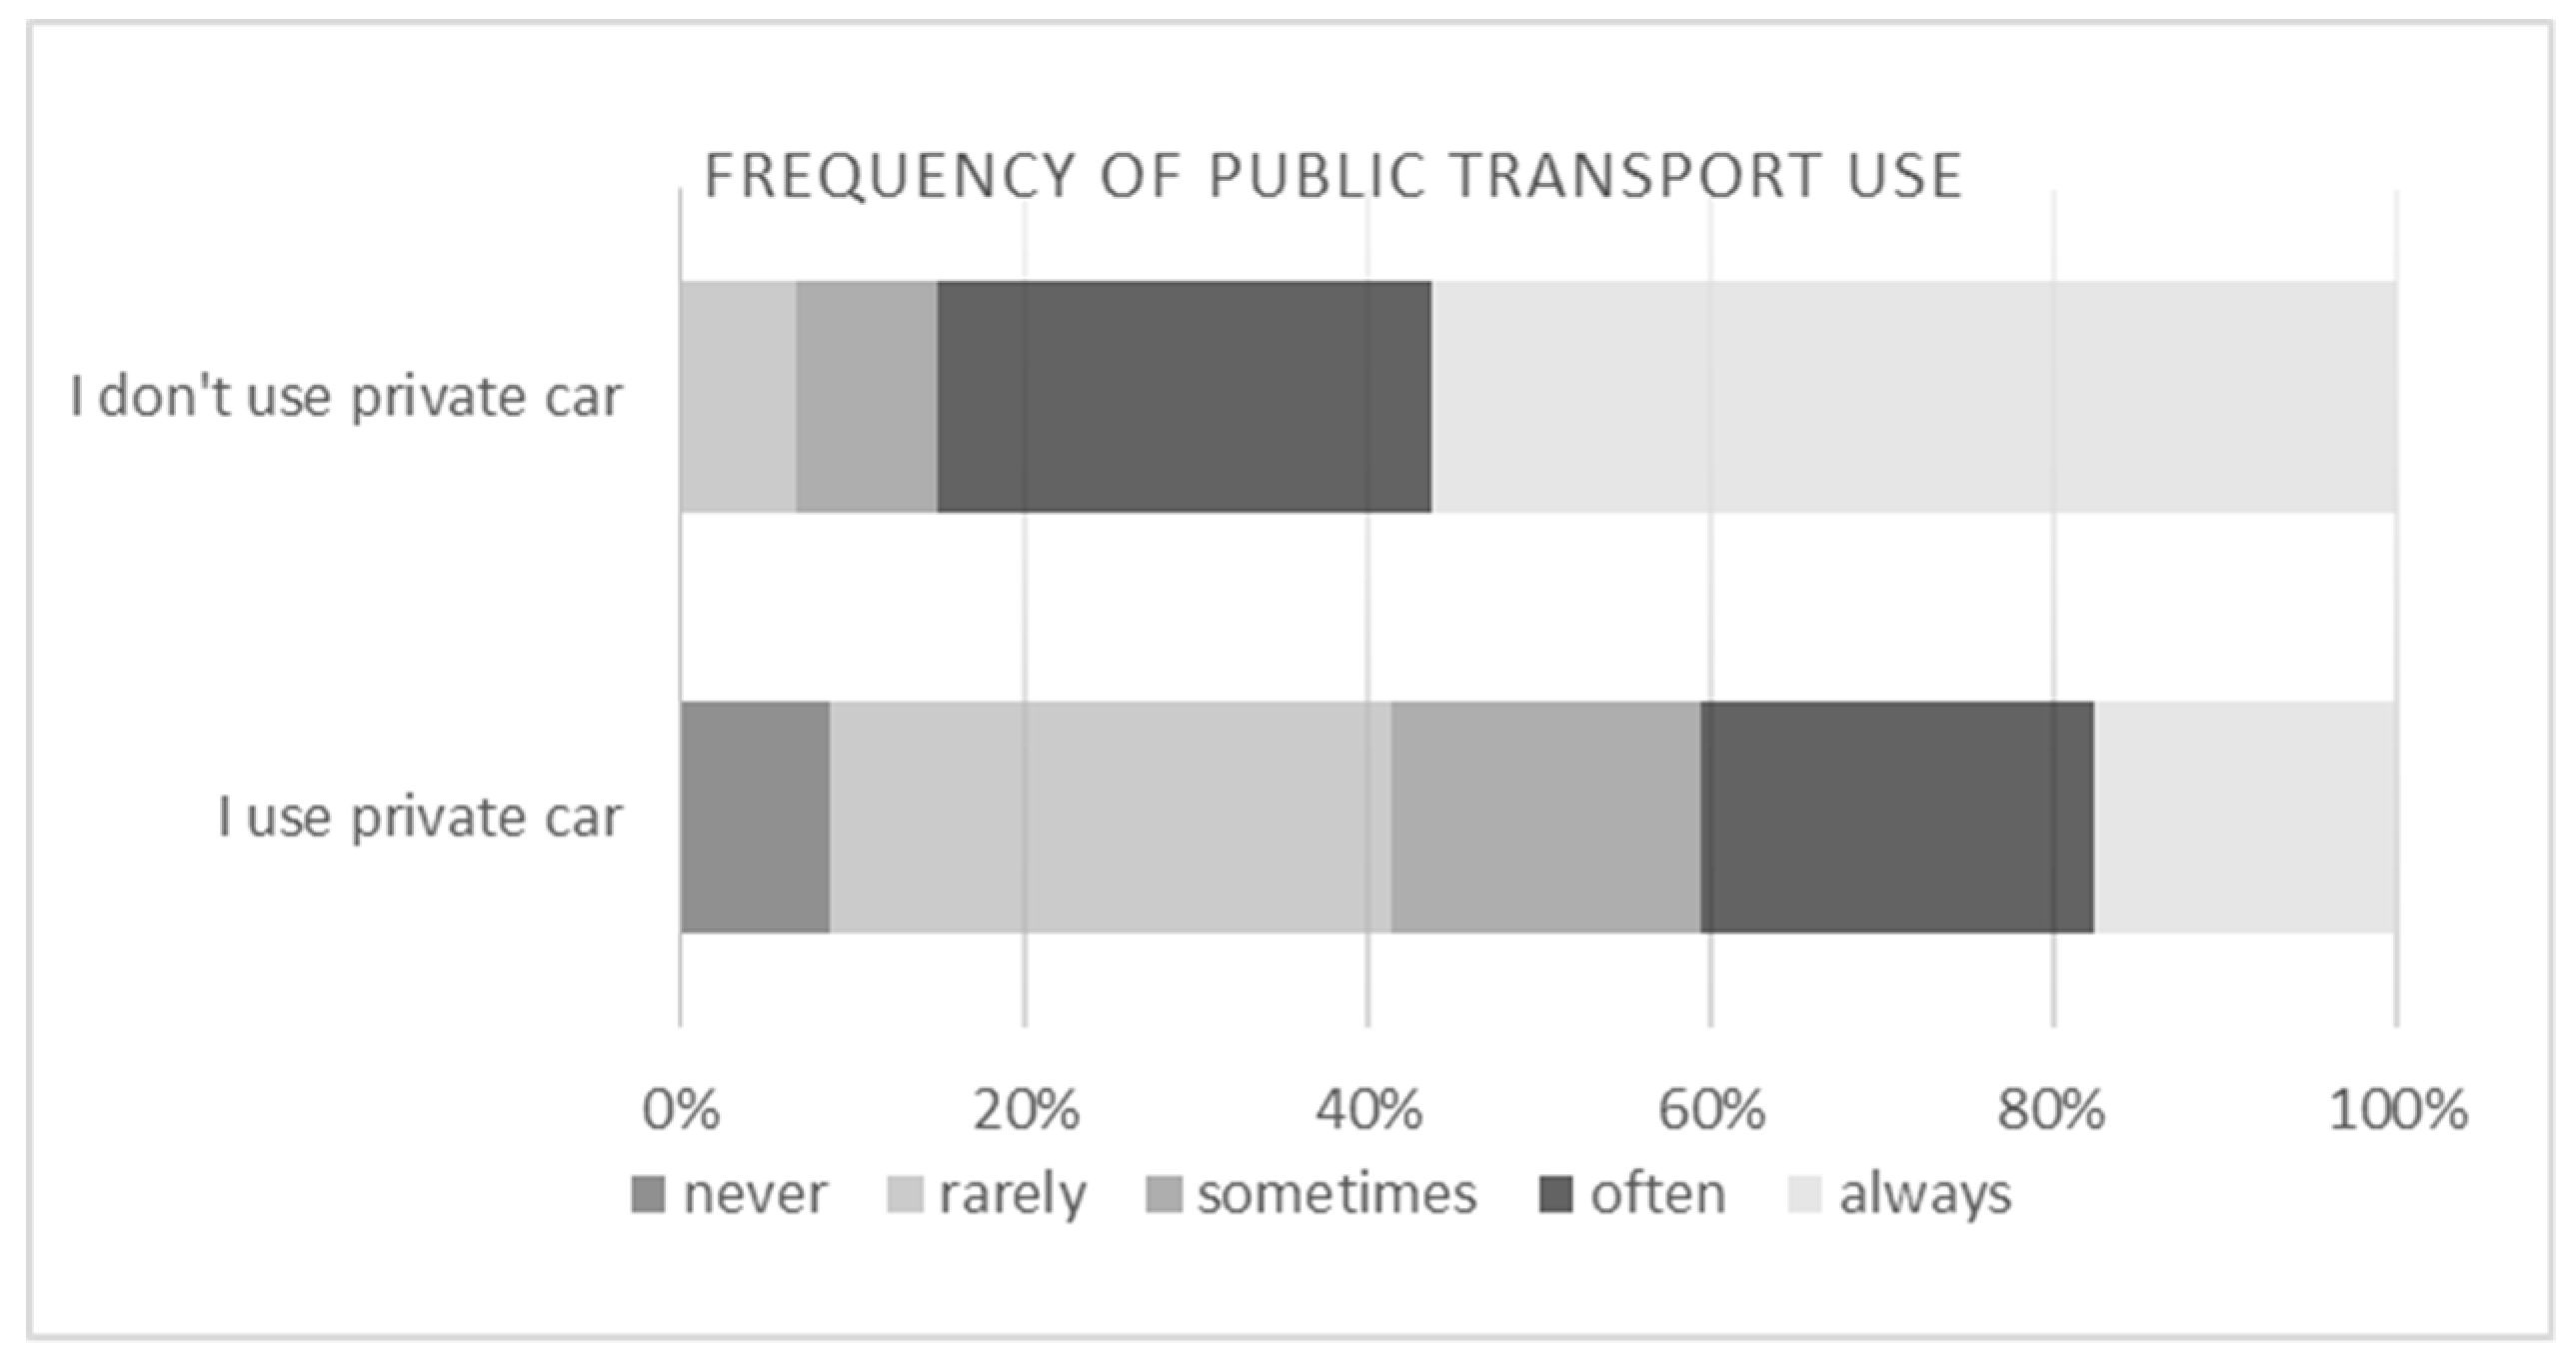
Our survey’s results confirmed the relationship between frequent car users and PT usage, in which it is less often selected. Results were conducted via an MW test in which U = 16,797,
z = −11.57,
p = 0.0001 (
Figure 2). However, it should be noted that in the case of people who had cars at their disposal, more than half declared that they sometimes, often or even always use PT. Therefore, this high gravity for PT could be used and related to the high absorption of ICT solutions and its potential for increase in PT choices.
It was found that there was a wide variation in the popularity of ICTs (
Figure 3). Travel planners and electronic info boards were definitely the most used. About 50% of respondents declared that they use these solutions often or always. Half of them use (i.e., sometimes, often, or always) mobile ticketing. The relatively low-level usage of solutions relating to ticket systems was associated with poor regional development. Yet, it is worth noting that ICTs in passenger cars are relatively hardly used by the respondents.
While analyzing respondents’ answers depending on their place of residence (i.e., Tri-City and outside of it), one can notice some divergent behavior in the use of ICTs (RQ5). In both variants—the predominance of users who do not use at all, rarely, and only sometimes—ICT is noticeable (
Table 3). The only exception is the use of electronic info-boards, which are commonly used by our respondents in all three cities. For most ICT solutions, it was confirmed that residents commuting to the Tri-City from outside the agglomeration are less likely to use non-PT oriented ICTs than residents of agglomerated areas, whereas specific PT designed ICTs are used by them as often as by those living in the cities.
The corresponding statistics for comparison of agglomeration and out of agglomeration users (
Table 4) indicates that there is a difference in use of various ICT options between them when
z-scores are higher than 1.96 or lower than −1.96 which was true only in the case of use of UBER-like platforms (i.e., U = 13,434, z = 4.81, p = 0.0000018), and travel planners (U = 15,927, z = 2.81, p = 0.0029). For the remaining ICTs, usage patterns for both groups of users are similar.
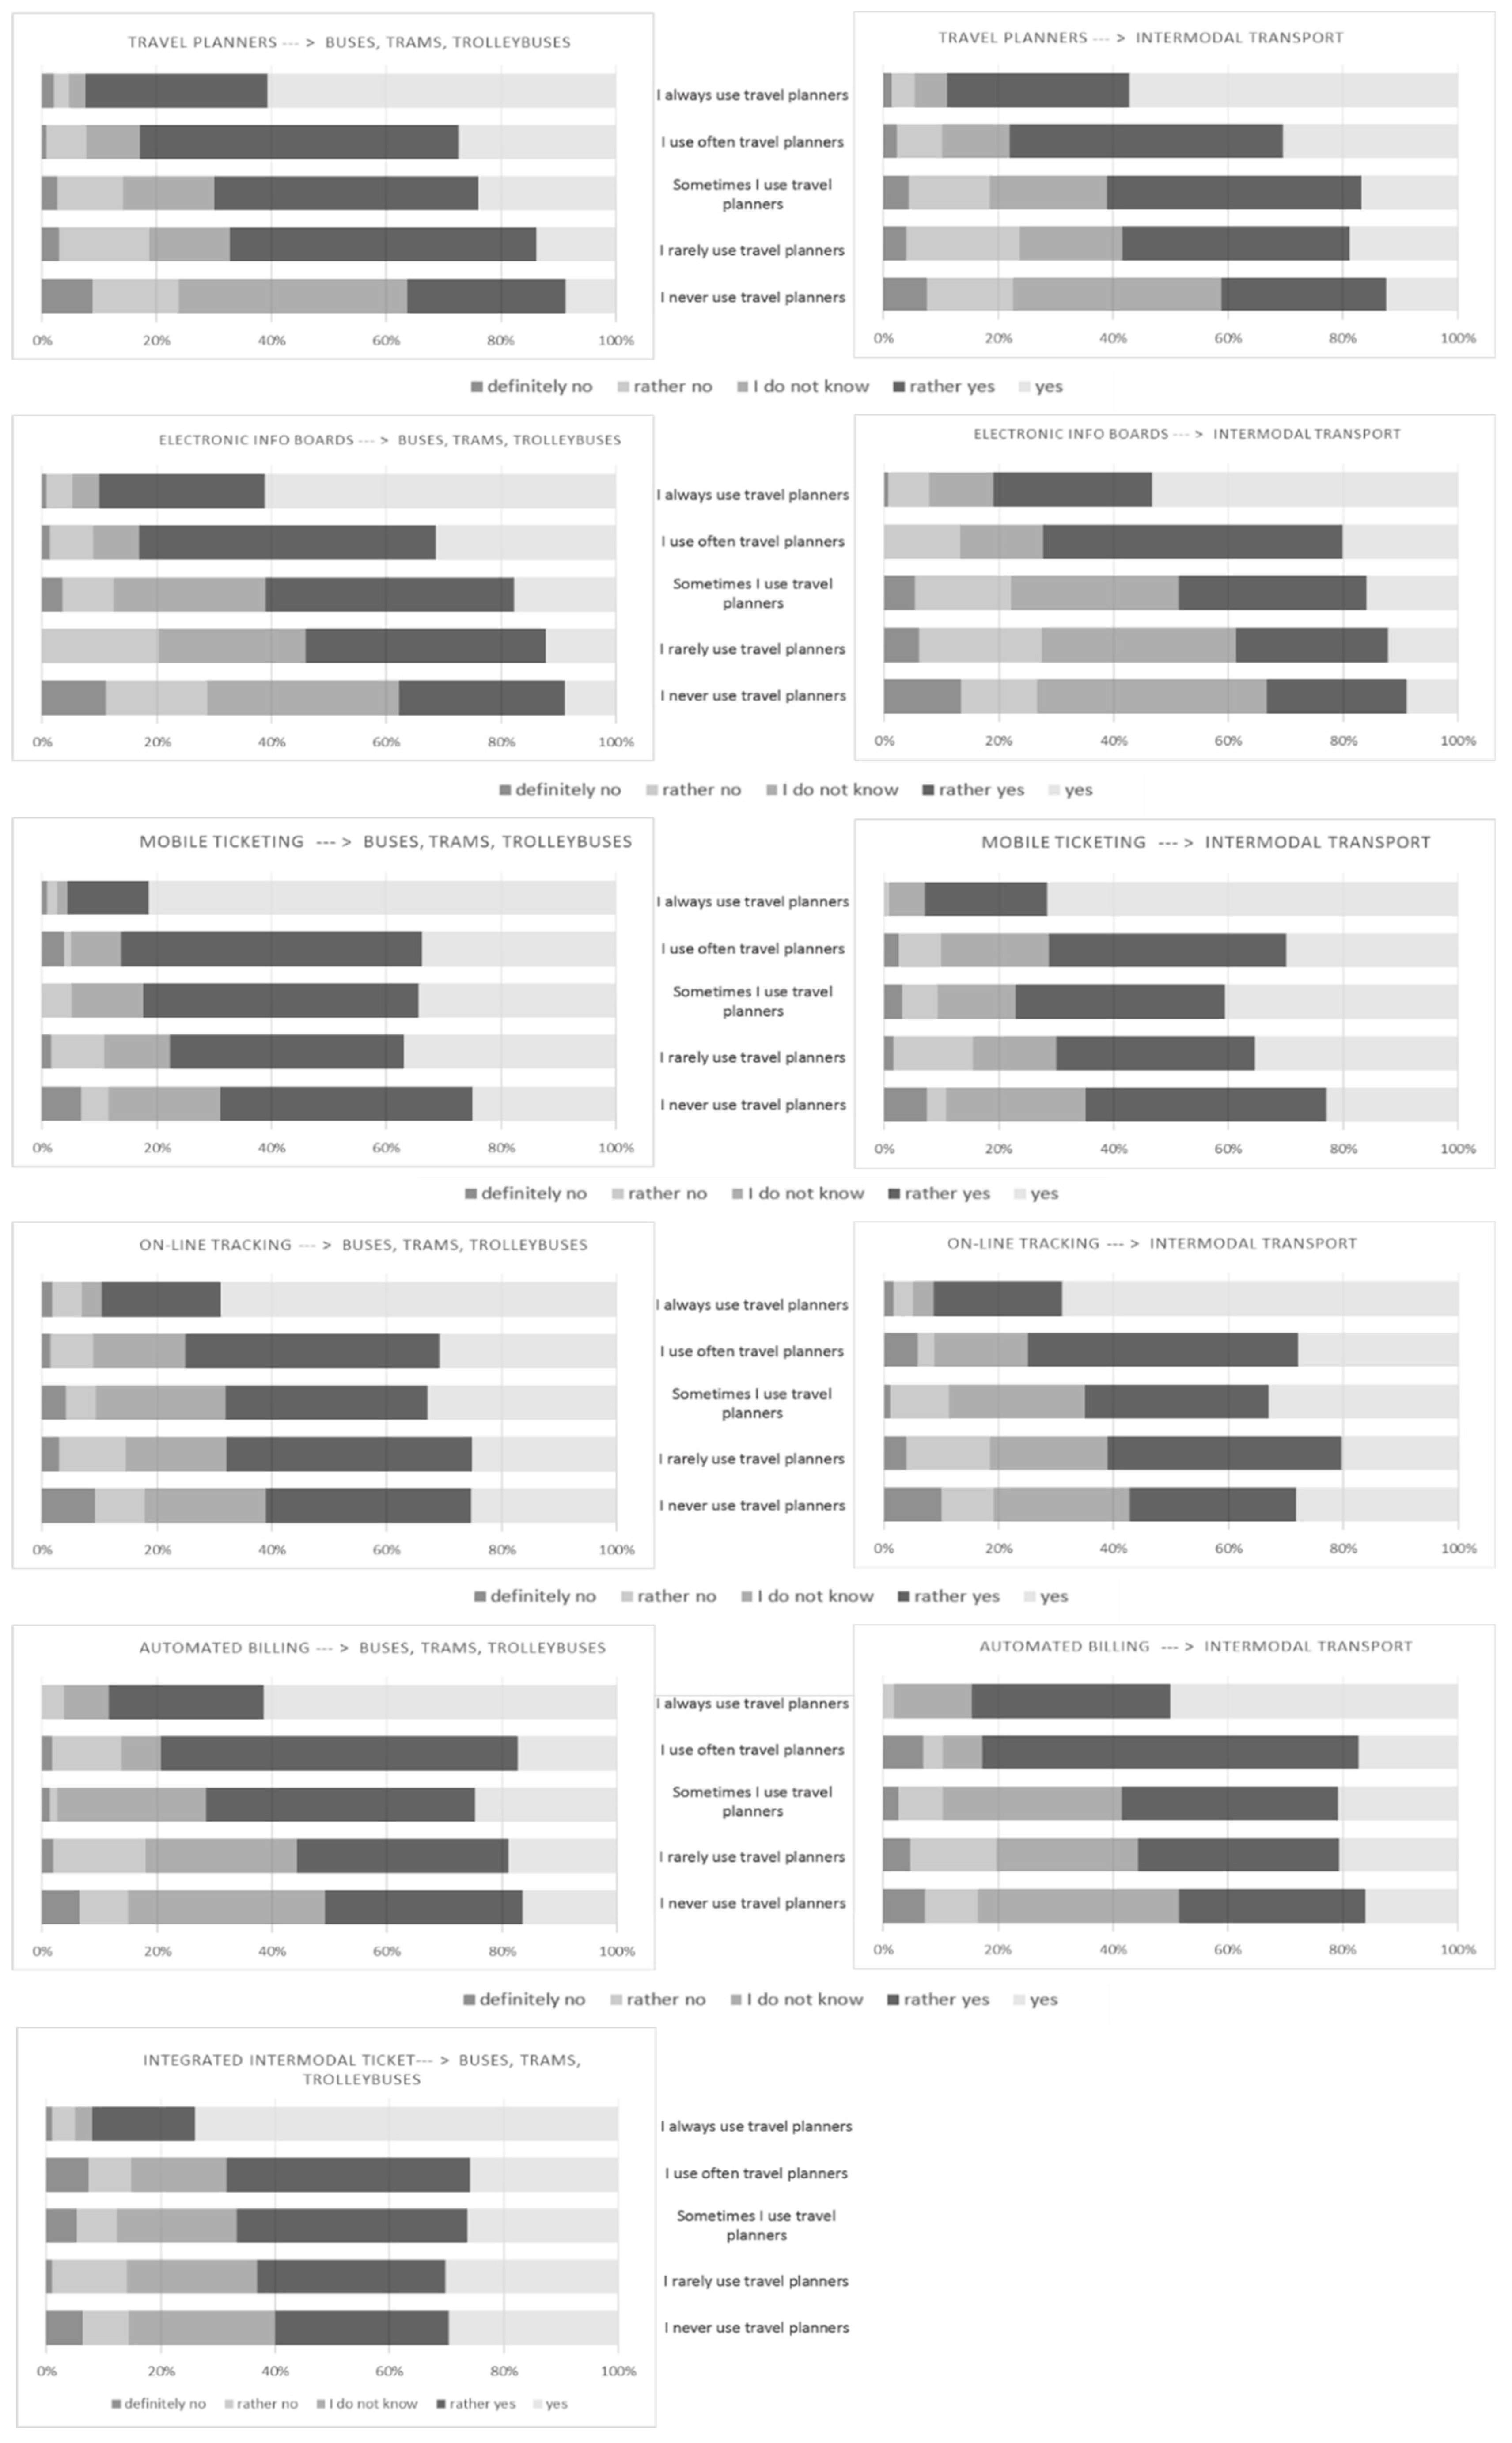
The most important part of the survey was dedicated to the exploration of the respondent perception regarding the stimulation of PT use through ICTs.
Figure 4 presents the results for different solutions that take into consideration the perception of how ICT encourages the use of the individual transport mode (i.e., buses, trams, and trolleybuses) but also the use of intermodal passenger transport. In general mobile ticketing is perceived as a solution which can most likely influence the modal split. Even for the non-users of this solution the perception is positive.
As it is presented in
Figure 4, there is a direct correlation between the increased frequency of ICT use and positive perception of how such a solution can encourage PT. MW tests allow us to differentiate between behaviors of car users and no car users. We can observe with
z-scores below 1.96 that both groups reacted similarly to most ICTs with the exception of travel planners and electronic info boards (
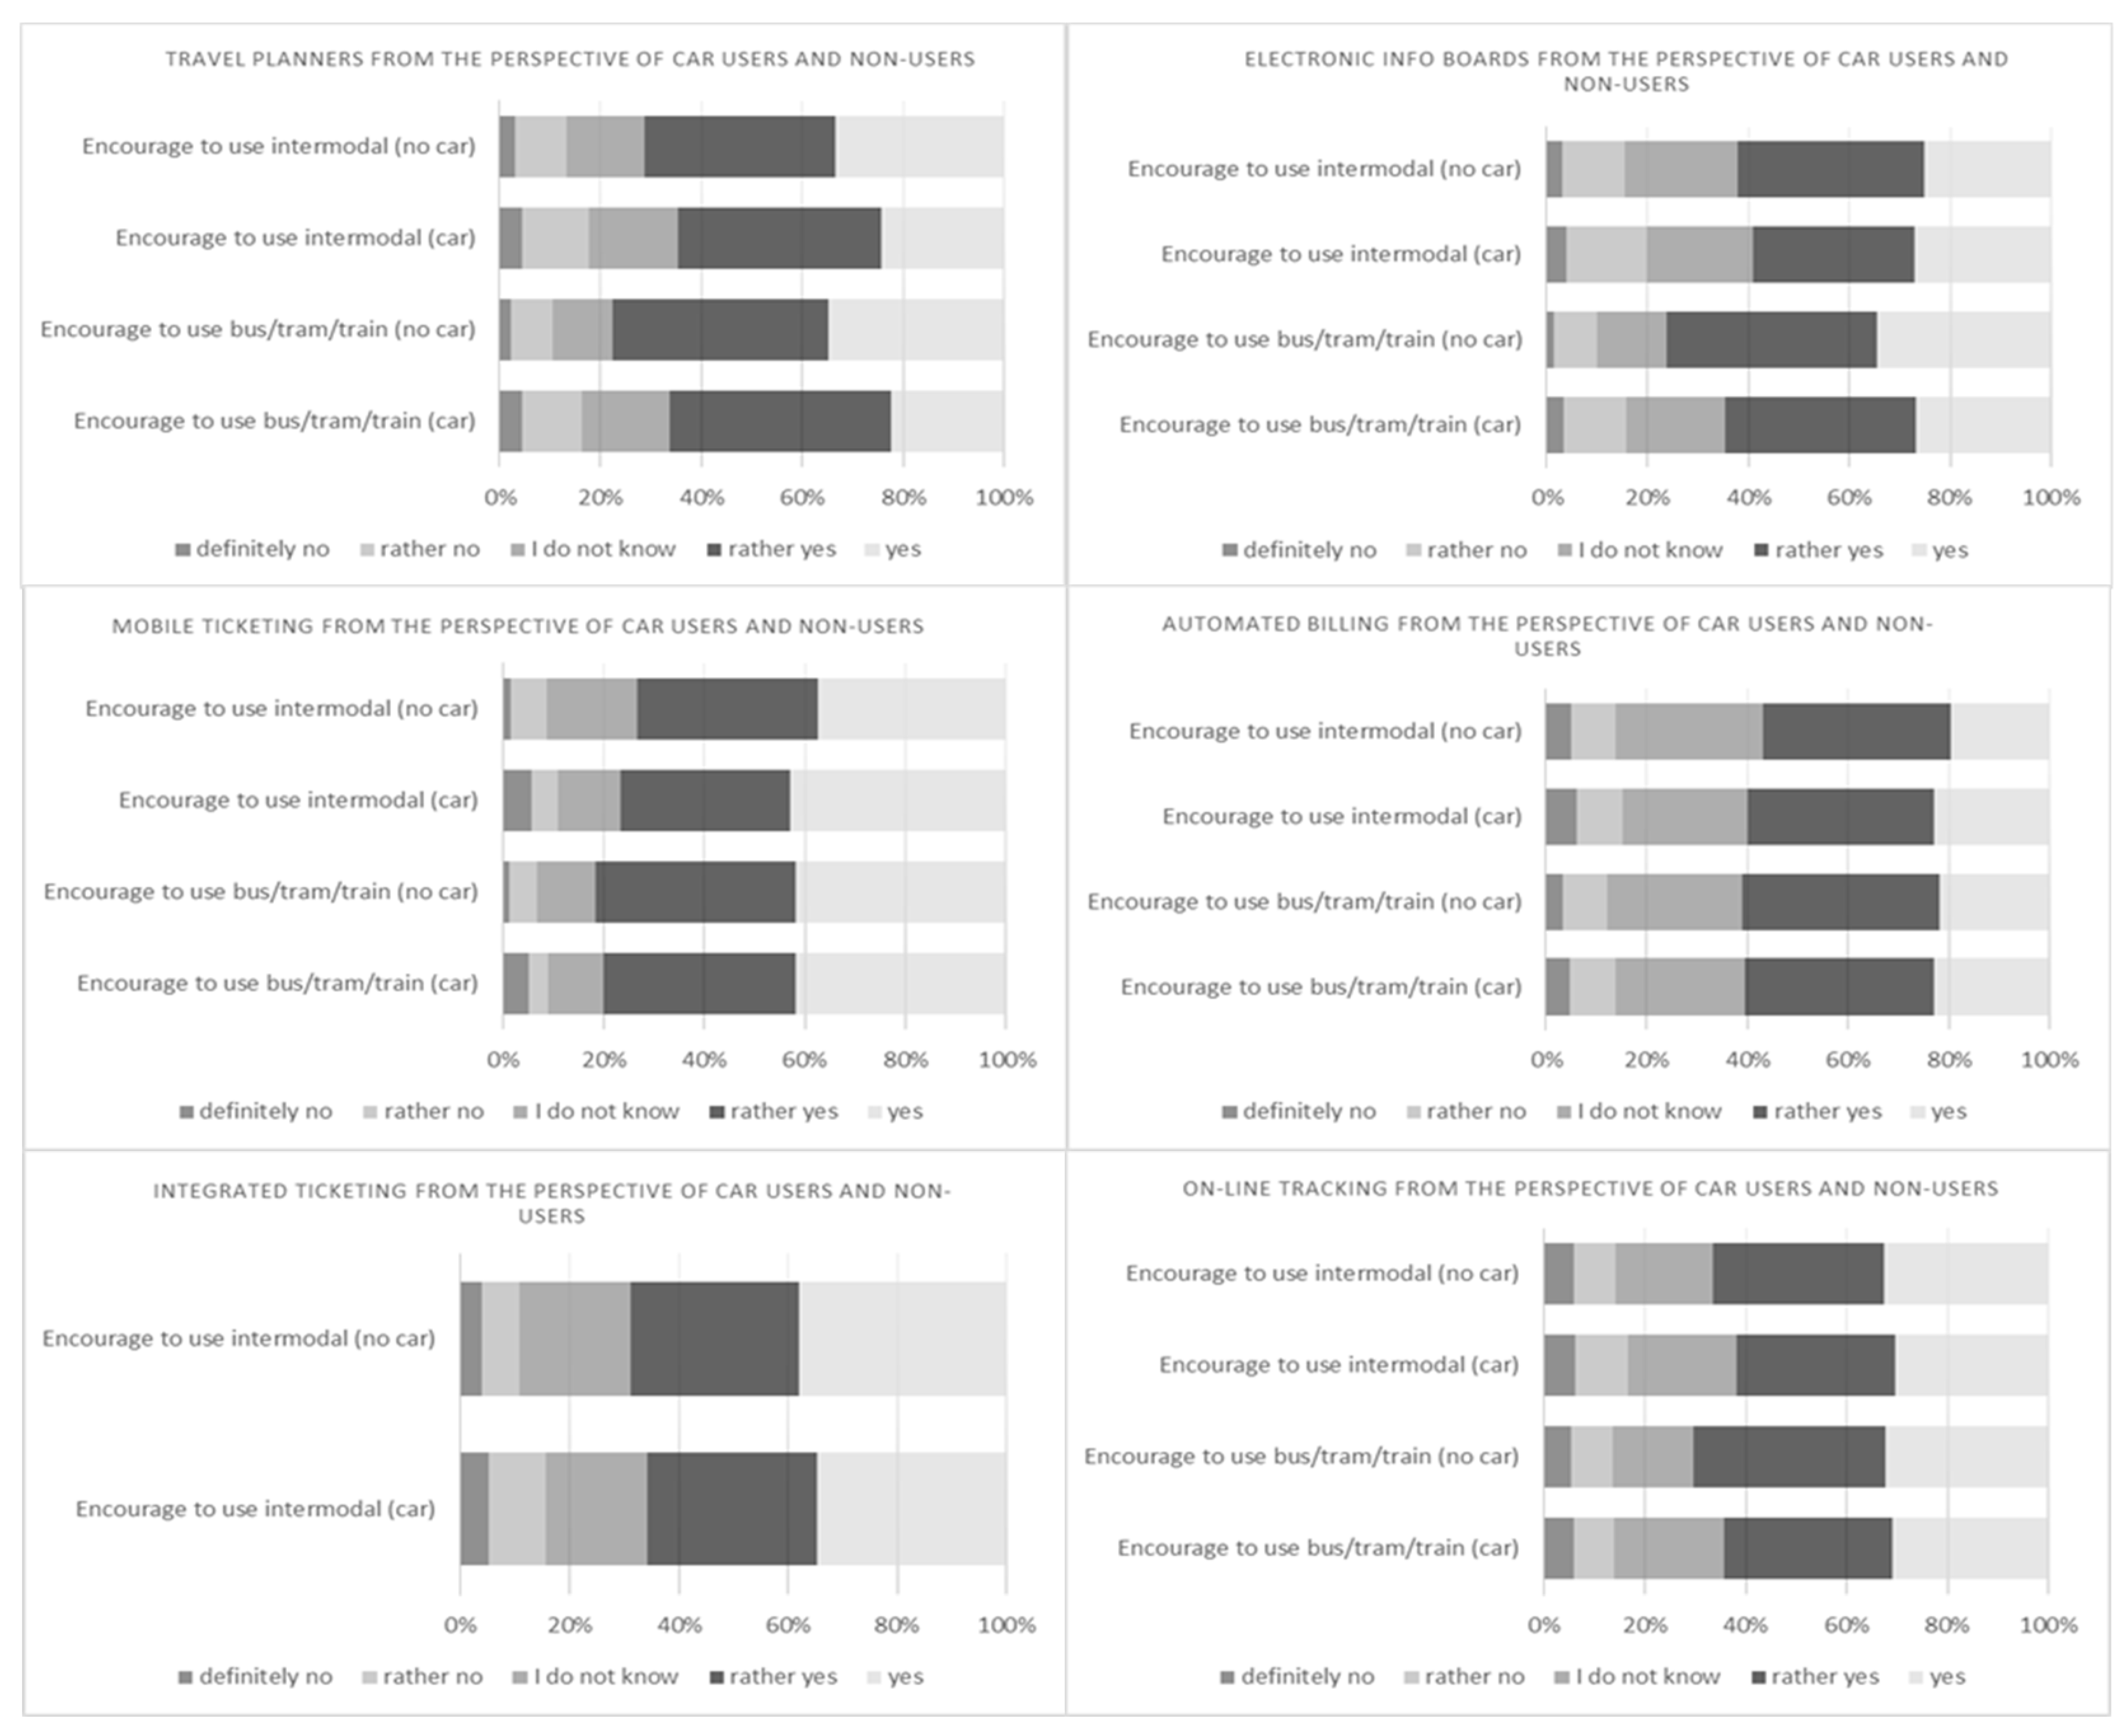
Table 5). The other purpose of the survey was to explore whether the behavior and perception of private car users and non-users differed (RQ6). Results are presented in
Figure 5 and
Table 5. Considering users’ opinion on the potential of different ICTs to increase use of PT there is no visible difference between the two abovementioned groups regarding the majority of ICT solutions as per interpretation of
z-score (i.e., there is a value higher than 1.96 for travel planners and electronic info boards).
Similar results were obtained for perceptive influence of different ICTs on intermodal travel. Here only travel planners stick out with z-score above 1.96 indicating similarity of answers for car users and non-users in regard to all other ICTs.
With regard to all solutions, non-users showed a slightly more optimistic attitude towards the perception of the positive impact of ICT. This is particularly evident in the case of travel planners, where nearly 80% of non-users believe that this solution may contribute to the popularity of individual PT (i.e., probably yes and definitely yes), and about 70% have the same opinion regarding intermodal transport. In the case of car users, the share of such respondents is only slightly lower and amounts to 66% and 65%, respectively. The analogous differentiation between car users and non- users is also visible in the case of electronic info boards and on-line tracking. In contrast, ticketing and billing solutions are perceived almost identically by car users and non-users. The results are quite optimistic because they prove that car-users also perceive ICTs as attractive and having the potential to stimulate PT use. To summarize, it is observable that in all specific solutions respondents perceived the role of ICTs in encouraging intermodal passenger transport as weaker that in the role of support of the individual transport modes.
5. Conclusions and Discussion
Given the current drive for sustainability and importance of the green city or sustainable city concept, we posit that wider use of transport ICTs will result in more balanced transport systems. This study used survey questionnaires of young transport users by examining the relationship between ICTs use and travel behavior. Additionally, we surveyed if ICTs were perceived as solutions encouraging the use of PT. Firstly, the empirical results revealed that the vast majority of young users use PT frequently. Even in the case of people who have cars at their disposal, more than half declare that they sometimes, often, or even always use PT. Surprisingly, the frequency of use of non- motorized transport means it is lower than our pre-study expectations (e.g., close to two thirds of them do not use bicycles at all). These results meant that we could expect high absorption of ICT solutions developed in PT instead of other transport modes (i.e., private cars or bicycles)—an observation confirmed in our study. From all tested ICTs travel planners and electronic info boards it was confirmed that they are definitely most frequently used. Another important finding is that, in the case of all ICT solutions in PT, residents commuting to the agglomerations from outside the cities are less likely to use some ICTs than residents within. We propose that this is caused by the fact that residents of non-urban areas can be less familiar with and consequently uninformed on the potential of ICTs. In turn, they are not attracted by ICT solutions that can influence their travel behavior. This relationship needs further substantial investigation but it seems that ICT potential may become relevant over time. It also could mean that ICTs’ intensive systems will not change user behaviors overnight but rather it is a prolonged process. A process which speculatively could be facilitated by making ICTs cost-attractive to operators, even more user-friendly, and by adding functionalities to them.
The most important part of the survey was dedicated to the exploration of the perception of respondents regarding the stimulation of PT use through ICTs. Out of all tested ICTs, mobile ticketing is perceived as a solution which can most significantly influence a modal split. Another important finding was that the frequency of ICT use impacts the perception of a given solution as one is encouraged to use PT. The more frequently ICT is used, the more positive the perception of the potential that particular tool has in encouraging the public to use it. This conclusion poses a challenge to transport planners. The early adoption of ICTs can be slow and new users unconvinced. It might be necessary to initially run particular transport upgrades for a limited number of active users which has a negative impact on cost-benefit analysis of a particular ICT investment due to the high marginal cost. It can be also noted that for all specific solutions tested respondents perceived the role of ICTs to encourage intermodal passenger transport as weaker that in the case of supporting individual PT modes.
Furthermore, we explored if the behavior and perception of ICTs expressed by private car users and non-users differs. Though some divergence was observed (i.e., for travel planners and electronic info boards), the majority of ICTs for both of these two perspectives gave similar results. It can be interpreted as an optimistic prospect for shaping sustainable transport policy due to the fact both non-users and car-users perceive ICTs as attractive and having the potential to stimulate PT usage.
In summary, the results of this study imply that ICTs can stimulate PT use among young passengers. The analyzed links can be helpful to better understand the relationship between ICT use and the perception of individual solutions by different types of transport users. Having said that, one must also remember that there are certain limitations to our results. First, the result represents only young people and cannot be considered representative of the whole population. Although for reasons stated, we perceive this group of users as the most viable target of transport policy. Second, there are certain socio-economic characteristics of the users which have the potential to impact behavior (e.g., household size or income) which were not taken into account. We suspect these factors to have less variation than for the full age spectrum of the population, since our target group was predominantly single and low income (i.e., still in education or early years of professional career). Third, it would be interesting to research whether the expressed perceptions of respondents are accompanied by a real change in travel patterns. This can be verified only through time series analysis and subsequent future questionnaires.


