Measuring the Degree of Integration in the Dairy Products Market in Malawi

Abstract
:1. Introduction
2. Background
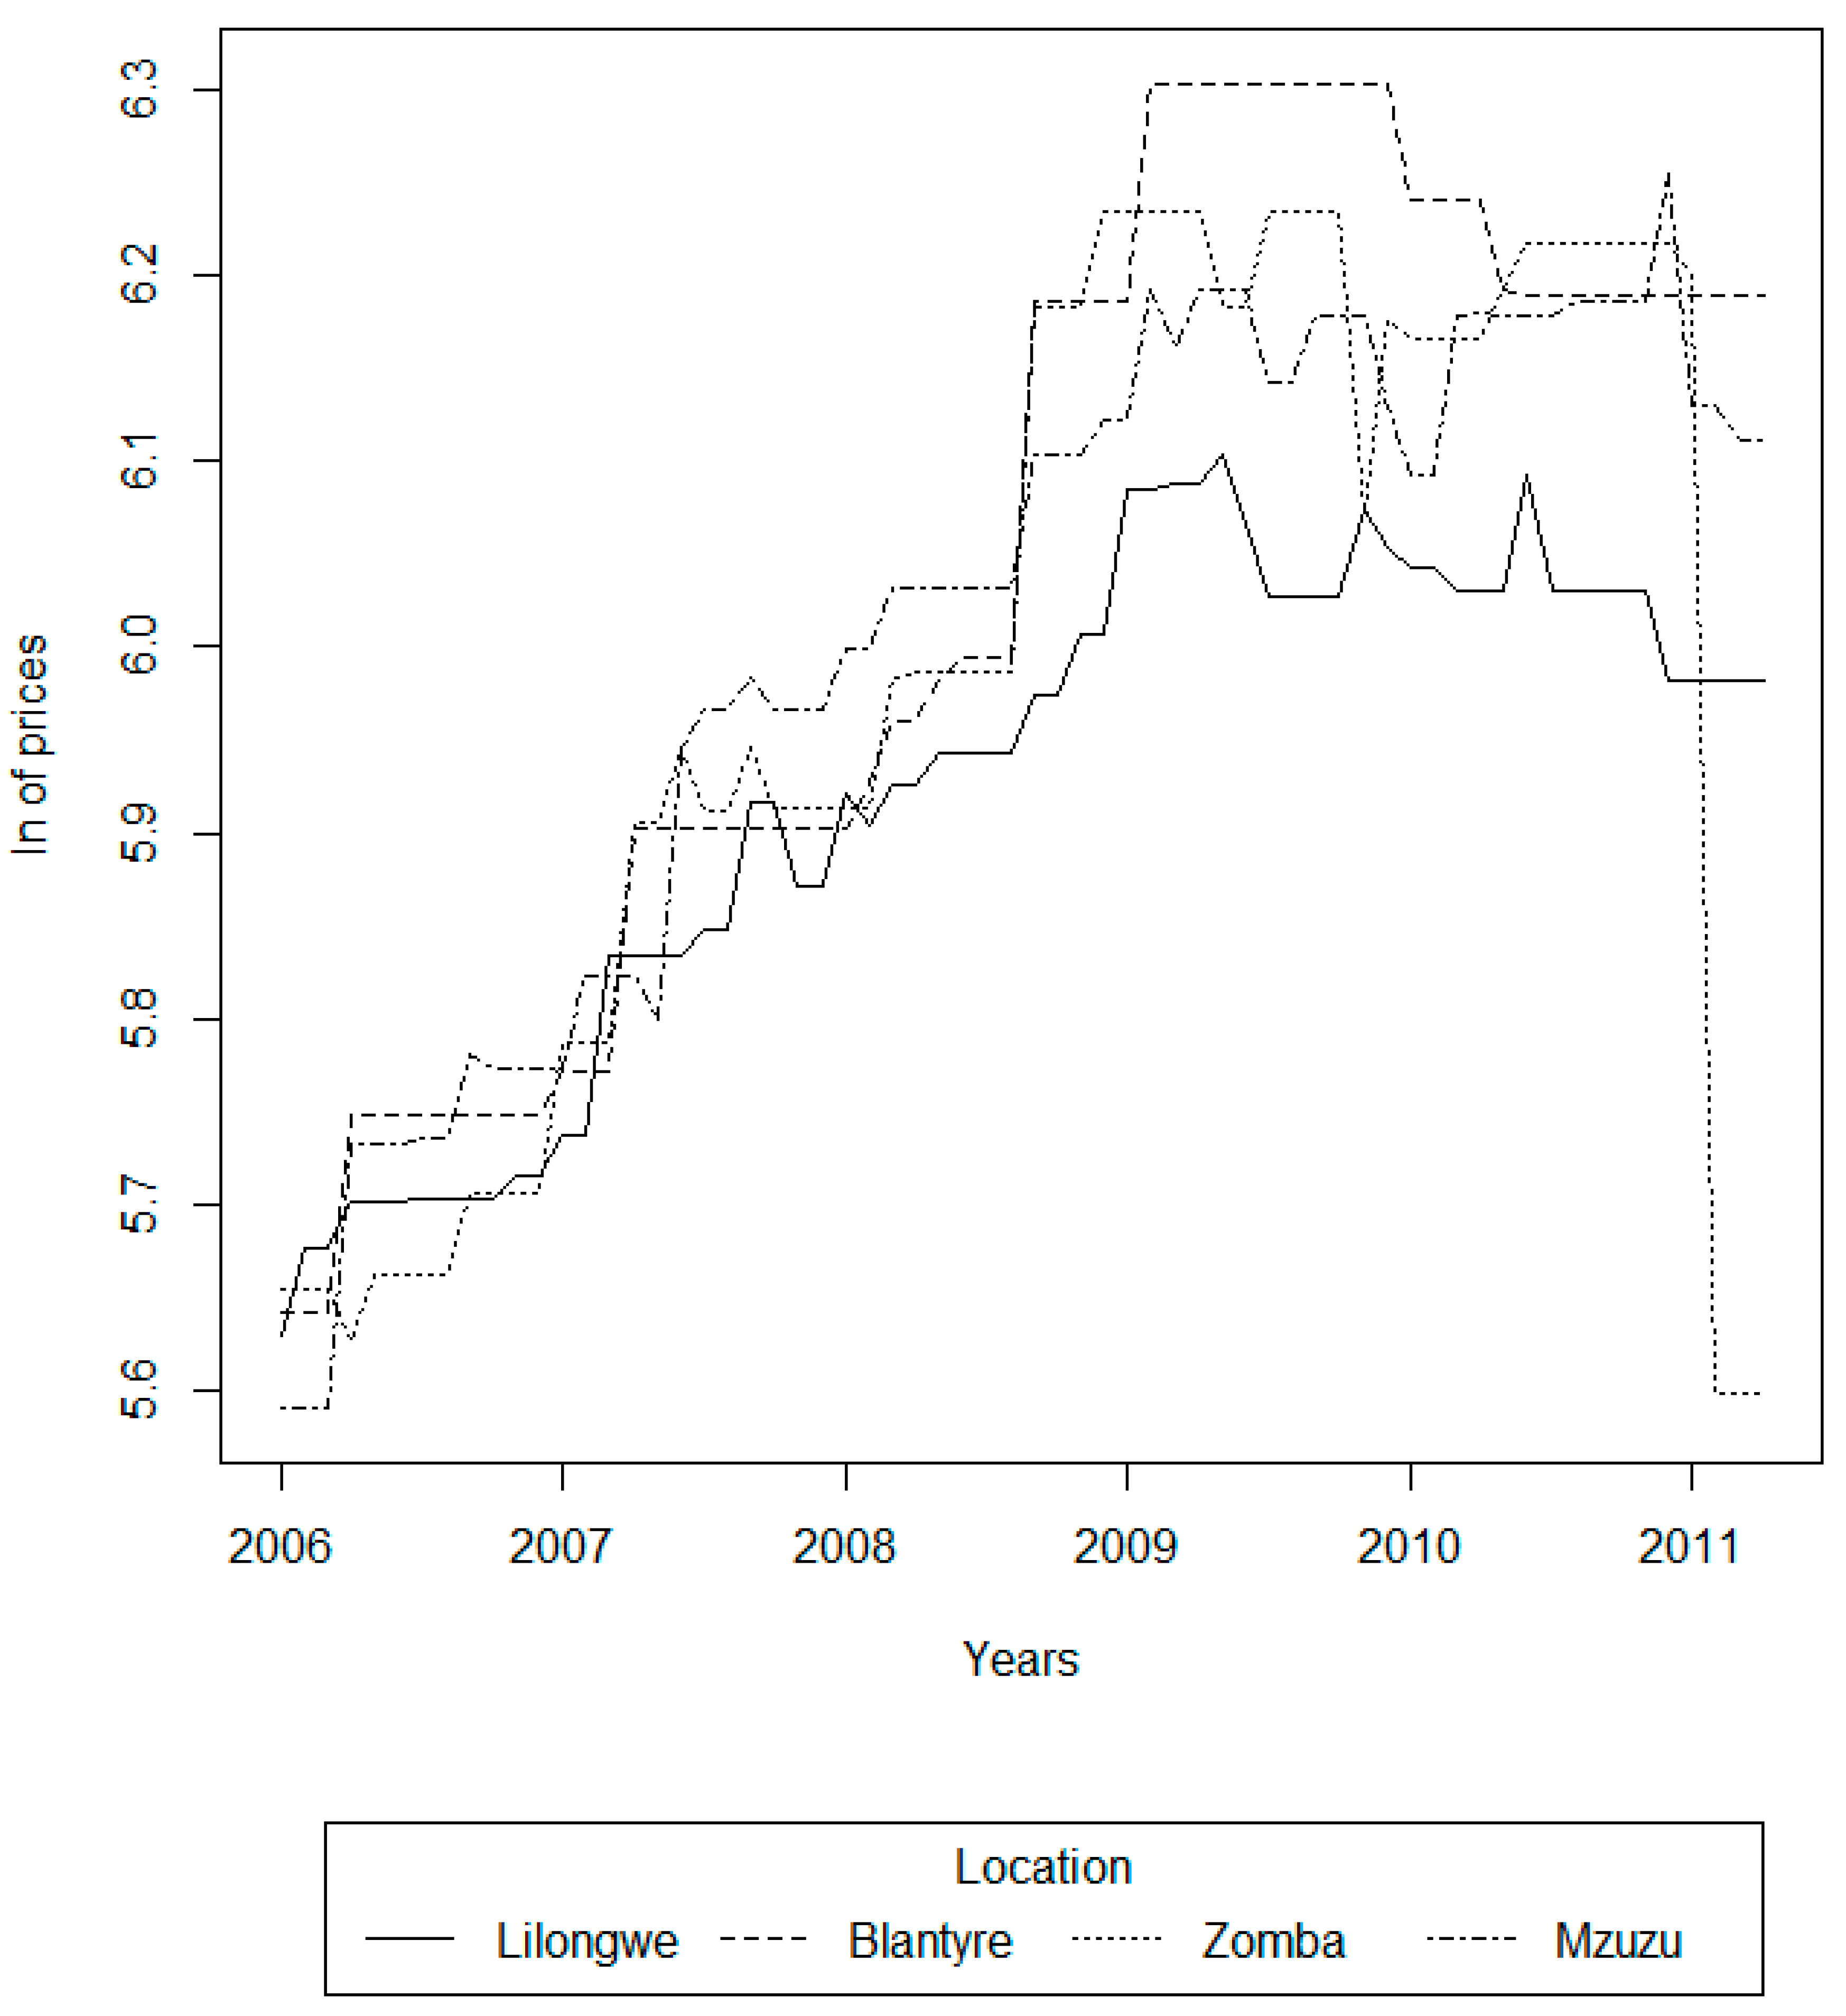
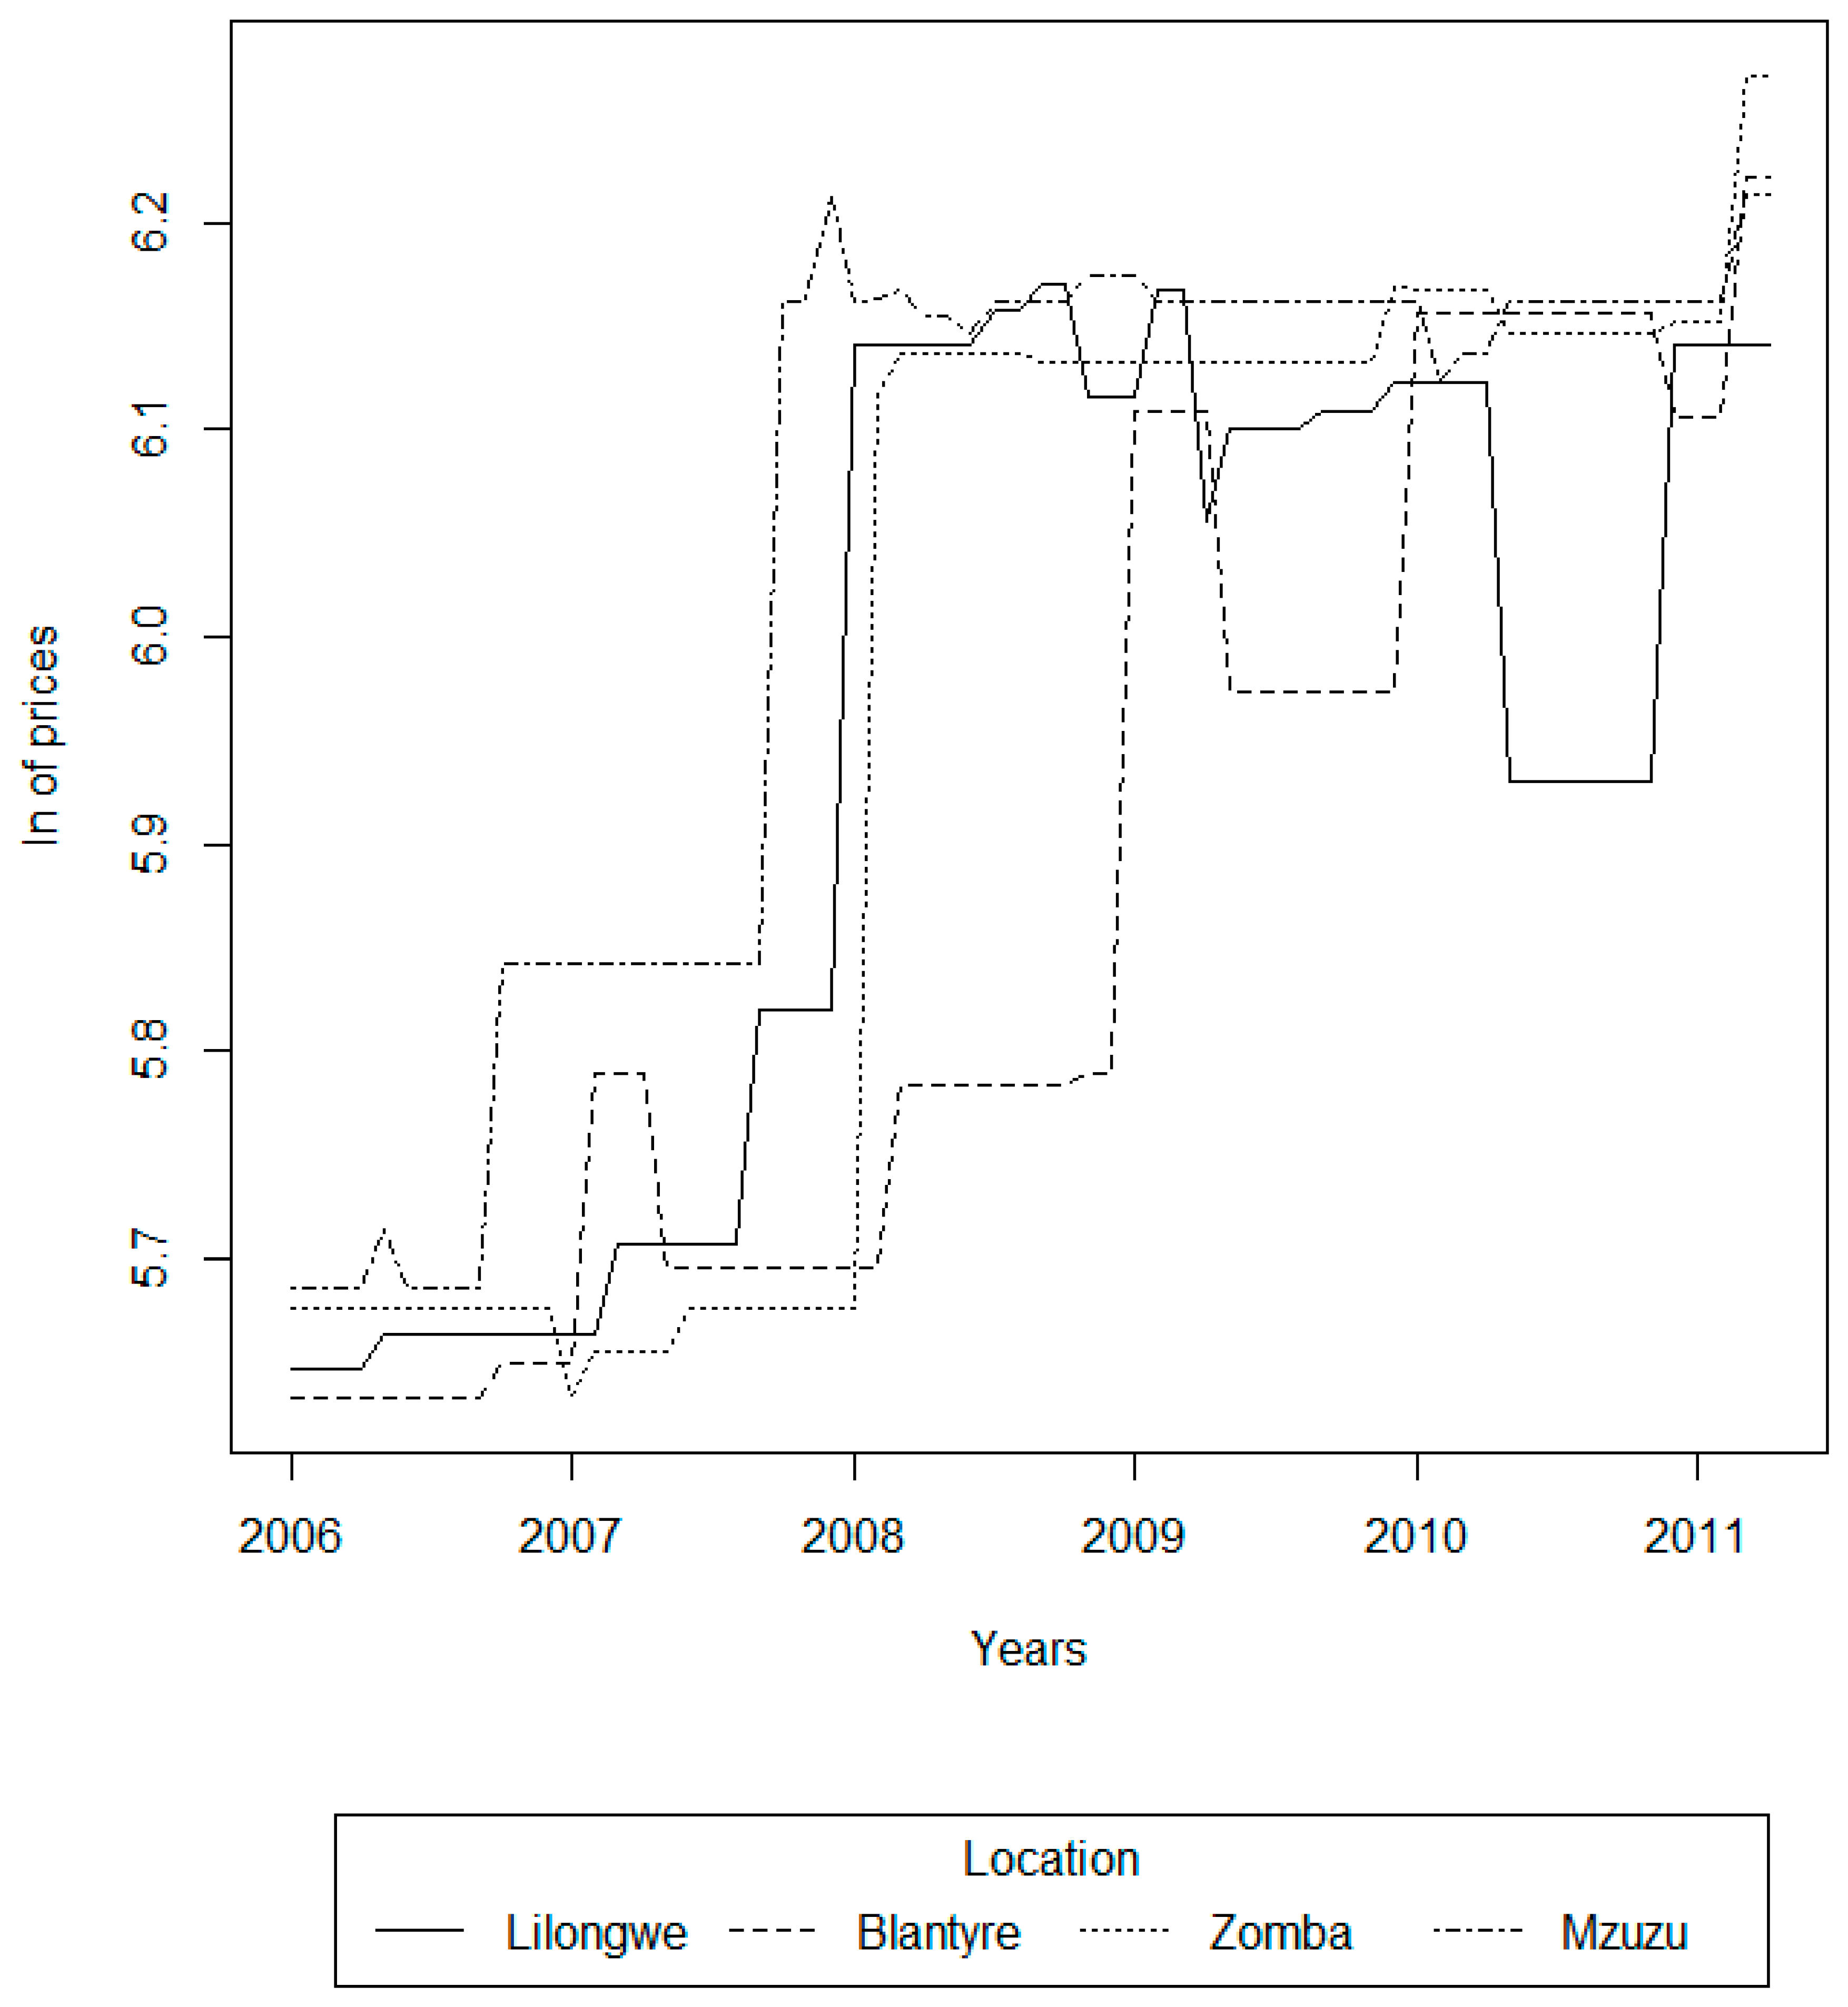
3. Data
4. Methods
4.1. Cointegration Test
4.2. Threshold Vector Autoregressive Model (TVAR)
4.3. Threshold Vector Error Correction Model (TVECM)
5. Results and Discussions
5.1. Cointegration Test
5.2. Threshold Vector Autoregressive and Vector Error Correction Models
6. Conclusions
Author Contributions
Funding
Acknowledgments
Conflicts of Interest
Appendix A

| Johansen-Procedure: Maximal Eigenvalue Statistic (Lambda Max) | ||||||||
|---|---|---|---|---|---|---|---|---|
| Fresh Milk | Powdered Milk (Anchor) | |||||||
| Null | Without linear trend and constant | Without linear trend and constant | ||||||
| Hypothesis | test | 10pct | 5pct | 1pct | test | 10pct | 5pct | 1pct |
| r ≤ 1 | 3.32 | 7.52 | 9.24 | 12.97 | 8.36 | 7.52 | 9.24 | 12.97 |
| r = 0 | 10.39 | 13.75 | 15.67 | 20.20 | 35.31 | 13.75 | 15.67 | 20.20 |
| Johansen-Procedure: Maximal Eigenvalue Statistic (Lambda Max) | ||||||||
|---|---|---|---|---|---|---|---|---|
| Fresh Milk | Powdered Milk (Anchor) | |||||||
| Null | Without linear trend and constant | Without linear trend and constant | ||||||
| Hypothesis | test | 10pct | 5pct | 1pct | test | 10pct | 5pct | 1pct |
| r ≤ 1 | 10.34 | 7.52 | 9.24 | 12.97 | 5.06 | 7.52 | 9.24 | 12.97 |
| r = 0 | 12.56 | 13.75 | 15.67 | 20.20 | 21.73 | 13.75 | 15.67 | 20.20 |
| Johansen-Procedure: Maximal Eigenvalue Statistic (Lambda Max) | ||||||||
|---|---|---|---|---|---|---|---|---|
| Fresh Milk | Powdered Milk (Anchor) | |||||||
| Null | Without linear trend and constant | Without linear trend and constant | ||||||
| Hypothesis | test | 10pct | 5pct | 1pct | test | 10pct | 5pct | 1pct |
| r ≤ 1 | 1.65 | 7.52 | 9.24 | 12.97 | 21.59 | 7.52 | 9.24 | 12.97 |
| r = 0 | 12.21 | 13.75 | 15.67 | 20.20 | 72.15 | 13.75 | 15.67 | 20.20 |
References
- Abdulai, Awudu. 2000. Spatial price transmission and asymmetry in the Ghanaian maize market. Journal of Development Economics 63: 327–49. [Google Scholar] [CrossRef]
- Balke, Nathan S., and Thomas B. Fomby. 1997. Threshold cointegration. International Economic Review 1997: 627–45. [Google Scholar] [CrossRef]
- Barrett, C.B. 2005. Spatial Market Integration. Available online: http://www.researchgate.net/publication/228321315_Spatial_Market_Integration/links/0fcfd50cf0f53e766e000000 (accessed on 14 September 2014).
- CYE Consult. 2009. Value Chain Analysis of Selected Commodities. Final Report. Malawi: Institutional Development across the Agri-Food Sector (IDAF). [Google Scholar]
- Dairibord Holdings Limited. 2014. Dairibord Holdings Annual Report 2013. Available online: http://www.dairibord.com/images/ar2013.pdf (accessed on 25 September 2014).
- Di Narzo, A.F., J.L. Aznarte, and M. Stigler. 2014. tsDyn: Nonlinear Time Series Models with Regime Switching. Available online: http://cran.r-project.org/web/packages/tsDyn/index.html (accessed on 1 October 2014).
- Goodwin, Barry K., and Nicholas E. Piggott. 2001. Spatial Market Integration in the Presence of Threshold Effects. American Journal of Agricultural Economics 83: 302. [Google Scholar] [CrossRef]
- Google. 2014. Google Maps. Available online: https://www.google.co.uk/maps (accessed on 2 October 2014).
- Greb, Friederike, Stephan von Cramon-Taubadel, Tatyana Krivobokova, and Axel Munk. 2013. The estimation of threshold models in price transmission analysis. American Journal of Agricultural Economics 95: 900–16. [Google Scholar] [CrossRef]
- Jones, Andrew D., Aditya Shrinivas, and Rachel Bezner-Kerr. 2014. Farm production diversity is associated with greater household dietary diversity in Malawi: Findings from nationally representative data. Food Policy 46: 1–12. [Google Scholar] [CrossRef]
- Lo, Ming Chien, and Eric Zivot. 2001. Threshold cointegration and nonlinear adjustment to the law of one price. Macroeconomic Dynamics 5: 533–76. [Google Scholar]
- Milk and Milk Products Act. 1990. Section 28, Caption 67.05. Milk and Milk Products Regulation. Lilongwe: Parliament of Malawi. [Google Scholar]
- Mtumbuka, Wezzie S., Lawrence Mapemba, Beston Maonga, and Mannex Mwabumba. 2014. Spatial Price Integration among Selected Bean Markets in Malawi. Washington: International Food Policy Research Institute. [Google Scholar]
- National Statistical Office of Malawi. 2013. Malawi Consumer Price Dataset; Zomba: National Statistical Office of Malawi.
- Park, Haesun, James W. Mjelde, and David A. Bessler. 2007. Time-varying threshold cointegration and the law of one price. Applied Economics 39: 1091–105. [Google Scholar] [CrossRef]
- Revoredo-Giha, Cesar. 2012. Market Structure and Coherence of International Cooperation: The Case of the Dairy Sector in Malawi. Available online: https://link.springer.com/content/pdf/10.1186%2Fs40100-016-0052-y.pdf (accessed on 20 February 2019).
- Revoredo-Giha, C., and F. Akaichi. 2013. Demand for Dairy Products in Malawi. Available online: http://www.sruc.ac.uk/info/120257/food_marketing/802/assessing_contribution_of_dairy_sector_to_economic_growth_and_food_security_in_malawi (accessed on 10 September 2014).
- Revoredo-Giha, C., I. Arakelyan, N. Chalmers, and R. Chitika. 2013. How Responsive to Prices is the Supply of Milk in Malawi? Available online: http://econpapers.repec.org/paper/agssaclwp/152214.htm (accessed on 10 September 2014).
- Leat, P., C. Revoredo-Giha, and C. Jumbe. 2013. Developing the Dairy Processing Sector in Malawi. Available online: http://www.sruc.ac.uk/info/120257/food_marketing/802/assessing_contribution_of_dairy_sector_to_economic_growth_and_food_security_in_malawi (accessed on 10 September 2014).
- Tebug, Stanly Fon, Victor Kasulo, Susan Chikagwa-Malunga, Steffi Wiedemann, David J Roberts, and M G G Chagunda. 2012. Smallholder dairy production in Northern Malawi: Production practices and constraints. Tropical Animal Health and Production 44: 55–62. [Google Scholar] [CrossRef] [PubMed]
- The Nation Online. 2016. Dairy Farmers Lose 45 000 Litres of Milk Monthly. The Nation Online. Available online: https://mwnation.com/dairy-farmers-lose-45-000-litres-of-milk-monthly/ (accessed on 28 January 2019).
- USAID and Malawi Dairy Development Alliance. 2012. January 1, 2007–May 31, 2012. Final report. Submitted by Land O’Lakes. [Google Scholar]
- Van Campenhout, Bjorn. 2007. Modelling trends in food market integration: Method and an application to Tanzanian maize markets. Food Policy 32: 112–27. [Google Scholar] [CrossRef]
- Verbeek, Marno. 2008. A Guide to Modern Econometrics. Hoboken: John Wiley & Sons. [Google Scholar]
| 1 | The six constraints were ranked: Unreliable supply of improved animal genetics, Poor animal health, Feed shortage, Low prices for milk, Poor farm management and Poor farmer group management. |
| 2 | As fresh milk and powdered milk were found to dominate the dairy consumption shares of Malawians surveyed (Revoredo-Giha and Akaichi 2013). |
| 3 | Threshold value measured by subtracting high and low thresholds. |

| Location Pairs | Distance by Road (km) | Google Estimated Driving Time |
|---|---|---|
| Mzuzu to | - | - |
| Lilongwe | 358 | 4 h, 36 min |
| Blantyre | 606 | 7 h, 47 min |
| Zomba | 578 | 7 h, 30 min |
| Level Series Augmented–Dickey Fuller (ADF) Test Statistic | First Differences ADF Unit | |||||||
|---|---|---|---|---|---|---|---|---|
| tau value | root test | |||||||
| Product | Location | Constant | Constant | No constant | AIC | Unit root | Order | |
| and time trend | or time trend | Lag 1/ | Type favored | test statistic | of integration | |||
| Fresh milk | Lilongwe | −0.51 | −1.99 | 1.61 | 1 | No Trend or Drift | −5.43 2/ | I(1) |
| Blantyre | −0.85 | −1.86 | 1.83 | 1 | No Trend or Drift | −5.35 2/ | I(1) | |
| Zomba | 0.23 | −1.45 | −0.13 | 1 | No Trend or Drift | −5.46 2/ | I(1) | |
| Mzuzu | −1.49 | −2.75 | 1.85 | 1 | No Trend or Drift | −6.15 2/ | I(1) | |
| Powdered | Lilongwe | −1.60 | −1.60 | −1.41 | 1 | No Trend or Drift | −5.66 2/ | I(1) |
| milk Anchor | Blantyre | −3.34 | −0.76 | 1.28 | 1 | No Trend or Drift | −5.28 2/ | I(1) |
| Zomba | −2.03 | −0.94 | 1.22 | 1 | No Trend or Drift | −5.25 2/ | I(1) | |
| Mzuzu | −1.66 | −1.72 | 1.43 | 1 | No Trend or Drift | −4.85 2/ | I(1) | |
| Johansen-Procedure: Maximal Eigenvalue Statistic (Lambda Max) | ||||||||
|---|---|---|---|---|---|---|---|---|
| Fresh milk | Powdered milk (anchor) | |||||||
| Null | Without linear trend and constant | Without linear trend and constant | ||||||
| Hypothesis | test | 10pct | 5pct | 1pct | test | 10pct | 5pct | 1pct |
| r ≤ 3 | 14.25 | 7.52 | 9.24 | 12.97 | 25.04 | 7.52 | 9.24 | 12.97 |
| r ≤ 2 | 29.83 | 13.75 | 15.67 | 20.2 | 121.35 | 13.75 | 15.67 | 20.2 |
| r ≤ 1 | 322.89 | 19.77 | 22 | 26.81 | 432.41 | 19.77 | 22 | 26.81 |
| r = 0 | NaN 1/ | 25.56 | 28.14 | 33.24 | 1164.1 | 25.56 | 28.14 | 33.24 |
| Products | Market | Lower | Higher | AIC | BIC | Observations | ||
|---|---|---|---|---|---|---|---|---|
| Pairs | Threshold | Threshold | In Each Regime (%) | |||||
| Value | Value | 1 | 2 | 3 | ||||
| Fresh milk | Mzuzu– | 5.80 | 6.18 | −878.34 | −810.33 | 21 | 64.5 | 14.5 |
| Lilongwe | ||||||||
| Mzuzu– | 5.80 | 6.14 | −828.24 | −760.18 | 21 | 50 | 29 | |
| Blantyre | ||||||||
| Mzuzu– | 6.11 | 6.14 | −766.45 | −698.40 | 59.7 | 11.3 | 29 | |
| Zomba | ||||||||
| Powdered | Mzuzu– | 6.14 | 6.16 | −785.77 | −717.70 | 37.1 | 51.6 | 11.3 |
| milk | Lilongwe | |||||||
| (anchor) | Mzuzu– | 5.84 | 6.16 | −727.26 | −659.19 | 32.3 | 56.5 | 11.3 |
| Blantyre | ||||||||
| Mzuzu– | 5.84 | 6.16 | −724.94 | −656.88 | 32.3 | 56.5 | 11.3 | |
| Zomba | ||||||||
| Products | Market | Lower | Higher | AIC | BIC | Observations | ||
|---|---|---|---|---|---|---|---|---|
| Pairs | Threshold | Threshold | In Each Regime (%) | |||||
| Value | Value | 1 | 2 | 3 | ||||
| Fresh milk | Mzuzu– | −0.121 | −0.002 | −860.012 | −804.707 | 8.10 | 80.60 | 11.30 |
| Lilongwe | ||||||||
| Mzuzu– | −0.033 | 0.015 | −813.055 | −757.749 | 64.50 | 17.70 | 17.70 | |
| Blantyre | ||||||||
| Mzuzu– | −0.007 | 0.016 | −769.027 | −713.722 | 14.50 | 12.90 | 72.90 | |
| Zomba | ||||||||
| Powdered | Mzuzu– | −0.019 | 0.143 | −711.503 | −631.290 | 36.10 | 47.50 | 16.40 |
| milk | Lilongwe | |||||||
| (anchor) | Mzuzu– | −0.006 | 0.225 | −713.822 | −658.517 | 56.5 | 30.6 | 12.9 |
| Blantyre | ||||||||
| Mzuzu– | −0.064 | 0.098 | −737.164 | −681.858 | 74.2 | 17.7 | 8.10 | |
| Zomba | ||||||||
© 2019 by the authors. Licensee MDPI, Basel, Switzerland. This article is an open access article distributed under the terms and conditions of the Creative Commons Attribution (CC BY) license (http://creativecommons.org/licenses/by/4.0/).
Share and Cite
Chalmers, N.; Revoredo-Giha, C.; Jumbe, C. Measuring the Degree of Integration in the Dairy Products Market in Malawi. Soc. Sci. 2019, 8, 66. https://doi.org/10.3390/socsci8020066
Chalmers N, Revoredo-Giha C, Jumbe C. Measuring the Degree of Integration in the Dairy Products Market in Malawi. Social Sciences. 2019; 8(2):66. https://doi.org/10.3390/socsci8020066
Chicago/Turabian StyleChalmers, Neil, Cesar Revoredo-Giha, and Charles Jumbe. 2019. "Measuring the Degree of Integration in the Dairy Products Market in Malawi" Social Sciences 8, no. 2: 66. https://doi.org/10.3390/socsci8020066
APA StyleChalmers, N., Revoredo-Giha, C., & Jumbe, C. (2019). Measuring the Degree of Integration in the Dairy Products Market in Malawi. Social Sciences, 8(2), 66. https://doi.org/10.3390/socsci8020066