1. Introduction
Our world is being transformed into a Digital Society at a fast pace, with an increasing number of human interactions and communications leaving a digital trail. The volume of accessible data on social activity at both personal and professional levels—combined with the explosive growth of data processing technologies—is often seen as an opportunity for the development of applications that measure several aspects of human behaviour. In a management context, the potential of utilizing such data brings promises of improved monitoring, performance measurement and control of organizations, with the objective of better understanding the dynamics of an organization and improving its efficiency.
The research question we address here is how social network analysis based on email traffic can be applied for Human Resources (HR) management. The main hypothesis is that the (email) communication patterns of each member of an organization can reveal information about their role and performance which—consequently—can be used for a variety of management actions, such as promotions, training and internal mobility. We discuss three main dimensions of the research question:
Suitable indicators that take into account the direction, intensity and frequency of information flow among the organisation’s members.
How such indicators can be connected with human resources and the overall organisation efficiency measurement.
What are the possible areas of application and the trade-offs when applying such an approach?
The article is structured as follows:
Section 2 provides an overview of the literature on Social Network Analysis (SNA) and organizational dynamics, focusing on the use of e-mails and related technologies.
Section 3 describes the dataset that we use for a demonstration of the approach, a well-known reference dataset of email traffic within a large EU research organization.
Section 4 explores the importance of SNA indicators as a descriptor of individual and organizational aspects of interest to HR management.
Section 5 discusses the overall results and
Section 6 summarizes the conclusions.
2. Research on Emails and Organizational Dynamics
Organizations are systems that change constantly over time and their internal patterns of communication can reflect how an organization is evolving as a whole. Several studies have shown that a there is a significant correlation between changes in an organizational network and the evolution of organizational behaviours (
Li et al. 2017). In this context, the analysis of communication flows within an organization is of utmost importance for understanding its dynamic relationships, and the effect of these patterns on the behaviour of individuals and groups.
Network Analysis, based on digital forms of communication, like email, is an established approach to better understanding organizational networks. Email network analysis has a broad set of applications in analytics, ranging from organizational design to operational efficiency and change management. Email communication analyses usually address two main dimensions of this: network structure, by measuring the degree of connectivity, and its dynamic change over time.
This latter dimension is mostly ignored in studies dealing with dynamic complex systems; even the temporal dynamics of networks influence their properties (
Scholtes et al. 2014). One feasible explanation is that many of the methods and models developed for static networks could be inapplicable or need non-trivial generalizations to be implemented in networks with a temporal dimension (
Holme 2015). For example,
Holme and Saramäki (
2012) argue that measures developed for static networks need revising when the temporal nature of network edges is explicitly analyzed. One approach to circumvent these limitations is to present temporal networks as sequences of static graphs (
Michail 2015), or layers in a multilayer network (
Lee et al. 2015). Another aspect of interest is the sequence of interactions among network members. Time and sequence, as two temporal aspects of social interaction, are typically used separately in existing temporal network measures, which may be problematic, because it is not clear when interactions are part of the same sequence (
Falzon et al. 2018). This is typically solved by combining sequence and time together in order to specify—based on context—the threshold to consider two social interactions as part of the same sequence.
Emails represent a major source of electronic communication in an organization. Therefore, email based organizational network analysis is often seen as a potential tool to describe and visualize structural holes and bottlenecks, critical connections, irregular communication patterns, stress on overburdened entities, fragile or isolated actors, and to identify optimal network structures. In addition, it may help in the detection of emerging communities, by detecting distinct groups or subgroups inside hierarchies in the organization, possibly each with its own culture and mode of operation.
Appropriate connectivity in networks within organizations can have a substantial impact on performance, learning, and innovation. Identifying influential, or leaders’, nodes in networks can be regarded as ranking important nodes, and it has become one of the main problems in network-based information retrieval and mining (
Domingos and Richardson 2001). For instance, in organizational network analyses, homogenous actors with similar attributes are locked together, diminishing their capability of absorbing what is going on beyond their immediate relationships (
AbouAssi and Tschirhart 2018). Strong ties are associated with compromise, and reduced conflict and opportunism (
Polidoro et al. 2011). As new information arrives, actors and ties can appear or disappear, and the strength of the ties can change (
Li et al. 2017).
Organizational networks consist of
a finite set or sets of actors and the relation or relations defined on them (
Michalski et al. 2011). Actors are linked to each other by social ties, and these relations are the core of the organizational network approach. Social networks are presented using
graph structures, where
nodes are actors and
edges or
relations are connections between them.
Depending on the scale of analysis, an actor may represent a discrete individual, larger subgroups, a project team, or a division. The interactions that occur within internal information networks are poorly understood and, therefore, are unmanaged processes. Social networks may be inferred from email communications and used to examine how organizational entities interact with each other, characterizing the many informal connections that link different roles together. Leading roles within organizations are often more linked to the number of relationships an individual within a network is at the centre of than their actual job description.
Research projects dealing with mining email archives have to do with privacy, and, therefore, to assess the release of private information is of paramount importance. This issue can be addressed in three ways, each representing each a layer of protection: (1) a commitment to anonymized analysis, providing results aggregated by team or working unit, (2) restricting the content analysis to email header information, and (3) maintaining transparent communication by holding regular status meetings with partners, in which the process and findings are described. It is worth considering that, depending on context, high-level goals aimed at the project and the information available from emails, must be in alignment, since the analysis of rather limited information from emails could compromise the positive outcome of the project.
The idea that the connectivity of a team is highly correlated with its performance is not new (
Losada 1999). Neither is the idea that the ways in which personnel within an institution collaborate affect overall outcomes, such as individual and group performance, degree of innovation and employee satisfaction (
Zenk et al. 2010). In the past decade, studies using e-mail have become popular in social network analysis, and much work has been done on this subject. Important research will be presented here.
Kolli and Narayanaswamy (
2013) analysed email communication using a social network framework for crisis detection in a large organization. The work of
Gloor et al. (
2014) measured team creativity and collaborative innovation through longitudinal social signals, using electronic records of interpersonal interactions like e-mails. The first of these signals was
Rotating Leadership, measuring the degree to which, over time, actors in a team vary how central they are to the team’s communication network structure. The second was
Rotating Contribution, which measured the degree to which, over time, actors in a team vary in the ratio of communications they distribute versus receive. One year later, the same author described an experiment measuring
organizational consciousness, comparing six “honest signals” of interpersonal communication within organizations with specific metrics of performance, using an e-mail-based structural social network analysis of the organization (
Gloor and Colladon 2015).
By modelling e-mail interactions as communication in social networks,
Merten and Gloor (
2010) recognized a possible source of stress caused by email. They investigated positive and negative e-mail usage patterns and their influence on job satisfaction. In this work, the authors also studied the integration of new employees by measuring e-mail communication during the first working day and after the first working week.
Biswas and Biswas (
2015), using data mining techniques and graph theory, carried out an analysis focused on ego-centric community estimation, to detect reachability and isolability in the actors within networks. The authors considered reachability as a measure for estimating the ability of any node to reach out to members of their community, while isolability accounted for the ability of any community to isolate itself from rest of the network.
The work of
Nawaz et al. (
2016) studied the grouping of individuals with similar neighbourhood and communication behaviour using email metadata, such as number of sent and received emails, subject length, text, email and attachment sizes, and the date and time. The community evolution process was studied using different clustering techniques, in addition to graph analyses.
3. Description of the Dataset
The dataset we use here is the Stanford Network Analysis Project (SNAP) “
email-Eu-core-temporal” network, a well-known reference for Social Network Analysis (SNA) of email traffic (
Yin et al. 2017;
Leskovec et al. 2007). The dataset was constructed using real email traffic data from a large European research institute. Anonymized information about all incoming and outgoing emails in the research institute was collected over 18 months. The information retained consists of the (anonymized) sender, the (anonymized) receiver and the email timestamp. To convert the set of email messages into a network, each email address is considered a node. A directed edge between nodes
i and
j is created if
i sent at least one message to
j. SNAP also provides an additional dataset, “
email-Eu-core-department-labels”, which associates each individual e-mail address to one of the 42 departments of the organization. The resulting network consists of 986 nodes (unique email addresses). Since 21 email addresses had only outgoing messages within the organization, and 162 e-mail addresses had only incoming messages from within the organization, there are 824 transmitting nodes and 965 receiving nodes. Membership in a department ranges from 1 to 109, with a mean of 23.93 members and a median of 14.5.
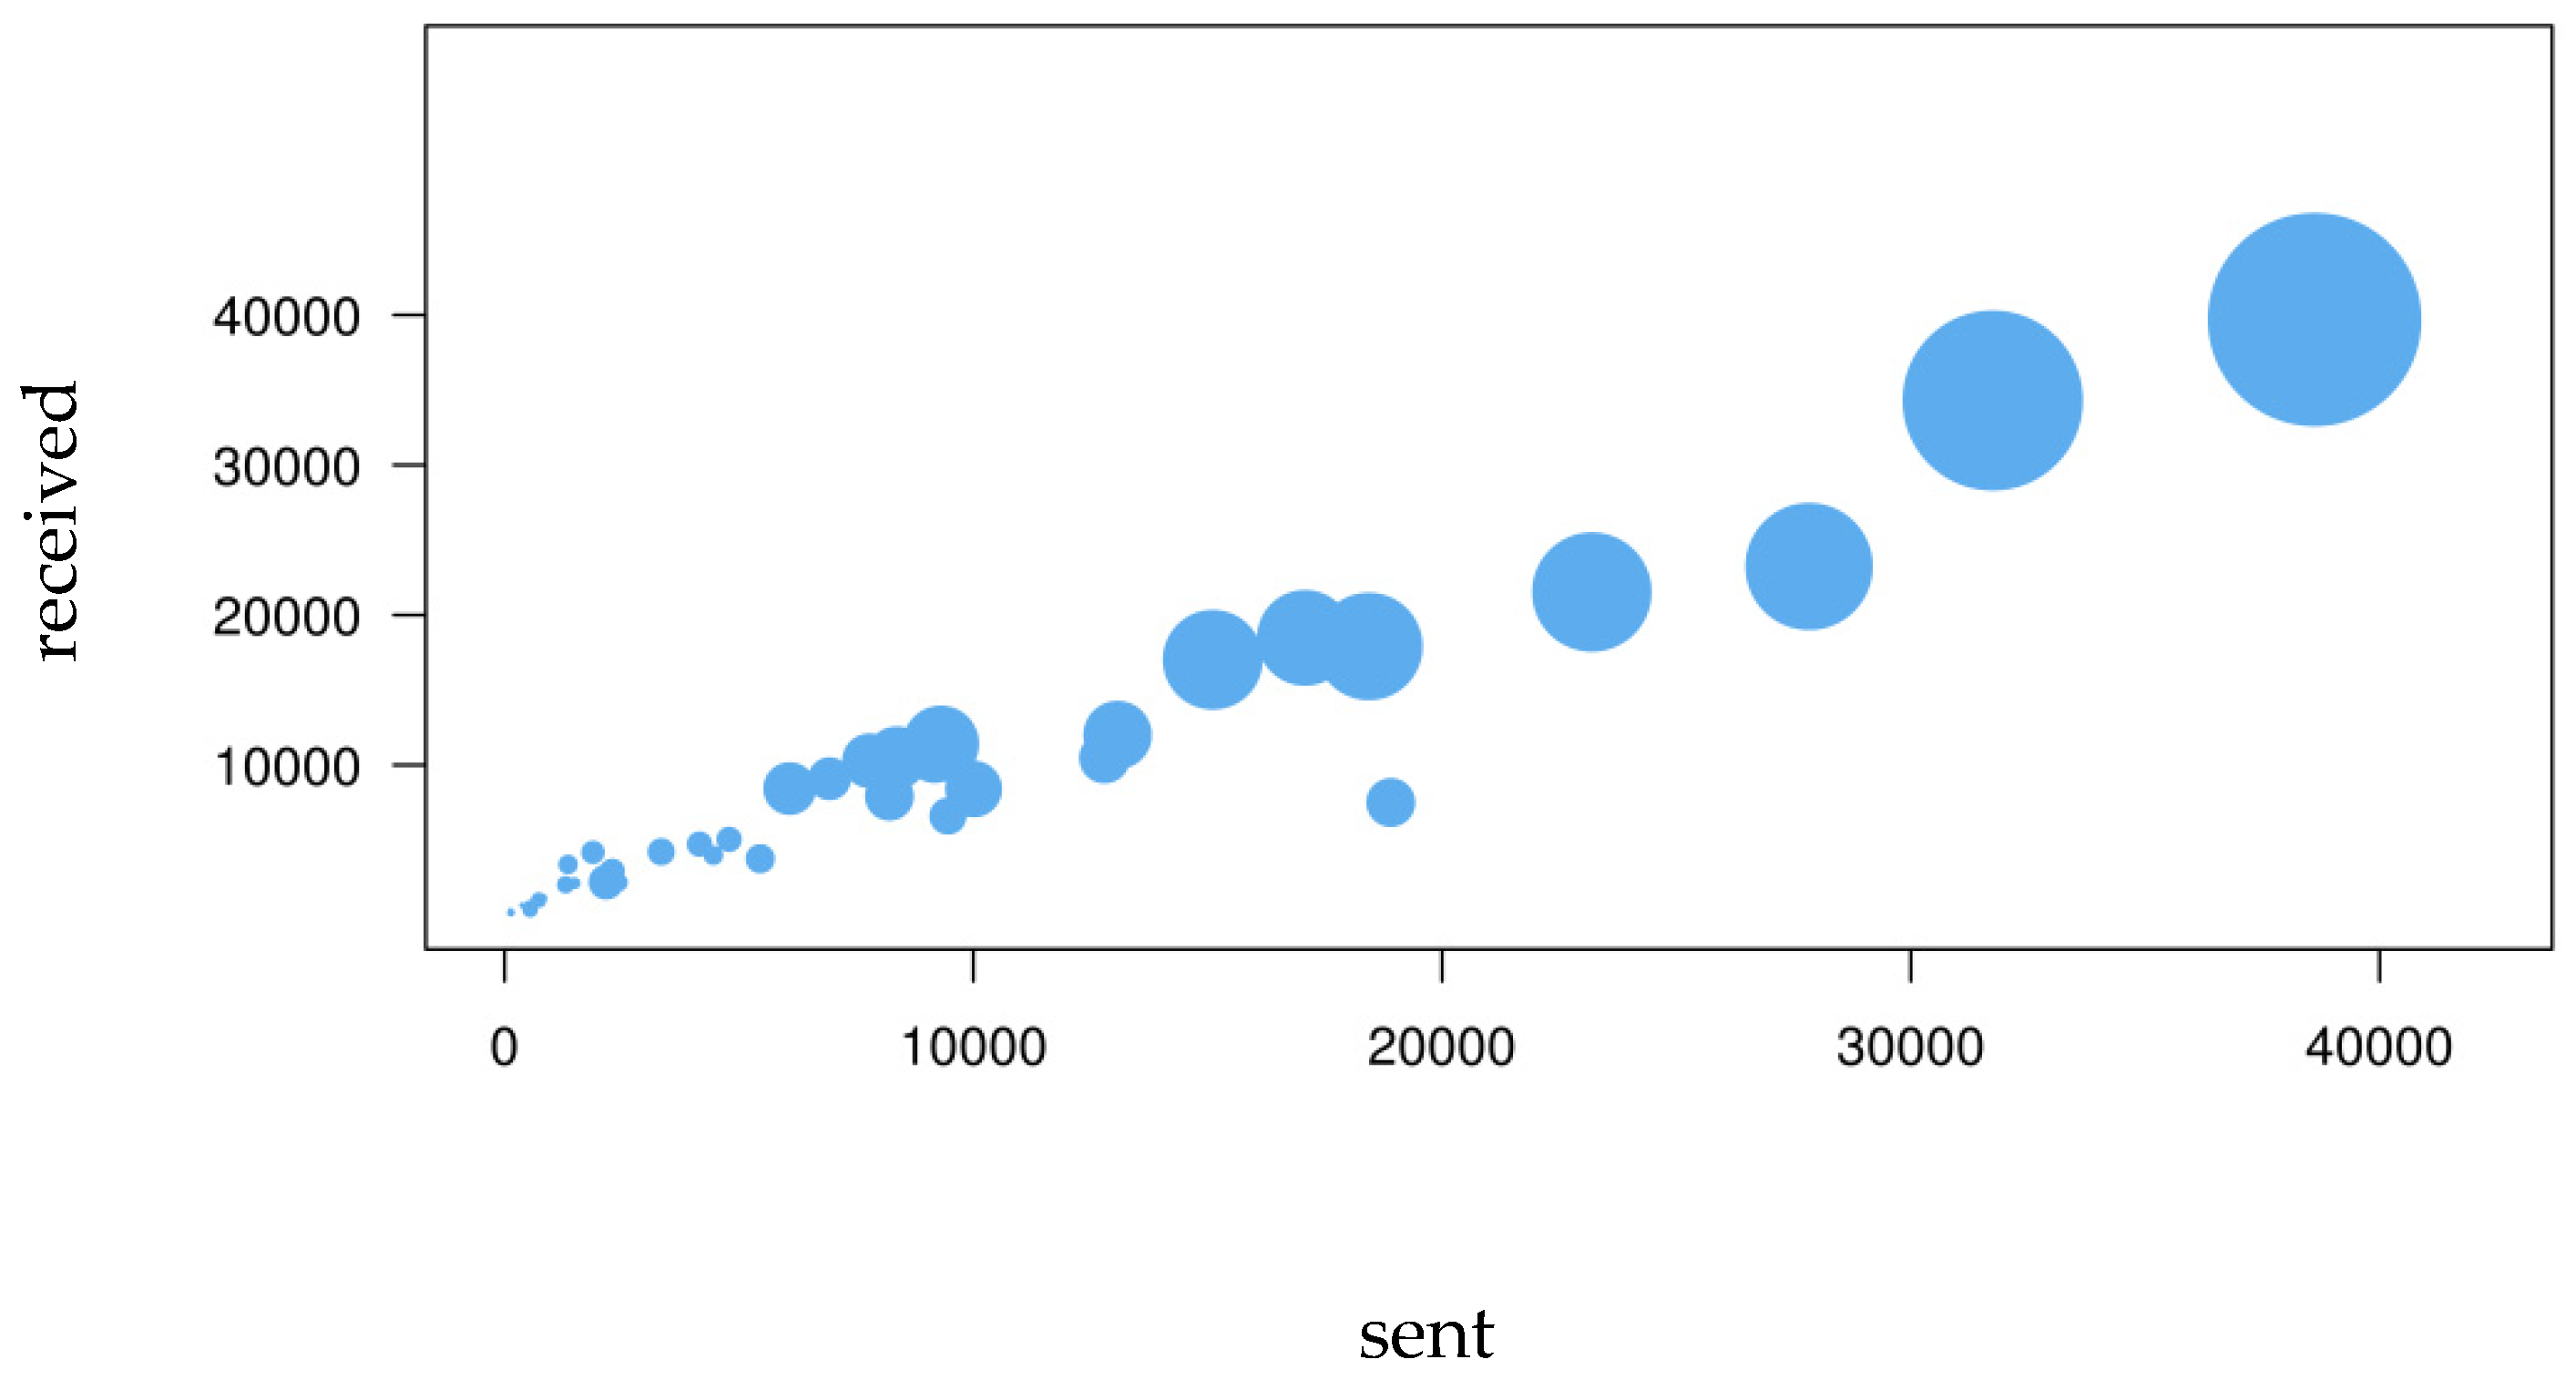
The number of e-mails sent by each individual is highly correlated with the number of e-mails received (Pearson correlation = 0.747). The correlation between the number of sent and received e-mails is even higher when summarized at department level (Pearson correlation= 0.967). E-mail activity appears to be an effect of the individual’s role within the department and the organisation at large, rather than an attribute associated to the role that each department has inside the organisation. The number of e-mails sent by a department’s members to members of other departments is proportional to the number of e-mails received from other departments (
Figure 1 and
Table 1). In addition, even though there is a significant variance in the number of e-mails sent or received by each individual (
Table 2 and
Table 3), the aggregate figures at department level are, to a large extent, proportional to the number of individuals in each department. Even though there is a significant variance among individuals as regards e-mail activity, the e-mail flow between departments is, to a large extent, symmetrical.
4. Modelling Based on Social Network Analysis Indicators
There are a large number of indicators that can be applied in order to measure the various aspects of networks in an organisational context, at either an individual or institutional level. As discussed in the preceding sections, such indicators are often used in SNA, but their application is usually limited to simple rankings of individual actors in the network. What is largely missing is an identification of causality between these SNA indicators, and an objective measure of the performance of the individuals, or the network as a whole. The reason for this is usually a lack of data on system variables that are independent of the network structure itself. For example, data may be available on the follower structure of a Twitter account network, but it is difficult to associate them with data that reflect the real importance of a specific Twitter account. In practice, such analyses would be limited to calculating the total number of followers of an account which, by itself, does not (or should not) constitute a measure of the importance of the account. Moreover, most SNA indicators would be highly correlated with number of followers, creating an additional bias.
We explore here the possibility of using SNA on the internal email communication patterns of an organisation in order to explain certain operational characteristics. In order to do so, we chose a set of independent variables that can be extracted from the available data and constructed a model that predicts two indicators of performance.
On the side of the independent variables, we extract SNA indicators at two levels. At a network level, we use the well-known graph theory concept of
closeness centrality, an indicator that reflects how central each individual is to the “centre” of the organisation. In order to capture differences between the role of each individual as a sender or recipient of information, we use the two directional forms of closeness, normalized to account for the network size, adapting from (
Freeman 1979):
where
and
the distances (number of edges, or “
degrees of separation”) between nodes
i and
j in the two directions (
Melhorado et al. 2016).
At a second level, we use SNA indicators that measure the role of each individual at “small world” level through the local clustering coefficients, proposed by
Watts and Strogatz (
1998). The clustering coefficient of node
i is equal to the number of triangles
connected to this node divided by the number of triples (i.e., potential triangles) centred on it:
where
As in the case of closeness centrality, this assumes directed clustering in weighted networks can provide additional insight into the structure and dynamics of a social network. Nevertheless, a node can be part of triangles, with arcs pointing in different directions. Four types of triangles can be distinguished (
Yin et al. 2017;
Leskovec et al. 2007):
In: a triangle with two arcs incoming to
i (j→i, k→i, j→k or k→j) (
Figure 2a)
Out: a triangle with two arcs coming out of
i (i→j, i→k, j→k or k→j) (
Figure 2b)
Cycle, a triangle where every arc has the same direction
(j→i, i→k, k→j or vice versa) (
Figure 2c)
Middleperson: a triangle where the two arcs of
i have different directions and there is an arc between
j and
k (or vice versa), without forming a cycle. There are two arcs incoming to
k or
j (
j→
i,
i→
k,
j→
k or vice versa) (
Figure 2d)
A directed clustering coefficient can be specified for each of the above cases, in order to account for the different patterns. Each coefficient is defined as the number of triangles of i with a specific pattern of arc directions, divided by the number of potential specific triangles of i.
If
is a binary variable that indicates whether there is a connection between
i and
j or not, and
is the number of e-mails sent from
i to
j (and, consequently,
if and only if,
), the four clustering coefficients can be defined as:
where
is the strength of the connection between node
i and its adjacent nodes
j, expressed as:
To decide on the dependent variables to use for modelling performance, we construct custom features that can be derived from information not already used in the calculation of the independent variables. The dataset we use here is limited in terms of the type of information it includes. For example, there is no information on the job description of each individual, which would allow us to explore whether specific roles in the organisation lead to higher email exchanges. On the other hand, the dataset does offer two types of information that could potentially be useful in creating additional features of higher explicatory value:
a. The intensity of bilateral email exchanges between individuals
i and
j: the hypothesis is that the total number of e-mails exchanged between two members of the network is a reflection of the strength of their relation. While this number is not used in the calculation of SNA indicators, the hypothesis is that the SNA indicators can (at least partially) explain it, i.e., whether the centrality of two individuals in the network influences the number of e-mails they exchange. The work of
Zhuang et al. (
2012) suggested that the number of interactions among members of a social network is a predictor of their social ties. The work of
Lou et al. (
2013) studied reciprocity in social network links, while
Wang et al. (
2013) explored how the links are related to each user’s profile. In both cases, the number of messages exchanged has a strong correlation with the role of each user in the social network.
b. The delay in replying to an email exchange: the dataset provides the timestamp of each email which—in turn—allows the measurement of the time between an email from
i to
j, until an email from
j to
i is sent. The data does not distinguish between whether the email from j to i was an actual reply to the original email, but it is sufficient for this application to assume that the communication pattern is continuous, regardless of whether the email exchanges follow a specific subject. The use of response time as a variable in the analysis of social networks is a growing line of research. The work of
Kalman et al. (
2006) identified persistent patterns in the latencies of responses in digital communications. The work of
Avrahami et al. (
2008) suggested that responsiveness, or the time until a person responds to communication, can affect the dynamics of a conversation, as well as participants’ perceptions of one another. The work of
Kalman et al. (
2013) extended the concept of
chronemic research—the exploration of the temporal dimension in communication—and associated it with Social Information Processing. They suggested that chronemic variance can be a conduit for important information about the members of a social network, an assertion that we use as a starting point for the definition of the response time variable in our model.
The results of the regression suggest that the SNA indicators explain the variation in the intensity of the bilateral flows and the delay in responses sufficiently well. In the first case, R2 is remarkably high at 0.8781. The number of emails sent from i to j appears to be positively correlated with the out-closeness centrality of i—i.e., how close i is to the centre of the network as regards sending emails. Nevertheless, it is negatively correlated with the in-closeness centrality of i. Seen from the j point of view, the in- and out-closeness centrality estimates have—as expected—the opposite signs. The correlation with the local clustering coefficient is not as straightforward. The in-, out- and middleperson indicators of i show a positive correlation, while the cycle clustering coefficient has a negative correlation. On the side of j, the correlations are not symmetrical. It may be implied that the middleperson role generates more email activity, while the cycle role generates less, for both i and j. It is also interesting to note that the strength of email exchanges is expected to be higher when i and j belong to the same department.
Regarding the time it takes for a reply to be received, R2 is lower (0.5556), but still acceptable. Most probably, the influence of possible weekends between the original email and its reply distorts the results. Even so, the estimates for the independent variable are in the expected direction. Individuals with high out-closeness centrality are expected to reply (as j) and be replied to (as i) faster than the average, while high in-closeness has the opposite effect. The in- and out-clustering coefficients have opposite signs, but have the same direction for i and j. This suggests that individuals with a high out-clustering indicator reply and are replied to faster. High in-clustering or cycling clustering coefficients suggest higher delays in replies. The middleperson clustering coefficient has a negative time for i and a positive one for j. Finally, similarly to the case of intensity, the time to reply is, on average, lower when i and j belong to the same department.
5. Discussion
The methodology and the results presented here suggest that, from a technical point of view, it is feasible to collect data from the email traffic within an organisation and derive indicators that may be useful for the analysis of certain operational characteristics. Given the research questions raised in the introduction, each point can be discussed separately:
Suitable indicators that take into account the direction, intensity and frequency of information flow among the organisation’s members: Our results suggest that it is possible to use a minimal set, that includes (anonymized) sender id, (anonymized) recipient id and the email’s timestamp as data that can help infer the role of an individual in an organisation. This information is sufficient for the construction of a (graph) network, which in turn allows for the calculation of several indicators and measures. While several options for the choice of indicators are available from the literature, our experiments identified the combination of a measure of each individual’s role in the overall network (closeness centrality) with a group of clustering coefficients, which quantify the individual’s role at a small world scale, as the most suitable to explain the variation in the dependent variables. The modelling results suggest that it is important to consider the relative roles of both the sender and the recipient of each email communication. We also recommend that the directional version of each indicator is used, since the asymmetry in the intensity and frequency of the communication flow among individuals reveals patterns that can be useful in the interpretation of the results.
How such indicators can be connected with human resource and overall organisational efficiency measurements: We have used two custom measures that allow for quantification of the intensity and speed of email exchanges among members of the organisation. Both are modelled sufficiently well using the independent variables that we selected. Moreover, the results suggest that members belonging to the same department have a more intense and frequent communication pattern than ones who do not. These two measures have a direct physical interpretation and have both been identified in the literature as important predictors of organisational behaviour. Our methodology allows for the explanation of different patterns in email communication as a result of each individual’s role, as expressed by the individual’s centrality and clustering coefficients. For example, a user closer to the centre, as sender (high ), would be expected to send a higher number of messages and to receive responses faster than the average user. Users with a middleperson profile tend to send a high number of emails (positive estimate for ) and reply to emails faster (positive estimate for ).
What are the possible areas of application and the trade-offs when applying such an approach? Intensity and response time can be measured and monitored at an organisational level and explained by a mix of the various user profiles. This information can be useful from the management point of view as long as certain conditions apply, but there are also several risks, as regards its possible misuse. As a starting point, monitoring the number of emails and the speed of response can be an indicator of an organisation’s workload, performance and efficiency. Depending on the organisation analysed, a growing number of emails—as a whole or for an individual—may be the result of higher output (positive), higher workload (negative), shift from other means (neutral), improved communication (positive), worsening real-life communication (negative), or several other reasons, that may or may not relate to performance. At an individual level, the number of emails and the speed of responses should not be confused with a measure of efficiency but, instead, should be seen as a gauge of the communication of the individual with the rest of the organisation. Therefore, we recommend that such an approach is used as a system to monitor overall patterns of communication throughout an organisation, using the underlying indicators to identify possible causes of changes in the patterns. A rising number of emails, combined with a rising average middleperson coefficient, probably signifies a less desirable communication structure than one with a falling number of emails and a rising average out-clustering coefficient.
Apart from the caution in selecting which application is feasible, two additional, potentially limiting, factors need to be addressed. On one hand, if a system that measures organisational or individual aspects of behaviour uses information that is generated by an individual, there is always a risk that the individual will change their behaviour, in order to influence the measurement. If, for example, an organisation monitors the average time to respond to an email as a direct or indirect performance measure, it can be expected that most members of the organisation will react according to the observer effect, and modify their response time according to the expected benchmark. In cases where the benchmark is a goal in itself, such a monitoring system may make sense (e.g., in an IT helpdesk), but in many real-life situation this could be detrimental to the quality of the response sent. The legal and ethical context also needs to be clarified. Access to personal data, such as email contacts, may be illegal in certain jurisdictions, or considered unethical in certain cultures. The capacity to derive useful information increases the more detailed the data that can be accessed are, but so do worries regarding its possible uses and misuses.
6. Conclusions
The methodology that we have presented here is an application of Social Network Analysis with suitable indicators that take into account the direction and weight of communications among members of the network. The indicators proposed allow for standard graph theory indicators, as well as social network clustering coefficients, to be calculated for real-life email networks and, potentially, for all types of directional social networks.
We also suggest how these indicators can be used to explain two measures of organisational operation—the intensity and speed of bilateral communication—through social network indicators. While this is possible for the specific indicators using the current dataset, data availability may be an obstacle in other applications. It is important to highlight that—especially in cases using social network analysis methods for Human Resources management—special care should be given to the availability of independent and objective data before SNA data are used for measurement purposes. Here, we demonstrated that efficiency measures and SNA indicators can be correlated, but there are limited examples of real-life data combining these two aspects. The sensitive and private nature of efficiency and communication data may limit the applicability of the approach, most probably to controlled environments within specific organisations.
SNA analysis can be useful when combined with additional data on the network and its individual members. However, there are privacy issues that need to be respected. There is a trade-off between the scope of measurements that increase the usefulness of such approaches, and the sensitivity of the information collected. For example, applying text analytics on the contents of the emails could allow measurement of the sentiment of the emails, but would obviously mean that access to such information would be possible. Several company policies state that employees’ email contents can be accessed (particularly when the information is stored in a device owned by the employer), but these provisions are normally applied for monitoring and investigating specific cases, often in a legal context. Applying them for analyzing—or even improving—working conditions, can face strong reactions from the ones monitored.
Even when privacy or other ethical concerns are not relevant, it is well known that people who are aware they are being monitored may not behave in a normal way. The literature has long proposed that ‘unobtrusive’ measurements should be carried out, whereby people are not aware they are being monitored (
Webb et al. 1966). This
observer effect (also known as
Hawthorne effect) may distort the results and applications of SNA in an organisational context. If individual members of the network know that—for example—the number of emails sent is positively correlated with high efficiency in an efficiency measurement system, they may be inclined to send more (possibly unnecessary) emails, so that their model-based efficiency indicators are higher.
The dataset we used here solely covers internal email traffic and is only suitable for the analysis of the internal patterns of email communication within an organisation. A similar analysis of external email communication would probably provide more insight, and possibly be more valuable, from a business perspective. Performing such an analysis for external communication flows would have, however, its own limitations, such as a lack of information on the communication patterns between actors outside of the organization itself. Without such information, a measurement of the role of the specific organization within its network of external communication would be incomplete.
Communication, in a business or private setting, is becoming increasingly multi-channelled. As a consequence, it may not be enough to analyse a single communication channel, such as email. One needs to also explore the evolution and patterns of other modes of communication, either conventional (telephone, regular mail) or digital (instant messaging, skype, etc.). In a similar fashion, other factors that may modify email and overall communication patterns should be explored. For example, changes in office distribution are often mentioned as a driver for increased digital communication (to the detriment of physical communication). In such a case, while exploring patterns of communication using emails would lead to distorted results, a comparison of the evolution of all possible communication channels, using a long enough observation period, could potentially provide useful results.
To summarize, the work presented here demonstrates that it is technically feasible to analyse email traffic within an organisation and derive information that can be usable for organisational management purposes. Technical feasibility does not, however, translate directly to practical feasibility. Specific care should be taken to ensure that the conceptual link between the measured indicators and the management objectives is robust. Such an approach can be applied on a variety of social networks, but its applicability is limited by privacy concerns, the existence of multiple alternative communication channels that evolve over time, the difficulty of establishing clear links between organisational structure and efficiency and, most importantly, the challenge of setting up a system that measures the impact of communication behaviour without influencing the communication behaviour itself.


