Article

The Profitability of Residential Photovoltaic Systems. A New Scheme of Subsidies Based on the Price of CO2 in a Developed PV Market

Department of Industrial and Information Engineering and Economics, University of L’Aquila, 67100 L’Aquila, Italy
Soc. Sci. 2018, 7(9), 148; https://doi.org/10.3390/socsci7090148
Submission received: 4 August 2018 / Revised: 25 August 2018 / Accepted: 27 August 2018 / Published: 31 August 2018
(This article belongs to the Special Issue Adopting Circular Economy Current Practices and Future Perspectives)

Abstract

:
Photovoltaic (PV) resource drives the clean global economy of the future. Its sustainability is widely confirmed in literature, however some countries present a growth very low in the last years. A new policy proposal is examined in this work. It aims to stimulate a new diffusion of PV plants in mature markets (e.g., Italy) regarding residential consumers. The subsidy is given to the amount of energy produced by PV plant for a period of 20 years (equal to its lifetime) and its value is calculated according to the scheme of European Emissions Trading System (EU ETS). Discounted Cash Flow (DCF) is used as economic method and two indexes are proposed: Net Present Value (NPV) and Discounted Payback Time (DPBT). The baseline case studies vary in function of two variables; (i) the share of self-consumption (30%, 40% and 50%) and (ii) the price of emissions avoided (10, 35 and 70 € per ton of CO2eq). Results confirms the environmental advantages of PV sources as alternative to the use of fossil fuels (685 gCO2eq/kWh) and economic opportunities are verified in several scenarios (from 48 €/kW to 1357 €/kW). In particular, the profitability of PV systems is greater with a subsidized rate of fiscal deduction of 50% in comparison to subsidies with a value of carbon dioxide lower than 18.50 €/tCO2eq.

1. Introduction

Social Sciences aims to integrate considerations regarding the sustainability of humanity (Lin 2012). The global warming is one the most important hazards for the Earth’s future and the use of renewable energy sources (RES) is a valid solution to stop their adverse influences on human life (Saavedra et al. 2018).
Global energy demand increased by 2.1% in 2017 and also, global energy-related CO2 emissions grew by 1.4% in 2017 (
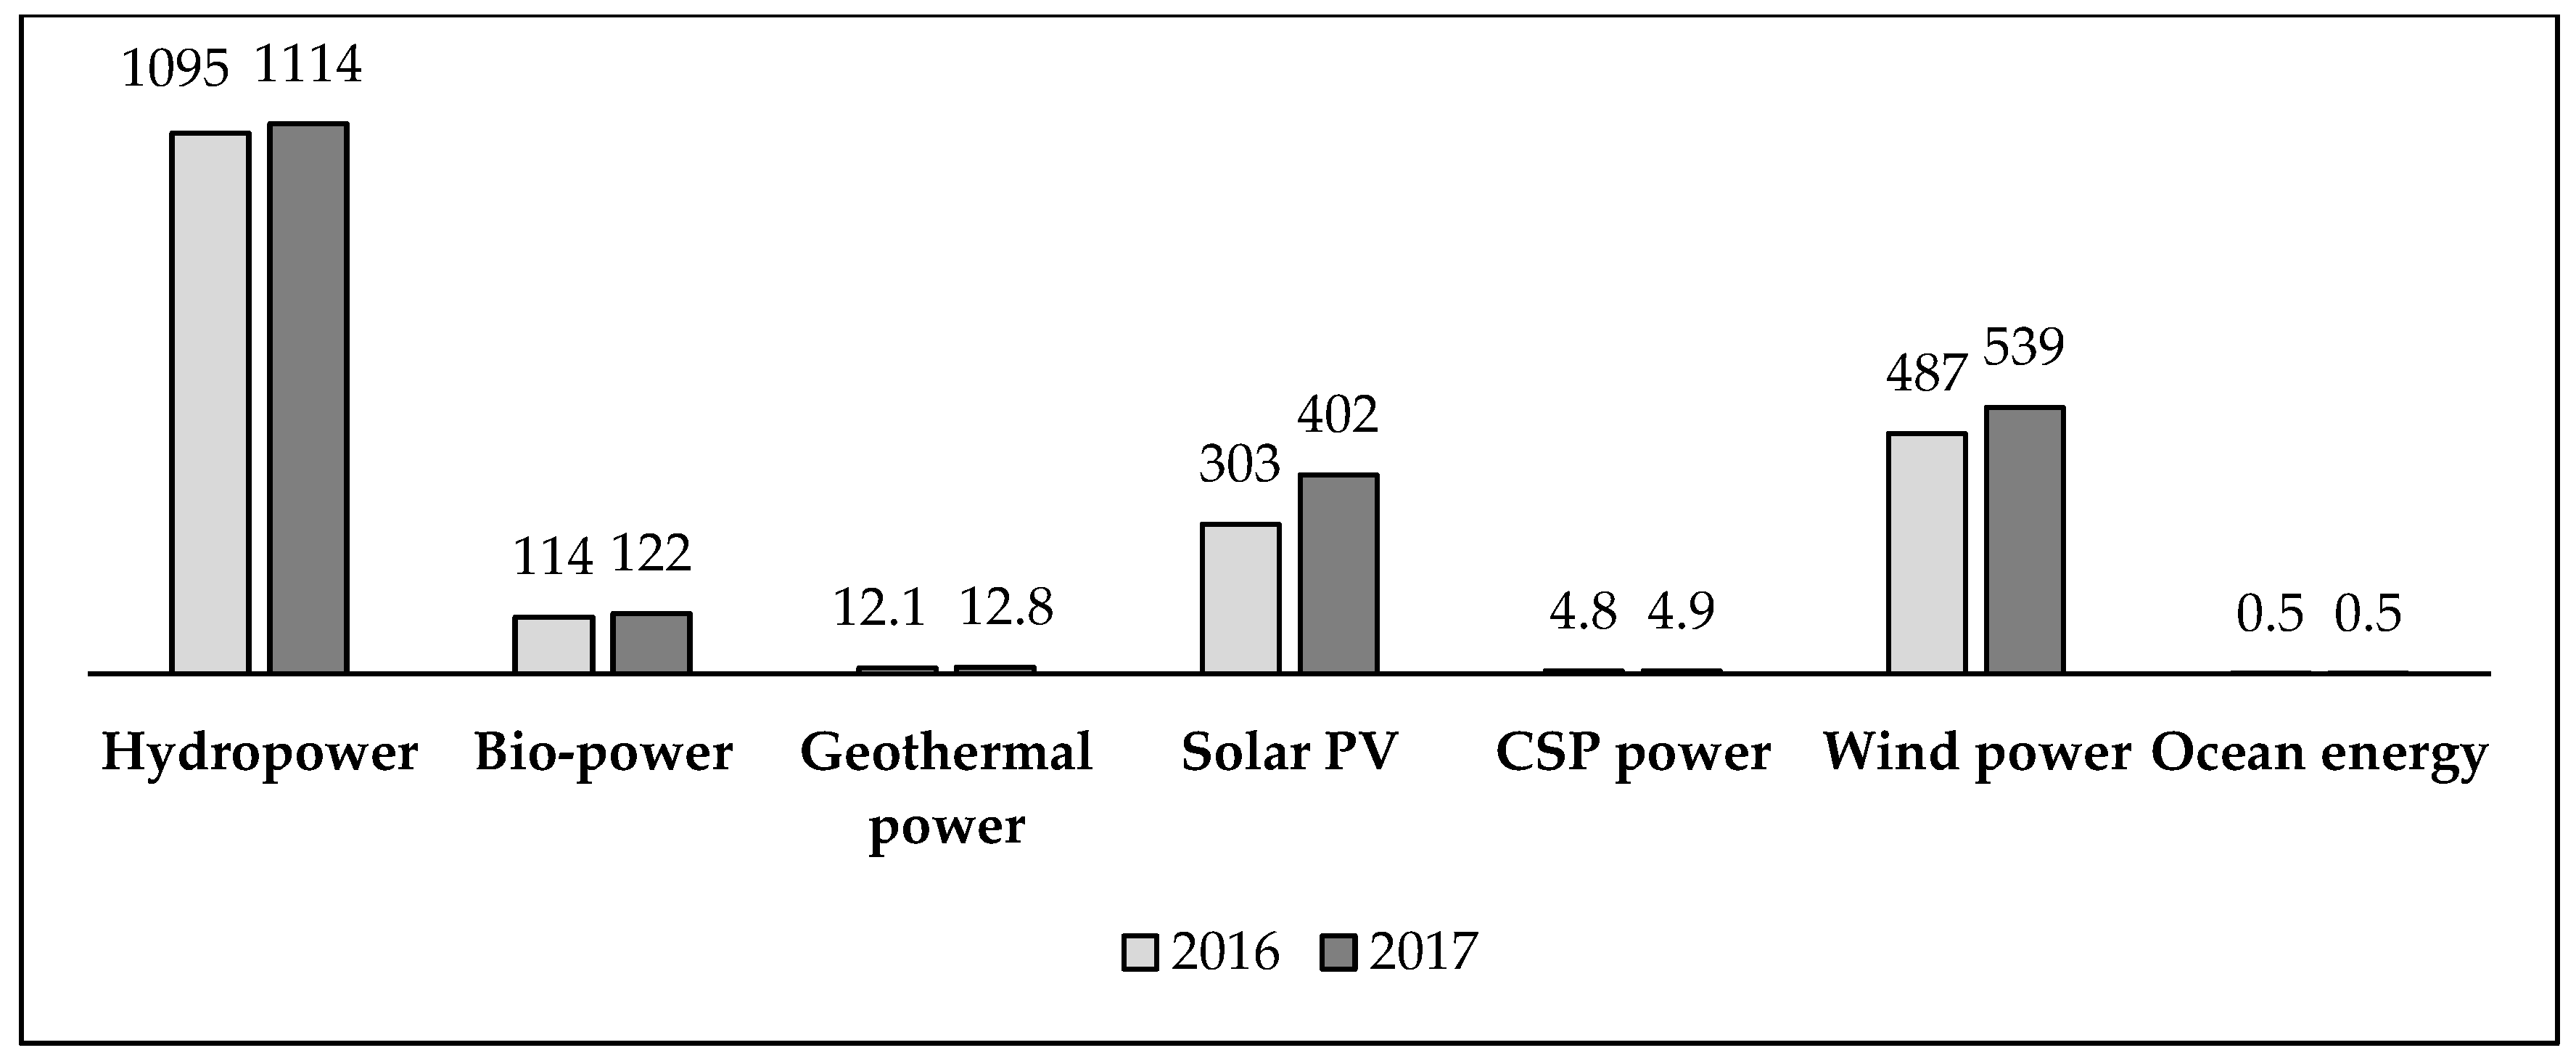
IEA 2015). Recently, the whole energy sector changes towards the use of low-carbon applications. Renewable energy (RE) power generating capacity is equal to 2195 GW in 2017 (+8.8% than previous year). This electricity transition is driven by increases in installed capacity of solar PV (+99 GW with an increase of 32.7% than 2016) and wind power (+52 GW with an increase of 10.7% than 2016)—Figure 1 (REN21 2018).
Economic growth is typically coupled with the use of energy consumption (Sun et al. 2018). However, the energy consumption is usually linked to a great level of emissions and pollutions. This effect is significantly reduced when the green electricity is used (Sampaio and González 2017). In addition, two actions push towards more effective future global initiatives. The first regards strategies that engage all political parties, the second aims to educate individuals on climate change (Dadural and Reznikov 2018). At the same time, residential energy consumption can be improved not only through adequate technological solutions but also with a behavior more eco-friendly to citizens (Escoto Castillo and Peña 2017).
PV sources can play a key role in this energy transition for the global energy supply (Breyer et al. 2017). Solar PV is a mature technology suitable for both small and large scale applications. It is a clean energy according to the principle of sustainability (Hosenuzzaman et al. 2015; 
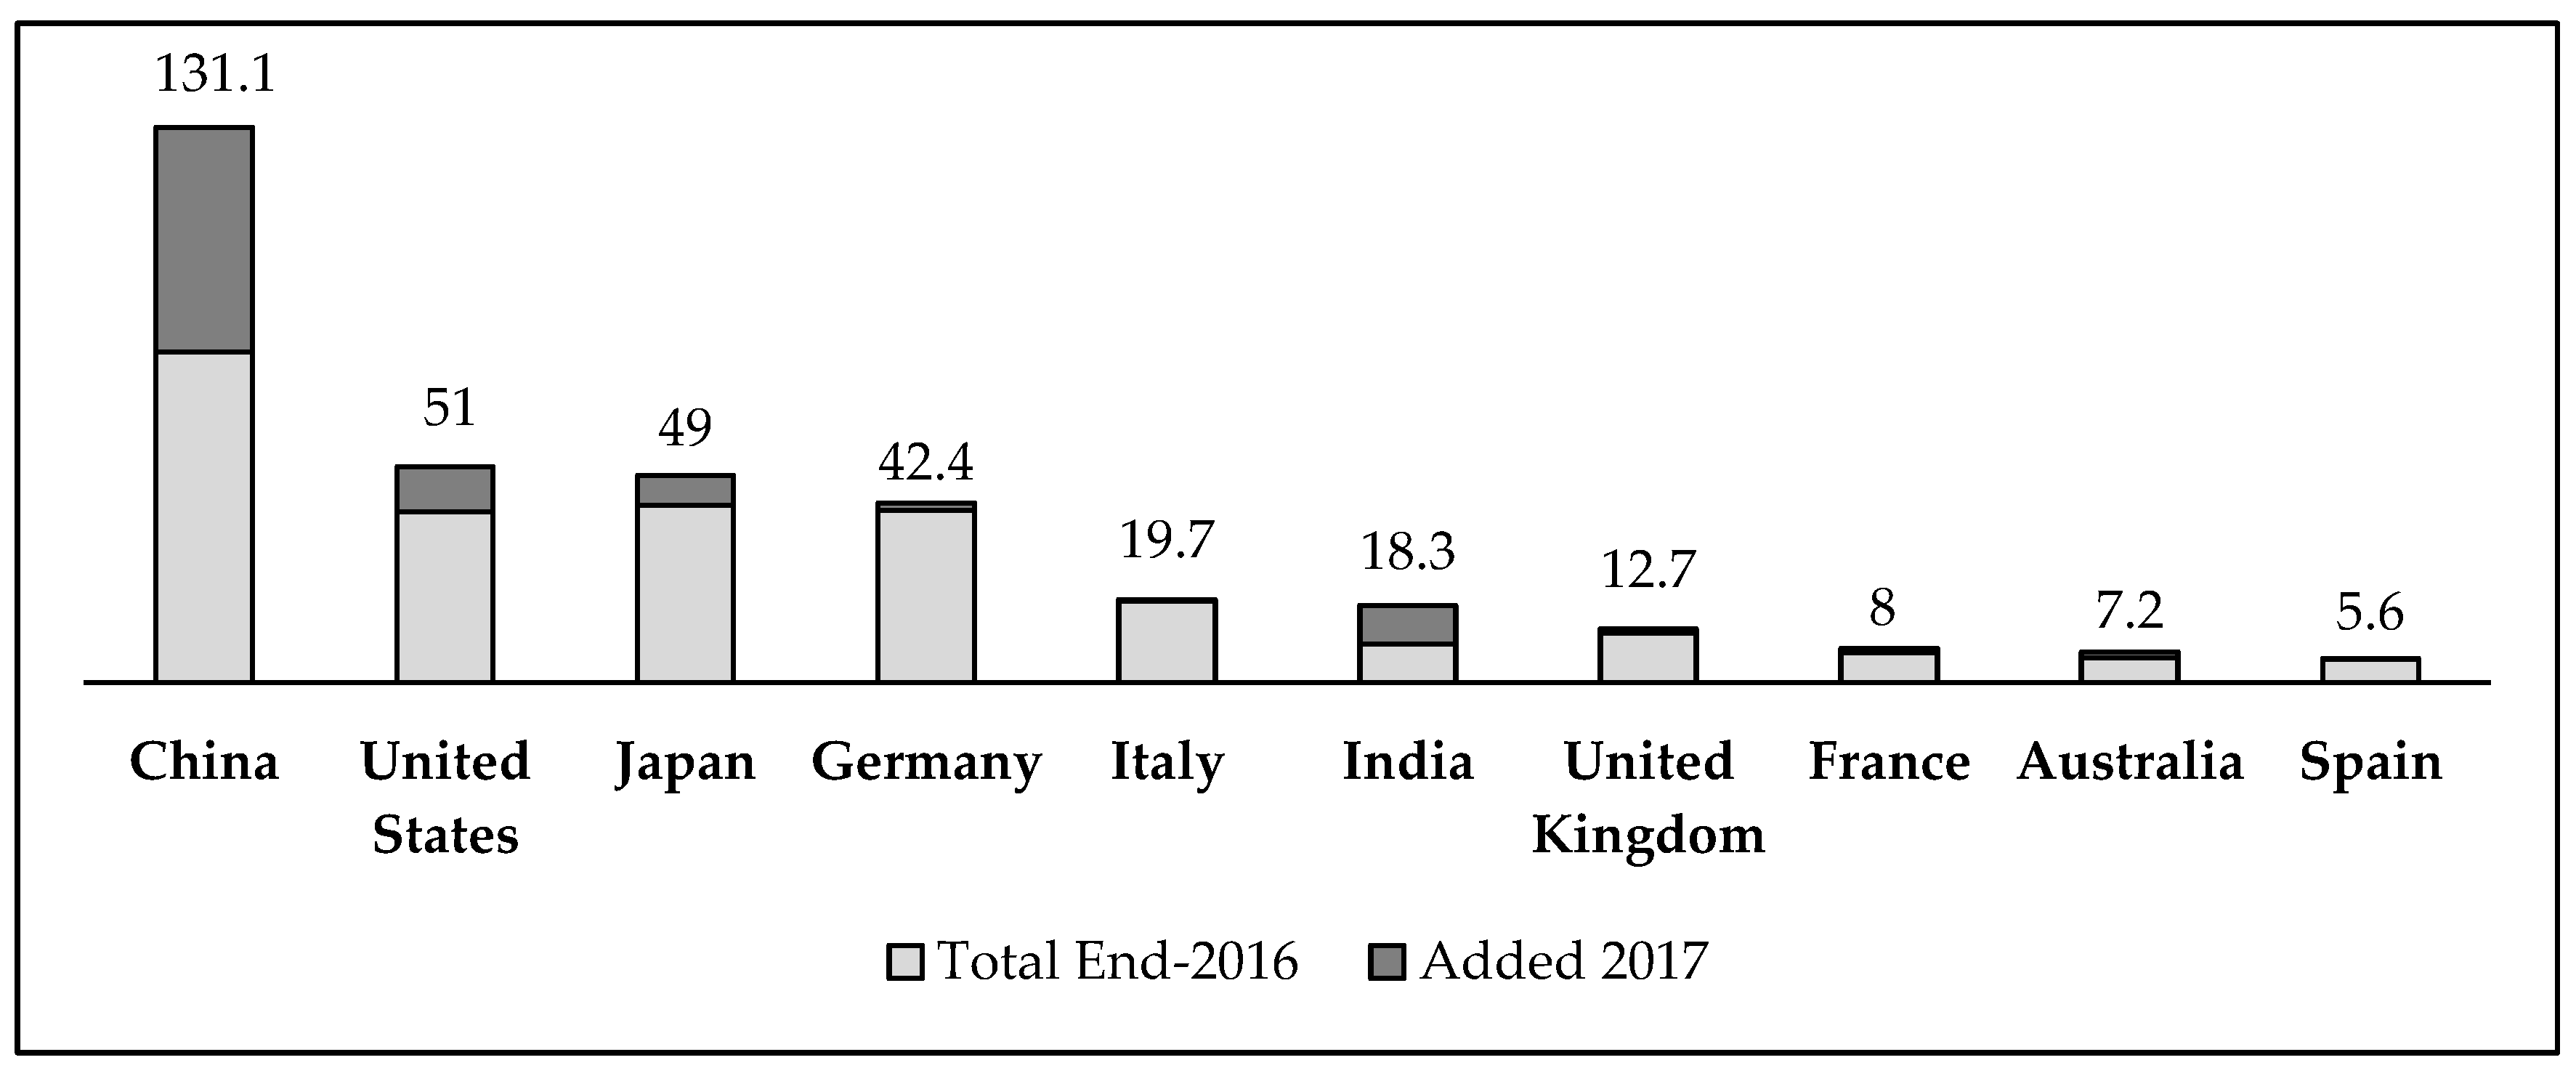
Khan and Arsalan 2016). Solar PV power capacity is equal to 402 GW in 2017 and it is concentrated in a short list of countries. In fact, about 86% of this power is installed in 10 countries with a role predominant of China (Figure 2). China (53.1 GW), United States (10.6 GW) and India (9.1 GW) represent the first three countries of solar PV power installed in 2017 (REN21 2018).
The Feed-in-Tariff (FIT) scheme has encouraged investors to be involved in RE production worldwide. Large energy providers offer long-term contracts to smaller-scale RE producers to sell their green energy to the market under a fixed tariff above the market rate (Pyrgou et al. 2016; Tanaka et al. 2017). The policy subsidy has determined the development of PV source with the aim to tackle the climate change. At the same time, the guaranteed security of tariffs, defined in a FIT scheme, has driven several investors to choose this resource (Avril et al. 2012; Strupeit and Palm 2016). In addition, it has determined an improvement of the technology, a reduction of costs and an increase of know-how of firms (Baur and Uriona 2018).
The economic feasibility of PV plants is well analysed in literature. Residential applications represent a typical case-study (Lee et al. 2017; Comello and Reichelstein 2017). The key-parameter of profitability depends by the typology of the market in residential PV systems: subsidies and the share of self-consumption are the main variable in developing and developed markets, respectively (Cucchiella et al. 2017a).
From environmental side, the greenhouse gas (GHG) emissions produced by PV systems are estimated equal to 29–35 gCO2eq/kWh (Fthenakis et al. 2008). Literature analysis presents a variety of approaches to calculate GHG emissions. Consequently, there is a wide variety in the evaluation of this value: for example some authors propose 20–25 gCO2eq/kWh (Louwen et al. 2016), other 60.1–87.3 gCO2eq/kWh (Hou et al. 2016). However, all studies converge to define that this environmental effect is widely balanced by the reduction of GHG emissions determined by the use of PV resource as alternative to fossil fuels. Assuming a lifetime of PV plant equal to 20 year, the environmental advantage is quantified equal to 21 tCO2eq per kW installed (Cucchiella et al. 2016). Another work has calculated a reduction of about 742.7 gCO2eq/kWh. It considers 37.3 gCO2eq/kWh and 780 gCO2eq/kWh for PV and coal resources, respectively (Mauleón 2017).
A review of CO2 price with government subsidy through FIT scheme is analysed for European countries (Bakhtyar et al. 2017). The evaluation of PV systems under carbon market is proposed also in Chinese context (Tian et al. 2017). A low carbon tax is able to finance the investment in PV plants (Mauleón 2017). The economic evaluation of PV systems is required for the development of the sector also in a market developed (Cucchiella et al. 2017b). A new research can try to consider policy, environmental and economic aspects. This work proposes the economic impact of a residential PV plant and a small size equal to 3 kW located in Italy is considered. The idea is to implement a new policy of subsidies for residential consumers that implemented PV systems. The subsidy is given to the amount of energy produced and its value is calculated according to the reduction of CO2 emissions.
The paper is organised as follows. Section 2 presents a literature review concerning the mechanisms of market of CO2. An economic model based on DCF is proposed in Section 3. Starting by input data, NPV and DPBT are used to evaluate the economic performance of PV systems considering several scenarios (Section 4). Section 5 presents some concluding remarks.

2. Literature Review

The European Union (EU) launched the EU ETS to fight global warming in 2005. EU ETS covers around 11,000 power stations and industrial plants. The inspiring principle of EU ETS is to give firms an incentive to move towards less fossil-fuel intensive production. It works on the ‘cap and trade’ principle. The emission allowance (EUA) allows the firms to emit one tonne of CO2 and each of them has assigned a limit of CO2 emissions (cap). The following year, a defined number of EUAs must be returned. If this number is lower than the assigned cap, the firm has the opportunity to sell EUAs (trade). When, instead, it is greater the firm must buy the missing shares. Alternately, heavy fines are provided. The limit is reduced over time so that total emissions decrease (European Commision 2016).
Several works have considered the European context. Energy prices are considered by some authors as the main driver of carbon price because power generators can use several fuel inputs (Christiansen et al. 2005; Convery and Redmond 2007). Other works have underlined the relevance of other critical variables as weather conditions, policy and regulatory issues and economy activities. Prices vary to uncontrollable temperatures changes during colder events (Alberola et al. 2008). At the same time, institutional strategies have a direct impact (Aatola et al. 2013). In fact, during the First Phase of EU ETS coal and gas prices have influenced CO2 prices, while electricity price has played a role more during the Second Phase (Keppler and Mansanet-Bataller 2010). Foreign direct investment (FDI) increase carbon emissions in the host country influencing the carbon price (Doytch and Uctum 2016).
The market instrument of CO2 ETS is been implemented also in several Chinese regions and it is regulated by the government (Yang et al. 2017). The analysis of market highlights that the carbon price is closely linked to the supply and demand of carbon allowance. The supply is determined by Government policies, while the demand is determined by the regional economic pattern and energy structure (Yang et al. 2018). The development of an ETS is more complex in a vast country with regional differences (Böhringer et al. 2014). Other international initiatives to tackle the increase of CO2 emissions are California cap-and-trade program (Olson et al. 2016), cap-and-trade programs of the Republic of Korea (Park and Hong 2014). A comparative among several programs is investigated and EU ETS is the main cornerstone to combat climate change (Xiong et al. 2017).
However, several works have identified the criticism of EU ETS. Three limits are identified: (i) it is not an attractive market for its economic added value, (ii) it is not able to maintain the carbon price sufficiently high and (iii) it has no reduced significantly the overall emissions (Gerbeti 2017). In particular, EU ETS had not encouraged green investments (Segura et al. 2018) and its ineffectiveness is substantiated in times of economic crisis (Vlachou and Pantelias 2017). Another work defines that EU ETS lacks fairness on both effectiveness and the distribution of the duties involved in climate change (Dirix et al. 2015). The risk of carbon leakage is extremely high for energy-intensive industries. Some firms can transfer their production in countries with lower emission constraints (Gerbeti 2018). This work does not aim to define a judgement on EU ETS. It is based on the approach that the emissions must be quantified in economic terms and considering the European context, in this moment EU ETS represents the main reference.
Literature review has covered mainly the first two phases of EU ETS. The main mechanism was free allocation based on past emissions. Since 2013, auctioning is the default method of allocating emission allowances (Cai and Pan 2017). The accurate prediction of carbon prices is an information useful for carbon traders, brokers and firms, who can use this information to manage their portfolios. This data is necessary also for policy makers, who have inputs on marginal abatement costs adjusting the emission cap (Zhao et al. 2018).
The development of carbon trading aims to tackle the climate change, to improve the energy system, to promote energy-saving and emission-reduction (ESER) system and to accelerate the transformation of economic growth (Fang et al. 2018b). The government control is a sensitive parameter in carbon trading system. In fact, policy measures can accelerate its development reaching the peak value of carbon emissions in short terms, but the effect can be also negative in specific economic periods. The equilibrium between demand and supply requires generally a run-in period to achieve balance (Fang et al. 2018a).
Carbon price is a tool for scientists to reduce global warming. The value indicated by several authors varies in a significant way. Nationally efficient CO2 prices are referred to domestic environmental benefits per ton of CO2 reduction. For example, it is equal to 63 $/tCO2 and 57.5 $/tCO2 in USA and China in 2010, respectively. A greater difference is instead found for 2013 between Europe (below 10 $/tCO2) and USA (35 $/tCO2) (Parry et al. 2015). Another work has calculated a global carbon price in order to estimate the annual transfer payments that would be required to compensate the damages linked to the emissions. It is equal to 35 $/tCO2 (Landis and Bernauer 2012). Other authors quantified the economic advantages linked to the technological solutions able to capture CO2 emissions. Benefits are evaluated considering a price of 13 $/tCO2 (Ogland-Hand et al. 2017). The substitution of fossil fuels with a renewable resource (wind) is evaluated in Chinese context. Carbon price varies from 233 CNY/tCO2 to 251 CNY/tCO2 and it is higher than real markets because a high proportion of free allowances is used (Lin and Chen 2018).
A group of economists has defined that about 75% of emissions regulated by carbon pricing are covered by a price below 10 €/tCO2 in 2017. This price is considered too low in order to support the low carbon transition (Metivier et al. 2017). There are other studies (Gerbeti 2016) that claim to economically enhance the CO2 contained in the goods, representing it as a raw material of industrial production processes.
The effective carbon rate (ECR) is the sum of carbon taxes, specific taxes on energy use and tradable emission permit prices. The OECD has estimated the ECR for 41 countries. ECR is assumed equal to 30 €/tCO2 (OECD 2016). This value is lower than other studies: 50 €/tCO2 (Alberici et al. 2014) and 50 $/tCO2 (Smith and Braathen 2015).
A recent report of the High-Level Commission on Carbon Prices guided by Stiglitz and Stern has defined relevant several indications for the future. From one side, a consistent quantity of emissions are not covered by a carbon price and from the other side, about three quarters of the emissions have a price lower than 10 $/tCO2. The Nationally Determined Contributions (NDCs) for 2030 associated with the Paris Agreement are not suitable to achieve the Paris target of “well below 2 °C.” This target could be reach using a price from 40 $/tCO2 to 80 $/tCO2 by 2020 and from 50 $/tCO2 to 100 $/tCO2 by 2030. In fact, the use of carbon pricing must be considered also non-climate benefits, for example access to modern energy, the health of ecosystems and improvements in air pollution and congestion (Stiglitz et al. 2017).
Some authors have identified the value of certified emission reduction equal to 20 CNY/ tCO2 and it is applied a case study of PV systems. Their results define that firms have not benefits until carbon price does not exceed 38 CNY/tCO2 (Tian et al. 2017). A comprehensive review has identified the social cost of carbon. Its minimum value is equal to 6.1 €/tCO2 (Isacs et al. 2016). The value of CO2 emissions is strictly linked to possible economic downturns and also to the volatility of energy prices in an organized market, as EU ETS (Mauleón 2017). The substitute price of avoiding CO2 emission (SPAC) is calculated for each technology and country in Europe. Values obtained are extremely far from market prices (Bakhtyar et al. 2017).

3. Materials and Methods

The methodology used in this paper is based on several steps:
  • The definition of emissions avoided using PV resource as alternative to the fossil fuels.
  • The evaluation of CO2eq emissions price.
  • The policy proposal.
  • The economic model.
  • The presentation of case studies.
  • Input data.

3.1. The Reduction in the Emissions of Carbon Dioxide

From environmental side, there is a reduction in the Emissions of Carbon Dioxide (RECD) when the energy is produced using a PV system compared to the use of fossil fuels. Starting by a hypothetical energy mix composed only by fossil fuels and considering results of literature review regarding GHG emissions from fossil fuels, the value of emissions released by a mix of fossil fuels (ECDFF) is calculated—Equation (1). The definition of emissions released by PV source (ECDPV) is defined considering also in this case the results of literature review regarding GHG emissions from this resource. In this way, it is possible to calculate RECD as difference between ECDFF and ECDPV—Equation (2).
ECD FF = ECD OIL × PEM OIL + ECD COAL × PEM COAL + ECD GAS × PEM GAS
RECD = ECD FF ECD PV
in which ECDOIL = emissions of carbon dioxide released by oil, ECDCOAL = emissions of carbon dioxide released by coal, ECDGAS = emissions of carbon dioxide released by natural gas, PEMOIL = percentage in energy mix of oil, PEMCOAL = percentage in energy mix of coal and PEMGAS = percentage in energy mix of natural gas.
Figure 3 reports several values concerning the Life Cycle Analysis of GHG emissions from electricity generation technologies. The difference between fossil fuels and RES is extremely significant. In this study an average value obtained by values reported in Figure 3 is chosen for the fossil fuels: ECDOIL = 824 gCO2eq/kWh, ECDCOAL = 1149 gCO2eq/kWh and ECDGAS = 568 gCO2eq/kWh.
Regarding the emissions of PV systems, values reported in Figure 3 vary from 5 to 92 gCO2eq/kWh, while ones reported in Section 1 from 20 to 87.3 gCO2eq/kWh. PV source is the core of this work and for this motive, other studies are proposed in order to choose an appropriate value: 15–76 gCO2eq/kWh (Bravi et al. 2011), 10.5–50 gCO2eq/kWh (Peng et al. 2013), 13–39 gCO2eq/kWh (Fthenakis and Kim 2013) and 49 gCO2eq/kWh (Cucchiella et al. 2017a). ECDPV = 42 gCO2eq/kWh is the value hypothesized and it is obtained as average value of all studies examined in this work.
The energy report in Italy underline a growth of natural gas occupying a leadership position with a share of 36.5%. The oil continues to decrease (about 34%) with a reduction of ten points in comparison to ten years ago. RES has a share of 19% with a decrease of hydropower and an increase of solar energy and wind. However, it is far by the maximum value (21%) reached in 2014 (ENEA 2018).
In order to evaluate the mix of fossil fuels is used the approach proposed by (Cucchiella et al. 2017a). Energy portfolio is calculated at net of renewables and imports. The following values are obtained for 2017 year: PEMGAS = 48%, PEMOIL = 44% and PEMCOAL = 8%. In comparison to the previous year, there is a difference. In fact, the percentage of both gas and oil is equal to 45.5%, while one of coal is 9% in 2016.

3.2. The Price of CO2eq Emissions

Section 2 has underlined that the carbon price is characterized by a great variability. For this motive, the trend of EU ETS is examined during the last year (from 26 July 2017 to 26 July 2018). A value for each month is reported in Figure 4. There is a significant growth in the last year (from 4.84 €/tCO2eq to 16.99 €/tCO2eq). A maximum value equal to 17.45 €/tCO2eq is registered on 24 July 2018.
However, it is opportune to underline as the prices of the last year are following many legislative changes in on-going process of the scheme. Certified emission reductions (CERs) and emission reduction units (ERUs) were effective until 2009. The absence of an agreement post-Kyoto has determined a significant reduction of CO2 price equal to about 14 €/tCO2eq and 17 €/tCO2eq for ERUs and CERs respectively (Gerbeti 2017).
The price of CO2 emissions (PCD) is assumed equal to 10 €/tCO2eq and this choice is assumed according to two motivations. The first regards that this value is the average value reported in Figure 4 and the second concerns the literature review proposed in Section 2, in which this value is often proposed by authors. Literature review and real markets have presented different values in several case studies. According also to the variability of this price, it is opportune to conduct a sensitivity analysis on this variable in order to image future scenarios. Consequently, three scenarios are considered in this work:
  • Low price of CO2 emissions (Low PCD), in which PCD is equal to 10 €/tCO2eq. In fact, it is the baseline value, but at the same time several authors have underlined that this value is not appropriate for a transition towards a society low carbon.
  • Moderate price of CO2 emissions (Moderate PCD), in which PCD is equal to 35 €/tCO2eq. This value represents the minimum value proposed by the report of the High-Level Commission on Carbon Prices.
  • High price of CO2 emissions (High PCD), in which PCD is equal to 70 €/tCO2eq. This value represents the maximum value proposed by the report of the High-Level Commission on Carbon Prices.

3.3. The Policy Proposal

Figure 1 has underlined that Italy occupies the fifth position in the ranking of PV power installed. In the last year, only 0.4 GW are installed. This result is negative, in fact among top ten countries only Spain has registered a lower value (+0.1 GW) (REN21 2018). The definition of negativity is given according to the environmental advantages linked to the use of solar resource.
The tradition tools of subsidies, as Feed-in-Premium and FIT, are no longer provided in this country. The policy choices support the development of PV residential sector through a 50% tax deduction in substitution of the typical value of 36%. The deduction is divided into ten equal yearly amounts.
This work try to propose a new tool of subsidy according to both Paris Agreement and EU ETS. The economic support is given for a period of 20 years, equal to the lifetime of PV plants. The initial assumption defines as all consumers employed to reduce carbon dioxide emission levels can receive an economic contribution. These funds are paid by operators who produce a level of pollutants greater than the value allowed. A comparison with existing literature is not possible, in fact for the first time this idea is applied to PV systems in residential applications.
The unitary value of subsidies (SUBPV) is obtained multiplying three factors: (i) the amount of reduction of CO2eq emissions substituting the fossil fuels with the production of energy by PV system, (ii) the price of CO2eq emissions and (iii) the amount of energy produced by PV system during its lifetime—Equation (3). The energy produced is calculated in function of several variables: average annual insolation (tr), optimum angle of tilt (kf), module efficiency (ηm), balance of system efficiency (ηbos), active surface (Acell), nominal power of a PV module (Pf) and number of PV modules to be installed (ηf)—Equation (4). The value of SUBPV varies during the lifetime in function of reduction of energy produced by PV system because a decrease of efficiency of PV system (dEf) is considered—Equation (5).
SUB PV , t = RECD × P CD × E out , t
E Out , t = t r × K f × η m × η bos × A cell × P f × η f
E out , t + 1 = E out , t × ( 1 dE f )
In an objective context, the value of SUBPV should vary also in function of RECD. In fact, if ECDPV can be assumed fixed for an operating PV plant, ECDFF varies in function of the energy mix. For example, this value is equal to 727 gCO2eq/kWh in 2017 while a value greater is obtained in 2016 (737 gCO2eq/kWh). At the same time, the value of SUBPV should vary also in function of PCD. In fact, this value changes in according to both supply and demand of CO2. For example, there is difference of about 12 € ton of CO2eq during the period analysed in Figure 4. This assumption is justified by Section 1, in which the variability of subsidy is perceived as an issue by investors.
The final purpose has a nature not speculative and consequently, it is possible to fix the value of PCD during all lifetime of PV system according to the principle used in FIT scheme.

3.4. The Economic Model

DCF analysis is a method of valuing a project using the concepts of the time value of money. It is based on an incremental approach, in which cash inflows and outflows are considered and a cost opportunity of capital is applied to aggregate several cash flows.
NPV and DPBT are the financial indexes proposed in this work. NPV is the sum of present values of individual cash flows—Equation (6). DPBT is the number of years needed to balance cumulative discounted cash flows and the initial investment—Equation (7) (Cucchiella et al. 2017a).
Four items are hypothesized as revenues: (i) fiscal deduction, (ii) saving energy through internal consumption, (iii) selling energy not used for internal consumption and (iv) subsidies—Equations (8) and (9). Six items are considered as costs: (i) investment, (ii) maintenance, (iii) assurance, (iv) taxes, (v) replacement of inverter and (vi) general—Equations (10) and (11). The mathematical reference model used in a previous research is considered (Cucchiella et al. 2017a) and a new item of revenue (subsidies) is added. The novelty of the work consists also in the calculation of this new value. The model is reported below:
NPV = DCI DCO
t = 0 DPBT ( CI t CO t ) / ( 1 + r ) t = 0
DCI = t = 1 N ( ω self , c × E Out , t × p t c + ω sold × E Out , t × p t s ) / ( 1 + r ) t + t = 1 N TaxD ( ( C inv / N TaxD ) × TaxD u ) / ( 1 + r ) t + t = 1 N ( RECD × P CD × E Out , t ) / ( 1 + r ) t
p t + 1 c = p t c × ( 1 + inf el ) ; p t + 1 s = p t s × ( 1 + inf el )
DCO = t = 0 N debt 1 ( C inv / N debt + ( C inv C lcs , t ) × r d ) / ( 1 + r ) t + t = 1 N ( P Cm × C inv × ( 1 + inf ) +   P Cass × C inv × ( 1 + inf ) + SP el , t × P Ctax ) / ( 1 + r ) t + ( P Ci × C inv ) / ( 1 + r ) 10 + C ae
C inv = C inv , unit × ( 1 + Vat ) × P f × η f
in which DCI = discounted cash inflow, DCO = discounted cash outflow, CI = cash inflow, CO = cash outflow, r = cost opportunity of capital, t = time period, N = lifetime of a PV system, wself,c = percentage of energy self-consumption, wsold = percentage of the produced energy sold to the grid, pc = electricity purchase price, ps = electricity sales price, Cinv = total investment cost, NTaxD = period of tax deduction, TaxDu = unitary tax deduction, infel = rate of energy inflation, Ndebt = period of loan, Clcs = loan capital share cost, rd = interest rate on a loan, PCm = percentage of maintenance cost, inf = rate of inflation, PCass = percentage of assurance cost, SPel = sale of energy, PCtax = percentage of taxes cost, PCi = percentage of inverter cost, Cae = administrative and electrical connection cost, Cinv,unit = unitary investment cost and Vat = value added tax.

3.5. The Presentation of Case Studies

Subsidies have played a key-role in the development of PV sector. As defined in Section 1, this work aims to propose an economic analysis of PV systems in residential applications. For this motive, a plant size equal to 3 kW is considered.
This work try to evaluate the impact of subsidies on the profitability of PV systems, consequently several scenarios can be analysed:
  • Scenario “Fiscal Deduction 36%”, in which subsidies are not provided and Fiscal Deduction has a standard value (TaxDu = 36%).
  • Scenario “Fiscal Deduction 50%”, in which subsidies are not provided (PCD = 0 €/tCO2eq) and Fiscal Deduction is subsidized (TaxDu = 50%).
  • Scenario “Subsidies Low PCD”, in which subsidies are provided with a low value of PCD and Fiscal Deduction has a standard value of 36%.
  • Scenario “Subsidies Moderate PCD”, in which subsidies are provided with a moderate value of PCD and Fiscal Deduction has a standard value of 36%.
  • Scenario “Subsidies High PCD”, in which subsidies are provided with a high value of PCD and Fiscal Deduction has a standard value of 36%.

3.6. Input Data

The transformation of both cash inflows and outflows in discounted values requires the use of a cost opportunity of capital. This variable measures the return coming from an alternative project, which has the same risk level. It is hypothesized equal to 5%. The time period of cash flows is defined by the lifetime of PV plant, which is assumed equal to 20 years. PV plant is located in a central region (1450 kWh/m2 × year) and investment costs are covered by third party funds. The share of self-consumption is the harmonization between demanded and produced energy. This variable assumes a key-role in the economic evaluation and for this motive three scenarios characterized by different values are considered (Cucchiella et al. 2017a):
  • Scenario “Self-consumption 30%”, in which the investor uses the 30% of energy produced for internal uses and the remaining share is sold to the market.
  • Scenario “Self-consumption 40%”, in which wself,c and wsold are equal to 40% and 60%, respectively.
  • Scenario “Self-consumption 50%”, in which the share of self-consumption is equal to 50%.
Other economic inputs useful to develop the economic model presented in the previous sub-section are proposed in Table 1.

4. Results

The first step is represented by the calculation of RECD. This value is reported in Equation (12) and it is applied also for the following years of lifetime of PV systems. Currently, there are no robust estimates on the future energy mix. However, alternative scenarios concerning this variable will be examined in the following section.
RECD = ( 842 × 0.44 + 114 × 0.08 + 568 × 0.48 ) 42 = 685   gCO 2 eq / kWh  
The following step is the economic quantification of reduction of carbon dioxide. According to Equation (4) and input data reported in Table 1, EOut,1 is equal to 4680 kWh/year during the first year. Consequently the unitary value of subsidies is reported in Equations (13)–(15) according to the single value of PCD.
SUB PV , 1 = 685 × 10 × 4680 = 32   / year    Subsidies Low   P CD
SUB PV , 1 = 685 × 35 × 4680 = 112   / year    Subsidies Moderate   P CD
SUB PV , 1 = 685 × 70 × 4680 = 224   / year    Subsidies High   P CD
The results of economic feasibility are subdivided as follows:
  • Baseline scenarios.
  • The distribution of revenues.
  • Alternative scenarios.
  • Discussions and policy implications.

4.1. Baseline Scenarios

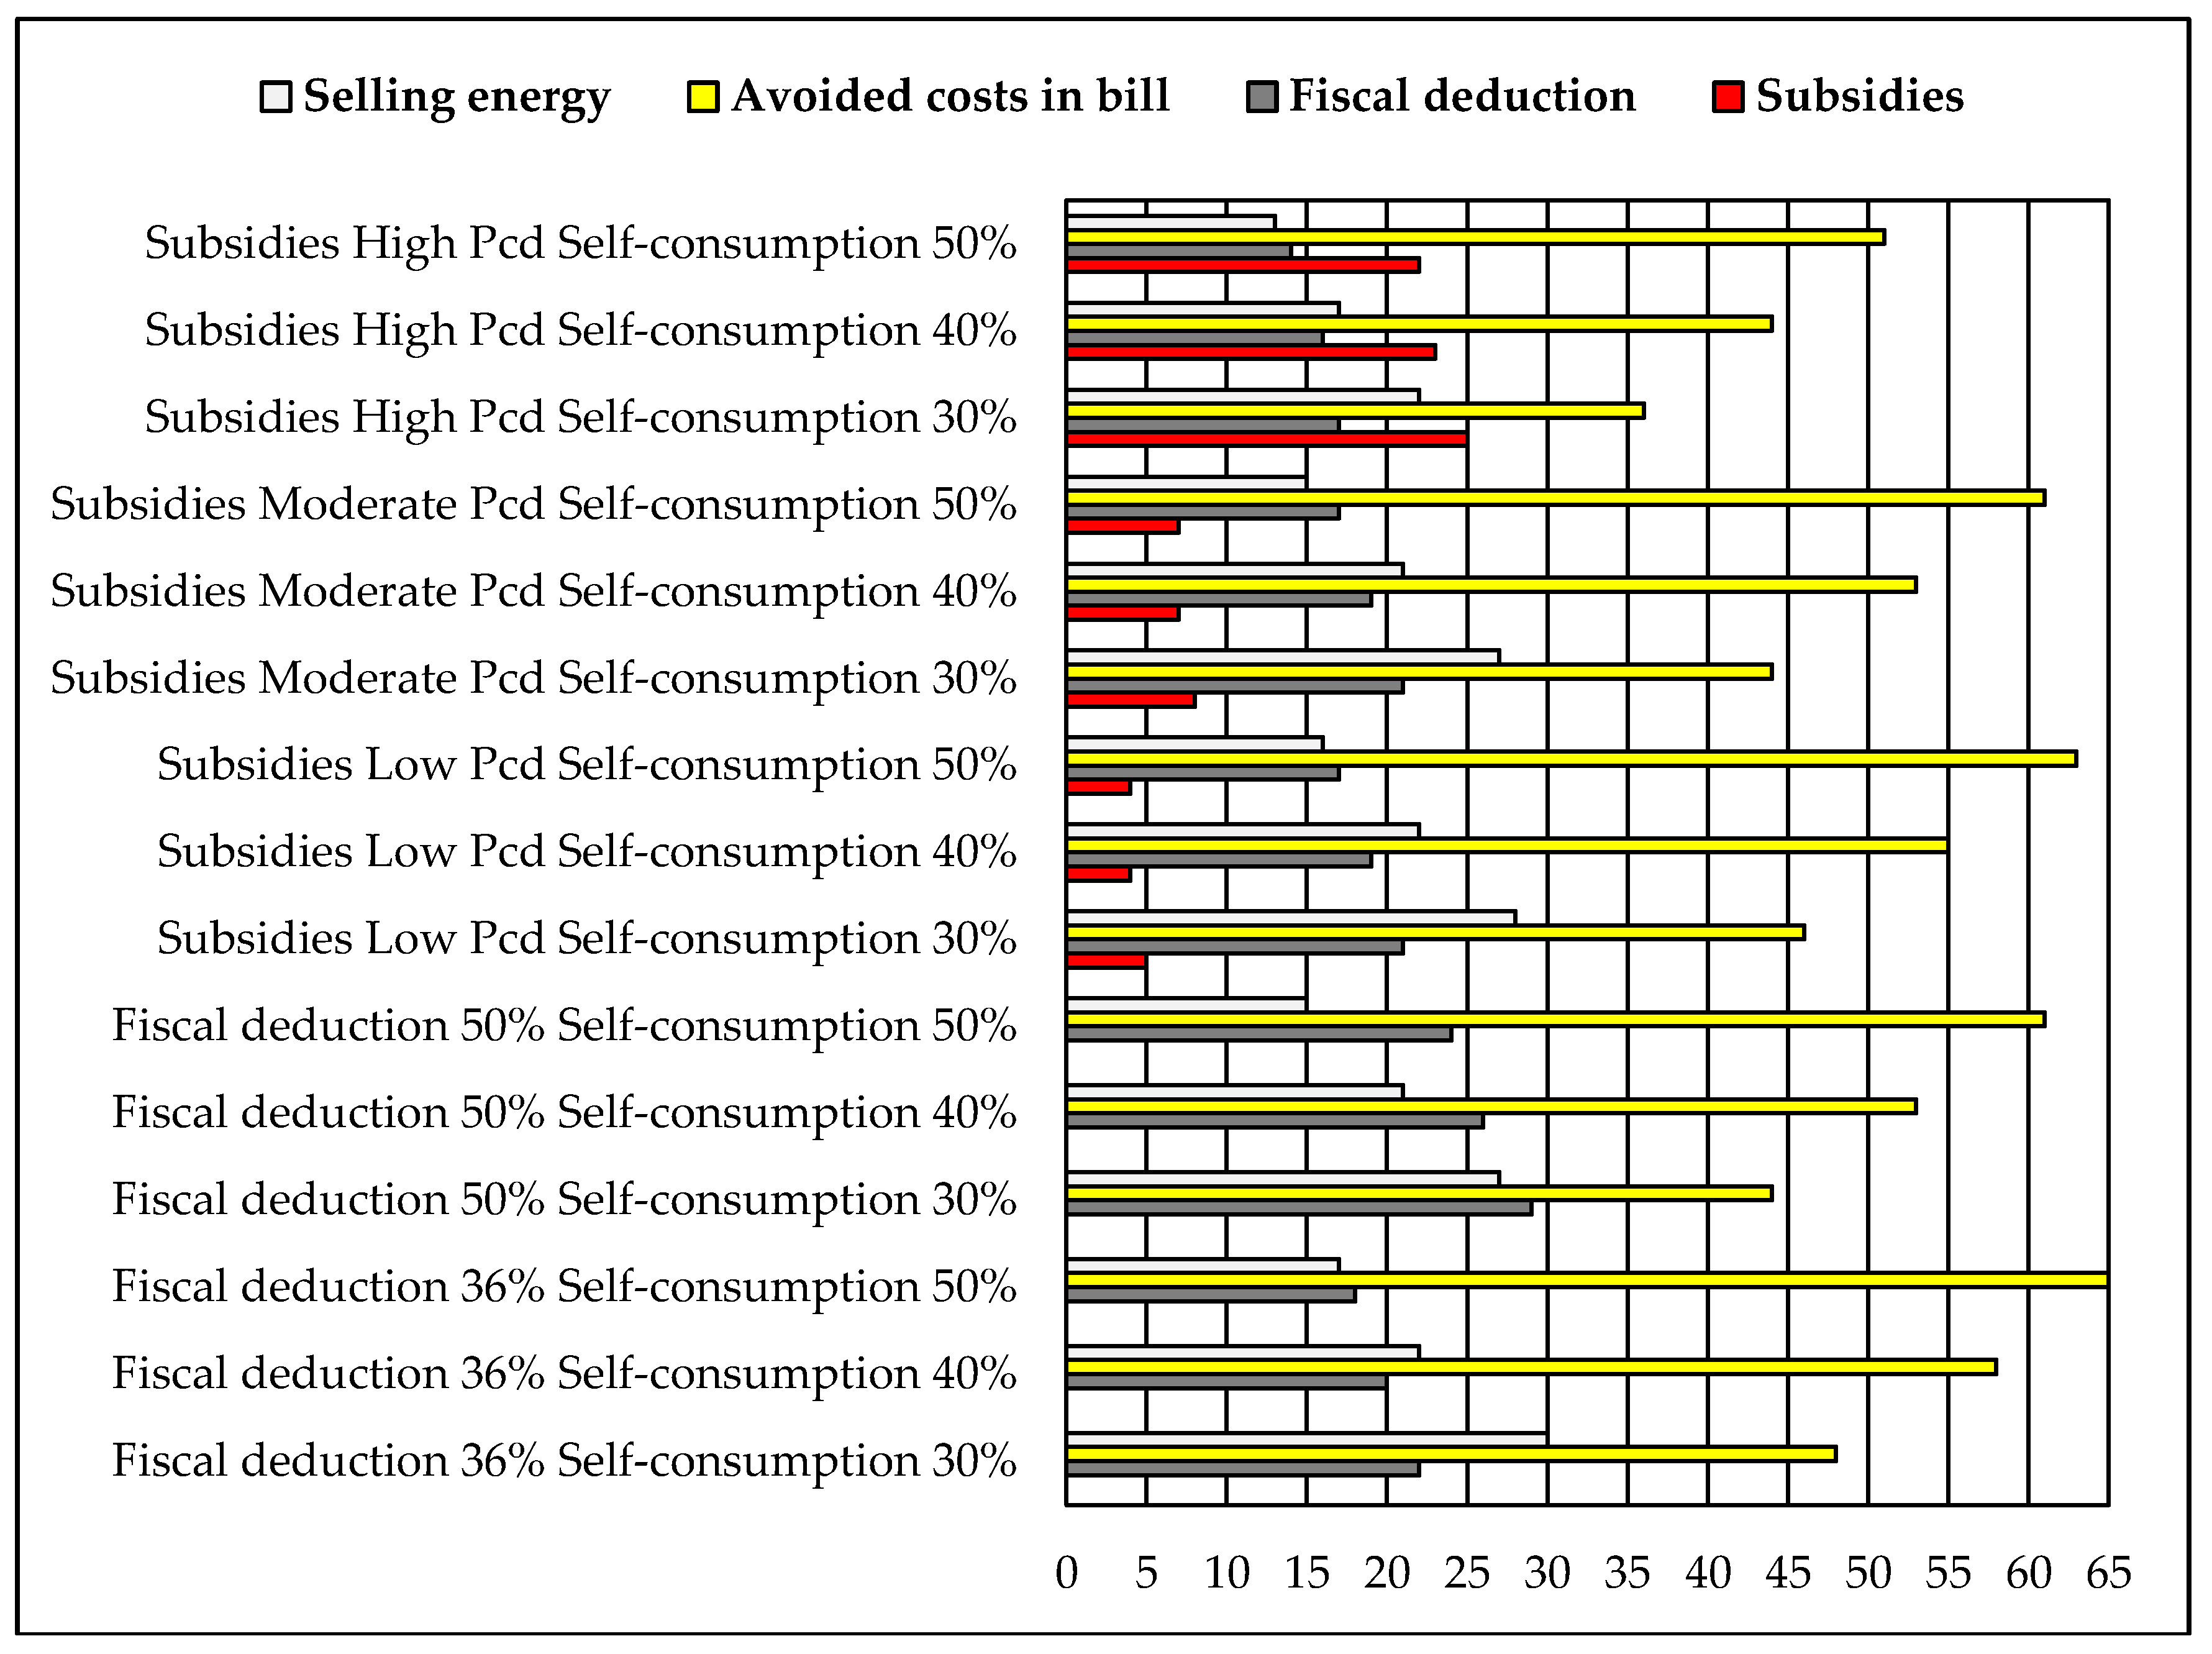
The profitability of a 3 kW PV plant is evaluated in this work. The baseline scenario is composed by fifteen case studies obtained multiplying three scenarios linked to consumer choices and five scenarios related to political decisions. Two distinct indexes are proposed, because NPV quantifies the amount of money generated by PV investment (Table 2), while DPBT gives an information concerning the number of years in which the investment is recovered (Table 3).
The profitability is verified in thirteen case-studies. It ranges from 1357 €/kW (scenarios Subsidies High PCD and Self-consumption 50%) to 48 €/kW (scenarios Fiscal deduction 50% and Self-consumption 30%). NPV is negative when it is hypothesized a wself,c equal to 30% considering or a rate of fiscal deduction of 36% or an unitary value of subsidy of 10 €/tCO2eq. These values can be referred to the existing literature also when was applied a FIT scheme: 716–913 €/kW (Chiaroni et al. 2014), 1804–2386 €/kW (Campoccia et al. 2014), (−1300)–3300 €/kW (Bortolini et al. 2013).
Results proposed in this work underline that the share of self-consumption plays a role more critical than subsidies. The profitability of residential PV systems depends by this variable in a mature market (Sarasa-Maestro et al. 2016). A value of 30% is used typically in the evaluation of economic feasibility, because the production of energy from PV modules has its peak during the day, while consumers are busy to work outside the home. A possible solution to intermittent nature of this RES is represented by the application of a battery storage, but this choice requires also an appropriate environmental evaluation (Üçtuğ and Azapagic 2018). The use of intelligent machinery represents another technical solution to solve this issue (Zhou et al. 2016).
The comparison among several political tools underline as the increase of rate of fiscal deduction to 50% permits to reach better economic performance than the application of a subsidies with a low price of carbon dioxide. In addition, there is an increase of 226 €/kW applying a fiscal deduction of 50% than 36%. Consequently, the choice of subsidized fiscal deduction is useful, but the quantity of PV power installed is been low and so the market has not rewarded this choice.
The re-introduction of subsidies can have a shock effect pushing the investors to opt for this choice. In fact, starting by the idea to support the contrast to climate change when also economic opportunities are verified, the development of PV plants can involve homes in which currently renewable plants are not installed. The increase of energy self-sufficiency is a long-term objective.
NPV obtained in scenarios Subsidies Moderate P
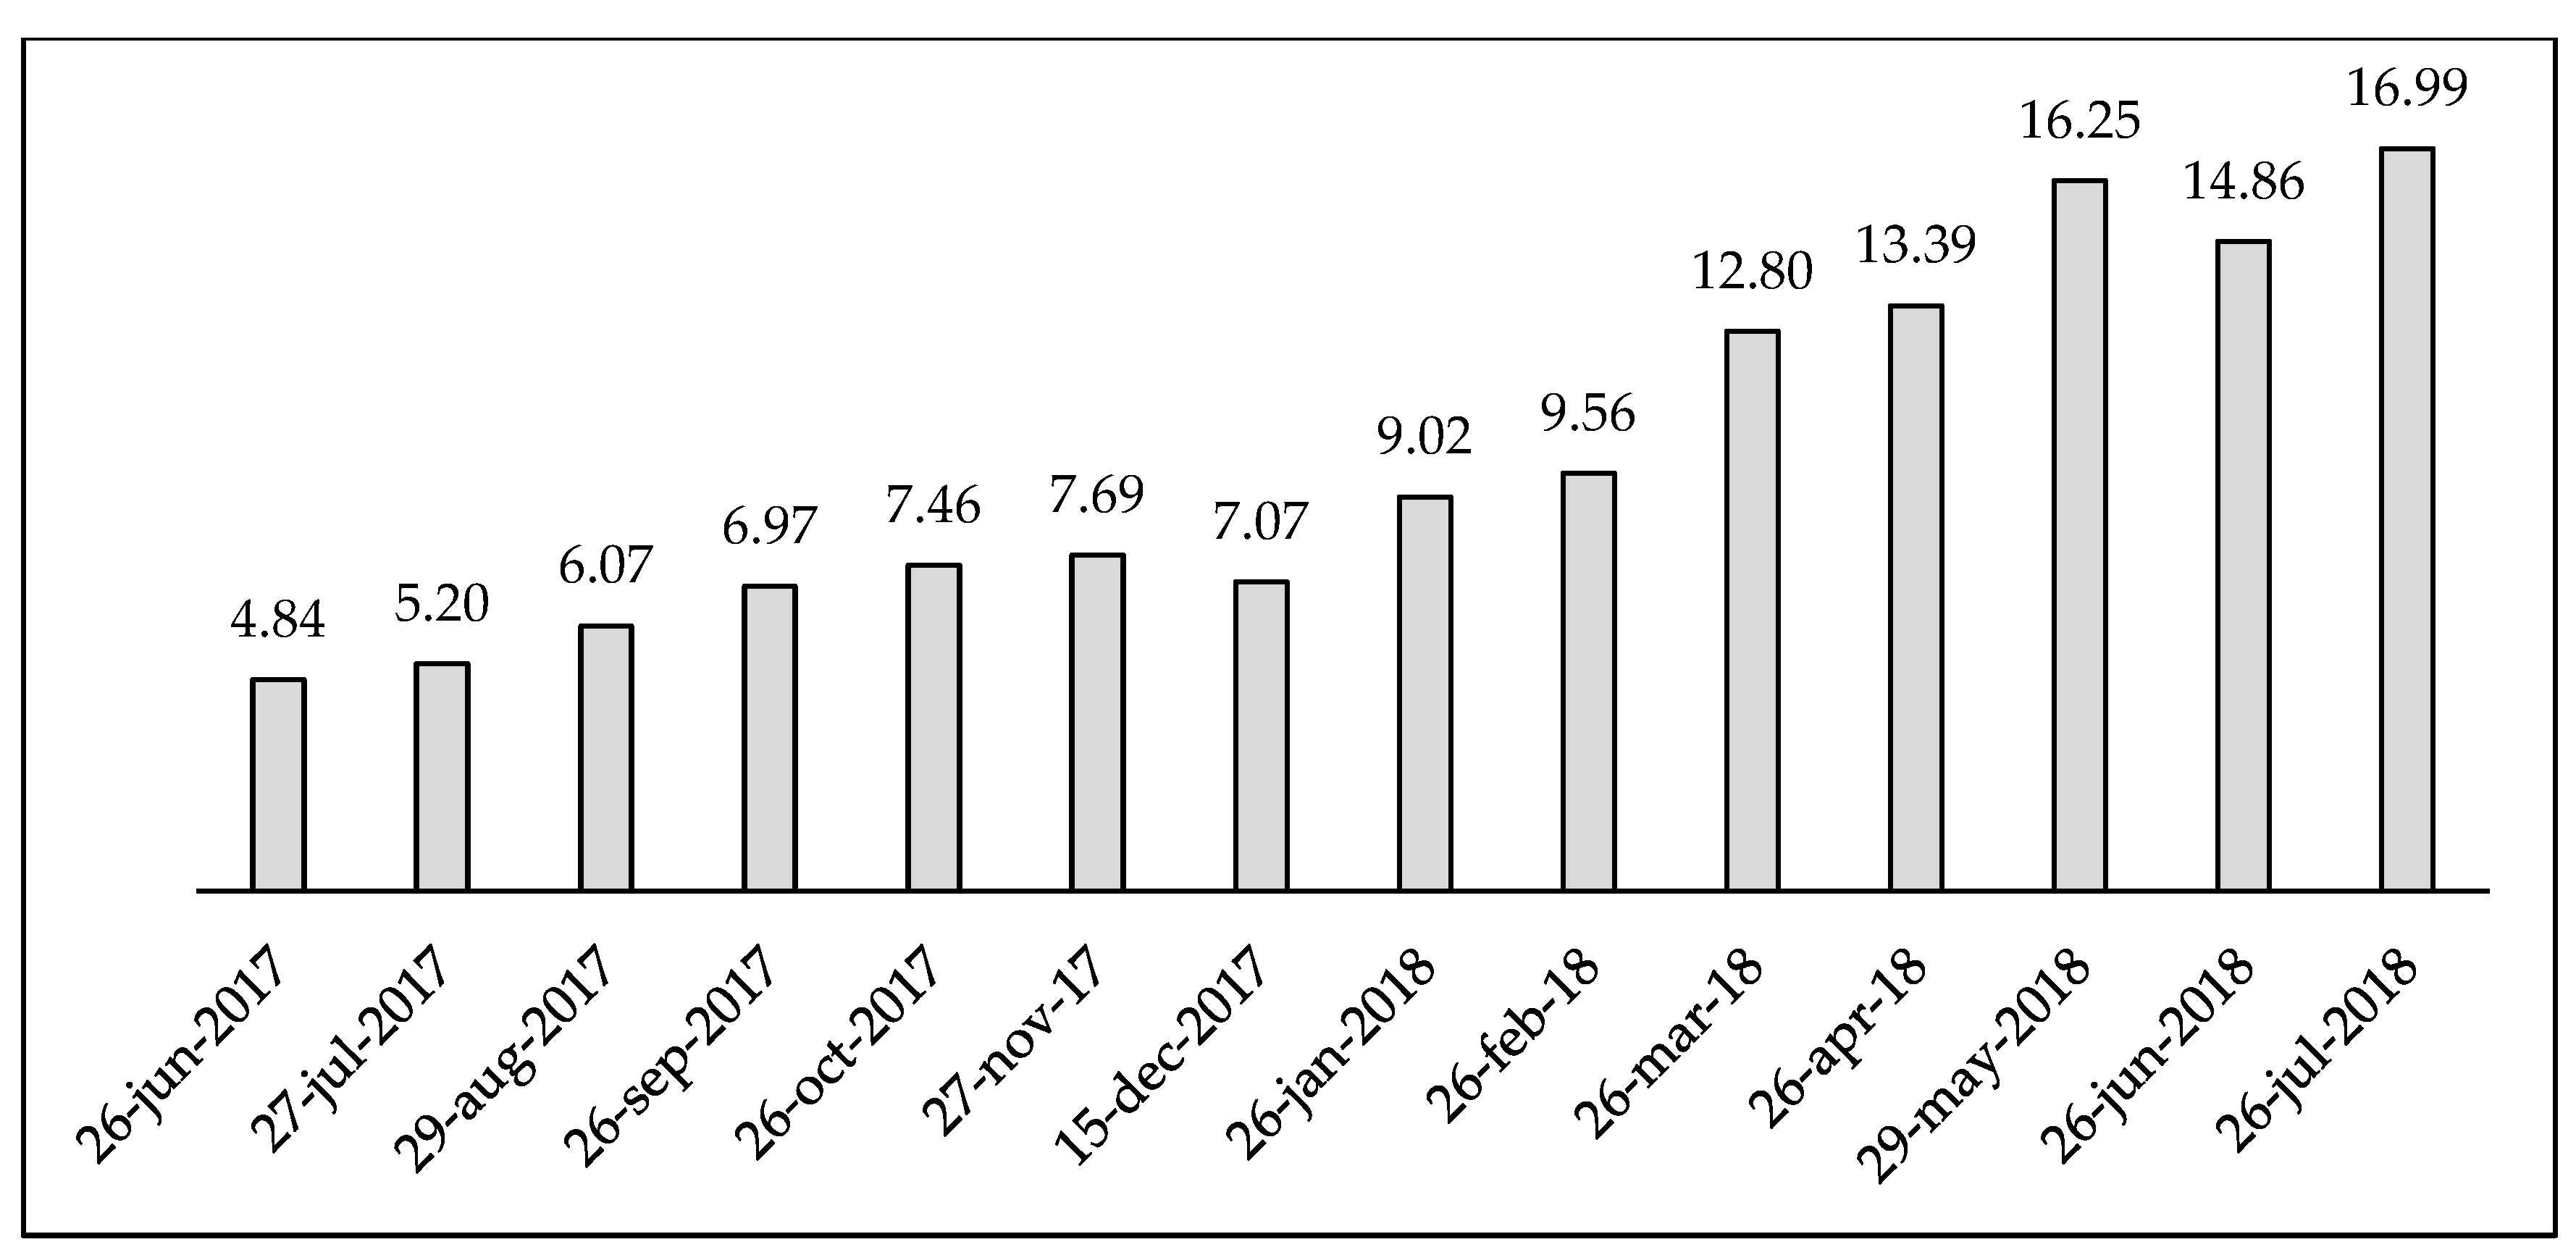
CD are greater than ones of Fiscal deduction 50% and an analysis of Break-Even point notes that this point is equal to 18.50 €/tCO2eq. A comparison with recent values reported in the market (see Figure 4) underlines that there is a difference very low with current values (about 1 €/tCO2eq). NPV increases of 313 €/kW using a moderate PCD than low PCD and this increase becomes 438 €/kW when is choice a high PCD than moderate PCD.
The DPBT results are coherent with the NPV ones. Two unprofitable case studies are characterised by a value >20. In fact, in the worse scenario the cut-off period is fixed equal to the lifetime of the plant and when is reported a DPBT >20 the investment cannot be recovered within this interval time. The difference between DCI and DCO has always a negative sign. In three case studies (Subsidies Moderate PCD with Self-consumption 30%, Fiscal deduction 50% with Self-consumption 40% and Fiscal deduction 36% with Self-consumption 50%) has more sign changes. While, the remaining case studies have only one sign change.
DPBT varies from 3 years (scenarios Subsidies High PCD and Self-consumption 50%) to 19 years (scenarios Fiscal Deduction 50% and Self-consumption 30%). This result is justified by application of third-party funds that distribute the investment cost over the years of loan. Seven case studies have a value that does not exceed 6 years and it is comparable with other works: 3–12 years (Chiaroni et al. 2014), 4–8 years (Rodrigues et al. 2016) and 7–15 years (Orioli and Gangi 2015).

4.2. The Distribution of Revenues

The profitability is characterized by several items. An analysis of their percentage distribution can be useful to define the relevance of these variables. Obviously, the distribution depends by typology of case study—Figure 5.
A consumer pays to use electricity and when a PV system is installed, the investor (consumer) becomes also a producer of energy (also called prosumer). For this motive, the purchase of energy is not more necessary (relatively to the share of self-consumption) and avoided cost of bills can be interpreted as a revenue. In all case studies, this represent the aim item of discounted cash inflow. It varies from 36% in scenarios Subsidies High PCD and Self-consumption 30% to 65% in scenarios Fiscal deduction 36% and Self-consumption 50%.
The selling of energy to the grid has a percentage weight basically greater than fiscal deduction. This is not verified only in scenarios in which the consumer reaches a share of self-consumption equal to 50%. The fiscal deduction permits to reduce the taxable income and it is applied following by the investment in PV system. In this way, there is a reduction of taxable costs and this item can be interpreted as a revenue.
Literature analysis underlined as subsidies played a key-role in the economic evaluation of PV plants. In this context their weight is marginal, when is hypothesized a low value of PCD (about 4–5%) or a moderate value of PCD (about 7–8%). Instead, they have a weight of about 22–25%, when the reduction of carbon dioxide assumes a value of 70 € per ton of CO2.

4.3. Alternative Scenarios

NPV are obtained according to the assumptions of a set of input variables. In order to give solidity to results obtained, a sensitivity on the critical variables is conducted. In this way, a variance of the expected NPV could occur and this analysis defines the variations of this index (Sommerfeldt and Madani 2017).
Some variables are already changed in baseline case studies and for this motive the same approach is repeated in this analysis. Section 4.1 has defined as NPV varies in function of the share of self-consumption, the rate of fiscal deduction and the value of carbon dioxide (subsidies).
Alternative scenarios are constructed considering two distinct scenarios (one pessimistic and one optimistic) for the critical variables that are not examined previously (Cucchiella et al. 2017a; Sarasa-Maestro et al. 2016; Radomes and Arango 2015):
  • electricity purchase price. Section 4.2 has defined that this cost, having a sign negative, can be interpreted as a revenue. The variable is decreased (Table 4) and increased (Table 5) of 0.02 cent€/kWh.
  • electricity sales price. The consumer can sell to the grid the share of energy not self-consumed. The variable is decreased (Table 6) and increased (Table 7) of 0.015 cent€/kWh.
  • unitary investment cost. A significant decrease of investment costs has characterised the PV market. This is caused by political choices (e.g., subsidies) that have favoured a consistent amount of installed PV systems. The variable is increased (Table 8) and decreased (Table 9) of 200 €/kW.
  • average annual insolation. Italy presents several insolation levels due to its geographical conformation varying from 1350 kWh/m2 × year (northern region—Table 10) to 1600 kWh/m2 × year (southern region—Table 11).
The profitability is verified in one-hundred and three case studies in alternative scenarios. In particular, NPV is always positive in two scenarios. The first when is applied a value of tr equal to 1600 kWh/m2 × year and the second is verified with a Cinv,unit equal to 1700 €/kW. Instead, the unprofitability is obtained in seventeen case studies: fourteen when the share of self-consumption is equal to 30% (six in combination with Fiscal Deduction 36% and four with both Fiscal Deduction 50% and Subsidies Low PCD) and three with a wself,c equal to 40% (in combination with Fiscal Deduction 36%).
This work does not assign a probability value to single case studies. However, the solar irradiation calculated in baseline scenario is subject to variation when is considered a territory situated in a northern or southern region. NPV varies from −365 €/kW to 1011 €/kW in the North of Italy, it ranges from 9 €/kW to 1702 €/kW in the South of Italy.
Italian PV market is mature and consequently, the variation of investment costs is not expected. However, the difference of costs can be proposed by several firms in order to expand their market share. NPV ranges from −378 €/kW to 1157 €/kW when is considered an increase of costs in comparison to baseline scenario, while it varies from 22 €/kW to 1557 €/kW in the opposite situation.
Regarding electricity sales price, a possible variation can be assumed when is applied a Net Metering Scheme, in which the price of electricity is increased above market value. The development of decentralized energy systems aims to obtain that single units must be self-sufficient in terms of energy and consequently, all advantages must be destined to the share of self-consumption. NPV varies from −330 €/kW to 1253 €/kW with a ps equal to 4 cent€/kWh and it ranges from −26 €/kW to 1461 €/kW with a ps equal to 7 cent€/kWh.
The energy bill is composed by several components and its value depends by time bands. Currently, there is an increase of energy bill in Italy. For this motive, there is a concrete opportunity that scenario presented in Table 5 can be real. NPV varies from −46 €/kW to 1576 €/kW. While, in the opposition situation (pc equal to 17 cent€/kWh) it ranges from −309 €/kW to 1137 €/kW.
Finally, alternative values RECD can of be analysed. In Section 3.1, energetic mix is calculated at net of renewables and imports and RECD is equal to 685 gCO2eq/kWh. However, PV plant can be compared with an energy portfolio in which also renewables and imports are considered. Initially, the distribution of energy sources is evaluated for 2017 (ENEA 2018): PEMGAS = 36.5%, PEMOIL = 34%, PEMCOAL = 6%, PEMRES = 19% (percentage in energy mix of renewables) and PEM
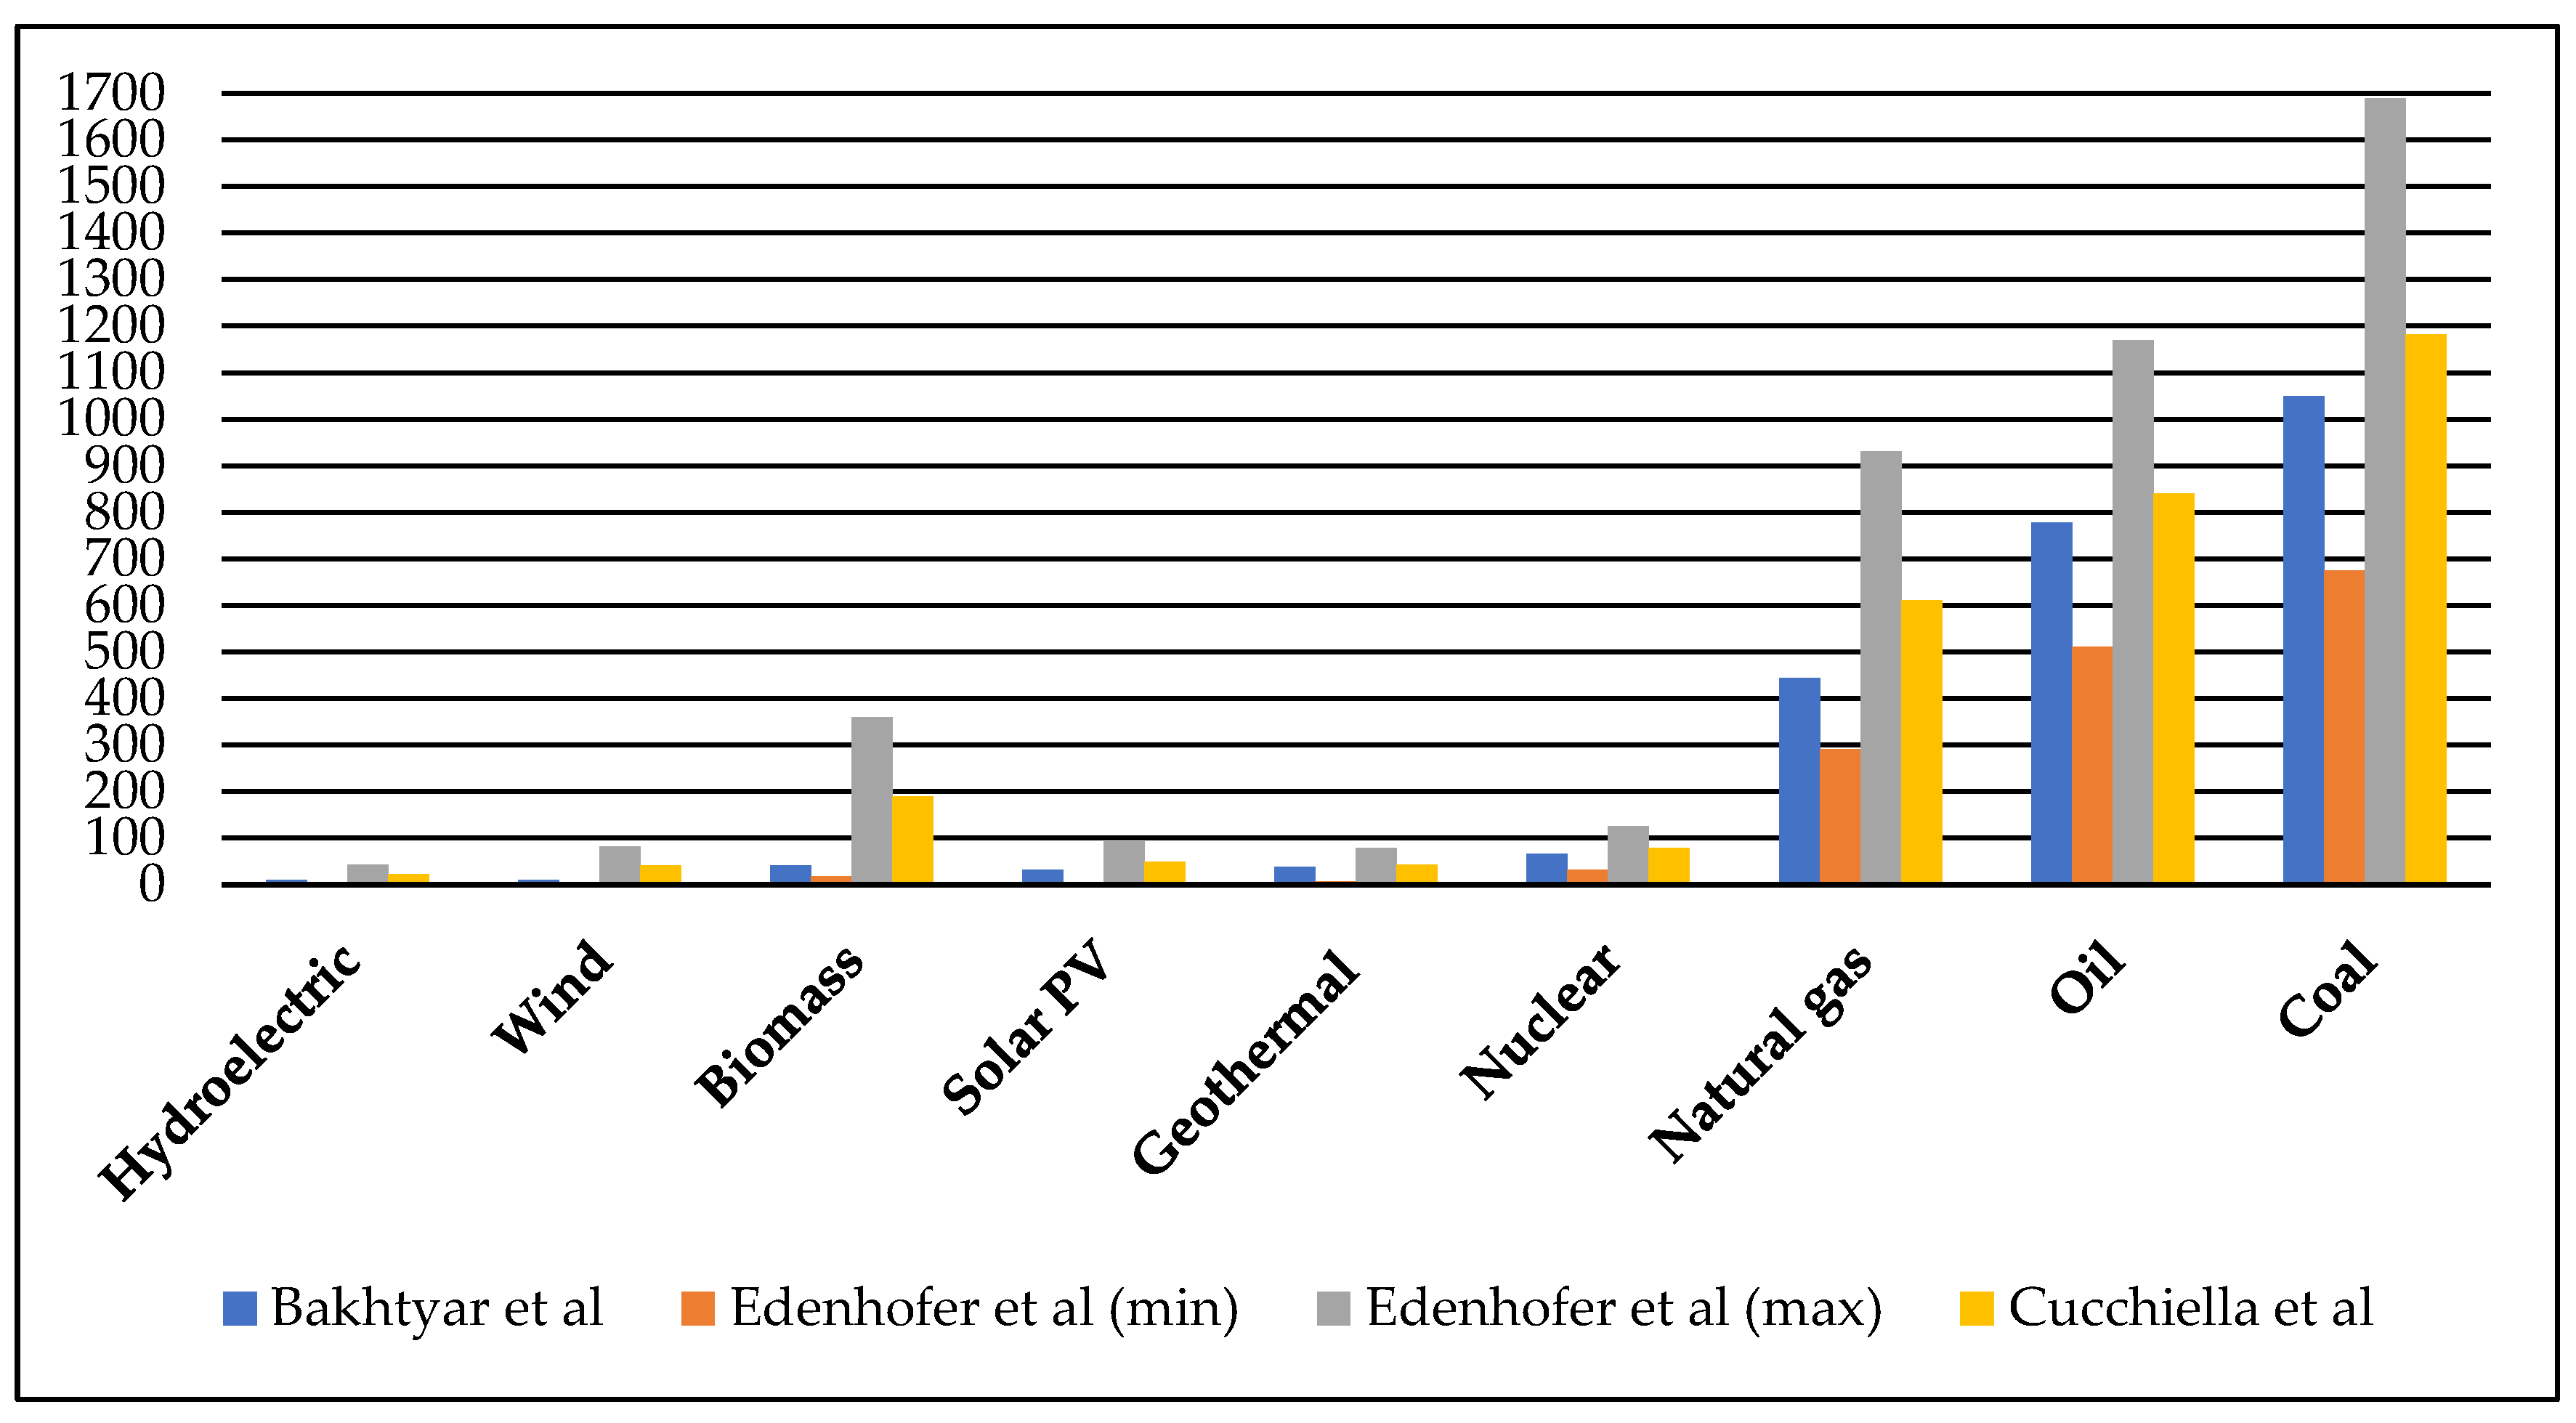
IMP = 4.5% (percentage in energy mix of imports). In particular, renewables can be subdivided in hydroelectric (HYD), PV, biomass (BIO), wind (WIN) and geothermal (GEO). Their distribution is calculated according to values of GSE (Gestore Servizi Energetici) regarding electricity sector in 2016: PEMHYD = 39%, PEMPV = 21%, PEMBIO = 18%, PEMWIN = 16% and PEMGEO = 6%. The values of emissions are chosen as average values of Figure 3: ECDHYD = 19 gCO2eq/kWh, ECDPV = 42 gCO2eq/kWh, ECDBIO = 152 gCO2eq/kWh, ECDWIN = 34 gCO2eq/kWh and ECDGEO = 41 gCO2eq/kWh. For the value of imports is considered the average among oil, carbon and gas (ECDIMP = 847 gCO2eq/kWh)—Equation (16).
RECD = ( ECD OIL × PEM OIL + ECD COAL × PEM COAL + ECD GAS × PEM GAS + ECD HYD × PEM HYD + ECD PV × PEM PV + ECD WIN × PEM WIN + ECD BIO × PEM BIO + ECD GEO × PEM GEO + ECD IMP × PEM IMP ) ECD PV = 604 42 = 562   gCO 2 eq / kWh
According to Equations (13)–(15), the following step is the transformation of environmental benefits in economic terms. The unitary value of subsidies changes in function of the value of PCD—Equations (17)–(19).
SUB PV , 1 = 562 × 10 × 4680 = 26   / year Subsidies Low   P CD
SUB PV , 1 = 562 × 35 × 4680 = 92   / year Subsidies Moderate   P CD
SUB PV , 1 = 562 × 70 × 4680 = 184   / year Subsidies High   P CD
The variation of NPV in alternative scenarios in which RECD is assumed equal to 562 gCO2eq/kWh is proposed in Table 12. Obviously, both scenarios Fiscal Deduction 36% and Fiscal Deduction 50% are not modified by this change.
The profitability is confirmed in several scenarios (only scenario Subsidies Low PCD and Self-consumption 30% has a negative NPV). The index varies from 181 €/kW to 1200 €/kW. The presence of renewable in an energy mix determines a reduction of carbon dioxide linked to this portfolio. In fact, a reduction of RECD is verified and it is equal to 123 gCO2eq/kWh. This determines a reduction of value of SUBPV and consequently, also NPV is characterized by a reduction. It varies from about 20 €/kW (Self-consumption 30%) to 160 €/kW (Self-consumption 50%).

4.4. Discussions and Policy Implications

The transition towards a low carbon society requires to evaluate the relationship between the CE models and the use of REs. The CE framework is characterized by requirements to measure. One of them is increasing share of renewable and recyclable resources.
The reduction of GHG emissions is possible thanks to the use of less raw materials and more sustainable sourcing (Elia et al. 2017). Recycling and recovery of materials as indium, silicon and silver can be obtained by PV waste favouring the application of CE model (Brenner and Adamovic 2017). However, a sustainable RE technology requires that the all parts of the product lifecycle can be optimized. The analysis from cradle to growth is conducted (Charles et al. 2016). The recovery of PV modules is typically characterized by unprofitability (Choi and Fthenakis 2014).
CE model aims to favour the development of REs and economic opportunities take the front seat (Kopnina 2017). This work follows this approach. In fact, PV investment is characterized by a low risk and results obtained define that the profitability can reach interesting values.
PV systems are able not only to favour the decarbonisation of society, but also to reduce geopolitical risks. In fact, when a country increases the internally energy produced there is also a decrease in external energy required. Consumers can increase their profits in a significant way and this is possible through the harmonization between demanded and produced energy. At the same time, consumers are responsible actors towards targets to reach.
Energy firms move from centralised to decentralised power and new business models emerge in which people provide the energy for their homes and commercial premises. At the same time, emissions constraints for manufacturing of products represent another motivation to develop REs.
Subsidies cannot be seen as a perpetual assistance, but in this new proposal consumers sell the amount of CO2eq avoided using a PV system instead to use electricity by fossil fuels.
The Paris Agreement is a crucial step to reduce the decarbonisation of society. A mix of renewable resources, energy efficiency, an appropriate waste management and material efficiency strategies represent initiatives to implement. In this way, renewable economy and circular economy moves towards the same direction.

5. Conclusions

Renewables represent the main actor in a transition towards a society low-carbon. PV source plays a key-role, in fact its growth has assumed significant values in the last years globally. However, consumers are also investors and a project is implemented only if economic conditions are verified.
Currently, a subsidized fiscal rate of 50% (instead of 36%) is applied to the Italian context. This measure has not produced a consistent increase of the power installed. A new proposal is defined in this work, in which when a consumer reduces carbon dioxide emission levels has right to receive an economic contribution. This is paid by operators that emit a level of pollutants greater than the value allowed (carbon price defined by a real market). In addition, this incentive is given to the energy produced by a PV plant for all its lifetime (20 years). The subsidy is assumed fixed according to the FIT scheme.
Literature review has underlined as a consistent quantity of emissions is not covered by a carbon price and this value is below 10 €/tCO2eq. However, several authors have highlighted as carbon price must have a greater value in order to tackle climate change.
The reduction of carbon dioxide is calculated according to values reported in literature. Italy moves towards a reduction of use of both oil and carbon, at the same time there is an increase of natural gas. The share of RE tends to be stable. The reduction of emissions is assumed equal to 685 gCO2eq/kWh and the market value of EU ETS is characterised by an increase of about 13 €/tCO2eq considering July 2017–July 2018 as interval period.
The fiscal deduction with a rate of 50% produces more profits for consumers in comparison to a subsidy determined by the price of CO2eq when this value is lower than 18.50 €/tCO2eq. Among this value and one proposed by market there is a difference of only 1 €/tCO2eq. Consequently, this choice can be applied in a real context.
This analysis follows the values reported by report of the High-Level Commission on Carbon Prices. Applying a price of carbon dioxide equal to 35 €/tCO2eq. NPV varies from 260 €/kW to 919 €/kW and DPBT can be equal to 5–6 years. When, instead, is applied a price of carbon dioxide equal to 70 €/tCO2eq, NPV ranges from 698 €/kW to 1357 €/kW and DPBT varies from 3 years to 6 years.
Profits obtained are probably not relevant, but consumer can opt towards this choice for the following aspects: (i) investment costs are low, (ii) reduces the costs of energy bill and can also obtained profits and (iii) contributes to tackle the climate change. The harmonization between demanded and produced energy increases the economic performance. Alternative scenarios give solidity to results obtained.
A new development of residential PV applications is able to increase the sustainability of a country and the quantitative analysis proposed in this work demonstrates as PV source contributes to the CE models.

Funding

This research received no external funding.

Conflicts of Interest

The author declares no conflict of interest.

References

  1. Aatola, Piia, Markku Ollikainen, and Anne Toppinen. 2013. Price Determination in the Eu Ets Market: Theory and Econometric Analysis with Market Fundamentals. Energy Economics 36: 380–95. [Google Scholar] [CrossRef]
  2. Alberici, Sacha, Sil Boeve, Pieter van Breevoort, Yvonne Deng, Sonja Förster, Ann Gardiner, Valentijn van Gastel, Katharina Grave, Heleen Groenenberg, David de Jager, and et al. 2014. Subsidies and Costs of Eu Energy—Final Report and Annex 3, Ecofys. Available online: https://ec.europa.eu/energy/en/content/final-report-ecofys (accessed on 9 July 2018).
  3. Alberola, Emilie, Julien Chevallier, and Benoît Chèze. 2008. Price Drivers and Structural Breaks in European Carbon Prices 2005–2007. Energy Policy 36: 787–97. [Google Scholar] [CrossRef]
  4. Avril, Sophie, Christine Mansilla, Marie Busson, and Thibault Lemaire. 2012. Photovoltaic Energy Policy: Financial Estimation and Performance Comparison of the Public Support in Five Representative Countries. Energy Policy 51: 244–58. [Google Scholar] [CrossRef]
  5. Bakhtyar, Bardia, Ahmad Fudholi, Kabir Hassan, Muhammad Azam, Chin Haw Lim, Ngai Weng Chan, and Kamaruzzaman Sopian. 2017. Review of CO2 Price in Europe Using Feed-in Tariff Rates. Renewable and Sustainable Energy Reviews 69: 685–91. [Google Scholar] [CrossRef]
  6. Baur, Lucia, and Mauricio Uriona. 2018. Diffusion of Photovoltaic Technology in Germany: A Sustainable Success or an Illusion Driven by Guaranteed Feed-in Tariffs? Energy 150: 289–98. [Google Scholar] [CrossRef]
  7. Böhringer, Christoph, Bouwe Dijkstra, and Knut Einar Rosendahl. 2014. Sectoral and Regional Expansion of Emissions Trading. Resource and Energy Economics 37: 201–25. [Google Scholar] [CrossRef]
  8. Bortolini, Marco, Mauro Gamberi, Alessandro Graziani, Cristina Mora, and Alberto Regattieri. 2013. Multi-Parameter Analysis for the Technical and Economic Assessment of Photovoltaic Systems in the Main European Union Countries. Energy Conversion and Management 74: 117–28. [Google Scholar] [CrossRef]
  9. Bravi, Mirko, Maria Laura Parisi, Enzo Tiezzi, and Riccardo Basosi. 2011. Life Cycle Assessment of a Micromorph Photovoltaic System. Energy 36: 4297–306. [Google Scholar] [CrossRef]
  10. Brenner, W., and Nadja Adamovic. 2017. A Circular Economy for Photovoltaic Waste-the Vision of the European Project Cabriss. Paper presented at the 40th International Convention on Information and Communication Technology, Electronics and Microelectronics, Opatija, Croatia, May 22–26. [Google Scholar]
  11. Breyer, Christian, Dmitrii Bogdanov, Ashish Gulagi, Arman Aghahosseini, Larissa S. N. S. Barbosa, Otto Koskinen, Maulidi Barasa, Upeksha Caldera, Svetlana Afanasyeva, and Michael Child. 2017. On the Role of Solar Photovoltaics in Global Energy Transition Scenarios. Progress in Photovoltaics: Research and Applications 25: 727–45. [Google Scholar] [CrossRef]
  12. Cai, Wugan, and Jiafeng Pan. 2017. Stochastic Differential Equation Models for the Price of European CO2 Emissions Allowances. Sustainability 9: 207. [Google Scholar] [CrossRef]
  13. Campoccia, Angelo, Luigi Dusonchet, Enrico Telaretti, and Gaetano Zizzo. 2014. An Analysis of Feed’in Tariffs for Solar Pv in Six Representative Countries of the European Union. Solar Energy 107: 530–42. [Google Scholar] [CrossRef]
  14. Charles, Rhys G., Matthew L. Davies, and Peter Douglas. 2016. Third Generation Photovoltaics—Early Intervention for Circular Economy and a Sustainable Future. Paper presented at the 2016 Electronics Goes Green, Berlin, Germany, September 7–9. [Google Scholar]
  15. Chiaroni, Davide, Vittorio Chiesa, Lorenzo Colasanti, Federica Cucchiella, Idiano D’Adamo, and Federico Frattini. 2014. Evaluating Solar Energy Profitability: A Focus on the Role of Self-Consumption. Energy Conversion and Management 88: 317–31. [Google Scholar] [CrossRef]
  16. Choi, Jun-Ki, and Vasilis Fthenakis. 2014. Crystalline Silicon Photovoltaic Recycling Planning: Macro and Micro Perspectives. Journal of Cleaner Production 66: 443–49. [Google Scholar] [CrossRef]
  17. Christiansen, Atle C., Andreas Arvanitakis, Kristian Tangen, and Henrik Hasselknippe. 2005. Price Determinants in the Eu Emissions Trading Scheme. Climate Policy 5: 15–30. [Google Scholar] [CrossRef]
  18. Comello, Stephen, and Stefan Reichelstein. 2017. Cost Competitiveness of Residential Solar Pv: The Impact of Net Metering Restrictions. Renewable and Sustainable Energy Reviews 75: 46–57. [Google Scholar] [CrossRef]
  19. Convery, Frank J., and Luke Redmond. 2007. Market and Price Developments in the European Union Emissions Trading Scheme. Review of Environmental Economics and Policy 1: 88–111. [Google Scholar] [CrossRef]
  20. Cucchiella, Federica, Idiano D’Adamo, and Massimo Gastaldi. 2016. A Profitability Assessment of Small-Scale Photovoltaic Systems in an Electricity Market without Subsidies. Energy Conversion and Management 129: 62–74. [Google Scholar] [CrossRef]
  21. Cucchiella, Federica, Idiano D’Adamo, and Massimo Gastaldi. 2017a. Economic Analysis of a Photovoltaic System: A Resource for Residential Households. Energies 10: 814. [Google Scholar] [CrossRef]
  22. Cucchiella, Federica, Idiano D’Adamo, and Massimo Gastaldi. 2017b. The Economic Feasibility of Residential Energy Storage Combined with Pv Panels: The Role of Subsidies in Italy. Energies 10: 1434. [Google Scholar] [CrossRef]
  23. Dadural, Joshua S., and Leah R. Reznikov. 2018. Interest in and Awareness of French President Emmanuel Macron’s “Make Our Planet Great Again” Initiative. Social Sciences 7: 102. [Google Scholar] [CrossRef]
  24. Dirix, Jo, Wouter Peeters, and Sigrid Sterckx. 2015. Is the Eu Ets a Just Climate Policy? New Political Economy 20: 702–24. [Google Scholar] [CrossRef]
  25. Doytch, Nadia, and Merih Uctum. 2016. Globalization and the Environmental Impact of Sectoral Fdi. Economic Systems 40: 582–94. [Google Scholar] [CrossRef]
  26. Edenhofer, Ottmar, Ramón Pichs-Madruga, Youba Sokona, Christopher Field, Vicente Barros, Thomas Stocker, Qin Dahe, Jan Minx, Katharine Mach, and Gian-Kasper Plattner. 2012. Renewable Energy Sources and Climate Change Mitigation—Special Report of the Intergovernmental Panel on Climate Change. Available online: http://Www.Ipcc.Ch/ (accessed on 9 July 2018).
  27. Elia, Valerio, Maria Grazia Gnoni, and Fabiana Tornese. 2017. Measuring Circular Economy Strategies through Index Methods: A Critical Analysis. Journal of Cleaner Production 142: 2741–51. [Google Scholar] [CrossRef]
  28. ENEA. 2018. Analisi Trimestrale Del Sistema Energetico Italiano—Anno 2017. Available online: http://www.Enea.It/It (accessed on 9 July 2018).
  29. Escoto Castillo, Ana, and Landy Sánchez Peña. 2017. Diffusion of Electricity Consumption Practices in Mexico. Social Sciences 6: 144. [Google Scholar] [CrossRef]
  30. European Commision. 2016. The Eu Emissions Trading System (Eu Ets). Available online: https://ec.europa.eu/clima/policies/ets_en (accessed on 28 June 2018).
  31. Fang, Guochang, Lixin Tian, Menghe Liu, Min Fu, and Mei Sun. 2018a. How to Optimize the Development of Carbon Trading in China—Enlightenment from Evolution Rules of the Eu Carbon Price. Applied Energy 211: 1039–49. [Google Scholar] [CrossRef]
  32. Fang, Guochang, Lixin Tian, Min Fu, Mei Sun, Yu He, and Longxi Lu. 2018b. How to Promote the Development of Energy-Saving and Emission-Reduction with Changing Economic Growth Rate—A Case Study of China. Energy 143: 732–45. [Google Scholar] [CrossRef]
  33. Fthenakis, Vasilis M., and Hyung Chul Kim. 2013. Life Cycle Assessment of High-Concentration Photovoltaic Systems. Progress in Photovoltaics: Research and Applications 21: 379–88. [Google Scholar] [CrossRef]
  34. Fthenakis, Vasilis M., Hyung Chul Kim, and Erik Alsema. 2008. Emissions from Photovoltaic Life Cycles. Environmental Science & Technology 42: 2168–74. [Google Scholar]
  35. Gerbeti, Agime. 2016. CO2 in Goods. In Green Fiscal Reform for a Sustainable Future: Reform, Innovation and Renewable Energy. Cheltenham: Edward Elgar Publishing, pp. 77–92. [Google Scholar]
  36. Gerbeti, Agime. 2017. Mercati Ambientali. Aggiornamento 2017. Enciclopedia Treccani 2: 107–11. [Google Scholar]
  37. Gerbeti, Agime. 2018. Sustainability as a Parameter for Industrial Competitivenes. Energia Elettrica 95: 13–21. [Google Scholar]
  38. Hosenuzzaman, Md, Nasrudin Abd Rahim, Jeyraj A. L. Selvaraj, Mohammad Hasanuzzaman, A. B. M. Abdul Malek, and Afroza Nahar. 2015. Global Prospects, Progress, Policies, and Environmental Impact of Solar Photovoltaic Power Generation. Renewable and Sustainable Energy Reviews 41: 284–97. [Google Scholar] [CrossRef]
  39. Hou, Guofu, Honghang Sun, Ziying Jiang, Ziqiang Pan, Yibo Wang, Xiaodan Zhang, Ying Zhao, and Qiang Yao. 2016. Life Cycle Assessment of Grid-Connected Photovoltaic Power Generation from Crystalline Silicon Solar Modules in China. Applied Energy 164: 882–90. [Google Scholar] [CrossRef]
  40. IEA. 2015. Global Energy & CO2 Status Report. Available online: https://Webstore.Iea.Org/ (accessed on 28 June 2018).
  41. Isacs, Lina, Göran Finnveden, Lisbeth Dahllöf, Cecilia Håkansson, Linnea Petersson, Bengt Steen, Lennart Swanström, and Anna Wikström. 2016. Choosing a Monetary Value of Greenhouse Gases in Assessment Tools: A comprehensive Review. Journal of Cleaner Production 127: 37–48. [Google Scholar] [CrossRef]
  42. Keppler, Jan Horst, and Maria Mansanet-Bataller. 2010. Causalities between CO2, Electricity, and Other Energy Variables during Phase I and Phase II of the Eu Ets. Energy Policy 38: 3329–41. [Google Scholar] [CrossRef]
  43. Khan, Jibran, and Mudassar H. Arsalan. 2016. Solar Power Technologies for Sustainable Electricity Generation—A Review. Renewable and Sustainable Energy Reviews 55: 414–25. [Google Scholar] [CrossRef]
  44. Kopnina, Helen. 2017. European Renewable Energy. Applying Circular Economy Thinking to Policy-Making. Visions for Sustainability 8: 7–19. [Google Scholar]
  45. Landis, Florian, and Thomas Bernauer. 2012. Transfer Payments in Global Climate Policy. Nature Climate Change 2: 628. [Google Scholar] [CrossRef]
  46. Lee, Minhyun, Taehoon Hong, Choongwan Koo, and Chan-Joong Kim. 2017. A Break-Even Analysis and Impact Analysis of Residential Solar Photovoltaic Systems Considering State Solar Incentives. Technological and Economic Development of Economy 24: 358–82. [Google Scholar] [CrossRef]
  47. Lin, Shu-Kun. 2012. Social Sciences and Sustainability. Social Sciences 1: 1. [Google Scholar] [CrossRef]
  48. Lin, Boqiang, and Yufang Chen. 2018. Carbon Price in China: A CO2 Abatement Cost of Wind Power Perspective. Emerging Markets Finance and Trade 54: 1653–71. [Google Scholar] [CrossRef]
  49. Louwen, Atse, Wilfried G. J. H. M. van Sark, André P. C. Faaij, and Ruud E. I. Schropp. 2016. Re-Assessment of Net Energy Production and Greenhouse Gas Emissions Avoidance after 40 Years of Photovoltaics Development. Nature Communications 7: 13728. [Google Scholar] [CrossRef] [PubMed]
  50. Markets Insider. 2018. CO2 European Emission Allowances in Eur—Historical Prices. Available online: https://Markets.Businessinsider.Com/Commodities/Historical-Prices/CO2-Emissionsrechte/Euro/26.6.2017_29.7.2018 (accessed on 29 July 2018).
  51. Mauleón, Ignacio. 2017. Photovoltaic Investment Roadmaps and Sustainable Development. Journal of Cleaner Production 167: 1112–21. [Google Scholar] [CrossRef]
  52. Metivier, Clement, Sebastien Postic, Emilie Alberola, and Madhulika Vinnakota. 2017. Global Panorama of Carbon Prices in 2017. Available online: https://www.I4ce.Org/ (accessed on 28 June 2018).
  53. OECD. 2016. Effective Carbon Rates on Energy. Available online: http://www.Oecd.Org/ (accessed on 9 July 2018).
  54. Ogland-Hand, Jonathan D., Jeffrey M. Bielicki, and Thomas A. Buscheck. 2017. The Value of CO2-Bulk Energy Storage to Reducing CO2 Emissions. Energy Procedia 114: 6886–92. [Google Scholar] [CrossRef]
  55. Olson, Arne, Chi-Keung Woo, Nick Schlag, and Alison Ong. 2016. What Happens in California Does Not Always Stay in California: The Effect of California’s Cap-and-Trade Program on Wholesale Electricity Prices in the Western Interconnection. The Electricity Journal 29: 18–22. [Google Scholar] [CrossRef]
  56. Orioli, Aldo, and Alessandra Di Gangi. 2015. The Recent Change in the Italian Policies for Photovoltaics: Effects on the Payback Period and Levelized Cost of Electricity of Grid-Connected Photovoltaic Systems Installed in Urban Contexts. Energy 93 Part 2: 1989–2005. [Google Scholar] [CrossRef]
  57. Orioli, Aldo, Vincenzo Franzitta, Alessandra Di Gangi, and Ferdinando Foresta. 2016. The Recent Change in the Italian Policies for Photovoltaics: Effects on the Energy Demand Coverage of Grid-Connected Pv Systems Installed in Urban Contexts. Energies 9: 944. [Google Scholar] [CrossRef]
  58. Park, Hojeong, and Won Kyung Hong. 2014. Korea’s Emission Trading Scheme and Policy Design Issues to Achieve Market-Efficiency and Abatement Targets. Energy Policy 75: 73–83. [Google Scholar] [CrossRef]
  59. Parry, Ian, Chandara Veung, and Dirk Heine. 2015. How Much Carbon Pricing Is in Countries’ Own Interests? The Critical Role of Co-Benefits. Climate Change Economics 6: 1550019. [Google Scholar] [CrossRef]
  60. Peng, Jinqing, Lin Lu, and Hongxing Yang. 2013. Review on Life Cycle Assessment of Energy Payback and Greenhouse Gas Emission of Solar Photovoltaic Systems. Renewable and Sustainable Energy Reviews 19: 255–74. [Google Scholar] [CrossRef]
  61. Pyrgou, Andri, Angeliki Kylili, and Paris A. Fokaides. 2016. The Future of the Feed-in Tariff (Fit) Scheme in Europe: The Case of Photovoltaics. Energy Policy 95: 94–102. [Google Scholar] [CrossRef]
  62. Radomes, Amando A., Jr., and Santiago Arango. 2015. Renewable Energy Technology Diffusion: An Analysis of Photovoltaic-System Support Schemes in Medellín, Colombia. Journal of Cleaner Production 92: 152–61. [Google Scholar] [CrossRef]
  63. REN21. 2018. Renewables 2018 Global Status Report. Available online: http://Www.Ren21.Net/Gsr-2017/ (accessed on 28 June 2018).
  64. Rodrigues, Sandy, Roham Torabikalaki, Fábio Faria, Nuno Cafôfo, Xiaoju Chen, Ashkan Ramezani Ivaki, Herlander Mata-Lima, and F. Morgado-Dias. 2016. Economic Feasibility Analysis of Small Scale Pv Systems in Different Countries. Solar Energy 131: 81–95. [Google Scholar] [CrossRef]
  65. Saavedra, Marroquin, Melkyn Ricardo, Cristiano Hora de O. Fontes, and Francisco Gaudêncio M. Freires. 2018. Sustainable and Renewable Energy Supply Chain: A System Dynamics Overview. Renewable and Sustainable Energy Reviews 82: 247–59. [Google Scholar] [CrossRef]
  66. Sampaio, Priscila Gonçalves Vasconcelos, and Mario Orestes Aguirre González. 2017. Photovoltaic Solar Energy: Conceptual Framework. Renewable and Sustainable Energy Reviews 74: 590–601. [Google Scholar] [CrossRef]
  67. Sarasa-Maestro, Carlos, Rodolfo Dufo-López, and José Bernal-Agustín. 2016. Analysis of Photovoltaic Self-Consumption Systems. Energies 9: 681. [Google Scholar] [CrossRef]
  68. Segura, Sara, Luis Ferruz, Pilar Gargallo, and Manuel Salvador. 2018. Environmental Versus Economic Performance in the Eu Ets from the Point of View of Policy Makers: A Statistical Analysis Based on Copulas. Journal of Cleaner Production 176: 1111–32. [Google Scholar] [CrossRef]
  69. Smith, Stephen, and Nils Axel Braathen. 2015. Monetary Carbon Values in Policy Appraisal. Available online: https://www.Oecd-Ilibrary.Org/Environment/Monetary-Carbon-Values-in-Policy-Appraisal_5jrs8st3ngvh-En (accessed on 9 July 2018).
  70. Sommerfeldt, Nelson, and Hatef Madani. 2017. Revisiting the Techno-Economic Analysis Process for Building-Mounted, Grid-Connected Solar Photovoltaic Systems: Part Two—Application. Renewable and Sustainable Energy Reviews 74: 1394–404. [Google Scholar] [CrossRef]
  71. Stiglitz, Joseph E., Nicholas Stern, Maosheng Duan, Ottmar Edenhofer, Gaël Giraud, Geoff Heal, Emilio Lebre la Rovere, Adele Morris, Elisabeth Moyer, Mari Pangestu, and et al. 2017. Report of the High-Level Commission on Carbon Prices Supported—Carbon Pricing Leadership Coalition. Available online: https://www.Carbonpricingleadership.Org/Report-of-the-Highlevel-Commission-on-Carbon-Prices/ (accessed on 9 July 2018).
  72. Strupeit, Lars, and Alvar Palm. 2016. Overcoming Barriers to Renewable Energy Diffusion: Business Models for Customer-Sited Solar Photovoltaics in Japan, Germany and the United States. Journal of Cleaner Production 123: 124–36. [Google Scholar] [CrossRef]
  73. Sun, Jingqi, Jing Shi, Boyang Shen, Shuqing Li, and Yuwei Wang. 2018. Nexus among Energy Consumption, Economic Growth, Urbanization and Carbon Emissions: Heterogeneous Panel Evidence Considering China’s Regional Differences. Sustainability 10: 1–16. [Google Scholar] [CrossRef]
  74. Tanaka, Yugo, Andrew Chapman, Shigeki Sakurai, and Tetsuo Tezuka. 2017. Feed-in Tariff Pricing and Social Burden in Japan: Evaluating International Learning through a Policy Transfer Approach. Social Sciences 6: 127. [Google Scholar] [CrossRef]
  75. Tian, Lixin, Jianglai Pan, Ruijin Du, Wenchao Li, Zaili Zhen, and Gao Qibing. 2017. The Valuation of Photovoltaic Power Generation under Carbon Market Linkage Based on Real Options. Applied Energy 201: 354–62. [Google Scholar] [CrossRef]
  76. Üçtuğ, Fehmi Görkem, and Adisa Azapagic. 2018. Environmental Impacts of Small-Scale Hybrid Energy Systems: Coupling Solar Photovoltaics and Lithium-Ion Batteries. Science of The Total Environment 643: 1579–89. [Google Scholar] [CrossRef]
  77. Vlachou, Andriana, and Georgios Pantelias. 2017. The Eu’s Emissions Trading System, Part 2: A Political Economy Critique. Capitalism Nature Socialism 28: 108–27. [Google Scholar] [CrossRef]
  78. Xiong, Ling, Bo Shen, Shaozhou Qi, Lynn Price, and Bin Ye. 2017. The Allowance Mechanism of China’s Carbon Trading Pilots: A Comparative Analysis with Schemes in Eu and California. Applied Energy 185: 1849–59. [Google Scholar] [CrossRef]
  79. Yang, Baochen, Chuanze Liu, Yunpeng Su, and Xin Jing. 2017. The Allocation of Carbon Intensity Reduction Target by 2020 among Industrial Sectors in China. Sustainability 9: 148. [Google Scholar] [CrossRef]
  80. Yang, Baochen, Chuanze Liu, Zehao Gou, Jiacheng Man, and Yunpeng Su. 2018. How Will Policies of China’s CO2 Ets Affect Its Carbon Price: Evidence from Chinese Pilot Regions. Sustainability 10: 605. [Google Scholar] [CrossRef]
  81. Zhao, Xin, Meng Han, Lili Ding, and Wanglin Kang. 2018. Usefulness of Economic and Energy Data at Different Frequencies for Carbon Price Forecasting in the Eu Ets. Applied Energy 216: 132–41. [Google Scholar] [CrossRef]
  82. Zhou, Nan, Nian Liu, Jianhua Zhang, and Jinyong Lei. 2016. Multi-Objective Optimal Sizing for Battery Storage of Pv-Based Microgrid with Demand Response. Energies 9: 591. [Google Scholar] [CrossRef]
Figure 1. Cumulative global renewable power capacity. Data expressed in GW (REN21 2018).
Socsci 07 00148 g001
Figure 2. Cumulative solar PV power capacity in 2017. Data expressed in GW. Top 10 countries (REN21 2018).
Socsci 07 00148 g002
Figure 3. Emissions of carbon dioxide of energy sources. Data expressed in gCO2eq/kWh (Cucchiella et al. 2017a; Bakhtyar et al. 2017; Edenhofer et al. 2012).
Socsci 07 00148 g003
Figure 4. CO2 European emission allowances. Data expressed in €/EUA (Markets Insider 2018).
Socsci 07 00148 g004
Figure 5. The distribution of revenues. Data expressed in percentage.
Socsci 07 00148 g005
Table 1. Economic inputs (Cucchiella et al. 2017b; Orioli et al. 2016).
VariableValueVariableValue
Acell7 m2/kWpps5.5 cent€/kWh
Cae250 €PCass0.4%
Cinv,unit1900 €/kWPCi15%
dEf0.7%PCm1%
inf2%PCtax43.5%
infel1.5%pffunction of S
kf1.13r5%
N20 yrd3%
Ndebt15 yS3 kW
NTaxD10 ytr1450 kWh/m2 × year
ƞbos85%TaxDu36–50%
ƞffunction of Swself,c30–50%
ƞm16%wsold50–70%
pc19 cent€/kWhVat10%
Table 2. NPV in baseline scenario. Data expressed in €.
ScenariosSelf-Consumption 30%Self-Consumption 40%Self-Consumption 50%
Fiscal Deduction 36%−5334551443
Fiscal Deduction 50%14511332121
Subsidies Low PCD−1588301819
Subsidies Moderate PCD78017692757
Subsidies High PCD209430824070
Table 3. DPBT in baseline scenario. Data expressed in years.
ScenariosSelf-Consumption 30%Self-Consumption 40%Self-Consumption 50%
Fiscal Deduction 36%>201813
Fiscal Deduction 50%19155
Subsidies Low PCD>20166
Subsidies Moderate PCD1665
Subsidies High PCD543
Table 4. NPV in alternative scenario (pc = 17 cent€/kWh). Data expressed in €.
ScenariosSelf-Consumption 30%Self-Consumption 40%Self-Consumption 50%
Fiscal Deduction 36%−928−72785
Fiscal Deduction 50%−2506061463
Subsidies Low PCD−5533041160
Subsidies Moderate PCD38512422099
Subsidies High PCD169925553412
Table 5. NPV in alternative scenario (pc = 21 cent€/kWh). Data expressed in €.
ScenariosSelf-Consumption 30%Self-Consumption 40%Self-Consumption 50%
Fiscal Deduction 36%−1389822102
Fiscal Deduction 50%54016592779
Subsidies Low PCD23713572477
Subsidies Moderate PCD117522953415
Subsidies High PCD248936094729
Table 6. NPV in alternative scenario (ps = 4 cent€/kWh). Data expressed in €.
ScenariosSelf-Consumption 30%Self-Consumption 40%Self-Consumption 50%
Fiscal Deduction 36%−989711131
Fiscal Deduction 50%−3117491809
Subsidies Low PCD−6134471507
Subsidies Moderate PCD32513852445
Subsidies High PCD163826983758
Table 7. NPV in alternative scenario (ps = 7 cent€/kWh). Data expressed in €.
ScenariosSelf-Consumption 30%Self-Consumption 40%Self-Consumption 50%
Fiscal Deduction 36%−788391755
Fiscal Deduction 50%60015162433
Subsidies Low PCD29712142131
Subsidies Moderate PCD123521523069
Subsidies High PCD254934664382
Table 8. NPV in alternative scenario (Cinv,unit = 2100 €/kW). Data expressed in €.
ScenariosSelf-Consumption 30%Self-Consumption 40%Self-Consumption 50%
Fiscal Deduction 36%−1134−145843
Fiscal Deduction 50%−3856041592
Subsidies Low PCD−7592301218
Subsidies Moderate PCD18011682156
Subsidies High PCD149324823470
Table 9. NPV in alternative scenario (Cinv,unit = 1700 €/kW). Data expressed in €.
ScenariosSelf-Consumption 30%Self-Consumption 40%Self-Consumption 50%
Fiscal Deduction 36%6710562044
Fiscal Deduction 50%67416622650
Subsidies Low PCD44314312419
Subsidies Moderate PCD138123693357
Subsidies High PCD269436834671
Table 10. NPV in alternative scenario (tr = 1300 kWh/m2 × year). Data expressed in €.
ScenariosSelf-Consumption 30%Self-Consumption 40%Self-Consumption 50%
Fiscal Deduction 36%−1094−208678
Fiscal Deduction 50%−4164701356
Subsidies Low PCD−7581281014
Subsidies Moderate PCD839701856
Subsidies High PCD126121473033
Table 11. NPV in alternative scenario (tr = 1600 kWh/m2 × year). Data expressed in €.
ScenariosSelf-Consumption 30%Self-Consumption 40%Self-Consumption 50%
Fiscal Deduction 36%2811182209
Fiscal Deduction 50%70517962886
Subsidies Low PCD44215322623
Subsidies Moderate PCD147725683658
Subsidies High PCD292640175107
Table 12. NPV in alternative scenario (RECD = 562   gCO 2 eq / kWh ). Data expressed in €.
ScenariosSelf-Consumption 30%Self-Consumption 40%Self-Consumption 50%
Subsidies Low PCD−2257631751
Subsidies Moderate PCD54415332521
Subsidies High PCD162226103599

