4.1. Part I: A National Accounting Model
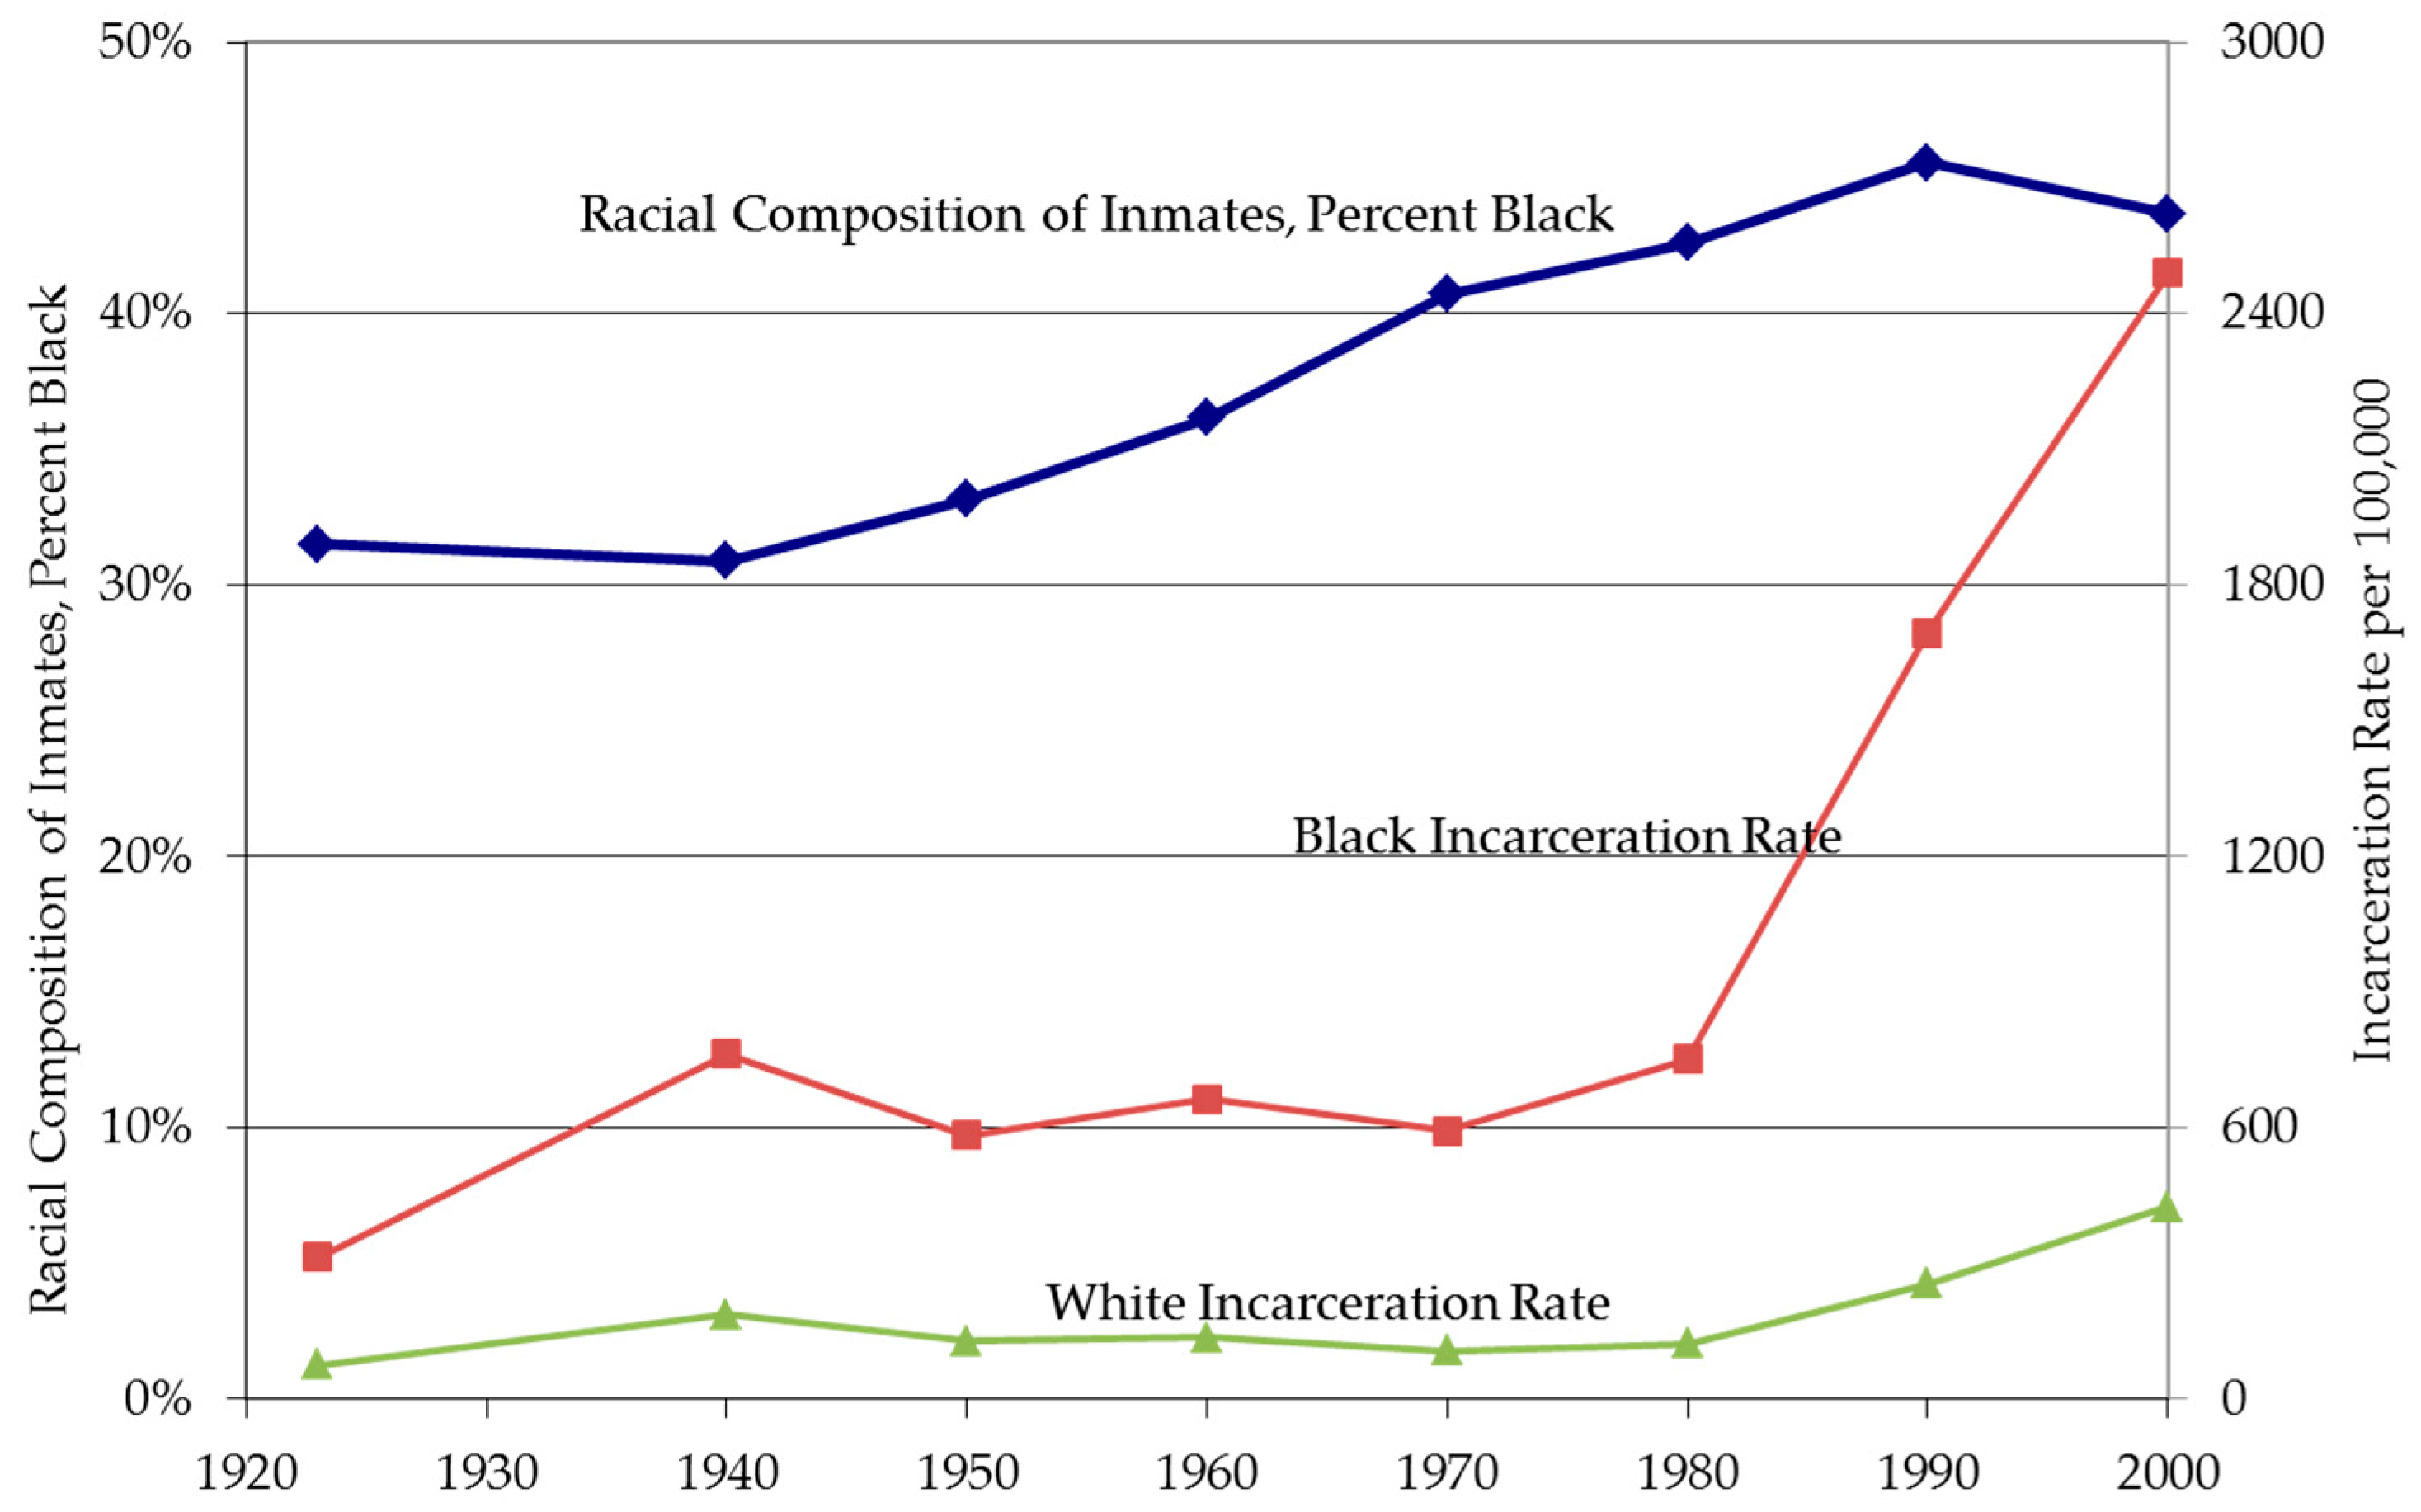
Figure 2 shows our decomposition of the national trends in the racial difference in incarceration. The dashed line with the diamonds shows the unadjusted difference between the log of the number of black prisoners and the log of the number of white prisoners
. In 1940, there are many more white prisoners than black prisoners, but by 1980 there are almost as many black prisoners as white prisoners. The thick solid line with squares shows the difference in the rate of incarceration by adjusting for population size
. Here the difference in incarceration
rates is clearly evident, and we see the familiar increase over time in the racial difference in incarceration. The increase appears to be relatively steady throughout the time period, with a somewhat slower increase during the 1950s. The population-adjusted line increases less steeply than the unadjusted line, indicating that the growth in the black population relative to the white population explains some of the increase in RDI. Calculations indicate that adjusting for population accounts for 32% of the original trend between 1940 and 1980. During this period the white population grew by 59% whereas the black population grew by 106%, nearly twice as fast.
7 The thin solid line with triangles further adjusts for the arrest rates in the black and white populations (recall that this population arrest rate includes both the crime rate and the rate of arrest among those who have committed a crime). Between 1940 and 1960, adjusting for racial differences in arrest rates explains virtually all of race difference in incarceration; only one percent of the 1940 to 1960 trend remains unexplained after adjusting for arrest rates. After 1960, racial differences in arrest rates explain much of the racial difference in incarceration, though a declining amount; the solid line with triangles slowly diverges from the flat solid line representing equality. After 1960, however, there were actually larger increases in arrest rates among whites than among blacks. Arrest rates increased 177% among whites and 105% among blacks over this period. As such, changes in the racial differential in arrest rates during the 1960s and 1970s cannot explain the increasing racial difference in incarceration during that period, and adjusting for arrest rates results in a larger racial difference in incarceration in 1980 compared to 1960.
8By definition, the remaining differences are accounted for by differences in rates of sentencing to prison (or prison term length) among those arrested. In subsequent sections we examine why these rates have changed. In both the 1960s and 1970s, the rate of sentencing for blacks appears to have increased relative to that for whites. The dashed line with the x’s adjusts for population, arrests, and for the likelihood of being sentenced to prison. This line hovers around the zero line, with the black and white values being essentially equal in 1940 and 1970. We suspect that the remaining differences in 1950, 1960, and 1980 reflect imperfections in our data. Sentencing appears to add little to the explanation of racial differences in incarceration between 1940 and 1960. However, between 1960 and 1980, sentencing differences account for a considerable portion of the racial difference in incarceration.
In summary, this part of analysis suggests the following conclusions. First, slightly less than one-third of the increase in the racial difference in incarceration during the 1940–1980 period was due to black population increase. This contribution occurs largely uniformly throughout the period. Second, differential arrest rates explain the vast majority of the racial difference in incarceration in 1940, 1950, and 1960, and differential changes in arrest rates account for the increase during that period not attributable to differential population growth. During the 1960s and 1970s, larger increases in arrest rates among whites than blacks imply that arrests cannot account for the increase in the racial differences in incarceration over that period. Instead, the remaining two-thirds of the increase in the racial difference in incarceration from 1960 to 1980 is due to racial differences in sentencing rates or sentencing length. These differences in sentencing could reflect a number of factors, including discrimination, racial differences in types of offense, or racial differences in individuals’ accumulated criminal records.
4.2. Part II: Decomposing State-Level Variation in Incarceration Rates
Model 1 in
Table 2 shows the basic trend to be decomposed. It predicts inmates using only time dummies, the black dummy, and the black by time dummies, and can be thought of as a simple display of the mean of the log of the number of inmates for blacks and whites over time.
9 The first column displays results representing the constant and the time trend with 1940 as the base year and is the time trend for whites. The third column displays the results from the black dummy and black by time interaction terms, the focus of our analysis. The trend in the racial difference in incarceration is clearly evident. As expected, the racial difference in the log of the number of individuals incarcerated is increasing over time (−0.736 for 1940 to 0.015 for 1980). The second column shows the implied coefficients for blacks, calculating by summing the first and third columns.
Model 2 in
Table 2 shows analogous estimates from the full model described above. Coefficients for the individual state, state by time, and race by time dummies are omitted for space reasons. Comparing the rightmost columns for each of the two models shows that accounting for population increase and for migration has greatly reduced the time trend in the racial difference in incarceration, particularly after 1960. Whereas the difference between 1980 and 1940 in the RDI in model 1 is 0.751, it drops to 0.398 in model 2.
Table 3 shows the decomposition of white trends by decade and, in the rightmost column, for the entire period 1940 to 1980. For each time period, the total trend is decomposed into components contributing to an increase in incarceration over time and those contributing to a decrease over time, with components contributing to the decrease indicated by shaded cells. For each period, the raw values in the difference in ln(inmates) metric are to the left, and percentages of the total increase or decrease are on the right. The three total rows near the bottom of the table show that during the 1940s and 1960s, components leading to a decrease in incarceration among whites were larger than those leading to an increase, resulting in an overall decrease during those two decades and a slight overall decrease over the entire period, 1940–1980. The magnitudes of the overall increases in incarceration among whites during the 1950s and 1970s were about the same.
Increasing population pushes white incarceration numbers higher in all decades, but had an especially large impact in the 1940s and 1950s, a moderate impact in the 1960s, and contributed to over half of the 1940 to 1980 increase in white incarceration. As captured by the state dummies, population increases in states with higher incarceration rates, most likely due to migration rather than differential birth rates, also consistently increase white incarceration over time, contributing to about 13 percent of the overall increase from 1940 to 1980. Finally, as captured by the state by time dummies, population change in states with changing incarceration rates has differing impacts in each decade. For example, an increase in the population of a state with increasing incarceration rates would, ceteris paribus, lead to an increase in incarceration. Similarly, a decrease in the population of a state with decreasing incarceration rates would also lead to an increase in incarceration. This component leads to a very slight decline in white incarceration in the 1940s and to increases in the 1950s, 1960s, and 1970s. Throughout the entire period, the net impact of a decrease in the population in states with decreasing incarceration rates is positive and accounts for about 32 percent of the overall increase in white incarceration. The time dummies capture the overall time trend for each period not accounted for by the other components. Their relatively large magnitudes, especially in the individual decades, suggest that adding other variables to the model is necessary to fully understand the time trend in white incarceration.
Table 4 performs the same decomposition for black incarceration. The bottom section of the table shows a similar temporal story for black incarceration as for white incarceration, except that the net declines in incarceration in the 1940s and 1960s are smaller for blacks, and the net increases in the 1950s and 1970s are larger for blacks. This leads to an overall increase in black incarceration between 1940 and 1980. Slightly over half of this increase occurred during the 1970s, with the remainder occurring in the 1950s.
As among whites, national population increase plays an important role in the increase in incarceration among blacks in all time periods. In these data, for blacks, it accounts for a little over a third of the overall increase between 1940 and 1980. As captured by the state dummies, population change in states with different incarceration rates pushed black incarceration rates down between 1940 and 1970 and pushed them up in the 1970s, presumably as blacks moved to lower-incarceration states in the first period and higher incarceration states in the second. However, the magnitudes of these effects are relatively small. As captured by the black by state dummies, black population growth in states with higher black incarceration rates increased black incarceration in all decades but the 1970s, having its biggest impact in the 1940s, 1950s, and 1960s. This component contributes about 13 percent of the overall increase in black incarceration from 1940 to 1980. Finally, state by time dummies capture the changes in black incarceration due to changes in population in states with changing incarceration rates. These changes pushed black incarceration upward throughout the period, as blacks moved to states whose incarceration rates were increasing and away from states where they were decreasing. Between 1940 and 1980, these movements on net contributed to about 30 percent of the increase in black incarceration. Again, the relatively large contributions of the time dummies and black by time dummies in many periods suggest that additional variables are necessary to understand black incarceration trends. Understanding why incarceration rates increased in states where blacks moved also requires examining additional variables, as we do in Part III.
Table 5 differences the components of the black and white trends in order to decompose the time trend in the racial difference in incarceration. The bottom section of the table indicates that the racial difference in incarceration increased in all years, though not evenly. The 1950s account for almost one-third of the change, and the 1970s account for over one-third. As indicated by the ln(Pop) row, differential national population increase pushed up the racial difference in incarceration in all decades except the 1940s and accounted for about one-fifth of the overall increase between 1940 and 1980.
10 Differential population change in states with higher overall incarceration rates lowers the racial difference in all years, though its effects are largest in the 1940s and 1950s and moderate in the 1960s. Black population increase in states where black incarceration rates are disproportionately higher than those of whites increases the differential in all periods except the 1970s, contributing to about 22 percent of the overall increase in the racial differential between 1940 and 1980. In other words, the white population increased faster in states with overall higher incarceration rates throughout the period, lowering the RDI, but black population increase in states with higher black incarceration rates throughout the period increased the RDI. Finally, differential movement to states with increasing incarceration rates over time also contributes about one-fifth of the overall increase between 1940 and 1980, leading to an increase in all periods and having its biggest impact in the 1940s and 1950s. In other words, the black population increases more in states whose incarceration rates were rising, increasing the RDI.
4.3. Part III: Modeling Incarceration Rates Using State Characteristics
The two descriptive decomposition analyses above provide information on the proximate causes of changes in the RDI, but more detailed explanations of specific causes are needed to understand the patterns revealed. For example, how can we understand the role of black population increases in states with rising black incarceration rates? In addition, the remaining importance of the black by time dummies in the decomposition of the black-white incarceration differential, about one-third of the total between 1940 and 1990, still needs to be explained. As such, social processes in addition to the changing geographic location of whites and blacks by state should also be taken into account in understanding the trend.
We begin by examining how various state characteristics that are hypothesized above to affect incarceration rates changed over time between 1940 and 1980. State means by race and time, weighted by the proportion of the black population that resides in each state in each year, are provided in
Appendix B,
Table A3. Here we describe a number of trends in the state characteristics that are worthy of note. Some of these show improvement in the situation of blacks relative to that of whites and some of these show declines.
The gap in wage income at the 25th percentile of the wage distribution became wider until 1970 and then began to close.
11The proportion of single mothers increased among both blacks and whites but increased more among blacks.
The racial gap in the unemployment rate held relatively steady through 1970 and then increased substantially by 1980.
Though education increased among blacks throughout the period, blacks lost ground relative to whites through 1970.
The proportion of blacks and whites in the peak crime ages was fairly similar throughout the period.
Wage inequality increased among both blacks and whites, and blacks had consistently lower within group inequality throughout the period.
We also note the following shifts related to population growth, migration, and urbanization, which are consistent with prior research [
13]:
The proportion of the state that was black where the typical black lived declined as the black population moved north and west.
The likelihood of living in a state where black population change was high increased.
The proportion of blacks born outside their current region of residence increased.
Both blacks and whites urbanized, though blacks slightly more so than whites.
Agricultural employment fell.
Manufacturing employment increased, at least through 1970.
Blacks and whites came to live in states that increasingly voted Republican and increasingly had Republican governors.
Racial segregation increased slightly through 1970 and then declined somewhat during the 1970s.
We now turn to Poisson models similar to those above except that here we include only year dummies and add state characteristics. For each pair of regressions, we display the coefficients from the black and white models and the differences between the models in the constant and the year dummy coefficients. The differences in the year dummies can be interpreted as the remaining time trend in the racial difference in the incarceration rate once the state characteristics included in the model are held constant at their black mean. The difference in the constant can be interpreted as the remaining racial difference in incarceration in the omitted year, 1940. Results are presented in
Table 6.
12 Rather than show one preferred model, we build up a series of models that progressively add explanatory variables. This procedure allows us to see how much more of the RDI can be explained by the added variables, providing information about their importance relative to other possible explanatory variables.
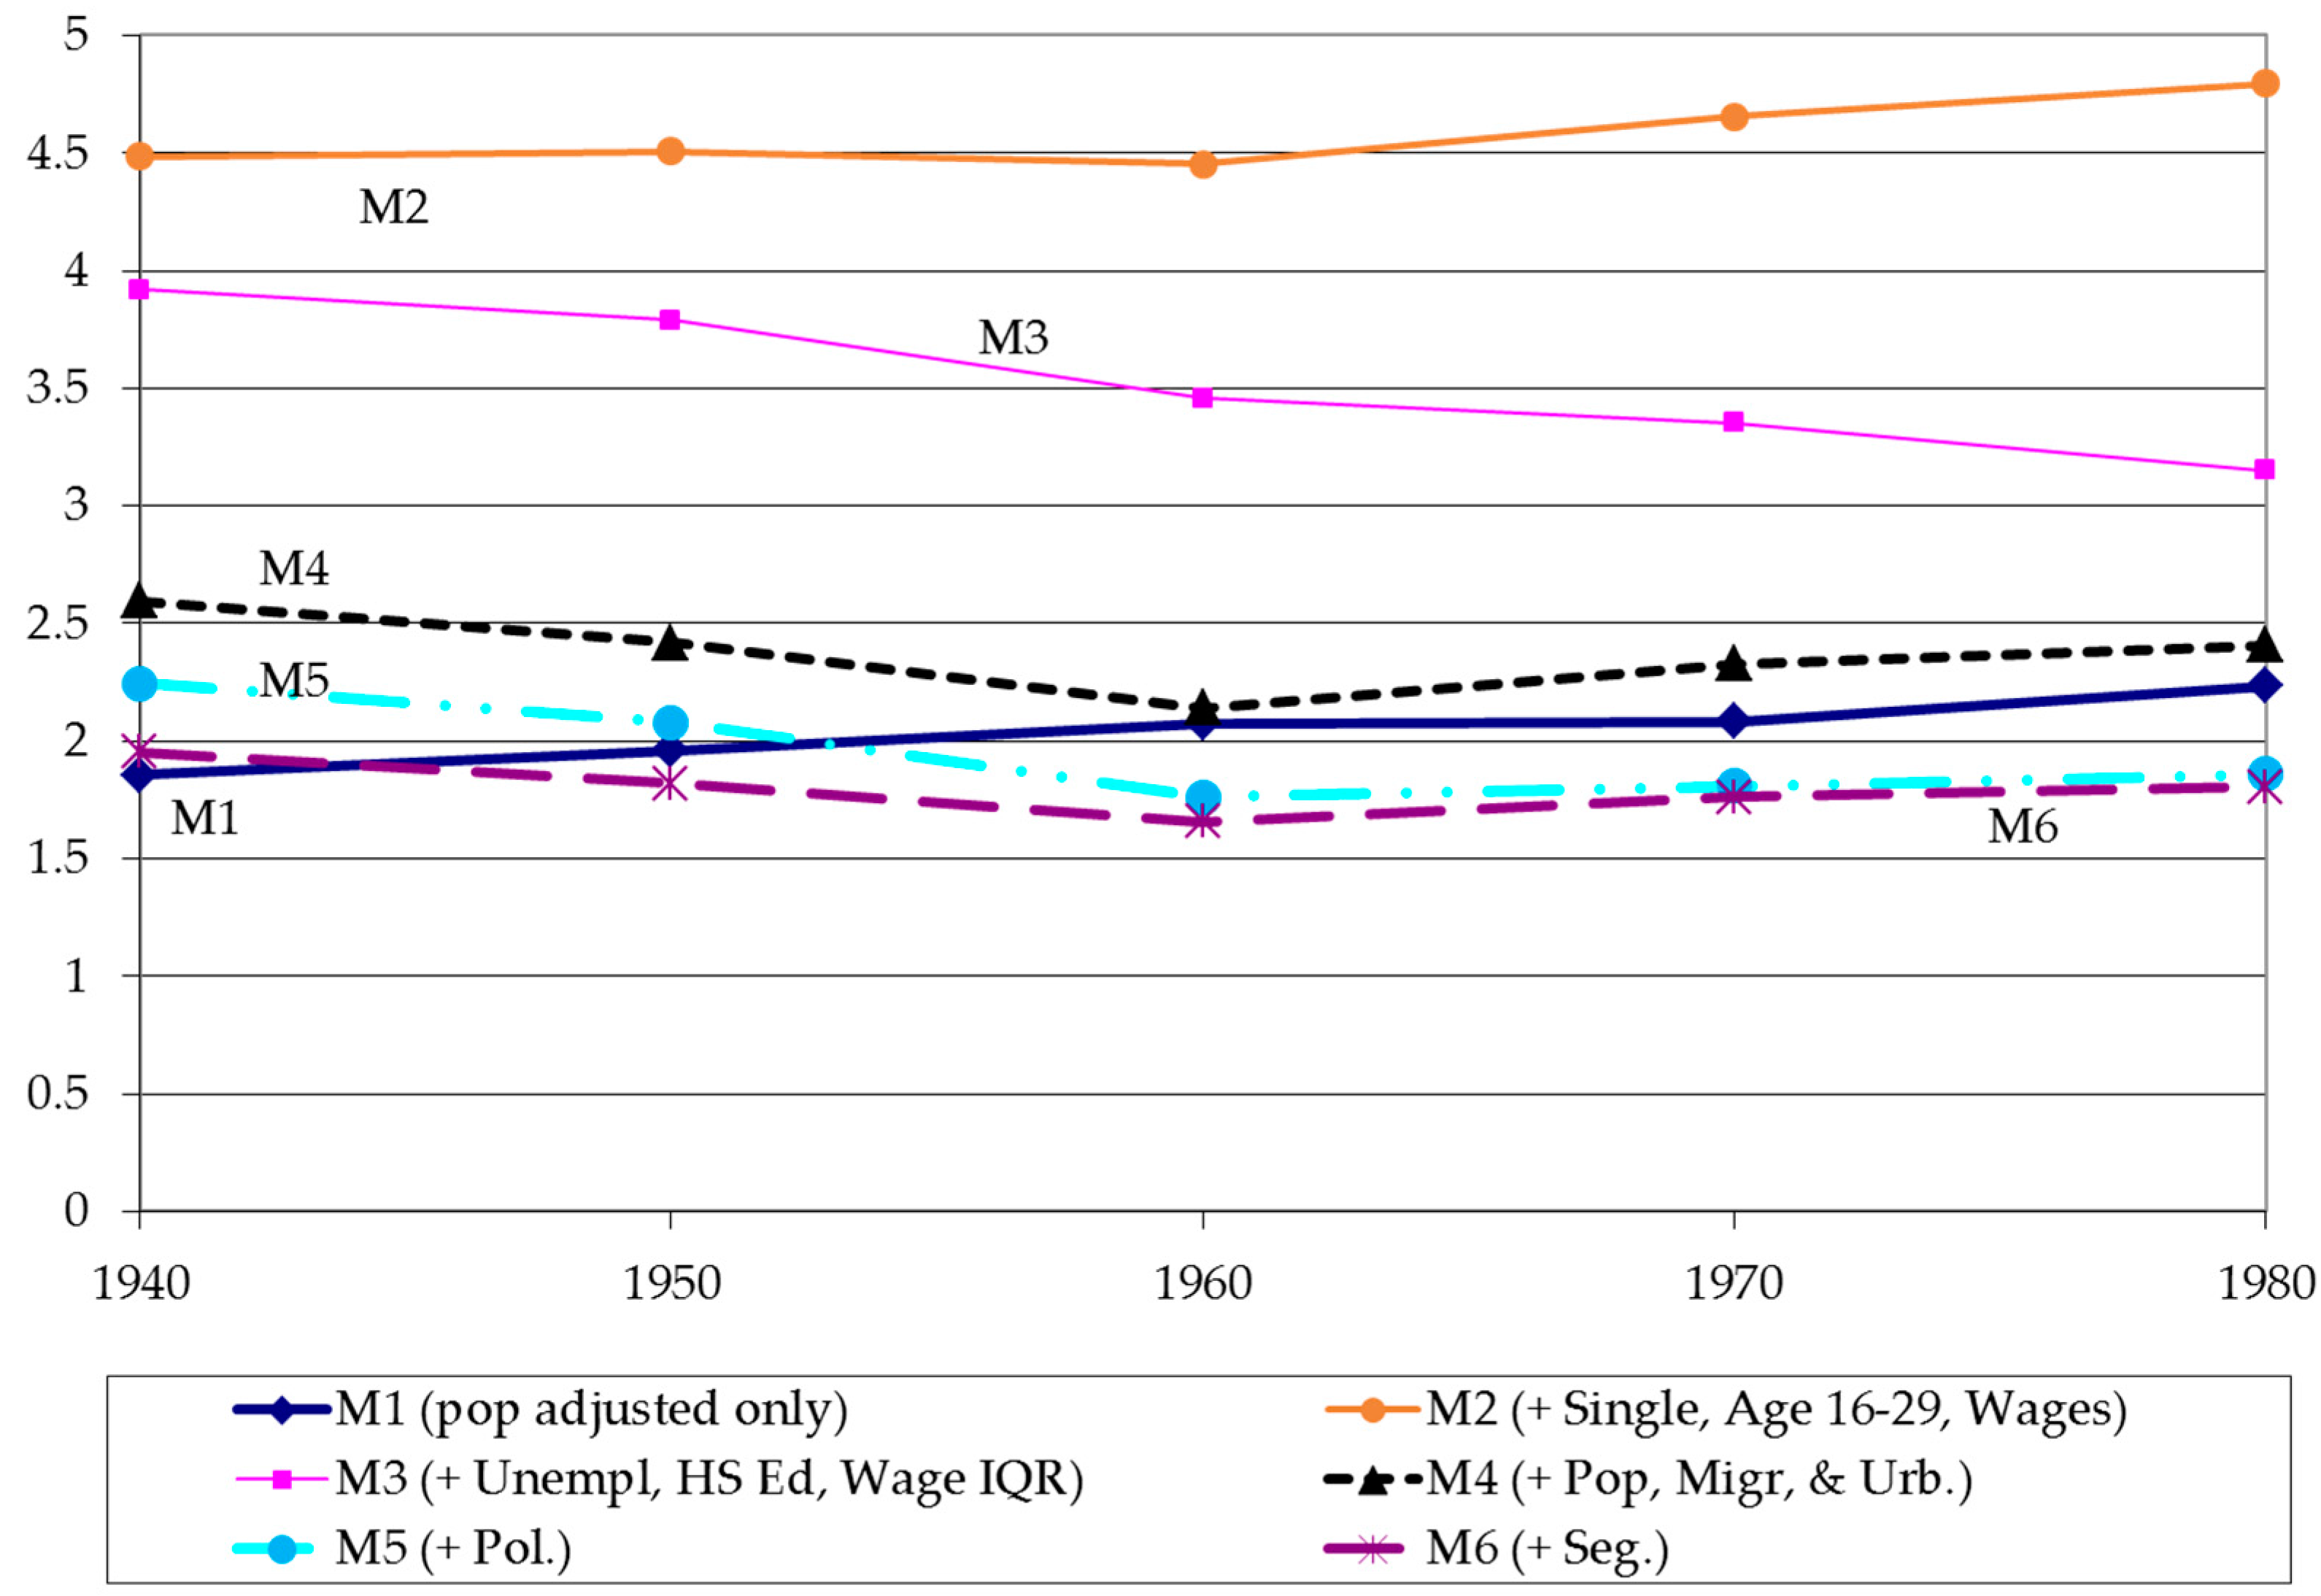
Figure 3 shows the implied trends in the racial difference in log incarceration rates based on the models in
Table 6.
The regressions in column (1) of
Table 6 contain only the exposure, the constant, and the time dummies, which display the now-familiar racial difference in incarceration in 1940 that grows over time. The trend is displayed in
Figure 3 with the thick solid line with the diamonds. Model (2) adds three demographic and economic characteristics, percentage single mothers, wage income at the 25th percentile, and the percentage of the population aged 16–29. Holding constant these characteristics increases the racial differential in 1940, as blacks were relatively disadvantaged compared to whites on these dimensions in that year (recall that since the independent variables are black-mean centered in both the white and black models, the white constant now reflects the mean incarceration rate for whites in 1940 were the mean characteristics of whites set to those of blacks). Entering these variables individually into the model suggests that controlling for the single parenthood variable is responsible for almost all of the increase in the 1940 racial gap in incarceration (models not shown). Holding constant these characteristics also accounts for almost all the trend in racial difference in incarceration in the 1940s, all of the trend in the 1950s, and a small fraction of the trend thereafter. The remaining trend in the racial difference in incarceration is displayed graphically in
Figure 3 in the thick solid line with the circles.
Model 3 adds three additional demographic and economic characteristics: unemployment, education, and wage inequality. Holding constant these characteristics explains some of the racial difference in 1940, but more importantly also shifts the trend from an increasing racial difference over time to a decreasing one, reflecting the fact that over time blacks’ status relative to that of whites’ fell on these demographic and economic characteristics. This downward trend is displayed in
Figure 3 in the thin solid line with the squares. Judging from the large decreases in the AIC and BIC values from Model 1 to Model 2 to Model 3, the demographic and economic characteristics improved the fit of the models considerably.
In most cases the demographic and economic characteristic variables operate in the expected direction. Higher unemployment and a greater share of the population in the crime-prone age range of 16–29 are associated with higher incarceration, while higher levels of education are associated with lower incarceration. Yet not all variables operate the same for blacks and whites, and not all operate in the expected direction. This is due to controlling for the other variables and to the state fixed effects dummies. Among blacks, greater within-race wage inequality is associated with higher incarceration, but among whites it is associated with lower incarceration. This pattern persists across all of the models, even when other variables are controlled (and is also evident in models that do not include any other state characteristics—models not shown). This pattern in consistent with Wilson’s arguments about the concentration of poverty among blacks that accompanied the growth of the black middle class the associated rise in inequality among blacks.
Among blacks, higher wage income at the 25th percentile is associated with higher imprisonment, but among whites it is associated with lower imprisonment. These income effects become more consistent in direction and shrink as other variables are added in later models, suggesting that failing to account for other factors such as migration and urbanization may be driving the unexpected wage income results in Model 3. The percentage of single mothers shows a strong and consistently negative association with both black and white incarceration rates. Bivariate analyses reveal that this unexpected relationship is a product of the state fixed effects in the model (models not shown). Intuitively, this means that once all cross-state variation is removed, there is a negative relationship between single motherhood and incarceration within-states over time.
Model 4 adds the Population Growth, Migration, and Urbanization variables to the model. These variables considerably reduce the base level racial difference in incarceration reflected in the constant as well as the trend between 1960 and 1980. This is also clear from
Figure 3, which shows the remaining trend from Model 4 with the dotted line with the triangles. The large decreases in the BIC and AIC statistics also indicate the importance of these variables for model fit. Moreover, all of the individual variables show associations with incarceration in the expected directions. Percentage black and black population growth both increase black incarceration but decrease white incarceration. Migration (percentage born in another region) and urbanization increase incarceration among both blacks and whites, while agricultural employment is associated with lower levels of incarceration among both blacks and whites. Manufacturing employment is associated with higher levels of incarceration among blacks but not whites. Glancing ahead to Models 5 and 6, we see that these results are robust to further controls for political context and segregation. Together, these results suggest that processes of black population growth, urbanization, and migration played important roles in the trend in the racial difference in incarceration between 1940 and 1980.
Model 5 adds the political context variables to the model. The constant and year coefficients in
Table 6 and the trend line in
Figure 3 (which shows the remaining trend from Model 5 in the dot-dash line with circles) both reveal that these variables further account for some of the baseline racial difference in 1940 as well as a small fraction of the trend between 1960 and 1970. Both variables operate in the expected direction, with more Republican influence associated with greater incarceration, but this effect is stronger among whites. Indeed, the AIC and BIC statistics actually increase from Model 4 to Model 5 for blacks, suggesting that the political variables are adding little explanatory power to the black model. The white models, however, show decreases in the AIC and BIC, as we would expect based on the large coefficients on the political variables in Model 5. These results suggest that the political factors identified in previous research as explaining black incarceration in more recent years are less important in the period we study.
Model 6 adds the segregation measure, which is positively associated with incarceration for both blacks and whites, although not surprisingly the association is considerably larger for blacks than whites. Adding this measure to the model further explains the baseline difference in 1940 and further explains the trends over time, particularly between 1950 and 1960, when migration of blacks from the South to the urban North greatly increased racial segregation. This is clear from the constant and year coefficients in the model and from the resulting trend line in
Figure 3, which shows the remaining trend from Model 6 with the dashed line with asterisks. The BIC and AIC statistics for both the black and the white models also suggest that this variable has improved the fit of the model. Note however, that there is still a large racial difference, particularly at baseline, that remains unexplained by the full array of variables in Model 6. We have not fully explained the baseline racial difference in incarceration. Additional research is necessary to fully understand the racial differences in incarceration in the 1940–1980 period.
The above discussion has focused on the coefficients in the models and the residual time trends. It does not explicitly consider the trends in the mean characteristics of blacks and whites. An alternative way to interpret the models in
Table 6 is to decompose the trends in racial differences into those that are due to differences in the mean characteristics of blacks and whites and those that are due to differences in the coefficients between blacks and whites. This decomposition will allow us to examine the relative importance of specific variables in driving the changes in the racial difference in incarceration taking into account both the changes in the characteristics over time and the association between the variables and incarceration by racial group. Juhn, Murphy, and Pierce [
80] generalize the cross-sectional Blinder-Oaxaca decomposition to two periods (see also Makepeace et al. [
81]). Because we estimate only one model pooled across years for each group, we focus here on the trends attributable to changes in the black means and trends attributable to racial differences in changes in mean characteristics.
13Table 7 shows the decomposition for the entire period from 1940 to 1980 using the race-specific means from those years (
Appendix B provides cross-sectional Blinder-Oaxaca decompositions for 1940 and 1980 individually, and
Appendix Table A5 displays decompositions that are analogous to the 1940–1980 decomposition in
Table 7, separately by decade).
Table 7 shows the total raw contribution of each variable and the percentage of the total raw racial trend for which it accounts. The bottom three rows of the table show the sum of the trends captured by the model, the trend that remains unexplained (identical to the B-W 1980 dummy in Model 6 of
Table 6), and the resulting sum, which represents the raw trend in the racial difference once race-specific state fixed effects are removed. When interpreting the results of the decompositions, it is important to remember that the results are dependent on the specification of the regression models. For example, if one variable in the model is endogenous to another, the decomposition will attribute the effects to the endogenous variable. This might occur, for example, with the political variables. If election of a Republican governor is a response to an increasing black population, some of the effect of increasing black population will be attributed to the Republican governor variable.
Note first that we have more than explained the trend in the racial difference in incarceration (the unexplained trend is negative and the sum of the attributable trend is over 100%), which was also evident from
Figure 3 (recall that the trend line switched from upward to downward). We see from
Table 5 which variables explain the increase in the racial difference in incarceration and which explain any countervailing effects that contributed to decreases in the racial difference in incarceration.
14 Most of the contribution comes from demographic and economic characteristics and the migration and urbanization variables. Although segregation plays a major role in the 1940 and 1980 cross-sectional decompositions (see
Appendix B,
Table A4), the small contribution of segregation to the trend in the racial difference in incarceration is due to its relatively small change over the period. Political context also appears to play only a minor role in the trend, with its effects concentrated in the 1960s (see
Appendix B Table A5 for decade specific results). The small contribution of the political context variables is due to their relatively small coefficients. Overall, the changes in the demographic and economic characteristics serve to increase the racial difference in incarceration over time, though this effect seems concentrated in the 1950s. It also masks multiple countervailing forces. The bulk of the increase in incarceration is attributable to rising wage inequality among blacks relative to whites, particularly in the 1950s and 1960s, and rising rates of single parenthood among blacks relative to whites, particularly in the 1960s and 1970s. Growth in wages among blacks pushed racial differences in incarceration downward, particularly in the 1940s, 1950s, and 1960s, as did the rise in education among blacks, particularly in the 1970s.
Overall, the migration and urbanization variables contributed to a decline in the racial difference in incarceration, but again this masks considerable variation by specific variables and across time. Percentage black, percentage in manufacturing, and percentage in agriculture drove the downward trend, while percentage born in another region and, to a much lesser extent, black population change and percentage urban, drove the upward trend. The contribution of percentage black is most pronounced in the 1940s, followed by the 1950s and 1960s. Mean percentage black declines throughout the period (recall that the models are weighted by mean proportion black in the state across years, so this indicates a dispersal of the black population), and percentage black is positively associated with black incarceration and negatively associated with white incarceration. Agricultural employment, which is negatively associated with incarceration for both blacks and whites, declined drastically throughout the period in both groups, but because blacks started with a greater concentration in the agricultural sector, the change was larger for blacks. These effects are concentrated somewhat in the 1940s and 1960s. Manufacturing employment increased among both groups in the 1940s and 1950s but increased among blacks in the 1960s and 1970s while decreasing among whites in those decades. These trends, coupled with a positive association with incarceration among blacks and a negative association with incarceration among whites meant that changes in manufacturing employment fueled an increase in the racial difference in incarceration in the 1950s and decreases in the 1960s and 1970s. Percentage born in another region increased the racial difference in incarceration in the 1950s and 1960s, and to a small extent in the 1970s. During these periods, this measure of migration was much higher for blacks than whites, a difference that was exaggerated by the larger positive association with incarceration among blacks than whites. Differential changes in urbanization decreased the racial difference in incarceration in the 1950s but increased the racial difference during the 1960s, for a slight net upward impact over the whole period.


