
On Housing-Related Financial Fears of Baby Boomer Women Living Alone in Switzerland


Abstract
1. Introduction
2. Literature Review and Background Information
3. Survey, Available Data, and Descriptive Statistics
3.1. Survey Setup
3.2. Description of the Variables
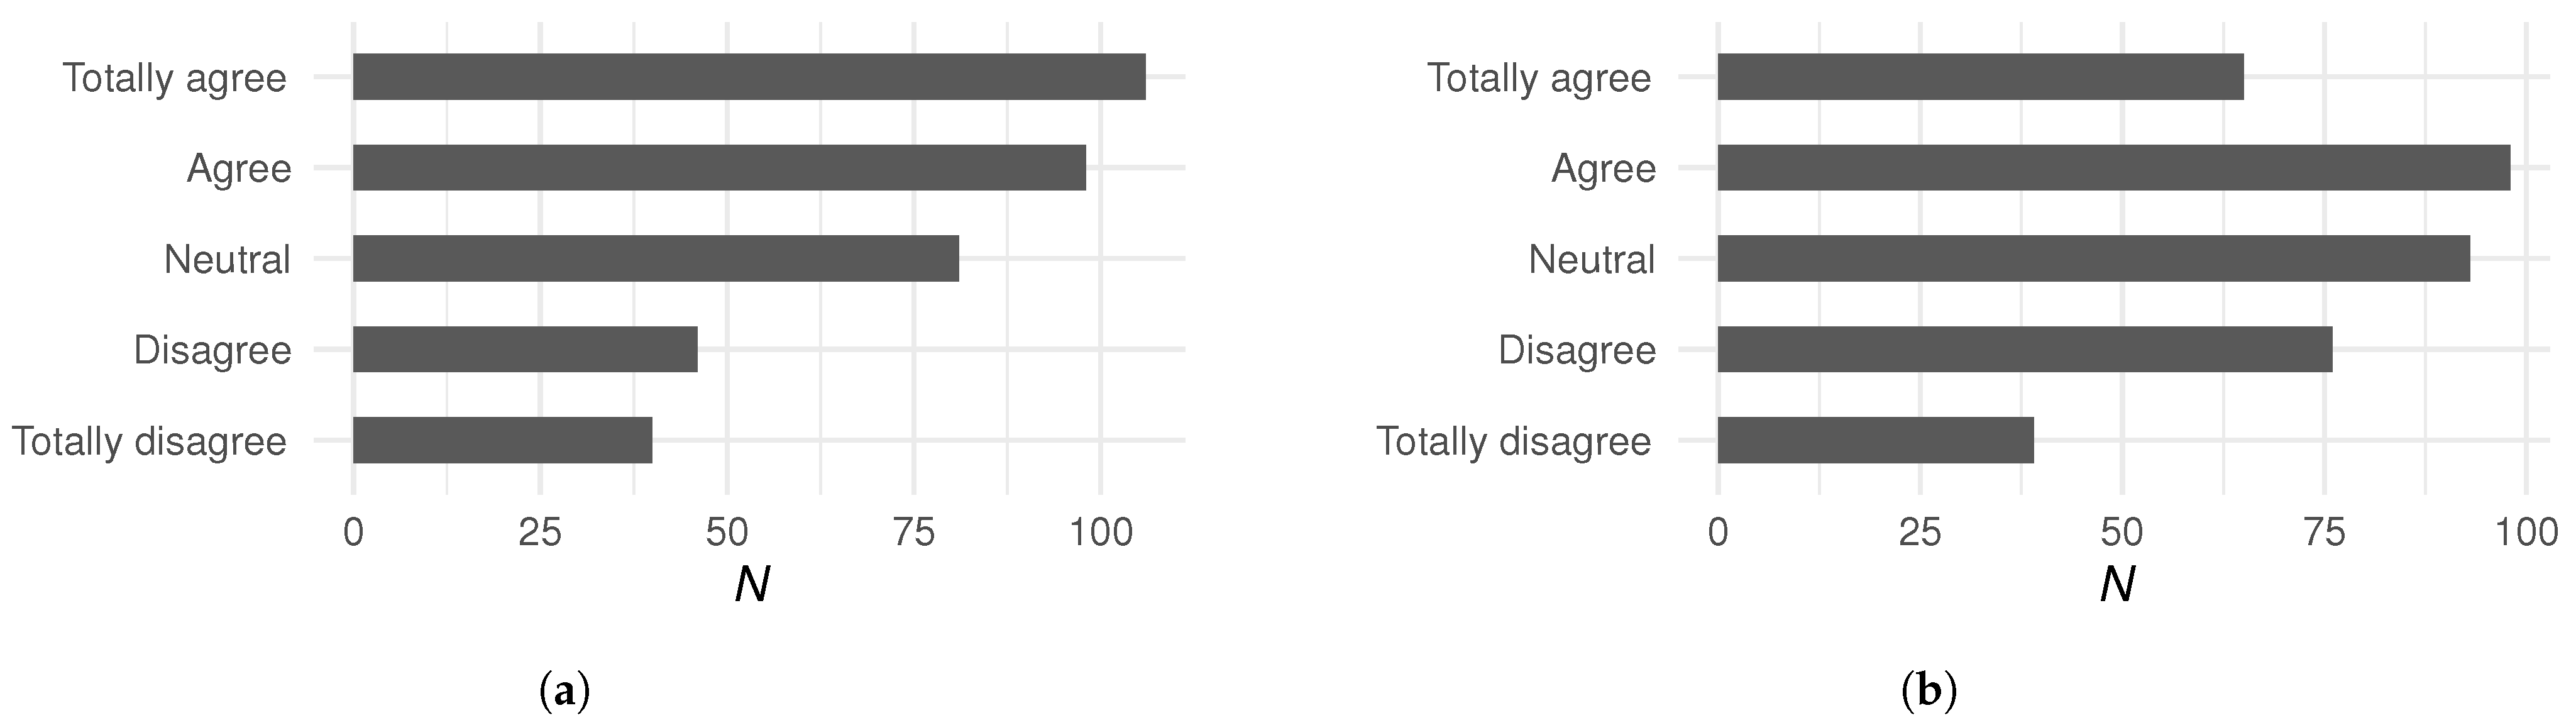
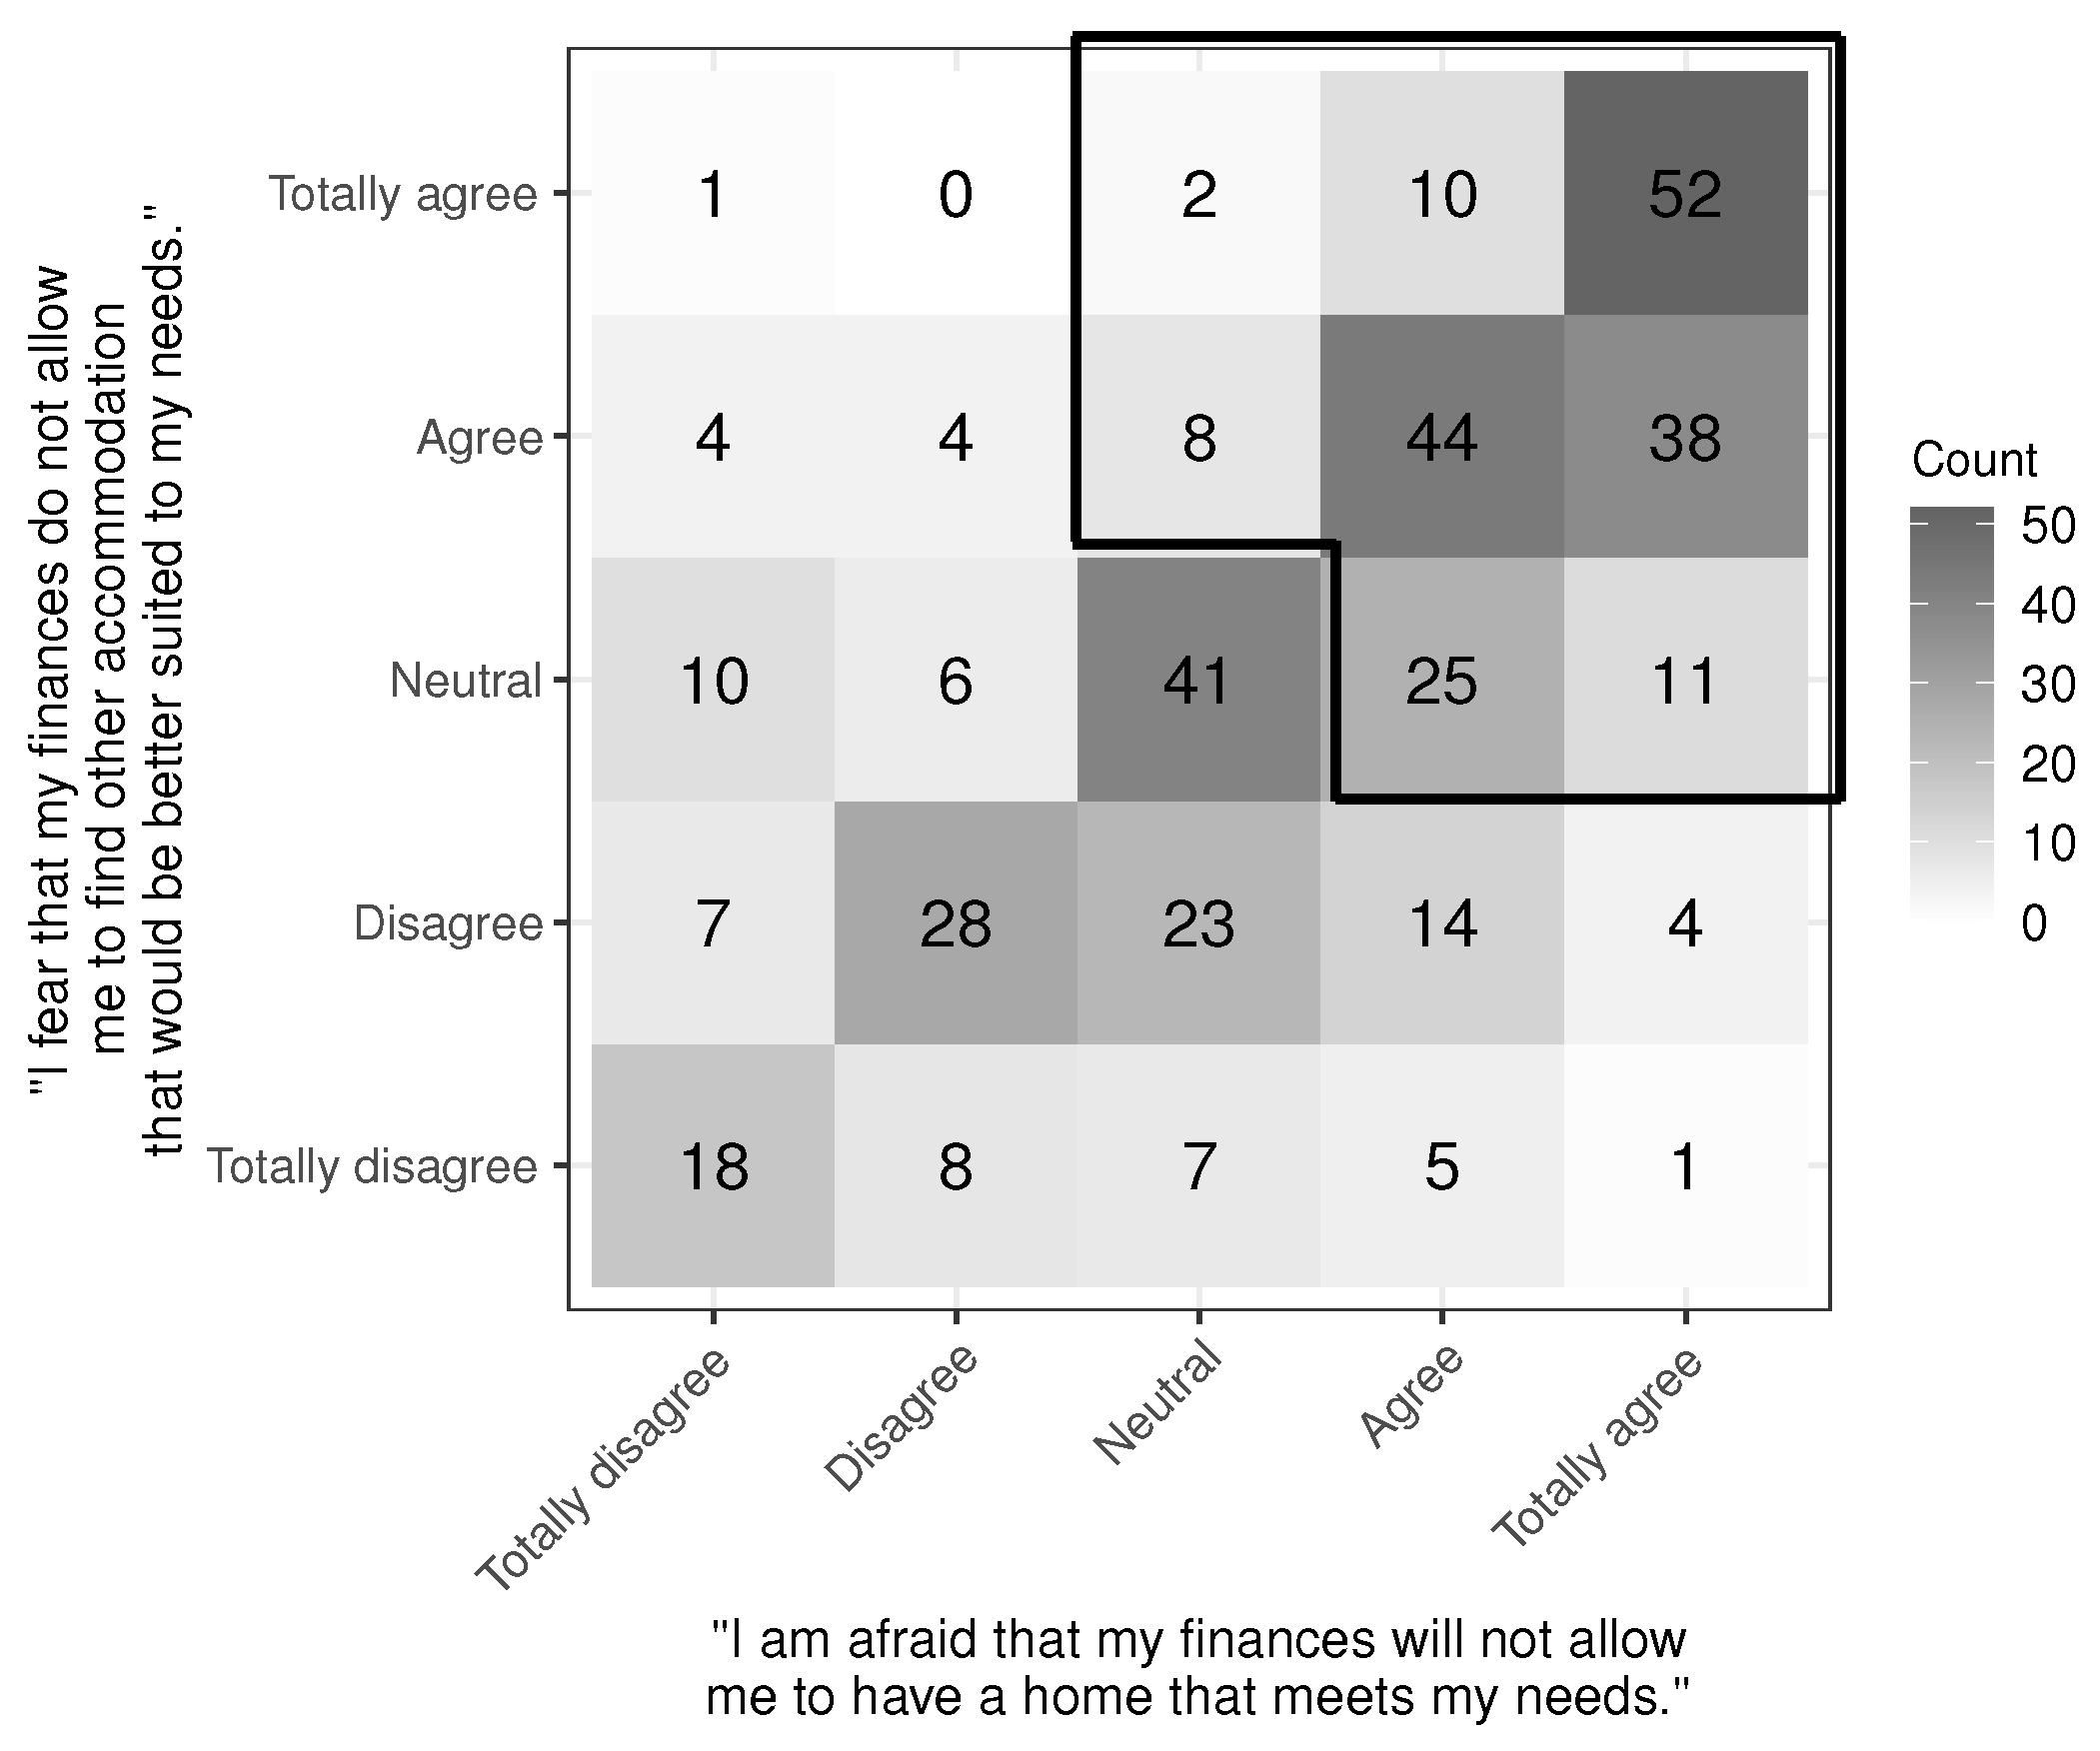
- “I am afraid that my finances will not allow me to have a home that meets my needs.”
- “I fear that my finances do not allow me to find other accommodation that would be better suited to my needs.”
- For homeowners: “I am afraid I will not be able to keep my property.”
- For tenants: “I am afraid that the rent will increase.”
3.3. Descriptive Statistics
4. Model Framework
5. Results, Robustness, and Discussion
5.1. Regression Results
5.2. Robustness of the Results
5.3. Discussion
6. Conclusions
Author Contributions
Funding
Institutional Review Board Statement
Informed Consent Statement
Data Availability Statement
Acknowledgments
Conflicts of Interest
Appendix A. Survey Questions
Appendix A.1. Introduction
| Welcome to the investigation into the housing dilemmas of senior women living alone. |
| If you are a woman aged between 55 and 75 and live alone, we would like to hear from you! |
- A1: Year of birth.
- A2: Gender.
- A3: Household size.
- A4: Zip code.
Appendix A.2. Social Life
- B1: Retirement.
Appendix A.3. Housing
- C1: Type of dwelling.
- ○
- Single-family home.
- ○
- Semi-detached house.
- ○
- Flat.
- ○
- Sheltered housing (housing architecturally appropriate or adaptable to ageing).
- ○
- Nursing home.
- ○
- Other.
- C2: Ownership.
- ○
- …tenant (you pay rent)?
- ○
- …owner/co-owner?
- ○
- A cooperative or non-profit organization.
- ○
- An institutional investor (e.g., pension fund).
- ○
- A municipality.
- ○
- A private owner.
- ○
- Other.
- ○
- I do not know.
- C3: Retirement accommodation.
- □
- Your current dwelling.
- □
- Sheltered housing.
- □
- Housing with a social concierge service.
- □
- Self-contained accommodation linked to a family member’s home.
- □
- Smaller dwelling.
- □
- Self-contained accommodation with communal areas (e.g., shared lounge or kitchen).
- □
- Shared flat with:…
- (1)
- …seniors.
- (2)
- …younger/active people.
- (3)
- …woman.
- □
- None of these types of accommodation would appeal to me.
- C4: Dwelling size.
- ○
- 1 to 1.5 rooms
- ○
- 2 to 2.5 rooms
- ○
- 3 to 3.5 rooms
- ○
- 4 to 4.5 rooms
- ○
- 5 to 5.5 rooms
- ○
- 6 or more
- C5: Attachment.
- (1)
- …canton in which you live?
- (2)
- …municipality in which you live?
- (3)
- …neighbourhood in which you live?
- (4)
- …dwelling in which you live?
- C6: Satisfaction with dwelling characteristics.
- (1)
- Its size (living area in m2.).
- (2)
- Its insulation with respect to:…
- (2.1)
- …noise.
- (2.2)
- …temperatures.
- (3)
- Its interior fittings (no door sills, etc.).
- (4)
- The rent (charges included).
- (5)
- Charges and interest.
- (6)
- The (rental) property management.
- (7)
- The immediate environment (greenery, cleanliness, etc.).
- (8)
- Neighbourhood safety.
- (9)
- Noise pollution.
- (10)
- Its accessibility to shops (e.g., grocery stores).
- (11)
- Its accessibility to public transport.
- (12)
- Its accessibility to healthcare facilities (e.g., doctors’ surgeries, hospitals).
- (13)
- Its accessibility to the cultural, sporting, leisure or religious activities you enjoy.
- (14)
- Its proximity to your family and friends.
- C7: Housing fears.
- (1)
- …of being kicked out of my flat (end of lease, etc.).
- (2)
- …I will not be able to keep my property (problem with the mortgage, …).
- (3)
- …that the rent will increase.
- (4)
- …of being disturbed by my neighbours.
- (5)
- …that the current layout of my home won’t be suitable for my old age.
- (6)
- …that I won’t find accommodation that suits my needs/wishes.
- (7)
- …that my finances will not allow me to have a home that meets my needs.
Appendix A.4. Health
- D1: Perceived health.
- (1)
- …physical health (e.g., functional capabilities.).
- (2)
- …mental health (e.g., morale.).
- D2: Diagnosed illnesses.
- □
- Physical.
- □
- Mental.
- □
- None.
Appendix A.5. Finance
- E1: Financial situation.
- ○
- Modest
- ○
- Below average
- ○
- Above average
- ○
- Comfortable
- E2: Retirement funding.
- (1)
- Have you interrupted your professional career for more than a year in total?
- (2)
- Do your retirement pensions (AVS, 2nd pillar) correspond to at least 60% of your last salary?
- (3)
- Do you think you will need additional benefits?
- (4.1)
- Have you contributed to a 2nd pillar?
- (4.2)
- Do you think your 2nd pillar is complete?
- (4.3)
- Have you bought back years of 2nd pillar contributions?
- (4.4)
- Do you plan to (re)purchase any in the future?
- (5.1)
- Have you contributed to a 3rd pillar?
- (5.2)
- Do you intend to (continue to) contribute to a 3rd pillar?
- (6)
- Do you have savings life insurance?
- E3: Financial worries.
- (1)
- …do not allow me to stay in my environment (neighbourhood, town/village).
- (2)
- …are not sufficient to cover the standard of living I envision.
- (3)
- …do not allow me to find other accommodation that would be better suited to my needs (e.g., better lighting, non-slip floor).
- (4)
- …will not allow me to repay my debts in the coming years.
- (5)
- …don’t allow me to support my family financially.
- E4: Fears summary.
- (1)
- …feel alone (feelings of loneliness)?
- (2)
- …not be able to finance your day-to-day living?
- (3)
- …live in an accommodation that is not suitable for you?
- (4)
- …lose your independence (because of illness/accident/…)?
Appendix A.6. Demographics
- F1: Marital status.
- ○
- Single
- ○
- Married
- ○
- In a registered partnership
- ○
- Separated/divorced
- ○
- Widowed
- F2: Children.
- ○
- None
- ○
- 1
- ○
- 2
- ○
- 3
- ○
- 4 or more
| 1 | See https://www.rdocumentation.org/packages/MASS/versions/7.3-58.3/topics/stepAIC (accessed on 10 October 2024). |
| 2 | See https://www.rdocumentation.org/packages/randomForest/versions/4.7-1.1/topics/varImpPlot (accessed on 10 October 2024) and https://www.rdocumentation.org/packages/randomForest/versions/4.7-1.1/topics/randomForest (accessed on 10 October 2024). |
References
- Althaus, Eveline, and Angela Birrer. 2021. Aging in Place Opportunities, Challenges, and Options for Housing Providers. Technical Report. Zürich: ETH Zürich. [Google Scholar]
- Angelini, Viola, and Anne Laferrere. 2012. Residential Mobility of the European Elderly. CESifo Economic Studies 28: 544–69. [Google Scholar] [CrossRef]
- Aplin, Tammy, and Maree Petersen. 2023. Relationships between housing and health for older private renters: Evidence from a pilot study in Australia. Journal of Housing and the Built Environment 38: 1869–88. [Google Scholar] [CrossRef]
- Beer, Jenay M., Cory Ann Smarr, Tiffany L. Chen, Akanksha Prakash, Tracy L. Mitzner, Charles C. Kemp, and Wendy A. Rogers. 2012. The domesticated robot: Design guidelines for assisting older adults to age in place. Paper presented at the HRI’12—Proceedings of the 7th Annual ACM/IEEE International Conference on Human-Robot Interaction, Boston, MA, USA, March 5–8; pp. 335–42. [Google Scholar] [CrossRef]
- Beringhs, Antonin, Yashka Huggenberger, Joël Wagner, and Gabrielle Wanzenried. 2024. The Perceived Life Situation of Baby Boomers Living Alone in Switzerland. Ageing International, submitted. [Google Scholar]
- Caradec, Vincent. 2010. Les comportements résidentiels des retraités. Quelques enseignements du programme de recherche “Vieillissement de la population et habitat”. Espace Populations Societes 1: 1–14. [Google Scholar] [CrossRef]
- Comolli, Chiara L., Laura Bernardi, and Marieke Voorpostel. 2022. Trajectoires Famille-Travail et Bien-être Subjectif des Femmes et Hommes en SUISSE. Technical Report. Lausanne: Université de Bologne, Universtité de Lausanne, FORS. [Google Scholar] [CrossRef]
- Darab, Sandy, Yvonne Hartman, and Louise Holdsworth. 2018. What women want: Single older women and their housing preferences. Housing Studies 33: 525–43. [Google Scholar] [CrossRef]
- Ehrler, Franziska, Felix Bühlmann, Peter Farago, François Höpflinger, Dominique Joye, Pasqualina Perrig-Chiello, and Christian Suter. 2016. Swiss Social Report 2016: Wellbeing. Technical Report. Zürich: FORS. [Google Scholar]
- Eurostat. 2024a. European Union—Demography of Europe—2024 Edition. Luxembourg: Eurostat. [Google Scholar] [CrossRef]
- Eurostat. 2024b. European Union—Housing in Europe—2023 Edition. Luxembourg: Eurostat. [Google Scholar] [CrossRef]
- Federal Office for Housing. 2020. Recherche sur le sur le Logement 2020–2023—Programme de Recherche De l’Office fédéral du Logement. Bern: Federal Office for Housing. [Google Scholar]
- Federal Office for Housing. 2024. Aides Fédérales Selon la LOG (Depuis 2003). Bern: Federal Office for Housing. [Google Scholar]
- Federal Social Insurance Office. 2024a. Les Prestations Complémentaires. Bern: Federal Social Insurance Office. [Google Scholar]
- Federal Social Insurance Office. 2024b. Statistique des Assurances Sociales Suisses 2012. Technical Report. Bern: Federal Social Insurance Office. [Google Scholar]
- Federal Social Insurance Office. 2024c. Switzerland’s Old-Age Insurance System. Bern: Federal Social Insurance Office. [Google Scholar]
- Garten, Claudius, Michał Myck, and Monika Oczkowska. 2024. Homeownership and the perception of material security in old age. Applied Economics 57: 1–13. [Google Scholar] [CrossRef]
- Giesecke, Matthias, and Guanzhong Yang. 2018. Are financial retirement incentives more effective if pension knowledge is high? Proceedings of the International Astronomical Union 17: 278–315. [Google Scholar] [CrossRef]
- Gobillon, Laurent, and François Charles Wolff. 2011. Housing and Location Choices of Retiring Households: Evidence from France. Urban Studies 48: 331–47. [Google Scholar] [CrossRef]
- Hasu, Eija. 2018. Housing decision-making process explained by third agers, Finland: “We didn’t want this, but we chose it”. Housing Studies 33: 837–54. [Google Scholar] [CrossRef]
- Höpflinger, François, Valérie Hugentobler, and Dario Spini. 2019. Habitat et Vieillissement—Réalités et Enjeux de la Diversité. Technical Report. Zürich: Age-Stiftung. [Google Scholar]
- Huggenberger, Yashka, Joël Wagner, and Gabrielle Wanzenried. 2023. The determinants of the mobility patterns of the elderly in Switzerland. Journal of Housing and the Built Environment 38: 2151–84. [Google Scholar] [CrossRef]
- Huggenberger, Yashka, Maria Grazia Bedin, Marion Droz Mendelzweig, Joël Wagner, and Gabrielle Wanzenried. 2024. On the vulnerabilities of baby boomer women living alone: Evidence from Switzerland, [Manuscript submitted for publication].
- Karlen, Claudine, Anna Pagani, and Claudia R. Binder. 2021. Obstacles and opportunities for reducing dwelling size to shrink the environmental footprint of housing: Tenants’ residential preferences and housing choice. Journal of Housing and the Built Environment 37: 1367–408. [Google Scholar] [CrossRef]
- Kopanidis, Foula Z., Linda J. Robinson, and Mike Reid. 2017. To stay or to go? Postretirement housing choices of single Baby Boomer women. Journal of Women and Aging 29: 417–27. [Google Scholar] [CrossRef] [PubMed]
- Kuhn, Ursina. 2020. Augmented wealth in Switzerland: The influence of pension wealth on wealth inequality. Swiss Journal of Economics and Statistics 156: 19. [Google Scholar] [CrossRef]
- Lee, William Keng Mun. 2003. Women and Retirement Planning: Towards the “Feminization of Poverty” in an Aging Hong Kong. Journal of Women and Aging 15: 31–53. [Google Scholar] [CrossRef] [PubMed]
- Lewis, Christine, and Patrice Ollivaud. 2020. Policies for Switzerland’s Ageing Society Economics Department. OECD Economics Department Working Papers, 1600. [Google Scholar] [CrossRef]
- Lusardi, Annamaria, and Olivia S. Mitchell. 2006. Baby Boomer Retirement Security: The Roles of Planning, Financial Literacy, and Housing Wealth. SSRN Electronic Journal 54: 205–24. [Google Scholar] [CrossRef]
- Morris, Alan. 2009. Living on the margins: Comparing older private renters and older public housing tenants in Sydney, Australia. Housing Studies 24: 693–707. [Google Scholar] [CrossRef]
- Nakajima, Makoto, and Irina A. Telyukova. 2017. Reverse Mortgage Loans: A Quantitative Analysis. Journal of Finance 72: 911–50. [Google Scholar] [CrossRef]
- PwC Switzerland. 2021. Golden Silver Years—Trust in Transformation. Zurich: PwC Switzerland. [Google Scholar]
- Ravazzini, Laura, and Jenny Chesters. 2018. Inequality and Wealth: Comparing the Gender Wealth Gap in Switzerland and Australia. Feminist Economics 24: 83–107. [Google Scholar] [CrossRef]
- Reher, David, and Miguel Requena. 2017. Elderly women living alone in Spain: The importance of having children. European Journal of Ageing 14: 311–22. [Google Scholar] [CrossRef]
- Roy, Noémie, Roxanne Dubé, Carole Després, Adriana Freitas, and France Légaré. 2018. Choosing between staying at home or moving: A systematic review of factors influencing housing decisions among frail older adults. PLoS ONE 13: e0189266. [Google Scholar] [CrossRef]
- Ruíz, Josafhat Salinas, Osval Antonio Montesinos López, Gabriela Hernández Ramírez, and Jose Crossa Hiriart. 2023. Generalized Linear Mixed Models with Applications in Agriculture and Biology. Berlin/Heidelberg: Springer. [Google Scholar] [CrossRef]
- Speelman, Craig P., Marilyn Clark-Murphy, and Paul Gerrans. 2013. Decision Making Clusters in Retirement Savings: Gender Differences Dominate. Journal of Family and Economic Issues 34: 329–39. [Google Scholar] [CrossRef]
- Statistique Vaud. 2018. Logement des Séniors à l’horizon 2040. Technical Report. Lausanne: Canton of Vaud. [Google Scholar]
- Swiss Federal Statistical Office. 2018. Les Conditions D’habitation des Seniors en Suisse en 2016. Technical Report. Neuchâtel: Federal Statistical Office. [Google Scholar]
- Swiss Federal Statistical Office. 2020. Poverty in Old Age. Technical Report. Neuchatel: Swiss Federal Statistical Office. [Google Scholar]
- Swiss Federal Statistical Office. 2023a. Housing Conditions—Tenants/Owners. Bern: Swiss Federal Statistical Office. [Google Scholar]
- Swiss Federal Statistical Office. 2023b. Population and Households Statistics. Bern: Swiss Federal Statistical Office. [Google Scholar]
- Swiss Federal Statistical Office. 2025. Construction and Housing—Rented Dwellings. Bern: Swiss Federal Statistical Office. [Google Scholar]
- UBS. 2024. Retirement Planning—Real Estate Financing in Old Age: Challenges and Tips. Zurich: UBS. [Google Scholar]
- World Health Organization. 2023. Promoting Physical Activity and Healthy Diets for Healthy Ageing. Technical Report. Copenhagen: World Health Organization. [Google Scholar]
- Zimmerli, Joelle. 2016. Residential Mobility of the Elderly—A Sustainable Approach to Higher Residential Density? DISP 52: 61–72. [Google Scholar] [CrossRef]
- Zimmerli, Joëlle, and Markus Schmidiger. 2016. Demografie und Wohnungswirtschaft. Pensionierte auf dem Wohnungsmarkt. Technical Report. Lucerne: Lucerne University of Applied Sciences and Arts. [Google Scholar]
- Zimmerli, Joëlle, and Petra Vogel. 2012. Wohnbedürfnisse und Wohnmobilität im Alter—Heute und in Zukunft. Technical Report. Zürich: Zimraum Raum + Gesellschaft. [Google Scholar]

| Variable | Description | Categories | Question |
|---|---|---|---|
| Key variables | |||
| Financial housing fears | Yes, no | C7.7, E3.3 | |
| Price increase fears | Yes, no | C7.2, C7.3 | |
| Lack of housing offer fears | Yes, no | C7.6 | |
| Socio-demographic factors | |||
| Language region | French, German | A4 | |
| Age | 55–60, 61–65, 66–70, 71–75 | A1 | |
| Retired | Yes, no | B1 | |
| Marital status | Sep./Div., single, widowed | F1 | |
| Children | Yes, no | F2 | |
| Financial aspects | |||
| Perceived financial situation | Modest, below avg., above avg., comfortable | E1 | |
| Buyback years of pension savings | Yes, no | E2.4.3 | |
| Private pension savings | Yes, no | E2.5.1, E2.6 | |
| Ownership status | Oneself, private, institution, other | C2.1, C2.2 | |
| Declared career break | Yes, no | E2.1 | |
| Well-being aspects | |||
| Diagnosed illnesses | Yes, no | D2 | |
| Perceived health status | Good, bad | D1 | |
| Fear of losing independence | Yes, no | E4.4 | |
| Fear of feeling alone | Yes, no | E4.1 | |
| Housing characteristics | |||
| Housing type | Flat, house, other | C1 | |
| Number of rooms | 1–2.5, 3–3.5, 4+ rooms | C4 | |
| Attributes satisfaction | Yes, no | C6.1–5 | |
| Accessibility satisfaction | Yes, no | C6.10–14 | |
| Environment satisfaction | Yes, no | C6.6–9 | |
| Housing expectations | |||
| Wish to stay home | Yes, no | C3.1 | |
| Housing attachment | Yes, no | C5.4 | |
| Current housing unsuitable fears | Yes, no | C7.5 | |
| Lifestyle change fear | Yes, no | E3.2 | |
| Variable | Category | N | (%) | |||
|---|---|---|---|---|---|---|
| All records | 371 | 100.0 | 51.2 | 47.7 | 54.7 | |
| Socio-demographic factors | ||||||
| French | 260 | 70.1 | 55.8 | 51.1 | 60.8 | |
| German | 111 | 29.9 | 40.5 | 39.6 | 40.5 | |
| 55–60 | 70 | 18.9 | 52.9 | 54.3 | 57.1 | |
| 61–65 | 108 | 29.1 | 59.3 | 50.9 | 62.0 | |
| 66–70 | 107 | 28.8 | 42.1 | 39.2 | 47.7 | |
| 71–75 | 86 | 23.2 | 51.2 | 48.8 | 52.3 | |
| Yes | 243 | 65.5 | 47.3 | 44.0 | 54.7 | |
| No | 128 | 34.5 | 58.6 | 54.7 | 54.7 | |
| Sep./Div. | 203 | 54.7 | 52.7 | 48.8 | 58.1 | |
| Single | 118 | 31.8 | 51.7 | 50.9 | 53.4 | |
| Widowed | 50 | 13.5 | 44.0 | 36.0 | 44.0 | |
| Yes | 231 | 62.3 | 54.1 | 47.2 | 57.6 | |
| No | 140 | 37.7 | 46.4 | 48.6 | 50.0 | |
| Financial aspects | ||||||
| Modest | 93 | 25.1 | 76.3 | 60.2 | 60.2 | |
| Below avg. | 89 | 24.0 | 78.7 | 67.4 | 71.9 | |
| Above avg. | 142 | 38.2 | 28.9 | 37.3 | 47.9 | |
| Comfortable | 47 | 12.7 | 17.0 | 17.0 | 31.9 | |
| Yes | 99 | 26.7 | 42.4 | 45.5 | 53.5 | |
| No | 272 | 73.3 | 54.4 | 48.5 | 55.1 | |
| Yes | 254 | 68.5 | 42.9 | 46.1 | 50.4 | |
| No | 117 | 31.5 | 69.2 | 51.3 | 64.1 | |
| Oneself | 111 | 29.9 | 22.5 | 18.9 | 36.0 | |
| Private | 125 | 33.7 | 67.2 | 60.8 | 67.2 | |
| Institution | 60 | 16.2 | 65.0 | 61.7 | 66.7 | |
| Other | 75 | 20.2 | 56.0 | 57.3 | 52.0 | |
| Yes | 208 | 56.1 | 57.2 | 49.5 | 55.3 | |
| No | 163 | 43.9 | 43.6 | 45.4 | 54.0 | |
| Well-being aspects | ||||||
| Yes | 206 | 55.5 | 56.3 | 51.9 | 58.2 | |
| No | 165 | 44.5 | 44.9 | 42.4 | 50.3 | |
| Good | 274 | 73.9 | 47.5 | 45.3 | 53.6 | |
| Bad | 97 | 26.1 | 61.9 | 54.6 | 57.7 | |
| Yes | 235 | 63.3 | 56.6 | 51.9 | 62.1 | |
| No | 136 | 36.7 | 41.9 | 40.4 | 41.9 | |
| Yes | 144 | 38.8 | 63.9 | 52.1 | 65.3 | |
| No | 227 | 61.2 | 43.2 | 44.9 | 48.0 | |
| Housing characteristics | ||||||
| Flat | 317 | 85.4 | 53.9 | 52.4 | 56.5 | |
| House | 46 | 12.4 | 28.3 | 21.7 | 43.5 | |
| Other | 8 | 2.2 | 75.0 | 12.5 | 50.0 | |
| 1–2.5 | 122 | 32.9 | 64.8 | 49.2 | 56.6 | |
| 3–3.5 | 147 | 39.6 | 49.0 | 54.4 | 57.1 | |
| 4+ | 102 | 27.5 | 38.2 | 36.3 | 49.0 | |
| Yes | 288 | 77.6 | 45.5 | 43.8 | 48.6 | |
| No | 83 | 22.4 | 71.1 | 61.5 | 75.9 | |
| Yes | 311 | 83.8 | 48.5 | 48.5 | 53.0 | |
| No | 60 | 16.2 | 65.0 | 43.3 | 63.3 | |
| Yes | 178 | 48.0 | 37.6 | 38.2 | 45.5 | |
| No | 193 | 52.0 | 63.7 | 56.5 | 63.2 | |
| Housing expectations | ||||||
| Yes | 187 | 50.4 | 43.3 | 49.7 | 44.9 | |
| No | 184 | 49.6 | 59.2 | 45.6 | 64.7 | |
| Yes | 230 | 62.0 | 43.9 | 47.4 | 48.3 | |
| No | 141 | 38.0 | 63.1 | 48.2 | 65.2 | |
| Yes | 146 | 39.4 | 63.7 | 51.4 | 75.3 | |
| No | 225 | 60.6 | 43.1 | 45.3 | 41.3 | |
| Yes | 147 | 39.6 | 81.6 | 70.1 | 68.0 | |
| No | 224 | 60.4 | 31.2 | 33.0 | 46.0 | |
| Full Model | Reduced Model | |||||||
|---|---|---|---|---|---|---|---|---|
| Variable | Category | Coef. | Std. Err. | Sig. | Coef. | Std. Err. | Sig. | λ |
| Intercept | –3.459 | 1.098 | ** | –3.661 | 0.557 | *** | ||
| Yes | 2.437 | 0.383 | *** | 2.203 | 0.339 | *** | 1 | |
| (Above avg.) | Modest | 2.193 | 0.461 | *** | 1.996 | 0.395 | *** | 2 |
| Below avg. | 2.394 | 0.454 | *** | 2.168 | 0.403 | *** | ||
| Comfortable | –0.467 | 0.596 | –0.342 | 0.524 | ||||
| (Oneself) | Private | 1.685 | 0.503 | *** | 1.702 | 0.400 | *** | 3 |
| Institution | 1.604 | 0.580 | ** | 1.509 | 0.483 | ** | ||
| Other | 0.350 | 0.552 | 0.516 | 0.434 | ||||
| (Sep./Div.) | Single | 0.776 | 0.443 | . | 0.566 | 0.337 | . | 4 |
| Widowed | 0.956 | 0.523 | . | 0.920 | 0.488 | . | ||
| Yes | –0.601 | 0.348 | . | –0.509 | 0.307 | . | 5 | |
| Yes | 0.803 | 0.346 | * | 0.608 | 0.302 | * | 6 | |
| Yes | 0.850 | 0.358 | * | 0.939 | 0.318 | ** | 7 | |
| Yes | 0.636 | 0.349 | . | 0.645 | 0.309 | * | 8 | |
| Yes | –0.609 | 0.491 | ||||||
| (55–60) | 61–65 | 0.203 | 0.474 | |||||
| 66–70 | –0.250 | 0.517 | ||||||
| 71–75 | –0.593 | 0.503 | ||||||
| Yes | 0.843 | 0.460 | . | |||||
| Yes | –0.606 | 0.358 | . | |||||
| Yes | 0.238 | 0.412 | ||||||
| Good | 0.594 | 0.408 | ||||||
| Yes | 0.097 | 0.348 | ||||||
| (Flat) | House | 0.250 | 0.670 | |||||
| Other | 1.042 | 1.233 | ||||||
| (French) | German | 0.147 | 0.443 | |||||
| Yes | –0.369 | 0.367 | ||||||
| (1–2.5) | 3–3.5 | –0.222 | 0.378 | |||||
| 4+ | 0.008 | 0.526 | ||||||
| Yes | 0.395 | 0.373 | ||||||
| Yes | –0.404 | 0.351 | ||||||
| Yes | –0.108 | 0.339 | ||||||
| Yes | –0.465 | 0.369 | ||||||
| Full Model | Reduced Model | |||||||
|---|---|---|---|---|---|---|---|---|
| Variable | Category | Coef. | Std. Err. | Sig. | Coef. | Std. Err. | Sig. | λ |
| Intercept | –2.758 | 0.556 | *** | –2.219 | 0.347 | *** | ||
| (Oneself) | Private | 1.556 | 0.266 | *** | 1.320 | 0.218 | *** | 1 |
| Institution | 1.476 | 0.299 | *** | 1.322 | 0.255 | *** | ||
| Other | 1.280 | 0.290 | *** | 1.063 | 0.242 | *** | ||
| Yes | 0.811 | 0.182 | *** | 0.798 | 0.162 | *** | 2 | |
| (1–2.5) | 3–3.5 | 0.523 | 0.188 | ** | 0.473 | 0.178 | ** | 3 |
| 4+ | 0.433 | 0.249 | . | 0.488 | 0.220 | * | ||
| (Above avg.) | Modest | 0.601 | 0.229 | ** | 0.435 | 0.206 | * | 4 |
| Below avg. | 0.703 | 0.221 | ** | 0.638 | 0.205 | ** | ||
| Comfortable | –0.457 | 0.308 | –0.524 | 0.275 | . | |||
| Yes | 0.423 | 0.191 | * | 0.347 | 0.170 | * | 5 | |
| Yes | 0.327 | 0.182 | . | 0.368 | 0.155 | * | 6 | |
| Yes | 0.397 | 0.172 | * | 0.266 | 0.150 | . | 7 | |
| Yes | –0.052 | 0.212 | –0.250 | 0.159 | 8 | |||
| Yes | 0.397 | 0.238 | . | |||||
| (55–60) | 61–65 | –0.561 | 0.239 | * | ||||
| 66–70 | –0.319 | 0.260 | ||||||
| 71–75 | –0.340 | 0.245 | ||||||
| Yes | –0.325 | 0.235 | ||||||
| Yes | 0.335 | 0.185 | . | |||||
| Yes | –0.144 | 0.181 | ||||||
| Yes | 0.253 | 0.174 | ||||||
| Good | 0.229 | 0.199 | ||||||
| Yes | 0.107 | 0.176 | ||||||
| (Flat) | House | 0.269 | 0.344 | |||||
| Other | –1.031 | 0.604 | . | |||||
| (French) | German | –0.045 | 0.226 | |||||
| (Sep./Div.) | Single | 0.264 | 0.220 | |||||
| Widowed | 0.049 | 0.258 | ||||||
| Yes | –0.066 | 0.182 | ||||||
| Yes | 0.029 | 0.193 | ||||||
| Yes | –0.203 | 0.176 | ||||||
| Yes | –0.205 | 0.178 | ||||||
| Full Model | Reduced Model | |||||||
|---|---|---|---|---|---|---|---|---|
| Variable | Category | Coef. | Std. Err. | Sig. | Coef. | Std. Err. | Sig. | λ |
| Intercept | –1.687 | 0.857 | * | –1.018 | 0.344 | ** | ||
| Yes | 1.051 | 0.278 | *** | 1.228 | 0.258 | *** | 1 | |
| Yes | 0.548 | 0.277 | * | 0.471 | 0.249 | . | 2 | |
| (Above avg.) | Modest | 0.252 | 0.369 | 0.181 | 0.318 | 3 | ||
| Below avg. | 0.941 | 0.365 | ** | 0.921 | 0.334 | ** | ||
| Comfortable | –0.301 | 0.446 | –0.525 | 0.396 | ||||
| (Oneself) | Private | 0.838 | 0.380 | * | 0.691 | 0.309 | * | 4 |
| Institution | 0.931 | 0.452 | * | 0.849 | 0.375 | * | ||
| Other | –0.014 | 0.444 | –0.036 | 0.353 | ||||
| Yes | –0.470 | 0.280 | . | –0.595 | 0.246 | * | 5 | |
| Yes | 0.682 | 0.296 | * | 0.592 | 0.266 | * | 6 | |
| Yes | 0.209 | 0.391 | ||||||
| (55–60) | 61–65 | 0.008 | 0.385 | |||||
| 66–70 | 0.009 | 0.412 | ||||||
| 71–75 | –0.217 | 0.398 | ||||||
| Yes | –0.212 | 0.390 | ||||||
| Yes | –0.358 | 0.293 | ||||||
| Yes | 0.282 | 0.338 | ||||||
| Yes | –0.278 | 0.284 | ||||||
| Yes | 0.327 | 0.278 | ||||||
| Good | 0.405 | 0.321 | ||||||
| (Flat) | House | 0.185 | 0.509 | |||||
| Other | –0.569 | 0.831 | ||||||
| Yes | 0.371 | 0.276 | ||||||
| (French) | German | –0.142 | 0.341 | |||||
| (Sep./Div.) | Single | –0.019 | 0.352 | |||||
| Widowed | –0.262 | 0.399 | ||||||
| Yes | 0.206 | 0.289 | ||||||
| (1–2.5) | 3–3.5 | 0.421 | 0.307 | |||||
| 4+ | 0.471 | 0.409 | ||||||
| Yes | 0.240 | 0.300 | ||||||
| Yes | –0.311 | 0.279 | ||||||
| Yes | –0.269 | 0.301 | ||||||
| Variable | Description | λ | RF | λ | RF | λ | RF |
|---|---|---|---|---|---|---|---|
| Socio-demographic factors | |||||||
| Language region | 10 | 13 | 12 | ||||
| Age | 22 | 15 | 17 | ||||
| Retired | 5 | 22 | 20 | ||||
| Marital status | 4 | 23 | 7 | 9 | |||
| Children | 19 | 8 | 6 | 6 | |||
| Financial aspects | |||||||
| Perceived financial situation | 2 | 1 | 4 | 3 | 3 | 10 | |
| Buyback years of pension savings | 14 | 23 | 15 | ||||
| Private pension savings | 8 | 5 | 18 | 18 | |||
| Ownership | 3 | 3 | 1 | 1 | 4 | 2 | |
| Declared career break | 13 | 17 | 16 | ||||
| Well-being aspects | |||||||
| Diagnosed illnesses | 6 | 20 | 7 | 8 | 19 | ||
| Perceived health status | 18 | 21 | 23 | ||||
| Fear of losing independence | 15 | 19 | 2 | 5 | |||
| Fear of feeling alone | 7 | 9 | 14 | 11 | |||
| Housing characteristics | |||||||
| Housing type | 16 | 4 | 14 | ||||
| Number of rooms | 12 | 3 | 11 | 22 | |||
| Attributes satisfaction | 11 | 5 | 4 | ||||
| Accessibility satisfaction | 17 | 20 | 21 | ||||
| Environment satisfaction | 5 | 7 | 10 | 13 | |||
| Housing expectations | |||||||
| Wish to stay home | 6 | 6 | 16 | 5 | 7 | ||
| Housing attachment | 21 | 12 | 8 | ||||
| Current housing unsuitable fears | 8 | 4 | 9 | 1 | 1 | ||
| Lifestyle change fear | 1 | 2 | 2 | 2 | 6 | 3 | |
Disclaimer/Publisher’s Note: The statements, opinions and data contained in all publications are solely those of the individual author(s) and contributor(s) and not of MDPI and/or the editor(s). MDPI and/or the editor(s) disclaim responsibility for any injury to people or property resulting from any ideas, methods, instructions or products referred to in the content. |
© 2025 by the authors. Licensee MDPI, Basel, Switzerland. This article is an open access article distributed under the terms and conditions of the Creative Commons Attribution (CC BY) license (https://creativecommons.org/licenses/by/4.0/).
Share and Cite
Huggenberger, Y.; Beringhs, A.; Wagner, J.; Wanzenried, G. On Housing-Related Financial Fears of Baby Boomer Women Living Alone in Switzerland. Soc. Sci. 2025, 14, 427. https://doi.org/10.3390/socsci14070427
Huggenberger Y, Beringhs A, Wagner J, Wanzenried G. On Housing-Related Financial Fears of Baby Boomer Women Living Alone in Switzerland. Social Sciences. 2025; 14(7):427. https://doi.org/10.3390/socsci14070427
Chicago/Turabian StyleHuggenberger, Yashka, Antonin Beringhs, Joël Wagner, and Gabrielle Wanzenried. 2025. "On Housing-Related Financial Fears of Baby Boomer Women Living Alone in Switzerland" Social Sciences 14, no. 7: 427. https://doi.org/10.3390/socsci14070427
APA StyleHuggenberger, Y., Beringhs, A., Wagner, J., & Wanzenried, G. (2025). On Housing-Related Financial Fears of Baby Boomer Women Living Alone in Switzerland. Social Sciences, 14(7), 427. https://doi.org/10.3390/socsci14070427