Abstract
Ethnic segregation, a global phenomenon shaping social dynamics, urban development, and political behavior, is typically studied between distinct racial or national groups. This study provides insights into internal divisions within seemingly unified populations by investigating intra-group segregation within Israel’s ultra-Orthodox (Haredi) Jewish communities. By analyzing Knesset voting patterns as a proxy for residential distribution, I quantify segregation between two major ethnic groups within the Haredi community and identify significant segregation across Haredi-majority cities and clusters. Dissimilarity indices reveal distinct voluntary segregation patterns, with the city of Ashdod emerging as a unique case study due to its dynamic segregation trends and an unexplained sharp decline in dissimilarity in 2021. A comparison with Black–White segregation in U.S. metro areas highlights differing drivers of segregation: cultural and religious dynamics in Haredi communities versus structural inequalities in the U.S. Despite relatively lower dissimilarity scores, cultural and institutional factors reinforce residential separation. This research underscores the need for continued exploration of segregation’s underlying drivers and its implications for fostering more cohesive societies.
1. Introduction
Ethnic segregation is a global phenomenon shaping social dynamics, urban development, and political behavior (Bakens and Pryce 2019; Zuccotti et al. 2023). While much research focuses on segregation between distinct racial or national groups, intra-group ethnic segregation—divisions within broader cultural or religious communities—also significantly influences societal structures (Petrescu-Prahova 2009). Understanding these patterns is key to addressing inequality and fostering cohesion.
Israel presents a compelling case for studying ethnic segregation due to its diverse population and complex social fabric. Beyond the Jewish–Arab divide, there are ethnic distinctions within Israel’s Jewish population, particularly between Ashkenazi (European descent) and Sephardic (Middle Eastern and North African descent) Jews. These divisions are evident in Israel’s ultra-Orthodox (Haredi; plural: Haredim) Jewish communities, which, despite shared religious practices, often maintain separate institutions and social networks (Friedman 1991). This study examines ethnic segregation within this sector, which wields significant societal influence.
Haredi residential patterns reflect the interplay of identity and space. A 2012 study by Flint, Benenson, and Alfasi (Flint et al. 2012) documented “micro-segregation” within Jerusalem’s Sanhedria neighborhood, showing how sectarian distinctions shape localized residential patterns, even among economically similar groups. In a follow-up published by the same authors in 2013 (Alfasi et al. 2013), they compared Ramat Shlomo, a state-planned Haredi neighborhood from the 1990s, to Sanhedria, which has developed informally since the 1960s. This comparison illustrated how top-down versus bottom-up processes influence segregation. Both studies relied on labor-intensive surveys of sending surveyors to each and every household in the neighborhood. More recently, Keren-Kratz (2024) analyzed Knesset election data to provide broader, multi-year insights, documenting the Haredi community’s shift from integration to enclave formation since the 1970s, driven by socio-political changes like the rise of the “society of learners”.
Haredi society is highly mobilized, as evidenced by homophily in voting patterns, where individuals consistently vote for political parties aligned with their religious and ethnic affiliations (Koopmans and Statham 1999). Koopmans and Statham (1999) highlight the role of ethnic and religious identities in political mobilization, demonstrating how these factors shape group cohesion and policy engagement. This mobilization extends beyond elections and into broader social structures, reinforcing intra-group segregation patterns.
This study builds on such work by using large-scale voting data to quantify residential segregation among Haredi communities. Voting patterns for two Haredi political parties—Shas (predominantly Sephardic) and United Torah Judaism (UTJ, primarily Ashkenazi)—serve as proxies for geographic distribution. Shas and UTJ represent distinct Haredi sub-groups, with Shas appealing to Sephardic voters through an integrative ideology addressing socio-economic and cultural grievances (Peled 1998). This analysis not only measures voluntary segregation but also provides insights into the socio-political drivers of these patterns.
Findings reveal significant voluntary segregation within Haredi neighborhoods across Israel. This raises questions about the factors influencing such segregation, its implications for social cohesion, and its relevance to understanding ethnic dynamics in diverse societies. By leveraging political behavior as a demographic tool, this research offers a novel methodological framework that complements traditional Geographic Information System (GIS) approaches. While the shift from aspatial to spatially nuanced and individual-based metrics is well-recognized and often relies on GIS data (Wong 2016), the methodology employed in this study remains effective in providing local insights even without detailed GIS data, demonstrating its applicability in contexts where such information is unavailable.
Additionally, this study deepens our understanding of the intersection of ethnicity, religion, and political behavior in shaping community structures. Recent research has increasingly emphasized the interconnectedness of ethnicity, religion, and political behavior in shaping community structures (Koopmans and Statham 1999; McCauley 2014). Ethnicity serves as a marker of identity, often intersecting with religion to reinforce group boundaries and collective action (Fox 2004). Theories of homophily and xenophobia have been instrumental in explaining segregation patterns within communities, illustrating how shared religious and ethnic practices foster intra-group cohesion while also reinforcing physical and social segregation.
Recent empirical studies provide further validation of these dynamics. Curiel and Zeedan (2024) analyzes socio-political structures within Haredi enclaves, demonstrating the role of community-driven institutions in shaping segregation patterns.
Methodological advancements have played a crucial role in advancing the study of segregation, with Geographic Information Systems (GIS) and spatial analysis enabling researchers to map segregation patterns and their evolution over time. In contexts where GIS data are unavailable, alternative approaches, such as using voting patterns as proxies for residential segregation, provide valuable insights into the sociopolitical factors driving segregation (Wong 2016; Fossett 2017; Fraga 2016).
Building on the discussion of intra-group segregation within Haredi communities and its sociopolitical drivers, it is valuable to compare these patterns with broader cases of segregation to highlight both shared mechanisms and unique distinctions. A comparison with Black–White segregation in U.S. metro areas highlights differing drivers of segregation: cultural and religious dynamics in Haredi communities versus structural inequalities in the U.S. While Black–White segregation in the U.S. has historically been reinforced by systemic discrimination, redlining, and economic disparities (Massey and Denton 2007), segregation in Haredi communities stems from communal institutions, sectarian identity, and voluntary clustering (Alfasi et al. 2013).
Recent studies have emphasized that while Haredi segregation is largely voluntary, cultural homophily plays a critical role. Individuals gravitate toward communities that share their cultural and religious values, reinforcing ethnic and sectarian divisions (Melamed et al. 2020; Village 2021). These findings align with broader research on intra-group segregation in global contexts, including Southeast Asia and African religious communities, where distinct liturgical and cultural practices contribute to voluntary separation (Sri and Waluyajati 2022; Thomas et al. 2023).
Ultimately, this study uncovers findings that I could not fully explain, and I hope this publication will inspire further analysis and collaboration to address these open questions and expand our collective understanding.
2. Methods
I analyzed voting data from Israeli Knesset elections to quantify residential segregation between Ashkenazi and Sephardic Haredi communities. I obtained data for recent elections (2015–2024) from the official website of the Central Elections Committee (Israel’s Central Election Committee 2024). Dr. Keren-Kratz generously provided earlier election data, which were unavailable in an analyzable format, after extracting them for his study (Keren-Kartz 2024). Additional demographic information was sourced from Israel Democracy Institute (IDI) (Israel Democracy Institute 2023). This dataset includes voting patterns from cities and areas with a prominent Haredi presence, focusing on the two main Haredi political parties: Shas and United Torah Judaism (UTJ).
Each Israeli citizen is assigned to a specific polling station based on their registered residential address. Polling stations can contain one or more ballot boxes, with each ballot box typically representing between 536 and 650 registered voters (25th and 75th percentiles, based on data from the most recent elections). This makes a single ballot box a proxy for relatively small residential areas. In this study, a “Haredi voting box” is defined as a polling station where at least 75% of the votes are cast for the Haredi parties—Shas and UTJ—which strongly indicates the presence of predominantly Haredi voters. Although this cutoff is somewhat arbitrary, it is supported by an empirical cumulative percentage analysis (details and code are provided in the Data Availability Statement) that validates its use. In cities with large non-Haredi populations, only the homogeneous Haredi boxes were analyzed to focus on clusters of the Haredi population. The analysis was limited to cities and towns with at least five such homogeneous Haredi boxes.
While UTJ voters are mostly Haredim, the majority of Shas voters across the entire Israeli population do not belong to the Haredi sector; it is estimated that only one-third of Shas voters are Haredi (Keren-Kartz 2024). However, due to the focus on homogeneous Haredi ballot boxes, I can safely assume that all the votes for UTJ and Shas in these boxes come from Haredi voters. It is important to note that any Haredi citizen is free to vote for any party—indeed, some Ashkenazi voters may cast ballots for Shas and some Sephardic Haredim for UTJ. Historical data, however, suggest that such cross-voting is relatively rare within these homogeneous boxes (Curiel and Zeedan 2024; Malovicki-Yaffe et al. 2024). Consequently, while this possibility could introduce some noise into the calculation of dissimilarity indices, its impact is likely minimal, and the assumption of near-exclusive Haredi voting remains a robust basis for the analysis.
No further preprocessing, such as anomaly detection or removal, was performed.
Measuring Segregation Patterns
If no internal segregation exists, the Shas/UTJ vote ratio within a city or area would remain approximately the same across all ballot boxes. To quantify deviations from this expectation, I calculated the index of dissimilarity for each city or area to measure the degree of segregation between the two groups. The index of dissimilarity (D) is defined as follows:
where
- Ai: Number of votes for Shas in the i-th box,
- A: Total number of votes for Shas in the city,
- Bi: Number of votes for UTJ in the i-th box,
- B: Total number of votes for UTJ in the city.
The index ranges from 0 to 1, where 0 represents complete integration (even distribution), and 1 represents complete segregation (no overlap between groups). To provide a reference, I shuffled each city’s voting data 1000 times and calculated the distribution of the dissimilarity index for these randomized datasets. I then ranked each Haredi population cluster based on their dissimilarity scores to highlight relative segregation levels.
While the dissimilarity index is widely used in segregation studies and is easily understood, its use has limitations. For example, Lengyel and Botta-Dukát (2023) critiques that it overlooks changes in the total number of individuals within a community, potentially leading to misinterpretations of species interactions. Fossett (2017) highlights that traditional segregation indices, including the dissimilarity index, are susceptible to bias, especially when analyzing small populations or groups with significant size disparities. However, in this current study, only two populations are analyzed, both of comparable sizes. This comparability mitigates concerns about disproportionate group sizes affecting the reliability of the metric. Furthermore, the study focuses exclusively on a two-group system, which aligns well with the original formulation and intended use of the index of dissimilarity. Since the metric effectively captures the extent of segregation between two distinct yet similarly sized populations, it remains a valid and appropriate tool for assessing intra-group ethnic segregation in Haredi communities.
To examine factors contributing to segregation levels, I analyzed the correlation between the dissimilarity index and several variables, including the number of Haredi voting boxes, Haredi voters, and Haredi legal voters, as well as the overall Haredi population. Additional variables included the total number of voting boxes, total voters, total legal voters, and the ratios of Haredi-to-total voting boxes and Haredi-to-total legal votes.
Since these variables are closely related, regression analysis was deemed infeasible due to high collinearity. Instead, I performed Spearman correlation analysis to assess relationships between key variables and segregation levels. Spearman was chosen over Pearson correlation to avoid reliance on assumptions such as normality and linearity. To check for multiple comparisons, I applied the Benjamini–Yekutieli (Emmert-Streib et al. 2023) correction to the regression p-values.
The analysis was conducted using Python (version 3.12.2) and associated libraries, including pandas (version 2.2.3) and the multitest package by Josef Perktold, which is part of statsmodels version 0.14.4 (Seabold and Perktold 2010).
While the dissimilarity index provides a useful and widely accepted measure of segregation, it is important to acknowledge its inherent limitations to contextualize the findings. The index focuses on proportional representation and does not account for spatial separation or physical distances between groups. Incorporating Geographic Information System (GIS) data, such as residential coordinates or detailed neighborhood boundaries, would enable more nuanced spatial analysis and enhance the robustness of segregation studies (Wong 2016). The geographical boundaries of citizens assigned to each ballot box are not publicly available in Israel. As a result, accurately measuring micro-segregation at the neighborhood level requires reliance on human surveyors (Flint et al. 2012; Alfasi et al. 2013). However, using homogeneous Haredi ballot boxes serves as a reliable proxy for identifying segregation patterns, allowing for meaningful analysis on a country-wide scale.
This study relied solely on publicly available national election data and survey data published by a research institute. Since all the data were publicly accessible and did not involve personal or sensitive information, no ethics committee approval was required for this study.
3. Results and Discussion
3.1. Overview of Data
The collected dataset is summarized in Table 1. It includes voting patterns from multiple Haredi-majority areas, providing insights into ethnic segregation between Ashkenazi and Sephardic Haredim.

Table 1.
Summary of voting data for Knesset elections (1999–2022), including total number of voters, number of homogeneous Haredi ballot boxes, and the number of relevant voters in these boxes for each election.
Table 2 presents key metrics, including city name, number of voters, dissimilarity index values, and predominant party support in the latest, 25th Knesset elections. The total number of registered voters in Haredi-homogeneous ballot boxes was 1,226,667, of whom 789,393 cast legal votes. This is higher than the total Haredi population reported in these areas by the Israel Democracy Institute (936,602) (Israel Democracy Institute 2023). This discrepancy may arise from several factors, including IDI survey limitations, mixed populations in some neighborhoods, and the fact that non-Haredi individuals may vote for UTJ or Shas, particularly the latter (Peled 1998; Keren-Kartz 2024).
Table 2.
Key metrics for ethnic segregation in Haredi-majority areas in Israel during the 25th Knesset elections. The table displays dissimilarity index values, voting data, and population estimates for cities with significant Haredi populations. Data in the “Haredi Population” and “Fraction of Haredim Within the City Population” columns are based on Israel Democracy Institute estimations for 2023, while all other data are derived from the 25th Knesset voting data, unless specified otherwise.
The most recent 25th Knesset election data included 670 homogeneous Haredi ballot boxes, as defined in the Methods Section. The number of voters per box ranged from 397 to 518 (25th to 75th percentiles).
3.2. Segregation Analysis
The analysis reveals significant levels of ethnic segregation within Israel’s Haredi communities, as quantified by the dissimilarity index over the entire study period.
Figure 1 illustrates the dynamics of the Dissimilarity Index over the observed period. Looking at the latest data from 2022, cities such as Ashdod, Elad, and Bnei Brak exhibit the highest segregation levels, with dissimilarity scores of 0.125, 0.107, and 0.097, respectively. These values are substantially higher than the 95% confidence intervals of randomized shuffled data, demonstrating that the observed patterns are not random but reflect meaningful geographic and social separation (Figure 2).
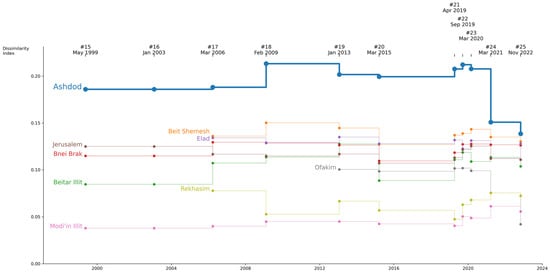
Figure 1.
Trends in ethnic segregation within Israel’s Haredi communities, as measured by the dissimilarity index, across multiple cities during Knesset election years (1999–2022). The line for Ashdod is thicker to emphasize the significant changes in segregation levels, raising an open question discussed in the paper regarding the unique dynamics in Ashdod.
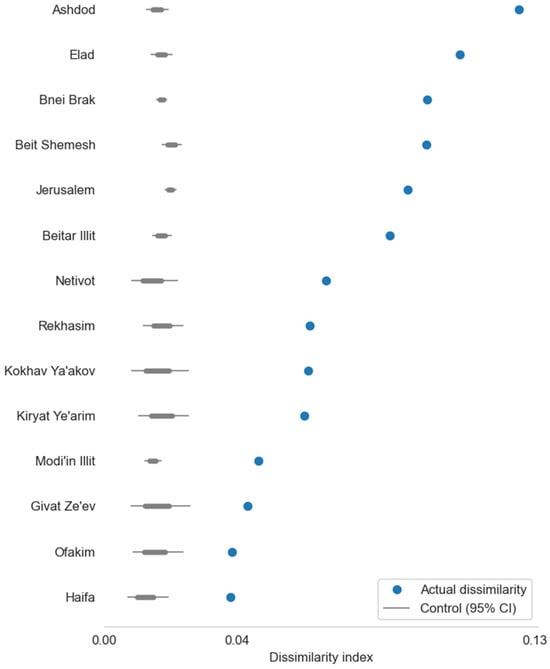
Figure 2.
Dissimilarity index values for ethnic segregation in Israel’s ultra-orthodox communities. The figure displays segregation levels between Ashkenazi and Sephardic Haredi populations across various cities, measured using the dissimilarity index (blue dots). Higher index values represent greater segregation. The gray boxes indicate the 95% confidence intervals for randomized control data, providing a baseline for comparison. Cities are ranked by their actual dissimilarity index values. The analysis is based on voting patterns from the 25th Knesset elections, held in November 2022.
In comparison, a 2022 analysis of Black–White segregation in U.S. metro/micro areas (Pendergrass 2022) reports a median dissimilarity index of 0.462, with values ranging from 0.211 to as high as 0.835 in the most segregated areas. This highlights the much higher levels of segregation observed in racial contexts within the United States. While Black–White segregation in the U.S. is often attributed to structural inequalities and systemic discrimination, segregation in Haredi communities appears to be driven more by cultural and religious differences. However, it is important to note that a direct comparison of these dissimilarity index values is not possible due to differences in methodology, including variations in geographic units, data sources, and the specific metrics used to assess segregation. These distinctions underscore the need to interpret the findings within their respective social and analytical contexts.
In 2012, Flint et al. (2012) quantified the separation in a single Haredi neighborhood of Sanhedria over the years. They used Moran’s I index over time. Direct comparison is not possible, as this index measures spatial autocorrelation, indicating the degree to which similar values cluster spatially, whereas the dissimilarity index assesses the evenness of distribution between two groups across a geographic area. Therefore, each index provides different insights into segregation patterns.
3.3. Correlation Analysis
The Spearman correlation analysis identified a significant positive relationship between segregation levels measured in 2022 and variables such as the number of Haredi voting boxes () and the total number of Haredi voters (). These findings suggest that segregation becomes more pronounced in areas with larger Haredi populations, potentially due to the capacity to establish separate religious, cultural, and communal hubs for Ashkenazi and Sephardic communities (Figure 3).
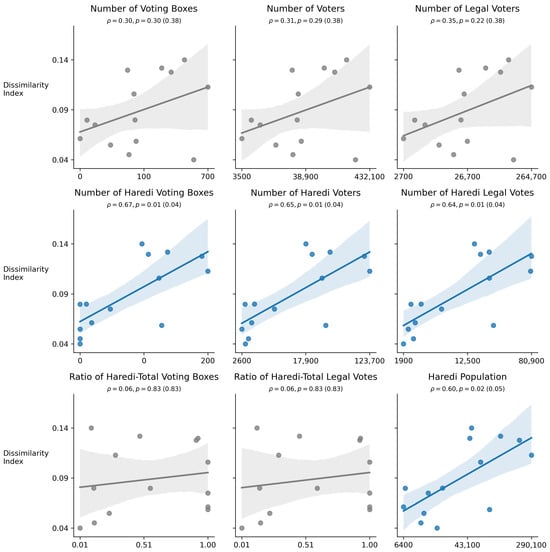
Figure 3.
Spearman correlation between dissimilarity index and demographic variables in Israel’s ultra-Orthodox communities. Scatter plots show relationships between the dissimilarity index and various metrics (as indicated by the subgraph titles), based on the 25th Knesset elections held in November 2022. The color of the plots indicates whether p-values are below 0.05, with corrected values using the Benjamini–Yekutieli method shown in parentheses. Shaded regions represent 95% confidence intervals for the regression lines.
3.4. The Curious Case of Ashdod
Of all the cities in this study, Ashdod stands out as the most noteworthy one. Ashdod is a large Israeli city on the coast of the Mediterranean Sea. The consistent increase in the Haredi population began in the early 1990s, alongside cities such as Beit Shemesh and Modi’in Ilit (Keren-Kartz 2024). Today, over one-fifth of the city’s population identifies as Haredi (see Table 2). The thicker line in Figure 1 shows the dynamics of the dissimilarity index in Ashdod, indicating a notably higher level of segregation over most of the study period, with a sharp drop in the index around the March 2021 elections. While its dissimilarity index remains the highest among all the Haredi population clusters, it has converged closer to the values observed in the rest of the country.
This pattern contrasts with all other Haredi clusters, both old (such as Jerusalem and Bnei Brak) and new, where longstanding Haredi populations exhibit relatively stable dissimilarity indices. In Ashdod, however, the dynamics are still evolving, making it a significant case study for understanding how demographic shifts and cultural factors shape urban segregation in mixed-population cities.
Despite extensive efforts, no information could be found to explain the sharp drop in Ashdod’s dissimilarity index in 2021. This unexplained change underscores the need for further investigation into the social, political, or cultural factors that may have contributed to these dynamics.
4. Discussion
Ethnic segregation, as a multifaceted phenomenon, has been extensively explored in the context of racial and national divides (Massey and Denton 2007), yet intra-group segregation within seemingly cohesive communities remains underexplored. This study’s findings on Israel’s Haredi communities contribute to this gap by illuminating how cultural and religious identities shape residential patterns within a shared religious framework. By analyzing voting patterns as a proxy for residential distribution, this research not only quantifies the extent of segregation but also provides insights into its sociopolitical drivers.
These results highlight the deep cultural and organizational divides within Israel’s Haredi society. Although both Ashkenazi and Sephardic Haredim share religious beliefs, their differences in liturgy, customs, and community structures often result in physical separation. This divide reflects broader dynamics of ethnic and value-based segregation (Paolillo and Lorenz 2018).
The observed dissimilarity indices, such as 0.125 in Ashdod, 0.107 in Elad, and 0.097 in Bnei Brak, reveal significant levels of ethnic segregation within Haredi communities. These values, while lower than those typically seen in racial segregation contexts like Black–White segregation in U.S. metro areas (median dissimilarity index of 0.462 (Pendergrass 2022)), nonetheless indicate separation that is not only statistically significant (see the randomized simulation numbers in Figure 2), but is also practically meaningful. This is because it indicates that even modest deviations from an even distribution correspond to distinct patterns of voluntary residential clustering, and that these patterns persist and evolve over time, reflecting dynamic cultural and socio-political processes within Haredi communities. Importantly, the drivers differ. While U.S. segregation is often attributed to structural inequalities and historical discrimination (Massey and Denton 2007), Haredi segregation appears to be more voluntary, rooted in cultural and religious preferences (Keren-Kartz 2024; Keren-Kratz 2025). This distinction underscores the diverse mechanisms underlying segregation across societal contexts.
Our findings also align with theories of homophily and xenophobia, which may simultaneously drive segregation. Homophily reflects in-group preferences for shared culture and customs, while xenophobia stems from out-group avoidance. While our data do not distinguish between these mechanisms, their combined influence likely reinforces segregation. Future studies should explore their relative contributions, potentially through survey data or experimental approaches.
Urban venues such as synagogues, schools, and community centers specific to each ethnic group may further entrench segregation, as they act as cultural anchors shaping residential patterns (Rae et al. 2022). The persistence of these institutions underscores the role of physical and social infrastructure in maintaining ethnic divides.
The comparison between segregation in Haredi communities and Black–White segregation in the U.S. provides valuable context. While segregation in the U.S. is driven by structural inequalities, segregation in Haredi communities stems from cultural and religious differences. This highlights the unique drivers and implications of intra-group segregation.
Larger Haredi populations correlate with greater segregation due to the formation of distinct cultural hubs. These hubs reinforce separation through separate schools, synagogues, and community networks. This mechanism should be explored further to understand how it shapes residential patterns.
Ashdod emerges as a unique case study with dynamic segregation trends. The sharp decline in its dissimilarity index in 2021 raises important questions about demographic shifts or socio-political factors influencing this pattern. Investigating Ashdod could provide insights into the evolving nature of segregation.
Larger Haredi populations may correlate with higher levels of segregation through the formation of distinct cultural hubs, which reinforce separation via separate schools, synagogues, and community networks. Future research should delve deeper into this mechanism to clarify how these hubs influence residential patterns.
Methodological limitations, such as the lack of GIS data and reliance on voting patterns as proxies for residential segregation, must be acknowledged. Incorporating spatial data in future research could improve the precision and depth of segregation analyses.
Although the index of dissimilarity (D) is widely used, it does not capture spatial clustering or distances, which may lead to an incomplete picture of segregation. Its sensitivity depends also on data granularity; larger ballot boxes can mask finer-scale variations. However, with ballot boxes averaging 397–518 voters and comparable group sizes, the index remains a robust tool for measuring intra-group ethnic segregation. Recent studies have advanced to more nuanced spatial analyses using GIS and activity space mapping (Malaker and Meng 2024). Our study demonstrates that even non-geographic data, such as voting patterns, can reveal enduring segregation, showing that entrenched separation limits intergroup contact and reinforces social cleavages. Future work integrating advanced spatial methods could further refine our understanding of these dynamics.
Recent studies of societies show both parallels and contrasts with the intra-group segregation observed in Israel’s ultra-Orthodox communities. Hwang and McDaniel (2022) find that segregation arises from interacting drivers—such as economic stratification, housing policies, cultural preferences, and historical discrimination—that combine to sustain spatial separation. Similarly, Järv et al. (2021) argue that structural forces, including zoning practices, school catchment areas, and housing market dynamics, are critical in channeling ethnic groups into distinct areas. These findings resonate with our results, where strong community institutions (e.g., religious schools and synagogues) and deliberate cultural insulation reinforce segregation. However, whereas Western segregation often stems from externally imposed inequalities, the ultra-Orthodox case appears to result primarily from voluntary separation aimed at preserving cultural and religious integrity (Flint et al. 2012; Alfasi et al. 2013; Keren-Kartz 2024).
Finally, integrating quantitative approaches, like agent-based modeling (Bakens and Pryce 2019), could provide deeper insights into the long-term evolution of segregation in Haredi communities. Such methods would complement this study’s findings by simulating how individual preferences and institutional factors interact to shape residential patterns over time.
5. Conclusions
This study highlights the extent of ethnic segregation within Israel’s Haredi communities, demonstrating that even within a seemingly homogenous religious group, significant intra-community divisions persist. Using voting data as a proxy for residential segregation, I offer a novel approach that complements traditional Geographic Information System (GIS) methods. This approach not only corroborates known segregation patterns but also sheds light on the sociopolitical factors driving these divisions. Future research could benefit from the inclusion of GIS data, if made available by governmental institutions in a responsible and anonymous manner, to enhance the depth and precision of such analyses.
The temporal trends observed in dissimilarity indices, such as Ashdod’s fluctuations, underscore the dynamic nature of segregation. These changes suggest evolving socio-political and demographic factors that warrant further investigation.
The distinct patterns of support for Shas and UTJ across different localities underline the enduring influence of ethnic identity in shaping community structures. These findings align with Schelling’s classic segregation model, which illustrates how even slight preferences for similarity can produce significant segregation at the macro level. This study extends these theoretical insights into the domain of intra-religious ethnic segregation, revealing that such divisions endure even within communities united by shared religious values, practices, and political goals. Moreover, the comparison with U.S. racial segregation highlights the unique cultural and voluntary drivers of Haredi segregation, enriching our understanding of segregation mechanisms across different societal contexts.
By empirically demonstrating intra-community ethnic segregation and linking these patterns to broader theoretical frameworks, this study advances our understanding of the interplay between ethnicity, religion, and urban dynamics. It provides a foundation for future investigations into the mechanisms that sustain segregation and their implications for urban planning, community cohesion, and social integration.
Funding
This research received no external funding.
Institutional Review Board Statement
Ethical review and approval were waived for this study. This study exclusively utilized publicly available national election data and survey data provided by a recognized research institute. As all data sources were publicly accessible and did not include any personal or sensitive information, ethical approval from an institutional review board was not required.
Informed Consent Statement
This study relied solely on publicly available, anonymized aggregate data; therefore, obtaining informed consent was not required.
Data Availability Statement
The data and the code used in this research are available at https://github.com/bgbg/segregation_paper (accessed on 6 March 2025).
Acknowledgments
The author thanks Menachem Keren-Kratz, an independent researcher, for his very important discussions and suggestions, which significantly improved the depth of this work, as well as for generously providing ready-to-analyze files of earlier election results. During the preparation of this manuscript, the author used OpenAI’s ChatGPT (GPT-4o and GPT-4.5 models) for proofreading and editing purposes. The author has reviewed and edited the output and take full responsibility for the content of this publication.
Conflicts of Interest
The author declares no conflicts of interest.
References
- Alfasi, Nurit, Shlomit Flint Ashery, and Itzhak Benenson. 2013. Between the Individual and the Community: Residential Patterns of the Haredi Population in Jerusalem. International Journal of Urban and Regional Research 37: 2152–76. [Google Scholar] [CrossRef]
- Bakens, Jessie, and Gwilym Pryce. 2019. Homophily Horizons and Ethnic Mover Flows among Homeowners in Scotland. Housing Studies 34: 925–45. [Google Scholar] [CrossRef]
- Curiel, Concha Pérez, and Rami Zeedan. 2024. Social Identity and Voting Behavior in a Deeply Divided Society: The Case of Israel. Societies 14: 177. [Google Scholar] [CrossRef]
- Emmert-Streib, Frank, Salissou Moutari, and Matthias Dehmer. 2023. Multiple Testing Corrections. In Elements of Data Science, Machine Learning, and Artificial Intelligence Using R. Cham: Springer, pp. 421–54. [Google Scholar] [CrossRef]
- Flint, Shlomit, Itzhak Benenson, and Nurit Alfasi. 2012. Between Friends and Strangers: Micro-Segregation in a Haredi Neighborhood in Jerusalem. City and Community 11: 171–97. [Google Scholar] [CrossRef]
- Fossett, Mark. 2017. New Methods for Measuring and Analyzing Segregation. The Springer Series on Demographic Methods and Population Analysis. Berlin: Springer Nature, vol. 42. [Google Scholar] [CrossRef]
- Fox, Jonathan. 2004. The Rise of Religious Nationalism and Conflict: Ethnic Conflict and Revolutionary Wars, 1945–2001. Journal of Peace Research 41: 715–31. [Google Scholar] [CrossRef]
- Fraga, Bernard L. 2016. Candidates or Districts? Reevaluating the Role of Race in Voter Turnout. American Journal of Political Science 60: 97–122. [Google Scholar] [CrossRef]
- Friedman, Menachem. 1991. The Haredi (Ultra-Orthodox) Society: Sources, Trends and Processes. Jerusalem: The Jerusalem Institute for Israel Studies 1: 80–87. Available online: https://jerusaleminstitute.org.il/wp-content/uploads/2019/06/PUB_haredcom_eng.pdf (accessed on 6 March 2025).
- Hwang, Jackelyn, and Tyler W. McDaniel. 2022. Racialized Reshuffling: Urban Change and the Persistence of Segregation in the Twenty-First Century. Annual Review of Sociology 48: 397–419. [Google Scholar] [CrossRef]
- Israel Democracy Institute. 2023. Israel Democracy Institute. Annual Statistical Report on Ultra-Orthodox (Haredi) Society in Israel. Available online: https://en.idi.org.il/publications/52436 (accessed on 2 March 2025).
- Israel’s Central Election Committee. 2024. Available online: https://www.bechirot.gov.il (accessed on 20 November 2024).
- Järv, Olle, Anu Masso, Siiri Silm, and Rein Ahas. 2021. The Link Between Ethnic Segregation and Socio-Economic Status: An Activity Space Approach. Tijdschrift Voor Economische En Sociale Geografie 112: 319–35. [Google Scholar] [CrossRef]
- Keren-Kartz, Menachem. 2024. התכנסותה של החברה החרדית בישראל למובלעות גאוגרפיות: סקירה היסטורית [The Convergence of Haredi Society in Israel to Geographical Enclaves: A Historical Overview]. אופקים בגאוגרפיה [Horizons in Geography] 103: 2023. Available online: https://drive.google.com/file/d/11J7zmmhYz-ZNe3yFk4aJATLZGzKDLwRL/view (accessed on 2 March 2025). (In Hebrew).
- Keren-Kratz, Menachem. 2025. The Turnaround in Israel’s Haredi Society in the Late 20th Century: A Data-Based Analysis. Religions 16: 145. [Google Scholar] [CrossRef]
- Koopmans, Ruud, and Paul Statham. 1999. Challenging the Liberal Nation-State? Postnationalism, Multiculturalism, and the Collective Claims Making of Migrants and Ethnic Minorities in Britain and Germany. American Journal of Sociology 105: 652–96. [Google Scholar] [CrossRef]
- Lengyel, Attila, and Zoltán Botta-Dukát. 2023. A Guide to Between-Community Functional Dissimilarity Measures. Ecography 2023: e06718. [Google Scholar] [CrossRef]
- Malaker, Tanmoy, and Qingmin Meng. 2024. Urban Disparity Analytics Using GIS: A Systematic Review. Sustainability 16: 5956. [Google Scholar] [CrossRef]
- Malovicki-Yaffe, Nechumi, David N. Myers, Mark Trencher, and Chaya Lehrfield-Trop. 2024. Politics, National Identity, and Democracy: A Comparison of Haredi Political Attitudes and Behavior in the United States and Israel. In New Trends in the Study of Haredi Culture and Society. West Lafayette: Purdue University Press, pp. 227–40. Available online: https://library.oapen.org/bitstream/handle/20.500.12657/96028/9781612499949.pdf?sequence=1#page=254 (accessed on 2 March 2025).
- Massey, Douglas S., and Nancy A. Denton. 2007. American apartheid: Segregation and the making of the underclass. American Journal of Sociology 96: 329–57. [Google Scholar] [CrossRef]
- McCauley, John F. 2014. The Political Mobilization of Ethnic and Religious Identities in Africa. American Political Science Review 108: 801–16. [Google Scholar] [CrossRef]
- Melamed, David, Christopher W. Munn, Brent Simpson, Jered Z. Abernathy, Ashley Harrell, and Matthew Sweitzer. 2020. Homophily and Segregation in Cooperative Networks. American Journal of Sociology 125: 1084–127. [Google Scholar] [CrossRef]
- Paolillo, Rocco, and Jan Lorenz. 2018. How Different Homophily Preferences Mitigate and Spur Ethnic and Value Segregation: Schelling’s Model Extended. Advances in Complex Systems 21: 1850026. [Google Scholar] [CrossRef]
- Peled, Yoav. 1998. Towards a Redefinition of Jewish Nationalism in Israel? The Enigma of Shas. Ethnic and Racial Studies 21: 703–27. [Google Scholar] [CrossRef]
- Pendergrass, Robert William. 2022. The Relationship between Urban Diversity and Residential Segregation. Urban Science 6: 66. [Google Scholar] [CrossRef]
- Petrescu-Prahova, Miruna. 2009. Beyond Schelling: The Role of Attitudes toward In-Group and Out-Group Members in Ethnic Residential Settlement and Segregation. Washington, DC: University of Washington. [Google Scholar]
- Rae, James R., Allison L. Skinner-Dorkenoo, Anna Kaisa Reiman, Katharina Schmid, and Miles Hewstone. 2022. Mixed Evidence for Interactive Effects of Outgroup Proportions and Intergroup Contact on Racial Bias in the United States. Social Psychological and Personality Science 13: 476–89. [Google Scholar] [CrossRef]
- Seabold, Skipper, and Josef Perktold. 2010. Statsmodels: Econometric and Statistical Modeling with Python. Available online: https://pdfs.semanticscholar.org/3a27/6417e5350e29cb6bf04ea5a4785601d5a215.pdf (accessed on 6 March 2025).
- Sri, Roro, and Rejeki Waluyajati. 2022. Religious Segregation in Rural Urban Community: The Experiences from Cihampelas District, Indonesia. Khazanah Sosial 4: 765–80. [Google Scholar] [CrossRef]
- Thomas, Veliska, Stan L. Bowie, and Chesney J. Ward. 2023. Assessing the Impact of Religious Values on Social Bonds among African American Adults: Implications for Social Work Practice. Journal of Religion and Spirituality in Social Work 42: 259–78. [Google Scholar] [CrossRef]
- Village, Andrew. 2021. Belonging, Ethnicity, and Homophily in Local Congregations: A Multivariate Analysis. In The Science of Congregation Studies: Searching for Signs of Growth. Berlin: Springer, pp. 227–51. [Google Scholar] [CrossRef]
- Wong, David W. 2016. From Aspatial to Spatial, from Global to Local and Individual: Are We on the Right Track to Spatialize Segregation Measures? In Recapturing Space: New Middle-Range Theory in Spatial Demography. Cham: Springer International Publishing, pp. 77–98. [Google Scholar] [CrossRef]
- Zuccotti, Carolina V., Jan Lorenz, Rocco Paolillo, Alejandra Rodríguez Sánchez, and Selamawit Serka. 2023. Exploring the Dynamics of Neighbourhood Ethnic Segregation with Agent-Based Modelling: An Empirical Application to Bradford, UK. Journal of Ethnic and Migration Studies 49: 554–75. [Google Scholar] [CrossRef]
Disclaimer/Publisher’s Note: The statements, opinions and data contained in all publications are solely those of the individual author(s) and contributor(s) and not of MDPI and/or the editor(s). MDPI and/or the editor(s) disclaim responsibility for any injury to people or property resulting from any ideas, methods, instructions or products referred to in the content. |
© 2025 by the author. Licensee MDPI, Basel, Switzerland. This article is an open access article distributed under the terms and conditions of the Creative Commons Attribution (CC BY) license (https://creativecommons.org/licenses/by/4.0/).