Abstract
“Obesity”, is defined as a body mass index (BMI) ≥ 30. Yet the tool, BMI, has been shown to be flawed in its weight classing. BMI categories were made by relying nearly exclusively on data about middle-class white males, creating “the normal (white) man”. Yet, BMI continues to be used as a diagnostic tool, and is increasingly deployed to stigmatize fat persons as “diseased”. This has critical implications for women—especially Black women and Latinas—who have some of the highest BMIs in the country. But, despite the consternation over the size of the bodies women of color have, there are nearly no studies to date examining the relationship between BMI and rates of chronic illness by race and gender. In this study, we examined the associations between BMI and type 2 diabetes (T2D) for women across race in comparison to white men. Relying on 20 years of NHANES data, we found that while Latinas and Black women were nearly 3 times and over 5 times as likely to have T2D than white men, respectively, the association between BMI and T2D was significantly weaker for Latinas than for white men. The association between BMI and T2D was markedly weaker for Black women. This study shows that racial and gendered health disparities cannot be explained by differences in rates of “obesity” as defined by a white male norm.
Keywords:
obesity; race; gender; fatphobia; blackness; whiteness; diabetes; health disparities; history of medicine 1. Introduction
In 2013, the American Medical Association (AMA) voted to classify obesity as a disease. The decision was controversial. Although the National Institutes of Health (NIH) had labeled obesity a disease back in 1998, the AMA is the most influential medical organization in the U.S. Therefore, many expected that their assignation that obesity is a disease would, well, carry more weight. The AMA’s decision came with the new stipulation that physicians would now be required to engage in efforts to both treat obese persons, and work to prevent people from becoming obese (Rosen 2014).
That was not the only reason the AMA’s move raised eyebrows. The organization had been resisting the charge to label obesity a disease for some time. They had made this decision in part because there is no universally agreed-upon definition of “disease” (Rosen 2014). Still, a doctrinal definition issues from Heshka and Allison (2001), who detailed four criteria:
Disease is a condition of the body, its parts, organs, or systems or an alteration thereof. It results from infection, parasites, nutritional, dietary, environmental, genetic, or other causes. It has a characteristic, identifiable, marked group of signs or symptoms. It deviates from normal structure or function (variously described as abnormal structure or function; incorrect function; impairment of normal state; interruption, disturbance, cessation, disorder, derangement of bodily or organ functions….(quoted in Rosen 2014, p. 106)
In its review of the merits of considering obesity a disease in 2007, the AMA had ruled that points 1, 2, and 4 were essential characteristics. Obesity, they claimed, did not fit the bill (Rosen 2014, p. 106).
In 2012, the AMA revisited the question amidst a growing number of organizations answering in the affirmative. Now, the AMA’s own Council on Science and Public Health, had made the following argument:
“Medicalizing” obesity…[could] lead to prioritizing body size as a greater determinant of health than health behaviors… this could also lead to the overtreatment of some people, such as those who meet the criteria for obesity, (i.e., BMI > 30) but are metabolically healthy. A similar concern is that obese individuals who improve their eating, physical activity, and sleeping habits, yet fail to lose enough weight to change their BMI classification, would still bear the “diseased” label and be pressured to receive medical treatment by clinicians, health insurers, and/or employers….(American Medical Association 2013)
Recognizing that medicalizing body size could be prejudicial—to the extent that a fat person would be deemed “diseased” even if they are leading a healthy lifestyle and are shown to be metabolically healthy—the Council averred. Refusing to apply the label of “diseased” to individuals considered obese, the AMA remained one of the few holdouts.
A few months later, they abruptly reversed course. In 2013, just months after the report was drafted, and nearly overlapping with its publication, the AMA changed tracks. Its House of Delegates voted in opposition to the Council’s report, declaring suddenly that obesity was a chronic disease (Kyle et al. 2016).
It’s not entirely clear what led to this dramatic change of policy in such a short space of time. But it is clear that this decision did not follow any new clinical evidence. It is not unreasonable to hypothesize that the AMA’s decision resulted from pressure from a swelling chorus of doctors to fall in line. Indeed, a mounting number of medical orgs since 1998 were making the case that “excess fatness” was itself a sickness (Rosen 2014). The AMA’s status as a rare holdout was evidently beginning to discomfit some within the organization.
Added to this was the timing. As other scholars have noted, 2012 and 2013 were particularly abundant for the churn of anti-obesity screeds. In 2012, the influential American Association of Clinical Endocrinologists published its own position paper in which they “strongly assert” that “obesity is a primary disease” (Mechanick et al. 2012, p. 644). In 2013, the National Heart, Lung, and Blood Institute (NHLBI) released new guidelines that the AMA itself had been anticipating. In it, the authors claim, “Understanding obesity as a complex, chronic disease is essential for providing effective health care for overweight and obese patients.” (National Heart, Lung, and Blood Institute 2013, p. 7).
That same year saw the debate leap from the pages of medical journals and into the mass media. A high-profile paper in the American Journal of Public Health claimed that obesity was an underappreciated cause of death and was especially deadly for Black women (Masters et al. 2013a). The paper was picked up by major news networks across the political spectrum, brandishing headlines intoning “Obesity Kills” (Rosen 2014; Strings 2019).
Arguably more compelling than the AMA’s sudden flip-flop on the issue was their own stated recognition of the primary problem with obesity science that had given them pause for years: BMI. Referencing decisions by the World Health Organization (WHO) and the NHLBI, they write, “Both the WHO and NHLBI guidelines recognize that BMI is an indirect and imperfect measure…” (American Medical Association 2013, p. 3). They added that some people with low BMIs will have metabolic conditions that go undiagnosed owing to its dominance, whereas some people with elevated BMIs may have excellent insulin responses, low blood pressure, and normal lipid levels. They sum up the rationale for its continued use with resignation: “While some argue that BMI should be excluded from the definition of obesity in deciding whether or not obesity is a disease, the fact remains that BMI is currently the prevailing clinical measure of obesity.” (American Medical Association 2013, p. 5). Which is to say that, while BMI is a deeply flawed measure of health outcomes, it is the only tool doctors can use to suggest that a person is overly fat, and advise weight loss.
While BMI is a bad tool all around, a fact recognized by several researchers (Campos et al. 2006; Gutin 2018), its use has critical implications for Black and Latine women. Women in these groups have some of the highest BMIs in the country, with Black women edging out Latinas as the group with the single highest BMIs in America (Strings 2019). There are very few studies directly examining the association between BMI and health outcomes among women at all, much less Black women and Latinas. Indeed, almost none of the extant (and correlative) BMI science uses anything approximating an intersectional approach to understand the specific relationship between its biomarkers and health outcomes for individuals who are neither white nor male.
This paper addresses this gulf in the literature. We examine the following: what is the relationship between BMI and health outcomes for women? Is the association stronger or weaker for women vs. men? When we consider the roles of race in tandem with gender, do we find that the link between BMI for Black and Latine women diverges from that of white men?
We anticipate that since BMI and its biomarkers were invented by white men, based partially on the limited study of largely white and male populations, BMI will prove to be less predictive of the major chronic illness often associated with “obesity”—that being type 2 diabetes, or T2D—for women than for men. We further hypothesize that the relationship between BMI and T2D will be weaker for Black and Latine women than for white women, and most noticeably weaker for Black women.
2. Literature
2.1. BMI: The Non-Medical Origin Story
BMI was never meant to be used to measure individual adiposity, or so-called obesity. The tool was invented by a Belgian statistician and astronomer named Adolphe Quetelet in the 19th century. In the 1820s, Quetelet was well on his way to realizing his life’s dream of becoming a well-known astronomer, racking up esteem like that of his idol, Sir Isaac Newton. When revolution rocked his country in 1830, his role as a director of an observatory and his life ambitions were both scrapped. He had to find a new way to remain afloat, but fast.
He decided to turn his attention to the very thing that had derailed his career—that being the instability of human social and political life. Leaning on his skills as a mathematician and astronomer, Quetelet devised to study the social life of man. Unwittingly perhaps, he became what would later be deemed one of the founders of the field of social science (Eknoyan 2008). His plan was to see if human society could not be managed through scientific endeavor. It would usher in a new type of biopolitics right as society was getting a taste for the “big data” made available for the first time in the 19th century (Rose 2016).
In a first effort to rein in the chaos of human life, he had the rather clever notion that it might be useful to identify what might be a few “norms” for mankind. Applying a theory of averages he used as an astronomer, Quetelet used a dataset comprised solely of Scottish soldiers to arrive at what he deemed an “average” chest size for soldiers. Simple though it may seem, it was the first calculated average of any human body part (Rose 2016). Mathematical theories at the time held that the average of things was a good representation of their actual value. As such, taking averages of the human body was supposed, in Quetelet’s view, to represent the modal, or “true” human being (Rose 2016).
In a logical leap that would have negative ramifications for centuries, Quetelet suggested that the Average Man was a representation of perfection. He busily set himself to the task of calculating the average of all sorts of physical features, including skin color. But it was his work on the average height and weight that would inform the bulk of his legacy.
Since average was perfect in his esteem, he set about trying to understand the median weight and height of the typical man, and later, woman. He collated a bounty of population data, largely from what he called the “principal European states”, with a very small retinue of research into the difference between the white people and slaves at the Cape of Good Hope (Quetelet 1842, p. 11). He presented his findings in his iconic 1835 text, A Treatise on Man and the development of his aptitudes. Through statistical manipulations of these data, Quetelet found that for children aged one until puberty, “weight increases nearly as the square of the height” (Eknoyan 2008, p. 49).
Manipulations might be the operative word. Quetelet recognized that this relationship between weight and height held at some ages and not others, even for the people under study, and yet still advanced this formula. Moreover, the analyses were massaged in an effort to fit his data to the Gaussian curve, AKA the bell curve or the “normal curve” (Eknoyan 2008, p. 49). His aim was to identify the “normal man” (Pray and Riskin 2023, p. 1). Fitting the distribution of the data around the normal curve was, in his view, a way to achieve this. This formula for the relationship between weight and height would be known as the Quetelet Index. It would later be renamed body mass index, or BMI.
2.2. Biologizing the Index
Several things are clear from the development of the Quetelet Index-cum-BMI. First, Quetelet himself, as noted by one of his chroniclers, “had no interest in obesity” (Eknoyan 2008, p. 49). His goal was not to identify the relationship between weight and health—only to identify a (vaunted) weight/height norm, relying largely on data from white men. He did, though, suggest that “differing from the Average Man’s proportions and condition, would constitute deformity and disease”, and, worse, that “exceeding the observed limits, would constitute a Monstrosity”, (Rose 2016). In other words, he believed the statures of men and women should aggregate around an identifiable and idealized “norm”. But this is not remotely the same as performing an empirical study of the relationship between body size and health. As an astronomer, such analyses were outside the scope of his work. It would take men who were interested in using statistical averages to infer health outcomes to import Quetelet’s insights into the field of medicine.
The first notable to do so in the U.S. was a man by the name of Charles Davenport. Davenport was one of America’s foremost biologists. He was also a eugenicist who, like his idol Francis Galton, thought it important to encourage the marriage and reproduction of only the “fittest” individuals (Farber 2008, p. 243). As such, he wanted to create a taxonomy of humanity using statistical methods.
“Fitness”, according to eugenic standards, was intimately tied to race. The reason was political. Between the mid-19th and the early-20th centuries, the world was rocked by demands that European powers end the enslavement of Africans. It was the era of the so-called “Negro Question” (Carlyle 1849). Some abolitionists and other activists demanded Black repatriation, others their integration. Still others, resistant to Black freedom and equality, were devising a rationale about the incommensurability of the races.
Race scientists since the 17th century had hatched classificatory schemes suggesting inherent differences among people, based on their geographical origin, appearance, and customs (Smedley 1993). In the 19th century, scientific racism took a new turn, becoming now also about biology. Its biologization was folded into the eugenics movement by the tail end of the 19th century (Smedley 1993). For if the races were supposedly biologically distinct, and the elite elements of the white race were, but of course, biologically superior, this knowledge should be actionable. To the likes of Charles Davenport, it made sense to encourage the breeding of these (select) white persons exclusively and prevent racial inferiors—including so-called “hybrid” or non-Anglo, non-Saxon whites—from reproducing, for the betterment of humanity (Strings 2019).
But how could one recognize these superior whites? To Davenport and other eugenicists, skin color, height, and weight were among the key “biologically” racial qualities. In his well-received 1923 text, Body Build and Its Inheritance, he argued that there was racial propensity to thinness or fatness. Articulating the problem of what he claimed was a “racial obesity”, he argued “that there are marked differences racial differences in build is notorious.” He identifies Scottish men as “slender”, in “striking contrast” to Greeks, South Italians, Russian Jews, and the Bushmen of South Africa, who, he suggests are known for their fleshiness (Davenport 1923, p. 11). Worse, it seems, is that among these “fleshy races”, the women are particularly fat (Davenport 1923, p. 11).
It was a style of analysis indebted to Quetelet, whose data he also included in his analyses in several places throughout the work. It also picks up on racial taxonomies from none other than Carolus Linnaeus, who, a little over a century earlier, had proclaimed, a bit hypocritically, that though it would be “frivolous” to call “fat and skinny” people distinct species, there was nevertheless a propensity toward muscularity among European men, and a cultural tendency toward slenderness among European women (Müller-Wille 2014, pp. 8–16), conditions he does not attribute to any other races. It also recalls the bounty of racial scientific theories abounding between the mid-18th and mid-19th centuries, which claimed non-Anglos, and in particular women of color, were prone to a gross fatness (Strings 2023). To Davenport, the “racial differences in body build are so great, that when feasible, race should be taken into account in studies on body build” (Davenport 1923, p. 11).
2.3. A Formula for Health?
As a biologist and eugenicist, Davenport regularly ties race to weight and displays a marked preference for the presumptive thinness of Western and Northern Europeans. While he mentions health outcomes, he does not go so far as to imply that fatness is always indicative of sickness. This would be the purview of one of his admirers, Ancel Keys.
Ancel Keys was a physiologist by training. In the buildup to World War II, he accepted a position at the University of Minnesota, where he established their Laboratory of Physiological Hygiene. There, he continued his work on the relationship between diet and health.
The harsh realities of war, in which one of the main concerns is the potential for starvation in enemy territory, led Keys to concentrate on identifying precisely how little food humans needed to survive. He took 36 healthy young men and placed them on a semi-starvation diet. In almost no time, the wasting set in. The men became obsessed with food and were found hoarding it. Many experienced anxiety and depression. The behavior mirrored that of anorectics. In the end, the men had lost on average 40% of their muscle. When the staff went to re-feed the semi-starved men, then men would try to eat between 2 and 3 times what they had eaten on a normal day before the experiment began (Gil 2023).
From these grim results flowed a pile of accolades. The study, though interrupted by the war’s end, was considered a success. Now, both doctors and the lay community might have a firm grasp of the harm of restricting food, and the difficulty of returning to a baseline of health after extreme dieting (Gil 2023).
Yet, these findings were produced during an era in which there was a growing concern about rising rates of coronary heart disease in the U.S. The American government wanted to know why so many wealthy (white male) citizens were being cut down in their prime by heart attacks? The funding poured in (Fletcher 2014).
Keys was well-positioned to capitalize. He thought diet might be the main culprit. He set out to study the link between diet, and especially the amount of fat in the diet, and heart disease. They examined diet and lifestyle habits of middle-aged men, aged 40–59, from the US, Finland, Netherlands, Italy, Greece, Yugoslavia, and Japan. There were no women in any of the cohorts. The aim was to identify “universal” risk factors of coronary disease (The Seven Countries Study—Countries & Cohorts n.d.). Early on, the researchers identified a strong link between coronary heart disease (CHD) mortality and saturated fat consumption (The Seven Countries Study—Countries & Cohorts n.d.).
But dietary fat was not Keys’ only concern. Ten years prior, he had started a campaign against common understandings of body fatness. Already by 1948, he had amassed a team of researchers to examine the association between obesity (defined using the insurance industry tables), exercise, and CHD. The population under study was 300 white, middle-aged businessmen. They found that “obese” white men were more likely to develop CHD and high blood pressure (Rasmussen 2019, p. 305).
These associations having been spied in the data, the problem still lay in the definition. Keys thought it distasteful that physicians might need to rely on insurance companies for guidance about “healthy weight”. Doctors, he believed, ought to have control over this most basic of concepts. An important reason for doing so, was, according to Keys and colleagues, the problem of averages. Insurance companies’ definition of obesity relied on the extant population average. This was far from standardized. “Average values for weight and height for given age and sex for a given population do not necessarily apply to other populations or even to the same population at another time” they intoned, adding “persons examined in connection with application for life insurance are far from being a random sample of the population.” (Keys et al. 1972, p. 330.)
From 1950 onward, he worked to find a standardized tool for assessing “healthy weight” that was not tied to population averages. What was needed was not an end to the valorized “normal” or average man, but a new norm: the normal relative body weight. That is, a norm that was normative; something not beholden to the vagaries of real-life populations and their particularities, but rather a physician-certified healthy weight range. Curiously, he excavated historical tools for the measurement. In so doing, he traffics through Davenport at least twice, to acknowledge his role in popularizing the medico-actuarial tables, and to remind himself that he too trumpeted the Quetelet Index, or what Davenport had termed “Index of Build” (Brožek and Keys 1951; Keys et al. 1972).
Conducting an analysis of several historical equations used to measure body fatness, he lands somewhat resignedly on the Quetelet Index, renaming it the body mass index—BMI. He allows that “Quetelet himself did not actually advocate that ratio as the general measure of build or of adiposity” (Keys et al. 1972, p. 340), as questions of sickness and health lay outside the area of interest for the astronomer. Still, Keys became its primary booster in the medical field, claiming that “the body mass index…if not fully satisfactory” is, nevertheless, “at least as good as any other relative weight index as an indicator of relative obesity”(Keys et al. 1972, p. 339). Settling for what he considered the least fraudulent tool reads as less than a ringing endorsement. But it was a reclamation of the importance of meeting the physical proportions of the “normal” man. It would no longer be based on population averages—which were too variable. Instead, it was born from a contortion of weight profiles enacted to fit every population to the “normal” distribution.
2.4. BMI: The Strange Case of Women and BIPOC Peoples
BMI having been chosen by Keys—and two decades later, after much lobbying, the medical field broadly—the question remained as to what constituted a proper BMI. What was a healthy normative weight? For decades the answer had been shifting with the tides. But two things remained: the belief that men the world over should have the same white-male defined norm, despite their racial or ethnic group, and the view that women should be thinner than men.
Interestingly, for our purposes, the latter belief directly contradicts the earliest findings—those by Quetelet himself. In his original studies into the question of population weight distribution, relying on data from the late 18th century, he found that, on average, men weighed more than women. But, when considering height and age, he found that after puberty, the average woman “weighs a little more” than the average man of the same height (Quetelet 1842, p. 67).
This observation was discarded by American doctors. Rather, in the U.S. the infamous 1912 medico-actuarial tables, which would be used by doctors to create “desirable” weight tables for decades, declaimed men to be the heavier sex in adulthood. This was shuttled into the medical field, as Keys stipulates, in great measure through the analyses of the eugenicist, Charles Davenport (Keys and BroŽek 1953).
Between the eras of Davenport and Keys, there were very few studies of build carried out on women at all. Few researchers cared to include women, the poor, or non-whites in their analyses (Oppenheimer 2005). Indeed, according to the 1912 report from the joint American and Canadian Life Insurance Companies, they were only concerned with “types of risks which were likely to be of practical insurance value”. Indigent, non-white, and most female populations were unlikely to qualify, and so these “classes of purely academic interest would be excluded” (Hunter 1912, p. 385). These populations were not to represent the “normal man”. But they were, however, to be beholden to his standard.
In the U.S., the question of women’s size and stature was largely ignored prior to the medico-actuarial survey of 1912. The study relied on data from 1885–1900, with separate analyses conducted on women and men. The database contained information on 221,819 men but “less than 10,000 women”, the final tally not disclosed. Beyond the numerical mismatch was the problem of timing, since “companies did not insure women freely prior to 1890” so a handful of companies tossed more recent data (with no indication of when or from where these data were derived!) into the analyses, to bring the total number of women to 136,504 (Hunter 1912, p. 386).
They found, once again, that the average weight, and “normal weight” or “ideal weight—now identified as those persons with the lowest observed mortality risk—diverged, writing “the normal weight for any age and height may vary considerably from the average weight for that age and height” (Hunter 1912, p. 389). Noting that Germans were, on average, leading longer lives at heavier weights than Americans and Canadians, the authors intoned that “average weight in one country may not be applicable to another country, especially where there is a difference in race” (Hunter 1912, p. 389, emphasis ours).
Performing analyses on women, the authors found that, unlike in Quetelet’s study, younger men, largely in their 20s and 30s, were heavier than young women, but that this size advantage diminished with age. They also found that the sex disparity in body size was heightened among the tallest people (Hunter 1912). Nevertheless, the “ideal weight” for them too was based on mortality, and circled around women who were both thinner than men, and thinner than the average woman. By the mid-20th century, surveys including women were becoming more common, most showing women as slimmer than men, and suggested their “desirable” weight should be lower as well (Komaroff 2016).
It should go without saying that the majority of women in these studies were white. Studies including a representative sample of non-white women were uncommon prior to the 1980s (Strings 2019). And if these women were thinner than (white) men, it may well have been because racial and religious expectations for white Christian women demanded as much. Fatness had been linked to racial inferiority (and especially Blackness) both within and outside the medical field for years. Elite white women were not only well aware of this, but they were also likely to promote these so-called racial differences in build to prove their own superiority over women of color (Strings 2019).
Still, beginning in the 1980s, when it dawned on physicians that non-white people should be included in studies, they found (unsurprisingly) that women of color—Black, Latine, and Indigenous—were heavier on average than white women. By the late 90s, after much back and forth, the medical field worldwide agreed to a universal standard of “obesity” being a body mass index of 30 or greater. Very little is known about how this became the global gender-and-colorblind standard. But its announcement and the subsequent realization that women of color were still often heavier than this standard sparked a panic that far outstripped the supposed size of their “threat” to the public health (Campos et al. 2006; Saguy and Almeling 2008). It also triggered several initiatives to fix the errant fat bodies of women of color—with a great focus on Black women, owing to their “excessively” high BMIs (Strings 2015).
Correlative analyses abounded. Those treating fat women of color, and especially fat Black women, like ticking time bombs became all the rage between the early 00s and the late 2010s (Boggs et al. 2011; Masters et al. 2013b). A growing number over time focused on co-morbidities—or chronic health conditions considered to be associated with obesity—rather than mortality. Type 2 diabetes (T2D) was an intense focus, largely because obesity has long been thought to be a crucial risk factor for diabetes and pre-diabetes. Indeed, by 2022, a paper featured in the NIH’s National Library of Medicine, finally made the ecstatic claim that elevations in BMI, above the white and male norm, cause insulin resistance (Klein et al. 2022). Yet, we have found very little evidence of researchers examining the intersectional relationship between gender, race, and BMI with any T2D, or any other health condition. Most of these studies assumed the “normal” weight standard should be applied to all populations, and did not investigate the specific relationship between race/gender/BMI and a given chronic illness.
This paper works to fill this gap in the literature. Specifically, we examine the following: What is the relationship between BMI and T2D for women? Is the association stronger for women than men? When we take an intersectional approach, do we find that the association between BMI for Black and Latine women diverges from that of White women?
3. Materials and Methods
To investigate these associations, we relied on the National Health and Nutrition Examination Survey (NHANES). NHANES is a long-running, repeated cross-sectional survey of non-institutionalized adults in the United States. It is nationally representative of the non-institutionalized population and contains comprehensive information on nutrition and health markers. Full information on the methods of NHANES is available from the Centers for Disease Control and Prevention (CDC).
The current analysis compiled data from 1999 to 2000 through 2017–2018. Data were included from participants who were 18 or older, whose self-reported race/ethnicity was non-Hispanic Black, Hispanic/Latine, or non-Hispanic White, and who participated in the laboratory assessment. This resulted in a sample of 45,365 participants.
3.1. Measures
- Race/ethnicity and sex. Race/ethnicity was self-reported. Participants’ ethnicity was categorized as Hispanic/Latine or non-Hispanic and race was also assessed. NHANES created a variable for race/ethnicity and analyzed with the following three categories: Black, White, or Latine. The Latine category combines those reporting as “Mexican American” and “Other Hispanic”. A six-category variable was created for race/ethnicity and sex categories.
- Body Mass Index. BMI information was obtained by trained NHANES personnel. Participants wore a standard examination gown and were weighed on a digital scale. Stadiometry measured height to the nearest 1/10th of a centimeter. The standard equation of weight(kg)/height(m2) was used to calculate BMI.
- Diabetes status. Glycohemoglobin was assayed from blood samples taken by trained staff/phlebotomists. Those who had hemophilia or received chemotherapy in the past 4 weeks were excluded from the blood draw procedures. Assay information and quality control procedures are available from the CDC. Participants were then divided into three risk tiers using the criteria put forth by the CDC, where normal risk = HbA1c < 5.7%, prediabetes = HbA1c 5.7–6.4%, and T2DM = HbA1c ≥ 6.5%.
- Age (covariate). Age was obtained via self-report and top-coded at 80 years.
3.2. Analytic Plan
All statistical analyses were conducted in STATA Version 16 (StataCorp LP, College Station, TX, USA). All analyses used Taylor-linearization procedures for the complex multistage sampling design and a weight variable was created to account for the combining of multiple years of NHANES following the procedure recommended by the National Center for Health Statistics. Additionally, the prefix command svy, subpop was used for analyses. Descriptive statistics of all analytical variables were calculated. To assess the associations between BMI and HbA1c level, generalized ordered logistic regressions adjusting for age and race/ethnicity were conducted in Model 1. The data violated ordered logistic regression assumptions, and therefore generalized ordered logistic regression was used. In Model 2, multiplicative interaction terms were included to assess whether the race/ethnicity category moderated the association between BMI and HbA1c level. Because non-Hispanic White men were the reference group, significant interactions indicated that the association between BMI and HbA1c level differed in that race/ethnicity and sex category compared to non-Hispanic White men. Where significant interactions were observed, the margins post-estimation command was used to calculated predicted probabilities of being in each HbA1c category by BMI level and race/ethnicity. Descriptive statistics are displayed in Table 1.

Table 1.
Descriptive statistics, NHANES 1999–2018.
4. Result
Table 2 displays associations between BMI and race/ethnicity and their interaction in predicting diabetes status. As the table shows, Black men and women and Latine men and women had higher odds of being classified with prediabetes and T2DM compared to White men. White women had lower odds of being classified with prediabetes and T2DM compared to White men.
Table 2.
Associations between body mass index, race/ethnicity and sex, and diabetes, NHANES 1999–2018.
However, as also displayed in Table 2, Model 2, these associations were qualified by a two-way interaction. There was no difference in the association between BMI and being classified as having pre-diabetes in Black men compared to White men. The associations between BMI and being classified as having pre-diabetes were weaker among all women: White women (OR = 0.98, 95% CI = 0.97–0.99), Black women (OR = 0.97, 95% CI = 0.96–0.98), and Latine women (OR = 0.98, 95% CI = 0.97–0.99). They were also weaker for Latine men compared to White men (OR = 0.98, 95% CI = 0.97–0.99).
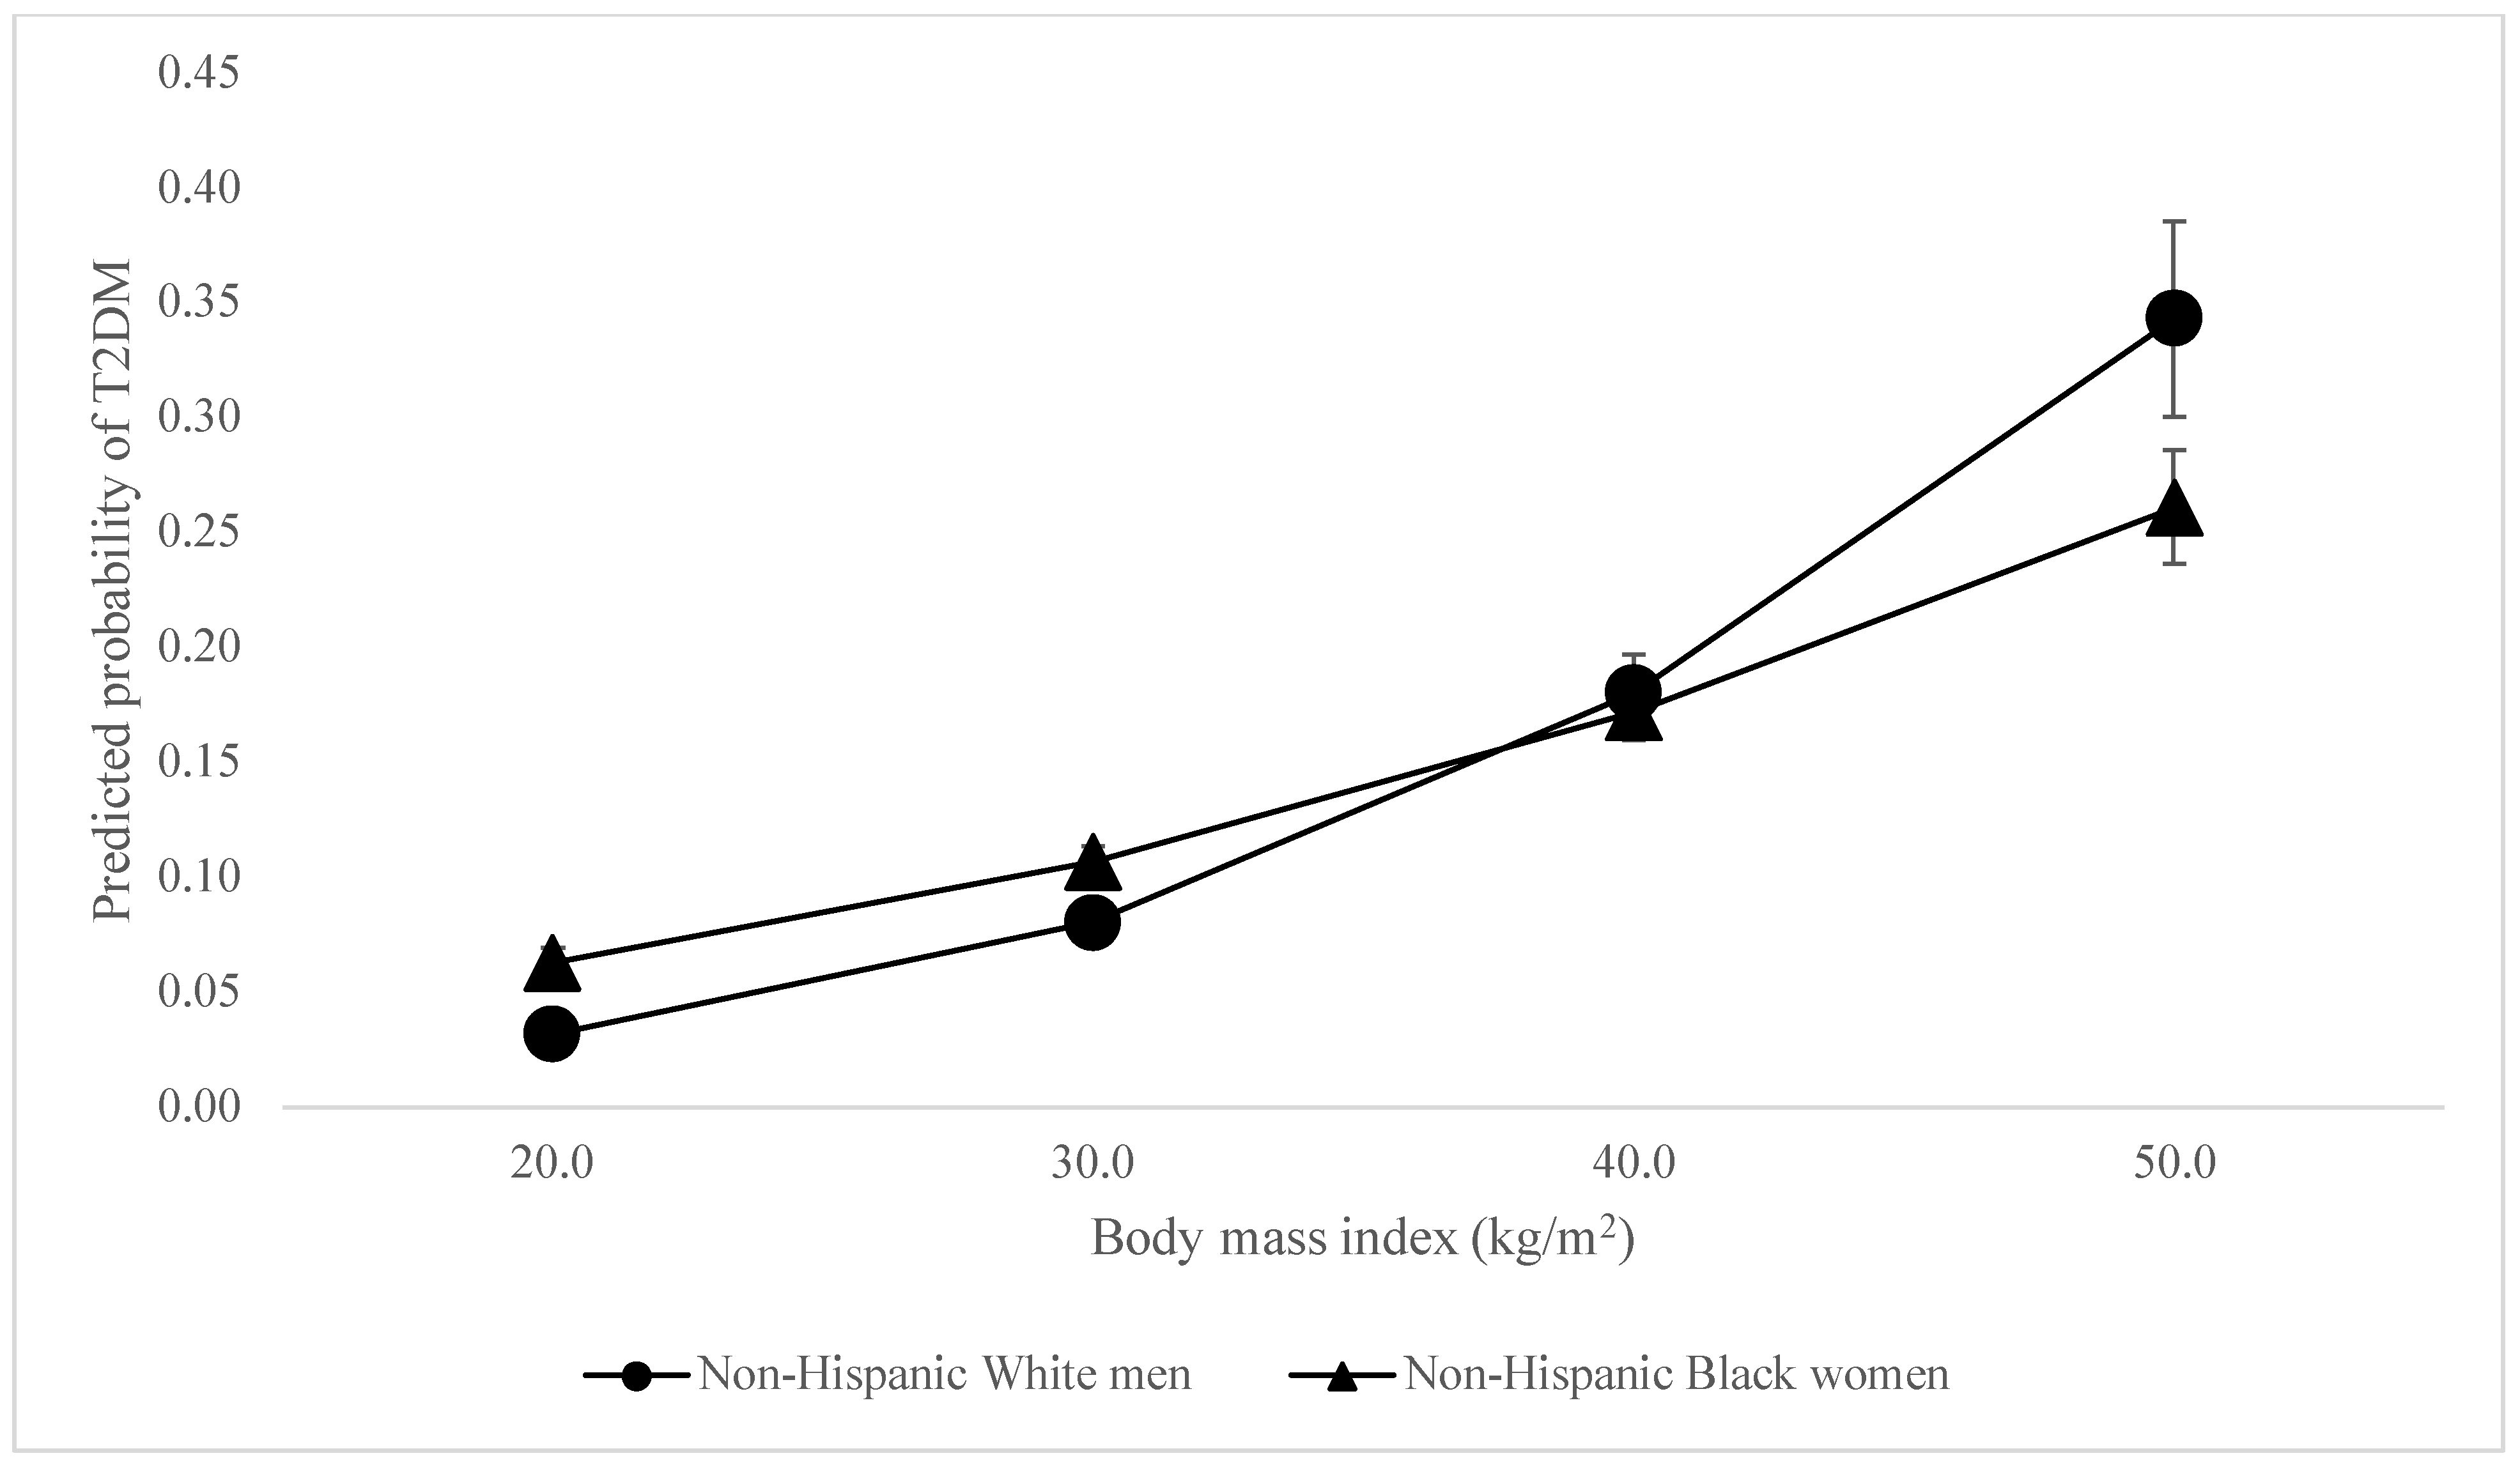
When considering the odds of T2DM, unexpectedly, there was no difference in the association between BMI and being classified as having T2DM among Black men compared to White men. The associations between BMI and being classified as having T2DM were slightly stronger (OR = 1.02, 95% CI = 1.01–1.03) among White women than White men—peculiar given that white women were least likely to be diabetic among all participants (see Figure 1). The association was slightly weaker among Latine women (OR = 0.98, 95% CI = 0.97–0.99) and men (OR = 0.98, 95% CI = 0.97–0.99) compared to White men, even though Latine women and men were 2.83 and 3.63 times as likely to have T2DM respectively. However, the association between BMI and T2DM was most dramatically weaker for Black women (OR = 0.96, 95% CI = 0.95–0.97). This reveals BMI to be less reliable in predicting diabetes among women of color—and significantly so for Black women—even as women of color had higher BMIs and were between 2.83 and 5.6 times more likely to be diabetic. The associations between BMI and T2DM differ so palpably between women of color and white men that the lines demonstrating these relationships intersect, as shown in Figure 2 and Figure 3.
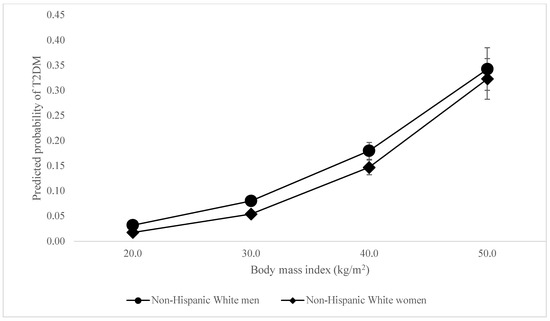
Figure 1.
Predicted probability of T2DM by BMI, White women vs. White men.
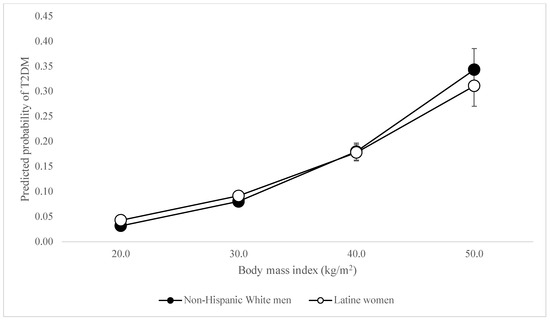
Figure 2.
Predicted probability of T2DM by BMI, Latine women vs. White Men.

Figure 3.
Predicted Probability of T2DM by BMI, Black women vs. White men.
5. Discussion
This study reveals the weakness of BMI as a predictor of health outcomes for women of color, and especially Black women. Our model shows that relying on BMI as a predictor of type 2 diabetes would lead us to predict that Latinas and Black women would have lower rates of T2DM than white men at elevated BMIs. In reality, Black and Latine women across BMI statuses in these nearly 20 years of NHANES data were nearly three, and more than five times as likely as white men to be diabetic. This is to say that BMI is a poor predictor of diabetes for women of color, and Black women in particular.
In their 2012 report, the AMA averred “[b]oth the WHO and NHLBI guidelines recognize that BMI is an indirect and imperfect measure…”, adding that associations “between BMI and adiposity…as well as disease risk…vary by age, gender, ethnicity, socioeconomic [and] status”(American Medical Association 2013, p. 3). In spite of this acknowledgement, undoubtedly one of the factors that led them to reject the notion of elevations in BMI as a disease state before reversing course a few months on, they nevertheless, like Ancel Keys, finally decided that BMI was, well, good enough for their purposes.
But why should we accept a white male norm as “good enough”? NIH data show that women are more likely to be considered “obese” than men, with Black women having BMIs ≥ 30 at rates that exceed all other populations (Overweight & Obesity Statistics—NIDDK 2021). While studies suggest women and men face weight stigma, a number of studies suggest women are more likely to be stigmatized by obesity science. Within this group, Black women bear the brunt of fatphobic consternation (Strings 2019).
And yet, our findings show that BMI is a noticeably less reliable indicator of disease risk for women of color, and especially Black women, than for white men. Studies have long indicated that the real drivers of the high rates of chronic illness for Latinas and Black women are upstream. The notable upstream and structural factors include residential segregation, food insecurity, and your garden variety gendered racial discrimination (Williams and Collins 2001; Strings et al. 2016; Smith 2021). Consider the fact that in our analysis of nearly 20 years of NHANES data, we found that Black women were more likely than white men to have diabetes at a BMI of 20 (so-called “normal weight”), yet less likely than white men to have diabetes at a BMI of 50.
We find that the white male norm is not “normal”. Not only is it a faulty predictor of disease risk—much less the actual presence of disease—for women of color, but the BMI cut-points establishing normativity themselves were based on an idealized standard of slim, white, middle-class men who lived decades ago. What, beyond bald social control, can be the reason for holding all persons to a white male norm? Especially when the norm is not even based on a white male average (as with Quetelet), but an idealized white man originally concocted by insurance companies, and only later rebooted with the Quetelet Index’s rebranded replacement, body mass index?
For insight into this, perhaps we should consider the relationship not between Blackness and fatness, but whiteness and the mean green. Per the AMA’s report, one reason to vote “no” on labeling obesity a disease was that the “‘[m]edicalization’ of obesity is intended to drive financial gains of certain providers/interests” (American Medical Association 2013, 11). How interesting then that the AMA would quite so rapidly shift gears and vote in favor of labeling obesity a disease?
One final revelation: 2012 was a landmark year for the development of medications that would ultimately be used to “treat” fatness. That year, the first semaglutide was developed by researchers at Novo Nordisk—an AMA sponsor—to treat T2DM, that being Ozempic. Ozempic works by mimicking the hormone GLP-1, which slows gastric emptying and encourages insulin secretion, making a person feel fuller, longer. While it would take several years for Ozempic and other semaglutides to be marketed as weight-loss aids, already by 2013 German researchers had shown GLP-1s can reduce “fat mass” in so-called obese rodents (Finan et al. 2013, p. 1).
To the extent that previous fat-studies scholarship reveals that lobbying on the part of weight-loss organizations in the 90s was integral to linking fatness to health even before an “obesity epidemic” was announced (Boero 2012), it should perhaps come as no surprise that the medical field may have, yet again, been willing to foreground questions of financial gain (including from drugs under development) in their decision-making process. After all, the history of America reveals that largely white and male financial gain has long trumped concerns over safeguarding the actual health and wellbeing of communities of color (Holmes and Bourgois 2013; Gazetteterrymurphy 2019).
Author Contributions
This paper was a co-conceived by the two authors. S.S. did the research and the majority of the writing for the manuscript. C.B. conducted the statistical analyses, drafted the tables and charts, and helped with the revisions to the results section. All authors have read and agreed to the published version of the manuscript.
Funding
We did not receive any funding to conduct this study.
Institutional Review Board Statement
Our analysis meets the requirements for exemption.
Informed Consent Statement
Not applicable.
Data Availability Statement
Researchers may access NHANES datasets here: https://www.cdc.gov/nchs/nhanes/index.htm (accessed on 1 April 2024).
Acknowledgments
We would like to thank A. Janet Tomiyama for her assistance in thinking through the logistics of this paper.
Conflicts of Interest
The authors declare no conflicts of interest.
References
- American Medical Association. 2013. Report of the Council on Science and Public Health [CSAPH Report 3-A-13]: Is Obesity a Disease. Resolution 115-A-12. Available online: https://www.ama-assn.org/sites/ama-assn.org/files/corp/media-browser/public/about-ama/councils/Council%20Reports/council-on-science-public-health/a13csaph3.pdf (accessed on 19 May 2024).
- Boero, Natalie. 2012. Killer Fat: Media, Medicine, and Morals in the American “Obesity Epidemic”. New Brunswick: Rutgers University Press. [Google Scholar]
- Boggs, Deborah A., Lynn Rosenberg, Yvette C. Cozier, Lauren A. Wise, Patricia F. Coogan, Edward A. Ruiz-Narvaez, and Julie R. Palmer. 2011. General and Abdominal Obesity and Risk of Death among Black Women. New England Journal of Medicine 365: 901–8. [Google Scholar] [CrossRef] [PubMed]
- Brožek, Josef, and Ancel Keys. 1951. The Evaluation of Leanness-Fatness in Man: Norms and Interrelationships. British Journal of Nutrition 5: 194–206. [Google Scholar] [CrossRef]
- Campos, Paul, Abigail Saguy, Paul Ernsberger, Eric Oliver, and Glenn Gaesser. 2006. The Epidemiology of Overweight and Obesity: Public Health Crisis or Moral Panic? International Journal of Epidemiology 35: 55–60. [Google Scholar] [CrossRef]
- Carlyle, Thomas. 1849. Occasional Discourse on the Negro Question. Invercargill: J. Fraser. [Google Scholar]
- Davenport, Charles Benedict. 1923. Body Build and Its Inheritance. Proceedings of the National Academy of Sciences 9: 226–30. [Google Scholar] [CrossRef]
- Eknoyan, Garabed. 2008. Adolphe Quetelet (1796–1874)—the Average Man and Indices of Obesity. Nephrology, Dialysis, Transplantation: Official Publication of the European Dialysis and Transplant Association—European Renal Association 23: 47–51. [Google Scholar] [CrossRef]
- Farber, Steven A. 2008. U.S. Scientists’ Role in the Eugenics Movement (1907–1939): A Contemporary Biologist’s Perspective. Zebrafish 5: 243–45. [Google Scholar] [CrossRef]
- Finan, Brian, Tao Ma, Nickki Ottaway, Timo D. Müller, Kirk M. Habegger, Kristy M. Heppner, and Henriette Kirchner. 2013. Unimolecular dual incretins maximize metabolic benefits in rodents, monkeys, and humans. Science Translational Medicine 5: 209ra151. [Google Scholar] [CrossRef]
- Fletcher, Isabel. 2014. Defining an Epidemic: The Body Mass Index in British and US Obesity Research 1960–2000. Sociology of Health & Illness 36: 338–53. [Google Scholar] [CrossRef]
- Gazetteterrymurphy. 2019. Ramifications of Slavery Persist in Health Care Inequality. Cambridge: Harvard Gazette, October 29, Available online: https://news.harvard.edu/gazette/story/2019/10/ramifications-of-slavery-persist-in-health-care-inequality/ (accessed on 9 May 2024).
- Gil, Chantal. 2023. The Starvation Experiment. Duke Department of Psychiatry & Behavioral Sciences, May 9. Available online: https://psychiatry.duke.edu/blog/starvation-experiment (accessed on 9 May 2024).
- Gutin, Iliya. 2018. In BMI we trust: Reframing the body mass index as a measure of health. Social Theory & Health 16: 256–71. [Google Scholar]
- Heshka, Stanley, and David B. Allison. 2001. Is obesity a disease? International Journal of Obesity 25: 1401–1404. [Google Scholar] [CrossRef]
- Holmes, Seth, and Philippe Bourgois. 2013. Fresh Fruit, Broken Bodies: Migrant Farmworkers in the United States, 1st ed. With a Foreword by Philippe Bourgois. Berkeley: University of California Press. [Google Scholar]
- Hunter, Arthur. 1912. The Medico-Actuarial Investigation of the Mortality of American and Canadian Life Assurance Companies. Journal of the Institute of Actuaries (1886–1994) 46: 384–94. [Google Scholar]
- Keys, Ancel, and Josef BroŽek. 1953. Body Fat in Adult Man. Physiological Reviews 33: 245–325. [Google Scholar] [CrossRef] [PubMed]
- Keys, Ancel, Flaminio Fidanza, Martti J Karvonen, Noboru Kimura, and Henry L Taylor. 1972. Indices of Relative Weight and Obesity. Journal of Chronic Diseases 25: 329–43. [Google Scholar] [CrossRef] [PubMed]
- Klein, Samuel, Amalia Gastaldelli, Hannele Yki-Järvinen, and Philipp E. Scherer. 2022. Why Does Obesity Cause Diabetes? Cell Metabolism 34: 11–20. [Google Scholar] [CrossRef] [PubMed]
- Komaroff, Marina. 2016. For Researchers on Obesity: Historical Review of Extra Body Weight Definitions. Journal of Obesity 2016: 2460285. [Google Scholar] [CrossRef] [PubMed]
- Kyle, Theodore K., Emily J. Dhurandhar, and David B. Allison. 2016. Regarding Obesity as a Disease: Evolving Policies and Their Implications. Endocrinology and Metabolism Clinics of North America 45: 511–20. [Google Scholar] [CrossRef] [PubMed]
- Masters, Ryan K., Daniel A. Powers, and Bruce G. Link. 2013a. Obesity and US Mortality Risk Over the Adult Life Course. American Journal of Epidemiology 177: 431–42. [Google Scholar] [CrossRef] [PubMed]
- Masters, Ryan K., Eric N. Reither, Daniel A. Powers, Y. Claire Yang, Andrew E. Burger, and Bruce G. Link. 2013b. The Impact of Obesity on US Mortality Levels: The Importance of Age and Cohort Factors in Population Estimates. American Journal of Public Health 103: 1895–901. [Google Scholar] [CrossRef]
- Mechanick, Jeffrey I., Alan J. Garber, Yehuda Handelsman, W. Timothy Garvey, Dennis M. Beir, Nancy J. V. Bohannon, George A. Bray, Michael A. Bush, John Gary Evans, and Daniel L. Hurley. 2012. American Association of Clinical Endocrinologists’ Position Statement on Obesity and Obesity Medicine. Endocrine Practice 18: 642–48. [Google Scholar] [CrossRef] [PubMed]
- Müller-Wille, Staffan. 2014. Linnaeus and the Four Corners of the World. In The Cultural Politics of Blood, 1500–1900. Berlin and Heidelberg: Springer, pp. 191–209. [Google Scholar] [CrossRef]
- National Heart, Lung, and Blood Institute. 2013. Managing Overweight and Obesity in Adults: Systematic Evidence Review from the Obesity Expert Panel; Bethesda: US Department of Health and Human Services, National Institutes of Health.
- Oppenheimer, Gerald M. 2005. Becoming the Framingham Study 1947–1950. American Journal of Public Health 95: 602–10. [Google Scholar] [CrossRef]
- Overweight & Obesity Statistics—NIDDK. 2021. National Institute of Diabetes and Digestive and Kidney Diseases. September. Available online: https://www.niddk.nih.gov/health-information/health-statistics/overweight-obesity (accessed on 8 May 2024).
- Pray, Rachel, and Suzanne Riskin. 2023. The History and Faults of the Body Mass Index and Where to Look Next: A Literature Review. Cureus 15: e48230. [Google Scholar] [CrossRef]
- Quetelet, Adolphe. 1842. A Treatise on Man and the Development of His Faculties. Edinburgh: W. and R. Chambers. [Google Scholar]
- Rasmussen, Nicolas. 2019. Downsizing Obesity: On Ancel Keys, the Origins of BMI, and the Neglect of Excess Weight as a Health Hazard in the United States from the 1950s to 1970s. Journal of the History of the Behavioral Sciences 55: 299–318. [Google Scholar] [CrossRef] [PubMed]
- Rose, Todd. 2016. How the Idea of a ‘Normal’ Person Got Invented. The Atlantic (Blog). February 18. Available online: https://www.theatlantic.com/business/archive/2016/02/the-invention-of-the-normal-person/463365/ (accessed on 9 May 2024).
- Rosen, Howard. 2014. Is Obesity A Disease or A Behavior Abnormality? Did the AMA Get It Right? Missouri Medicine 111: 104–8. [Google Scholar] [PubMed]
- Saguy, Abigail C., and Rene Almeling. 2008. Fat in the Fire? Science, the News Media, and the ‘Obesity Epidemic’2. Sociological Forum 23: 53–83. [Google Scholar] [CrossRef]
- Smedley, Audrey. 1993. Race in North America: Origin and Evolution of a Worldview. Boulder: Westview. [Google Scholar]
- Smith, Nicholas C. 2021. Black-White disparities in women’s physical health: The role of socioeconomic status and racism-related stressors. Social Science Research 99: 102593. [Google Scholar] [CrossRef] [PubMed]
- Strings, Sabrina. 2015. Obese Black Women as ‘Social Dead Weight’: Reinventing the ‘Diseased Black Woman’. Signs: Journal of Women in Culture and Society 41: 107–30. [Google Scholar] [CrossRef]
- Strings, Sabrina. 2019. Fearing the Black Body: The Racial Origins of Fat Phobia. New York: NYU Press. [Google Scholar]
- Strings, Sabrina. 2023. How the Use of BMI Fetishizes White Embodiment and Racializes Fat Phobia. AMA Journal of Ethics 25: 535–39. [Google Scholar]
- Strings, Sabrina, Yamini K. Ranchod, Barbara Laraia, and Amani Nuru-Jeter. 2016. Race and sex differences in the association between food insecurity and type 2 diabetes. Ethnicity & Disease 26: 427. [Google Scholar]
- The Seven Countries Study—Countries & Cohorts. n.d. Seven Countries Study|The First Study to Relate Diet with Cardiovascular Disease. (Blog). Available online: https://www.sevencountriesstudy.com/about-the-study/countries/ (accessed on 2 April 2024).
- Williams, David R., and Chiquita Collins. 2001. Racial Residential Segregation: A Fundamental Cause of Racial Disparities in Health. Public Health Reports 116: 404–16. [Google Scholar] [CrossRef]


Disclaimer/Publisher’s Note: The statements, opinions and data contained in all publications are solely those of the individual author(s) and contributor(s) and not of MDPI and/or the editor(s). MDPI and/or the editor(s) disclaim responsibility for any injury to people or property resulting from any ideas, methods, instructions or products referred to in the content. |
© 2024 by the authors. Licensee MDPI, Basel, Switzerland. This article is an open access article distributed under the terms and conditions of the Creative Commons Attribution (CC BY) license (https://creativecommons.org/licenses/by/4.0/).