Article

Analyzing the Emotions That News Agencies Express towards Candidates during Electoral Campaigns: 2018 Brazilian Presidential Election as a Case of Study

by
Rogerio Olimpio da Silva
1,
Juan Carlos Losada
1,* and
Javier Borondo
2
1
Complex System Group, ETSIAAB, Universidad Politécnica de Madrid, Avda Puerta de Hierro 2-4, 28040 Madrid, Spain
2
Departamento de Gestión Empresarial, Universidad Pontificia de Comillas ICADE, Alberto Aguilera 23, 28015 Madrid, Spain
*
Author to whom correspondence should be addressed.
Soc. Sci. 2023, 12(8), 458; https://doi.org/10.3390/socsci12080458
Submission received: 1 June 2023 / Revised: 5 August 2023 / Accepted: 7 August 2023 / Published: 17 August 2023
(This article belongs to the Special Issue Elections and Political Campaigns in Times of Uncertainty)

Abstract

:
Since online social networks play an increasingly important role in the final voting decision of each individual, political parties and candidates are changing the way of doing politics and campaigning, increasing their digital presence. In this paper, we propose a methodology to analyze and measure the emotions that news agencies express on social media towards candidates and apply it to the 2018 Brazilian elections. The presented method is based on a sentiment analysis and emotion mining by means of machine learning and Natural Language Processing approaches such as Naïve Bayes classification and Stemming calculation. We found that if doing basic sentiment detection, nearly all posts are neutral. However, when we analyze emotions, following Ekman’s six basic emotions, we do not find neutrality but clear and identifiable emotions. Next, we present and discuss the associative patterns between news agencies and presidential candidates. Finally, since the candidate that captured the highest and most negative attention emerged victorious in the elections, we discuss the potential importance of having a social media presence, regardless of generating positive or negative emotions.

1. Introduction

A large part of today’s society barely watches live TV, even less TV-news-wise, and almost all of its updates on the current world are obtained through the internet (Purcell et al. 2010) and, in many cases, through social networks (M. Conover et al. 2011). In general, social networks have become an important vehicle to attract visibility and aggregate supporters in political speeches (Ali et al. 2021). Twitter has become famous as the leading social network for news consultation (Kwak et al. 2010) and has influenced political mobilizations, campaigns, and recent protests (Morales et al. 2012). According to Braha (2012), social networks have helped to spread civil unrest news events and social influence quickly around the globe, and this is expected to increase with the number of people involved in social unrest. González-Bailón et al. (2011) have studied messages on Twitter related to protests and have highlighted the important role of social networks in the growth of protests.
Beyond ordinary people who post content based on what they consider the truth, filled with their personal opinions and intentions, social networks are also widely used to broadcast news from the press. Those renowned companies already have a certain respect and backing from society in general and their content consumers, who can spread the information by multiplying the audience (Borondo et al. 2015). The power of the press has become amplified with the advent of social networks, posting headlines, explaining quotes, and disseminating complete articles through specific comments. It has become essential for news agencies to have a repertoire on social media, providing headlines, summaries, and complete articles. Braha and De Aguiar (2017) suggested the growing role of social influence in shaping peoples’ behaviors and actions in a variety of real-life situations, including voters’ electoral decisions.
Thus, attracting an audience that grows daily with more people interested in brief and instantaneous information is challenging. For this reason, nowadays, news outlets post headlines on Twitter with a link to the full story on their website. Most people will just read the headline in the post and will not access the content behind the link to the whole story. In other words, they will primarily base their knowledge on the content of the headline. In most cases, they would read only the story’s beginning without reaching the end or analyzing the full content (Yadamsuren and Erdelez 2011).
The power of spreading the news on social networks cannot be denied. The propagation of news was once limited by the print media, then increased its potential audience through the television media, and currently has no barriers through social networks. In 1999, printed newspaper circulation was around 7.25 million copies daily (Folha n.d.). Currently (on 22 July 2023), an online newspaper such as Folha de SP has 8.8 million followers only on Twitter, an uncountable amount of content republishing, and countless internet accesses from subscribers and non-subscribers consulting the page several times a day. The out-degree of a news channel like this can have an extremely big audience, impacting people’s knowledge and decision making, directly and indirectly (Olimpio da Silva 2017). Each year, the global use of social networks grows considerably. In 2023, there are around 4.8 billion social media users worldwide, representing 59.9% of the global population and 92.7% of all active internet users are present on social media (Search Engine Journal n.d.). In Brazil, social media usage is similarly prolific, with at least 171.5 million Brazilians as active users on social media, comprising 79.9% of the country’s population (Marketing4Ecommerce n.d.).
Although unrelated to news agencies, another aspect that has grown a lot lately is the automatic interpretation of texts, content, and a sentiment analysis in texts with Natural Language Processing (NLP). It works through monitoring the automation of posts’ sentiments, signaling systems, and professionals with the result of the monitoring (Sufi and Khalil 2022).
By the way, NLP is an area within Artificial Intelligence that addresses the processing of natural language understanding. First presented by Allen (1995) as a language understanding assessment system, computational models help enable effective communication between person and machine. It is seeking each new advance to improve person–machine–person communication, improving the ways of interpreting and representing the understanding of the interpreted content. Within a Social Network Analysis (SNA), the study area is expected to exist with the automated monitoring of messages on social networks for commercial purposes. Companies follow what their customers, and the general public, say about their products on social media (Perakakis et al. 2019), which makes them able to calculate product decisions based on insights from these analyses. As NLP advanced, what was initially performed by people became increasingly automated, including security and disaster monitoring levels (Sufi and Khalil 2022).
One of the most used and trustful machine learning algorithms within the NLP is the classification using Naïve Bayes, derived from the “Bayes Theorem” (Murphy 2006). This form of classification is based on the categorization of texts based on the frequency of the words used. It receives the name “naïve” because of the naïve characteristic, disregarding the relationship between the different parameters or features and not taking into account the correlation between additional factors of each term (Rish 2001). It has become well-known and one of the most used algorithms for being easy to implement, scalable, and having excellent results. But even with the emergence of other forms of a sentiment analysis, such as neural networks and Support Vector Machine (SVM), the Naïve Bayes method remains among the most respected and widely used algorithms for a sentiment analysis (Ahuja and Sharma 2022; Kaur 2022).
On the other hand, there is another NLP technique to identify emotions with exemplary efficiency—the Stemming process. It consists of a rule-based approach that converts words into their root word (stem), properly removing prefixes and suffixes but ensuring that the root (lemma) belongs to the language (Snowball) and calculating the sum of stems or roots inside a phrase.
In the current literature, there are several works that involve a sentiment analysis on social networks’ data. Saxena et al. (2022), analyzed the suitability of several techniques, and Chong et al. (2014) explored a sentiment analysis on tweets. Further, Kratzwald et al. (2018) conducted a relevant work in emotion mining, employing deep learning to distill emotions and formulate decision inputs. In the intersection of a sentiment analysis and emotion mining, reference can be made to a study by Roberts et al. (2012), which analyzed tweets about the FIFA World Cup. When the scope is expanded to include the application of NLP in political scenarios, notable studies include those by Buntoro et al. (2021) and Budiharto and Meiliana (2018), focusing on the Indonesian elections, and Ceron et al. (2015), where a sentiment analysis was employed to investigate internet posts monitoring election campaigns. Moreover, specifically in Brazilian Portuguese, the works of de Oliveira and Merschmann (2021) apply, who worked with a sentiment analysis and opinion mining to identify the efforts for the language, and Souza and Souza (2021), who performed a sentiment classification analysis on reviews from Brazilian Twitter users. Nonetheless, our work focuses on analyzing posts from news agencies about presidential candidates, extracting relations between the media and the candidates, and analyzing sentiments, emotions, and possible positioning from the news agencies, which brings a more specific and focused approach. A detailed explanation of the Brazilian political scenario during this research can be found in Appendix A.
We analyzed the sentiments of news headlines from news agencies, finding mostly neutral sentiments. Despite this fact, it is notorious that we are in a time when political polarization has been a constant in several nations, including Brazil (M. Conover et al. 2011; Soares et al. 2019), mainly with the dynamics of having a second round (Olivares et al. 2019). The polarization achieved such a level in a way that whatever information is posted about a politician causes the most extreme emotions in people (Recuero et al. 2020). Hence, in this paper, we try to shed light on the following question: If we analyze the posts from news agencies regarding the candidates of the 2018 Brazilian election, where sentiments are mostly null, would emotions still be null? To answer this question, we have analyzed posts from news agencies, searching for patterns of emotions that can suggest a position of one news agency towards each candidate.
The main contribution of this research is a methodology to analyze the emotions and sentiments behind the posts of official news agencies on Twitter to infer their relation and their emotions towards each candidate. One of the novelties of the research lies in the use of techniques to measure emotional coherence in news agency posts regarding each candidate, providing an alternative model for measuring associative pattern support based on the consistent alignment of emotions in news agency posts for each candidate.
This paper is organized as follows. In Section 2, we describe the datasets used in our analysis. Section 3 describes the methodology, outlining the procedures and techniques used in our research. In Section 4, we present the results of the paper, highlighting the key findings. Finally, in Section 5, we discuss the results and present the conclusions.

2. Datasets

The corpus of this research, referred to in this document as the research dataset, was acquired by extracting Twitter posts from 24 June 2018 to 1 April 2019, comprising the period before, during, and after the 2018 Brazilian electoral campaign. To generate the dataset, we filtered tweets posted on Twitter, only including the posts from news agencies informing about the primary Brazilian elections. The generated dataset is and will be relevant for researchers exploring political contexts through social networks, even if the data are old, because this election presented a high polarization and most of the discussion took place through Twitter. In fact, it is actually very relevant, mainly because candidate Bolsonaro still stands as one of the main topics in the Brazilian social networks, where news agencies are constantly reporting about him.
Considering what was said by the linguist Sinclair (2005), the corpus is a collection of language texts using electronic capture, chosen by external criteria to represent, as far as possible, a language or linguistic variety as a data source for linguistic research. According to Leech (2014), a corpus represents a compilation of machine-readable texts generated in a natural linguistic environment, encompassing representative and balanced samples related to certain factors. These factors could include various genres, such as newspaper articles, literary fiction, spoken speeches, blogs, journals, and legal documents. In order to analyze the characteristics of sentiment and emotions in headlines, it is necessary to have a vast and reliable dataset with qualitative and quantitative linguistic reliability.
The research dataset was formed by posts written by news agencies on Twitter about the pre-candidates and candidates, totaling 53,932 records. Note that all these news agencies are official and renowned companies such as newspapers, TV channels, magazines, internet portals, etc.
These tweets are mainly composed of posts from news agencies on Twitter about the pre-candidates and candidates. These tweets consist mainly of news headlines.
We first considered print and online newspapers, TV stations, radio stations, and the media to choose the list of the primary official news agencies on Twitter. Next, we took into consideration which accounts had the highest number of followers (in-degree) and posts made, finally selecting the top 35 primary official news agencies. The complete list can be seen in Appendix B.
Next, we built an ETL (Extract, Transform, and Load) process to produce the research work database, which was developed in Python language, and used the Twitter API to extract daily posts from the select source list of news agencies. The data were processed using a data cleanse and mining processes, and the records were inserted into a MySQL database. In addition, the dataset was submitted to a data wrangling process, where the names of people who were equal to the candidates but were not candidates were removed, such as cleaning internet links. The data preparation was carried out through a data cleanse and mining processes, working on the headlines extracted from Twitter to prepare the tables for processing.
During the data mining process, the work proceeded with the removal of special characters because the source was in the Brazilian Portuguese language. As a language derived from Latin, it has an accentuation that needs to be changed for regular letters. For example, “á” and “ã” are required to become only “a” to be rightly considered for the NLP machine learning. In the same way, special characters and emoticons, commonly and widely used in internet communications, need to be removed, resulting in a rough text message. Generally, news agency posts are headlines of entire news content on their official platform, portal, or website. With the need to point to the official news, these posts have a link to the news. These links must also be removed as part of the data mining process.
After the data wrangling, data cleansing, and data mining, the dataset was enriched with new calculated fields with several different algorithms and equations. These methods are described in the next section.
The source codes, working datasets, and training datasets used in this research are available upon request.

3. Methodology

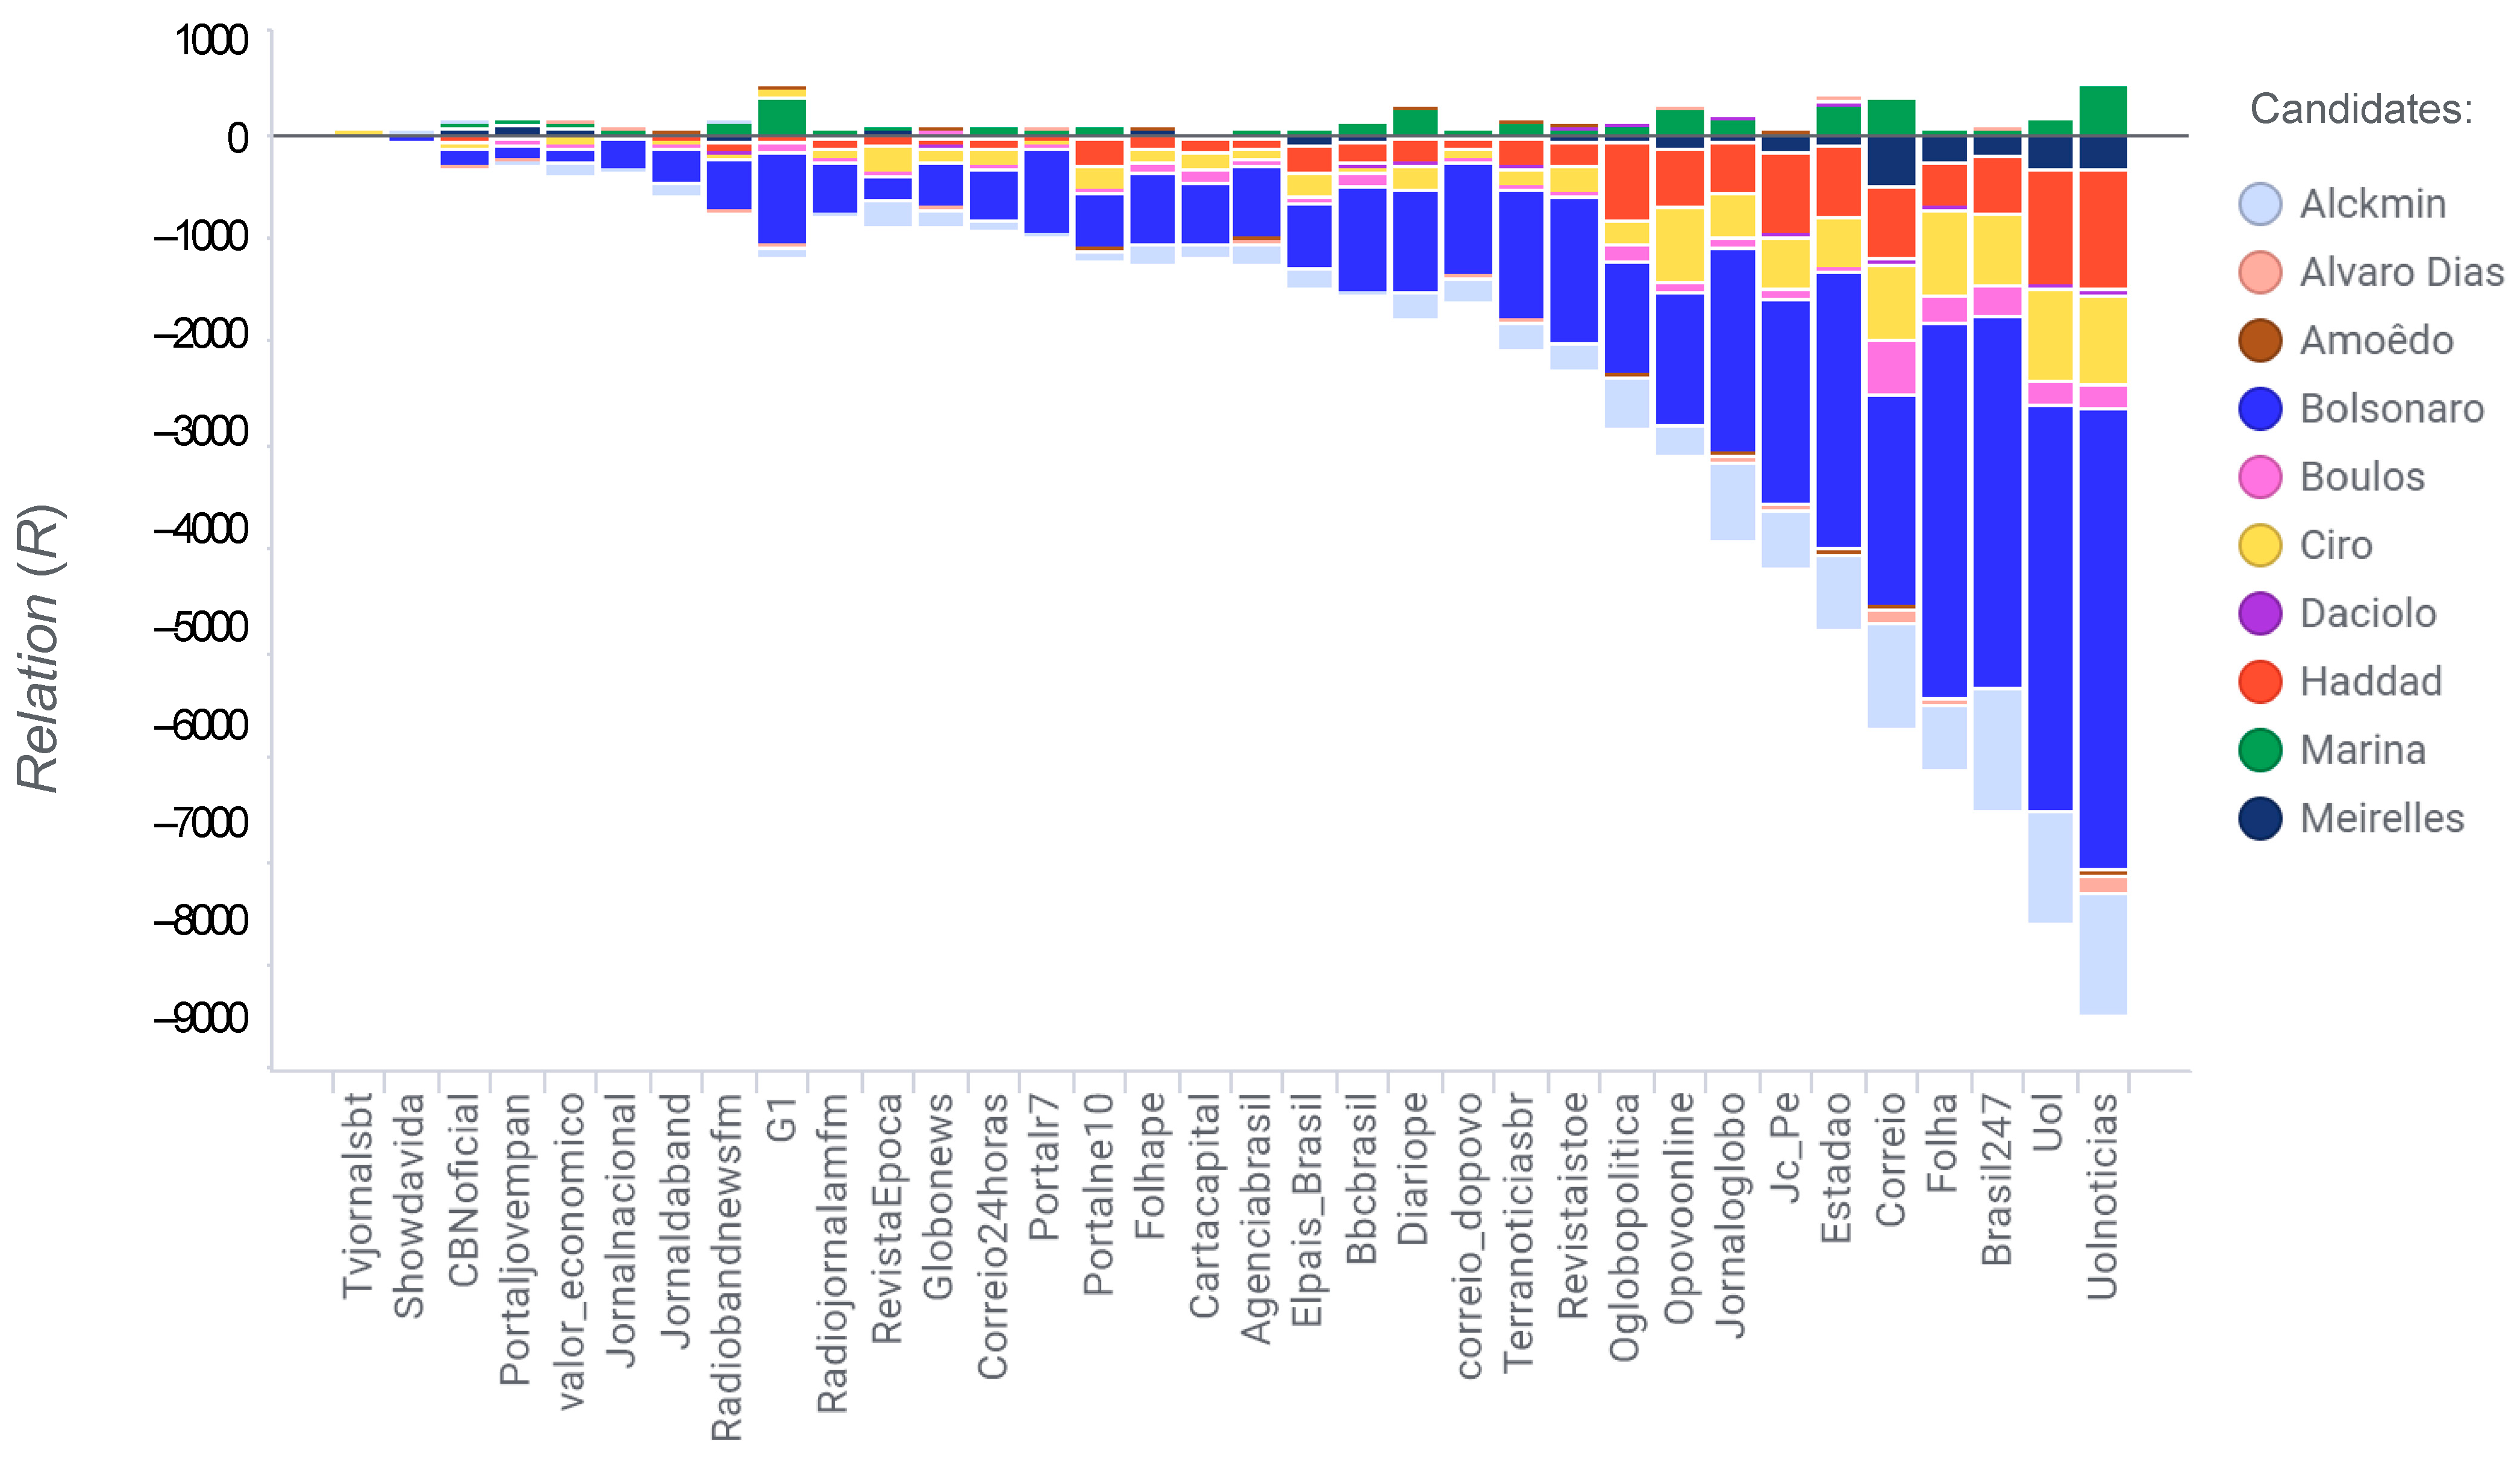
3.1. A Framework to Measure Support and the Relation between News Media and Candidates

In this work, we aim to analyze and understand the support of news agencies towards candidates. To do so, we will analyze the emotions that each agency shows towards each candidate and evaluate if we observe a consistency of similarity during the campaign.
Currently, in the literature, there is an absence of a globally accepted model that measures the opinion expressed by news agencies about political candidates through posts on social networks. Thus, this work proposes a simplified model with parameter weights using variables obtained through NLP. Similar to dynamic opinion models, identifying the position of media towards political candidates involves challenges, requiring a complex system modeling with weights of importance for the different variable elements as a multi-attribute decision-making framework. According to previous papers, e.g., (Anderson and Ye 2019; Borondo et al. 2014), the dynamical models with weighted parameters are suitable for estimating and explaining political opinion dynamics, even with fewer parameters than might be necessary to cover every single aspect of the system.
When, in this paper, we refer to Support, we aim to measure the degree of positive or negative sentiment that the author of the tweet is expressing towards the candidate that is being mentioned. Thus, in a first step, we compute the support of each tweet posted by the news agencies towards the candidate being mentioned. Then, in a second step, we introduce the term Relation that measures the association from a news agency towards a candidate. To compute the Relation from a news agency towards a candidate, we aggregate the Support obtained from all the posts written by a given news agency mentioning a given candidate.
In the two following subsections, we will expand the definition of both terms and fully describe the methodology followed to compute them.

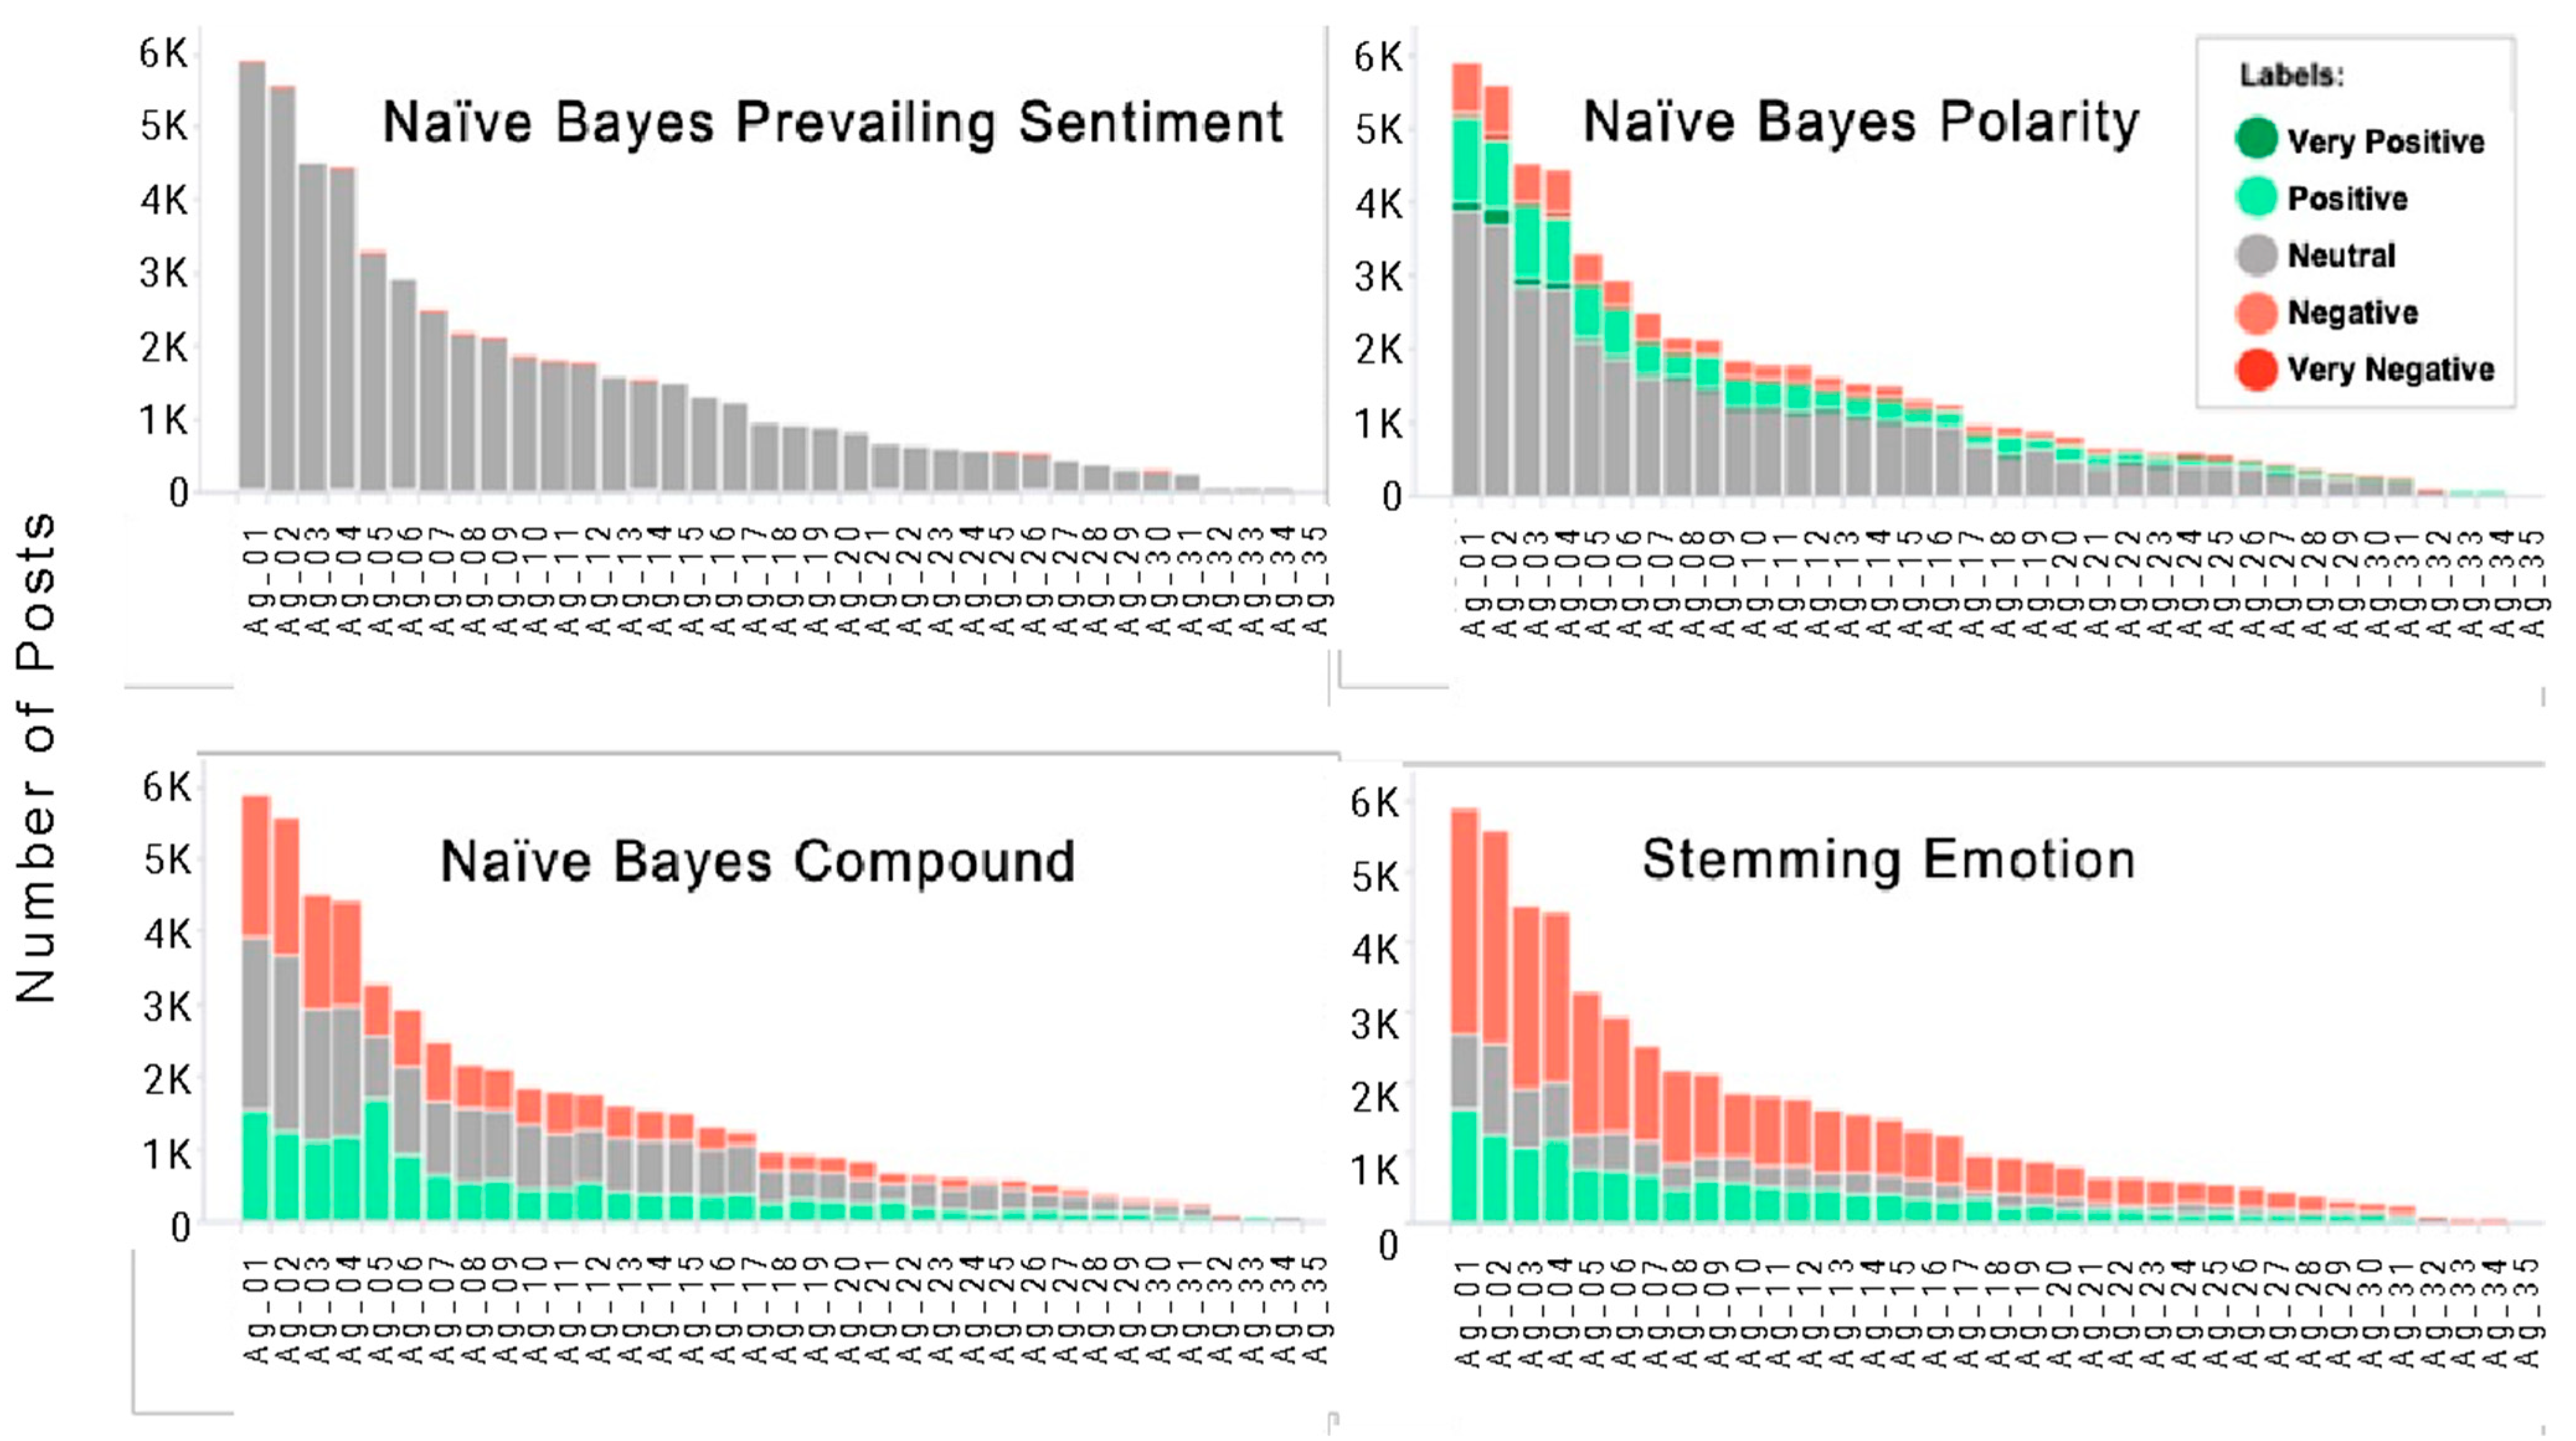
3.2. Analyzing Sentiment and Emotions

One of our objectives is to classify each tweet in the dataset based on the underlying sentiments and emotions through different techniques related to NLP. We employ two distinct and renowned methods for analyzing and detecting emotions—Naïve Bayes and Stemming. The Naïve Bayes classifier has been proven as successful in tasks involving text classification. Stemming identifies and obtains the root of a word, discarding prefixes and suffixes, thereby offering similar semantic interpretations for variant stems. In a second step, we use a training dataset that links each of these stems with one or more emotions.
In order to successfully implement and train both methods, additional databases for training each method are required. To train the Naïve Bayes classifier, we used a training dataset, co-developed by computing and psychology students for a graduation research project in Brazil (Ruby 2013). This dataset has been utilized by over 6000 students on a training platform (Udemy n.d.). For the Stemming method, we needed a dataset that relates the stem of words to the emotions. Thus, for this purpose, we used the widely accepted training dataset assembled for Kaggle challenges (Ghafariyan 2019) and procured it in its entirety to allow a full content analysis and emotional training with word roots. In this dataset, each word root was assigned to one or more emotions.
To develop the Naïve Bayes classification model, we used the Multinomial Naïve Bayes algorithm and it was used to generate estimations of the underlying sentiment and emotions of each tweet. The features used by the classificator regard the frequency of words in the training dataset. Then, using the pre-trained terms from the training dataset, every tweet in our research database underwent the Naïve Bayes classificator, obtaining the following attributes as output: emotions detected, prevailing sentiment (positive, neutral, and negative), sentiment polarity, subjectivity, and compound. The prevailing sentiment score results from obtaining the strongest sentiment from the polarities’ scores, while the modulated sentiment was obtained by normalizing the values of sentiments by taking the absolute value, and rescaling the values to a range between −1 and +1.
In addition to the Naïve Bayes method, we deployed the Stemming methodology for a comparative analysis of emotion detection. The process involves converting each word into its stem, which is then associated with one or more emotions. Each post in the research database is analyzed individually, with the emotional values linked to the stems added to the research worktable. Consequently, each entry in the research database receives a normalized total score for each emotion ranging between 0 and 1. Then, by aggregating the scores of positive and negative emotions, we can obtain a polarity score. The Snowball Stemming algorithm was selected due to its high efficacy in processing non-English languages, including Portuguese.
The full process for both methods is illustrated in Figure 1 and further explained in Appendix C.
Let us illustrate both methods with the following sentence: “The candidate gave a plain response to the reporter’s question.” This sentence is classified as neutral by the Naïve Bayes sentiment analysis. This is because the terms ‘candidate’, ‘gave’, ‘response’, to ‘reporter’s’, ‘question’, and ‘plain’ do not inherently carry positive or negative sentiment, leading to an overall neutral evaluation. However, when applying the Stemming method to obtain the underlying emotions, the root word ‘plain’ signifies something unremarkable or lacking in excitement—what is related to a negative emotion. Consequently, although the sentence’s sentiment is deemed neutral, it transmits an emotion, possibly interpreted as negative, to its audience. This example demonstrates how even a sentence with neutral sentiment can reveal emotional content through a variation in the analytical tool.
The Naïve Bayes classification provides subjectivity, polarity, and compound attributes. In 0.13% of the cases, there is an agreement between polarity and compound results, being either positive or negative. Furthermore, in a mere 0.08% of the cases, this combination corresponds with a low subjectivity. These observations correspond with the ones where the sentiment of the text is definitively positive or negative. This subset was utilized as a benchmark to compare Naïve Bayes and Stemming, using posts in Portuguese and English. The comparison showed that the most effective method for our dataset to analyze emotions was the “Stemming in Portuguese” approach, boosting a 90.70% accuracy.

3.3. A Model to Measure News Agencies’ Support or Non-Support

Next, we will use the results obtained from the Naïve Bayes classifier and the Stemming method to measure the support and relation from news agencies towards each candidate. To this end, we will define formulas to compute Support (S) and Relation (R). Intuitively, the S metric indicates whether the author of the post is demonstrating a positive or negative sentiment towards the candidate mentioned. In order to compute S, we operate on the premise that the author of the headline infuses in each post a set of emotions representing either a positive or negative sentiment as aggregated from the post, despite that final emotion being intentional or accidental. Thus, the value of S for each post is given by the following equation:
S   ( p o s t ) = ( α 1   P s + α 2   | M s | + α 3   C o + α 4   P o + α 5   S p )   S u  
where P s is the prevailing sentiment [from −2 to +2], M s is the modulated sentiment [from −1 to +1], C o is the compound [from −1 to +1], P o is the polarity [from −2 to +2], S p is the stemming polarity (from −5 to +5], and S u is the subjectivity [from +0.5 to +2]. Furthermore, the α 1 5 are balanced weights according to the importance of each parameter as a level of significance. The parameter subjectivity is the only weight multiplying instead of summing because the more objective a post is, the more it intends to communicate a message. Note that “Stemming polarity” is the only term of the equation obtained through the Stemming calculation method, while all the other attributes were obtained through the Naïve Bayes classification.
After obtaining the S value for each tweet indicating the positioning of each post towards the mentioned candidate, we can group the scores by news agency and candidate to obtain the score R that measures the positioning of each agency towards each candidate. The value of R from one agency towards one candidate can be expressed as
R ( a g e n c y ,   c a n d i d a t e ) = S ( a g e n c y ,   c a n d i d a t e )  
In essence, the Relation (R) represents the cumulative emotion of all posts from a single news agency concerning a specific candidate. It mirrors the longstanding position of each news agency with respect to a candidate—be it supportive or unsupportive—based on the consistent emotional undertones exhibited over a period. A detailed breakdown of this is presented in Appendix B.

4. Results

In this section, we summarize the main results derived from our methodology to analyze the relation between news agencies and candidates on social media.
We begin by comparing the results obtained from the different methods to analyze the sentiments and emotions of the posts from the news agencies described in the previous section.
The Relation (R) results, indicating the long-standing support between the agencies and the candidates, are summarized in Figure 2. The metric R (see Section 3) allows us to measure the aggregated emotion shown by each news agency towards each candidate, which shows the existence of a consistency with which the agencies have posted headlines showing negative emotions towards the same candidates. If there was a balance between positive and negative positions, the value of R would be very close to the zero line, which is not the case for most candidates. Marina is the only exception and captured the most extensive favorable support from the news agencies. In contrast, Bolsonaro has the most considerable opposition. However, overall, the media exhibited little positive emotions towards candidates, representing positive support as less than 1% of all support. The predominance of negative emotions and, consequently, S and R indicators is in concordance with some other research, such as de León and Trilling (2021), Bellovary et al. (2021), and Chmiel et al. (2011). Visualization of candidates in Figure 2 involves color-coded representation, wherein distinct hues symbolize individual candidates. For instance, the candidate Bolsonaro is allocated the color blue, red denotes the candidate Haddad, and the candidate Marina is depicted through the green.
Figure 3 presents the news agencies’ posts ordered by the decreasing quantity of posts colored by sentiments or emotions, enabling the comparison of the four different methods. As can be seen, there are differences among the methods that can be summarized as follows. In the top left panel, colors represent the prevailing sentiment. As it can be seen, nearly all posts are considered neutral. In the bottom left, the colors represent the sentiment according to the compound metric. This analysis indicates the presence of more positive and negative posts than neutral ones. At the top right panel, tweets were colored according to the polarity (from 0.1 to 0.5, positive; above 0.6, very positive; from −0.1 to −0.5, negative; below −0.6, very negative; and from 0.1 to −0.1, neutral). As it can be seen, this method indicates the presence of some positive posts and a few negative ones besides a neutral majority. Finally, at the bottom right, we have a plot colored by the Stemming calculation method. Using the Stemming method to analyze emotions, leveraging the values of each emotion according to the Snowball algorithm, provides an emotion matrix. Since Ekman (1999) classified emotions as positive or negative, we obtained the sentiment of each post.
In conclusion, we observe that the Stemming method is the one that classifies more posts into positive or negative (as green for positive and red for negative), minimizing the number of neutral posts. Thus, this method is, according to our dataset, the most suitable to detect the evidence of favoritism or opposition within each post. Subsequently, we compared the sentiments discerned via Naïve Bayes with the emotions identified through the Stemming method, discovering that posts with neutral sentiments primarily do not exhibit neutral emotions. Therefore, it is feasible for news agencies to publish content that appears neutral in sentiment while simultaneously transmitting emotional stances toward candidates.
Figure 4 reflects how the number of posts mentioning the candidates grows as the election day approaches, and that peaks, increasing the exposure for candidates on social networks, appear when relevant events occur. Accordingly, after the official nominations, where each party or coalition announced their candidate, the number of posts increased until the election, with a remarkable addition during the stabbing attack against candidate Bolsonaro. Visualization of candidates in Figure 4 and Figure 5 involve color-coded representation, wherein distinct hues symbolize individual candidates.
Figure 5 shows the negative peak of support numbers from official news agencies regarding candidates. Compared to the previous figure, if the support was neutral and there was compensation in the speeches, with positive and negative emotions, the values would be close to zero, but this is not what can be seen in this figure.
Next, we analyzed the sum of the Support (S) towards each candidate that was predominantly negative, except for the candidate Marina Silva, who received positive posts. Furthermore, Bolsonaro and Haddad, who were also the finalists for the second round, were the two candidates who received more posts with drastically negative positions, as seen in Figure 5. When the lines of Support (S) stand out from the lines of posts, it indicates that the positionings were significant or objective in the posts consistently in the daily accumulation. As could be expected, due to the negative nature of the subject, the positions of the agencies during the stabbing attack were negative. However, we have to note that the posts about candidate Bolsonaro were predominantly negative even before this event.
Finally, we can summarize the emotions expressed by each news agency towards each candidate by presenting them in radar plots that show the distribution of the emotions in posts related to the Brazilian presidential candidates, divided into six panels. Panel A of Figure 6 shows the average emotions expressed by all news agencies for all candidates, revealing that sadness, surprise, and fear are the most frequently used emotions in headlines. In panel B, we show the emotions from all news agencies towards the three leading candidates, demonstrating that candidate Marina captured significantly more positive emotions.
Panel C, which compares the most central agencies, indicates that despite all agencies expressing similar emotions, some agencies are more extreme and intense.
In panels D (“Globo News Agency”), E (“Folha News Agency”), and F (“Estado News Agency”), we can compare the different emotions expressed by these three agencies towards each candidate. Notably, candidate Marina receives a high number of expressions of happiness across all agencies, reflecting the positive support presented in previous figures. The top three agencies exhibit high levels of sadness, fear, and surprise, and they share similar feelings despite different distributions and levels of extremity and intensity. The Estadao agency expresses less disgust and surprise than the others; on average, all agencies post fewer expressions of happiness than other emotions.

5. Discussion and Conclusions

When a country or region faces a tonic of political polarization, social networks play an increasingly important role in the formation of society’s opinion. Therefore, the press, especially the news agencies, should remain impartial from this polarization. Thus, in this paper, we analyzed what the official news agencies have published in this respect and whether the sentiments and emotions behind their posts remain neutral. To this end, we have proposed a methodology to analyze whether there is a bias toward support and non-support from official news agencies when posting about presidential candidates. The Twitter platform was considered for this research as it is the most used communication method in social networks by official Brazilian news agencies.
Another complexity tackled in this paper was the difficulty of working simultaneously with Portuguese and English posts. To this end, we analyzed the dataset using a method based on classification with Naïve Bayes and another method based on Stemming techniques and found that in our scenario, the most efficient method to distinguish between positive and negative posts was Stemming in Portuguese texts.
We analyzed the sentiments present in the posts published by the news agencies and observed that almost all (99.87%) news have null sentiments. However, we observed that despite the sentiment being null, there are still emotions in the posts of the news agencies. Accordingly, we found non-null contents in the vast majority (99.91%), with a prevalence of more negative emotions (95.37%) than positive ones (4.53%).
We presented a model that accounts for the outcomes generated by the different NLP and machine learning techniques, initially measuring the emotion of each tweet towards a candidate and, secondly, measuring the emotional relationship from each news agency towards each candidate. Thus, in contrast with previous papers (Borondo et al. 2012) that base the relative support to candidates on regular users’ activity, we presented an alternative method and measure of support based on the coherence in the posts of news agencies. In light of our results, there was an alignment in the emotions of the posts of news agencies about the candidates in the Brazilian presidential election of 2018, with Bolsonaro capturing most of their attention and inducing the most negative emotions.
One of the main results of the paper is that the predominant emotions shown in the tweets published by official news media accounts are associated with negative sentiments. This fact may indicate that most news agencies expressed negative emotions towards most of the candidates. In this work, we only analyzed tweets that are limited in characters and therefore do not usually include quotes of the candidates. However, still, the messages of the candidates could have an impact in the tweets posted by news agencies. In polarized electoral campaigns, like this one, it is frequent that candidates focus on broadcasting negative messages about their opponents, and this could have an impact in the news published by news media accounts. We believe that this limitation could be addressed in future research, analyzing the emotions expressed by both candidates and official media accounts, and relating both analyses. Hence, in this way, we could bring light to the question of how the message and emotions expressed by political parties condition the message and emotions of the media.
Several studies analyzing social media during electoral campaigns suggest that activity on Twitter can help to predict election outcomes (M. D. Conover et al. 2011; Ceron et al. 2015; dos Santos Brito et al. 2021; Martín-Gutiérrez et al. 2018). Performing a robust analysis to evaluate the relationship between tweets and final election outcomes is beyond the scope of the paper. However, in this electoral campaign, we observe that Bolsonaro received the most negative posts from news agencies and, at the same time, was the candidate who captured most of the attention from the news agencies on Twitter. There are two possible interpretations for this divergence. The first possible interpretation is that having a big digital presence, despite being positive or negative, can positively impact the popularity of a candidate, resulting in a potential increase in the votes received. The second interpretation is related to the fact that when people make their voting decisions, they are not only influenced by official news media but also by their family and peers. Thus, a possible explanation could be that in this election, official media did not play a significant role compared to peers and non-official influencers campaigning for the candidates on Twitter. Further research should be performed in order to understand the impact that both hypotheses had on this particular election. In fact, we believe that our research can be expanded by developing new studies that analyze a wide variety of electoral campaigns, evaluating, at the same time, the impact that the attention (both positive and negative attention) from official media and from non-official accounts received by each candidate has on the final electoral outcomes.

Author Contributions

Conceptualization, R.O.d.S., J.B. and J.C.L.; methodology, R.O.d.S., J.B. and J.C.L.; software, R.O.d.S.; validation, R.O.d.S., J.B. and J.C.L.; formal analysis, R.O.d.S., J.B. and J.C.L.; investigation, R.O.d.S., J.B. and J.C.L.; resources, R.O.d.S., J.B. and J.C.L.; data curation, R.O.d.S., J.B. and J.C.L.; writing—original draft preparation, R.O.d.S., J.B. and J.C.L.; writing—review and editing, R.O.d.S., J.B. and J.C.L.; visualization, R.O.d.S., J.B. and J.C.L.; supervision, J.B. and J.C.L.; project administration, J.B. and J.C.L.; funding acquisition, J.B. and J.C.L. All authors have read and agreed to the published version of the manuscript.

Funding

This research was funded by Spanish Ministry of Science and Innovation grant number PID2021-122711NB-C21.

Institutional Review Board Statement

Not applicable.

Informed Consent Statement

Not applicable.

Data Availability Statement

The data that support the findings of this study are available on request from the corresponding author.

Conflicts of Interest

The authors declare no conflict of interest.

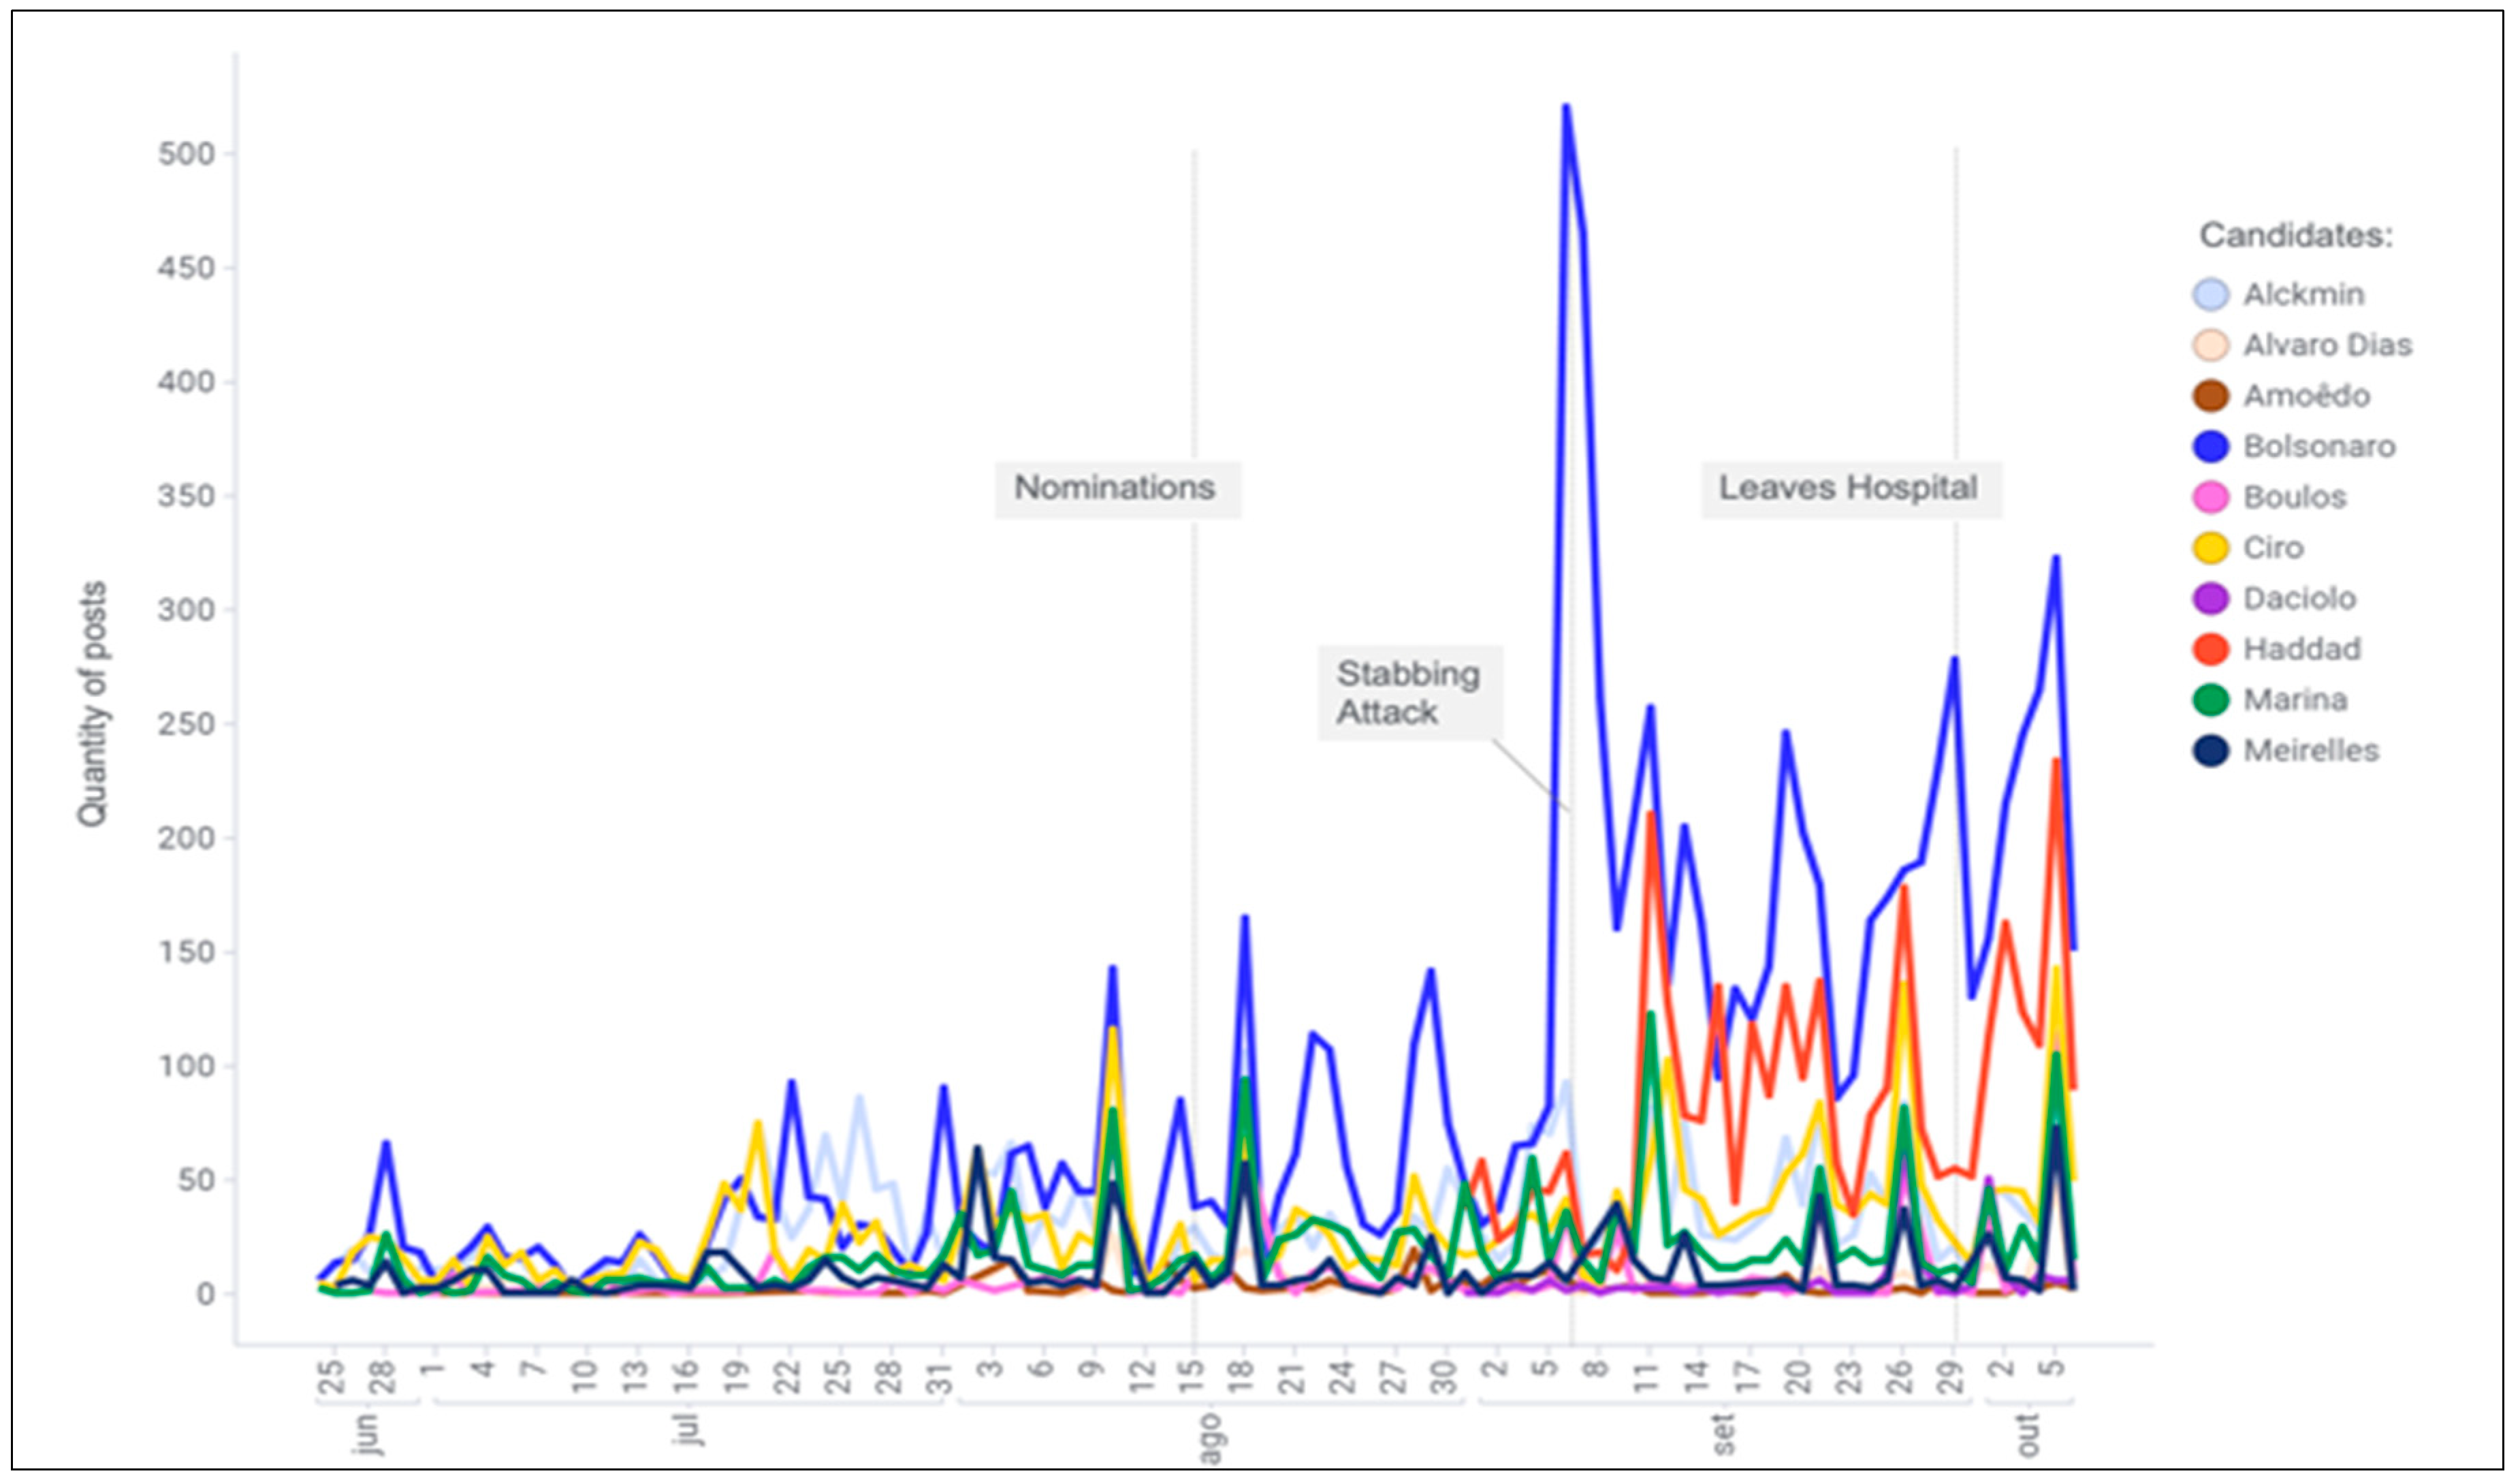
Appendix A. Political Scenario

According to Brazilian law, a pre-candidate can only declare themself a candidate on a specific date when the parties announce their candidacies in the party selection event. A few months before the official date, there was some speculation on political figures in the news around the so-called pre-candidates. This research monitoring started with the pre-candidates before the selection of parties, passing through the moment of official campaigns and the first months of government of the chosen candidate.
Brazil has 32 political parties. For the 2018 campaign, 12 candidates were running for the Presidency of the Republic, as Cabo Daciolo, Ciro Gomes, Eymael, Fernando Haddad, Geraldo Alckmin, Guilherme Boulos, Henrique Meirelles, Jair Bolsonaro, João Amoedo, João Goulart Filho, Marina Silva, and Vera Lúcia.
Moreover, as the Brazilian electoral law specified, the second round was disputed by the two top candidates: Fernando Haddad (from the PT party—Workers’ Party) and Jair Bolsonaro (from the PL party—Liberal Party).
Some critical reference dates were the beginning of the electoral campaign on August 18th, the first round of elections on 2 October, and the second round on 30 October.
Jair Bolsonaro won the election at the beginning of his term on 1 January 2019.
The 2018 election was also one of the milestones in using automated posting by robots, fooling social media algorithms, and putting fake news in evidence as reliable information. Social networks such as Facebook, Instagram, Telegram, and WhatsApp groups have been used to send content to multitudes of people (Kumar and Sebastian 2012; Soares et al. 2019).
At that time, social networks had no mechanisms to instantly stop messages’ massive sending or assess posts’ veracity, becoming, in that election, a strong influence on political opinion formation and possibly an instrument of impact for elections like in Venezuela a few years before (Morales et al. 2015).
Therefore, it would be crucial that the press publish unbiased and impartial news in their political publications through their official news agencies.

Appendix B. The Selection of News Agencies

To conduct our research, we first needed to select the official national news outlets on Twitter that would be monitored during the study period. The selection process involved the following steps:
  • Identify all national and state news agencies, including TV channels, radio stations, and newspapers.
  • Evaluation of each agency based on the number of followers, the number of historical posts, and the frequency of daily posts.
Using this information, we were able to identify the news agencies that were most relevant to our research. Our selection criteria were as follows:
Only agencies with more than 100 followers were included in the list.
Only agencies with recent posts were included in the list.
After applying these filters, we identified a total of 34 news agencies that had a relevant presence on Twitter. The list of selected agencies is presented below:
Table A1. List of selected news agencies with activity, the sum of support, and the sum of modulus of support, organized by activity.
CodeNews AgencyQuantity of PostsS∑ |S|
Ag_01Uolnoticias5865−15,198.5045,021.50
Ag_02Brasil2475541−17,482.5040,253.50
Ag_03Uol4491−14,432.0033,066.00
Ag_04Folha4394−11,148.0032,874.00
Ag_05Estadao3266−7631.0023,462.00
Ag_06Correio2907−7268.0021,000.00
Ag_07Jornaloglobo2469−6332.5018,190.50
Ag_08Jc_Pe2132−7815.5016,836.50
Ag_09Opovoonline2081−5278.0016,018.00
Ag_10G11810−2799.5013,242.50
Ag_11Oglobopolitica1762−4514.0013,222.00
Ag_12Diariope1738−3843.0012,552.00
Ag_13Terranoticiasbr1576−4051.0012,387.00
Ag_14Revistaistoe1508−4147.5011,863.50
Ag_15Bbcbrasil1453−3623.5010,308.50
Ag_16correio_dopovo1293−3421.0010,095.00
Ag_17Agenciabrasil1222−3063.509253.50
Ag_18Portalne10927−1507.507550.50
Ag_19Elpais_Brasil904−2392.006268.00
Ag_20Folhape847−2325.506352.50
Ag_21Cartacapital783−2429.005354.00
Ag_22RevistaEpoca626−1212.504200.50
Ag_23Radiobandnewsfm612−1569.504501.50
Ag_24Correio24horas571−1962.004093.00
Ag_25Globonews554−1809.503669.50
Ag_26Portalr7527−1478.503992.50
Ag_27Radiojornalamfm479−1632.503602.50
Ag_28CBNoficial419−1102.503064.50
Ag_29Jornaldaband356−1064.002562.00
Ag_30Portaljovempan283−236.001850.00
Ag_31valor_economico246−302.001889.00
Ag_32Jornalnacional212−672.501584.50
Ag_33Showdavida36−103.00233.00
Ag_34Tvjornalsbt311.0023.00
Ag_35Stjnoticias2−14.0014.00
Table A2. List of the selected news agencies. the sum of the Support (S). and the sum of the Support (S) modulus.
News AgencyQuantity of PostsS∑ |S|
Folha4394−11,148.0032,874.00
Estadao3266−7631.0023,462.00
Cartacapital783−2429.005354.00
Uolnoticias5865−15,198.5045,021.50
Jornaloglobo2469−6332.5018,190.50
RevistaEpoca626−1212.504200.50
valor_economico246−302.001889.00
Oglobopolitica1762−4514.0013,222.00
Brasil2475541−17,482.5040,253.50
Revistaistoe1508−4147.5011,863.50
Radiojornalamfm479−1632.503602.50
Portalne10927−1507.507550.50
Jc_Pe2132−7815.5016,836.50
Portaljovempan283−236.001850.00
Opovoonline2081−5278.0016,018.00
Correio2907−7268.0021,000.00
correio_dopovo1293−3421.0010,095.00
Uol4491−14,432.0033,066.00
Folhape847−2325.506352.50
Diariope1738−3843.0012,552.00
Jornaldaband356−1064.002562.00
G11810−2799.5013,242.50
Agenciabrasil1222−3063.509253.50
Correio24horas571−1962.004093.00
Tvjornalsbt311.0023.00
CBNoficial419−1102.503064.50
Terranoticiasbr1576−4051.0012,387.00
Bbcbrasil1453−3623.5010,308.50
Elpais_Brasil904−2392.006268.00
Radiobandnewsfm612−1569.504501.50
Portalr7527−1478.503992.50
Globonews554−1809.503669.50
Jornalnacional212−672.501584.50
Showdavida36−103.00233.00
Stjnoticias2−14.0014.00
Standard Deviation Sum (S)4429.30
Standard Deviation Sum (|S|)11,486.10
Table A3. List of the candidates. the sum of the Support (S). and the sum of the Support (S) modulus.
CandidateQuantity of PostsS∑ |S|
Bolsonaro32,530−88,726.5243,972.5
Haddad7018−22,989.051,235.0
Ciro3686−10,100.026,676.0
Alckmin3614−10,553.026,930.0
Marina20192782.015,901.0
Lula1841−5459.513,310.5
Meirelles1018−2988.57240.5
Boulos835−3205.56078.5
Alvaro Dias340−701.52398.5
Daciolo313−597.51961.5
Amoêdo270−264.01590.0
Kátia Abreu73−231.5541.5
Rodrigo Maia65−159.0495.0
Flávio Rocha53−38.5389.5
Eymael43−41.0366.0
Vera Lúcia41−163.0295.0
Paulo Rabello40−218.5369.5
Cristovam Buarque30−84.5180.5
Goulart Filho30−65.5238.5
Rebelo210.5196.5
Dávila13−47.076.0
Standard Deviation Sum (S)19,604.5
Standard Deviation Sum (|S|)53,141.9
Table A4. The Relation (R) for a subset of the ten most active news agencies per each candidate.
AlckminBolsonaroHaddadMarinaTotalStandard Dev.
Brasil247−1186.5−12,675.0−1638.543.5−15,456.55916.8
Correio−974.0−3338.0−1136.0326.5−5121.51519.9
Estadao−757.5−4758.0−1207.5285.0−6438.02190.1
Folha−692.0−7151.0−1311.032.0−9122.03293.1
G1−87.0−1832.5−769.5310.5−2378.5938.1
Jc_Pe−575.5−4350.5−1687.0−21.0−6634.01923.7
Jornaloglobo−743.5−3785.5−858.0124.5−5262.51704.0
Opovoonline−274.0−2594.5−220.0211.0−3877.51235.7
Uol−1154.0−8749.5−2330.5107.5−12,126.53939.8
Uolnoticias−1367.0−9487.5−2323.0453.5−12,724.04359.2
Total−7811.0−58,722.0−14,481.01873.0
Standard Dev.404.83506.5544.9154.2

Appendix C. Methods to Classify Tweets with Naïve Bayes and Stemming

The stages of the data acquisition and transformation process can be summarized as follows:
Generate the database with support tables: The creation of the temporary staging database with support tables such as the list of candidates, the list of official news agencies, and the electoral events.
Ingestion of posts mentioning candidates from news agencies: As a recursive process, news agencies’ tweets were ingested daily in a stage table.
Generate main tables of selected posts: Processing the staging table with a data wrangling process, cleaning incorrect and duplicated records, removing incorrect records, and generating the main research tables.
Analyze the posts, calculating sentiments and emotions: All the posts were analyzed using different techniques to calculate sentiments and emotions.
According to the results for each scenario, rank the techniques and identify the most efficient method to calculate sentiments and emotions.
Calculate the position of each post, considering all the fields of polarity, sentiment, and emotion, suggesting the position of the news agency related to the candidate.
Generate graphs and insights: Business Intelligence graphs and advanced analytics insights were produced over the resultant data.
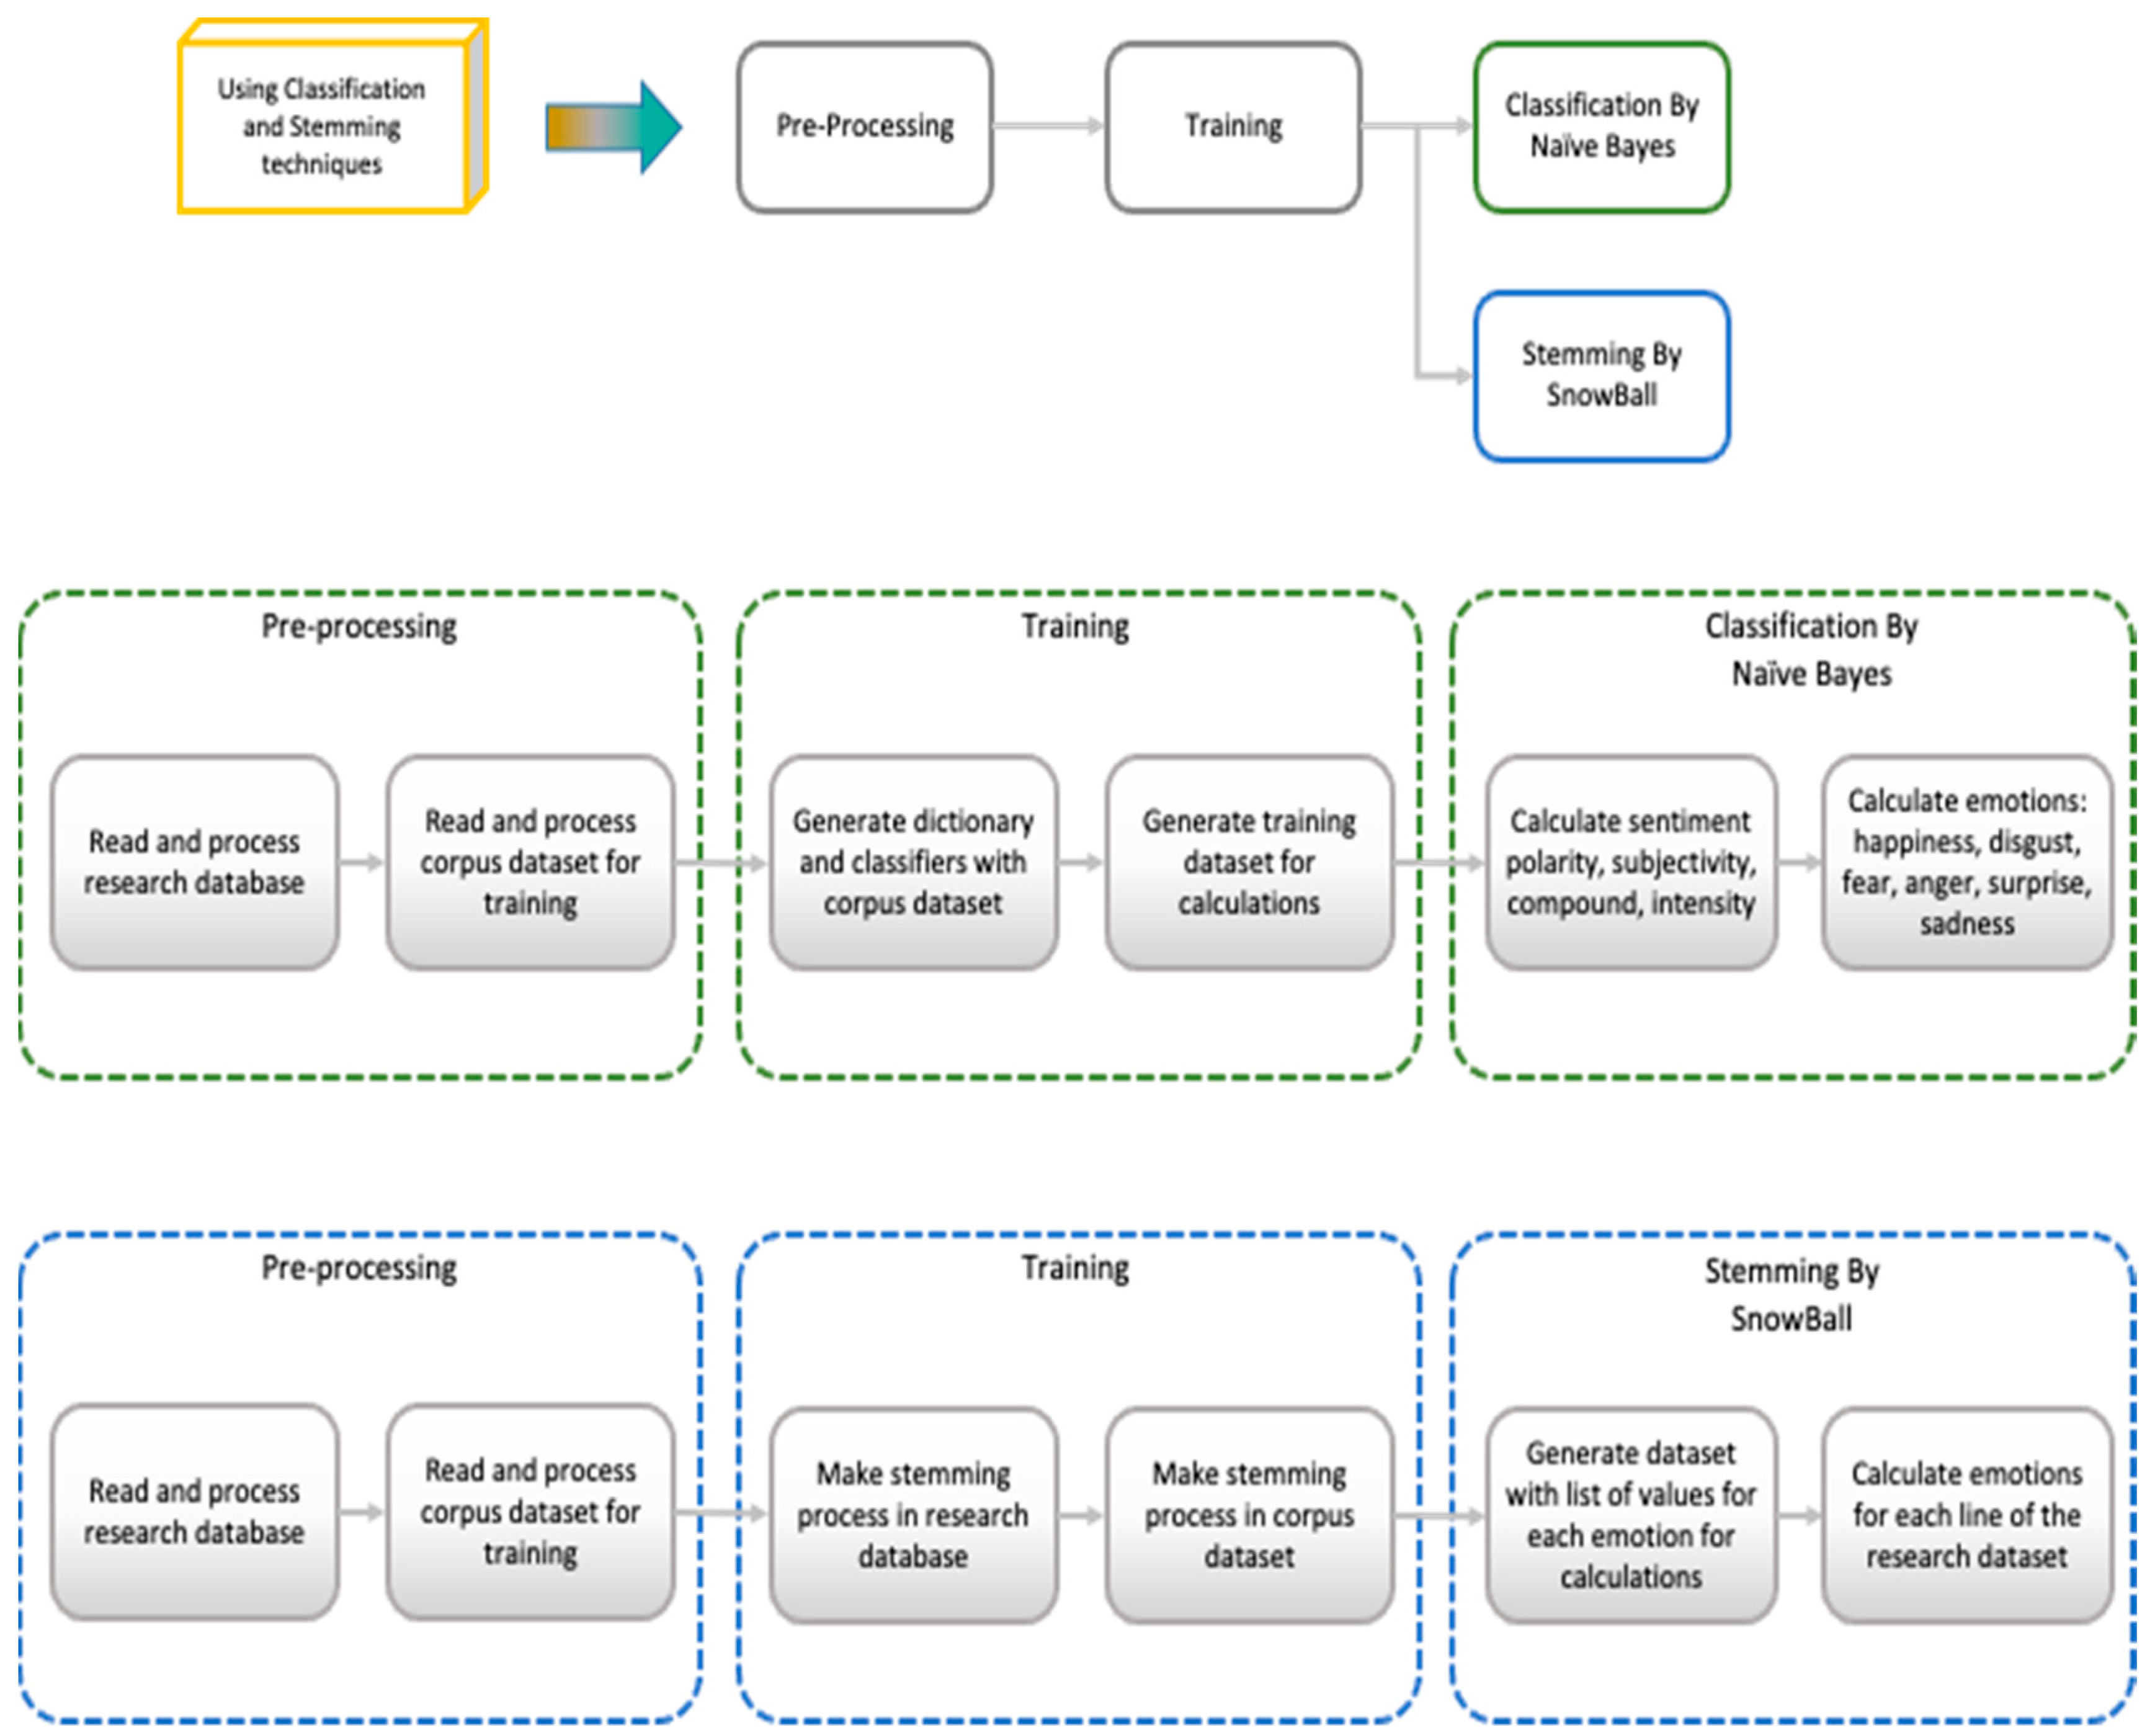
The differences in the use of the Naïve Bayes classification and the Stemming calculation are explained in Figure 1.
In Figure 1, we summarize the three phases executed for both the classification and Stemming methods: pre-processing, training, and the specific activities for each technique, which are detailed in the figure above:
Both methods use the same pre-processing that can be summarized as follows:
Pre-processing: This phase comprehends the preparation of all data (the research work database and the training datasets) for the following stages. In this research, all data were obtained in the following steps:
Acquisition: All official news agency posts were extracted daily during the research period.
Cleaning and Enrichment: The resulting dataset was cleaned, and the remaining posts only about the candidates in the presidential election remained, removing any false cognates, and were enriched with calculated fields to facilitate the analysis and filtering.
Discovery and Text Mining: An exploratory analysis was made using text mining to understand the indicators and identify insights into the data and their derivatives.
For the classification technique:
Training: Using the training datasets for Naïve Bayes classification, the dictionary and classifiers were created to provide referential information and a list of pre-trained terms to evaluate each post-classifying emotion.
Classification with Naïve Bayes: Using the list of trained terms, each line of the research work database was classified, calculating information as sentiment polarity, subjectivity, compound, and intensity, and was also classified for emotions as happiness, disgust, fear, anger, surprise, and sadness. Every single emotion has a value between 0 and 1 for each post.
For the Stemming with the Snowball technique:
Step 1: The Stemming process transformed each word into its root without prefixes and suffixes. As a result, we obtained a list of stems from each tweet. Each stem is associated with one or more emotions.
Step 2: The research worktable was analyzed line by line, adding the value of the emotions in the research worktable list for each post word. As a result, each research worktable received the total emotion score for each emotion normalized between 0 and 1.

References

  1. Ahuja, Ravinder, and S. C. Sharma. 2022. Sentiment Analysis on Different Domains Using Machine Learning Algorithms. In Advances in Data and Information Sciences: Proceedings of ICDIS 2021. Singapore: Springer, pp. 143–53. [Google Scholar]
  2. Ali, Farahat, Muhammad Awais, and Muhammad Faran. 2021. Social Media Use and Political Polarization: The Mediating Role of Political Engagement and Political Loyalty. International Journal of Media and Information Literacy 6: 17–33. [Google Scholar] [CrossRef]
  3. Allen, James. 1995. Natural Language Understanding. San Francisco: Benjamin-Cummings Publishing Co., Inc. [Google Scholar]
  4. Anderson, Brian D. O., and Mengbin Ye. 2019. Recent advances in the modeling and analysis of opinion dynamics on influence networks. International Journal of Automation and Computing 16: 129–49. [Google Scholar] [CrossRef]
  5. Bellovary, Andrea K., Nathaniel A. Young, and Amit Goldenberg. 2021. Left-and right-leaning news organizations use negative emotional content and elicit user engagement similarly. Affective Science 2: 391–96. [Google Scholar] [CrossRef]
  6. Borondo, Javier, Alfredo J. Morales, Juan-Carlos Losada, and Rosa M. Benito. 2012. Characterizing and modeling an electoral campaign in the context of Twitter: 2011 Spanish Presidential election as a case study. Chaos: An Interdisciplinary Journal of Nonlinear Science 22: 023138. [Google Scholar] [CrossRef] [PubMed]
  7. Borondo, Javier, Alfredo J. Morales, Rosa M. Benito, and Juan Carlos Losada. 2014. Mapping the online communication patterns of political conversations. Physica A: Statistical Mechanics and its Applications 414: 403–13. [Google Scholar] [CrossRef]
  8. Borondo, Javier, Alfredo J. Morales, Rosa M. Benito, and Juan Carlos Losada. 2015. Multiple leaders on a multilayer social media. Chaos, Solitons & Fractals 72: 90–98. [Google Scholar]
  9. Braha, Dan. 2012. Global civil unrest: Contagion, self-organization, and prediction. PLoS ONE 7: e48596. [Google Scholar] [CrossRef] [PubMed]
  10. Braha, Dan, and Marcus A. M. De Aguiar De Aguiar. 2017. Voting contagion: Modeling and analysis of a century of US presidential elections. PLoS ONE 12: e0177970. [Google Scholar] [CrossRef]
  11. Budiharto, Widodo, and Meiliana Meiliana. 2018. Prediction and analysis of Indonesia Presidential election from Twitter using sentiment analysis. Journal of Big Data 5: 51. [Google Scholar] [CrossRef]
  12. Buntoro, Buntoro, GHULAM ASROFI, Rizal Arifin, Gus Nanang Syaifuddiin, Ali Selamat, O. Krejcar, and F. Hamido. 2021. The Implementation of the machine learning algorithm for the sentiment analysis of Indonesia’s 2019 Presidential election. IIUM Engineering Journal 22: 78–92. [Google Scholar] [CrossRef]
  13. Ceron, Andrea, Luigi Curini, and Stefano M. Iacus. 2015. Using sentiment analysis to monitor electoral campaigns: Method matters—evidence from the United States and Italy. Social Science Computer Review 33: 3–20. [Google Scholar] [CrossRef]
  14. Chmiel, Anna, Pawel Sobkowicz, Julian Sienkiewicz, Georgios Paltoglou, Kevan Buckley, Mike Thelwall, and Janusz A. Hołyst. 2011. Negative emotions boost user activity at BBC forum. Physica A: Statistical Mechanics and Its Applications 390: 2936–44. [Google Scholar] [CrossRef]
  15. Chong, Wei Yen, Bhawani Selvaretnam, and Lay-Ki Soon. 2014. Natural language processing for sentiment analysis: An exploratory analysis on tweets. Paper presented at the 2014 4th International Conference on Artificial Intelligence with Applications in Engineering and Technology, Kota Kinabalu, Malaysia, December 3–5; pp. 212–17. [Google Scholar]
  16. Conover, Michael D., Bruno Gonçalves, Jacob Ratkiewicz, Alessandro Flammini, and Filippo Menczer. 2011. Predicting the political alignment of Twitter users. Paper presented at the 2011 IEEE Third International Conference on Privacy, Security, Risk and Trust and 2011 IEEE Third International Conference on Social Computing, Boston, MA, USA, October 9–11; pp. 192–99. [Google Scholar]
  17. Conover, Michael, Jacob Ratkiewicz, Matthew Francisco, Bruno Gonçalves, Filippo Menczer, and Alessandro Flammini. 2011. Political Polarization on Twitter. Paper presented at the International AAAI Conference on Web and Social Media, Barcelona, Spain, July 17–21; vol. 5, pp. 89–96. [Google Scholar] [CrossRef]
  18. de León, Ernesto, and Damian Trilling. 2021. A sadness bias in political news sharing? The role of discrete emotions in the engagement and dissemination of political news on Facebook. Social Media+ Society 7: 20563051211059710. [Google Scholar] [CrossRef]
  19. de Oliveira, Douglas Nunes, and Luiz Henrique de Campos Merschmann. 2021. Joint evaluation of preprocessing tasks with classifiers for sentiment analysis in Brazilian Portuguese language. Multimedia Tools and Applications 80: 15391–412. [Google Scholar] [CrossRef]
  20. dos Santos Brito, Kellyton, Silvio Romero de Lemos Meira, and Paulo Jorge Leitão Adeodato. 2021. Correlations of social media performance and electoral results in Brazilian presidential elections. Information Polity 26: 417–39. [Google Scholar] [CrossRef]
  21. Ekman, Paul. 1999. Basic emotions. Handbook of Cognition and Emotion 98: 16. [Google Scholar]
  22. Folha. n.d. Available online: www1.folha.uol.com.br/fsp/brasil/fc1506200017.htm (accessed on 22 July 2023).
  23. Ghafariyan, S. 2019. Andbrain Dataset v5. Available online: www.kaggle.com/code/jibinjk/starter-emotions-sensor-data-set-5123fe52-6 (accessed on 22 July 2023).
  24. González-Bailón, Sandra, Javier Borge-Holthoefer, Alejandro Rivero, and Yamir Moreno. 2011. The dynamics of protest recruitment through an online network. Scientific Reports 1: 197. Available online: http://snowball.tartarus.org/algorithms/portuguese/stemmer.html (accessed on 22 July 2023).
  25. Kaur, Parneet. 2022. Sentiment analysis using web scraping for live news data with machine learning algorithms. Materials Today: Proceedings 65: 3333–41. [Google Scholar] [CrossRef]
  26. Kratzwald, Bernhard, Suzana Ilić, Mathias Kraus, Stefan Feuerriegel, and Helmut Prendinger. 2018. Deep learning for affective computing: Text-based emotion recognition in decision support. Decision Support Systems 115: 24–35. [Google Scholar] [CrossRef]
  27. Kumar, Akshi, and Teeja Mary Sebastian. 2012. Sentiment analysis: A perspective on its past, present and future. International Journal of Intelligent Systems and Applications 4: 1–14. [Google Scholar] [CrossRef]
  28. Kwak, Haewoon, Changhyun Lee, Hosung Park, and Sue Moon. 2010. What is Twitter, a social network or a news media? Paper presented at the 19th International Conference on World Wide Web, Raleigh, NC, USA, April 26–30; pp. 591–600. [Google Scholar]
  29. Leech, Geoffrey. 2014. The state of the art in corpus linguistics. English Corpus Linguistics, 8–29. [Google Scholar]
  30. Marketing4Ecommerce. n.d. Available online: https://marketing4ecommerce.net/en/social-media-in-brazil-this-is-how-social-media-works-in-the-largest-country-in-south-america (accessed on 22 July 2023).
  31. Martín-Gutiérrez, Samuel, Juan Carlos Losada, and Rosa M. Benito. 2018. Recurrent patterns of user behavior in different electoral campaigns: A twitter analysis of the Spanish general elections of 2015 and 2016. Complexity 2018: 2413481. [Google Scholar] [CrossRef]
  32. Morales, Alfredo Jose, Javier Borondo, Juan Carlos Losada, and Rosa M. Benito. 2015. Measuring political polarization: Twitter shows the two sides of Venezuela. Chaos: An Interdisciplinary Journal of Nonlinear Science 25: 033114. [Google Scholar] [CrossRef]
  33. Morales, A. J., J. C. Losada, and R. M. Benito. 2012. Users structure and behavior on an online social network during a political protest. Physica A: Statistical Mechanics and Its Applications 391: 5244–53. [Google Scholar] [CrossRef]
  34. Murphy, Kevin P. 2006. Naive Bayes classifiers. University of British Columbia 18: 1–8. [Google Scholar]
  35. Olimpio da Silva, Rogerio. 2017. Estudo da propagação de postagens de notícias no Twitter. Master dissertation, Univer-sidade de São Paulo, São Paulo, Brazil. [Google Scholar]
  36. Olivares, Gastón, Juan Pablo Cárdenas, Juan Carlos Losada, and Javier Borondo. 2019. Opinion polarization during a dichotomous electoral process. Complexity 2019: 5854037. [Google Scholar] [CrossRef]
  37. Perakakis, Emmanouil, George Mastorakis, and Ioannis Kopanakis. 2019. Social media monitoring: An innovative intelligent ap-proach. Designs 3: 24. [Google Scholar] [CrossRef]
  38. Purcell, Kristen, Lee Rainie, Amy Mitchell, Tom Rosenstiel, and Kenny Olmstead. 2010. Understanding the participatory news consumer. Pew Internet and American Life Project 1: 19–21. [Google Scholar]
  39. Recuero, Raquel, Felipe Bonow Soares, and Anatoliy Gruzd. 2020. Hyperpartisanship, disinformation and political conversations on Twitter: The Brazilian presidential election of 2018. Paper presented at the International AAAI Conference on Web and Social Media, Atlanta, GA, USA, June 8–11; vol. 14, pp. 569–78. [Google Scholar] [CrossRef]
  40. Rish, Irina. 2001. An empirical study of the naive Bayes classifier. Paper presented at IJCAI 2001 Workshop on Empirical Methods in Artificial Intelligence, Seattle, WA, USA, August 4–10; vol. 3, pp. 41–46. [Google Scholar]
  41. Roberts, Kirk, Michael A. Roach, Joseph Johnson, Josh Guthrie, and Sanda M. Harabagiu. 2012. Empatweet: Annotating and detecting emotions on Twitter. Paper presented at Eighth International Conference on Language Resources and Evaluation (LREC’12), Istanbul, Turkey, May 23–25; pp. 3806–13. [Google Scholar]
  42. Ruby, J. 2013. Mineração de Sentimentos Aplicada em Textos em Português do Brasil. dissertation, Universidade do Contestado, Mafra, Brazil. Available online: https://drive.google.com/file/d/1SGjh9opctV0JXuwJuFolaBiM_j4GBUf9 (accessed on 22 July 2023).
  43. Saxena, Akrati, Harita Reddy, and Pratishtha Saxena. 2022. Recent developments in sentiment analysis on social networks: Techniques, datasets, and open issues. Principles of Social Networking: The New Horizon and Emerging Challenges, 279–306. [Google Scholar]
  44. Search Engine Journal. n.d. Available online: https://www.searchenginejournal.com/social-media-statistics/480507 (accessed on 22 July 2023).
  45. Sinclair, John. 2005. Corpus and Text-Basic Principles. In Developing Linguistic Corpora: A Guide to Good Practice. Edited by Martin Wynne. Oxford: Oxbow Books, pp. 1–16. [Google Scholar]
  46. Soares, Felipe Bonow, Raquel Recuero, and Gabriela Zago. 2019. Asymmetric polarization on Twitter and the 2018 Brazilian presidential elections. Paper presented at the 10th International Conference on Social Media and Society, Toronto, ON, Canada, July 19–21; pp. 67–76. [Google Scholar]
  47. Souza, Frederico Dias, and João Baptista de Oliveira e Souza. 2021. Sentiment analysis on Brazilian Portuguese user reviews. Paper presented at the 2021 IEEE Latin American Conference on Computational Intelligence (LA-CCI), Temuco, Chile, November 2–4; pp. 1–6. [Google Scholar]
  48. Sufi, Fahim K., and Ibrahim Khalil. 2022. Automated Disaster Monitoring from Social Media Posts Using AI-Based Location Intelligence and Sentiment Analysis. IEEE Transactions on Computational Social Systems, 1–11. [Google Scholar] [CrossRef]
  49. Udemy. n.d. Available online: https://www.udemy.com/course/mineracao-de-emocao-em-textos-com-python-e-nltk (accessed on 22 July 2023).
  50. Yadamsuren, Borchuluun, and Sanda Erdelez. 2011. Online news reading behavior: From habitual reading to stumbling upon news. Proceedings of the American Society for Information Science and Technology 48: 1–10. [Google Scholar] [CrossRef]
Disclaimer/Publisher’s Note: The statements, opinions, and data contained in all publications are solely those of the individual author(s) and contributor(s) and not of MDPI and/or the editor(s). MDPI and/or the editor(s) disclaim responsibility for any injury to people or property resulting from any ideas, methods, instructions, or products referred to in the content.
Figure 1. Detailing the classification and Stemming techniques’ activity.
Socsci 12 00458 g001
Figure 2. Relation (R) per each candidate grouped by news agencies.
Socsci 12 00458 g002
Figure 3. Comparison of the results obtained using the different methods.
Socsci 12 00458 g003
Figure 4. This figure shows the increase in posts during special events.
Socsci 12 00458 g004
Figure 5. The evolution of support towards the candidates until the first round of elections.
Socsci 12 00458 g005
Figure 6. Radial comparison of emotions’ distribution. Panel (A) aggregates emotions from all news agencies, revealing that sadness, surprise, and fear predominate in headlines. In Panel (B), emotions towards the top candidates are contrasted. Panel (C) examines central agencies, displaying slight emotional alignment despite variations in intensity. Panels (DF) delve into agency-specific emotions, highlighting widespread positivity and the concurrence of high sadness, fear, and surprise across leading agencies while happiness remains relatively subdued.
Socsci 12 00458 g006
Disclaimer/Publisher’s Note: The statements, opinions and data contained in all publications are solely those of the individual author(s) and contributor(s) and not of MDPI and/or the editor(s). MDPI and/or the editor(s) disclaim responsibility for any injury to people or property resulting from any ideas, methods, instructions or products referred to in the content.

