Article

Enhancing Planning Behavior during Retirement: Effects of a Time Perspective Based Training Intervention

1
Faculty of Medicine, Health and Human Sciences, Macquarie University, Macquarie Park 2109, Australia
2
Department of Psychology, Oklahoma State University, Stillwater, OK 74078, USA
3
College of Science and Engineering, Flinders University, Bedford Park 5042, Australia
*
Author to whom correspondence should be addressed.
Soc. Sci. 2021, 10(8), 306; https://doi.org/10.3390/socsci10080306
Submission received: 23 June 2021 / Revised: 27 July 2021 / Accepted: 27 July 2021 / Published: 13 August 2021
(This article belongs to the Section Work, Employment and the Labor Market)

Abstract

:
Time perspective is a psychological construct that reflects the way people view time. Two schools of thought exist that theorize how this temporal mindset affects behavior—dominant and balanced. We applied dominant and balanced time perspective frameworks separately to two versions of an online intervention that aimed to promote goal-setting and accumulation of essential retirement resources (health, physical, social, cognitive and emotional) and compared effects with a control group. The effectiveness of the intervention was tested with 109 US retirees using a 4-wave design over a 6-month period. Linear mixed models showed an increase in health goal striving for the balanced group at posttraining and gains were maintained at the 3-month time point. Both training groups demonstrated an increase in the number and specificity of goals at posttraining and 3-months. Applying a time perspective framework to an online planning intervention for retirees shows promise in promoting planning for retirement resources. Practical implications, limitations, and suggestions for developing future interventions are discussed.

1. Introduction

Traditionally, retirement has been primarily viewed as an eagerly awaited life stage away from work-related structured time and towards leisure time (Lee et al. 2020). Longer retirement periods due to increased longevity and better health (Humpel et al. 2010) point to the increasing importance of on-going planning beyond the period of preparation for the transition to retirement (Donaldson et al. 2010; Earl et al. 2015b). More than ever, retirement is not a single event, but rather a complex multifaceted process (Henning et al. 2019; Kim and Moen 2002; Muratore and Earl 2015; Wang 2007), evident from the diverse experiences and difficulties that many retirees face in their efforts to adjust to the later life stage (Kojola and Moen 2016; Topa and Pra 2018; Wang and Hesketh 2012).
Along with the numerous challenges associated with retirement adjustment, particularly in cases of involuntary retirement, pressure for individuals to be self-sufficient is an added concern (Barbosa et al. 2016; Hansson et al. 2019; Topa et al. 2018b). With pressure on governments and individuals alike, research interest is rapidly growing surrounding the conditions that promote retirement adjustment and a favorable retirement experience (Hershey and Henkens 2013; Rafalski et al. 2017; Schultz and Wang 2011). Having contemplated or planned for retirement, many retirees adjust well to the lifestyle changes (Noone et al. 2010), but a large number of retirees experience adverse retirement outcomes and struggle to adjust (Cohen-Mansfield and Regev 2018; Kim and Moen 2002; Wang 2007). Despite this, interventions to assist retirees are still lacking (Earl et al. 2015a).
Retirement planning has been widely researched in the context of retirement preparation and adjustment (e.g., Barbosa et al. 2016; Earl et al. 2015a; Hansson et al. 2019; Hershey and Mowen 2000; Hurtado and Topa 2019; Noone et al. 2012; Petkoska and Earl 2009; Topa and Pra 2018; Yeung 2018) with calls for practical interventions to optimise retirement outcomes (Löckenhoff 2012). A majority of such interventions aimed to assist older workers or young retirees, particularly with regard to transition or the early retirement stage (Baxter et al. 2016; Dubé et al. 2007; Leandro-França et al. 2016b; Ng et al. 2019; Seiferling and Michel 2017). However, planning during retirement is just as important for well-being as it is in preretirement (Earl et al. 2015a). The motivation to help prepare individuals for the retirement lifestyle should not end once they have transitioned out of the workforce.

2. Theoretical Frameworks

2.1. Time Perspective Theory

One individual difference dimension that has been found to influence retirement planning (Earl et al. 2015b) is time perspective (TP), a mindset broadly defined by Zimbardo and Boyd (1999) as an orientation toward the positive or negative past, the fatalistic or hedonistic present, and the future. Specifically, they identified five TP domains: past-negative—a focus on unpleasant past experiences, including the negative reconstruction of ordinary occurrences; past-positive—a tendency to reflect on the past with a nostalgic and sentimental attitude; present-fatalistic—a belief that outside forces control one’s life and the future is predestined, often leading to a lack of motivation and feelings of helplessness; present-hedonistic—a tendency toward impulsive risk taking and attraction toward immediate gratification, often with little concern for future consequences; and future—a disciplined focus on future goals and rewards, while often neglecting present enjoyment.
A tendency to focus on any one of these TP dimensions has been found to strongly influence adjustment and retirement outcomes (Earl et al. 2015b). In cases of strong bias, dominant orientations can be maladaptive (Zimbardo and Boyd 1999). The potential to improve planning may lie in raising awareness of the influence that TP has on planning efforts through the use of a planning intervention. The key to promoting more planning behavior may be to encourage individuals to apply their TP in an adaptive way. Much like strengths-based training, where weaknesses are recognized and strengths are nurtured (Boermans et al. 2012; Schutte and Malouff 2019; Wade and Jones 2015), the strengths of individual TPs could be nurtured to increase planning efforts.

2.2. Dominant Time Perspective

The most comprehensively studied dimension of psychological time has undoubtedly been future TP, due to the motivational aspect of how people construct their imagined future leading to actions and behaviors in the present (Kooij et al. 2018). However, research demonstrates the effect of temporal orientations other than the future on a range of behavioral and psychological variables. For example, drug use and smoking (Adams 2009; Keough et al. 1999), procrastination (Gupta et al. 2012; Sirois 2014; Zabelina et al. 2018), emotional intelligence (Stolarski et al. 2011), risky driving (Zimbardo et al. 1997) and depression (Zimbardo and Boyd 1999).

2.3. Balanced Time Perspective

Zimbardo and Boyd (1999) advocate that having a balanced TP maximizes well-being and psychological health. They described balanced TP as having the mental flexibility to alternate between a focus on the past, present and future to suit different situations as appropriate rather than having a bias toward—or neglect of—a particular domain that may negatively influence important decisions. Proposed by Zimbardo and Boyd (2008), a balanced profile consists of a high present-hedonistic score (4.33), moderately high past-positive (3.67) and future scores (3.69), and low past-negative (2.10) and present-fatalistic scores (1.67), all of which are based on a 5-point scale. Having the ability to switch between temporal states to suit situational demands is reportedly found in only a small proportion of study participants (5–23%; Boniwell et al. 2010; Drake et al. 2008). Balanced TP is associated with, and predictive of, a range of outcomes associated with subjective well-being (McKay et al. 2018; Rönnlund et al. 2017; Szczesniak and Timoszyk-Tomczak 2018; Webster et al. 2014; Zhang et al. 2013).

2.4. Dynamic Model of Retirement Resources

In terms of topics, the need to accumulate adequate financial resources continues to dominate retirement planning practices (e.g., Agnew et al. 2013; Hershey et al. 2010; Noone et al. 2012; Topa et al. 2018a). However, this important but narrow focus places retirees at risk of maladjustment and reduced well-being since personal finances alone do not necessarily lead to high quality retirement adjustment (Topa and Pra 2018). In addition to finances, five other resource domains have been proposed as contributors of adjustment; these are physical, social, emotional, cognitive and motivational resources (Wang and Shi 2014; Wang et al. 2011). The dynamic resource perspective proposed by Wang et al. (2011) posits that, as resources increase, so does adjustment and well-being and, as resources decrease, adjustment is negatively impacted and well-being suffers.
Many of the factors that have been identified in the literature as contributors of retirement adjustment (e.g., individual attributes and postretirement activities) could be directly linked to the six resources just mentioned (Wang et al. 2011). For example, retirees’ savings contributions, personal insurance and superannuation relate to financial resources (Stawski et al. 2007); the quality of relationships and meaningful engagement with close others relates to social and emotional resources (Leung and Earl 2012); and, sense of control or mastery to achieve goals or adapt to changing circumstances is associated with motivational resources (Bandura 1997; Donaldson et al. 2010). Accordingly, planning in retirement should include accumulation or management of these essential resources (Leung and Earl 2012; Wang et al. 2011).

3. Method

3.1. Study Aims

Central to the notion that TP might play a role in attitudes towards planning and goal achievement efforts during retirement, the focus of the current study was to administer a training program with a TP-based theoretical framework that aimed to inspire and promote planning behavior in retirees leading to greater resource accumulation. The specific research questions that the current study sought to answer were, “Which TP themes (dominant versus balanced) in the training intervention would work best to influence improvements in goal perceptions, goal-setting and resource accumulation?” and “Do positive changes in goal striving, goal expectancy and resources persist over a six-month period?”.
Given the paucity of research on interventions involving dominant and balanced time perspectives, a priori hypotheses were not specified regarding the differential magnitude of the training effects. Accordingly, it was hypothesized that, compared with the control group, following the intervention, both dominant and balanced training groups will report a greater level of goal striving (Hypothesis 1; behavior), higher levels of goal expectancy (Hypothesis 2; perception) and increases in resources (Hypothesis 3; both tangible and cognitive). It was further predicted that both training groups will formulate new goals with specificity (Hypothesis 4; cognitive and behavior) leading to achievement (i.e., goal implementation). Using retention rates as indicators of engagement and ongoing participation, it was expected that both training groups would demonstrate a higher level of engagement than members of the control group (Hypothesis 5; retention).

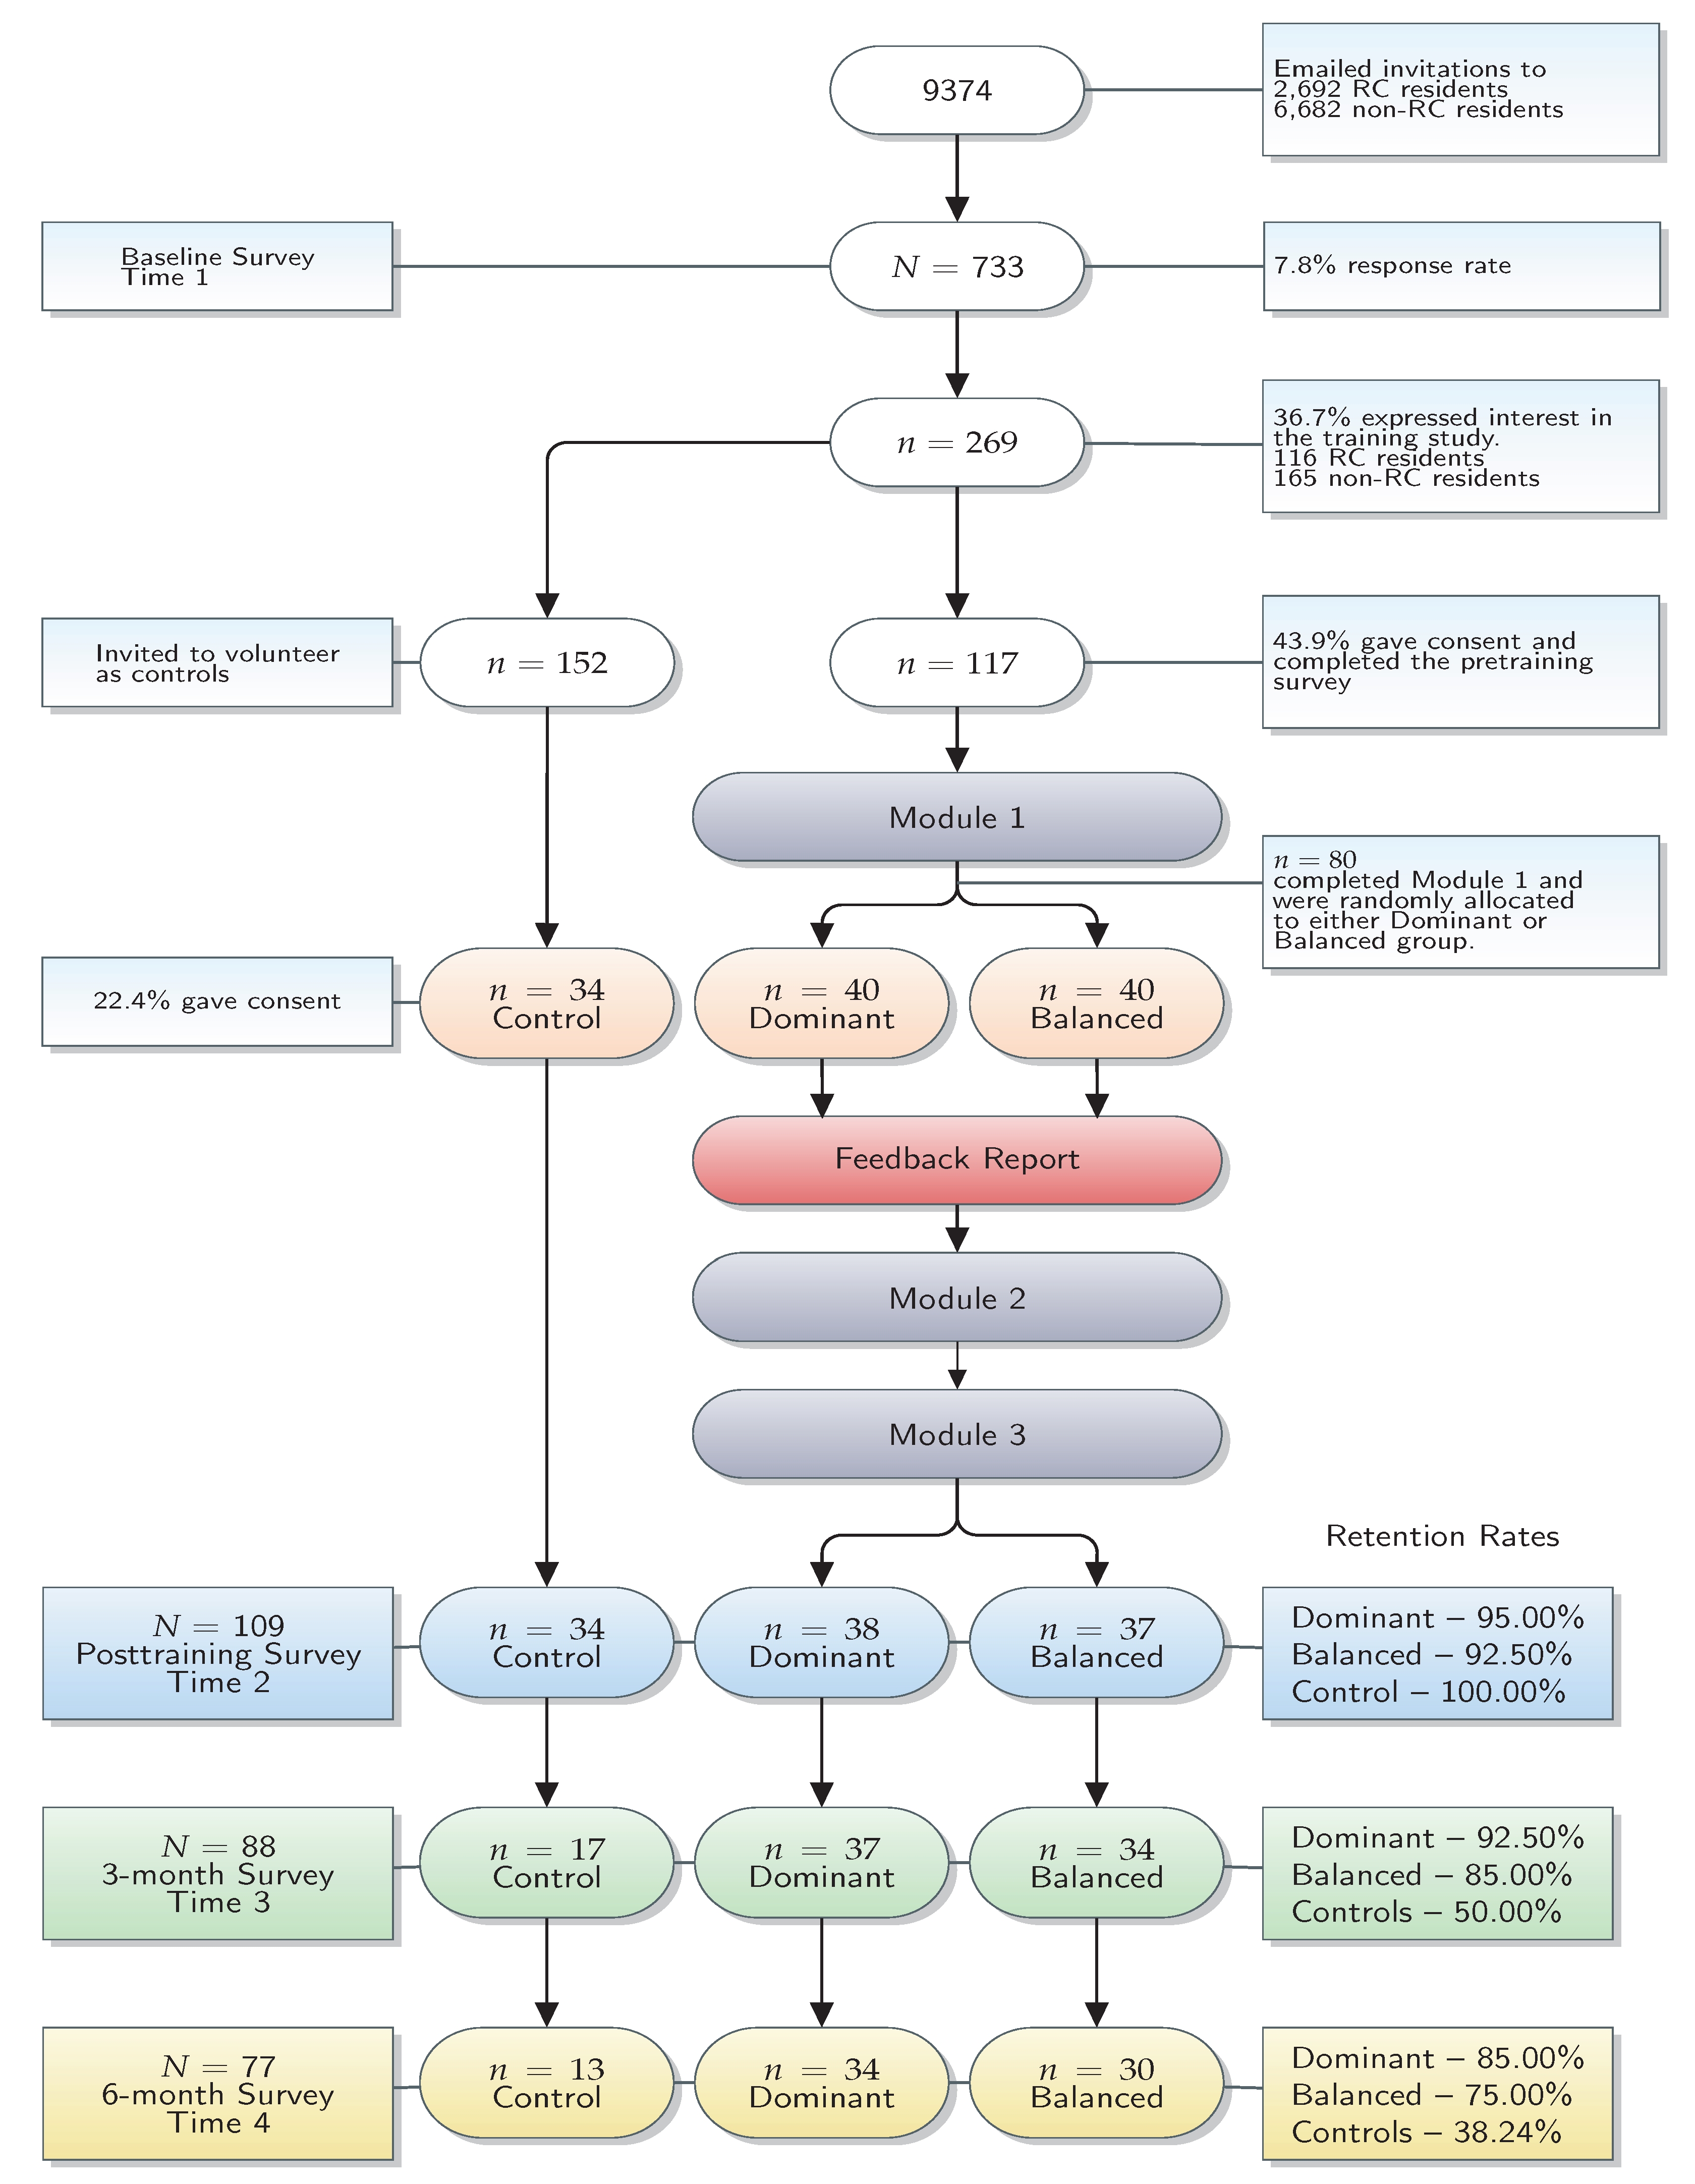
3.2. Participants and Procedure

Participants were residents ( n = 332 ) and potential prospective residents ( n = 411 ) of a not-for-profit organisation that manages retirement communities across the US. Participants were recruited via email invitation sent by the organisation to 9374 retirees in June 2018. The invitation called for individuals to complete an online survey that asks about their planning practices. Eligibility criteria included being 50 years of age or over and self-classified as fully or partly retired. Seven hundred and thirty-three respondents completed the baseline survey—a response rate of 7.92%. In terms of demographics, 81.6% self-classified as fully retired with a mean age of 76.3 years ranging between 51–94, 44.7% living in a retirement community, 52.8% female, 66.6% married or partnered, the vast majority (83.5%) were well educated and held, at minimum, a Bachelor’s degree and reported an average of 15 years since ceasing full-time work.
Upon completing the baseline survey, participants were invited to evaluate a free online retirement planning course comprising three modules and to provide feedback and suggestions for improvement. Interested respondents ( n = 269 ; 36.7 % ) were sent an electronic link to pretraining study information where 117 ( 43.5 % ) individuals provided informed consent to continue. The remainder of this group ( n = 152 ) were invited to complete the posttraining survey (Time 2) as controls and 34 individuals (22.4%) volunteered. Regarding demographic characteristics of the final sample at posttraining, the majority self-classified as fully retired (78.9%) with a mean 74.1 years of age ( S D = 6.79 ), female (53.2%), married or partnered (67.9%), well-educated holding at minimum, a Bachelor’s degree (88.1%) and reported an average of 12.3 years since ceasing full-time work.
The flowchart in Figure 1 outlines the recruitment process and a breakdown of retention rates for each group (a more detailed description of retention rates and dropout characteristics is reported in Results).

3.2.1. Participant Assignment

It was anticipated that approximately 200 of the 269 individuals would consent to proceed with the training study, which would have allowed three randomly assigned groups, two training (dominant and balanced) and one wait-list control. However, due to the lower-than-expected response rate ( n = 117 ), two options were considered for how to proceed. The first option was to allocate the sample to two groups (training and control) and release only one of the two versions of the training. The second option was to allow all 117 participants access to the training and invite other individuals from the group (of 269) who expressed interest in the training to continue as controls. The latter option was chosen for three reasons; (1) two versions of the training would be tested rather than one, (2) control participants would be sourced from the same subgroup that expressed interest in the training, maximizing equivalence, and (3) statistical analysis based on the medical model of intention-to-treat (Gupta 2011; White et al. 2012) made it possible to determine any key differences between training participants and the survey-only group and predict likely outcomes for both groups.

3.2.2. Retention Strategies

Internal validity and the statistical power of longitudinal research relies on cohort retention (Abshire et al. 2017). Retaining participants often proves challenging for behavioral intervention researchers (Olem et al. 2009). Self-guided online interventions have typically suffered from high attrition rates, increasing the risk of bias (Abshire et al. 2017; Brindal et al. 2012; Eysenbach 2005). Retention strategies previously adopted by researchers include monetary incentives (Chang et al. 2004; Dubé et al. 2007), shorter surveys (Rolstad et al. 2011), monthly newsletters (Blanton et al. 2006) and telephone calls (McSweeney et al. 2009). However, it is difficult to ascertain whether these strategies alone improve retention or whether a combination of complex personal, researcher-related and contextual factors (Gul and Ali 2010), some not measured, influence ongoing engagement. For example, financial incentives may motivate an initial willingness to participate; however, unless the program holds personal importance or relevance for participants, engagement in the study may not be sustained (Gul and Ali 2010).
A systematic review by Robinson et al. (2015) identified 985 retention strategies within 12 themes and found that, while it is difficult to determine which cohort-based strategies were most effective, using a larger number of different types of strategies tends to increase the likelihood of good retention.
The current study adopted three broad types of retention strategies deemed suitable to the older cohort. The first involved providing participants with an event table containing dates of all stages of the study, participant requirements and expected time commitment to help participants integrate study dates in their diaries and manage expectations. The second strategy entailed providing participants with broad sample information without causing any survey demand bias. For example, an outline of the main demographic characteristics of the sample and an outline of the most common feedback themes that emerged from comments about the modules. The aim was to promote feelings of ‘inclusion and belonging’ to the study and to help encourage continued engagement. The third strategy involved personalized communication. ID codes were used to address participants in all email communications allowing personal communication while ensuring trust and anonymity. Again using ID codes, animated holiday cards were sent via email to continuing participants two weeks before December holidays. Importantly, email communications were sent and received by the same researcher at every stage of the study to ensure familiarity with the researcher—a sort of ‘getting to know the researcher’ strategy—as a way of making it easier to reach out if an issue arose.

3.2.3. Training Program Design

The program incorporated theoretical and practical training in the following areas: TP theory (Zimbardo and Boyd 1999), resource-based dynamic model of retirement (Wang et al. 2011), as well as integrating SMART goals (Lawlor and Hornyak 2012), which offer a strategic method of goal development. The modules were developed using the Articulate Storyline 360 e-learning software package. The program used adaptive training (i.e., varying levels of cognitive load) as the course progressed, known to contribute to training outcomes by gradually increasing the level of mentally challenging responses (Brehmer et al. 2012).
The modules were internet-based. It is acknowledged that module delivery via this popular medium has both advantages and disadvantages as compared to face-to-face training. Broadly speaking, evidence from the literature suggests that the outcome gains far outweigh any losses (Andersson et al. 2016; Lappalainen et al. 2014; Newman et al. 2011). The main advantage of online program delivery is that the opportunity exists for people to access the modules from different locations. Furthermore, respondents could choose to remain anonymous and they can work through the modules at their own pace. The primary disadvantage is the absence of interpersonal contact with the trainer. However, a review by Andersson et al. (2016) contrasting face-to-face and online-based therapies found no significant difference in outcome effects between the two modes of treatment delivery.
In designing the current intervention, two previous versions of online retirement planning modules were analyzed for their content and participant feedback. Accordingly, certain module features were adopted, adapted or modified. Module content included design features such as the use of lifelike (as opposed to cartoon-like) presenters, larger fonts, features to illustrate points included scenarios and dialogues, the use of easy-to-understand language and a good number of interactive exercises.
Interactive exercises included knowledge-testing activities such as drag-and-drop and matching corresponding tabs. Participants were also able to reveal evidence-based information about a topic by clicking onto, or hovering over, ‘sticky notes’, tabs, icons or images; these were intended to have a ‘playful’ feel that was designed to foster active exploration of the module. The rationale for including activities of this type was to minimize any perceived high level of difficulty of the module content, which may seem daunting and negatively influence the motivation to complete the training (Sitzmann and Weinhardt 2018; Stansbury and Earnest 2017). Engagement was further enhanced with self-reflection exercises that required participants to reflect on their own experiences and write these either directly onto the slide or in the fillable PDF activity sheet provided.

3.2.4. Feedback Reports

Feedback reports containing personal scores on TP and resources were generated using Microsoft Office® applications (Word, Outlook and Excel). These reports were emailed to all training participants upon completion of the first module. Reports were distributed at that time because participants had just completed resources training in Module 1, making the interpretation of their scores for each resource more meaningful. For easy interpretation, scores were colour-coded in terms of level of resources; scores ≤ 2.00 were red (low), 2.10–3.5 were yellow (medium), and >3.5 were green (high). Individual TP scores were also provided and accompanied with the average population scores as presented at the The Time Paradox website (Zimbardo and Boyd 2021) so that individuals could compare their scores to the average. The only difference was that dominant group participants were informed of their dominant TP and balanced group participants were not. This distinction is further elaborated below, in Module 2, where the reports were utilised. Members of the control group received their feedback report only at the end of the study.
Once the reports were issued, a URL link to the second module was emailed to all training participants. The website hosting the modules was created explicitly for the training: Planning During Retirement. To ensure correct progression through the training, the modules were made visible in turn whilst those that were not yet to be accessed were hidden until due.

3.2.5. Module 1

Module 1 had two main objectives: (a) to encourage participants to consider, and comment on, their planning behaviors as a way of building the momentum to plan, and (b) to introduce the ‘retirement resources pyramid’ (Leung and Earl 2012; Wang et al. 2011) as the basis from which to target planning for specific resources. Participants were asked to reflect on some of the plans that they had for their retirement. Following this, the importance of planning was highlighted, not only as it pertains to personal finance, but more holistically in terms of the six resources in the dynamic model of retirement (Wang et al. 2011).
The resources pyramid depicted three tiers (top tier depicted physical and financial resources, social resources were shown at the middle level, and the bottom tier had emotional, cognitive and motivational resources). As each resource was introduced, its relevance to retirement well-being was explained. To help consolidate the relative importance of each resource in the pyramid (Leung and Earl 2012), participants were asked to drag-and-drop resource icons in their correct position in the pyramid. Next, participants were encouraged to think about the resources that they currently have, and identify resource domains that could be improved upon. This reflection exercise was designed to generate a review of resources in preparation for setting resource accumulation goals in Module 3.

3.2.6. Module 2

The main objective of Module 2 was to introduce the concept of TP and explain how individuals’ planning behavior may be influenced by their psychological view of time (Zimbardo and Boyd 1999). There were two parts to Module 2; the first part introduced the concept of TP and was identical for both groups and, in keeping with the theoretical focus of each group, the second part differed between groups through its focus on either dominant or balanced TP theory. To illustrate some of the characteristics of each of the five TP factors (Zimbardo and Boyd 1999), the module presented life-like characters, each possessing a strong orientation toward one of the TP domains. This way, participants could easily associate the scenarios with either someone they know, or themselves. Once participants completed the first part of the module, they accessed the second part by entering a group-specific code to unlock the content.
Dominant group. The focus of the ’dominant’ component of the training was to generate thought about how the different time dimensions—and, in particular, participants’ own dominant TP—can influence decisions and behavior. Participants in this group were informed of their dominant TP status via their feedback report. To illustrate the concept of dominant TP, participants were required to read dialogues that characterized some of the ways that people with different dominant TPs might think about planning.
A strengths-based approach (Linley and Joseph 2004; Linley et al. 2010; Peterson and Seligman 2004; Rath 2007) was used emphasizing the utility of one’s natural abilities rather than changing a deficit. The strengths and weaknesses of each dominant TP were outlined and suggestions were provided regarding how the strengths of dominant TPs could be used to think about effective ways of planning. Similarly, information about the ‘downside’ to dominant TPs raised awareness about thinking styles that can hinder planning. For example, a past-negative person may be reluctant to plan because previous events had not turned out as expected. Rather than dwelling on these and refraining from formulating a new plan, advice was given to learn from past events and plan to do things differently. Participants were invited to think and write about how their dominant temporal orientation was influencing their planning, allowing them to reflect on what they had learned about TP and themselves in a novel way to initiate a positive change in their planning behavior.
Balanced group. The objective of the balanced version of the module was to highlight the advantages of having a flexible TP as evidenced in the literature (e.g., Boniwell et al. 2010; Sobol-Kwapinska and Jankowski 2016; Stolarski and Cyniak-Cieciura 2016; Stolarski et al. 2016). Balanced group participants were required to create their personal TP profile and compare it to the ideal profile, as suggested by Zimbardo and Boyd (2021). They did this by dragging a series of blue dots onto the ‘ideal profile’ graph at the points representing their personal scores. This afforded individuals a visual representation of how far each of their scores (blue dots) were from each individual ideal TP score (indicated by red dots).
Participants were then asked to identify the dimension that deviated the most from the ideal. This deviating dimension was used to guide the selection of activities deemed best to help bring the deviating score closer to the ideal. Each of the recommended activities was intended to direct a temporal focus toward the opposite dimension or positive elements of the deviating dimension. In other words, the intention was to stimulate planning behavior using a temporal orientation toward the direction of the ideal.
The rationale for these activities stems from clinical work with TP strategies. For example, Sword et al. (2014) applied a strategy of promoting the opposite TP, predominantly past-positive and future, to post-traumatic stress disorder clients with extreme past-negative or present-fatalistic orientations. Even a strong dominant future orientation eliciting frequent feelings of ‘running out of time’ can cause personal struggles (Kazakina 2015).

3.2.7. Module 3

The final module recapped the themes of Modules 1 (Resources; Wang et al. 2011) and 2 (TP; Zimbardo and Boyd 1999), and introduced the SMART Goals acronym (Lawlor and Hornyak 2012), which offers a strategic method of goal development. The objective of Module 3 was to encourage participants to integrate the information learned about themselves and their TP to set new goals and to develop a detailed plan for executing their goals. The exercises in Module 3 were designed to engage participants in deeper self-reflection than was encouraged in the previous modules. Similar to the notion that through self-reflection one typically draws on personally meaningful experiences (Bosangit et al. 2015), self-reflection in this exercise aimed to ensure that the goals participants set were meaningful and relevant to them (Ryan and Deci 2017; Travers et al. 2015).
Before being guided through the process of setting a goal and planning its implementation, participants were asked to consider their TP from another person’s viewpoint and think about how others might see their TP and planning. This exercise aimed to stimulate an assessment of participants’ own planning behavior from a different viewpoint (Gerace et al. 2017; Goldstein et al. 2014). Similar to having the ability to adopt another person’s point of view to help understand the affective states and behaviors of the other person (Gerace et al. 2017), this exercise looped the other person’s perspective back to the participant. Participants were also asked to consider how their TP may be hindering their efforts to increase their resources.
Following a number of slides that defined goals and described different types of goals, the SMART Goals (Lawlor and Hornyak 2012) planning strategy was introduced, which offered participants a method of determining specific and attainable goals geared toward resource accumulation. Goals have been described as being ambivalent in nature; on the one hand, giving structure and, on the other hand, causing dissatisfaction when they become unattainable (Brandtstädter and Rothermund 2002). SMART Goals aim to reduce the degree of ambivalence associated with setting broad goals by providing structure to the planning process. A sort-and-match activity was included as a way to recap the SMART Goal elements.
Participants were then guided through a process of planning using implementation intentions (Legrand et al. 2017; Wieber et al. 2015). When an implementation intention is applied beyond the mere creation of a goal, the likelihood of goal attainment is significantly increased (Gollwitzer 1999; Gollwitzer and Sheeran 2006; Martijn et al. 2008; Papies et al. 2009; Seo et al. 2018). For this reason, participants were asked to specify when and where they would take action on the goal, or goals, that they had just set. Goals were based on any of the resources from the pyramid that participants identified as an area that needed improvement. The importance of each resource was reiterated in terms of their position on the pyramid; that is, resources at the top are most critical to well-being.

3.3. Measures

3.3.1. Time Perspective

Time perspective was measured using the 56-item Zimbardo Time Perspective Inventory (ZTPI; Zimbardo and Boyd 1999). The ZTPI consists of five subscales; each one assesses the level of orientation and attitude toward that particular dimension. Each statement was scored using a five-point Likert scale ranging from 1 (very uncharacteristic) to 5 (very characteristic). Sample items include, “Things rarely work out as I expected” (past-negative); “I get nostalgic about my childhood” (past-positive); “Fate determines much in my life” (present-fatalistic); “I take risks to put excitement in my life” (present-hedonistic); and “I make lists of things to do” (future). Items 9, 24, 25, 41, and 56 were reverse-scored in accordance with scoring requirements. The mean of all items for each dimension was calculated to obtain subscale scores. Higher scores reflect a stronger orientation toward the TP for that subscale. Cronbach’s alpha reliability coefficients across subscales were good in the current study, ranging from 0.72 to 0.83.

3.3.2. Deviation from Balanced Time Perspective

Temporal balance was operationalised as a measure of how great the deviation from the ideally balanced profile a person was. As proposed by Zhang et al. (2013), the squared Euclidean distance method was used. Each empirical (e) TP sub-scale score was subtracted from the ideal (i) and squared, thus eliminating negative values. The derived values for each of the subscales were then summed, and the square root was taken. This resulted in the Euclidean distance that was used as the DBTP (see Equation (1)). Zimbardo and Boyd (2021) proposed an ideal TP profile consisting of low level past-negative (2.1) and present-fatalistic (1.67) orientations, a moderately high level of past-positive (3.67) and future (3.69) scores and a strong present-hedonistic (4.33) orientation:
D B T P = i P N e P N 2 + i P P e P P 2 + i P F e P F 2 + i P H e P H 2 + i F e F 2
As mentioned, a score of zero assumes a perfectly balanced profile. Therefore, the closer to zero one is, the more balanced they are deemed to be. Conversely, a score of 6.7 represents the greatest deviation from a balanced profile.

3.3.3. Accumulation and Maintenance of Resources

Current resource levels were assessed using the Retirement Resources Inventory (RRI; Leung and Earl 2012), a 35-item questionnaire designed to assess six key resource domains that pertain to retirement well-being. These resource domains were based on a six-factor model of retirement resources proposed by Wang et al. (2011). Depending on the nature of the item, Likert-type responses ranged from 1 (extremely poor/not/severely/very little/no) to 5 (extremely good/severely/plenty of/excess). Scores were averaged; and higher scores indicate a greater level of resources. The current RRI data had good internal consistency with reliability coefficients ranging from α = 0.74 to 0.84 .

3.3.4. Retirement Goal Striving and Expectancy

Based on a process model of retirement goals advanced by Hershey and Jacobs-Lawson (2009), and subsequently replicated and further extended by Tsotsoros et al. (2021), goal striving and expectancy in the current study were measured by firstly showing participants five descriptions of broad resource-based goal domains. These were: HEALTH: Being healthy and physically fit; FINANCIAL: Being financially stable and independent; SOCIAL: Spending time with friends, family members, or other retirees; COGNITIVE: Participating in activities that keep me mentally sharp and intellectually engaged; and EMOTIONAL: Being happy and emotionally satisfied. Relating to each of the five goal domains, the following questions were asked: “How much thought and effort have you put into achieving this goal?” (goal striving) and “How likely is it you will achieve this goal?” (goal expectancy). Responses were made using a 5-point scale for both goal striving (1 = little or none to 5 = a great deal) and goal expectancy (1 = not at all likely to 5 = extremely likely).

3.3.5. Goal Setting and Specificity

Adapted from Petkoska and Earl (2009), the number and specificity of any new goals set following the training was measured by asking, “Since completing the modules, have you set a new goal (or goals)?” ’Yes’ or ’No’ responses were given. Up to five new goals could be listed with a brief description of each. The level of specificity of each goal was measured from responses to “Please rate how specific each goal is in terms of how, when and where you will achieve your goal(s). Think about the amount of detail you have considered when setting your goal(s). Responses ranged from 1 (not specific at all) to 5 (very specific—I have considered all the details of how I will achieve the goal).

3.4. Analytical Approach

Data were collected across four time points and were analysed using IBM SPSS Statistics 25. Following reverse-scoring and calculation of all aggregate variables, the data were checked for assumptions of normality, frequency distributions, outliers, skewness and kurtosis. Graphical examination of the distribution of outcome variables at pretraining ( N = 733 ) was deemed acceptable (Tabachnick and Fidell 2013). However, due to the reduced sample size at subsequent time points, some distributions deviated from normality and were primarily negatively skewed. Standardized z-scores for skewness and kurtosis were calculated using an alpha criterion of .001 (two-tailed), as per Tabachnick and Fidell (2013). A score with an extreme value exceeding z ± 3.29 was considered a potential outlier (Kim 2013; Tabachnick and Fidell 2013). Following Aguinis et al. (2013), outlying scores were identified as interesting outliers as they were not errors, evident from the consistent responses following reverse coding. Therefore, as Tabachnick and Fidell (2013) suggest, outliers were assigned the next highest value and the cases were retained for analysis. No further adjustments were made to minimise any influence to substantive conclusions regarding relationships or effect sizes (Aguinis et al. 2013). Normality of residuals was visually inspected using Q-Q plots; deviations were deemed acceptable (Barker and Shaw 2015).
In terms of the RRI (Leung and Earl 2012), three resource types (RT) were originally identified during its development (RT1, RT2, RT3). However, because six resource-based subscales were intended for this study, a principal components analysis with six fixed factors was carried out to evaluate the psychometric adequacy of the RRI for the present study (Mulaik 2010). Item loadings were examined using an oblique rotation. The correlation between factors ranged from 0.008 to −0.323. The Kaiser–Meyer–Olkin value was 0.86, and 50% of the variance was accounted for. Inspection of the screeplot resulted in the retention of six factors (Cattell 1966). Seven items in total were deleted: items 8, 33 and 34 cross-loaded substantially; 22 and 35 failed to load on any factor; and, following a reliability analysis, items 3 and 7 were deleted in order to improve reliability of the scale.
Linear mixed models (LMM) were utilized to investigate longitudinal changes to outcome variables. Compared with methods of repeated analysis of variance (ANOVA), LMMs are increasingly utilized as a method for longitudinal data analysis due to the many advantages of their flexible properties such as being able to estimate missing data, analyze unbalanced data sets, include both variant and invariant covariates, estimate standard errors of higher-level coefficients, and allow inclusion of alternative covariance structures (Shek and Ma 2011; West 2009). Despite missing data due to dropouts at Time 4 (19.27% controls, 6.42% balanced, 3.67% dominant), unbalanced group sizes and differences in time lag between data collection points, the Time 2 sample size ( N = 109 ) was able to be retained through the full maximum likelihood capability in the models (Singer and Willett 2003). The conservative Bonferroni adjustment was applied to p-value estimates.
Following the intention-to-treat (ITT) principle (Gupta 2011; White et al. 2012), the final sample at Time 2 ( N = 109 ) was included in all analyses. Intention-to-treat is a statistical concept that refers to the inclusion of all randomized participants in analyses whether they completed the treatment or not and regardless of whether or not they adhered to treatment protocols. This takes into account the likelihood that patients or clients will deviate or cease treatments, yet includes these individuals to avoid an overoptimistic evaluation of the effectiveness of a treatment (Gupta 2011; Hollis and Campbell 1999; Nam and Toneatto 2016; Newell 1992; Sedgwick 2015).

4. Results

4.1. Testing for Self-Selection Bias

The voluntary aspect of participation in psychological research has the potential for samples to under- or over-represent the target population (Bethlehem 2010). Due to available baseline data, it was possible to test for self-selection bias by investigating potential differences in key predictor and outcome variables between participants who only completed the baseline survey and those who continued with the training study. Training participants ( n = 109 ) and baseline only respondents ( n = 624 ) were compared on demographic characteristics, TP domains, resources, goal striving and expectancy. A Bonferroni adjustment was applied to reduce the family-wise error rate (Armstrong 2014). Compared to the baseline-only group, the training group were younger ( M d i f f = 2.51 , t ( 731 ) = 3.50 , p < 0.001 , d = 0.36 ), had retired more recently ( M d i f f = 3.09 , t ( 727 ) = 3.03 , p = 0.003 , d = 0.31 ), and had more financial resources ( M d i f f = 0.25 , t ( 731 ) = 3.47 , p = 0.001 , d = 0.34 ). Despite the reasonably small effects (Cohen 1988), these results suggest the presence of self-selection bias and, as such, were considered for inclusion as covariates in subsequent analyses.
Due to their binary categorical structure, gender and relationship status (partnered or single) were also tested for differences between training group and baseline-only group using chi-square tests for independence (with Yates’ Continuity Correction). The groups were deemed equivalent since there was no significant association between group status and gender χ 2 ( 1 , n = 733 ) = 0.00 , p = 0.959 , nor with relationship status, χ 2 ( 1 , n = 733 ) = 0.19 , p = 0.666 .
In addition to tests for self-selection bias, it was important to determine whether the experimental groups and control were equivalent at baseline as no deliberate matching was applied. To this end, a series of one-way analyses of variance models (ANOVAs) were estimated for group differences in age, gender, level of educational achievement, years since retired, monthly income, and financial literacy. No significant differences were observed.
Descriptive statistics (means and standard deviations) and Pearson correlations among variables are presented in Table 1.

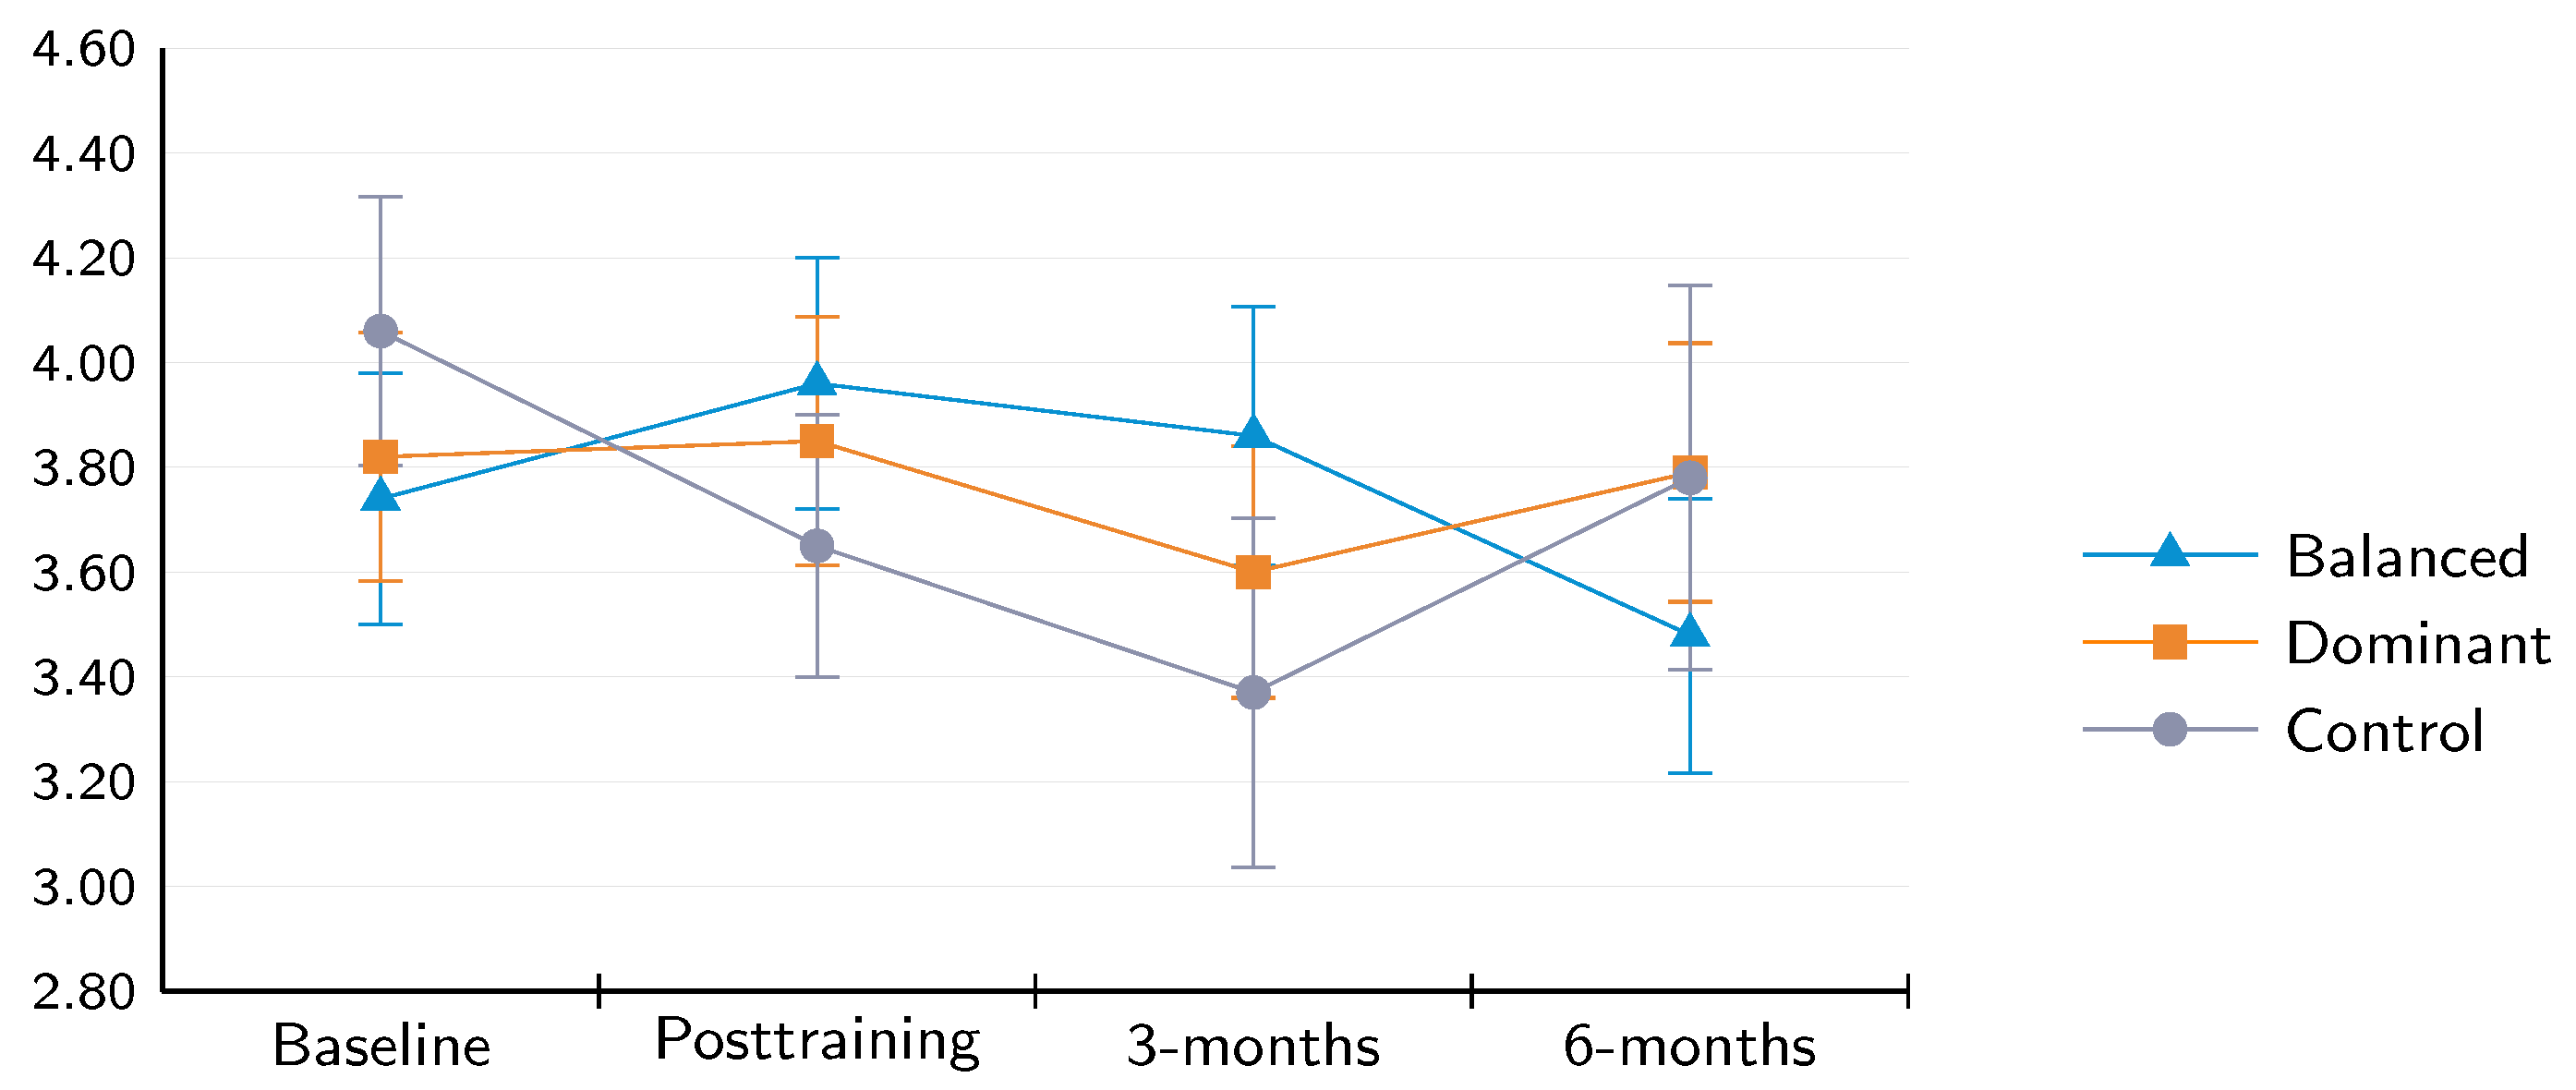
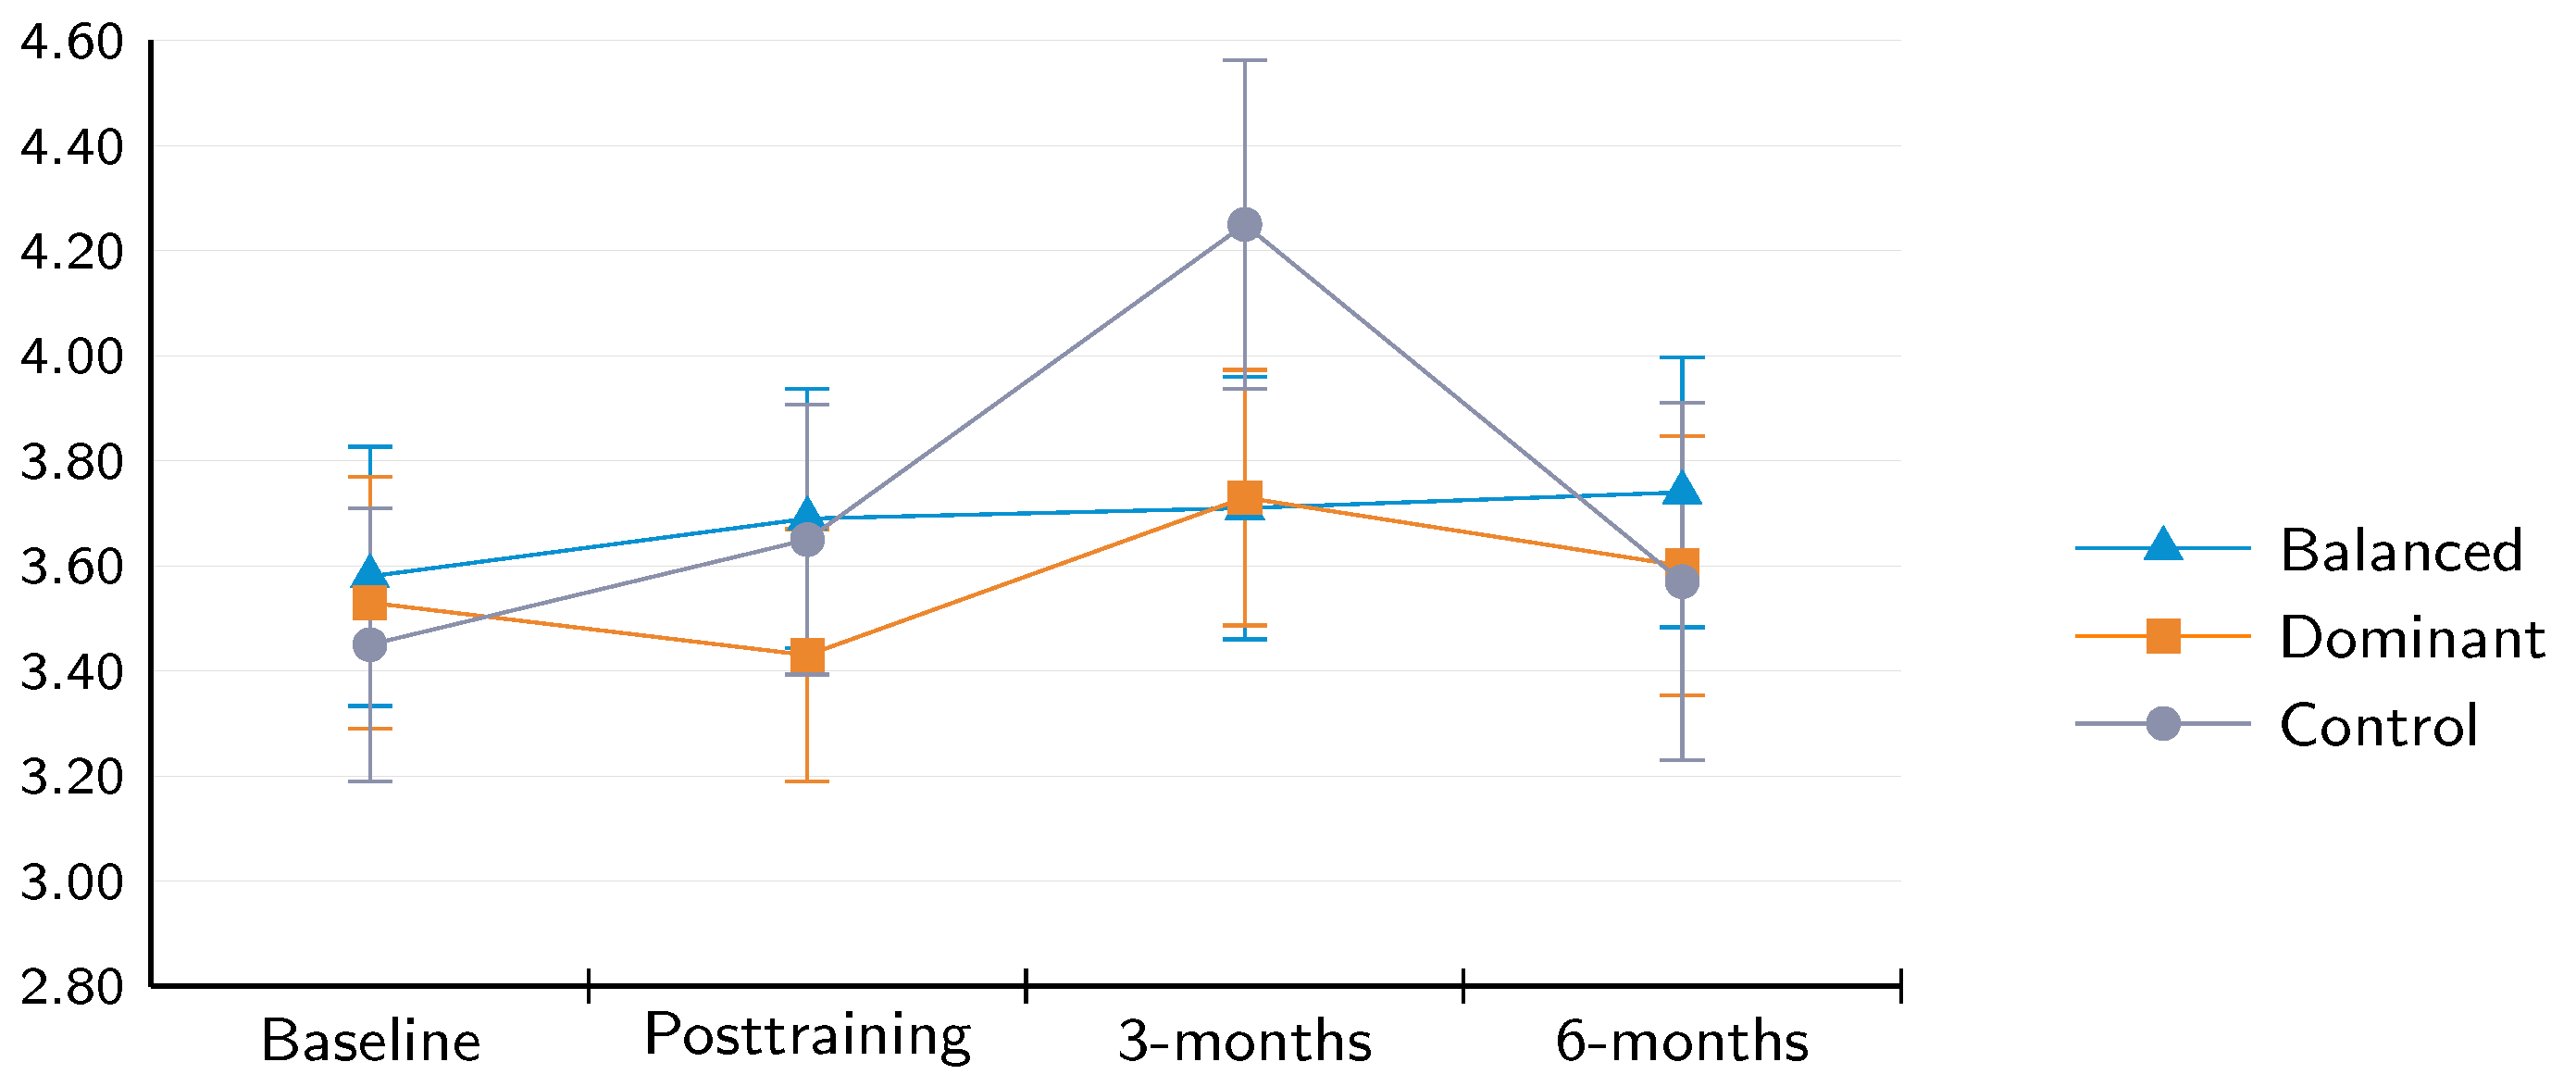
4.2. Longitudinal Posttraining Changes

In order to establish models that provided the best fit to the data, linear and quadratic growth curve models were estimated. As proposed by Bozdogan (1987), model selection was based on the Consistent Akaike’s Information Criterion (CAIC) as it is best suited for small samples, avoids overfitting a model, and balances sensitivity and specificity in a standardized way; lower CAIC coefficients indicate a better fit (Bozdogan 1987; Dziak et al. 2020). Compared to the quadratic growth curve models (1691.50–1982.04), lower CAIC values were observed for the linear models (268.38–431.13). Accordingly, LMMs were adopted for analysis. All statistically significant covariates (age, years since retired and financial resources) were initially included in each LMM model. Using a process of elimination, various combinations were trialed by subsequently removing each covariate in turn. Lower CAIC coefficients were observed for models that included all the covariates, indicating best fit; as such, all the aforementioned covariates were applied.
Next, a model was built for each outcome variable using a 3-step process, as proposed by Singer and Willett (2003). The first model excluded time to examine the random effect of individual-level variation in the outcome variable. As demonstrated by Shek and Ma (2011), intraclass correlation coefficients (ICC) were calculated for the outcome variables using estimates of covariance parameters as follows: i n t e r c e p t / ( i n t e r c e p t + r e s i d u a l ) . In general, LMMs are justified when ICC values are 0.25 or higher (Shek and Ma 2011); values for the models ranged between 42.55 and 81.90.
The next step was to build an unconditional linear growth curve model to examine changes over time. Assuming there is a statistically significant change in scores over time, further modeling would be required; otherwise, there would be no need for further longitudinal testing (Shek and Ma 2011). Results indicated significant change ( p 0.05 ) across time for the following variables: health striving ( β = 0.30 , S E = 0.17 ), financial striving ( β = 39 , S E = 0.18 ), emotional striving ( β = 0.47 , S E = 0.20 ), health expectancy ( β = 0.33 , S E = 0.16 ), cognitive expectancy ( β = 0.33 , S E = 0.14 ), and cognitive resources ( β = 0.15 , S E = 0.08 ). The final step involved adding the time-invariant group variable and covariates to the seven models just mentioned. Of interest here was to determine whether group type was a predictor of the linear parameters while controlling for covariate effects (Shek and Ma 2011).
Regarding goal striving, LMMs were conducted separately for health, financial, cognitive and emotional resource domains. Significant results were observed only for health goal striving. The Type III F test for fixed effects revealed a significant interaction between time and group, suggesting that the relationship of time and health goal striving varied depending on group type, F ( 6 , 194 ) = 4.46 , p < 0.001 ; the results are illustrated in Figure 2. Estimates of the maximum likelihood of fixed effects at posttraining indicated greater slope parameters for the balanced group compared with the control group at posttraining, ( β = 0.61 , S E = 0.24 , t ( 183.75 ) = 2.58 , p = 0.022 , 95% CI [ 0.14 , 1.08 ] ), and at 3-months, ( β = 0.79 , S E = 0.24 , t ( 227.82 ) = 3.27 , p = 0.002 , 95% CI [ 0.31 , 1.27 ] ). Pairwise comparisons contrasting all time points and groups revealed a significant mean difference of 0.50, ( S E = 0.21 , p = 0.040 , 95% CI [ 0.80 , 0.91 ] ) between balance and control at the 3-month time point. The estimated marginal means at baseline and posttraining represent the same participants ( N = 109 ). Due to attrition, however (see Figure 1), a somewhat smaller number of individuals are represented at the 3- and 6-month follow-ups. The results indicate that striving following the training increased health goals for the balanced group compared to the control group, and the greater level of striving was maintained at three months before declining at six months. As such, Hypothesis 1 was partially supported.
Regarding expectancy of health and cognitive goals, only health expectancy returned significant results. The Type III F test for fixed effects revealed a significant interaction between time and group suggesting that the relationship of time and health goal expectancy varied depending on group type, F ( 6 , 237.19 ) = 3.42 , p = 0.003 ; see Figure 3. Contrary to expectations (Hypothesis 2), at three months, the control group spiked in health expectancy, while, in comparison, negative slopes for the dominant ( β = 0.55 , S E = 0.21 , t ( 232.07 ) = 2.64 , p = 0.018 , 95% CI [ 0.97 , 0.14 ] and balanced ( β = 0.71 , S E = 0.21 , t ( 230.65 ) = 3.34 , p = 0.002 , 95% CI [ 1.12 , 0.29 ] groups indicated relative stability.
Other than the planning perceptions related to health goals, the LMMs failed to reveal significant differences between groups and across time for any of the other resource domains pertaining to goal striving and expectancy.
Similarly, and contrary to expectations (Hypothesis 3), investigations into any changes to the six resource categories did not return significant results.

4.3. Goal Setting Following the Training

Due to similarity in the proportion of participants who set new goals from both the balanced (75.8%) and dominant (73.7%) groups, results were analyzed together. The control group was excluded from this analysis as they were not asked to list their goals. At Time 2 and Time 3, goal setting was measured using the total number of goals set, and the level of specificity of the goals (1–5).
As Table 2 shows, at posttraining, 47 goals were set among 75 individuals, an average of 0.63 goals per participant. In support of Hypothesis 4, at three months, this increased to 74 goals among 71 individuals or 1.04 goals per subject. Likewise, goal specificity increased at three months with the five goals ranging in small to large effect sizes.
For descriptive purposes, the goals were categorized according to resource types (i.e., health, financial, social, cognitive, and emotional); some examples are provided below:
  • Health. “Improve my physical strength through an exercise program” and “Participate in four physical fitness classes per week for balance, strength and lose 5 pounds”.
  • Financial. “Be more attentive to matching expenses with income” and “...adjust my resources to stay within budget”.
  • Social. “I will begin a new volunteer job with hopes of meeting new people” and “...broaden my social skills by getting involved in resident activities that are new to me”.
  • Cognitive. “Learn to play Mahjong” and “To study how to become a bookkeeper, and work on a part-time basis”.
  • Emotional. “Do a better job of expressing feelings” and “Not internalize other people’s problems—listen respectfully”.

4.4. Engagement and Retention

The average retention rate across intervention studies with two or three waves of data collection has been estimated at 60% (e.g., Buller et al. 2008; Duncan et al. 2014; Hirshfield et al. 2012; Horvath et al. 2012; Mak et al. 2015; Myers et al. 2017). Accordingly, approximately 60% sample retention was anticipated for the current study; however, as a measure of ongoing participation and engagement with the training, a greater level of retention was anticipated for both training groups compared to the control group (Hypothesis 5). The retention rate at posttraining for the training conditions combined was 93.75%, a dropout rate of just 6.25%. At three months, 11.25% of training participants had dropped out, whereas half of the control group was lost to attrition. At six months (Time 4), an additional 10.1% of the sample had dropped out. As with Time 3, the control group suffered the greatest proportional reduction in participant numbers with only 38.24% retained, which was considerably below the predetermined 60% benchmark. Conversely, retention was highest among the combined training groups (80.00%) and above the benchmark for the entire study period.

5. Discussion

The primary objective of the present study was the development of two versions of an online intervention aimed at promoting planning behavior among retirees that would lead to greater accumulation of retirement resources. We applied two theoretical frameworks to the intervention, one of which was time perspective (Zimbardo and Boyd 1999). The basis of the underlying two schools of thought—dominant and balanced—was to investigate which was more effective in promoting positive changes to the key outcomes of interest. The second theoretical framework employed was the dynamic resource perspective (Wang et al. 2011); this provided the structure from which to target accumulation of essential resources. Responding to calls for interventions to assist with retirement planning (Earl et al. 2015b; Leandro-França et al. 2016a; Petkoska and Earl 2009; Wang and Shultz 2010), the study provides a practical and theoretical contribution towards furthering our understanding of the role of TP in the context of planning for resources during retirement.
Over the 6-month study period, we expected to find notable improvements in goal perceptions (striving and expectancy) across five resource domains (health, financial, social, emotional and cognitive). Compared with the control group, only striving and expectancy of health goals returned significant results. In both instances, the greatest group differences were observed at the 3-month time point. Interestingly, at this point, the control group experienced a considerable drop in health striving and spike in health expectancy, a pattern reflecting discordant levels of activity and goal perceptions.
On the one hand, an increase in health striving for the balanced group indicates intervention effectiveness from a behavioral perspective that points to a greater level of effort in working towards achieving health related goals. On the other hand, a spike in health goal expectancy for the control group points to a pattern of fluctuation in retirees’ expectations of achieving their health goals. The volatility of the control group in the current sample indicates that perceptions of health goals fluctuate for older individuals and that the training may have had a stabilizing effect as a consequence of having a more realistic assessment of the attainability of their health goals.
In terms of the hypothesized improvements to striving and expectancy in the other resource domains (finance, social, emotional and cognitive), it is possible that the lack of notable increases reflect an unchanged level of importance held for these domains. As Hershey and Jacobs-Lawson (2009) found, goal importance and striving had a strong positive relationship across all goal dimensions with an average standardized beta weight of 0.59. The current study did not assess goal importance and therefore cannot conclude whether this may have been the case. Future studies of goal perceptions would advance knowledge in this regard by including goal importance in their investigations. By extension, changes to level of importance for resource-based goals could explain outcomes related to resource accumulation.
Another possible reason for the nonsignificant goal perception outcomes lies in participants’ dominant TPs. As reported in Table 1, participants were relatively future-focused. Regarding the training groups combined, 37 individuals (about half) were future-dominant. Considering the fact that future-focused individuals are typically planners, our training materials may have been preaching to the converted. The second most prevalent orientation was past-positive with 28 (more than a third) participants. Past-positive individuals do not tend to plan (Earl et al. 2015b), probably because they are satisfied with how things have turned out for them thus far. They may have been more motivated to participate for cognitive stimulation reasons or curiosity rather than to adopt ideas to plan for potential change. Incidentally, both of the observed mean scores lie within 0.07 of the ideal profile score (Zimbardo and Boyd 2021), which leaves little room for improvement.
Future research would likely benefit from having greater TP diversity in the sample. If retirees are predominantly future and past-positive dominant, perhaps invitations to participate could be framed to attract individuals dominant in the other TPs. For example, instead of inviting participation in a study that simply aims to promote planning, a more customized approach could be to take control and manage goals (present-fatalistic leave things to fate), learn from the past to set and manage future goals (past-negative) and offer an incentive as a way of attracting present-hedonistic participants.
Regarding the accumulation of resources, it is likely that obtaining an observable increase would generally require more than six months. For example, a physical goal to increase energy levels may be a long-term goal for most, an emotional goal to boost feelings of self-esteem is difficult for those battling with feelings of self-doubt, a tendency to ‘give up’ at the first sign of difficulty can discourage individuals with a motivational goal to keep plans in motion, or a social goal to spend more time with friends would be difficult if friends are too busy with family commitments. Rather than broad global measures, there seems to be a need for more finely tuned measures such as daily diaries that capture variations in everyday decisions over a period of time. For example, with financial resources, an individual receives their electricity bill and investigates a better deal leading to small financial savings.
The question then arises, if time is the metric upon which we can scale the process of improved planning and resource accumulation, how long after training would changes likely take place? Perhaps a long period of contemplation precedes certain types of goals before a decision is made to plan and take action (e.g., to give up excessive drinking). A starting point would be to look at the transtheoretical model of change developed by Prochaska and DiClemente (1982), which has been widely used (e.g., Armitage and Arden 2008; Marshall and Biddle 2001). The model specifies that behavior modification progresses along five stages: precontemplation (no intention to change), contemplation (thinking about changing), preparation (taking first steps), action (engaging in new behavior) and maintenance (continuing the new behavior). The current training focused primarily on promoting the behavioral processes—from preparation to maintenance—by incorporating implementation intentions (Gollwitzer 1999) to facilitate action; however, the relevant cognitive processes—precontemplation and contemplation—have not been addressed. To address this gap and progress our understanding of the process of planning and resource accumulation beyond the description of the change, future studies should investigate whether participants contemplated engaging in more planning, or contemplated exploring other ways of planning to accrue or maintain resources. Further knowledge in this regard would assist future planning intervention efforts. Seiferling and Michel’s (2017) resource-oriented group intervention study, in which older individuals contemplating retirement increased their personal resources following the intervention, suggests that resource-promoting interventions may be more effective when there is an already existing contemplation about upcoming changes to a new life stage such as retirement in which planning typically takes place.

5.1. Comparing Programs

The ‘balanced’ program encouraged a ‘shift’ closer to the ideal profile—as advocated by Zimbardo and Boyd (2021)—using temporally defined activities, while promoting the association between having a flexible view of time with planning for overall well-being (Boniwell et al. 2010; Sobol-Kwapinska and Jankowski 2016; Stolarski et al. 2016). On the other hand, the ‘dominant’ program focused on the strengths (Peterson and Seligman 2004; Rath 2007; Shatté et al. 2000) of individual TPs, while framing those strengths as the naturally innate positive qualities that one could draw upon to increase planning efforts. While both programs aimed to increase planning and goal setting, the stand-out difference between these two versions of the training was that the ‘dominant’ condition worked with naturally existing traits, whereas the ‘balanced’ condition attempted to improve, at least, the most deviating TP domain toward the ideal.
The current findings indicate that utilizing naturally dominant TPs did not prove to be any more effective in terms of improving planning and goal setting than did encouraging a more balanced orientation. Despite the balance-promoting activities offered in the balanced group training, no significant reduction in the level of deviation from the ideal profile was observed. It was interesting to see, however, that the balanced group mean DBTP scores were lower at posttraining, while the dominant and control groups both further deviated from the ideal to a similar degree. This observation indicates that it may be possible to change TP and promote more temporal balance through intervention. Of course, since the current results lack statistical support, further research is needed with a larger sample to determine whether, in fact, a more balanced profile could be encouraged through TP-based training.
Moreover, a review is warranted of how goal striving was measured. Goal striving was determined from individual responses to a single question and was assessed as the degree of striving towards achieving any of the predetermined resource-based goals. Perhaps it is the case that a single question cannot capture the more granular processes and factors that may contribute to behavioral change (Gollwitzer and Sheeran 2006).
By extension, it is now apparent that the goal striving question—“How much thought and effort have you put into achieving this goal?”—was double-barrelled. For example, the health goal—to “Be healthy and physically fit”—assumes that, if thought goes into setting a goal (mental process), a degree of effort would then be applied (behavioral process) to achieve the goal (Gollwitzer 1999; Locke and Latham 2002); this may not always be the case. For example, thinking about and acknowledging the health benefits of regular exercise do not necessarily lead to a change towards a more active lifestyle, although the thought could lead to a healthier diet. Furthermore, thought may be present for a longer period than sustained effort (Bandura 1997), as any well-intended New Year’s resolution setter knows (Sheldon and Elliot 1999). To tease apart the two processes—thought and effort—two questions should be asked: “How much thought have you put into achieving this goal?” and “How much effort have you put into achieving this goal?” This option would add slightly to participants’ survey burden; however, obtaining more finer-grained measures that may better detect improvements warrants their use.
In terms of the number and specificity of goals, a very similar proportion of participants in both training groups had set new goals. In accordance with earlier versions of retirement planning modules using dominant (Burbury 2015) and balanced (Mooney 2016) TP frameworks, training participants had set a greater number of goals at 3-months (74) compared to posttraining (47). This equates to an average increase of 0.42 goal per subject suggesting that any additional planning undertaken by participants following the training had resulted in setting additional goals. However, current goals at pretraining were not measured; therefore, a pre-post comparison cannot be made. To arrive at a more substantiated conclusion, goals at pre-training should be quantified.
In addition to setting more goals, a comparison of goal specificity values between posttraining and the 3-month follow-up confirmed a significant increase in the specificity of goals, which indicated that more attention was placed on determining the finer details of each goal. This improvement points to the application of SMART Goals (Lawlor and Hornyak 2012) covered in Module 3. According to Locke and Latham (2002), specificity reduces the ambiguity of what needs to be done to attain the goal, thereby increasing the likelihood of goal achievement. The fact that goals were more specific at 3-months provides further support for the need to tease apart the thought and effort parts of the goal striving question.

5.2. Methodological Considerations

The current study investigated linear trajectories of change in planning perceptions and behavior. It is difficult to know the exact time point of when any change takes place (Ployhart and Ward 2011), or where the line actually breaks (in terms of nonlinear patterns), in order to make an a priori nonlinear hypothesis with confidence and take the measurements accordingly (Ployhart and Vandenberg 2010; Shek and Ma 2011). For example, if emotional striving steadily increased after training and peaked two weeks later before declining to its original level six weeks after training, the changes would have gone undetected since measurements were taken three months after training. Although not parsimonious, the chances of detecting changes could be increased by capturing several data points at shorter intervals rather than arbitrarily selecting single points across time.
As Ployhart and Ward (2011) have suggested, due to the issue of participant burden associated with frequent repeated measures, future studies should include planned missingness, a data collection method that surveys subgroups at different time points in order to piece together the trend for the entire sample. Of course, the survey at critical times (such as baseline and posttraining) should be completed by all participants (Ployhart and Ward 2011). This way, researchers would be well-positioned to determine whether the function of change is linear, nonlinear, or discontinuous where it abruptly changes direction (Ployhart and Vandenberg 2010). Understanding how and when change takes place stands to advance the theory of behavioral change following a planning intervention.

5.3. Limitations

The first limitation to bear in mind is that individuals were not randomly assigned to conditions. Participants willing to complete the modules were randomly allocated to the two training groups, whereas controls were not. Rather, due to the lower-than-expected response rate to the pretraining survey, individuals who had previously expressed interest in the training were invited after training had commenced. Non-equivalent groups can pose a threat to internal validity due to the uneven distribution of extraneous variables that may affect accurate explanations of observed posttraining differences (Woodman 2014). Although observed between-group differences were controlled to help partial out some of the threats (Woodman 2014), results need to be considered with this limitation in mind.
Furthermore, generalizability may be limited due to the predominant composition of Caucasian, partnered, well educated, and financially comfortable retirees. Despite the fact that self-selection biases were controlled, greater sample diversity would almost certainly increase goal-linked variability in outcome variables and thereby benefit future investigations. Moreover, as with other retirement planning programs that typically attract low participant numbers (Killen and Macaskill 2015; Leandro-França et al. 2016c; Seiferling and Michel 2017), the present sample size was relatively small. Based on Heo and Leon’s (2010) guidelines, the current sample size ( N = 109 ) fell somewhat short of the estimated 120 needed to detect a two-way interaction with a medium effect size (Cohen 1988; Ellis 2010). As such, statistical power was curtailed and small to medium effects may have been obscured (Vadillo et al. 2016). Also worth considering is the fact that incentives were not offered. It is possible that, had an incentive been offered, the take-up rate would have been greater.
In terms of setting new goals, participants were introduced to the SMART (Lawlor and Hornyak 2012) goal setting strategy in Module 3 and were asked to list up to five goals during the posttraining (Time 2) survey; no suggestion was made for individuals to keep a personal record of the goals. Due to the reliance of goal recall, potential inaccuracies of reported goal progress should be considered.
A further limitation exists in making a reasonable comparison in goal-setting behavior between control and training groups; control participants were not asked to list their goals. One reason for this decision stems from the fact that control participants were invited to complete only the survey after indicating that they were not interested in completing the modules. In order to reduce survey burden, goal-setting items were removed from the survey as they were deemed burdensome and lower in critical value compared with other questionnaires. Given that a much larger proportion of controls dropped out (61.8%) compared with training participants (dominant = 11.5%, balanced = 18.9%), there is reason to assume that any additional survey burden would have contributed to higher levels of attrition among controls.

5.4. Implications for Future Research

The findings of this study have implications for TP theory pertaining to older people. It has been long argued that, as people age, their time orientation becomes more present-focused and their future ‘horizon’ becomes more restricted (Lang and Carstensen 2002). Contrary to Lang and Carstensen’s (2002) assertion that older people have a more limited perception of future time compared to younger people, participants in the present sample had a high future TP. In fact, as Table 1 revealed, they scored highest in future—followed closely by past-positive—compared to the other TP domains. These findings are in accordance with Bitti et al. (2015), who observed that older people with rich past-positive perceptions and an openness to future projects possess a conception of health and positive aging; the present sample had reasonably high mean scores pertaining to resources, goal striving and expectancy. With the vast majority of TP-based studies utilizing younger samples, these findings contribute to our understanding of TP in the older population—in particular, their future time perspective.
In terms of retirement resources, the dynamic resource-based model (Wang et al. 2011) of retirement was adopted as one pillar of the conceptual framework due to the positive relationship found between resources and adjustment in later life (Barbosa et al. 2016; Leung and Earl 2012). A distinction needs to be made between the resource-related focus of people preparing for the transition to retirement and those already retired. Although significant changes to resource levels were not found across all domains, the findings point to the probability that retirees are more concerned about maintaining and managing existing resources rather than accumulating them. This is in accordance with qualitative findings by Kendig et al. (2014) who reported independence, good health and psychological well-being as being the most valued for aging well among older Australians—in other words, maintaining healthy lifestyles. A reduction in resources can be detrimental to retirees as there are fewer opportunities to replenish depleted levels (Yeung 2018). For this reason, it is possible that retirees tend to focus more on preserving what they have and less on chasing opportunities to accumulate additional resources.
To provide sufficient structure and better track the progress of initial goals, a viable motivational approach using implementation intentions should focus on strategies for ‘getting started’ beyond merely stipulating when, where and how to achieve a desired target. Gollwitzer and Sheeran (2006) assert that forgetting to act on new or unfamiliar behavior is the first problem. An older cohort would benefit from learning strategies to recogniz e factors that could potentially influence initial action and inaction, and set reminders to act. Finally, potential goal achievement setbacks were not covered in the training. In the absence of including strategies for overcoming setbacks, goals were at risk of not being fulfilled (Gollwitzer and Sheeran 2006). In developing an improved version of the training, participants should be asked to generate “if…then” plans (e.g., “If I start craving sugary food, then I will go for a 10-minute walk outside”) in order to deal with possible setbacks (Oettingen and Gollwitzer 2010).
One emerging question is “Does the resources model in its current configuration apply to retirees?” In its current form, the model provides a basis for planning for retirement; however, it may need to be modified to guide planning during retirement. The model explains the adjustment experience during transition and early retirement (Dubé et al. 2007); however, there is little evidence to suggest that the same model explains well-being for those living in retirement. For example, since retirees no longer earn income, accumulating financial resources may apply to a lesser extent. Rather, managing assets would be a more relevant concern. As such, engagement with finances, rather than accumulation, is potentially more critical to financial well-being. Furthermore, regarding social resources, it is plausible that accumulating social resources is not as great a priority due to the typical desire to focus on positive experiences and nurture existing relationships in later life, rather than creating new ones, as perhaps younger adults typically would prefer to do (Marsden 2018).
As found, retention of training participants was significantly greater than controls. This observation has implications for our understanding of individuals’ motivation to maintain participation in longitudinal studies. Retention demonstrates that there is an appetite for training in retirement planning and an ongoing preference to change—even at an older age. If people enter a training study with an outcome expectation, asking them beforehand what gains they expect may prompt attention to confirmatory cues, potentially increasing the likelihood of meeting their expectations. Future retention efforts may consider integrating an expectation measure and participant satisfaction in meeting their expectations.

6. Conclusions

Two versions of a TP-based online planning program were designed, administered and evaluated—one with balanced TP themes, the other with dominant TP themes. Both versions aimed to inspire retirees to plan for essential resources and set resource accumulation goals. The program raised awareness about the influence that orientations toward, or against, individual TP domains could have on planning efforts (Zimbardo and Boyd 1999). The resource-based dynamic model of retirement (Wang et al. 2011) was integrated as the evidence-based model from which participants could identify essential retirement resources, assess their adequacy, and set specific goals to accumulate low-level resources. Overall, results of longitudinal analyses revealed that the two training programs provided beneficial effects on goal perceptions, particularly health goals.
Although significant increases in resource levels were not observed, possibly due to the shorter-than-optimal study duration, an increase was observed in the number and specificity of resource-based goals set by the training groups combined.
The notably higher engagement and retention of both training groups (80%), compared to controls (38.2%), combined with the provision of generally positive feedback from participants regarding the modules, shows promise for the application potential of planning interventions. In the context of planning during retirement, where resource depletion is often difficult to recover, we hope to encourage ongoing research interest in planning interventions that address perceptions of goal-setting and resource accumulation.

Author Contributions

Conceptualization, J.K.E. and A.M.; data curation, C.E.T. and A.M.; formal analysis, A.M.; funding acquisition, J.K.E.; methodology, A.M., J.K.E. and D.A.H.; project administration, A.M. and J.K.E.; software, C.H.M.; supervision, J.K.E. and D.A.H.; writing—original draft, A.M.; writing—review and editing, A.M., J.K.E., C.E.T. and D.A.H. All authors have read and agreed to the published version of the manuscript.

Funding

This research was funded by the Australian Research Council, Grant No. DP160100464.

Institutional Review Board Statement

The study was conducted according to the guidelines of the National Statement on Ethical Conduct in Human Research and approved by the Human Research Ethics Committee (Approval No. 5201800148, date of approval 3 April 2018).

Informed Consent Statement

Informed consent was obtained from all subjects involved in the study.

Data Availability Statement

Not available.

Conflicts of Interest

The authors declare no conflict of interest.

References

  1. Abshire, Martha, Victor D. Dinglas, Maan Isabella A. Cajita, Michelle N. Eakin, Dale M. Needham, and Cheryl Dennison Himmelfarb. 2017. Participant retention practices in longitudinal clinical research studies with high retention rates. BMC Medical Research Methodology 17: 1–10. [Google Scholar] [CrossRef] [Green Version]
  2. Adams, Jean. 2009. The role of time perspective in smoking cessation amongst older english adults. Health Psychology 28: 529–34. [Google Scholar] [CrossRef]
  3. Agnew, Julie R., Hazel Bateman, and Susan Thorp. 2013. Financial literacy and retirement planning in australia. Numeracy 6: 1–27. [Google Scholar] [CrossRef] [Green Version]
  4. Aguinis, Herman, Ryan K. Gottfredson, and Harry Joo. 2013. Best-practice recommendations for defining, identifying, and handling outliers. Organizational Research Methods 16: 270–301. [Google Scholar] [CrossRef]
  5. Andersson, Gerhard, Naira Topooco, Odd Havik, and Tine Nordgreen. 2016. Internet-supported versus face-to-face cognitive behaviour therapy for depression. Expert Review of Neurotherapeutics 16: 55–60. [Google Scholar] [CrossRef]
  6. Armitage, Christopher J., and Madelynne A. Arden. 2008. How useful are the stages of change for targeting interventions? Randomized test of a brief intervention to reduce smoking. Health Psychology 27: 789–98. [Google Scholar] [CrossRef] [PubMed] [Green Version]
  7. Armstrong, A. Richard. 2014. When to use the bonferroni correction. Ophthalmic and Physiological Optics 34: 502–8. [Google Scholar] [CrossRef] [PubMed]
  8. Bandura, Albert. 1997. Self Efficacy: The Exercise of Control. New York: Freeman. [Google Scholar]
  9. Barbosa, Leonardo Martins, Bárbara Monteiro, and Sheila Giardini Murta. 2016. Retirement adjustment predictors: A systematic review. Work, Aging and Retirement 2: 262–80. [Google Scholar] [CrossRef]
  10. Barker, Lawrence E., and Kate M. Shaw. 2015. Best (but oft-forgotten) practices: Checking assumptions concerning regression residuals. The American Journal of Clinical Nutrition 102: 533–39. [Google Scholar] [CrossRef] [Green Version]
  11. Baxter, S., M. Johnson, N. Payne, H. Buckley-Woods, L. Blank, E. Hock, A. Daley, A. Taylor, T. Pavey, G. Mountain, and et al. 2016. Promoting and maintaining physical activity in the transition to retirement: A systematic review of interventions for adults around retirement age. Physical Activity 13: 1–10. [Google Scholar] [CrossRef] [Green Version]
  12. Bethlehem, Jelke. 2010. Selection bias in web surveys. International Statistics Review 78: 161–88. [Google Scholar] [CrossRef]
  13. Bitti, Pio Enrico Ricci, Manuela Zambianchi, and Joanna Bitner. 2015. Time perspective and positive aging. In Time Perspective Theory; Review, Research and Application: Essays in Honour of Philip G. Zimbardo. New York: Springer. [Google Scholar] [CrossRef]
  14. Blanton, Sarah, David M. Morris, Michelle G. Prettyman, Karen McCulloch, Susan Redmond, Kathye E. Light, and Steven L. Wolf. 2006. Lessons learned in participant recruitment and retention. Physical Therapy 86: 1520–33. [Google Scholar] [CrossRef]
  15. Boermans, Sylvie, Roos Delahaij, J. E. Korteling, and Martin Euwema. 2012. Training Resilience for High-Risk Environments: Towards a Strength-Based Approach within the Military. West Sussex: John Wiley & Sons. [Google Scholar]
  16. Boniwell, Ilona, Evgeny Osin, P. Alex Linley, and Galina V. Ivanchenko. 2010. A question of balance: Time perspective and well-being in British and Russian samples. The Journal of Positive Psychology 5: 24–40. [Google Scholar] [CrossRef]
  17. Bosangit, Carmela, Sally Hibbert, and Scott McCabe. 2015. “If I was going to die I should at least be having fun”: Travel blogs, meaning and tourism experience. Annals of Tourism Research 55: 1–14. [Google Scholar] [CrossRef] [Green Version]
  18. Bozdogan, Hamparsum. 1987. Model selection and Akaike’s Information Criterion (AIC): The general theory and its analytical extensions. Psychometrika 52: 345–70. [Google Scholar] [CrossRef]
  19. Brandtstädter, Jochen, and Klaus Rothermund. 2002. The life-course dynamics of goal pursuit and goal adjustment: A two-process framework. Developmental Review 22: 117–50. [Google Scholar] [CrossRef]
  20. Brehmer, Yvonne, Helena Westerberg, and Lars Bäckman. 2012. Working-memory training in younger and older adults: Training gains, transfer, and maintenance. Frontiers in Human Neuroscience 6: 1–7. [Google Scholar] [CrossRef] [Green Version]
  21. Brindal, Emily, Jill Freyne, Ian Saunders, Schlomo Berkovsky, Greg Smith, and Manny Noakes. 2012. Features predicting weight loss in overweight or obese participants in a web-based intervention: Randomized trial. Journal of Medical Internet Research 14: e173. [Google Scholar] [CrossRef] [Green Version]
  22. Buller, David B., W. Gill Woodall, Donald E. Zimmerman, Michael D. Slater, Jerianne Heimendinger, Emily Waters, Joan M. Hines, Randall Starling, Barbara Hau, Patricia Burris-Woogall, and et al. 2008. Randomized trial on the 5 a Day, the Rio Grande Way website, a web-based program to improve fruit and vegetable consumption in rural communities. Journal of Health Communication 13: 230–49. [Google Scholar] [CrossRef] [Green Version]
  23. Burbury, Bianca. 2015. A ‘Time Perspective’ Focused Training Intervention to Improve Planning Behaviour for Retirement. Honours thesis, University of New South Wales, Sydney, Australia. [Google Scholar]
  24. Cattell, Raymond B. 1966. The scree test for the number of factors. Multivariate Behavioral Research 1: 245–76. [Google Scholar] [CrossRef]
  25. Chang, Bei-Hung, Ann M. Hendricks, Mara T. Slawsky, and Joseph S. Locastro. 2004. Patient recruitment to a randomized clinical trial of behavioural therapy for chronic heart failure. BMC Medical Research Methodology 4: 1–10. [Google Scholar] [CrossRef] [PubMed] [Green Version]
  26. Cohen, Jacob. 1988. Statistical Power Analysis for the Behavioural Sciences. Hillsdale: Lawrence Erlbaum Associates. [Google Scholar]
  27. Cohen-Mansfield, Jiska, and Irit Regev. 2018. Retirement preparation programs: An examination of retirement perceptions, self-mastery, and well-being. Research on Social Work Practice 28: 428–37. [Google Scholar] [CrossRef]
  28. Donaldson, Tarryn, Joanne K. Earl, and Alexa M. Muratore. 2010. Extending the integrated model of retirement adjustment: Incorporating mastery and retirement planning. Journal of Vocational Behaviour 77: 279–89. [Google Scholar] [CrossRef]
  29. Drake, Lisa, Elaine Duncan, Fi Sutherland, Clare Abernethy, and Colette Henry. 2008. Time perspective and correlates of wellbeing. Time and Society 17: 47–61. [Google Scholar] [CrossRef] [Green Version]
  30. Dubé, M., S. Lapierre, L. Bouffard, and M. Alain. 2007. Impact of a personal goals management program on the subjective well-being of young retirees. Revue Européenne de Psychologie Appliquée 57: 183–92. [Google Scholar] [CrossRef]
  31. Duncan, Mitch, Corneel Vandelanotte, Gregory S. Kolt, Richard R. Rosenkranz, Christina M. Caperchione, Emma S. George, Hang Ding, Cindy Hooker, Mohan Karunanithi, Anthony J. Maeder, and et al. 2014. Effectiveness of a web-based and mobile phone-based intervention to promote physical activity and healthy eating in middle-aged males: Randomized controlled trial of the ManUp study. Journal of Medical Internet Research 16: e136. [Google Scholar] [CrossRef] [Green Version]
  32. Dziak, John J., Donna L. Coffman, Stephanie T. Lanza, Runze Li, and Lars S. Jermiin. 2020. Sensitivity and Specificity of Information Criteria. Briefings in Bioinformatics 21: 553–65. [Google Scholar] [CrossRef] [PubMed]
  33. Earl, Joanne K., Alexa Muratore, Cindy Leung, and Tin Wei Yu. 2015a. Career Interventions: Retirement. Washington, DC: American Psychological Association, pp. 535–48. [Google Scholar] [CrossRef]
  34. Earl, Joanne K., Timothy C. Bednall, and Alexa M. Muratore. 2015b. A matter of time: Why some people plan for retirement and others do not. Work, Aging and Retirement 1: 181–89. [Google Scholar] [CrossRef] [Green Version]
  35. Ellis, Paul D. 2010. The Essential Guide to Effect Sizes: Statistical Power, Meta-Analyses, and the Interpretation of Research Results. New York: Cambridge University Press. [Google Scholar]
  36. Eysenbach, Gunther. 2005. The law of attrition. Journal of Medical Internet Research 7: 1–9. [Google Scholar] [CrossRef]
  37. Gerace, Adam, Andrew Day, Sharon Casey, and Philip Mohr. 2017. ‘I think, you think’: Understanding the importance of self-reflection to the taking of another person’s perspective. Journal of Relationships Research 8: 1–66. [Google Scholar] [CrossRef] [Green Version]
  38. Goldstein, Noah J., I. Stephanie Vezich, and Jenessa R. Shapiro. 2014. Perceived perspective taking: When others walk in our shoes. Journal of Personality and Social Psychology 106: 941–60. [Google Scholar] [CrossRef] [PubMed] [Green Version]
  39. Gollwitzer, Peter M. 1999. Implementation intentions: Strong effects of simple plans. The American Psychologist 54: 493–503. [Google Scholar] [CrossRef]
  40. Gollwitzer, Peter M., and Paschall Sheeran. 2006. Implementation intentions and goal achievement: A meta-analysis of effects and processes. Advances in Experimental Social Psychology 38: 69–119. [Google Scholar] [CrossRef] [Green Version]
  41. Gul, Raisa B., and Parveen A. Ali. 2010. Clinical trials: The challenge of recruitment and retention of participants. Journal of Clinical Nursing 19: 227–33. [Google Scholar] [CrossRef]
  42. Gupta, Ritu, Douglas A. Hershey, and Jighyasu Gaur. 2012. Time perspective and procrastination in the workplace: An empirical investigation. Current Psychology 31: 195–211. [Google Scholar] [CrossRef]
  43. Gupta, Sandeep K. 2011. Intention-to-treat concept: A review. Perspectives in Clinical Research 2: 109–12. [Google Scholar] [CrossRef]
  44. Hansson, Isabelle, Sandra Buratti, Boo Johansson, and Anne Ingeborg Berg. 2019. Beyond health and economy: Resource interactions in retirement adjustment. Aging and Mental Health 23: 1546–54. [Google Scholar] [CrossRef] [Green Version]
  45. Henning, Georg, Andreas Stenling, Susanne Tafvelin, Isabelle Hansson, Marie Kivi, Boo Johansson, and Magnus Lindwall. 2019. Preretirement work motivation and subsequent retirement adjustment: A self-determination theory perspective. Work, Aging and Retirement 5: 189–203. [Google Scholar] [CrossRef]
  46. Heo, Moonseong, and Andrew C. Leon. 2010. Sample sizes required to detect two-way and three-way interactions involving slope differences in mixed-effects models. Journal of Biopharmaceutical Statistics 20: 787–802. [Google Scholar] [CrossRef]
  47. Hershey, Douglas A., and John C. Mowen. 2000. Psychological determinants of financial preparedness for retirement. The Gerontologist 40: 687–97. [Google Scholar] [CrossRef] [PubMed]
  48. Hershey, Douglas A., and Joy M. Jacobs-Lawson. 2009. Goals for retirement: Content, structure and process. In New Directions in Aging Research. Edited by R. R. Brougham. New York: Nova Science Publishers, Inc., Chapter 9. pp. 167–86. [Google Scholar]
  49. Hershey, Douglas A., and Kène Henkens. 2013. Impact of different types of retirement transitions on perceived satisfaction with life. The Gerontologist 54: 232–44. [Google Scholar] [CrossRef] [Green Version]
  50. Hershey, Douglas A., Kène Henkens, and Hendrik P. van Dalen. 2010. Aging and financial planning for retirement: Interdisciplinary influences viewed through a cross-cultural lens. The International Journal of Aging and Human Development 70: 1–38. [Google Scholar] [CrossRef] [PubMed] [Green Version]
  51. Hirshfield, Sabina, Mary Ann Chiasson, Heather Joseph, Reoberta Scheinmann, Wayne D. Johnson, Robert H. Remien, Francine Shuchat Shaw, Reed Emmons, Gary Yu, and Andrew D. Margolis. 2012. An online randomized controlled trial evaluating HIV prevention digital media interventions for men who have sex with men. PLoS ONE 7: e46252. [Google Scholar] [CrossRef] [PubMed] [Green Version]
  52. Hollis, Sally, and Fiona Campbell. 1999. What is meant by intention to treat analysis? Survey of published randomised controlled trials. British Medical Journal 319: 670–74. [Google Scholar] [CrossRef] [PubMed] [Green Version]
  53. Horvath, Keith J., Kate Nygaard, Gene P. Danilenko, Sinan Goknur, Michael Oakes, and B. R. Simon Rosser. 2012. Strategies to retain participants in a long-term HIV prevention randomized controlled trial: Lessons from the MINTS-II study. AIDS Behavior 16: 469–79. [Google Scholar] [CrossRef] [PubMed] [Green Version]
  54. Humpel, Nancy, Kate O’Loughlin, Yvonne Wells, and Hal Kendig. 2010. The health of australian baby boomers. Australasian Journal on Ageing 29: 8–13. [Google Scholar] [CrossRef]
  55. Hurtado, Maria Dolores, and Gabriela Topa. 2019. Quality of life and health: Influence of preparation for retirement behaviors through the serial mediation of losses and gains. International Journal of Environmental Research and Public Health 16: 1539. [Google Scholar] [CrossRef] [Green Version]
  56. Kazakina, Elena. 2015. The Uncharted Territory; Time Perspective Research Meets Clinical Practice: Temporal Focus in Psychotherapy across Adulthood and Old Age. New York: Springer, pp. 499–516. [Google Scholar] [CrossRef]
  57. Kendig, Hal, Collette J. Browning, Shane A. Thomas, and Yvonne Wells. 2014. Health, lifestyle, and gender influences on aging well: An Australian longitudinal analysis to guide health promotion. Frontiers in Public Health 2: 1–9. [Google Scholar] [CrossRef]
  58. Keough, Kelli A., Philip G. Zimbardo, and John N. Boyd. 1999. Who’s smoking, drinking, and using drugs? Time perspective as a predictor of substance abuse. Basic and Applied Social Psycholgy 21: 149–64. [Google Scholar] [CrossRef]
  59. Killen, Alison, and Ann Macaskill. 2015. Using a gratitude intervention to enhance well-being in older adults. Journal of Happiness Studies 16: 947–64. [Google Scholar] [CrossRef] [Green Version]
  60. Kim, Hae-Young. 2013. Statistical notes for clinical researchers: Assessing normal distribution (2) using skewness and kurtosis. Restorative Dentistry and Endodontics 38: 52–54. [Google Scholar] [CrossRef] [PubMed]
  61. Kim, Jungmeen E., and Phyllis Moen. 2002. Retirement transitions, gender, and psychological well-being: A life-course, ecological model. Journal of Gerontology: Psychological Sciences 57: 212–22. [Google Scholar] [CrossRef] [PubMed] [Green Version]
  62. Kojola, Erik, and Phyllis Moen. 2016. No more lock-step retirement: Boomer’s shifting meanings of work and retirement. Journal of Aging Studies 36: 59–70. [Google Scholar] [CrossRef]
  63. Kooij, Dorien T. A. M., Ruth Kanfer, Matt Betts, and Cort W. Rudolf. 2018. Future time perspective: A systematic review and meta-analysis. Journal of Applied Psychology 103: 867–93. [Google Scholar] [CrossRef] [PubMed]
  64. Lang, Frieder R., and Laura L. Carstensen. 2002. Time counts: Future time perspective, goals, and social relationships. Psychology and Aging 17: 125–39. [Google Scholar] [CrossRef]
  65. Lappalainen, Paivi, Anna Granlund, Sari Siltanen, Suvi Ahonen, Minna Vitikainen, Asko Tolvanen, and Raimo Lappalainen. 2014. ACT Internet-based vs face-to-face? A randomized controlled trial of two ways to deliver acceptance and commitment therapy for depressive symptoms: An 18-month follow-up. Behaviour Research and Therapy 61: 43–54. [Google Scholar] [CrossRef]
  66. Lawlor, K. Blaine, and Martin J. Hornyak. 2012. SMART goals: How the application of SMART goals can contribute to achievement of student learning outcomes. Developments in Business Simulation and Experiential Learning 39: 259–67. [Google Scholar]
  67. Leandro-França, Cristineide, Hanna van Solinge, Kène Henkens, and Sheila Giardini Murta. 2016a. Effects of three types of retirement preparation program: A qualitative study of civil servants in Brazil. Educational Gerontology 42: 388–400. [Google Scholar] [CrossRef] [Green Version]
  68. Leandro-França, Cristineide, Juliana Seidl, and Sheila Giardini Murta. 2016b. Brief intervention as a strategy for retirement planning: Turning intentions into actions. Psicologia em Estudo 20: 543–53. [Google Scholar] [CrossRef] [Green Version]
  69. Leandro-França, Cristineide, Sheila Giardinin Murta, Douglas A. Hershey, and Leonardo Barbosa Martins. 2016c. Evaluation of retirement planning programs: A qualitative analysis of methodologies and efficacy. Educational Gerontology 42: 497–512. [Google Scholar] [CrossRef]
  70. Lee, Chungsup, Laura L. Payne, and Liza Berdychevsky. 2020. The roles of leisure attitudes and self-efficacy on attitudes toward retirement among retirees: A sense of coherence theory approach. Leisure Sciences 42: 152–69. [Google Scholar] [CrossRef] [Green Version]
  71. Legrand, Eve, Maik Bieleke, Peter M. Gollwitzer, and Astrid Mignon. 2017. Nothing will stop me? Flexibly tenacious goal striving with implementation intentions. Motivation Science 3: 101–18. [Google Scholar] [CrossRef]
  72. Leung, Cindy S. Y., and Joanne K. Earl. 2012. Retirement resources inventory: Construction, factor structure and psychometric properties. Journal of Vocational Behaviour 81: 171–82. [Google Scholar] [CrossRef]
  73. Linley, P. Alex, and Stephen Joseph. 2004. Positive Psychology in Practice. Hoboken: John Wiley & Sons. [Google Scholar]
  74. Linley, P. Alex, Karina M. Nielsen, Raphael Gillett, and Robert Biswas-Diener. 2010. Using signature strengths in pursuit of goals: Effects on goal progress, need satisfaction, and well-being, and implications for coaching psychologists. International Coaching Psychology Review 5: 6–15. [Google Scholar]
  75. Locke, Edwin A., and Gary P. Latham. 2002. Building a practically useful theory of goal setting and task motivation: A 35-year odyssey. American Psychologist 57: 705–17. [Google Scholar] [CrossRef] [Green Version]
  76. Löckenhoff, Corinna E. 2012. Understanding retirement: The promise of life-span developmental frameworks. European Journal of Ageing 9: 227–31. [Google Scholar] [CrossRef] [PubMed] [Green Version]
  77. Mak, Winnie W. S., Amy T. Y. Chan, Eliza Y. L. Cheung, Cherry L. Y. Lin, and Karin C. S. Ngai. 2015. Enhancing web-based mindfulness training for mental health promotion with the health action process approach: Randomized controlled trial. Journal of Medical Internet Research 17: e8. [Google Scholar] [CrossRef] [Green Version]
  78. Marsden, Peter V. 2018. Life Course Events and Network Composition. Cham: Springer, pp. 89–113. [Google Scholar]
  79. Marshall, Simon J., and Stuart J. H. Biddle. 2001. The transtheoretical model of behaviour change: A meta-analysis of applications to physical activity and exercise. Annals of Behavioral Medicine 23: 229–46. [Google Scholar] [CrossRef]
  80. Martijn, Carolien, Hugo Alberts, Paschal Sheeran, Gjalt-Jorn Y. Peters, Jochen Mikolajczak, and Nanne K. de Vries. 2008. Blocked goals, persistent action: Implementation intentions engender tenacious goal striving. Journal of Experimental Social Psychology 44: 1137–43. [Google Scholar] [CrossRef] [Green Version]
  81. McKay, Michael T., Frank C. Worrell, Urska Zivkovic, Elizabeth Temple, Zena R. Mello, Bojan Musil, Jon C. Cole, James R. Andretta, and John L. Perry. 2018. A balanced time perspective: Is it an exercise in empiricism, and does it relate meaningfully to health and well-being outcomes? International Journal of Psychology 54: 1–11. [Google Scholar] [CrossRef]
  82. McSweeney, Jean C., Christina M. Pettey, Ellen P. Fischer, and Alisa Spellman. 2009. Going the distance: Overcoming challenges in recruitment and retention of black and white women in a multisite, longitudinal study of predictors of coronary heart disease. Research in Gerontological Nursing 2: 256–64. [Google Scholar] [CrossRef]
  83. Mooney, Anna. 2016. Enhancing Planning Behaviour in Retirees Using Time Perspective. Honours thesis, Flinders University, Adelaide, Australia. [Google Scholar]
  84. Mulaik, Stanley A. 2010. Foundations of Factor Analysis, 2nd ed. Statistics in the Social and Behavioral Sciences Series. Boca Raton: Chapman & Hall/CRC. [Google Scholar]
  85. Muratore, Alexa Marie, and Joanne Kaa Earl. 2015. Improving retirement outcomes: The role of resources, pre-retirement planning and transition characteristics. Ageing and Society 35: 2100–40. [Google Scholar] [CrossRef]
  86. Myers, Nicholas D., Isaac Prilleltensky, Adam McMahon, Samantha Dietz, and Carolyn L. Rubinstein. 2017. Efficacy of the fun for wellness online intervention to promote multidimentional well-being: A randomized controlled trial. Prevention Science 18: 984–94. [Google Scholar] [CrossRef] [PubMed]
  87. Nam, Seungwon, and Tony Toneatto. 2016. The influence of attrition in evaluating the efficacy and effectiveness of mindfulness-based interventions. International Journal of Mental Health and Addiction 14: 969–81. [Google Scholar] [CrossRef]
  88. Newell, David J. 1992. Intention-to-treat analysis: Implications for quantitative and qualitative research. International Journal of Epidemiology 21: 837–41. [Google Scholar] [CrossRef] [PubMed] [Green Version]
  89. Newman, Michelle G., Lauren E. Szkodny, Sandra J. Llera, and Amy Przeworski. 2011. A review of technology-assisted self-help and minimal contact therapies for drug and alcohol abuse and smoking addiction: Is human contact necessary for therapeutic efficacy? Clinical Psychology Review 31: 178–86. [Google Scholar] [CrossRef] [PubMed]
  90. Ng, Siu-Man, Lingli Leng, and Qi Wang. 2019. Active interest mentorship for soon-to-retire people: A self-sustaining retirement preparation program. Journal of Applied Gerontology 38: 344–64. [Google Scholar] [CrossRef] [Green Version]
  91. Noone, Jack H., Fiona Alpass, and Christine Stephens. 2010. Do men and women differ in their retirement planning? Testing a theoretical model of gendered pathways to retirement preparation. Research on Aging 32: 715–38. [Google Scholar] [CrossRef]
  92. Noone, Jack H., Kate O’Loughlin, and Hal Kendig. 2012. Socioeconomic, psychological and demographic determinants of Australian baby boomers’ financial planning for retirement. Australasian Journal on Ageing 31: 194–97. [Google Scholar] [CrossRef]
  93. Oettingen, Gabriele, and Peter M. Gollwitzer. 2010. Strategies of Setting and Implementing Goals: Mental Contrasting and Implementation Intentions. New York: Guilford Press, pp. 114–35. [Google Scholar]
  94. Olem, David, Kelly M. Sharp, and Mallory O. Johnson. 2009. Challenges with engaging participants in behavioural intervention research trials. Open Access Journal of Clinical Trials 1: 17–21. [Google Scholar]
  95. Papies, Esther K., Henk Aarts, and Nanne K. de Vries. 2009. Planning is for doing: Implementation intentions go beyond the mere creation of goal-directed associations. Journal of Experimental Social Psychology 45: 1148–51. [Google Scholar] [CrossRef] [Green Version]
  96. Peterson, Christopher, and Martin Seligman. 2004. Character Strengths and Virtues: A Handbook and Classification. Oxford: Oxford University Press. [Google Scholar]
  97. Petkoska, Jasmina, and Joanne K. Earl. 2009. Understanding the influence of demographic and psychological variables on retirement planning. Psychology and Aging 24: 245–51. [Google Scholar] [CrossRef]
  98. Ployhart, Robert E., and Robert J. Vandenberg. 2010. Longitudinal research: The theory, design, and analysis of change. Journal of Management 36: 94–120. [Google Scholar] [CrossRef]
  99. Ployhart, Robert E., and Anne-Katherine Ward. 2011. The “quick start guide” for conducting and publishing longitudinal research. Journal of Business and Psychology 26: 413–22. [Google Scholar] [CrossRef]
  100. Prochaska, James O., and Carlo C. DiClemente. 1982. Transtheoretical therapy: Toward a more intergrative model of change. Psychotherapy Theory Research and Practice 19: 276–88. [Google Scholar] [CrossRef]
  101. Rafalski, Julia C., Jack H. Noone, Kate O’Loughlin, and Alexsandro L. de Andrade. 2017. Assessing the process of retirement: A cross-cultural review of available measures. Journal of Cross-Cultural Gerontology 32: 255–79. [Google Scholar] [CrossRef]
  102. Rath, Tom. 2007. Strengths Finder 2.0. New York: Gallup Press. [Google Scholar]
  103. Robinson, Karen A., Victor D. Dinglas, Vineeth Sukrithan, Ramakrishna Yalamanchili, Pedro A. Mendez-Tellez, Cheryl Dennison-Himmelfarb, and Dale M. Needham. 2015. Updated systematic review identifies substantial number of retention strategies: Using more strategies retains more study participants. Journal of Clinical Epidemiology 68: 1481–87. [Google Scholar] [CrossRef] [Green Version]
  104. Rolstad, Sidre, John Adler, and Anna Rydén. 2011. Response burden and questionnaire length: Is shorter better? A review and meta-analysis. SciVerse ScienceDirect 14: 1101–8. [Google Scholar] [CrossRef] [Green Version]
  105. Rönnlund, Michael, Elisabeth Åström, and Maria Grazia Carelli. 2017. Time perspective in late adulthood: Aging patterns in past, present and future dimensions, deviations from balance, and associations with subjective well-being. Timing and Time Perception 5: 77–98. [Google Scholar] [CrossRef]
  106. Ryan, Richard M., and Edward L. Deci. 2017. Self-Determination Theory: Basic Psychological Needs in Motivation, Development, and Wellness. New York: The Guilford Press. [Google Scholar]
  107. Schultz, Kenneth S., and Mo Wang. 2011. Psychological perspectives on the changing nature of retirement. American Psychologist 66: 1–10. [Google Scholar] [CrossRef]
  108. Schutte, Nicola S., and John M. Malouff. 2019. The impact of signature character strengths interventions: A meta-analysis. Journal of Happiness Studies 20: 1179–96. [Google Scholar] [CrossRef]
  109. Sedgwick, Philip. 2015. Intention to treat analysis versus per protocol analysis of trial data. British Medical Journal 350: 1–2. [Google Scholar] [CrossRef]
  110. Seiferling, Nadine, and Alexandra Michel. 2017. Building resources for retirement transition: Effects of a resource-oriented group intervention on retirement cognitions and emotions. Work, Aging and Retirement 3: 1–18. [Google Scholar] [CrossRef]
  111. Seo, Eunjin, Erika Patall, Marlone D. Henderson, and Rebecca R. Steingut. 2018. The effects of goal origin and implementation intentions on goal commitment, effort, and performance. The Journal of Experimental Education 86: 386–401. [Google Scholar] [CrossRef]
  112. Shatté, Andrew J., Karen Reivich, and Martin E. P. Seligman. 2000. Promoting human strengths and corporate competencies: A cognitive training model. The Psychologist-Manager Journal 4: 183–96. [Google Scholar] [CrossRef]
  113. Shek, Daniel T. L., and Cecilia M. S. Ma. 2011. Longitudinal data analyses using linear mixed models in SPSS: Concepts, procedures and illustrations. The Scientific World Journal 11: 42–76. [Google Scholar] [CrossRef] [Green Version]
  114. Sheldon, Kennon M., and Andrew J. Elliot. 1999. Goal striving, need satisfaction, and longitudinal well-being: The self-concordance model. Journal of Personality and Social Psychology 76: 482–97. [Google Scholar] [CrossRef]
  115. Singer, Judith D., and John B. Willett. 2003. Applied Longitudinal Data Analysis: Modeling Change and Event Occurrence. New York: Oxford University Press. [Google Scholar]
  116. Sirois, Fuschia M. 2014. Out of sight, out of time? A meta-analytic investigation of procrastination and time perspective. European Journal of Personality 28: 511–20. [Google Scholar] [CrossRef]
  117. Sitzmann, Traci, and Justin M. Weinhardt. 2018. Training engagement theory: A multilevel perspective on the effectiveness of work-related training. Journal of Management 44: 732–56. [Google Scholar] [CrossRef]
  118. Sobol-Kwapinska, Malgorzata, and Tomasz Jankowski. 2016. Positive time: Balanced time perspective and positive orientation. Journal of Happiness Studies 17: 1511–28. [Google Scholar] [CrossRef] [Green Version]
  119. Stansbury, Jessica A., and David R. Earnest. 2017. Meaningful gamification in an industrial/ooganizational psychology course. Teaching of Psychology 44: 38–45. [Google Scholar] [CrossRef]
  120. Stawski, Robert S., Douglas A. Hershey, and Joy M. Jacobs-Lawson. 2007. Goal clarity and financial planning activities as determinants of retirement savings contributions. International Journal of Aging and Human Development 1: 13–32. [Google Scholar] [CrossRef] [Green Version]
  121. Stolarski, Maciej, and Maria Cyniak-Cieciura. 2016. Balanced and less traumatized: Balanced time perspective mediates the relationship between temperament and severity of PTSD syndrome in motor vehicle accident survivor sample. Personality and Individual Differences 101: 456–61. [Google Scholar] [CrossRef]
  122. Stolarski, Maciej, Joanna Bitner, and Philip G. Zimbardo. 2011. Time perspective, emotional intelligence and discounting of delayed awards. Time and Society 20: 346–63. [Google Scholar] [CrossRef]
  123. Stolarski, Maciej, Jonte Vowinckel, Konrad S. Jankowski, and Marcin Zajenkowski. 2016. Mind the balance, be contented: Balanced time perspective mediates the relationship between mindfulness and life satisfaction. Personality and Individual Differences 93: 27–31. [Google Scholar] [CrossRef]
  124. Sword, Richard M., Rosemary K. M. Sword, Sarah R. Brunskill, and Philip G. Zimbardo. 2014. Time perspective therapy: A new time-based metaphor therapy for PTSD. Journal of Loss and Trauma 19: 197–201. [Google Scholar] [CrossRef]
  125. Szczesniak, Malgorzata, and Celina Timoszyk-Tomczak. 2018. A time for being thankful: Balanced time perspective and gratitude. Studia Psychologica 60: 150–66. [Google Scholar] [CrossRef]
  126. Tabachnick, Barbara G., and Linda S. Fidell. 2013. Using Multivariate Statistics, 6th ed. Boston: Pearson Education. [Google Scholar]
  127. Topa, Gabriela, and Inmaculada Pra. 2018. Retirement adjustment quality: Optimism and self-efficacy as antecedents of resource accumulation. Applied Research in Quality of Life 13: 1015–35. [Google Scholar] [CrossRef]
  128. Topa, Gabriela, Gregg Lunceford, and Richard E. Boyatzis. 2018a. Financial planning for retirement: A psychosocial perspective. Frontiers in Psychology 8: 1–8. [Google Scholar] [CrossRef]
  129. Topa, Gabriela, Marco Depolo, and Carlos-Maria Alcover. 2018b. Early retirement: A meta-analysis of its antecedents and subsequent correlates. Frontiers in Psychology 8: 1–24. [Google Scholar] [CrossRef]
  130. Travers, Cheryl J., Dominique Morisano, and Edwin A. Locke. 2015. Self-reflection, growth goals, and academic outcomes: A qualitative study. British Journal of Educational Psychology 85: 224–41. [Google Scholar] [CrossRef]
  131. Tsotsoros, Cindy E., Anna Mooney, Joanne K. Earl, and Douglas A. Hershey. 2021. Retirees’ perceptions of goal expectancy in five resource domains. Current Psychology, 1–15. [Google Scholar] [CrossRef]
  132. Vadillo, Miguel A., Emmanouil Konstantinidis, and David R. Shanks. 2016. Underpowered samples, false negatives, and unconscious learning. Psychonomic Bulletin and Review 23: 87–102. [Google Scholar] [CrossRef] [PubMed] [Green Version]
  133. Wade, John C., and Janice E. Jones. 2015. Strengths-Based Clinical Supervision: A Positive Psychology Approach to Clinical Training. New York: Springer. [Google Scholar]
  134. Wang, Mo. 2007. Profiling retirees in the retirement transition and adjustment process: Examining the longitudinal change patterns of retirees’ psychological well-being. Journal of Applied Psychology 92: 455–74. [Google Scholar] [CrossRef] [PubMed]
  135. Wang, Mo, and Beryl Hesketh. 2012. Achieving Well-Being in Retirement: Recommendations from 20 Years of Research. Bowling Green: Society for Human Resource Management and Society for Industrial and Organizational Psychology. [Google Scholar]
  136. Wang, Mo, and Junqi Shi. 2014. Psychological research on retirement. Annual Review of Psychology 65: 209–33. [Google Scholar] [CrossRef]
  137. Wang, Mo, and Kenneth S. Shultz. 2010. Employee retirement: A review and recommendations for future investigation. Journal of Management 36: 172–206. [Google Scholar] [CrossRef]
  138. Wang, Mo, Kene Henkens, and Hanna van Solinge. 2011. Retirement adjustment: A review of theoretical and empirical advancements. American Psychologist 66: 204–13. [Google Scholar] [CrossRef] [Green Version]
  139. Webster, Jeffrey Dean, Ernst T. Bohlmeijer, and Gerben J. Westerhof. 2014. Time to flourish: The relationship of temporal perspective to well-being and wisdom across adulthood. Aging & Mental Health 18: 1046–56. [Google Scholar] [CrossRef]
  140. West, Brady T. 2009. Analyzing longitudinal data with the linear mixed models procedure in SPSS. Evaluation and the Health Professions 32: 207–28. [Google Scholar] [CrossRef]
  141. White, Ian R., James Carpenter, and Nicholas J. Horton. 2012. Including all individuals is not enough: Lessons for intention-to-treat analysis. Clinical Trials 9: 396–407. [Google Scholar] [CrossRef] [Green Version]
  142. Wieber, Frank, J. Lukas Thürmer, and Peter M. Gollwitzer. 2015. Promoting the translation of intentions into action by implementation intentions: Behavioral effects and physiological correlates. Frontiers in Human Neuroscience 9: 1–18. [Google Scholar] [CrossRef] [PubMed] [Green Version]
  143. Woodman, Richard W. 2014. The role of internal validity in evaluation research on organizational change interventions. The Journal of Applied Behavioral Science 50: 40–49. [Google Scholar] [CrossRef]
  144. Yeung, Dannii Y. 2018. Adjustment to retirement: Effects of resource change on physical and psychological well-being. European Journal of Ageing 15: 301–9. [Google Scholar] [CrossRef] [PubMed]
  145. Zabelina, E., Yu. Chestyunina, I. Trushina, and E. Vedeneyeva. 2018. Time perspective as a predictor of procrastination. Procedia—Social and Behavioral Sciences 238: 87–93. [Google Scholar] [CrossRef]
  146. Zhang, Jia Wei, Ryan T. Howell, and Maciej Stolarski. 2013. Comparing three methods to measure a balanced time perspective: The relationship between a balanced time perspective and subjective well-being. Journal of Happiness Studies 14: 169–84. [Google Scholar] [CrossRef]
  147. Zimbardo, Philip G., and John Boyd. 2008. The Time Paradox: The New Psychology of Time that Can Change Your Life. New York: Simon and Schuster, Inc. [Google Scholar]
  148. Zimbardo, Philip G., and John N. Boyd. 1999. Putting time in perspective: A valid, reliable individual-differences metric. Journal of Personality and Social Psychology 77: 1271–88. [Google Scholar] [CrossRef]
  149. Zimbardo, Philip G., and John N. Boyd. 2021. The Time Paradox: The New Psychology of Time That will Change Your Life. Available online: http://www.thetimeparadox.com/ (accessed on 20 February 2021).
  150. Zimbardo, Philip G., Kelli A. Keough, and John N. Boyd. 1997. Present time perspective as a predictor of risky driving. Personality and Individual Differences 23: 1007–23. [Google Scholar] [CrossRef]
Figure 1. Study flowchart of the recruitment, training and follow-up process. RC = Retirement community.Study flowchart of the recruitment, training and follow-up process.
Socsci 10 00306 g001
Figure 2. Estimated marginal means for health goal striving between groups across time. Error bars represent standard errors.Estimated marginal means for health goal striving between groups across time.
Socsci 10 00306 g002
Figure 3. Estimated marginal means for health goal expectancy between groups across time. Error bars represent standard errors.
Socsci 10 00306 g003
Table 1. Means, standard deviations, and correlation coefficients among key variables.
VariableMeanSD1234567891011121314151617181920212223
Demographics
1. Age74.096.79
2. Years retired12.338.240.53 **
Time perspective
3. PN2.440.58−0.05−0.11
4. PP3.600.520.070.04−0.26 **
5. PF2.130.500.07−0.140.50 **−0.09
6. PH3.140.430.150.020.080.090.26 **
7. Future3.700.44−0.080.09−0.060.18−0.42 **−0.27 **
8. DBTP1.670.38−0.17−0.160.45 **−0.32 **0.26 **−0.57 **0.09
Resources
9. Physical3.970.610.110.13−0.240.08−0.150.160.04−0.16
10. Financial3.850.650.000.20 *−0.21 *0.12−0.20 *−0.170.24 *−0.02−0.02
11. Social3.160.600.070.02−0.040.38 **−0.140.200.09−0.27 **0.100.16
12. Emotional3.840.51−0.22 *−0.15−0.31 **0.24 *−0.37 **0.130.14−0.180.28 **−0.030.35 **
13. Cognitive3.780.39−0.050.12−0.25 **0.150.29 **−0.020.22 *−0.090.100.070.190.29 **
14. Motivational 4.020.500.080.30 **−0.21 **0.39 **0.37 **0.100.26 **−0.33 **0.28 **0.24 *0.31 **0.26 **0.34 **
Goal Striving
15. Health3.800.950.170.28 **−0.060.12−0.090.27 **−0.01−0.160.44 **0.09−0.010.170.150.40 *
16. Financial4.310.72−0.030.15−0.070.19−0.22 *−0.100.32 **−0.130.060.27 **0.160.110.160.36 **0.22
17. Social3.440.910.060.110.020.26 **0.050.27 **−0.09−0.27 **0.050.030.38 **0.160.090.180.29 **0.28 **
18. Cognitive3.900.810.34 **0.28 **−0.22 *0.23 *−0.24 *0.120.13−0.270.190.080.200.200.240.42 **0.37 **0.38 **0.26 **
19. Emotional3.580.870.060.06−0.070.130.000.13−0.05−0.040.05−0.040.120.34 **0.010.110.28 **0.210.33 **0.32 *
Goal Expectancy
20. Health3.520.760.070.17−0.24 *0.12−0.170.24 *0.06−0.170.56 **0.100.020.28 **0.120.37 **0.65 **0.160.24 *0.26 **0.20 *
21. Financial4.240.67−0.120.03−0.33 **0.16−0.33 **−0.170.27 **−0.080.050.45 **0.120.19 *0.040.21 *0.130.47 **0.100.23 *0.030.26 **
22. Social3.820.750.090.15−0.110.18−0.19 *0.120.05−0.20 *0.150.140.51 **0.22 *0.100.24 *0.150.160.66 **0.33 **0.190.23 *0.15
23. Cognitive4.060.550.170.26−0.28 **0.24 *−0.22 *0.19 *0.24 *−0.25 **0.24 *0.20 *0.100.190.29 **0.35 **0.33 **0.40 **0.26 **0.47 **0.20 *0.34 **0.38 **0.22 *
24. Emotional3.780.660.050.02−0.160.17−0.160.23 *−0.07−0.25 **0.200.000.37 **0.39 **0.080.140.080.150.300.030.39 **0.27 **0.21 *0.36 **0.16
Note: N = 109. PN = past-negative; PP = past-positive; PF = present-fatalistic; PH = present-hedonistic; F = future. * p < 0.05 . * * p < 0.01 .
Table 2. Number and specificity of goals set at the posttraining and 3-month time points.
Posttraining3-Months
( n = 75 )( n = 71 )
N° Goals Mean SD N° Goals Mean SD Cohen’s d
Goal 1204.000.92264.271.040.27
Goal 2133.231.17214.380.811.17
Goal 394.220.97143.930.920.31
Goal 433.671.5374.860.381.14
Goal 522.500.7164.330.822.36
Total47 74
Publisher’s Note: MDPI stays neutral with regard to jurisdictional claims in published maps and institutional affiliations.

