Article

Hierarchical Cluster Analysis of Human Value Priorities and Associations with Subjective Well-Being, Subjective General Health, Social Life, and Depression across Europe

by
Ângela Leite
1,*,
Ana Ramires
2,
Diogo Guedes Vidal
3,
Hélder Fernando Pedrosa e Sousa
4,
Maria Alzira Pimenta Dinis
3,* and
Alexandra Fidalgo
5
1
Faculty of Philosophy and Social Sciences, Portuguese Catholic University, Rua de Camões 60, 4710-362 Braga, Portugal
2
Faculty of Tourism and Hospitality, Universidade Europeia, Rua Laura Ayres 4, 1650-510 Lisboa, Portugal
3
UFP Energy, Environment and Health Research Unit (FP-ENAS), University Fernando Pessoa (UFP), Praça 9 de Abril 349, 4249-004 Porto, Portugal
4
Department of Mathematics, University of Trás-os-Montes and Alto Douro, Quinta de Prados, 5001-801 Vila Real, Portugal
5
Instituto Superior Técnico, Universidade Europeia, Estrada da Correia, 53, 1500-210 Lisboa, Portugal
*
Authors to whom correspondence should be addressed.
Soc. Sci. 2021, 10(2), 74; https://doi.org/10.3390/socsci10020074
Submission received: 21 January 2021 / Revised: 13 February 2021 / Accepted: 17 February 2021 / Published: 20 February 2021
(This article belongs to the Special Issue Social Ties and Health Outcomes)

Abstract

:
Human values are a central component in understanding individuals’ choices. Using the Schwartz’s Values instrument, this study aimed to identify patterns of human value priorities of 35,936 participants across 20 European countries and analyse their relations with subjective well-being (SWB), subjective general health (SGH), social life, and depression indices in Europe. A hierarchical cluster analysis of data from the seventh European Social Survey (ESS) round 7, based on the higher order dimensions of the Schwartz values model, allowed identifying four European groups with distinct indicators. Indices of SWB, SGH, social life, and depression showed statistically significant differences among the four different sociodemographic groups. The graphical representation of the monotonic correlations of each of these indices with the value priorities attributed to the ten basic human values was ordered according to the Schwartz circumplex model, yielding quasi-sinusoidal patterns. The differences among the four groups can be explained by their distinct sociodemographic characteristics: social focus, growth focus, strong social focus, and weak growth focus. The results of this study suggest a rehabilitation of the notion of hedonism, raising the distinction between higher and lower pleasures, with the former contributing more to well-being than the latter.

1. Introduction

As known, human values are socially approved desires and goals (Mukerjee 1965) and standards of judging worth (Shaver 1965). Value means price, appraisal, or worth, being an enduring belief (Dewey and McDermott 1973) and a specific mode of conduct (Rokeach 1973). One’s values depend on where a person was during the value formation age (0–20 years) and what that person experienced during that time (Gibson et al. 2009). Values first vary between individuals, second between nations, and third between regions within nations (Vignoles et al. 2018).
Human values represent a central concept in human behavioural sciences, such as sociology, anthropology, and psychology (Borg et al. 2017; Schwartz 1992). These disciplines view human values as central to explaining how people select their options and justify their actions, assessing individuals and events and characterising cultural groups and societies (Schwartz 1992, 2012). Values have a significant place in understanding and predicting the motivational bases of attitudes and behaviour decisions (Poeller et al. 2018; Schwartz 1992), while transcending specific situations and being unaffected by some variables, namely economic risk (Reeskens and Vandecasteele 2017). To think about human values means thinking about what is important in our life. Values are a central component of our self and personality, distinct from attitudes, beliefs, norms, and traits (Schwartz 2012), and may be considered principles that guide behaviour (Maio 2010; Schwartz 1992). However, the way that we think and act in society, and even our values, are socially constructed and influenced by our living environment. They are not natural or biological.
Despite the number of studies addressing the relationships between human values and subjective well-being (SWB), subjective general health (SGH), and depression, until now no research has presented an overview of the underlying patterns of these relationships, adding social life as a key element in these relationships. The present study aims to identify patterns of the human value priorities using the Schwartz value theory and analyse their relations with SWB, SGH, social life, and depression indices.

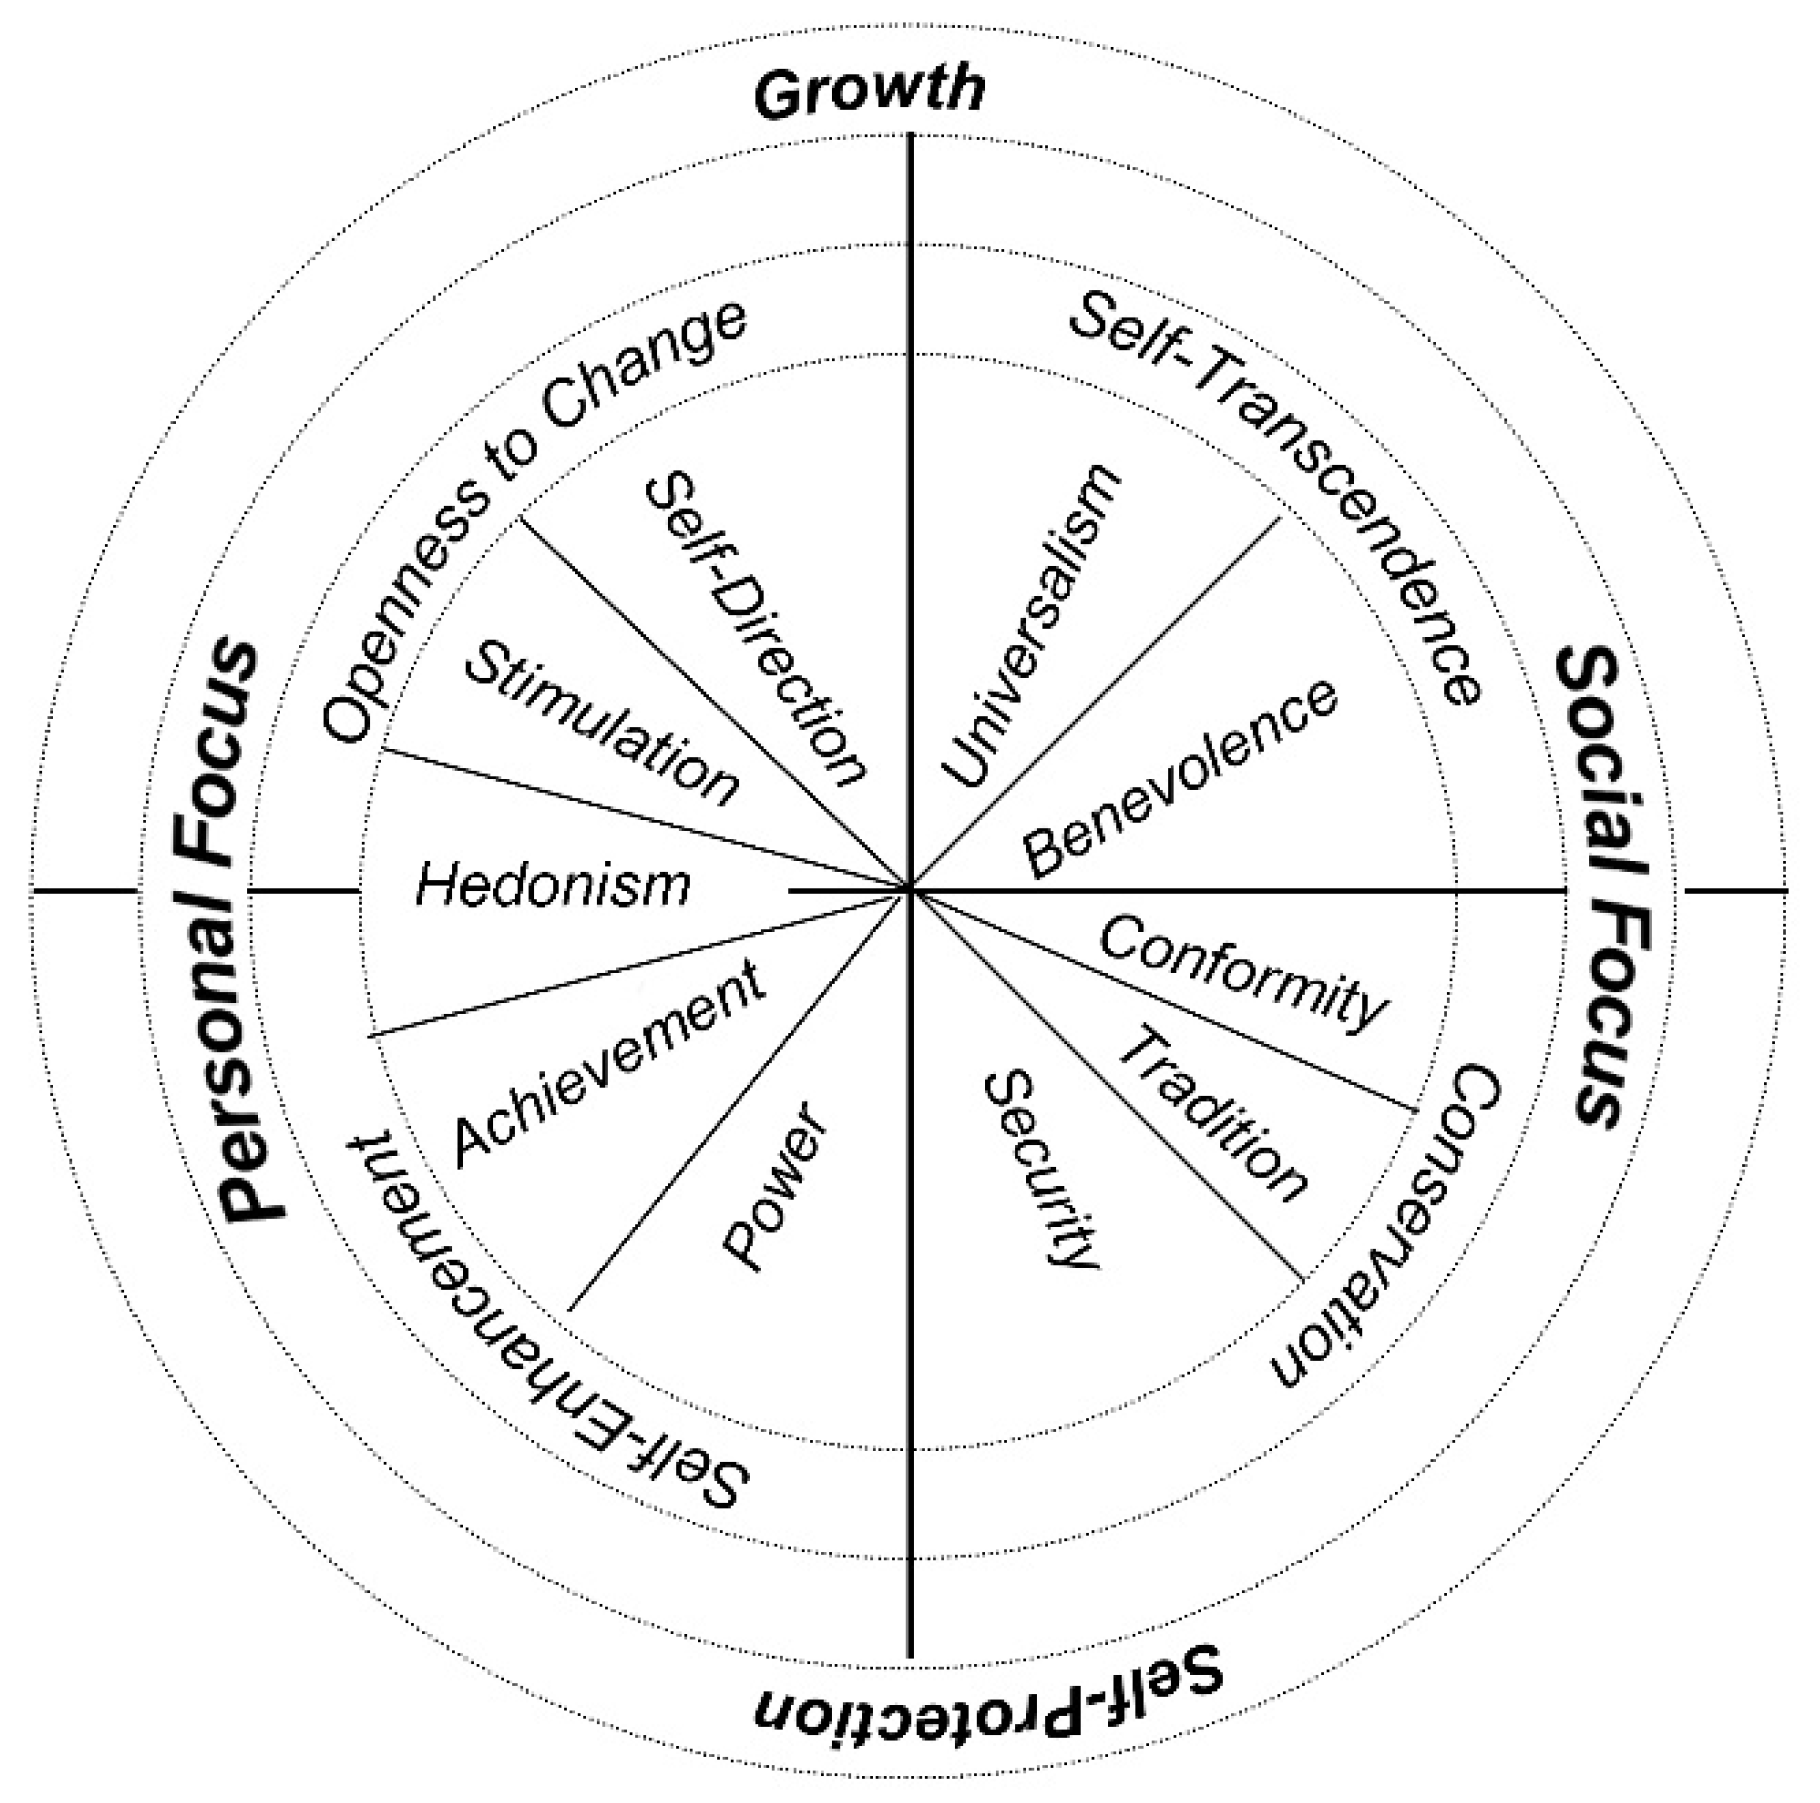
1.1. Schwartz Theory of Human Values

The universalism and content of human values have been studied by Schwartz (1992, 2012) for several years. According to Schwartz (2012), ten motivationally distinct types of values are recognised by people across cultures, suggesting a universal organisation of human motivations. The original set of 57 human values was combined, according to the type of goal or motivation expressed, into types of human values intended to be comprehensive of the main distinct motivations common to people within and across cultures. Table 1 presents the ten basic human values’ definitions, the goals they express, and the items that relate to them. Some important items that express the motivation of more than one human value are listed in parentheses in the last column.
The Schwartz’s (2012) model also addresses the possible dynamics among the ten basic human values. The actions to pursue each value have practical, psychological, and social consequences, as they may conflict or be congruent with some of the other human values. For example, the search for Achievement is congruent with the search for Power, but typically is incongruent with the search for Benevolence. Such dynamics suggest that human values form a continuum of related motivations, originating a circular structure typically ordered counter-clockwise as: Self-Direction–Stimulation–Hedonism–Achievement–Power–Security–Conformity–Tradition–Benevolence–Universalism (Schwartz 2012). The closer a value is to another value round the circle, the more similar are the motivations it expresses. Contrastingly, the two further distant values are, the more antagonistic they are in their motivations. Such arrangement allows viewing values as organized along with a higher order of two bipolar dimensions: opposing Self-Transcendence (Benevolence and Universalism) to Self-Enhancement (Power and Achievement) values, and opposing Conservation (Security, Conformity and Tradition) to Openness to Change (Self-Direction, Stimulation and Hedonism) values (Schwartz 2012). Figure 1 translates this circular arrangement.
Schwartz and Rubel (2005) had already studied gender differences in human value priorities across cultures and found that, more than women, men value Power, Stimulation, Hedonism, Achievement, and Self-Direction. The opposite was found for Benevolence, Universalism, and Security. Gouveia, Vione, Milfont, and Fischer (Gouveia et al. 2015) stated that values have different functions for distinct developmental stages, meaning that basic values differ as a function of age. Several works have used the Schwartz (2006) system of ten basic personal values to understand and sometimes predict individual differences (Schwartz 2006), namely personality traits. The majority of previous studies have examined the relations between values and other variables, such as behaviour (e.g., Manfredo et al. 2017), personality (e.g., Balakrishnan et al. 2017), attitude (e.g., Oishi et al. 2017), and well-being (e.g., Sortheix and Schwartz 2017), thus enriching the analysis, prediction, and explanation of human behaviour (Schwartz 2006). Some research on values focused on their relations with constructs of positive affectivity, such as SWB and life satisfaction (Hanel and Wolfradt 2016). However, few studies have focused on negative affectivity, such as depressed mood (Jarden 2010).

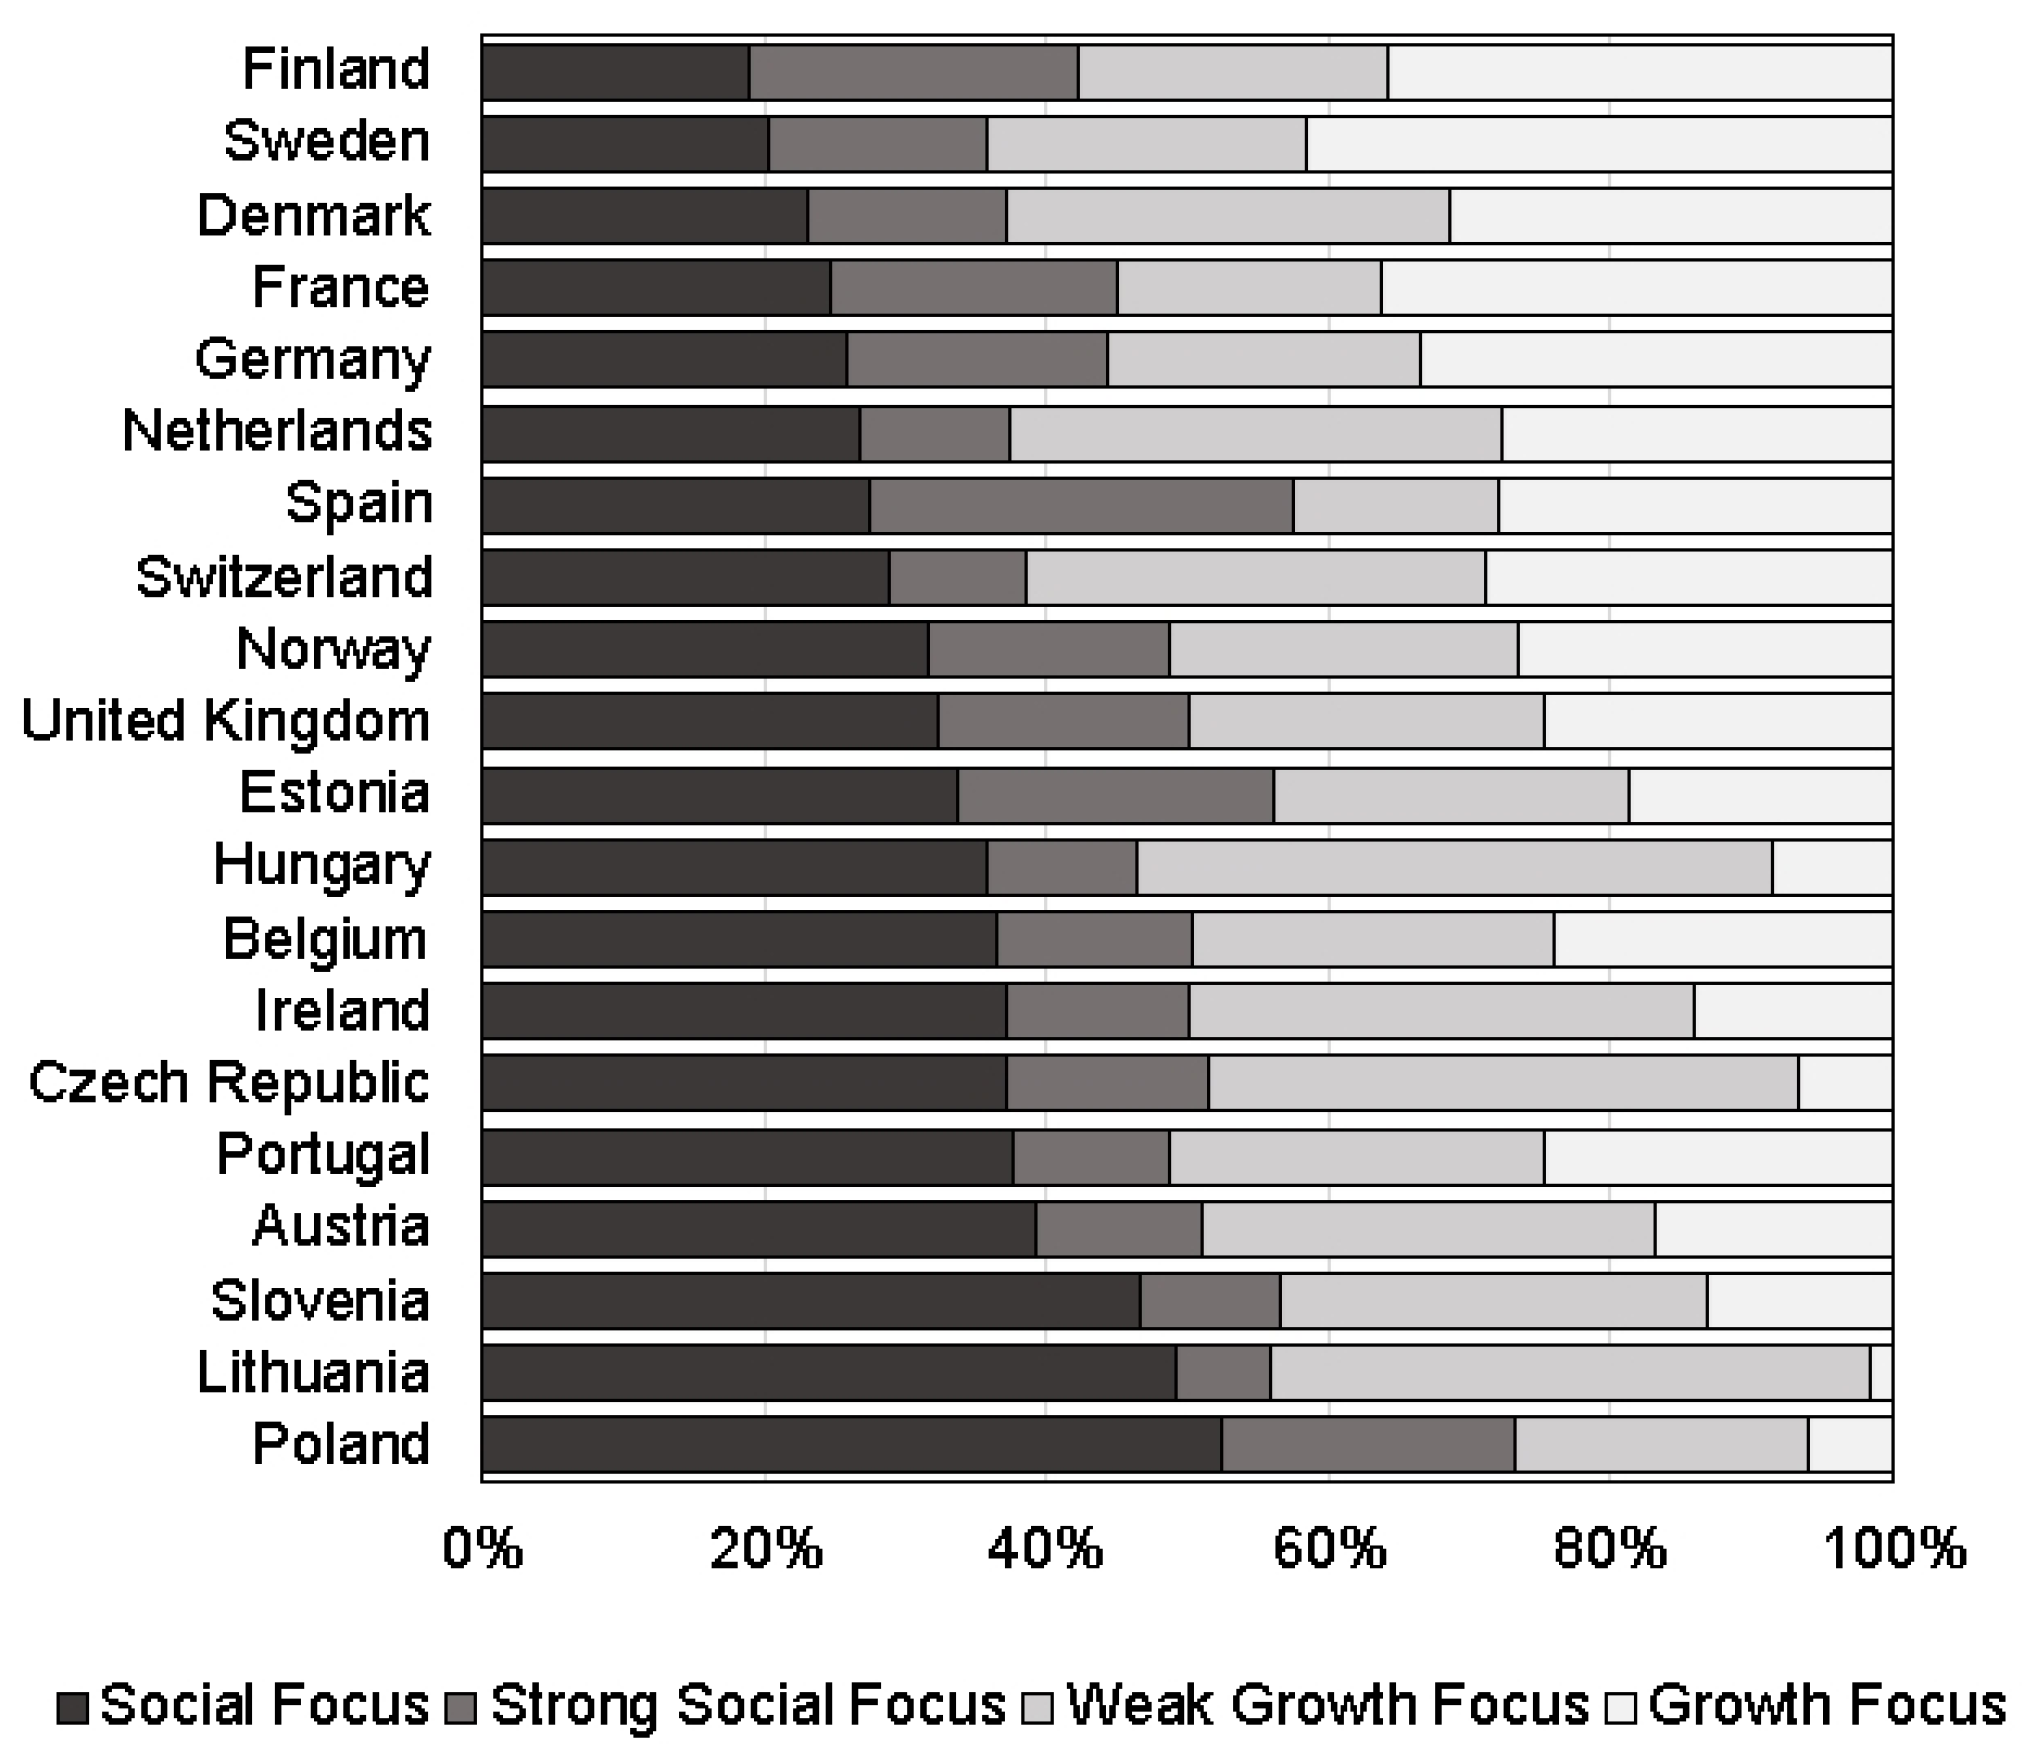
1.2. Human Values across Europe

Some studies have explored the diversity of human values in Europe (e.g., Eurobarometer 2012; Fischer and Schwartz 2011; Inglehart and Welzel 2010; Minkov and Hofstede 2012). The most common justifications for some differences are based on historical and contextual circumstances, including political and economic development. Magun and Rudnev (2015), Rudnev, Magun, and Schmidt (Rudnev et al. 2016) and Magun, Rudnev, and Schmidt (Magun et al. 2016, 2017) analysed within- and between-country values’ heterogeneity in Europe, using a latent class analysis to do a segmentation process based on the Schwartz’s Portrait Values Questionnaire (PVQ−21). Five classes were determined and labelled according to the four higher order values of importance: (1) a Growth class, in which people emphasise Openness to Change and Self-Transcendence values; (2) two classes with Social Focus, Strong and Weak, emphasising a combination of Conservation and Self-Transcendence values; (3) two Personal Focus classes, Strong and Weak, emphasising a combination of Openness to Change and Self-Enhancement. Growth Focus class membership was highly positively correlated with the economic development of the country, while membership of the other four classes was higher in less economically advanced countries, and its correlations with economic development were weak and negative (Magun et al. 2016). It is worth noticing that an identical number and type of classes were obtained by these authors using data from 2008, 2010, and 2012.

1.3. Human Values and Subjective Well-Being (SWB)

SWB describes how a person assesses their life quality, including both cognitive and the emotional aspects (e.g., self-esteem, joy, and feelings of fulfilment; (Diener 2000; Leite et al. 2020)), and is measured based on self-reports of how well life is going (Diener et al. 2003). Life assessment refers to the thoughts that people have about their own life, i.e., the cognitive aspect (Kahneman and Deaton 2010), while emotional well-being refers to the emotional quality of an individual’s everyday experience, i.e., affective aspect (Diener 2000; Kahneman and Deaton 2010). For years, psychologists have been interested in positive emotions of well-being and their relationship with human values (Bobowik et al. 2011; Sagiv and Schwartz 2000). According to Sagiv and Schwartz (2000), SWB may be associated with emphasising some human values rather than others. This suggests that a person’s SWB may depend on its value priorities (Bobowik et al. 2011; Sagiv and Schwartz 2000; Sortheix and Lönnqvist 2014, 2015). According to Sagiv and Schwartz (2000), human values can be divided into two groups: those representing growth needs—Self-Direction, Universalism, Benevolence, Achievement, and Stimulation—and those representing deficiency needs—Conformity, Security, and Power. Pursuing the former promotes well-being, because growth needs are self-actualising, while pursuing the latter undermines well-being, because deficiency needs reflect the necessity to protect oneself against insecurity and threat. Alternatively, an increase in personal well-being may be related to the successful realisation of any of one’s values rather than to one’s value profile, and the congruence between personal values and prevailing established values determines what values promote or undermine SWB (Sagiv and Schwartz 2000). According to other authors (Schwartz and Sortheix 2018; Seki and Dilmac 2015), humanistic values (responsibility, friendship, reconciliation, respect, honesty, and tolerance) are associated with an increase in SWB. However, Bobowik and colleagues (Bobowik et al. 2011) found that human values are not uniformly related to well-being, presenting variations across societies determined by contextual difficulties. Similarly, Jamaludin and colleagues (Jamaludin et al. 2016) found very little support regarding the relationship between personal values and SWB. From the above mentioned, it is possible to say that the relationship between personal values and well-being is all but conclusive.

1.4. Human Values and Subjective General Health (SGH)

SGH (health perception or subjective health) is a subjective rating that individuals make of their health status (Davies and Ware 1981). Some people perceive themselves as healthy despite suffering from one or more chronic diseases, while others perceive themselves as ill, when no objective evidence of disease can be found. Nowicki and co-workers (Nowicki et al. 2018) suggested that the perception of health was a personal value. In 1946, the World Health Organization defined health as a state of complete physical, mental, and social well-being, and not merely the absence of disease or infirmity. According to this definition, Chulef and colleagues (Chulef et al. 2001) hypothesised that the goals of physical health, mental health, and psychological well-being belong to distinct conceptual clusters. Human values research in health showed that people’s values predict the adequate use of public health services (Aavik et al. 2014; Ahola 2015). Values are equally responsible for the behavioural choices that keep people well and fit (Bulley et al. 2009). However, health psychologists assume it is more meaningful to know if people attribute a high value to their health, because valuing health may be a consequence of different motivations. Health values function in combination with other values to guide health-related attitudes, intentions, and behaviours and, consequently, influence perceived health outcomes (Aavik and Dobewall 2016). The Schwartz inventories assess health only by one item, which may be insufficient to capture its importance in people’s life. Several measures have been developed to examine the value people attribute to health (Abraham and Sheeran 2005; Gebhardt et al. 2001). However, these measures were projected isolated, assessing the absolute value people place on health and not the ranking of health on people’s hierarchy (Aavik and Dobewall 2016). The Eurobarometer (2012) survey revealed that health leads the list of values associated with happiness in all European member states assessed except Denmark, where respondents first mention love. Several studies relate SGH with the human values of Stimulation (e.g., Sagiv and Schwartz 2000), Hedonism (e.g., Pino-Domínguez et al. 2016), Achievement (e.g., Minkkinen et al. 2017), Power (e.g., Verstraete et al. 2018), Security (e.g., Norlander et al. 2015), Conformity (e.g., del Pilar Sánchez-López et al. 2014), Tradition (e.g., Baiocchi-Wagner and Olson 2016), Benevolence (e.g., Bevan and Sparks 2014), and Universalism (e.g., Hughes 2017).

1.5. Human Values and Social Life

According to Schwartz and Bardi (2001), the key social function of values is to motivate and govern the behaviour of group members. These authors suggest that developing cooperative and supportive relations among members of primary groups is the most important issue in group and societal functioning. Socializing agents “consciously and unconsciously seek to instil values that promote group survival and prosperity” (Schwartz and Bardi 2001, p. 280) and “individual differences in life experiences, social locations, enculturation, and genetic heritage give rise to individual differences in value priorities or hierarchies” (Döring et al. 2015, p. 6). According to Gouveia, Milfont, and Guerra (Gouveia et al. 2014), individuals oriented by personal values (e.g., an exciting life) are self-centered or intrapersonal in focus while individuals oriented by social values (e.g., genuine friendship) are society-centered or interpersonal in focus. Interactive values, with a focus on social goals, represent thriving needs and are essential in regulating, establishing, and maintaining interpersonal relationships (Gouveia et al. 2014). Self-Transcendence values and intrinsic goals nurture high-quality interpersonal relationships, shifting people away from materialistic, extrinsic goals (Kasser 2016). Meaning in life is expected to come largely through in-group social relationships, group identification, participating in a shared way of life, and striving towards shared goals (Schwartz 2014). The high priority attributed to Benevolence is likely due to its importance for maintaining in-group cooperation and solidarity, and thereby contributing to the stability of social relations (Sagiv et al. 2017). Several studies relate social life and human values, namely Self-Direction (e.g., Kohn and Slomczynski 1993), Stimulation (e.g., Cooley 2017), Hedonism (e.g., Annisette and Lafreniere 2017), Achievement (e.g., Thibaut 2017), Power (e.g., Blau 2017), Security (e.g., Stringham 2015), Conformity (e.g., Szolnoki and Perc 2015), Tradition (e.g., Maercker et al. 2015), Benevolence (e.g., Sagiv et al. 2017), and Universalism (e.g., Strelan 2018).

1.6. Human Values and Depression

The relationship between values and psychological symptoms was pointed by Sagiv and Schwartz (2000), who hypothesised that growth values are associated with lower levels of anxiety, depression, physical symptoms, higher self-actualisation, and vitality. According to Jarden (2010), depressive symptoms are related to lower levels of Stimulation, Self-Direction, and Hedonism values. Some other studies suggest that Conformity, Security, and Power can endorse negative emotional states, like depression (Bilsky and Schwartz 1994; Sagiv and Schwartz 2000). Substantial emphasis is also given to cultural differences associated with the expression of depression (Chang et al. 2016), because the ideologies and values that define humans as individuals derive from the social groups to which humans belong. Chang and Jetten (2015) argue that the identification with a cultural group is associated with greater endorsement of normative expectations that, in turn, guide one’s behaviour in social contexts, as in the depression expression. Indeed, some conceptual frameworks recognise the importance of cultural norms in shaping psychopathology (Hwang et al. 2008; Wong et al. 2010). Moreover, Chang and colleagues (Chang et al. 2016) argue that the identification with culture and norm endorsement is the key to understand the expression of psychopathology. There are several studies relating depression with values, namely, Self-Direction (e.g., Campos 2017; Rasmussen et al. 2017), Stimulation (e.g., Sortheix and Schwartz 2017), Hedonism (e.g., Bernard 2018), Achievement (e.g., Liu et al. 2018), Power (e.g., Porter and Bejerholm 2018), Security (e.g., Carnelley et al. 2018), Conformity (e.g., Villarosa et al. 2018), Tradition (e.g., Ramos et al. 2018), Benevolence; (e.g., Ripley et al. 2018), and Universalism (e.g., Van Assche et al. 2018). Generally, Self-Direction, Stimulation, Hedonism, and Benevolence appear negatively associated with depression, while Security, Conformity, Tradition, and Power appear positively associated with depression. There appears to be no correlation with Universalism and Achievement.

1.7. This Study

As summarised above, several studies addressed the relationship between human values and cognitive and emotional aspects, but many of them are contradictory and inconclusive, and none presented an overview of the underlying patterns of these relationships. This study provides further insight into this subject by using the Schwartz (2012) value theory to analyse the relationships between personal value priorities and cognitive-affective (SWB, SGH, social life, and depression) aspects across Europe, finding association patterns consistent within and cross-countries.
First, appropriate indices for measuring SWB, SGH, social life, and depression were built from the seventh European Social Survey (ESS 2015). Next, following a typological approach (Magun et al. 2016), hierarchical cluster analysis was used to classify the European population based on the higher order dimensions of the Schwartz’s values model (Self-Transcendence, Self-Enhancement, Conservation, Openness to Change) into distinct groups. Finally, following Schwartz’s quasi-circumplex model (Schwartz 2012; Sortheix and Schwartz 2017), the SWB, SGH, social life, and depression indices were correlated with the value priorities attributed to the ten basic human values, yielding quasi-sinusoidal association patterns roughly valid for the distinct European groups found. The findings were discussed in view of sociodemographic indicators available from the ESS instrument.

2. Material and Methods

2.1. ESS Design and Sample

ESS is a biennial academically driven multi-country cross-sectional survey, established in 2001 and distributed by the Norwegian Centre for Research Data on behalf of the ESS European Research Infrastructure Consortium (ESS ERIC). The ESS database contains information about nationally representative samples of data gathered through personal interviews run mainly in European countries. The data used in this study are from the seventh ESS round (edition 2.1), were collected in 2013/2014, and were released on 1 December 2016 (ESS 2014). The survey included questions on a variety of core topics, namely social trust, political interest and participation, socio-political orientations, social exclusion, national, ethnic and religious allegiances, health and social determinants, immigration, human values, demographics, and socioeconomics. The seventh round covered 20 European countries (Austria, Belgium, Czech Republic, Denmark, Estonia, Finland, France, Germany, Hungary, Ireland, Lithuania, Netherlands, Norway, Poland, Portugal, Slovenia, Spain, Sweden, Switzerland, and United Kingdom) and Israel. Strict random samples representative of the population aged 15 and older were collected. For this study, European countries’ data on the following indicators were considered: sociodemographic indicators—country, gender, age, legal marital status, highest level of education (European Survey version of International Standard Classification of Education, ES-ISCED), and years of full-time education completed and household’s total net income, all sources (categories are national and based on deciles of the actual household income range in the given country); PVQ–21; and SWB, SGH, social life, and depression related indicators (ESS 2016).
As the data analysis of the ESS (2015) requires the use of weights when combining different countries to ensure data are representative of the demographic structure of the countries and regions involved, post-stratification weights in combination with population size weights were applied, as recommended. Post-stratification weights are obtained using the information on variables for age-groups, gender, education, and regional marginal distributions, to reduce the sampling error and potential non-response bias. Population size weights corrected the bias resulting from ESS, with similar sample sizes for different sized populations, thus ensuring each country is represented proportionally to the size of its population. These data are available online to any researcher on the ESS website.

2.2. Statistical Analysis

After database preparation, statistical analyses were performed using the Statistical Package for the Social Sciences (SPSS 25): treatment of missing values, descriptive statistics, multicollinearity assessment (not found), formation of composite indices, contingency tables, correlations, Chi-square tests, One-way ANOVA, and Kruskal–Wallis. Group differences were analysed by Games–Howell post hoc tests (adequate for groups with different sizes and variances), or Dunn’s pairwise comparison tests, accordingly. Effect size interpretation followed Cohen (1988) guidelines. Composite indices were formed by application of Principal Component Analysis with a single component (Joint Research Centre-European Commission 2008) and rescaling of the factor scores to reflect the original metric and to ensure the semantic meaning (De Vaus 2013). A hierarchical cluster analysis based on Schwartz’s (2012) values higher order dimensions was applied, and the identified clusters were characterised. The statistical significance level was set at 0.05 (p < 0.05). Complementary statistical analyses are available in supplementary material (Tables S1–S3).

2.3. Measures and Procedures

2.3.1. Schwartz’s Human Values Instrument

ESS (2015) uses a shorter version of the Schwartz Human Value scale (Schwartz 1994), the PVQ-21 (Schwartz 2003). This version consists of 21 verbal portraits of different people, each describing a person’s goals, aspirations, or wishes that stress the importance of a given value type. Respondents are then requested to indicate to what extent they identify with each portrait in a response scale ranging from 1 (very much like me) to 6 (not like me at all). Responses were reversed to ensure that higher scores corresponded to greater similarity. Respondents with more than five missing answers in the 21 items or giving the same answer to more than 16 items were removed, following the procedure described by Schwartz (2005). The 21 items were then combined into ten indices, one for each of the basic values: Self-Direction, Stimulation, Hedonism, Achievement, Power, Security, Tradition, Conformity, Benevolence, and Universalism. The relative importance one gives to each of the ten basic values, that is, the person’s values priorities, are obtained subtracting the scores of each of the ten values for that person by the average score on the 21 items (Schwartz 2005). Subsequently, the four higher order Schwartz’s values, Conservation, Openness to Change, Self-Enhancement, and Self-Transcendence, were calculated as the mean of the individual values priorities that formed the same value type. Following a Schwartz proposal of a refined value theory and a new instrument (PVQ-5X) to measure 19 more narrowly defined values, Cieciuch, Davidov, Vecchione, Beierlein, and Schwartz (Cieciuch et al. 2014) recently tested the measurement invariance of this instrument across eight countries. Configural and metric invariance were established for all values across almost all countries, and scalar invariance was supported across nearly all countries for ten values. The same authors concluded that the cross-country invariance properties of the values measured with the PVQ 5X are noticeably better than when using the PVQ-21.

2.3.2. Subjective Well-Being (SWB)

The two most common measures of SWB are happiness and life satisfaction. The first measures people’s current feelings, i.e., emotional responses, and the second measures people’s assessment of their life as a whole, i.e., cognitive or assessment responses. SWB was measured by a composite index constructed with the ESS (2015) items: (1) “Taking all things together, how happy would you say you are?”, with answers on a 0 (extremely unhappy) to 10 (extremely happy) scale; (2) “All things considered, how satisfied are you with your life as a whole nowadays?”, with answers on a 0 (extremely dissatisfied) to 10 (extremely satisfied) scale.

2.3.3. Subjective General Health (SGH)

One single item measured the SGH of respondents: “How is your health in general?”, with responses rated on a five-point scale from 1 (very good) to 5 (very bad). The item was reverse-coded.

2.3.4. Social Life

Social life involves spending time with friends, family, other relatives, neighbours, and co-workers. To measure people’s social life, three items of the ESS (2015), with different response scales, were used: (1) “How often do you meet socially with friends, relatives or work colleagues?”, rated on a seven-point scale from 1 to 7 (never, less than once a month, once a month, several times a month, once a week, several times a week, and every day); (2) “How many people, if any, are there with whom you can discuss intimate and personal matters?”, rated on a scale from 0 to 6 (none, 1, 2, 3, 4–6, 7–9, and 10 or more); and (3) “How often do you take part in social activities compared to others of same age”, rated on a five-point scale from 1 (much less than most) to 5 (much more than most). A composite social life index was created, ranging from 0 to 6.

2.3.5. Depression

A shortened version of the Centre for Epidemiologic Studies Depression Scale (CES-D8) (Radloff 1977) was included in the ESS (2015) survey. The CES-D8 self-report depression scale consists of eight items, which ask about six positive and two negative actions/emotions “felt or behaved during the past week”, in a response scale ranged from 1 (none or almost none of the time) to 4 (all or almost all of the time): “Felt depressed”, “Felt everything did as effort”, “Sleep was restless”, “Were happy”, “Felt lonely”, “Enjoyed life”, “Felt sad”, and “Could not get going”. The positive affect items were reverse worded. A composite depression index was created, ranging from 1 to 4, with higher scores indicating a higher frequency of depressive complaints.

2.3.6. Sample Characterisation

A total of 37,623 respondents were included in ESS—Round 7 (ESS 2014). The data cleaning criteria applied led to dropping 4.5% of the cases (see Table S1 in Supplementary Material). The sample is balanced in gender (48 men versus 52% women) with mean and standard deviation of 47.42 and 18.82, respectively. The majority of the sample (53%) is married or in a legally registered civil union, 32% are single, and 15% are either divorced, separated, or widowed. Regarding education, 55% of the sample has some level of secondary education, and only 12% has less than the lower secondary level of education, therefore representing a low education inequity (less than lower secondary education to tertiary education ratio of 0.59). Some of these characteristics and the geographical distribution of the respondents are summarised in the hierarchical cluster analysis presented. The sociodemographic characteristics of the sample and its size guarantee diversity, inclusiveness, and statistical power.

2.3.7. Hierarchical Cluster Analysis and Correlations

Following a typological approach (Magun et al. 2016), hierarchical clustering was used to classify the European population, based on Schwartz’s (2012) values higher order dimensions, obtained from the value priorities attributed by representative samples from 20 European countries to the value items in the ESS (2014). SWB, SGH, social life, and depression indices were correlated with priorities attributed to the ten basic human values, yielding the quasi-sinusoidal curves predicted by the Schwartz circumplex model (Schwartz 2012; Sortheix and Schwartz 2017), roughly valid for all the clusters found.

3. Results

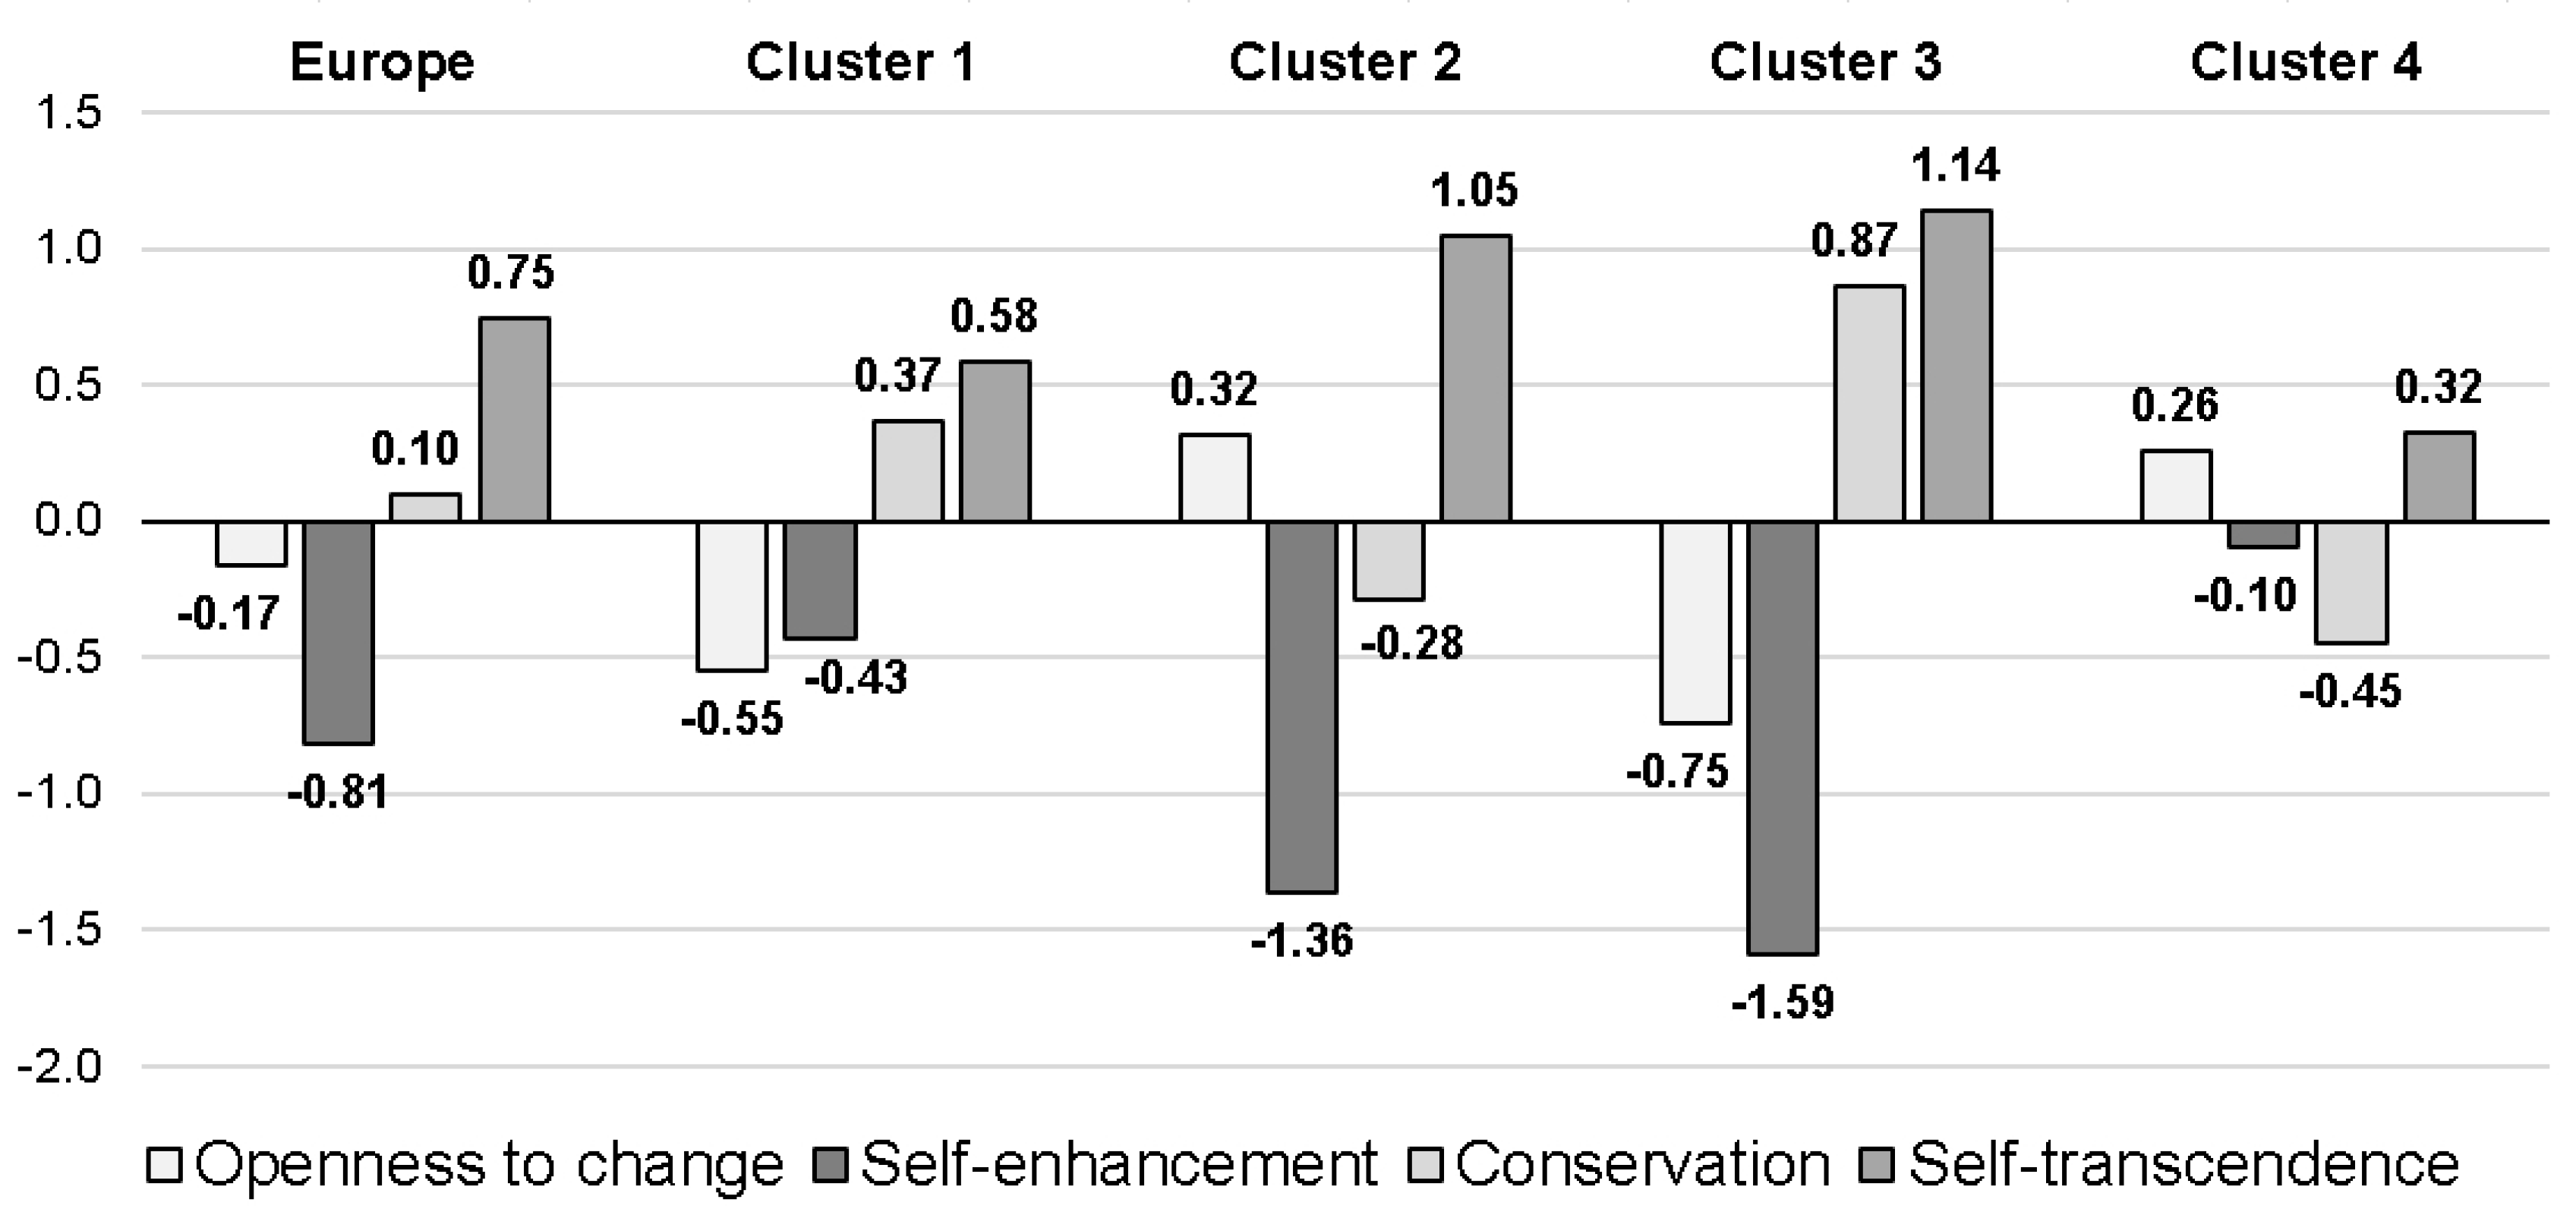
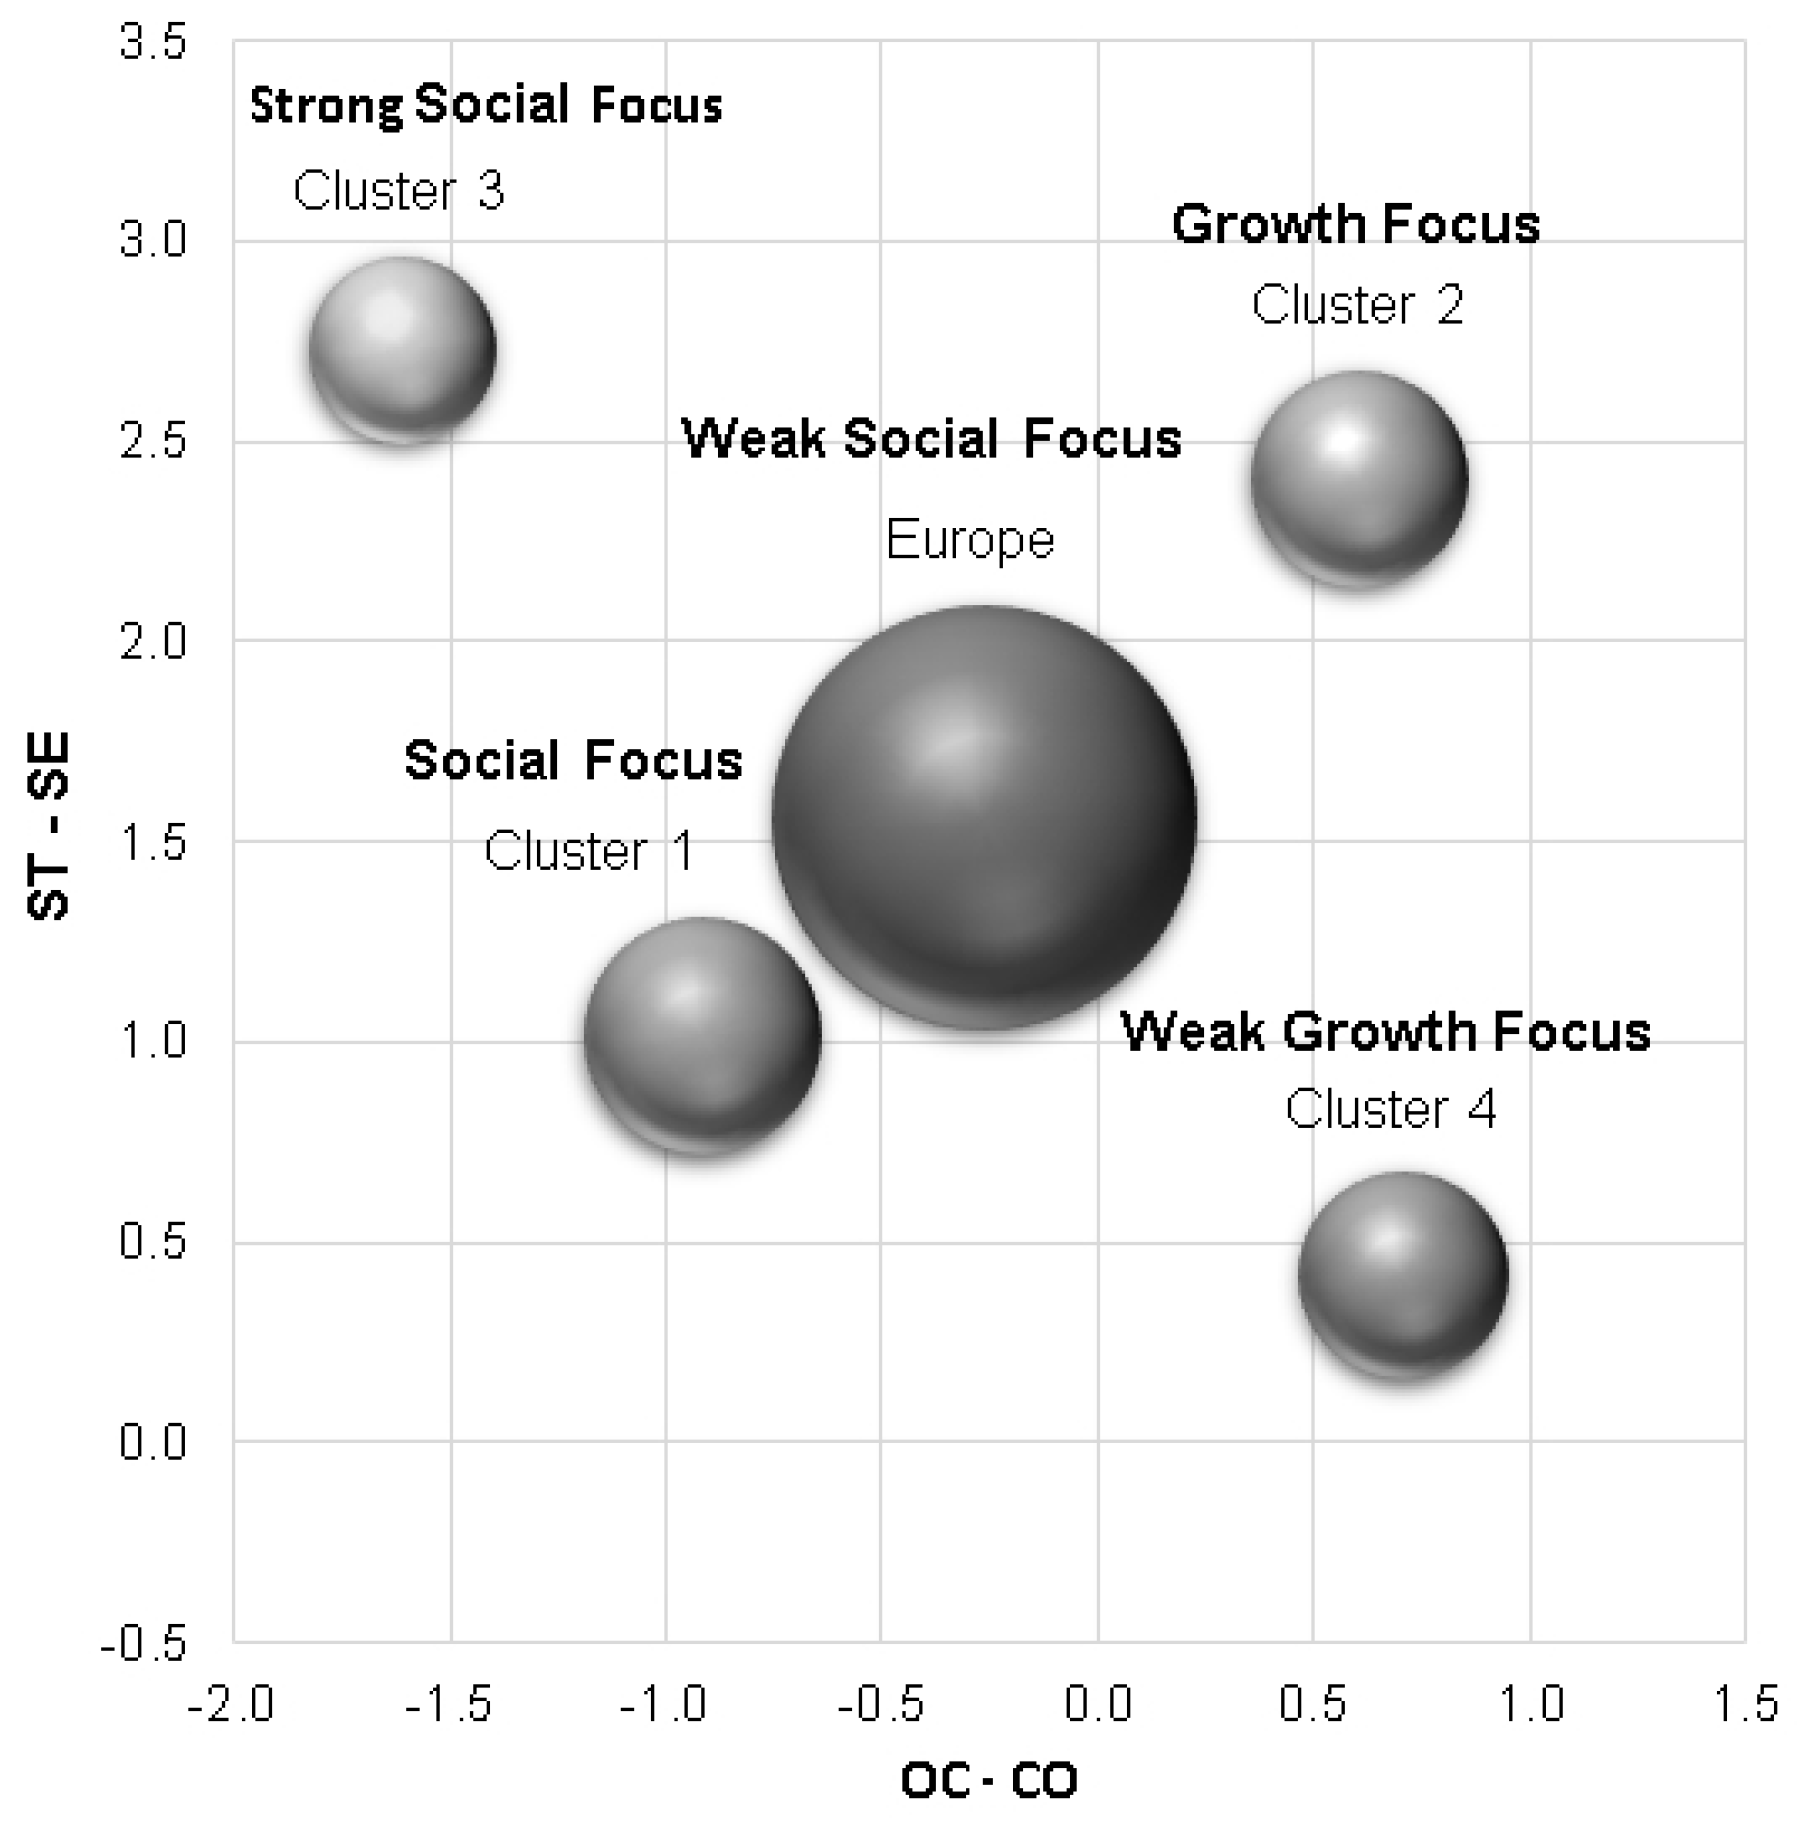
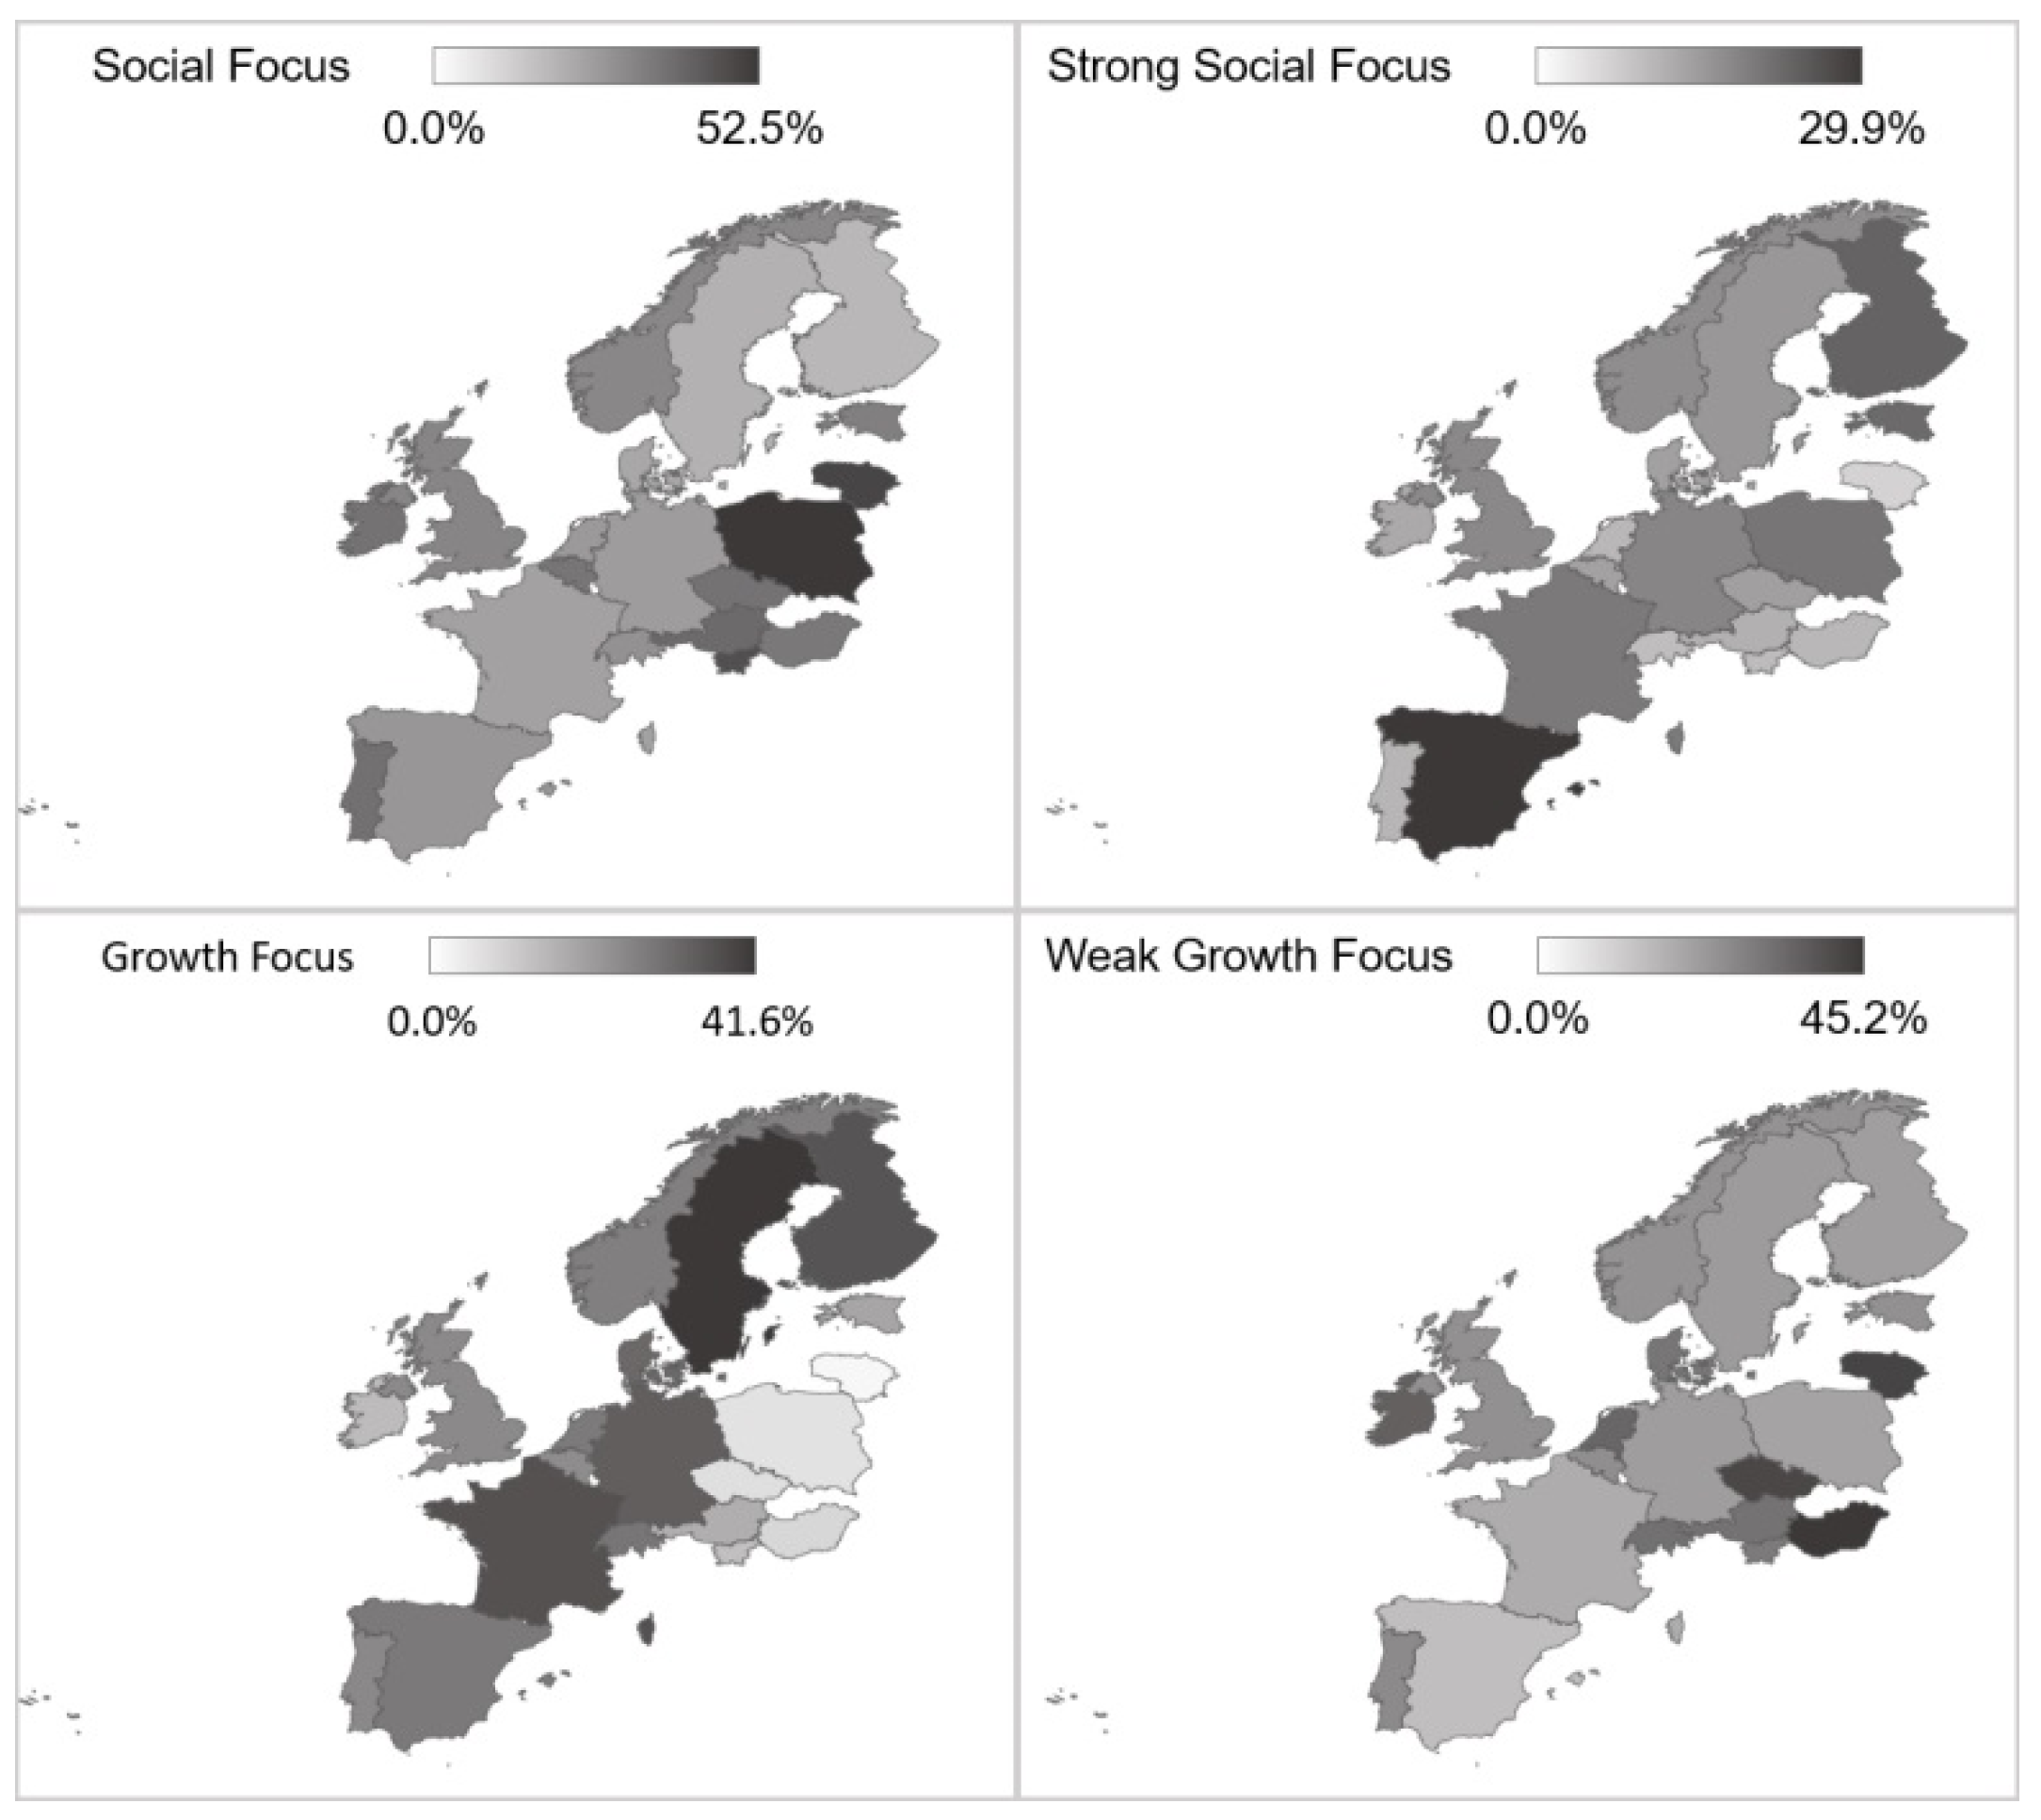
3.1. Segmentation Based on Schwartz’s Higher Order Values Dimensions

The segmentation process was based on the mean centered values of the Schwartz (2012) higher order value dimensions. The k-means cluster analysis (Ward method) was tested with three to six clusters. The result with four clusters was selected, as each group presented security versus stimulation and openness to change versus conformity dimensions in opposing directions, consistently with the compatibilities and conflicts in the Schwartz value theory (Schwartz 2005). Discriminant analysis was used to test the stability of the four clusters’ solution. The classification results showed 97.4% of the cases to be correctly classified. Table 2 indicates the clusters’ sizes and allows comparing the relative importance attributed to Schwartz’s values by each cluster with the European figures.
Positive and negative centered means indicate high and low priority attributed to the corresponding human values, respectively. Approximately null centered means indicate moderate priority attributed to the corresponding human values. Europe and all the four clusters attribute moderate to relatively high priority to Self-Direction, Security, Benevolence, and Universalism. Oppositely, there is a relatively low priority ascribed to Stimulation and Power across Europe and the four clusters. The remaining values are varyingly prioritised by the different European segments: high priority is only attributed to Achievement in cluster 4, to Hedonism in clusters 2 and 4, and to Conformity and Tradition in clusters 1 and 3.
These variations are consistent with the prioritisation attributed to the higher order value dimensions. Figure 2 compares the mean higher order value priorities of Europe with the ones in each cluster. Self-Transcendence values are highly prioritised both in Europe and all four clusters, opposing to Self-Enhancement values that have low priority for all.
Regarding Conservation and Openness to Change, Europe shows a moderate prioritisation of conformity over openness to change values, clusters 1 and 3 clearly prioritise conformity over openness to change, and clusters 2 and 4 show the opposite prioritisation order.
The four clusters can be labelled combining the results in Table 2 and Figure 2. Europe combines high identification with Self-Transcendence values (with emphasis on Universalism and Benevolence) and moderate identification with Conservation values, traducing into a “Weak Social Focus”. Cluster 1 (31% of the population) combines high identification with both Self-Transcendence and Conservation values (with emphasis on Universalism, Benevolence, and Security), implying a clear “Social Focus”. Cluster 3 (19% of the population) shows even higher identification with Self-Transcendence and Conservation values (with great emphasis on all related basic values), indicating a “Strong Social Focus”. Cluster 2 (26% of the population), on the other hand, combines high identification with both Self-Transcendence and Openness to Change values (with emphasis on Benevolence, Universalism and Self-Direction), therefore representing a “Growth Focus”. Finally, cluster 4 (24% of the population) combines high identification with Self-Transcendence values with moderate identification with Openness to Change, indicating a “Weak Growth Focus”.
Given the dynamic relations between opposing values, and following the typological approach proposed by Magun, Rudev, and Schmidt (Magun et al. 2016), the clusters can be better described in terms of the priorities attributed to Openness to Change over Conservation as well as to Self-Transcendence over Self-Enhancement. Thus, the four higher order values priorities (Openness to Change, Security, Conformity, Stimulation) can be used to determine the two higher order value dimensions of Openness to Change–Conformity and Stimulation–Security by subtracting the individual score for Conservation from the Openness to Change score and the score for Self-Enhancement from the Self-Transcendence score. The spatial representation of the bipolar dimension’s mean values, Stimulation–Security as a function of Openness to Change–Conformity, shown in Figure 3, allows a clear visualisation of the preceding description of the segments found.
The differences found in value priorities between clusters are statistically significant, for both basic and high order values, as shown by the one-way ANOVA results presented in Table 3. The Kolmogorov–Smirnov test indicated that the data were normally distributed.
However, Levene’s F test revealed that the homogeneity of variances assumption was not met. Accordingly, Welch’s F test was used. Post hoc comparisons, using the Games–Howell procedure, corroborate the previously discussed relative importance each cluster ascribes to the different human values, generally with medium to large effect size (η2). The results are also shown in Table 3.

3.2. Sociodemographic Characterisation of the Clusters

The geographical distribution of the residents by the four clusters is presented in Figure 4 and Figure 5.
A statistically significant association was detected between the two variables: χ2 (df = 57, N = 35,936) = 3231.29, p < 0.001. As shown in Figure 4, all countries have individuals in the four value segments, indicating an internally diverse value class composition. However, countries from Eastern Europe (e.g., Poland, Lithuania, Slovenia, and Austria) appear to contain a higher proportion of residents in the Social Focus class (cluster 1), while residents from Nordic and Central European countries (Finland, Sweden and Denmark, France, Germany, Switzerland, and the Netherlands) have more than 30% of their population belonging to the Growth Focus class (cluster 2) and over 55% belonging to either Weak Growth (cluster 4) or Growth Focus (cluster 2) classes. There is no specific pattern regarding countries with a large proportion of residents belonging to the Strong Social Focus (cluster 3), with Spain, Finland, Estonia, and Poland having over 20% of their population in this class. The same patterns are readily observable in Figure 5, where it can also be seen that Eastern European countries (Hungary, Lithuania, Czech Republic) present the larger percentages of residents with Weak Growth Focus (cluster 4).
The statistical analysis of the four clusters’ sociodemographic indicators is presented in Table 4 and Table 5.
Cluster 1 (Social Focus) is gender-balanced and contains mostly (61%) married individuals with a mean age of 50 years old (representing 34% of the European population aged over 35), who completed on average 12.6 years of education, with little instruction inequity (less than lower secondary education to tertiary education ratio of 0.71), that belong to the middle-income class (55% of its members have a total household income between the third and seventh deciles).
Cluster 2 (Growth Focus) mainly contains women (55%), primarily married (46%) or single (38%) people, with a mean age of 45 years old, and it represents around 30% of the European population aged under 35. It contains individuals with the highest levels of education (with an average of 13.8 completed years of education and an inequity educational ratio of 0.33) and income: (one in three members of this cluster belongs to the upper-income class, with total household income above the seventh decile).
Cluster 3 (Strong Social Focus) contains mostly women (65%) and married people (63%), and can be considered the oldest segment, as the average age is 59 years old. It represents around 30% of the population aged 50 and older and has the largest group of widowers (14%). Regarding education, this cluster shows the highest inequity (less than lower secondary education to tertiary education ratio of 1.49), corresponding to the lowest mean value of completed years of education (11.7). Concomitantly, its members belong primarily to lower- and lower-middle-income classes, half of them with total household income below the fifth decile.
Cluster 4 (Weak Growth Focus) is comprised mainly of men (60%) and singles (51%) and is the youngest segment, with an average age of 38 years old and representing 41% of the European population aged under 35. The mean education years completed is 13.5 (also with an inequity ratio of 0.33), and 48% of the cluster members belong to middle-upper or upper-income classes, holding total household incomes above the sixth decile.

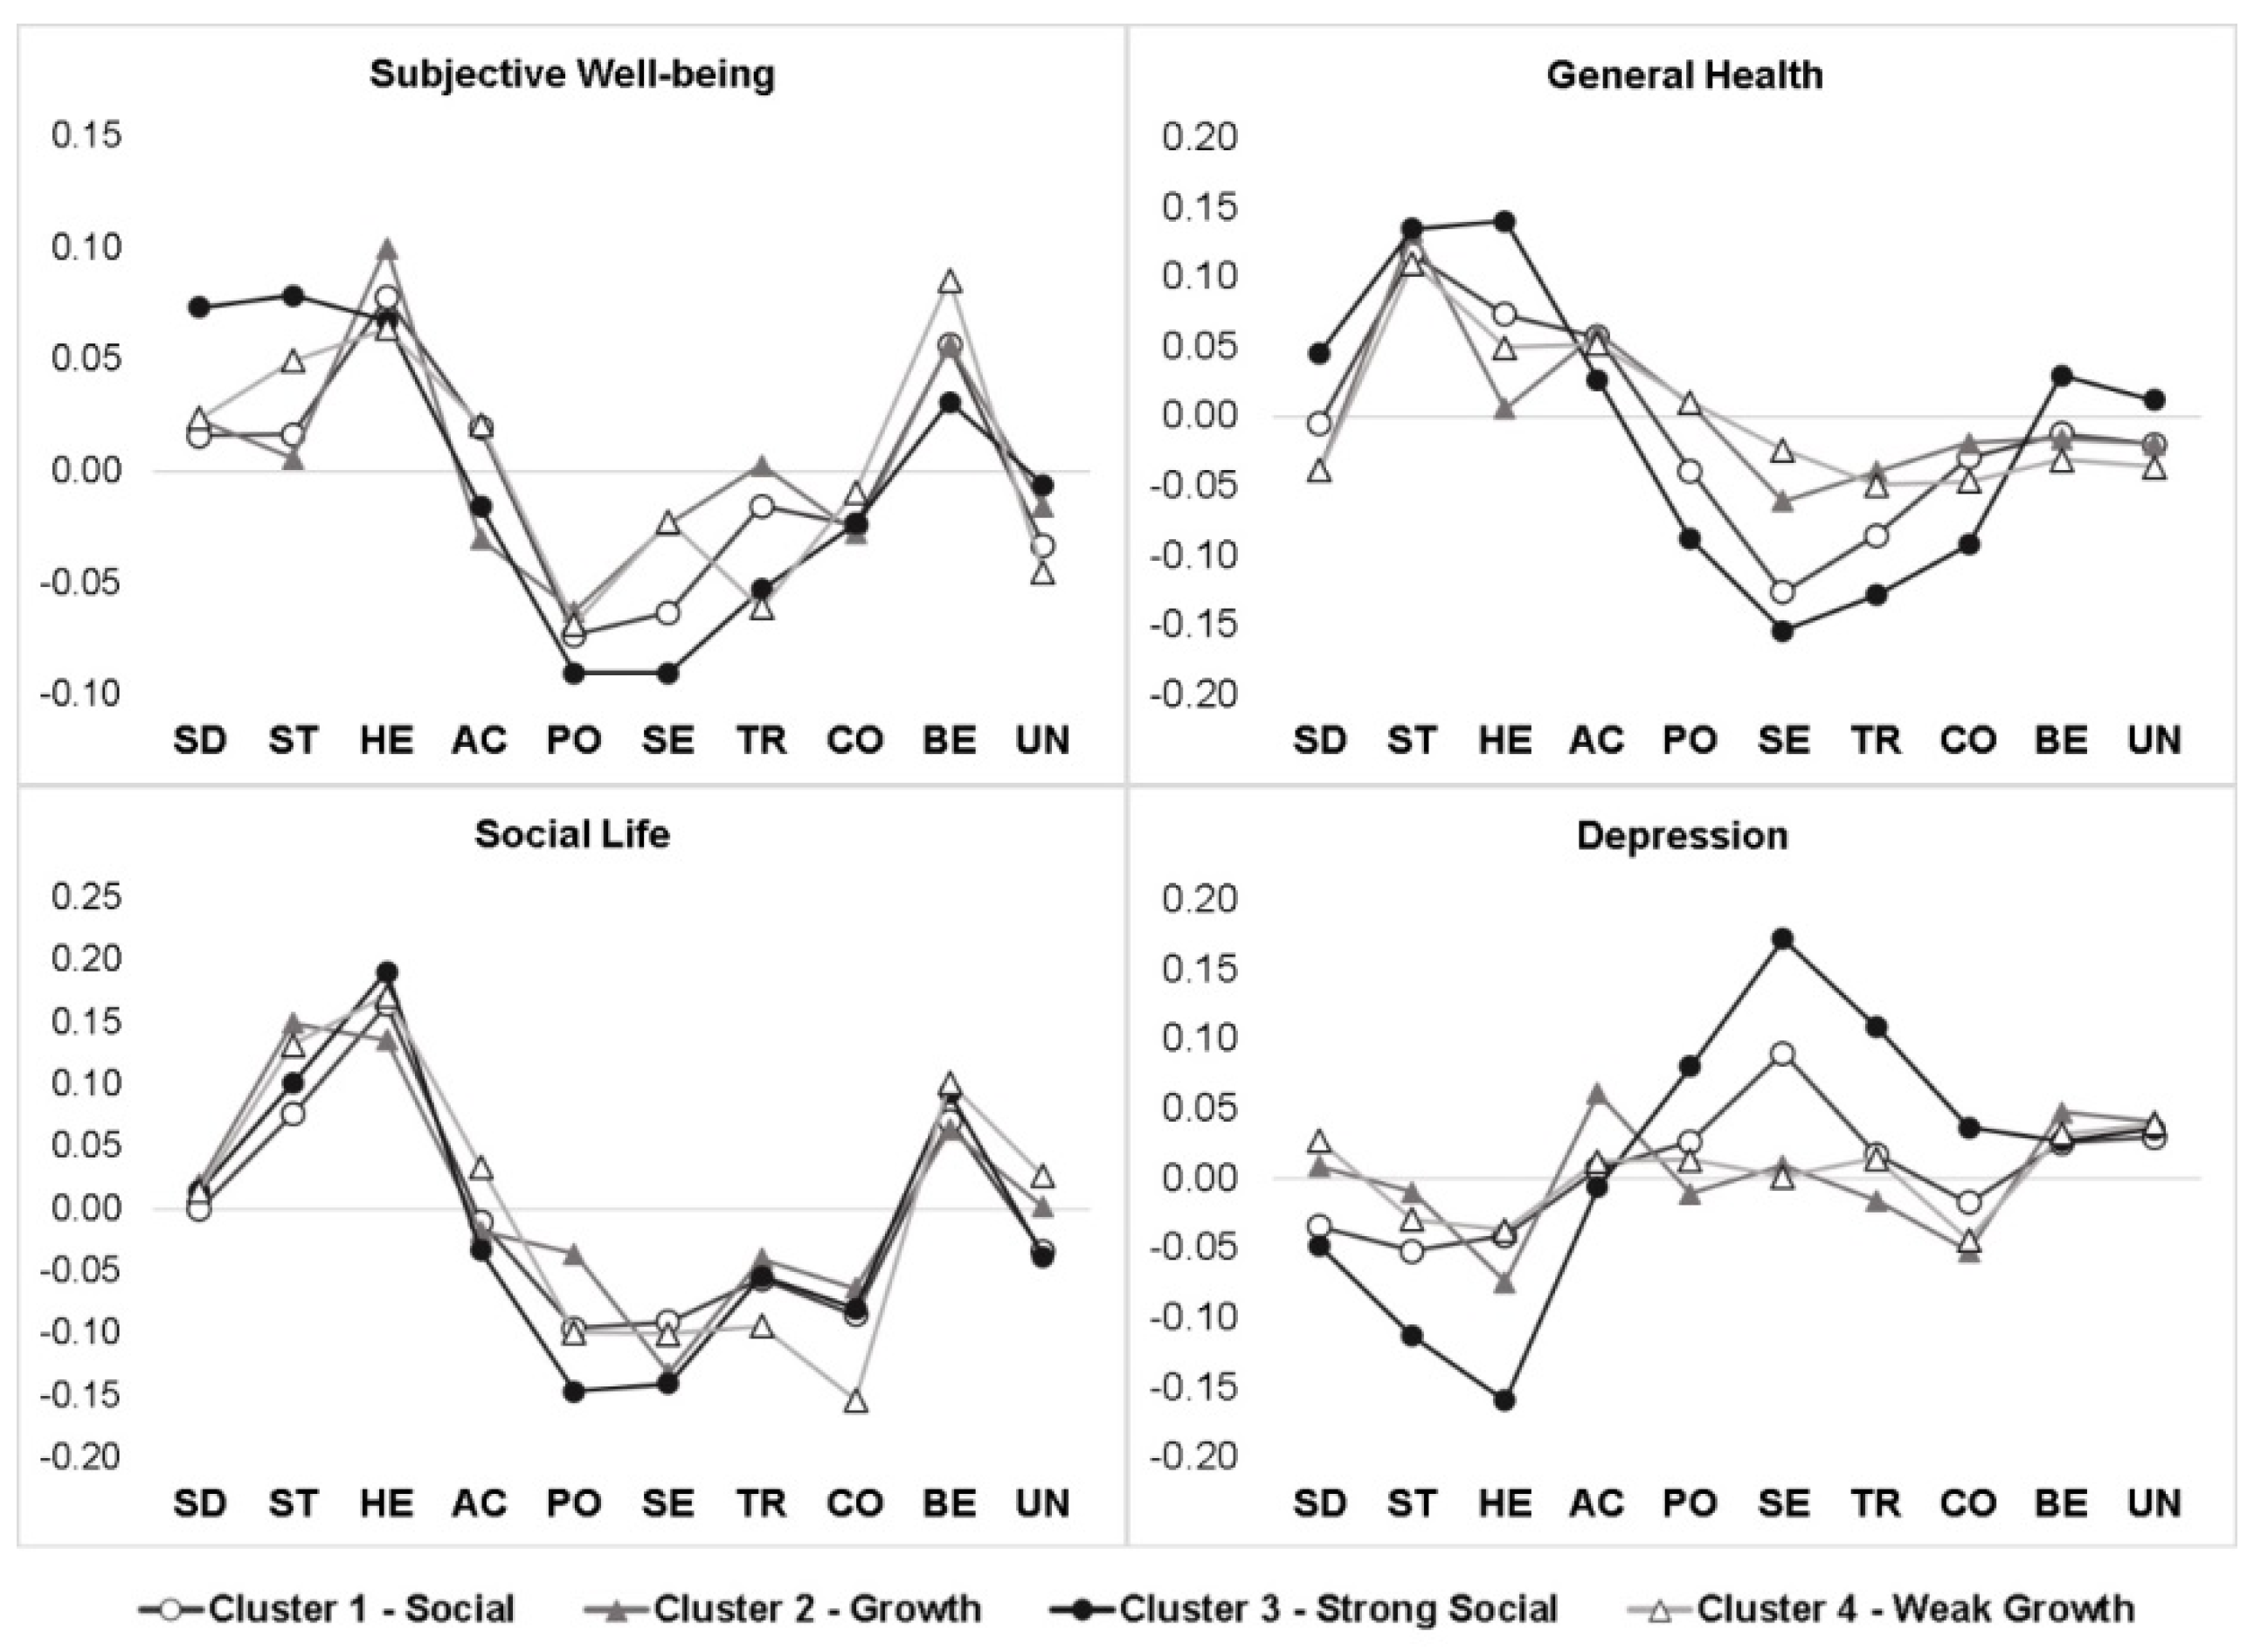
3.3. Subjective Well-Being, Subjective General Health, Social Life, Depression, and Schwartz’s Human Values

Composite indices for SWB, social life, and depression were established using the Principal Component Analysis. Items in each composite index generally revealed good levels of reliability (α), except for social life, and percentage of total variance explained SWB, α = 0.82 and 85%; social life, α = 0.50 and 52%; depression, α = 0.83 and 46%. SGH is a single index measured on a five-point ordinal scale (from 1—very bad to 5—very good). The statistical analysis of the three composite indices revealed non-normal distributions (Kolmogorov–Smirnov’s test) and significant heteroskedasticity (Levene’s test). Thus, the Kruskal–Wallis test was used for comparing SGH and the composite indices’ distributions among the four clusters, followed by post hoc pairwise comparison tests (Dunn’s tests). Statistically significant differences (p < 0.001) were found among the groups for all the indices; however, the effect size is small in all cases, indicating no substantial differences of the SWB, SGH, social life, and depression median scores between the clusters (see Table S2 in Supplementary Material).
The association between the four indices and the priorities attributed to the set of basic values was analysed following the Schwartz procedure (Schwartz 1992). The association of any external variable with a given basic value has implications for its associations with all the other basic values, traducing in a similarity with adjacent value types in the circular value’s structure, and in a monotonic variation of the strength of association with the basic values round that structure, from the most positive (or least negative) to the least positive (or most negative) association. The graphical representation of the strength of the associations, both significant and nonsignificant (Spearman correlations, see Table S3 in Supplementary Material), with the values ordered according to the circular value structure, reflects a pattern of association, which should yield a sinusoidal curve. Figure 6 shows the association patterns between the analysed indices and the ten basic values, separately for each of the four clusters identified.

3.3.1. Subjective Well-Being (SWB)

SWB patterns are generally consistent with the theoretical sinusoid correlation pattern (Sortheix and Schwartz 2017), with positive association maxima for Hedonism and Benevolence, and with a negative association minimum for Power. Larger SWB scores point to the attribution of higher relative importance to pleasure and self-rewarding and lower relative importance to social status. Thus, the values of Openness to Change, Achievement, and Benevolence, which express growth orientation and personal focus, promote SWB, while the values of Conservation, Power, and Universalism, which express social focus and self-protective anxiety-based orientation, hinder SWB. However, two clusters present deviations from the theoretical referential. In clusters 2 and 3, Achievement, which expresses personal focus, does not promote SWB. These deviations can be explained by the sociodemographic indicators of the clusters. Cluster 2 (Growth Focus), containing individuals with the highest levels of education and income, disregards achievement’s contribution to SWB due to a sense of self-accomplishment. Cluster 3 (Strong Social Focus), on the other hand, has the oldest individuals with the lowest total household income level. They have lower expectations and a higher need for security; thus, they prioritise less achievement.

3.3.2. Subjective General Health (SGH)

The monotonic correlations between the SGH index and basic value priorities also follow a quasi-sinusoidal pattern with association maxima for Stimulation (the quest for novelty and emotion in life) and Benevolence, and with an association minimum for Security (personal and societal safety). Exceptions to this general trend include the highest positive correlation with Hedonism (the pursuit of pleasure and enjoying life) observed in cluster 3, and the highest negative correlation with Tradition (respect for the ideas and customs of other religions or cultures) observed in cluster 4. In general, SGH correlates positively with the priorities given to adjacent values of Stimulation, Hedonism, and Achievement (challenging life, pleasure, and personal success) and negatively with the priorities given to Security, Tradition, and Conformity (control, order, and resistance to change). In growth-oriented segments (clusters 2 and 4), the relative priority attributed to Power (social prestige and control of material goods) correlates positively with SGH, contrarily to what happens in social-oriented segments (clusters 1 and 3). Strong Social Focus is the only cluster where SGH is positively correlated with the relative importance of Self-Direction (independence of thought and action), Benevolence, and Universalism (transcending one’s own interests for the sake of others).

3.3.3. Social Life

Regarding social life, the correlation patterns are similar between clusters, showing a monotonic tendency for all basic values, except Benevolence. Social life correlates positively with Openness to Change and Benevolence, and negatively with Conservation and Power. That is, in socialisation mechanisms, the importance of values that involve intrinsic motivation for change and concern for the well-being of others is at the opposite pole from the importance of values that emphasise social superiority, tradition, and compliance with social rules. Clusters with Social (1 and 3) and Growth (2 and 4) Focus have differentiating characteristics. In the former, social life associates positively with the priority attributed to Hedonism (good moments and pleasure) and negatively with both the priorities given to Power (material goods and social superiority) and Universalism (equity and social justice). For the latter, social life associates positively with Universalism (indiscrimination of individuals and protection of nature). Cluster 2 (Growth Focus) stands out because it has the largest positive correlation of social life with the relative importance of Hedonism (novelty, emotion, and excitement experienced in life), and the largest negative with the relative importance of Security (safety and protection against threats, protected by the government). In cluster 4 (Weak Growth Focus), social life is positively associated with the priorities given to Achievement (social success and ambition) and Hedonism (fun and enjoyment of life), the latter being the most strongly correlated, and negatively associated with the priority given to Conformity (compliance with socially established rules).

3.3.4. Depression

The depression index presents the most irregular patterns of association. The sinusoidal pattern is only clear for the two clusters with Social Focus (1 and 3) and has a different phase from the observed in the previous association patterns, with opposite maxima and minima to SGH. In these groups, the correlations between depression index and value priorities are generally positive for Self-Transcendence (Benevolence and Universalism), Conservation (Security and Tradition), and Self-Enhancement (Power) values, while they are generally negative for Openness to Change (Self-Direction, Stimulation, and Hedonism) values. More depressive symptoms are associated with increased relative importance attributed to the preservation of order and harmony in relations (Security and Tradition), to the pursuit of personal interests even at the expense of others (Power), and to the promotion of the welfare of others or transcendence of selfish interests (Benevolence and Universalism). Opposingly, fewer depressive symptoms are associated with higher relative importance attributed to affective autonomy-related values—pleasure (Hedonism) and excitement in life (Stimulation)—and conflict avoidance (Conformity). In Growth Focus clusters (2 and 4), depression correlates negatively with Hedonism and Conservation, following an irregular pattern of near no correlation with the other value priorities, except for the positive correlation with Achievement observed in cluster 2.

4. Discussion

All clusters present some common features concerning the relations between personal value priorities and the cognitive and affective aspects studied. SWB associates negatively with Power and Achievement, in agreement with the previous studies of Bilsky and Schwartz (1994) and of Steel, Taras, Uggerslev, and Bosco (Steel et al. 2018), not being “equable merely as frivolous hedonism” (Diener and Suh 1997, p. 204). This suggests that the extrinsic values are not the ones promoting SWB (Kasser 2018), contrarily to the expected in materialistic societies (Ramos et al. 2016). This notion of non-compliance between personal and social expectations is considered positive in Growth Focus clusters and negative in Social Focus ones. Another common feature is that SGH correlates positively with Hedonism, favouring a positive view of hedonism, seen as a natural signal that should not be disregarded (Veenhoven 2003). In fact, “Hedonism values derive from organismic needs and the pleasure associated with satisfying them” (Schwartz 2013, p. 5), legitimizing “inborn needs to attain pleasure and arousal” (Schwartz 2012, p. 16). Social life also correlates positively with Hedonism in all the clusters, contrarily to the Çalışkan, Sapmaz, and Uzunkol’s perspective (Çalışkan et al. 2015), in which internalised security, conformity, and benevolence values predict more importance to social life and interpersonal relationships. This result brings us to the conceptual distinction made by Ryan and Deci (2001) between the hedonic (pleasure attainment and pain avoidance) and the eudaimonic (meaning and self-realization) approaches that, in some areas, are divergent and in others complementary. According to Waterman, Schwartz, and Conti (Waterman et al. 2008), if someone experiences eudaimonic living, he or she will also experience hedonic enjoyment, although not all hedonic enjoyment is originated in eudaimonic living. Depression is associated with Conservation and Hedonism in all clusters, suggesting that a life devoted to survival and immediate pleasure does not fulfil the specific needs of human achievement (McLeod 2018). Consequently, it is possible to say Hedonism appears as the most prioritized human value associated with positive affectivity constructs and influences SWB, SGH, social life, and depression.
However, the distinct sociodemographic characteristics of the four clusters impact their value specificities, over imposing the Social versus Growth Focus dichotomy. Cluster 1 (Social Focus) primarily consists of people from central Europe, while cluster 3 (Strong Social Focus) shows a greater geographical diversity, including people from central Europe (Poland and Estonia), southern Europe (Spain), and northern Europe (Finland). These clusters present the highest values of Conservation (Security, Conformity, and Tradition) and Self-Transcendence (Benevolence and Universalism). Both clusters exhibit high SGH, fair SWB, regular social life, and low depression, although cluster 3 has the largest depressive values, probably because it contains mostly older people (Luppa et al. 2012) and women (Schuch et al. 2014) belonging to lower social classes (Piff et al. 2018). Depressive symptoms correlate positively with Self-Transcendence (Benevolence and Universalism), Conservation (Security and Tradition), and Self-Enhancement (Power), and negatively with Openness to Change (Hedonism and Stimulation) and Conformity, contrary to what was observed by Kotov, Gamez, Schmidt, and Watson (Kotov et al. 2010). Nevertheless, these are the clusters presenting less SWB, health perception, and social life. In cluster 3, SWB is not determined by Achievement because a greater need for security is related to less Achievement, although Self-Transcendence perceives an exciting life. Also, SWB is negatively associated with Self-Enhancement values, like Power. This may also be related to this cluster elements’s social class. For Diener, Oishi, and Lucas (Diener et al. 2015, p. 235), “the association between national income and well-being is likely because (…) people’s basic needs and desires are met”. Ng and Diener (2018) also found that income is more determinant of SWB in lower than higher-income inequity nations. Regarding age and gender, Ryff (1989) found that middle-aged persons scored significantly higher in SWB than elderly and young adults but noticed no gender differences. Still, in cluster 3, the perception of health is positively associated with Hedonism, Self-Direction, and Universalism. Wang, Worsley, and Hunter (Wang et al. 2012) and Brunsø, Scholderer, and Grunert (Brunsø et al. 2004) also observed an association between Universalism and health perception.
Regarding Growth Focus clusters, they both value Self-Transcendence and Openness to Change, although moderately in cluster 4, which explains the Weak Growth Focus designation. They also have in common the fact that their respondents come mostly from the same countries (northern Europe, France, Germany, and Switzerland, in accordance with Kasser’s view that “wealthy nations that are attempting to improve the well-being of their children might do well to focus less on policies designed to maximize economic growth and more on policies that encourage Harmony and Egalitarian values among the populace” (Kasser 2011, p. 213)), are younger (agreeing with Tyler and Schuller (1991) and with Srivastava, John, Gosling, and Potter (Srivastava et al. 2003), who state that “openness to change (...) declines over time”), include more single people (according to Schwartz (2007), “once people begin starting families (…) and attain stable positions (…), they (…) become less preoccupied with their (…) strivings and more concerned with the welfare of others (…)”, implying “self-transcendence values (…) increase with age and self-enhancement values (…) decrease” (p. 179)), have higher academic qualifications (corroborating Kohn and Schooler’s (1983, cit. in Schwartz 2007, p. 180) statement that “educational experiences presumably promote the intellectual openness, flexibility, and breadth of perspective essential for self-direction values”) and belong to higher social classes (which agrees with Thomas, Lazarova, and Inkson (Thomas et al. 2005), who found that openness to experience is positively related to salary and promotion, but disagrees with Gelissen and de Graaf (2006) and with Seibert and Kraimer (2001), for whom openness to experience is negatively related to income). The main difference between these two clusters is the fact that cluster 4 (Weak Growth Focus) is comprised mainly by males, and cluster 2 (Growth Focus) mainly by married females. This is somehow surprising, but effectively cluster 2 prioritises mostly Openness to Change (Self-Direction and Hedonism), whereas cluster 4 prioritises both Openness to Change (Stimulation and Hedonism) and Self-Enhancement (Power and Achievement). Such results are in partial agreement with those of Schwartz and Rubel (2005), who observed that men consistently attribute more importance than women to Power, Stimulation, Hedonism, Achievement, and Self-Direction values. Regarding the latter, 14 years past Rubel’s study (Schwartz and Rubel 2005), a greater appreciation on the part of women is found. Though, by then, Schwartz and Rubel (2005) claimed that the difference between gender was small and mostly moderated by culture. In any case, cluster 2, which is predominantly female, is far from what these authors reported (p. 1020): “Benevolence values are most important for women, followed by Universalism, Self-Direction, Security, Conformity, Hedonism, Achievement, Tradition, Stimulation, and Power. For men, benevolence values are first as well, followed by Self-Direction, Universalism, Security, Hedonism, Conformity, Achievement, Stimulation, Tradition, and Power”. Nevertheless, women consistently score higher than men in Benevolence and Universalism, and men higher than women in Self-Enhancement (Schwartz and Rubel 2005). Kajonius, Persson, and Jonason (Kajonius et al. 2015) consider that Hedonism, Achievement, and Power are the universal human values that characterise the Dark Triad of Personality (Machiavellianism, narcissism, and psychopathy).
Both Growth clusters present high SGH, SWB, and social life, and low depression. Wojcik and Ditto (2014) stress that individuals more prone to Self-Enhancement are more affected than low self-enhancers by the desirability of happiness when reporting SWB. Cluster 2 presents the highest scores in social life and SWB (here too the achievement does not promote SWB, but self-accomplishment) and cluster 4 scores highest in health perception. Such a result can be explained by the younger age of this cluster’s elements. Additionally, the fact that cluster 2, mostly female, values social life corroborates Fuhrer and Stansfeld (2002), who state that women report more close people in their primary networks and have a wider range of sources of emotional support than men. Ryff (1989) has also reported higher SWB in women than men. In cluster 2, SWB is enhanced by pleasure and self-rewarding and diminished by Social Focus’ values; here, the SWB correlates positively with hedonism and negatively with Power. These results can be explained by Kováč (2012, p. 298), who stated that “the emotional ‘good’ has become detached from the Darwinian ‘good’, such that experiencing pleasure has become an end in itself”. In cluster 4, SWB is positively associated with Benevolence, which prioritises concern with others and their well-being. In this cluster, SGH correlates positively with Stimulation, Hedonism, and Achievement and negatively with Conformity and Tradition. Aavik and Dobewall (2016) consider Schwartz’s values do not contemplate health to the extent of their importance to people and conclude that “health values were further found to disperse on a third dimension, which did not follow the conflicts and compatibilities ordering the original two value dimensions” (p. 1145): Benevolence, both dependability and caring, should join Social Health while opposing Universalism (nature), Mental Health, Physical Health, and Security (personal).
In clusters 2 and 4, social life correlates positively with Universalism and Hedonism. In cluster 4, social life also correlates positively with Achievement, and negatively with Conformity, while in cluster 2 it correlates negatively with Security. Assiter (2016) considers that all groups need a perspective of universal humanity because it is a view about the shared characteristics of all humans. “Universalism is also a normative perspective—a view that there are principles of justice that require that each person, whoever and wherever they are, is treated fairly and equally” (p. 35). In both clusters, depression correlates negatively with Hedonism and Conservation, according to Kotov and co-workers (Kotov et al. 2010), and in cluster 2 it correlates with Achievement, as Hanel and Wolfradt (2016) predicted.
This study has the following limitations: ESS data is based on self-reported measures and, although most of the information is correct, there may be mistakes and false reported information, namely regarding income; there is also the possibility of some bias resulting from refusal to participate in some social groups in different countries (Alam et al. 2005; Demarest et al. 2013; Stoop 2005); finally, some variables, namely, “subjective general health”, in ESS, adopted a five-point scale, which is easier from the respondent’s point of view, but gives the researcher fewer opportunities.

5. Conclusions

Given the relevance of Hedonism in this study, the authors agree with Allport (1954, 1968) when stating that the philosophy of hedonism is considered the most important simple principle that can explain all human behaviour, boredom, not pain, being the opposite of pleasure (Campbell 2018), in line with the James Mill’s Utilitarianism (Hariri 2018). Although the authors are aware of the paradox of hedonism (the idea that making pleasure the sole thing that we desire for its own sake can be self-defeating; (Dietz 2019)) and the negative aspects of neurotic hedonism (deriving satisfaction from unsatisfied desire itself; (Ware 2018)), they do not think it opposes altruism, as proposed by Sober and Wilson (1998). In fact, the results in this study point to a rehabilitation of the notion of hedonism, in line with Fletcher (2015), which raises the distinction between higher and lower pleasures and claims that the former contribute more to well-being than the latter.
This study contributes to the cumulative theoretical knowledge in psychology, in the sense that it seeks to update the model of Schwartz and colleagues (Schwartz 2012). Although these results should not be generalised to populations from continents other than Europe, this study provides new insights into the relationship between the human values and SWB, SGH, social life, and depression, allowing the identification and characterisation of four clusters, allowing the deepening of the knowledge on the topic.

Supplementary Materials

The following are available online at https://www.mdpi.com/2076-0760/10/2/74/s1: Table S1: Sample characterization: Count (N); row percentage per category (%) or mean (M) and standard deviation (StD). Table S2: Kolmogorov-Smirnov, Levene and Kruskal-Wallis tests results (test statistics D, W and Χ2, respectively) for Subjective General Health and the composite indices’ distributions between clusters. Dunn’s pairwise tests results indicate the cluster’s ranking for significant median differences found and the corresponding effect sizes (η2). All associated p-values were < 0.001 and, thus, are not indicated. Table S3: Spearman correlations between human values’ priorities and the indicators of subjective well-being (SWB), subjective general health (SGH), social life and depression, for the 4 clusters.

Author Contributions

Conceptualization, Â.L. and A.R.; methodology, Â.L. and A.R; formal analysis, A.R. and A.F.; investigation, Â.L., A.R., and A.F.; writing—original draft preparation, Â.L., A.R., and A.F.; writing—review and editing, Â.L., A.R., D.G.V., H.F.P.eS., and M.A.P.D. and A.F.; visualization, Â.L., A.R., D.G.V., H.F.P.eS., M.A.P.D., and A.F.; supervision, Â.L. All authors have read and agreed to the published version of the manuscript.

Funding

This research received no external funding.

Institutional Review Board Statement

Ethical review and approval were waived for this study, due to the fact that data is freely available in https://www.europeansocialsurvey.org/data/download.html?r=7 (accessed on 19 February 2021).

Informed Consent Statement

Not applicable.

Data Availability Statement

The data presented in this study are openly available in https://www.europeansocialsurvey.org/data/download.html?r=7 (accessed on 19 February 2021).

Conflicts of Interest

The authors declare no conflict of interest.

References

  1. Aavik, Toivo, Anu Aavik, and Margus Punab. 2014. Personal values that support and counteract utilization of a screening test for prostate cancer. Behavioral Medicine 40: 22–28. [Google Scholar] [CrossRef]
  2. Aavik, Toivo, and Henrik Dobewall. 2016. Where is the location of “health” in the human values system? Evidence from Estonia. Social Indicators Research 131: 1145–62. [Google Scholar] [CrossRef]
  3. Abraham, Charles, and Pashcal Sheeran. 2005. The health belief model. In Predicting Health Behavior. Edited by Mark Conner and Paul Norman. Glasgow: Bell and Bain Ltd. [Google Scholar] [CrossRef]
  4. Ahola, Salla. 2015. Human values and non-adherence to doctors’ instructions across Europe. Journal of Applied Social Psychology 45: 214–25. [Google Scholar] [CrossRef]
  5. Alam, Asad, Mamta Murthi, Ruslan Yemtsov, Edmundo Murrugarra, Nora Dudwick, Ellen Hamilton, and Erwin Tiongson. 2005. Growth, Poverty and Inequality: Eastern Europe and the Former Soviet Union. Washington, DC: World Bank. [Google Scholar]
  6. Allport, Gordon. 1954. The Nature of Prejudice. Oxford: Addison-Wesley. [Google Scholar]
  7. Allport, Gordon. 1968. The Person in Psychology. Boston: Beacon Press. [Google Scholar]
  8. Annisette, Logan, and Kathryn Lafreniere. 2017. Social media, texting, and personality: A test of the shallowing hypothesis. Personality and Individual Differences 115: 154–58. [Google Scholar] [CrossRef]
  9. Assiter, Alison. 2016. Why universalism? Feminist Dissident 1: 35–63. [Google Scholar] [CrossRef]
  10. Baiocchi-Wagner, Elizabeth, and Loreen Olson. 2016. Motherhood and family health advocacy in nutrition and exercise:“Doing the Tradition”. Journal of Family Communication 16: 128–42. [Google Scholar] [CrossRef]
  11. Balakrishnan, Anjana, Rachel Plouffe, and Donald Saklofske. 2017. What do sadists value? Is honesty-humility an intermediary? Replicating and extending findings on the link between values and “dark” personalities. Personality and Individual Differences 109: 142–47. [Google Scholar] [CrossRef]
  12. Bernard, Michael. 2018. Rationality in coaching. In Coaching for Rational Living. Cham: Springer, pp. 51–66. [Google Scholar]
  13. Bevan, Jennifer, and Lisa Sparks. 2014. The relationship between accurate and benevolently biased serial argument perceptions and individual negative health perceptions. Communication Research 41: 257–81. [Google Scholar] [CrossRef]
  14. Bilsky, Wolfgang, and Shalom H. Schwartz. 1994. Values and personality. European Journal of Personality 8: 163–81. [Google Scholar] [CrossRef]
  15. Blau, Peter. 2017. Exchange and Power in Social Life. Abingdon-on-Thames: Routledge. [Google Scholar]
  16. Bobowik, Magdalena, Nekane Basabe, Darío Páez, Amaia Jiménez, and Maria Angeles Bilbao. 2011. Personal values and well-being among Europeans, Spanish natives and immigrants to Spain: Does the culture matter? Journal Happiness Studies 12: 401–19. [Google Scholar] [CrossRef]
  17. Borg, Ingwer, Anat Bardi, and Shalom Schwartz. 2017. Does the value circle exist within persons or only across persons? Journal of Personality 85: 151–62. [Google Scholar] [CrossRef] [PubMed] [Green Version]
  18. Brunsø, Karen, Joachim Scholderer, and Klaus Grunert. 2004. Testing relationships between values and food-related lifestyle: Results from two European countries. Appetite 43: 195–205. [Google Scholar] [CrossRef]
  19. Bulley, Catherine, Marie Donaghy, Andrew Payne, and Nanette Mutrie. 2009. Personal meanings, values and feelings relating to physical activity and exercise participation in female undergraduates: A qualitative exploration. Journal of Health Psychology 14: 751–60. [Google Scholar] [CrossRef] [Green Version]
  20. Çalışkan, Hüseyin, Fatma Sapmaz, and Ebru Uzunkol. 2015. Value preferences of university students as predictors of life goals. Social Indicators Research 124: 111–25. [Google Scholar] [CrossRef]
  21. Campbell, Colin. 2018. Traditional and Modern Hedonism. In The Romantic Ethic and the Spirit of Modern Consumerism. Cham: Palgrave Macmillan, pp. 107–30. [Google Scholar]
  22. Campos, Rui. 2017. O relacionamento e a auto-definição de acordo com a perspectiva de Sidney Blatt: Conceptualização e implicações clínicas [Relationship and self-definition according to Sidney Blatt’s perspective: Conceptualization and clinical implications]. Análise Psicológica 35: 45–60. [Google Scholar] [CrossRef] [Green Version]
  23. Carnelley, Katherine, Mona-Maria Bejinaru, Lorna Otway, David Baldwin, and Angela Rowe. 2018. Effects of repeated attachment. security priming in outpatients with primary depressive disorders. Journal of Affective Disorders 234: 201–6. [Google Scholar] [CrossRef]
  24. Chang, Mellisa Xue-Ling, and Joland Jetten. 2015. Understanding cultural identification: Integrating the intersubjective approach with social identity theorizing. Journal of Cross-Cultural Psychology 46: 1291–95. [Google Scholar] [CrossRef]
  25. Chang, Mellisa Xue-Ling, Joland Jetten, Tegan Cruwys, and Catherine Haslam. 2016. Cultural identity and the expression of depression: A social identity perspective. Journal of Community and Applied Social Psychology 27: 16–34. [Google Scholar] [CrossRef]
  26. Chulef, Ada, Stephen Read, and David Walsh. 2001. A hierarchical taxonomy of human goals. Motivation and Emotion 25: 191–232. [Google Scholar] [CrossRef]
  27. Cieciuch, Jan, Eldad Davidov, Michele Vecchione, Constanze Beierlein, and Shalom Schwartz. 2014. The cross-national invariance properties of a new scale to measure 19 basic human values: A test across eight countries. Journal of Cross-Cultural Psychology 45: 764–76. [Google Scholar] [CrossRef] [Green Version]
  28. Cohen, Jacob. 1988. Statistical Power Analysis for the Behavioral Sciences. New York: Routledge. [Google Scholar]
  29. Cooley, Charles. 2017. Human Nature and the Social Order. New York: Routledge. [Google Scholar]
  30. Davies, Allyson Ross, and John Ware. 1981. Measuring Health Perceptions in the Health Insurance Experiment. Santa Monica: Rand Corporation. [Google Scholar]
  31. De Vaus, David. 2013. Surveys in Social Research. New York: Routledge. [Google Scholar]
  32. Del Pilar Sánchez-López, María, Ana Isabel Saavedra, Virginia Dresch, and Rosa María Limiñana-Gras. 2014. Conformity to traditional gender norms in a feminized occupation: The influence on health behaviors. Health 6: 2775–89. [Google Scholar] [CrossRef] [Green Version]
  33. Demarest, Stefaan, Johan Van der Heyden, Rana Charafeddine, Jean Tafforeau, Herman Van Oyen, and Guido Van Hal. 2013. Socio-economic differences in participation of households in a Belgian national health survey. The European Journal of Public Health 23: 981–85. [Google Scholar] [CrossRef] [PubMed]
  34. Dewey, John, and John McDermott. 1973. The Philosophy of John Dewey. New York: Putnam Sons. [Google Scholar]
  35. Diener, Edward. 2000. Subjective well-being: The science of happiness and a proposal for a National Index. American Psychologist 55: 34–43. [Google Scholar] [CrossRef]
  36. Diener, Ed, and Eunkook Suh. 1997. Measuring quality of life: Economic, social, and subjective indicators. Social Indicators Research 40: 189–216. [Google Scholar] [CrossRef]
  37. Diener, Ed, Shigehiro Oishi, and Richard Lucas. 2003. Personality, culture, and subjective well-being: Emotional and cognitive evaluations of life. Annual Review of Psychology 54: 403–25. [Google Scholar] [CrossRef]
  38. Diener, Ed, Shigehiro Oishi, and Richard Lucas. 2015. National accounts of subjective well-being. American Psychologist 70: 234242. [Google Scholar] [CrossRef]
  39. Dietz, Alexander. 2019. Explaining the Paradox of Hedonism. Australasian Journal of Philosophy 97: 497–510. [Google Scholar] [CrossRef]
  40. Döring, Anna, Shalom Schwartz, Jan Cieciuch, Patrick Groenen, Valentina Glatzel, Justyna Harasimczuk, Nicole Janowicz, Maya Nyagolova, Rebecca Scheefer, Matthias Allritz, and et al. 2015. Cross-cultural evidence of value structures and priorities in childhood. British Journal of Psychology 106: 675–99. [Google Scholar] [CrossRef]
  41. ESS Round 7: European Social Survey. 2014. Round 7 Data 2014. Data File Edition 2.1. Bergen: NSD—Norwegian Centre for Research Data, Norway—Data Archive and Distributor of ESS Data for ESS ERIC. [Google Scholar]
  42. ESS Round 7: European Social Survey. 2016. ESS-7 2014 Documentation Report. Edition 3.1. Bergen: European Social Survey Data Archive, NSD—Norwegian Centre for Research Data for ESS ERIC. [Google Scholar]
  43. Eurobarometer. 2012. Standard Eurobarometer. Report. The Values of Europeans. Available online: http://ec.europa.eu/commfrontoffice/publicopinion/archives/eb/eb77/eb77_value_en.pdf (accessed on 20 November 2018).
  44. European Social Survey—ESS. 2015. ESS Round 7 (2014/2015) Technical Report. London: ESS ERIC. [Google Scholar]
  45. Fischer, Ronald, and Shalom Schwartz. 2011. Whence differences in value priorities? Individual, cultural, or artifactual sources. Journal of Cross-Cultural Psychology 42: 1127–44. [Google Scholar] [CrossRef]
  46. Fletcher, Guy. 2015. The Routledge Handbook of the Philosophy of Well Being. New York: Routledge. [Google Scholar]
  47. Fuhrer, Rebecca, and Stephen Stansfeld. 2002. How gender affects patterns of social relations and their impact on health: A comparison of one or multiple sources of support from “close persons”. Social Science and Medicine 54: 811–25. [Google Scholar] [CrossRef]
  48. Gebhardt, Winifred, Margot van der Doef, and Laurie Paul. 2001. The revised health hardiness inventory (RRHI24): Psychometric properties and relationship with self-reported health and health behavior in two Dutch samples. Health Education Research 16: 579–92. [Google Scholar] [CrossRef]
  49. Gelissen, John, and Paul de Graaf. 2006. Personality, social background, and occupational career success. Social Science Research 35: 702–26. [Google Scholar] [CrossRef] [Green Version]
  50. Gibson, Jane Whitney, Regina Greenwood, and Edward Murphy Jr. 2009. Generational differences in the workplace: Personal values, behaviors, and popular beliefs. Journal of Diversity Management 4. [Google Scholar] [CrossRef] [Green Version]
  51. Gouveia, Valdiney, Kátia Vione, Taciano Milfont, and Ronald Fischer. 2015. Patterns of value change during the life span: Some evidence from a functional approach to values. Personality and Social Psychology Bulletin 41: 1276–90. [Google Scholar] [CrossRef] [PubMed]
  52. Gouveia, Valdiney, Taciano Milfont, and Valeschka Guerra. 2014. Functional theory of human values: Testing its content and structure hypotheses. Personality and Individual Differences 60: 41–47. [Google Scholar] [CrossRef]
  53. Hanel, Paul, and Uwe Wolfradt. 2016. The “dark side” of personal values: Relations to clinical constructs and their implications. Personality and Individual Differences 97: 140–145. [Google Scholar] [CrossRef] [Green Version]
  54. Hariri, Nizar. 2018. Mill’s qualitative hedonism as an ethics of desire: Towards an intersubjective concept of pleasure. In The Individual and the Other in Economic Thought. New York: Routledge, pp. 40–53. [Google Scholar]
  55. Hughes, Kahryn. 2017. Health as individual responsibility: Possibilities and personal struggle. In Mainstreaming Complementary and Alternative Medicine. New York: Routledge, pp. 25–46. [Google Scholar]
  56. Hwang, Wei-Chin, Hector Myers, Jennifer Abe-Kim, and Julia Ting. 2008. A conceptual paradigm for understanding culture’s impact on mental health: The cultural influences on mental health (CIMH) model. Clinical Psychology Review 28: 211–27. [Google Scholar] [CrossRef]
  57. Inglehart, Ronald, and Christian Welzel. 2010. Changing mass priorities: The link between modernization and democracy. Perspectives on Politics 8: 551–67. [Google Scholar] [CrossRef] [Green Version]
  58. Jamaludin, Nor Lelawati, David Lackland Sam, Gro Mjeldheim Sandal, and Ainul Adam. 2016. Personal values, subjective well-being and destination-loyalty intention of international students. Springer Plus 5: 720. [Google Scholar] [CrossRef] [Green Version]
  59. Jarden, Aaron John. 2010. Relationships between Personal Values and Depressed Mood and Subjective Wellbeing. Ph.D. dissertation, University of Canterbury, Christchurch, New Zealand. Available online: http://ir.canterbury.ac.nz/handle/10092/5205 (accessed on 18 November 2018).
  60. Joint Research Centre-European Commission. 2008. Handbook on Constructing Composite Indicators: Methodology and User Guide. Paris: OECD Publishing. [Google Scholar]
  61. Kahneman, Daniel, and Angus Deaton. 2010. High income improves evaluation of life but not emotional well-being. Proceedings of the National Academy of Sciences of the United States of America 107: 16489–93. [Google Scholar] [CrossRef] [Green Version]
  62. Kajonius, Petri, Björn Persson, and Peter Jonason. 2015. Hedonism, achievement, and power: Universal values that characterize the Dark Triad. Personality and Individual Differences 77: 173–78. [Google Scholar] [CrossRef]
  63. Kasser, Tim. 2011. Cultural values and the well-being of future generations: A cross-national study. Journal of Cross-Cultural Psychology 42: 206–15. [Google Scholar] [CrossRef]
  64. Kasser, Tim. 2016. Materialistic values and goals. Annual Review of Psychology 67: 489–514. [Google Scholar] [CrossRef] [Green Version]
  65. Kasser, Tim. 2018. Materialism and living well. In Handbook of Well-Being. Edited by Ed Diener, Shigehiro Oishi and Louis Tay. Salt Lake City: DEF Publishers. [Google Scholar]
  66. Kohn, Melvin, and Carmi Schooler. 1983. Work and Personality. Norwood: Ablex. [Google Scholar]
  67. Kohn, Melvin, and Kazimierz Slomczynski. 1993. Social Structure and Self-Direction: A Comparative Analysis of the United States and Poland. Oxford: Blackwell. [Google Scholar]
  68. Kotov, Roman, Wakiza Gamez, Frank Schmidt, and David Watson. 2010. Linking “big” personality traits to anxiety, depressive, and substance use disorders: A meta-analysis. Psychological Bulletin 136: 768821. [Google Scholar] [CrossRef]
  69. Kováč, Ladislav. 2012. The biology of happiness: Chasing pleasure and human destiny. EMBO Reports 13: 297–302. [Google Scholar] [CrossRef] [PubMed] [Green Version]
  70. Leite, Ângela, Hélder Fernando Pedrosa e Sousa, Diogo Guedes Vidal, and Maria Alzira Pimenta Dinis. 2020. Finding a path for happiness in the context of sustainable development: A possible key. International Journal of Sustainable Development & World Ecology 27: 396–404. [Google Scholar] [CrossRef]
  71. Liu, Junsheng, Amand Bullock, Robert Coplan, Xinyin Chen, Dan Li, and Ying Zhou. 2018. Developmental cascade models linking peer victimization, depression, and academic achievement in Chinese children. British Journal of Developmental Psychology 36: 47–63. [Google Scholar] [CrossRef]
  72. Luppa, Melanie, Claudia Luck-Sikorski, Tobias Luck, Lena Ehreke, Alexander Konnopka, Birgitt Wiese, Siegfried Weyerer, Hans-Helmut König, and Steffi Riedel-Heller. 2012. Age-and gender-specific prevalence of depression in latest-life–systematic review and meta-analysis. Journal of Affective Disorders 136: 212–21. [Google Scholar] [CrossRef]
  73. Maercker, Andreas, Xiao Chi Zhang, Zhihua Gao, Yakov Kochetkov, Shan Lu, Zhiqin Sang, Shaoqing Yang, Silvia Schneider, and Jürgen Margraf. 2015. Personal value orientations as mediated predictors of mental health: A three-culture study of Chinese, Russian, and German university students. International Journal of Clinical and Health Psychology 15: 8–17. [Google Scholar] [CrossRef]
  74. Magun, Vladimir, and Maksim Rudnev. 2015. Basic human values of the Russians: Both different from and similar to other Europeans. In Culture Matters in Russia and Everywhere: Backdrop for the Russia-Ukraine Conflict. Edited by Lawrence Harrison and Evgeny Yasin. Lanham: Lexington Books, pp. 431–50. [Google Scholar]
  75. Magun, Vladimir, Maksim Rudnev, and Peter Schmidt. 2016. Within- and between-country value diversity in Europe: A typological approach. European Sociological Review 32: 189–202. [Google Scholar] [CrossRef] [Green Version]
  76. Magun, Vladimir, Maksin Rudnev, and Peter Schmidt. 2017. A typology of European values and Russians’ basic human values. Russian Social Science Review 58: 509–40. [Google Scholar] [CrossRef]
  77. Maio, Gregory. 2010. Mental representations of social values. In Advances in Experimental Social Psychology. Edited by M. P. Zanna. San Diego: Academic Press, vol. 42, pp. 1–43. [Google Scholar] [CrossRef]
  78. Manfredo, Michael, Jeremy Bruskotter, Tara Teel, David Fulton, Shalom Schwartz, Robert Arlinghaus, Shigehiro Oishi, Ayse Uskul, Kent Redford, Shinobu Kitayama, and et al. 2017. Why social values cannot be changed for the sake of Conservation. Conservation Biology 31: 772–80. [Google Scholar] [CrossRef] [PubMed]
  79. McLeod, Saul. 2018. Maslow’s Hierarchy of Needs. Available online: https://www.simplypsychology.org/maslow.html (accessed on 21 May 2018).
  80. Minkkinen, Jaana, Pirjo Lindfors, Jaana Kinnunen, Eerika Finell, Mari-Pauliina Vainikainen, Sakari Karvonen, and Arja Rimpelä. 2017. Health as a predictor of students’ academic achievement: A 3-level longitudinal study of Finnish adolescents. Journal of School Health 87: 902–10. [Google Scholar] [CrossRef] [PubMed] [Green Version]
  81. Minkov, Michael, and Geert Hofstede. 2012. Hofstede’s fifth dimension: New evidence from the World Values Survey. Journal of Cross-Cultural Psychology 43: 3–14. [Google Scholar] [CrossRef] [Green Version]
  82. Mukerjee, Radhakamal. 1965. The Social Structure of Values. New Delhi: Chand. [Google Scholar]
  83. Ng, Weiting, and Ed Diener. 2018. Affluence and subjective well-being: Does income inequality moderate their associations? Applied Research in Quality of Life, 1–16. [Google Scholar] [CrossRef]
  84. Norlander, Torsten, Ellinor Ernestad, Ziba Moradiani, and Tommy Nordén. 2015. Perceived feeling of security: A candidate for assessing remission in borderline patients? The Open Psychology Journal 8. [Google Scholar] [CrossRef] [Green Version]
  85. Nowicki, Grzegorz, Patrycja Misztal-Okońska, Barbara Ślusarska, Ewa Rudnicka-Drożak, Magdalena Młynarska, and Artur Czekierdowski. 2018. Analysis of Health Behaviors and Personal Values of Childless Women, Pregnant Women and Women Who Recently Delivered. International Journal of Environmental Research and Public Health 15: 411. [Google Scholar] [CrossRef] [Green Version]
  86. Oishi, Shigehiro, Ayano Yagi, Asuka Komiya, Florian Kohlbacher, Takashi Kusumi, and Keiko Ishii. 2017. Does a major earthquake change job preferences and human values? European Journal of Personality 31: 258–65. [Google Scholar] [CrossRef]
  87. Piff, Paul, Michael Kraus, and Dacher Keltner. 2018. Unpacking the inequality paradox: The psychological roots of inequality and social class. In Advances in Experimental Social Psychology. Cambridge: Academic Press, vol. 57, pp. 53–124. [Google Scholar] [CrossRef]
  88. Pino-Domínguez, Lara, Patricia Navarro-Gil, Abel González-Vélez, Maria-Eugenia Prieto-Flores, Alba Ayala, Fermina Rojo-Pérez, Gloria Fernandez-Mayoralas, Pablo Martinez-Martin, and Maria João Forjaz. 2016. Self-perceived health status, gender, and work status. Journal of Women and Aging 28: 386–94. [Google Scholar] [CrossRef]
  89. Poeller, Susanne, Max Birk, Nicola Baumann, and Regan Mandryk. 2018. Let me be implicit: Using motive disposition theory to predict and explain behaviour in digital games. In Paper presented at CHI ‘18: Proceedings of the 2018 CHI Conference on Human Factors in Computing Systems, Montreal, QC, Canada, April 21–26. [Google Scholar]
  90. Porter, Susann, and Ulrika Bejerholm. 2018. The effect of individual enabling and support on empowerment and depression severity in persons with affective disorders: Outcome of a randomized control trial. Nordic Journal of Psychiatry 72: 259–67. [Google Scholar] [CrossRef]
  91. Radloff, Lenore Sawyer. 1977. The CES-D scale: A self-report depression scale for research in the general population. Applied Psychological Measurement 1: 385–401. [Google Scholar] [CrossRef]
  92. Ramos, Alice, Cicero Roberto Pereira, and Jorge Vala. 2016. Economic crisis, human values and attitudes towards immigrants. In Values, Economic Crisis and Democracy. New York: Routledge, pp. 130–63. [Google Scholar]
  93. Ramos, Katherine, Alaattin Erkanli, and Harold Koenig. 2018. Effects of religious versus conventional cognitive–behavioral therapy (CBT) on suicidal thoughts in major depression and chronic medical illness. Psychology of Religion and Spirituality 10: 79–87. [Google Scholar] [CrossRef]
  94. Rasmussen, Anne, Carsten Jørgensen, Maja O’Connor, Birgit Bennedsen, Kristine Godt, Rikke Bøye, and Dorthe Berntsen. 2017. The structure of past and future events in borderline personality disorder, eating disorder, and obsessive–compulsive disorder. Psychology of Consciousness: Theory, Research, and Practice 4: 190–210. [Google Scholar] [CrossRef] [Green Version]
  95. Reeskens, Tim, and Leen Vandecasteele. 2017. Hard times and European youth. The effect of economic in security on human values, social attitudes and well-being. International Journal of Psychology 52: 19–27. [Google Scholar] [CrossRef] [PubMed] [Green Version]
  96. Ripley, Jennifer, Everett Worthington, Rachel Garthe, Don Davis, Joshua Hook, Chelsea Reid, Daryl Van Tongeren, Amy Voltmer, Camilla Nonterah, Richard Cowden, and et al. 2018. Trait forgiveness and dyadic adjustment predict postnatal depression. Journal of Child and Family Studies 27: 1–8. [Google Scholar] [CrossRef]
  97. Rokeach, Milton. 1973. The Nature of Human Values. New York: Free press. [Google Scholar]
  98. Rudnev, Maksim, Vladimir Magun, and Peter Schmidt. 2016. Basic human values: Stability of value typology in Europe. In Values, Economic Crisis and Democracy. New York: Routledge, pp. 21–49. [Google Scholar]
  99. Ryan, Richard, and Edward Deci. 2001. On happiness and human potentials: A review of research on hedonic and eudaimonic well-being. Annual Review of Psychology 52: 141–66. [Google Scholar] [CrossRef]
  100. Ryff, Carol. 1989. Happiness is everything, or is it? Explorations on the meaning of psychological well-being. Journal of Personality and Social Psychology 57: 1069. [Google Scholar] [CrossRef]
  101. Sagiv, Lilach, and Shalom H. Schwartz. 2000. Value priorities and subjective well-being: Direct relations and congruity effects. European Journal Social Psychology 30: 177–98. [Google Scholar] [CrossRef]
  102. Sagiv, Lilach, Sonia Roccas, Jan Cieciuch, and Shalom Schwartz. 2017. Personal values in human life. Nature Human Behaviour 1: 630–39. [Google Scholar] [CrossRef]
  103. Schuch, Felipe Barreto, Stephanie Santana Pinto, Natália Carvalho Bagatini, Paula Zaffari, Cristine Lima Alberton, Eduardo Lusa Cadore, Rodrigo Ferrari, and Luiz Fernando Martins Kruel. 2014. Water-based exercise and quality of life in women: The role of depressive symptoms. Women & Health 54: 161–75. [Google Scholar]
  104. Schwartz, Shalom. 1992. Universals in the content and structure of values: Theoretical advances and empirical tests in 20 countries. In Advances in Experimental Social Psychology. Edited by Mark Zanna. New York: Academic Press, vol. 25, pp. 1–65. [Google Scholar] [CrossRef]
  105. Schwartz, Shalom. 1994. Are there universal aspects in the structure and contents of human values? Journal of Social Issues 50: 19–45. [Google Scholar] [CrossRef]
  106. Schwartz, Shalom. 2003. Value Orientations. European Social Survey Core Questionnaire Development, Chapter 07. Available online: http://www.europeansocialsurvey.org/docs/methodology/core_ess_questionnaire/ESS_core_questionnaire_human_values.pdf (accessed on 17 December 2020).
  107. Schwartz, Shalom. 2005. Human Values. European Social Survey Education Net. Available online: http://essedunet.nsd.uib.no/cms/topics/1/ (accessed on 19 February 2021).
  108. Schwartz, Shalom. 2006. Les valeurs de base de la personne: Théorie, mesures et applications [Basic values of the person: Theory, measures and applications]. Revue Française de Sociologie 47: 249–88. [Google Scholar] [CrossRef]
  109. Schwartz, Shalom. 2007. Value orientations: Measurement, antecedents and consequences across nations. Measuring Attitudes Cross-Nationally: Lessons from the European Social Survey, 161–93. [Google Scholar] [CrossRef]
  110. Schwartz, Shalom. 2012. An overview of the Schwartz Theory of Basic Values. Online Readings in Psychology and Culture 2. [Google Scholar] [CrossRef]
  111. Schwartz, Shalom. 2013. Value priorities and behavior: Applying. In The Psychology of Values: The Ontario Symposium. East Sussex: Psychology Press, vol. 8. [Google Scholar]
  112. Schwartz, Shalom. 2014. National culture as value orientations: Consequences of value differences and cultural distance. In Handbook of the Economics of Art and Culture. Amsterdam: Elsevier, vol. 2, pp. 547–86. [Google Scholar] [CrossRef]
  113. Schwartz, Shalom, and Anat Bardi. 2001. Value hierarchies across cultures: Taking a similarities perspective. Journal of Cross-Cultural Psychology 32: 268–90. [Google Scholar] [CrossRef] [Green Version]
  114. Schwartz, Shalom, and Florencia Sortheix. 2018. Values and subjective well-being. In Handbook of Well-Being. Edited by Ed Diener, Shigehiro Oishi and Louis Tay. Salt Lake City: DEF Publishers. [Google Scholar]
  115. Schwartz, Shalom, and Tammy Rubel. 2005. Sex differences in value priorities: Cross-cultural and multimethod studies. Journal of Personality and Social Psychology 89: 1010–28. [Google Scholar] [CrossRef] [PubMed] [Green Version]
  116. Seibert, Scott, and Maria Kraimer. 2001. The five-factor model of personality and career success. Journal of Vocational Behavior 58: 1–21. [Google Scholar] [CrossRef]
  117. Seki, Tolga, and Bülent Dilmaç. 2015. Predictor relationships between the values the adolescents have and their levels of subjective well-being and social appearance anxiety: A model proposal. Education and Science 40: 57–67. [Google Scholar] [CrossRef] [Green Version]
  118. Shaver, James. 1965. Reflective thinking, values, and social studies textbooks. The School Review 73: 226–57. [Google Scholar] [CrossRef]
  119. Sober, Elliott, and David Sloan Wilson. 1998. Unto Others: The Evolution and Psychology of Unselfish Behavior. Cambridge: Harvard University Press. [Google Scholar]
  120. Sortheix, Florencia, and Jan-Erik Lönnqvist. 2014. Personal value priorities and life satisfaction in Europe the moderating role of socioeconomic development. Journal Cross-Cultural Psychology 45: 282–99. [Google Scholar] [CrossRef]
  121. Sortheix, Florencia, and Jan-Erik Lönnqvist. 2015. Person-group value congruence and subjective well-being in students from Argentina, Bulgaria and Finland: The role of interpersonal relationships. Journal of Community and Applied Social Psychology 25: 34–48. [Google Scholar] [CrossRef]
  122. Sortheix, Florencia, and Shalom Schwartz. 2017. Values that underlie and undermine well-being: Variability across countries. European Journal of Personality 31: 187–201. [Google Scholar] [CrossRef]
  123. Srivastava, Sanjay, Oliver John, Samuel Gosling, and Jeff Potter. 2003. Development of personality in early and middle adulthood: Set like plaster or persistent change? Journal of Personality and Social Psychology 84: 1041. [Google Scholar] [CrossRef] [Green Version]
  124. Steel, Piers, Vas Taras, Krista Uggerslev, and Frank Bosco. 2018. The happy culture: A theoretical, meta-Analytic, and empirical review of the relationship between culture and wealth and subjective well-being. Personality and Social Psychology Review 22: 128–69. [Google Scholar] [CrossRef] [Green Version]
  125. Stoop, Ineke. 2005. The Hunt for the Last Respondent: Nonresponse in Sample Surveys. The Hague: Social and Cultural Planning Office of the Netherlands, Sociaal en Cultureel Planbu. [Google Scholar]
  126. Strelan, Peter. 2018. Justice and forgiveness in interpersonal relationships. Current Directions in Psychological Science 27: 20–24. [Google Scholar] [CrossRef]
  127. Stringham, Edward. 2015. Private Governance: Creating Order in Economic and Social Life. Oxford: Oxford University Press. [Google Scholar]
  128. Szolnoki, Attila, and Matjaž Perc. 2015. Conformity enhances network reciprocity in evolutionary social dilemmas. Journal of The Royal Society Interface 12: 20141299. [Google Scholar] [CrossRef] [Green Version]
  129. Thibaut, John. 2017. The Social Psychology of Groups. New York: Routledge. [Google Scholar]
  130. Thomas, David, Mila Lazarova, and Kerr Inkson. 2005. Global careers: New phenomenon or new perspectives? Journal of World Business 40: 340–47. [Google Scholar] [CrossRef]
  131. Tyler, Tom, and Regina Schuller. 1991. Aging and attitude change. Journal of Personality and Social Psychology 61: 689–97. [Google Scholar] [CrossRef]
  132. Van Assche, Jasper, Jolene van der Kaap-Deeder, Elien Audenaert, Maarten De Schryver, and Maarten Vansteenkiste. 2018. Are the benefits of autonomy satisfaction and the costs of autonomy frustration dependent on individuals’ autonomy strength? Journal of Personality 86: 1017–36. [Google Scholar] [CrossRef] [Green Version]
  133. Veenhoven, Ruut. 2003. Hedonism and happiness. Journal of Happiness Studies 4: 437–57. [Google Scholar] [CrossRef]
  134. Verstraete, Janine, Lebogang Ramma, and Jennifer Jelsma. 2018. Influence of the child’s perceived general health on the primary caregiver’s health status. Health and Quality of Life Outcomes 16. [Google Scholar] [CrossRef] [Green Version]
  135. Vignoles, Vivian, Peter Smith, Maja Becker, and Matthew Easterbrook. 2018. In search of a Pan-European culture: European values, beliefs, and models of selfhood in global perspective. Journal of Cross-Cultural Psychology 49: 868–87. [Google Scholar] [CrossRef]
  136. Villarosa, Margo, Mary Anne Messer, Michael Madson, and Virgil Zeigler-Hill. 2018. Depressive symptoms and drinking outcomes: The mediating role of drinking motives and protective behavioral strategies among college students. Substance Use and Misuse 53: 143–53. [Google Scholar] [CrossRef]
  137. Wang, Wei, Anthony Worsley, and Wendy Hunter. 2012. Similar but different. Health behaviour pathways differ between men and women. Appetite 58: 760–66. [Google Scholar] [CrossRef] [PubMed] [Green Version]
  138. Ware, Ben. 2018. Excremental Happiness: From Neurotic Hedonism to Dialectical Pessimism. College Literature 45: 198–221. [Google Scholar] [CrossRef]
  139. Waterman, Alan, Seth Schwartz, and Regina Conti. 2008. The implications of two conceptions of happiness (hedonic enjoyment and eudaimonia) for the understanding of intrinsic motivation. Journal of Happiness Studies 9: 41–79. [Google Scholar] [CrossRef]
  140. Wojcik, Sean, and Peter Ditto. 2014. Motivated happiness: Self-Enhancement inflates self-reported subjective well-being. Social Psychological and Personality Science 5: 825–34. [Google Scholar] [CrossRef] [Green Version]
  141. Wong, Y. Joel, Kimberly Tran, Seong-Hyeon Kim, Valerie Van Horn Kerne, and Nicolina Calfa. 2010. Asian Americans’ lay beliefs about depression and professional help seeking. Journal of Clinical Psychology 66: 317–32. [Google Scholar] [CrossRef] [PubMed] [Green Version]
Figure 1. Schwartz quasi-circumplex model of value types and higher order dimensions, adapted from Schwartz (2012).
Socsci 10 00074 g001
Figure 2. Comparison of the mean Schwartz’s higher order value priorities for Europe and the four clusters found.
Socsci 10 00074 g002
Figure 3. Comparison of Europe with the four clusters in the two-dimensional Schwartz value space. The area of the spheres is proportional to the cluster percent size (Europe being 100%). ST—stimulation; SE—security; CO—conformity.
Socsci 10 00074 g003
Figure 4. Clusters’ population distribution, by country.
Socsci 10 00074 g004
Figure 5. Clusters incidence by geographical distribution.
Socsci 10 00074 g005
Figure 6. Graphical representation of Spearman correlations between value priorities and the indicators of SWB, SGH, social life, and depression of the four clusters. (SD—self-direction; ST—stimulation; HE—hedonism; AC—achievement; PO—power; SE—security; TR—tradition; CO—conformity; BE—benevolence; UN—universalism).
Socsci 10 00074 g006
Table 1. Human value items and definition of the type of motivation expressed in Schwartz’s (2012) theory of basic values.
Basic Human ValueType of Goal or Motivation ExpressedHuman Value Items
Self-DirectionIndependent thought and action: choosing, creating, and exploring Freedom, creativity, independent, choosing own goals, curiosity(Intelligent, self-respect, privacy)
StimulationExcitement, novelty, and challenge in life Exciting life, varied life, daring
HedonismPleasure and sensuous gratification for oneself Pleasure, enjoying life, self-indulgent
AchievementPersonal success through demonstrating competence according to social standards Ambitious, capable, influential, successful
(Intelligent, self-respect, social recognition)
PowerSocial status and prestige, control or dominance over people and resources Social power, wealth, authority
(Social recognition, preserving public image)
SecuritySafety, harmony, and stability of society, relationships, and of self Social order, national security, family security, reciprocation of favours, clean, healthy
(Sense of belonging, moderate)
TraditionRespect, commitment and acceptance of the customs and ideas that one’s culture or religion provides Respect for tradition, modest, humble, accepting one’s portion in life, devout
(Moderate, spiritual life)
ConformityRestraint of actions, inclinations, and impulses that are likely to upset or harm others and violate social expectations or norms Politeness, self-discipline, respect for parents and elders, obedient
(Loyal, responsible)
TraditionRespect, commitment, and acceptance of the customs and ideas that one’s culture or religion provides Respect for tradition, humble, accepting one’s portion in life, devout
(Moderate, spiritual life)
BenevolencePreservation and enhancement of the welfare of people with whom one is in frequent personal contact Helpful, honest, responsible, loyal, forgiving, true friendship, mature love (Sense of belonging, meaning in life, a spiritual life)
UniversalismUnderstanding, appreciation, tolerance and protection for the welfare of all people and for nature Equality, unity with nature, wisdom, world of peace, world of beauty, social justice, broad-minded, protecting the environment
(Spiritual life, inner harmony)
Table 2. Comparison of the centered means (M) and standard deviations (StD) of the Schwartz’s basic and higher order value priorities for Europe and for the clusters found (weighted samples).
Human ValuesEuropeCluster 1Cluster 2Cluster 3Cluster 4
100%31.25%26.38%18.77%23.60%
M (StD)M (StD)M (StD)M (StD)M (StD)
Openness to Change−0.17 (0.63)−0.55 (0.40)0.32 (0.41)−0.75 (0.51)0.26 (0.39)
Self-Direction0.43 (0.80)0.10 (0.74)0.84 (0.69)0.15 (0.90)0.58 (0.66)
Stimulation−0.72 (1.01)−1.17 (0.81)−0.20 (0.88)−1.52 (0.81)−0.09 (0.79)
Hedonism−0.19 (1.01)−0.58 (0.90)0.32 (0.81)−0.86 (1.05)0.29 (0.75)
Self-Enhancement−0.81 (0.75)−0.43 (0.41)−1.36 (0.47)−1.59 (0.50)−0.10 (0.50)
Power−1.05 (0.91)−0.68 (0.72)−1.65 (0.69)−1.65 (0.76)−0.40 (0.73)
Achievement−0.58 (0.98)−0.19 (0.67)−1.06 (0.80)−1.54 (0.77)0.21 (0.65)
Conservation0.10 (0.65)0.37 (0.34)−0.28 (0.48)0.87 (0.42)−0.45 (0.45)
Security0.45 (0.87)0.71 (0.63)0.07 (0.90)1.08 (0.69)0.01 (0.78)
Conformity−0.22 (0.98)0.14 (0.71)−0.77 (0.90)0.57 (0.82)−0.72 (0.86)
Tradition0.07 (0.92)0.25 (0.68)−0.15 (0.83)0.94 (0.68)−0.63 (0.81)
Self-Transcendence0.75 (0.53)0.58 (0.38)1.05 (0.43)1.14 (0.42)0.32 (0.45)
Benevolence0.83 (0.65)0.66 (0.56)1.09 (0.55)1.21 (0.59)0.44 (0.62)
Universalism0.67 (0.66)0.50 (0.53)1.00 (0.58)1.07 (0.53)0.21 (0.61)
Note: Mean values significantly (p < 0.001) higher than the European are marked in bold.
Table 3. One-way ANOVA results of basic and high order values means (test statistic Welch’s F and p-value) between clusters, Games–Howell multiple comparison results indicating the cluster’s ranking for significant differences found, and corresponding effect sizes (η2).
ValuesOne-Way ANOVA
F (p-Value)
Games-Howellη2 (a)
Openness to Change12,869.10 (<0.001)3 < 1 < 4 < 20.54
Self-Direction2024.46 (<0.001)1 < 3 < 4 < 20.15
Stimulation5787.96 (<0.001)3 < 1 < 2 < 40.34
Hedonism3587.78 (<0.001)3 < 1 < 4, 20.25
Self-Enhancement18,329.27 (<0.001)3 < 2 < 1 < 40.64
Power6511.03 (<0.001)2, 3 < 1 < 40.37
Achievement9060.53 (<0.001)3 < 2 < 1 < 40.45
Conservation14,415.96 (<0.001)4 < 2 < 1 < 30.58
Security3542.51 (<0.001)4 < 2 < 1 < 30.24
Conformity4715.19 (<0.001)2 < 4 < 1 < 30.31
Tradition5667.52 (<0.001)4 < 2 < 1 < 30.33
Self-Transcendence6114.65 (<0.001)4 < 1 < 2 < 30.37
Benevolence2863.75 (<0.001)4 < 1 < 2 < 30.21
Universalism3926.20 (<0.001)4 < 1 < 2 < 30.27
Notes: (a) Effect size: no effect—η2 < 0.01; small—0.01 ≤ η2 < 0.09; medium—0.09 ≤ η2 < 0.25; large—η2 ≥ 0.25 (Cohen 1988).
Table 4. Clusters’ sociodemographic information: frequency distributions (%) and chi-square tests results.
Cluster 1
Social
Cluster 2
Growth
Cluster 3
Strong Social
Cluster 4
Weak Growth
GenderStatistically significant association, χ2 (df = 3, N = 35,936) = 946.12, p < 0.001
Male50.2345.1034.6760.02
Female49.7754.9065.3339.98
Education (ES-ISCED highest level)Statistically significant association, χ2 (df = 21, N = 35,936) = 1174.35, p < 0.001
I—less than lower secondary13.807.7320.437.94
II—lower secondary21.4017.4722.7821.60
IIIa—lower tier upper secondary20.1222.9821.9817.69
IIIb—upper tier upper secondary13.4713.0010.6116.35
IV—advanced vocational, sub-degree11.9415.1010.5912.65
V1—lower tertiary education, BA7.599.545.649.80
V2—higher tertiary education, >= MA11.3813.837.3613.51
Other0.300.350.590.46
Household’s total net income, all sources (decile)Statistically significant association, χ2 (df = 27, N = 35,936) = 737.38, p < 0.001
1st 8.546.7411.958.07
2nd 9.939.2113.337.84
3rd 11.309.3811.638.84
4th 11.3810.1313.098.37
5th 9.8910.759.7210.46
6th 11.0710.4011.398.97
7th 11.3311.008.6011.52
8th 10.0211.098.9111.38
9th 8.1410.866.4210.43
10th 8.4010.434.9614.13
Legal marital statusStatistically significant association, χ2 (df = 15, N = 35,936) = 3415.52, p < 0.001
Legally married61.1445.7363.0837.95
In a legally registered civil union1.062.120.731.13
Legally separated0.350.420.450.33
Legally divorced/civil union dissolved7.099.758.256.89
Widowed/civil partner died7.074.4414.142.93
NEVER married or in legally registered civil union23.3037.5313.3650.77
Notes: Statistically significant results (p < 0.05; adjusted residuals positive and higher than 1.96) are marked in bold; df = degrees of freedom.
Table 5. Clusters’ sociodemographic information: Mean (M), standard deviation (StD), and frequency distributions (%), and one-way ANOVA tests results and chi-square tests results.
Cluster 1
Social
Cluster 2
Growth
Cluster 3
Strong Social
Cluster 4
Weak Growth
AgeM (tSD)M (StD)M (StD)M (StD)
50.02
(17.70)
45.05
(17.52)
58.57
(17.11)
37.74
(17.38)
Significant age differences, F = 1775.02, p < 0.001. Post hoc Games–Howell tests indicated significant age variations between all clusters, although with a small effect size (η2 = 0.14)
<258.5315.002.9328.83
25–3413.5317.477.1721.75
35–4927.6125.7219.9124.65
50–6426.9426.7429.5415.51
65–7413.669.8720.606.06
>749.745.2119.863.20
Statistically significant association, χ2 (df = 15, N = 33,142) = 4918.06, p < 0.001
Education: Years of full-time completedM (StD)M (StD)M (StD)M (StD)
12.97
(4.04)
12.63
(4.08)
13.82
(3.95)
11.70
(4.11)
Significant age differences, F = 405.40, p < 0.001. Post hoc Games–Howell tests indicated significant age variations between all clusters, although with a small effect size (η2 = 0.14)
Notes: Statistically significant results (p < 0.05; adjusted residuals positive and higher than 1.96) are marked in bold; df = degrees of freedom.
Publisher’s Note: MDPI stays neutral with regard to jurisdictional claims in published maps and institutional affiliations.

