Article

How Has COVID-19 Affected the Public Auction Market?

by
Christine Bourron
Pi-eX Ltd., London W8 6BH, UK
Arts 2021, 10(4), 74; https://doi.org/10.3390/arts10040074
Submission received: 15 September 2021 / Revised: 25 October 2021 / Accepted: 27 October 2021 / Published: 1 November 2021
(This article belongs to the Special Issue Global Art Market in the Aftermath of COVID-19)

Abstract

:
The day of the last live auction at Sotheby’s in the spring of 2020 was on 19 March 2020 as multiple coronavirus lockdowns forced auction rooms to close worldwide. In the following months, hundreds of live auctions were cancelled or postponed, and combined revenue at Christie’s, Sotheby’s, and Phillips for the second Quarter 2020 plummeted 79% year on year from USD 4.4 bn in Q2 2019 to USD 0.9 bn in Q2 2020. This article focuses on public auctions at Christie’s, Sotheby’s, and Phillips and uses primary research to demonstrate how leading auction houses responded to the unprecedented challenges posed by the COVID-19 crisis. Leveraging Pi-eX’s public auction results database and its 12-month-rolling methodology, our analysis shows (1) the surge of online only auctions while the number of live auctions plummeted; (2) the limitations of online only auctions and the rise of new opportunities; and (3) a comparison of the COVID-19 crisis with previous art market crisis in the past 15 years.

1. Introduction

In the spring 2020, all major auction rooms at Christie’s, Sotheby’s, and Phillips were forced to close their doors as New York, Paris, and eventually London announced new strict confinement rules. The top three auction houses were ready for some disturbances in China and had already adjusted the schedule for the Hong Kong auctions, postponing their usual spring Hong Kong sales, but based on the auction houses’ early March 2020 auction schedule, they did not expect the same disturbances in other locations. By mid-March 2020, however, it became clear that the schedule of spring 2020 would have to be dramatically adjusted. Auction rooms worldwide had to be closed as New York witnessed its last live auction sale on 16 March, and London on 19 March 2020 (Table 1). From then on, none of the months of 2020 had comparable scheduling compared to previous years.
Faced with unprecedented operational issues, the auction houses pursued a strategy of aggressively moving their live auctions online. Within a year, the percentage of online only auctions arranged by the auction houses grew tremendously, from 25% at end of year 2019 to 66% by end of year 2020. Revenue from online only sales also grew significantly from USD 126 million in 2019 to over USD 1 billion in 2020 but failed to compensate for the fall in revenue from live auctions.
More than a year after the start of the pandemic, the auction houses continue to adapt to the post-COVID-19 world. Building on their newly improved online infrastructure, they were fast in catching up on the NFT (non-fungible tokens) craze and targeting the new rising wealth of the crypto community. At the same time, the slowdown of the growth of online sales after live auctions resumed seems to indicate that traditional art collectors may not fully embrace an online only world.
By leveraging Pi-eX’s monthly analysis, we were able to obtain a clear reading of the impact of COVID-19 on the public auction market not only at year end but also during each month of the year. Our analysis shows that the coronavirus crisis had a serious impact on the auction trade as it resulted in a sharp fall in revenue after March 20201 and forced auction houses to embark on drastic operational changes as they hastily had to move their business online in order to adapt to the confinement requirements. As lockdown restrictions were eased in the Spring of 2021 and life was returning to normal in many parts of the world, it became clear that the public auction market would not return to its pre-COVID-19 business-as-usual routine but would rather open a new chapter fueled by the many new options presented by the recent infrastructure built up for online sales.

2. Data and Methods

2.1. Focus on Public Auction Results at the Top Three Auction Houses (Christie’s, Sotheby’s, and Phillips)

The global art market is a very fragmented market counting many small players (art dealers, art advisors, auction houses, etc.).2 It also is a market where little reliable data are available3, especially with respect to the private transactions side as no standardized reporting requirements exist and, therefore, no easily available public information can be compiled. The three largest art market players, Christie’s, Sotheby’s, and Phillips, do not report their private transactions, but they do publish daily results of their public auctions. Our analysis focuses on the results at public auctions at the top three auction houses over the period of 2007 to present. While not an exhaustive count of all global art market transactions, it presents an interesting reading of trends at auctions, which can be observed as a barometer of the global art market.4

2.2. Live Auction versus Online Auction Definition

There is no official definition of what exactly an online auction is, as online auctions exist in several different formats.5 For our analysis, we counted an online sale or online only sale as a time limited sale that is arranged by the auction house over a period of a few days and, most importantly, that is performed by an algorithm rather than an auctioneer. On the other hand, was counted a Live sale as a sale arranged by the auction house over a few hours on the same day and ran live by an auctioneer. With this definition, a so-called hybrid sale, live streamed over the internet with no public in the auction room, would be considered a live sale as it is operated by an auctioneer. A lot sold online during a live sale (rather than over the phone via a specialist) would be counted as being part of a live auction. In contrast, an item/lot, catalogued in an online only sale, sold over the phone to a client asking an auction specialist to click the bid button on his or her behalf would be counted as being part of an online only auction.

2.3. “12-Month Rolling” Analysis Based on the Auction Calendar

Leveraging the repeating yearly auction calendar, we used Pi-eX’s 12-month rolling methodology. This allowed us to combine and compare the results at the top three auction houses every month by compiling, at the end of every month, the total sales achieved over the previous 12 months. This is the equivalent of generating an annual report at the end of every month.

2.4. Adjustment for Inflation

In the comparison analysis of the COVID-19 crisis versus the 2008–2009 crisis and the 2016 crisis, the total revenue over the previous 12 months has been adjusted for inflation according to the following methodology:
-
Non-USD daily revenues have been converted to USD by using the Bank of England’s daily exchange rate on the day each auction was arranged (for live sales) and closed (for online only sales).
-
Monthly USD revenues were compiled and then adjusted for inflation by using the Consumer Price Index (CPI-U), provided by the U.S. Department of Labor Bureau of Labor Statistics. November 2007 was used as a basis for comparison.
-
Twelve month rolling totals were then compiled using inflation adjusted monthly USD totals.
-
Index were created for each period based on what was considered as the first month of the crisis (October 2008 for the 2008–2009 financial crisis, October 2015 for the 2016 crisis, and October 2019 for the COVID-19 crisis).

3. Key Findings

3.1. The Explosion of Online Auctions

Within a month after closing auction rooms, the top three auction houses were able to switch most of their traditionally live business to their online infrastructure. Faced with the impossibility of arranging their scheduled live sales, the auction houses reshuffled their auction calendar, postponing or cancelling some sales and/or moving others online.
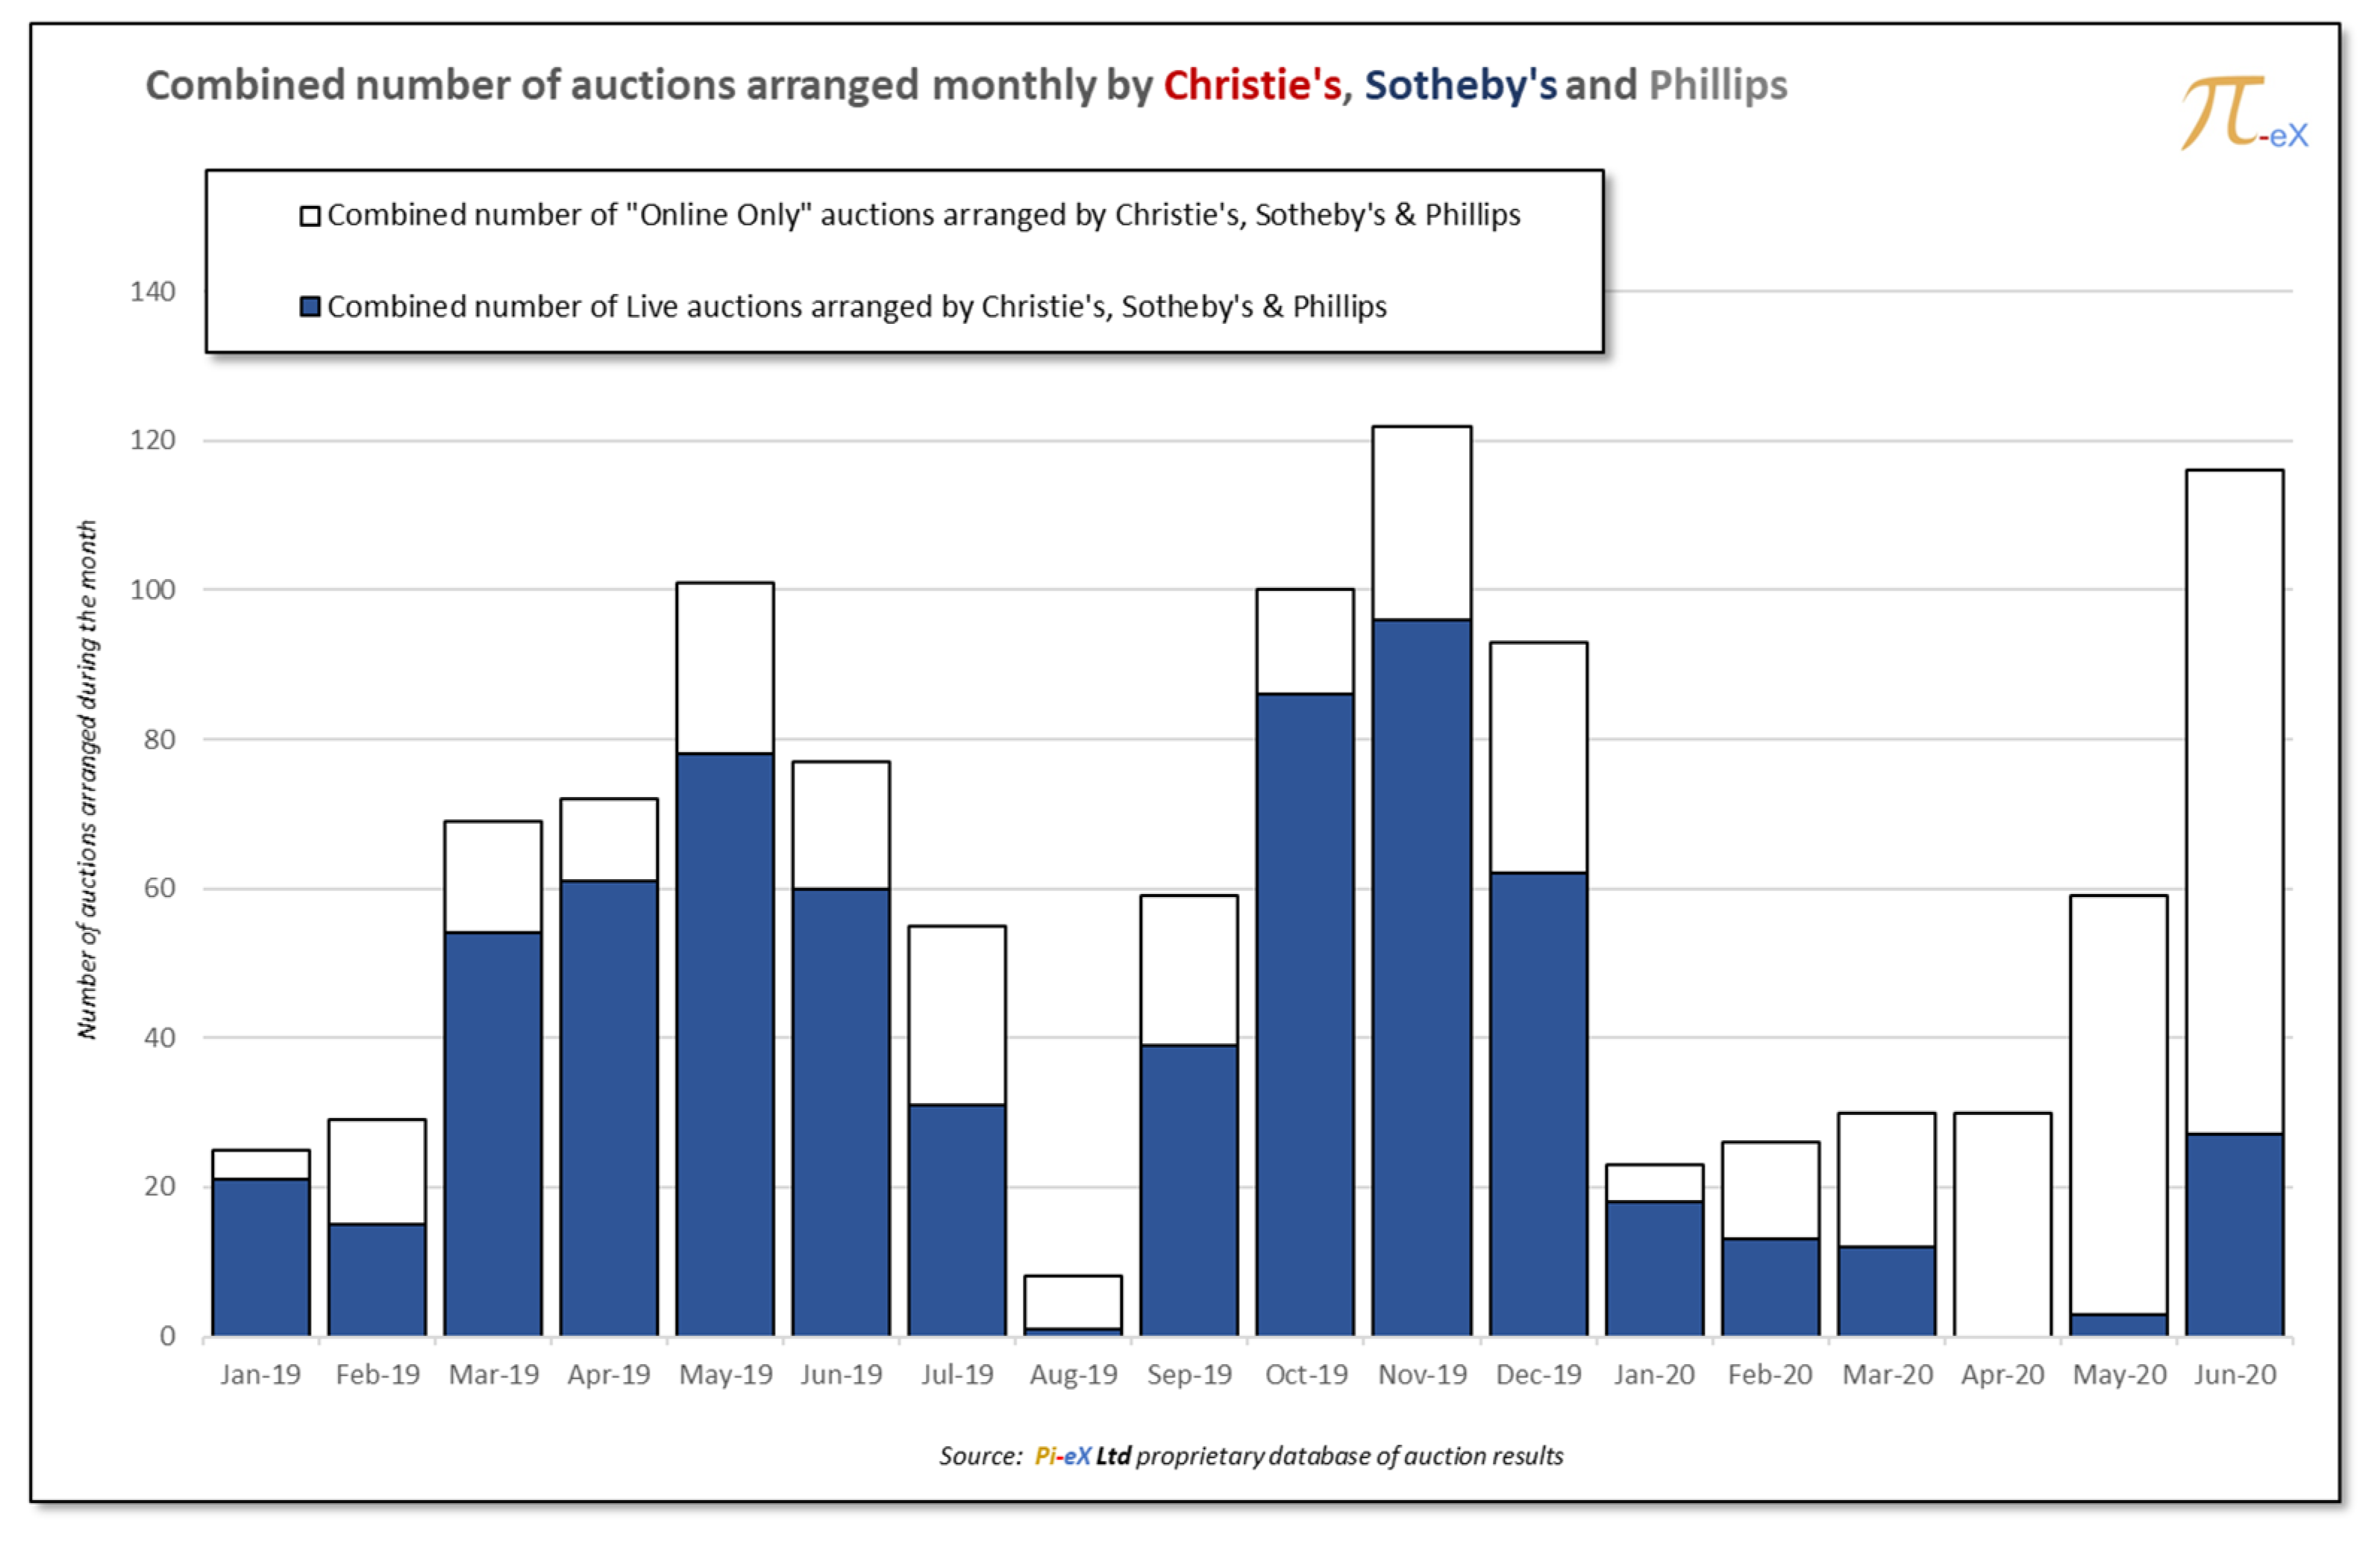
From mid-March to the end of May 2020, Christie’s, Sotheby’s, and Phillips cancelled more than 90 scheduled live auctions and created or rescheduled more than 100 online only auctions (Figure 1).
The percentage of online only sales, thus, increased from 22% in January 2020, 50% in February 2020, 60% in March 2020, 100% in April 2020, and 95% in May 2020 (Figure 2, Table 2). After the easing of lockdown and return to some normalcy, the percentage of online only auctions decreased to 77% in June 2020.
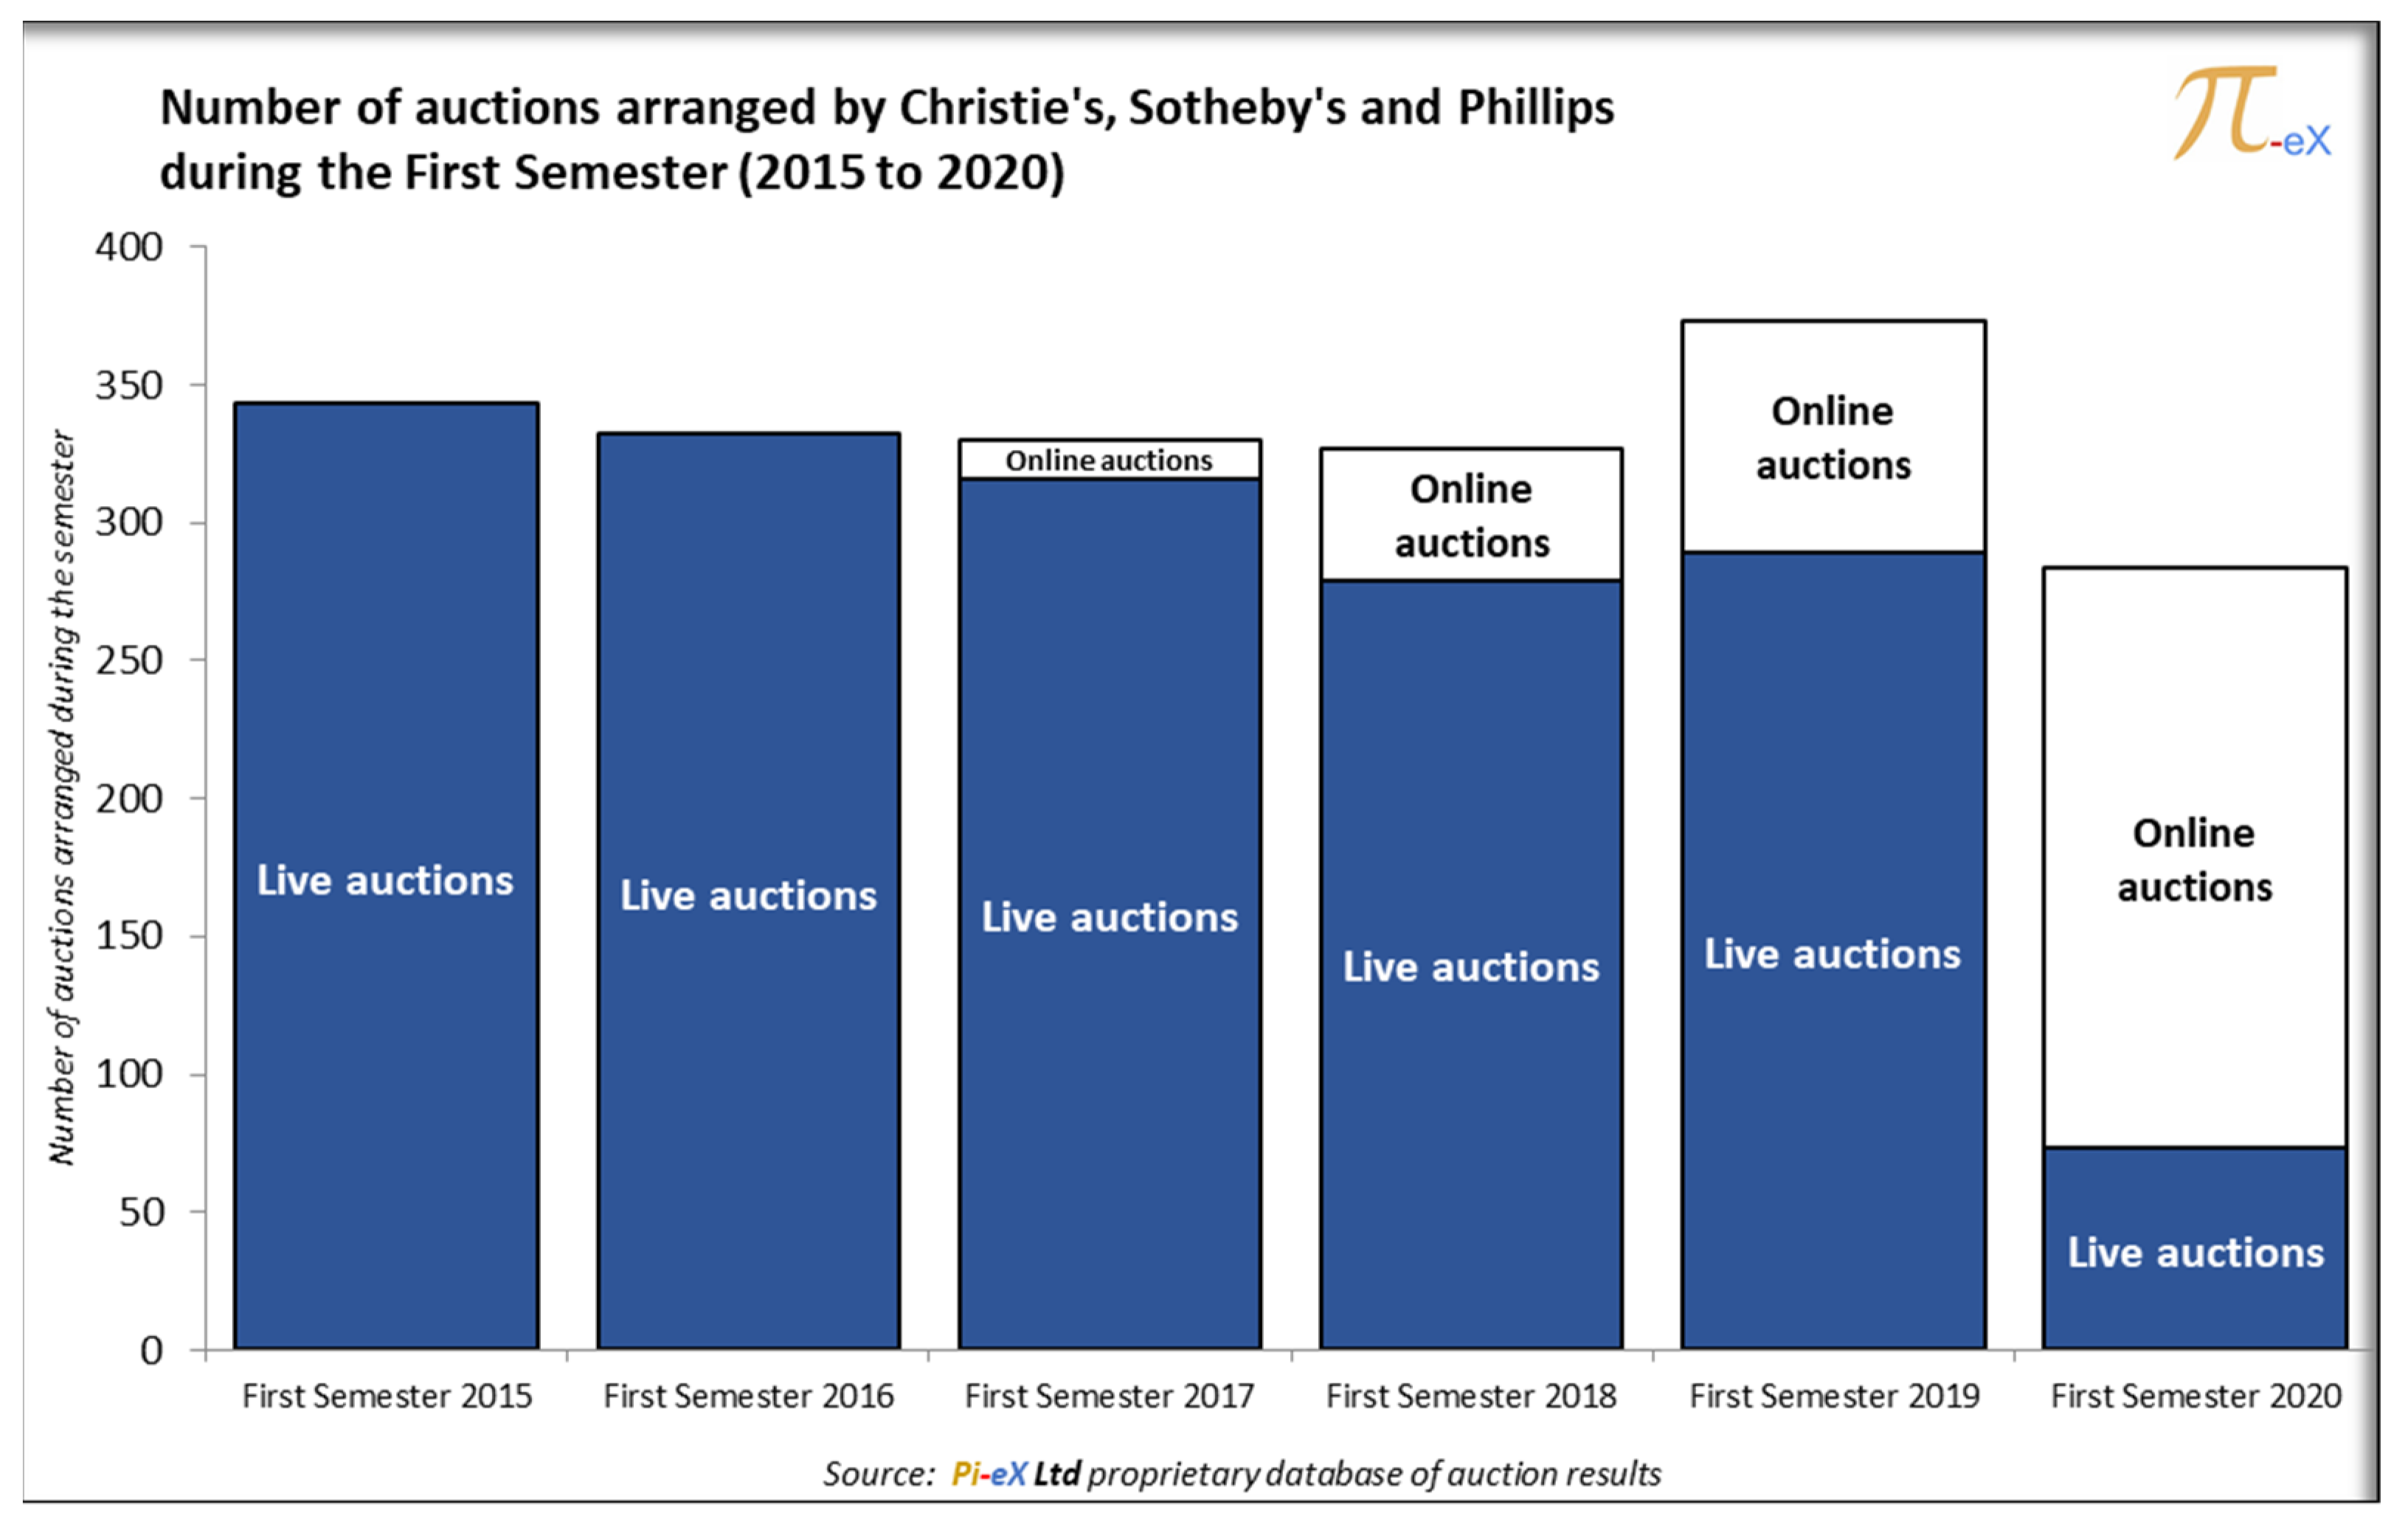
Overall, in the first semester 2020, 74% of all auctions arranged by Christie’s, Sotheby’s, and Phillips were online only auctions. This compares to only 23% in the first semester of 2019, 15% in the first semester of 2018, and only 4% in the first semester of 2017 (Figure 3, Table 3).
In March 2020, online only sales were not a new development for the top auction houses. Already for years, both Christie’s and Sotheby’s worked on moving some of their offerings online by creating new digital platforms.6 Christie’s focused on building its Christie’s LIVE TM platform and invested a reported USD 50 million over the years under the leadership of Steven Murphy.7 Sotheby’s also spent years building its online strategy. The auction house’s early efforts date back to pre-20008, with a notable failed partnership with Amazon in 1999.9 This was followed by multiple attempts to find the right partner as demonstrated by Sotheby’s alliances with eBay in 2002 and again in 2014 or with Invaluable, an online marketplace for art, in 2015.
The initial results from online only auctions at both auction houses were not impressive, and they suffered especially from a very high “Bought-in” (unsold) rate. This may explain why very few results from pre-2017 auctions are available on the auction houses’ websites.
In 2017, however, Christie’s decided to ramp up its online effort, launching more than 80 new online auctions. The sudden spike in online auctions at Christie’s in the Spring of 2017 was triggered by the closing of Christie’s South Kensington Salesroom in July 2017, which had been established in London in 1975 as a secondary salesroom to target buyers of lower price points and decorative art.10 In an interview with the New York Times, Guillaume Cerutti, then the new chief executive of Christie’s, announced that “The digital space is the Christie’s South Ken of the 21st century,” and that he “envisaged the auction house as a global operation with fewer auction rooms and more online sales”.11
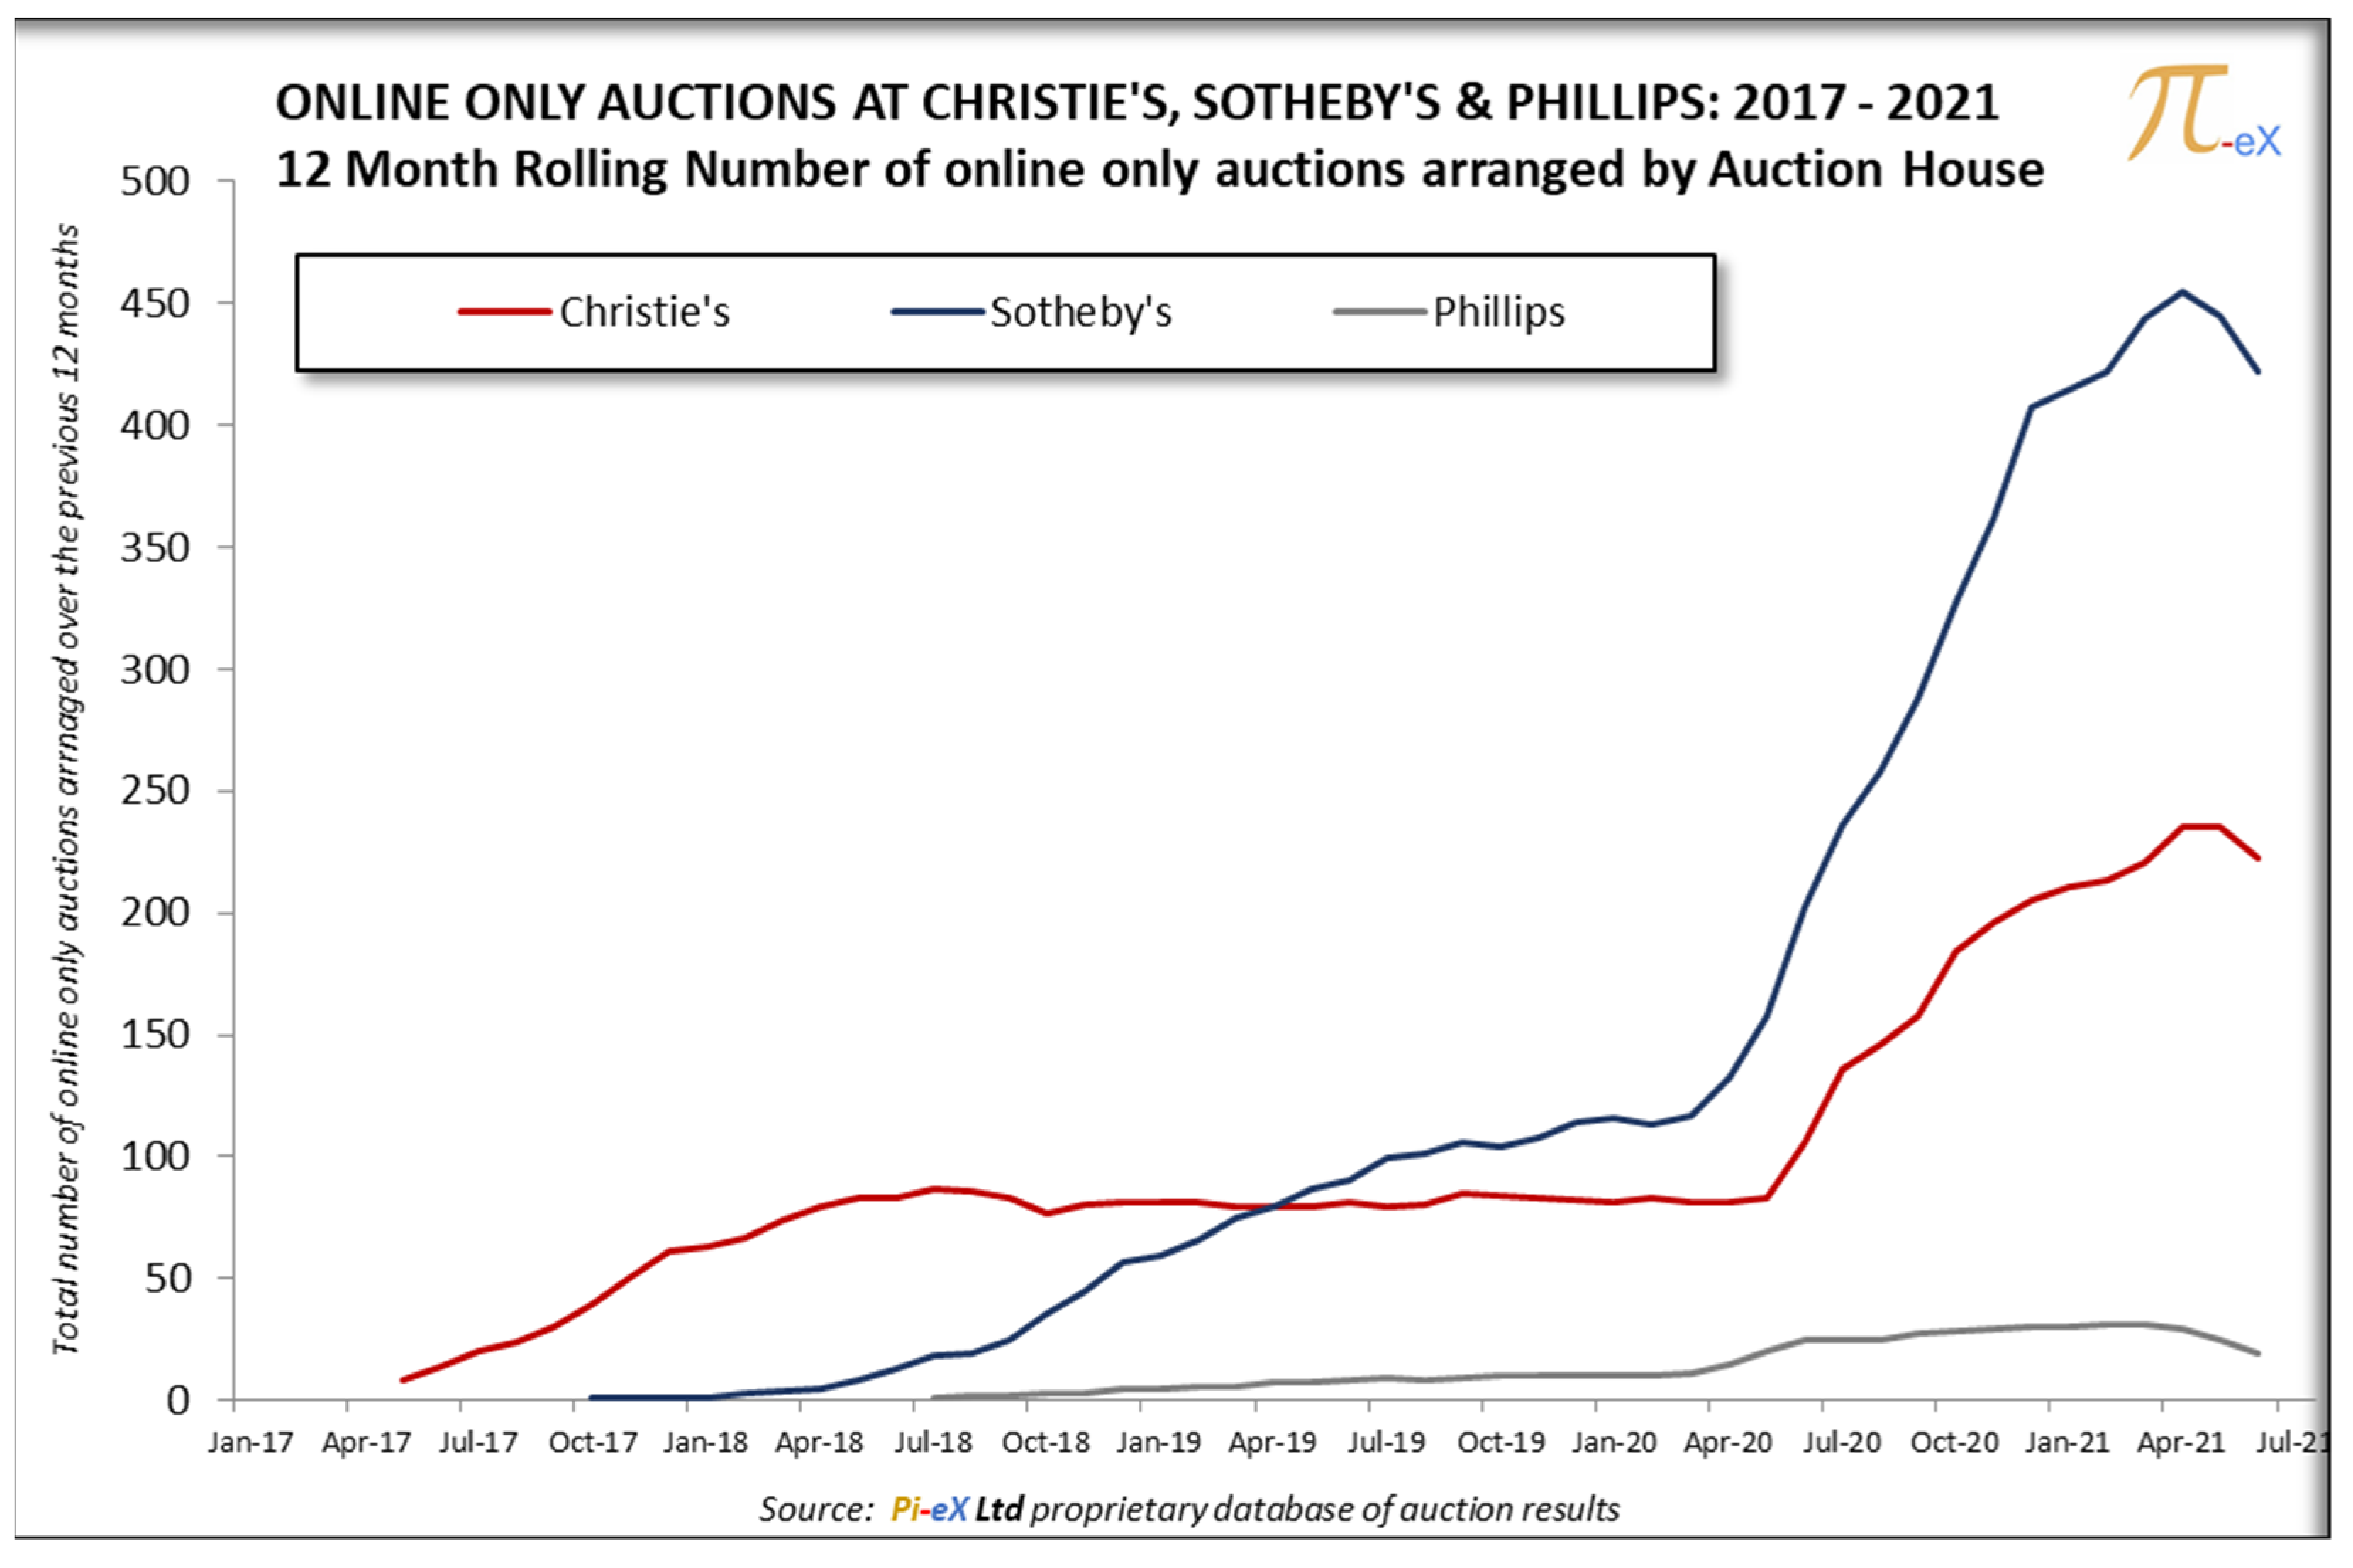
After only a year, however, the number of online auctions arranged by Christie’s plateaued and remained at less than 100 online only auctions a year until the start of the Coronavirus pandemic (Figure 4).
Sotheby’s also signaled its commitment to grow its online business in the summer of 2017 by announcing that it would entirely eliminate the buyer’s premium for online only sales that it traditionally charges on top of the Hammer Price.12 At the time, the auction house’s plan was to double the number of its online only sales from 16 sales arranged in 2016 to 32 sales in 2017.
In April 2019, thanks to additional investments in digital technology and personnel, Sotheby’s finally caught up and even surpassed Christie’s level of online sales (Table 4). By February 2020, ahead of the pandemic, the auction house has already arranging 36% more online auctions than Christie’s over the previous 12 months.
Phillips finally started to increase its offering of online only sales in 2018, but the number of online auctions arranged by the number three auction house remained much lower than at Christie’s and Sotheby’s.
As the auction houses built their online marketplaces, they made it amply clear that they did not view online only sales as a replacement of the live auctions. Rather, they viewed “the online marketplace as a related, yet distinct business opportunity beyond live auctions,” as stated by Tad Smith, Sotheby’s CEO in 2017. Their hope was that the online format would attract first time buyers who may otherwise not engage with the more traditional part of their business (i.e., the live auction format) but would grow into it over time.
That strategy changed at Sotheby’s in the summer of 2019 when French media and telecom entrepreneur Patrick Drahi acquired the company. His vision was to transform the company into a digital powerhouse. Already in the fall of 2019, the company started to work on increasing its offering of online only auctions. By the onset of the COVID-19 pandemic, this rendered Sotheby’s the best prepared auction house for the challenges to come.
In March 2020, the Coronavirus pandemic made online only sales an absolute priority for Christie’s, Sotheby’s, and Phillips, as online only sales were the only option for the auction houses to generate income in the next few months. Unsurprisingly, Sotheby’s was the first to embrace a new strategic focus on online sales and moved its live auctions online within a week and kept converting most of its live sales to the online format. By summer 2020, only key evening sales remained live, while most sales, including Sotheby’s Marquee May “Impressionist & Modern Art” and “Contemporary Art” Day Sales in New York, were arranged to be held online only. As of June 2021 and after more than a year of arranging additional online sales, Sotheby’s has become the clear leader by counting the total number of online sales arranged (Figure 4).
Christie’s followed Sotheby’s lead and reacted slightly slower in March 2020 but initially ramping up online sales at a parallel speed. By the end of 2020, however, Christie’s slowed down its online effort and went back to live auctions wherever and whenever possible. Finally, Phillips never aggressively increased its online presence, especially in comparison to the other top two auction houses.
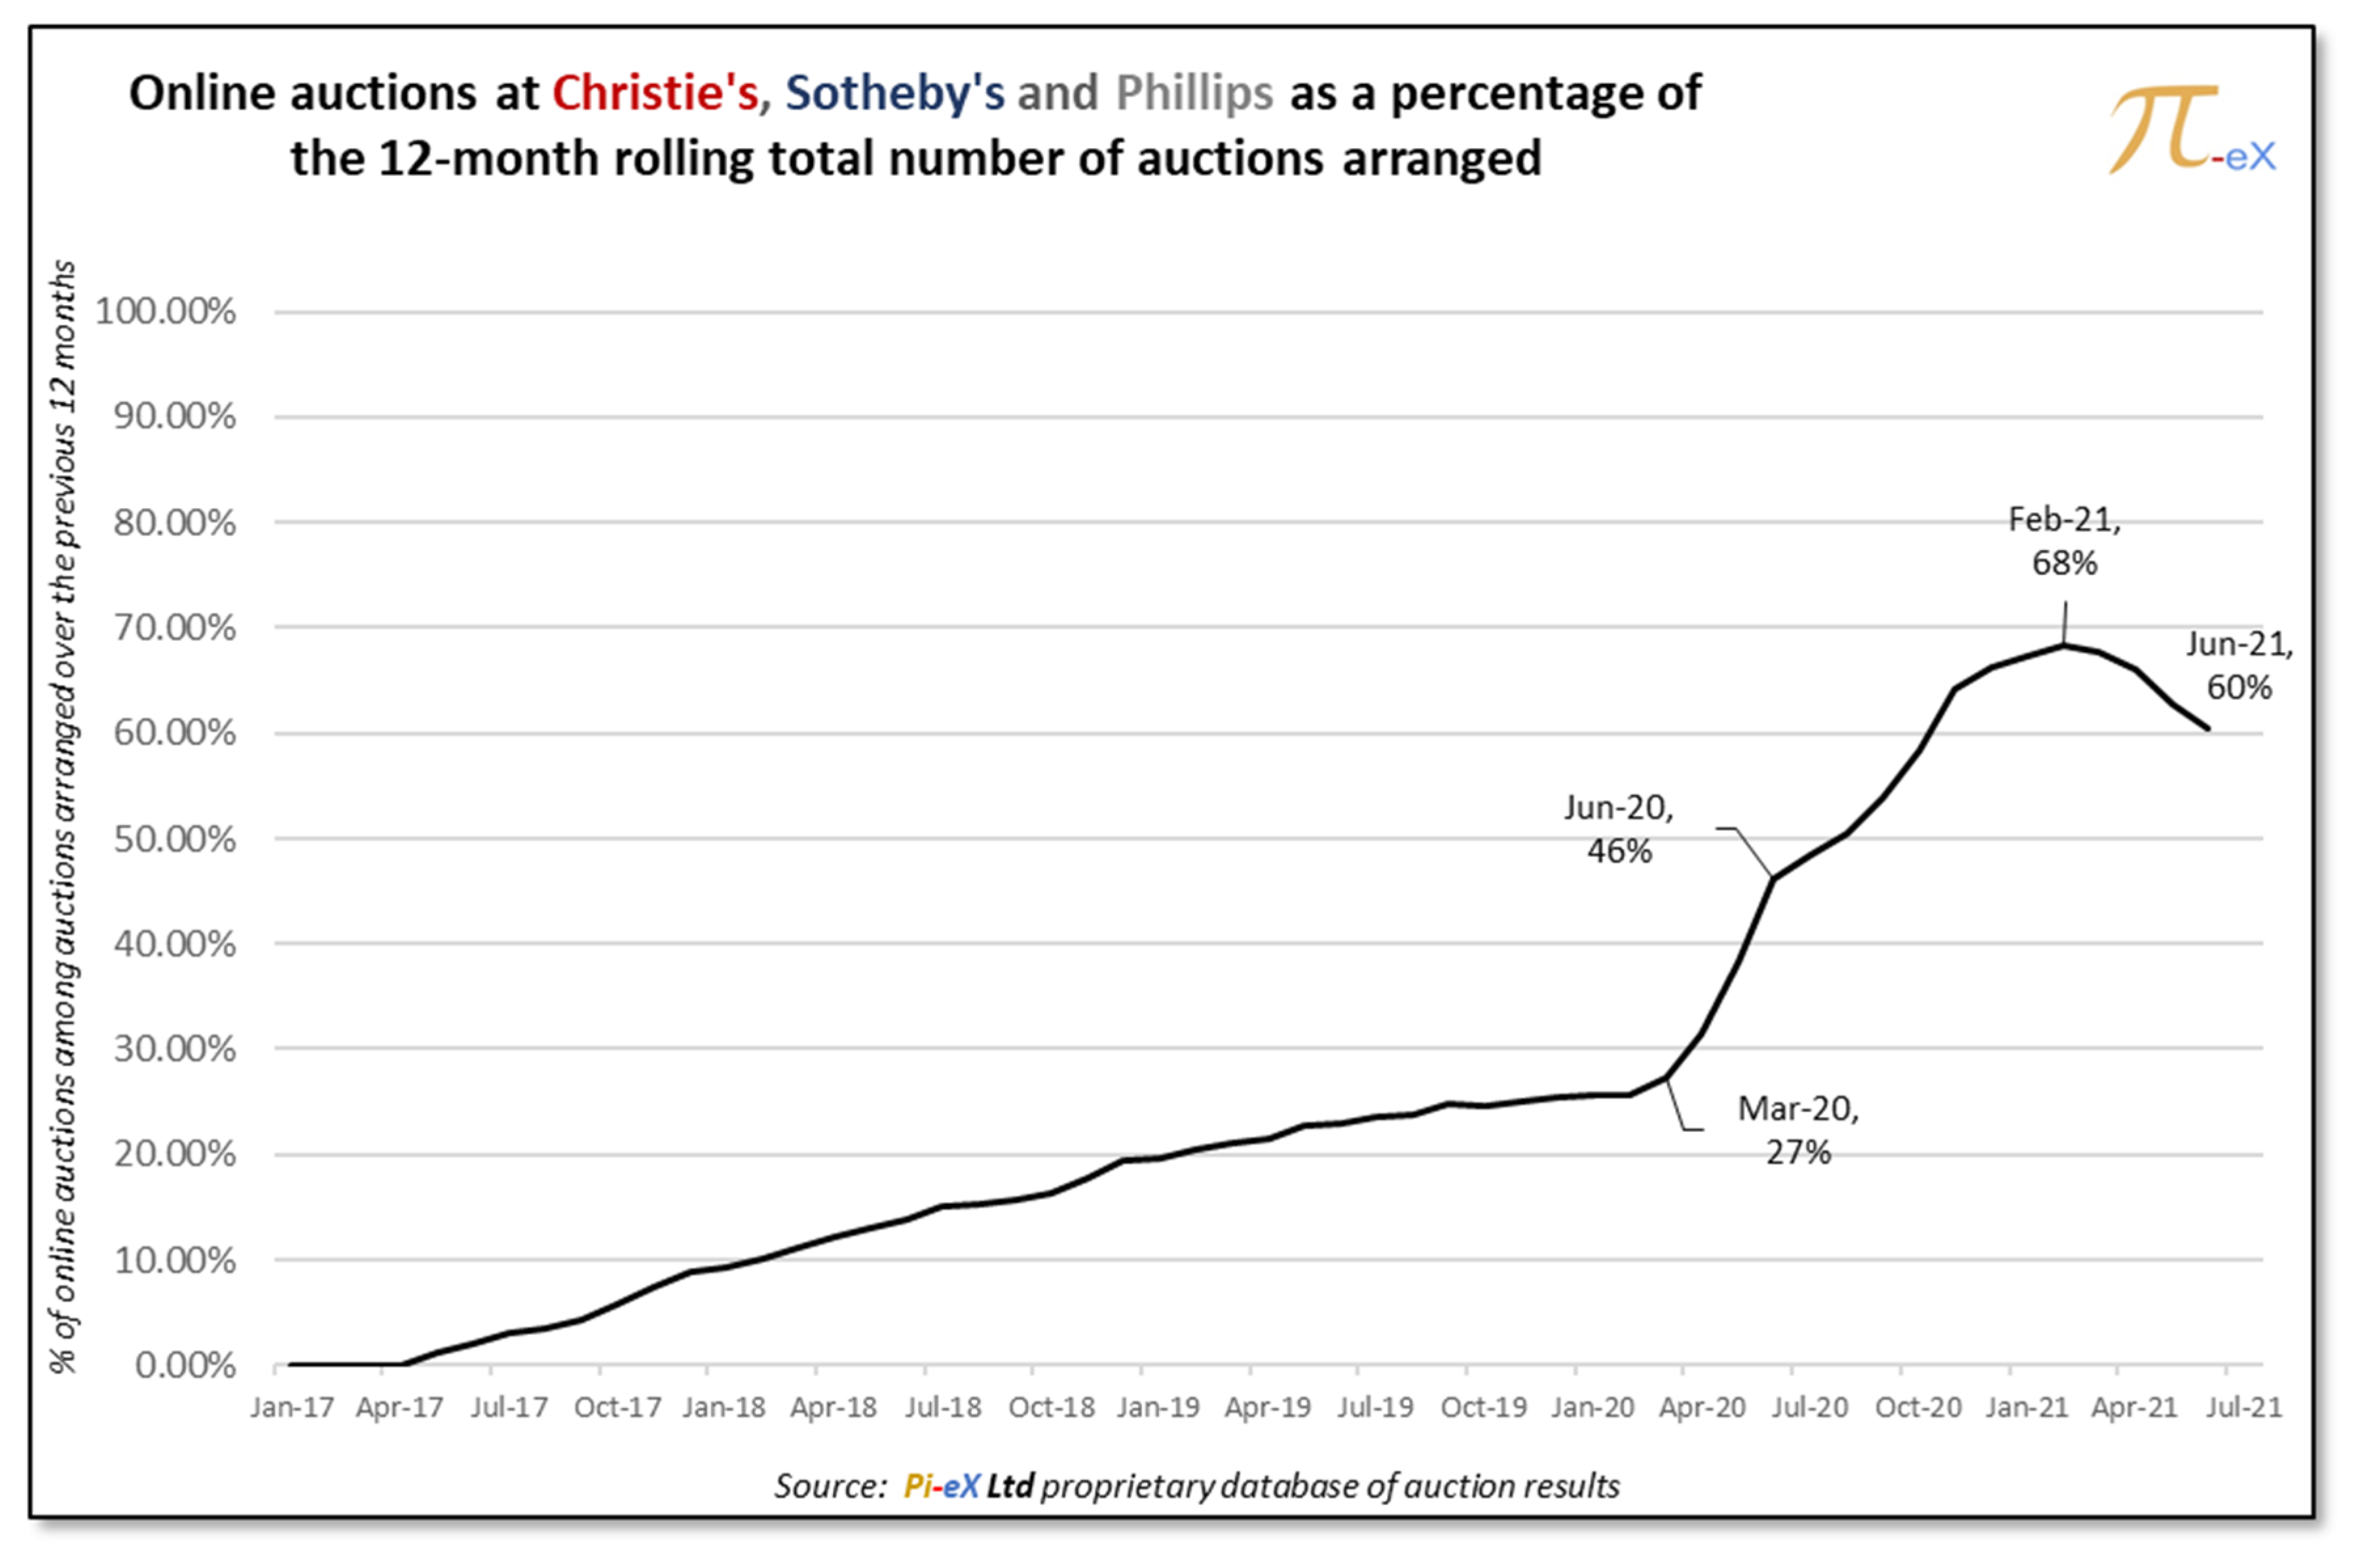
Overall, online auctions at Christie’s, Sotheby’s, and Phillips as a percentage of the 12-month rolling total number of auctions arranged grew from 27% in March 2020 to 68% in February 2021 before slowing down in the Spring of 2021 and contracting to 60% by end of June 2021 (Figure 5, Table 5). Why such a change?

3.2. Limitations of Online Auctions and the Rise of New Opportunities

While online only sales clearly became predominant in the wake of the COVID-19 pandemic, revenue generated by these sales remained dramatically lower than revenue generated via live auctions. In 2019, before the COVID-19 pandemic, the average revenue generated by a live auction arranged by Christie’s, Sotheby’s, and Phillips was USD 10 million for a day sale and USD 50 million for an evening sale. In contrast, the revenue generated by an online sale was much lower as algorithm driven sales brought in on average less than USD 1 million.13
The hope of the auction houses in the spring of 2020 was that the absence of live auctions would entice resistant collectors to switch their art trade to online only sales.
Interestingly, Sotheby’s strategy for moving auctions online during the COVID-19 crisis differed significantly from Christie’s and Phillips’ strategies. In fact, Sotheby’s boldly converted online almost every single auction it had in the pipeline for Spring 2020, except for a few private collections sales and its key London, Hong Kong, and Geneva evening sales. As discussed later, the auction house went even as far as arranging its two repeating Marquee day sales, the “Impressionist & Modern art” and the “Contemporary art” New York days sales in an online only format in May 2020. With a very different approach, Christie’s and Phillips chose to postpone most of their repeating auctions and private collection sales until further notice, while their online only sales arranged between April and June 2020 were curated sales with no history or comparable history. Examples of these new online sales included “Andy Warhol: Better Days” in 6 May 2020 and “Working from Home: Prints and Multiples” in 14 May 2020 at Christie’s or “Bloom: online auction” on 7 May 2020 and “Refresh: Reload online auction” on 28 May at Phillips.
Despite the different approaches, the auction houses arrived at the same conclusion that prices obtained via online only sales remained significantly lower than via live sales. Not one lot from online only sales arranged at Christie’s and Phillips between March and May 2020 obtained a selling price above USD 500,000. Sotheby’s was more successful with its online only sales as a few lots obtained prices above USD 1 million: a Cartier bracelet in its “Tutti Frutti” sale arranged on 28 April 2020 and a Giorgio Morandi artwork, which sold for USD 1.58 million in its “Impressionist & Modern Art Day online” sale on 18 May 2020. This was certainly impressive compared to the historic performance of online only sales, but one can wonder what prices these lots may have obtained had they been auctioned in live sales. This was most likely the rationale for Christie’s and Phillips to postpone most of their repeating live sales and to wait for a better time to arrange them in order to optimize their revenue.
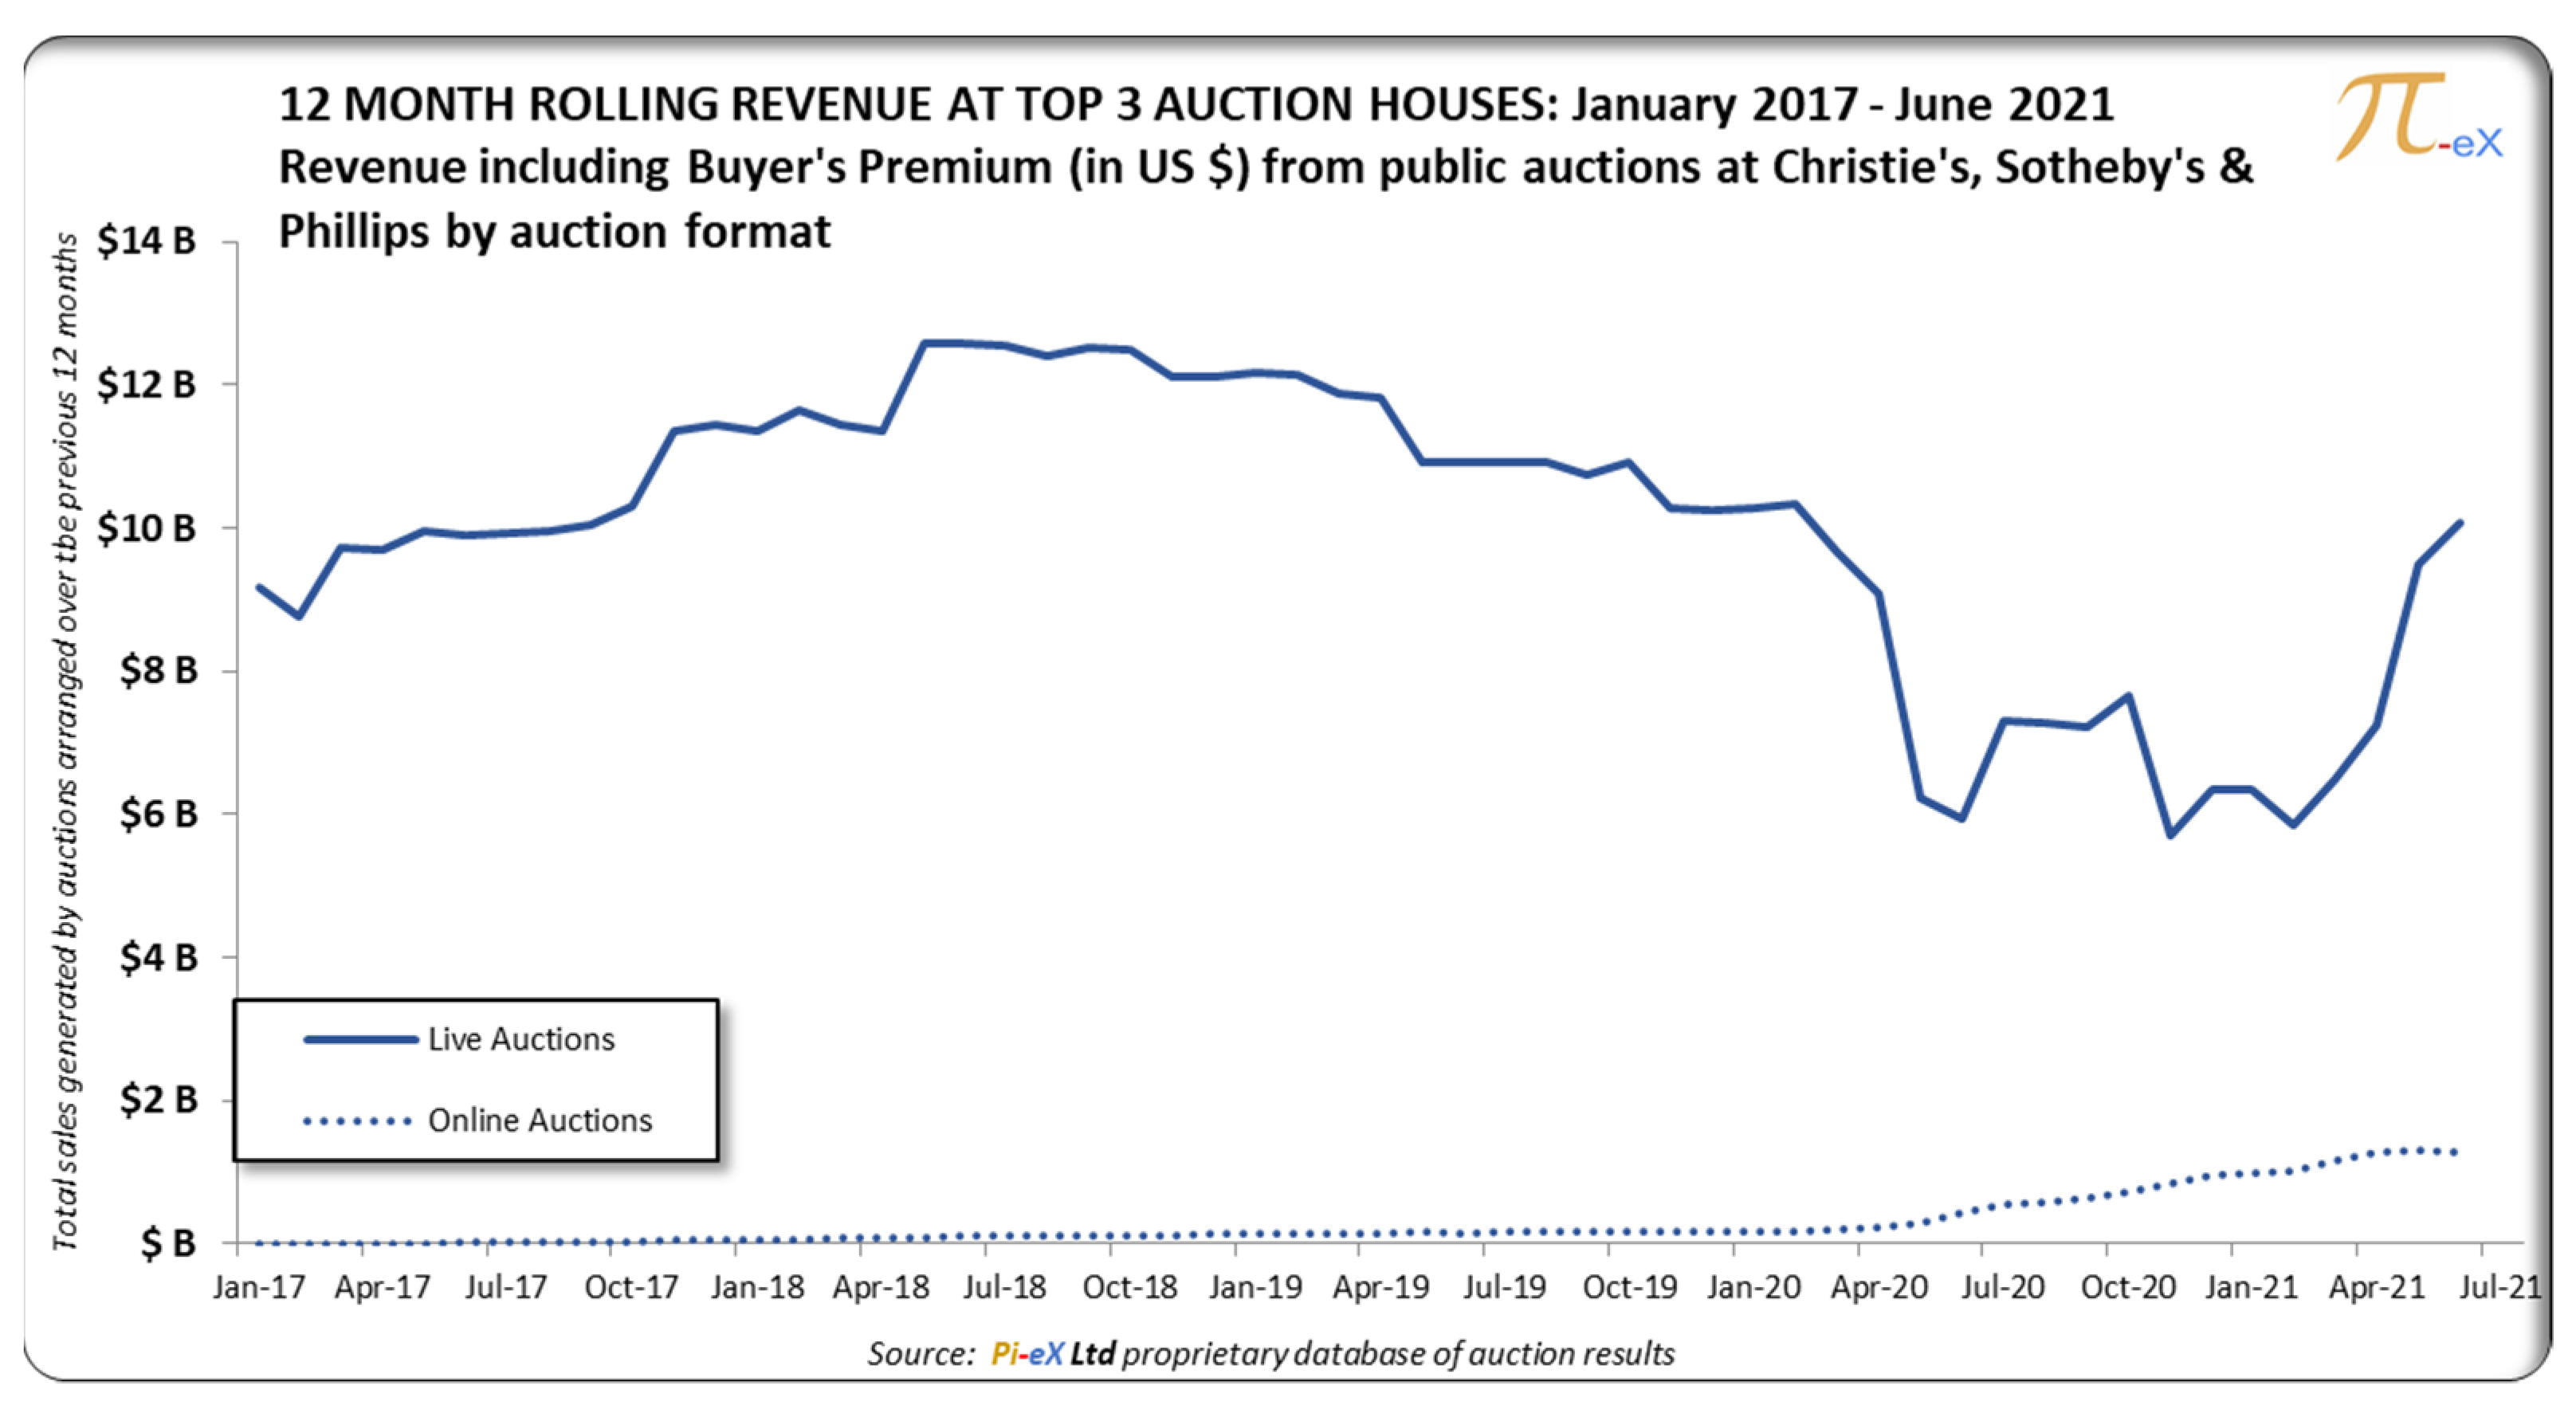
Unsurprisingly, therefore, the monthly tracking of revenue generated by online sales since the start of the confinement shows that while revenue from online only auctions has significantly increased, it remains far lower than the revenue generated by live auctions. Overall annual revenue from online sales at the top three auction houses has grown from USD 165 million in 2019 to USD 945 million in 2020 and USD 1.26 billion over the past 12-month leading to June 2021 (Table 6). While the growth is impressive, the total revenue generated online is still small in comparison to annual revenue generated by live auctions: USD 10.2 billion in 2019 to USD 6.3 billion in 2020 and USD 10.1 billion over the past 12-month leading to June 2021.
As shown in Figure 6, revenue from online only auctions has been growing over the past year while revenue from live sales plummeted after March 2020 due to the temporary operational challenge brought about by the Coronavirus pandemic. The scale, however, and growth trend of online revenue remains much smaller than that of live auctions (Figure 6).
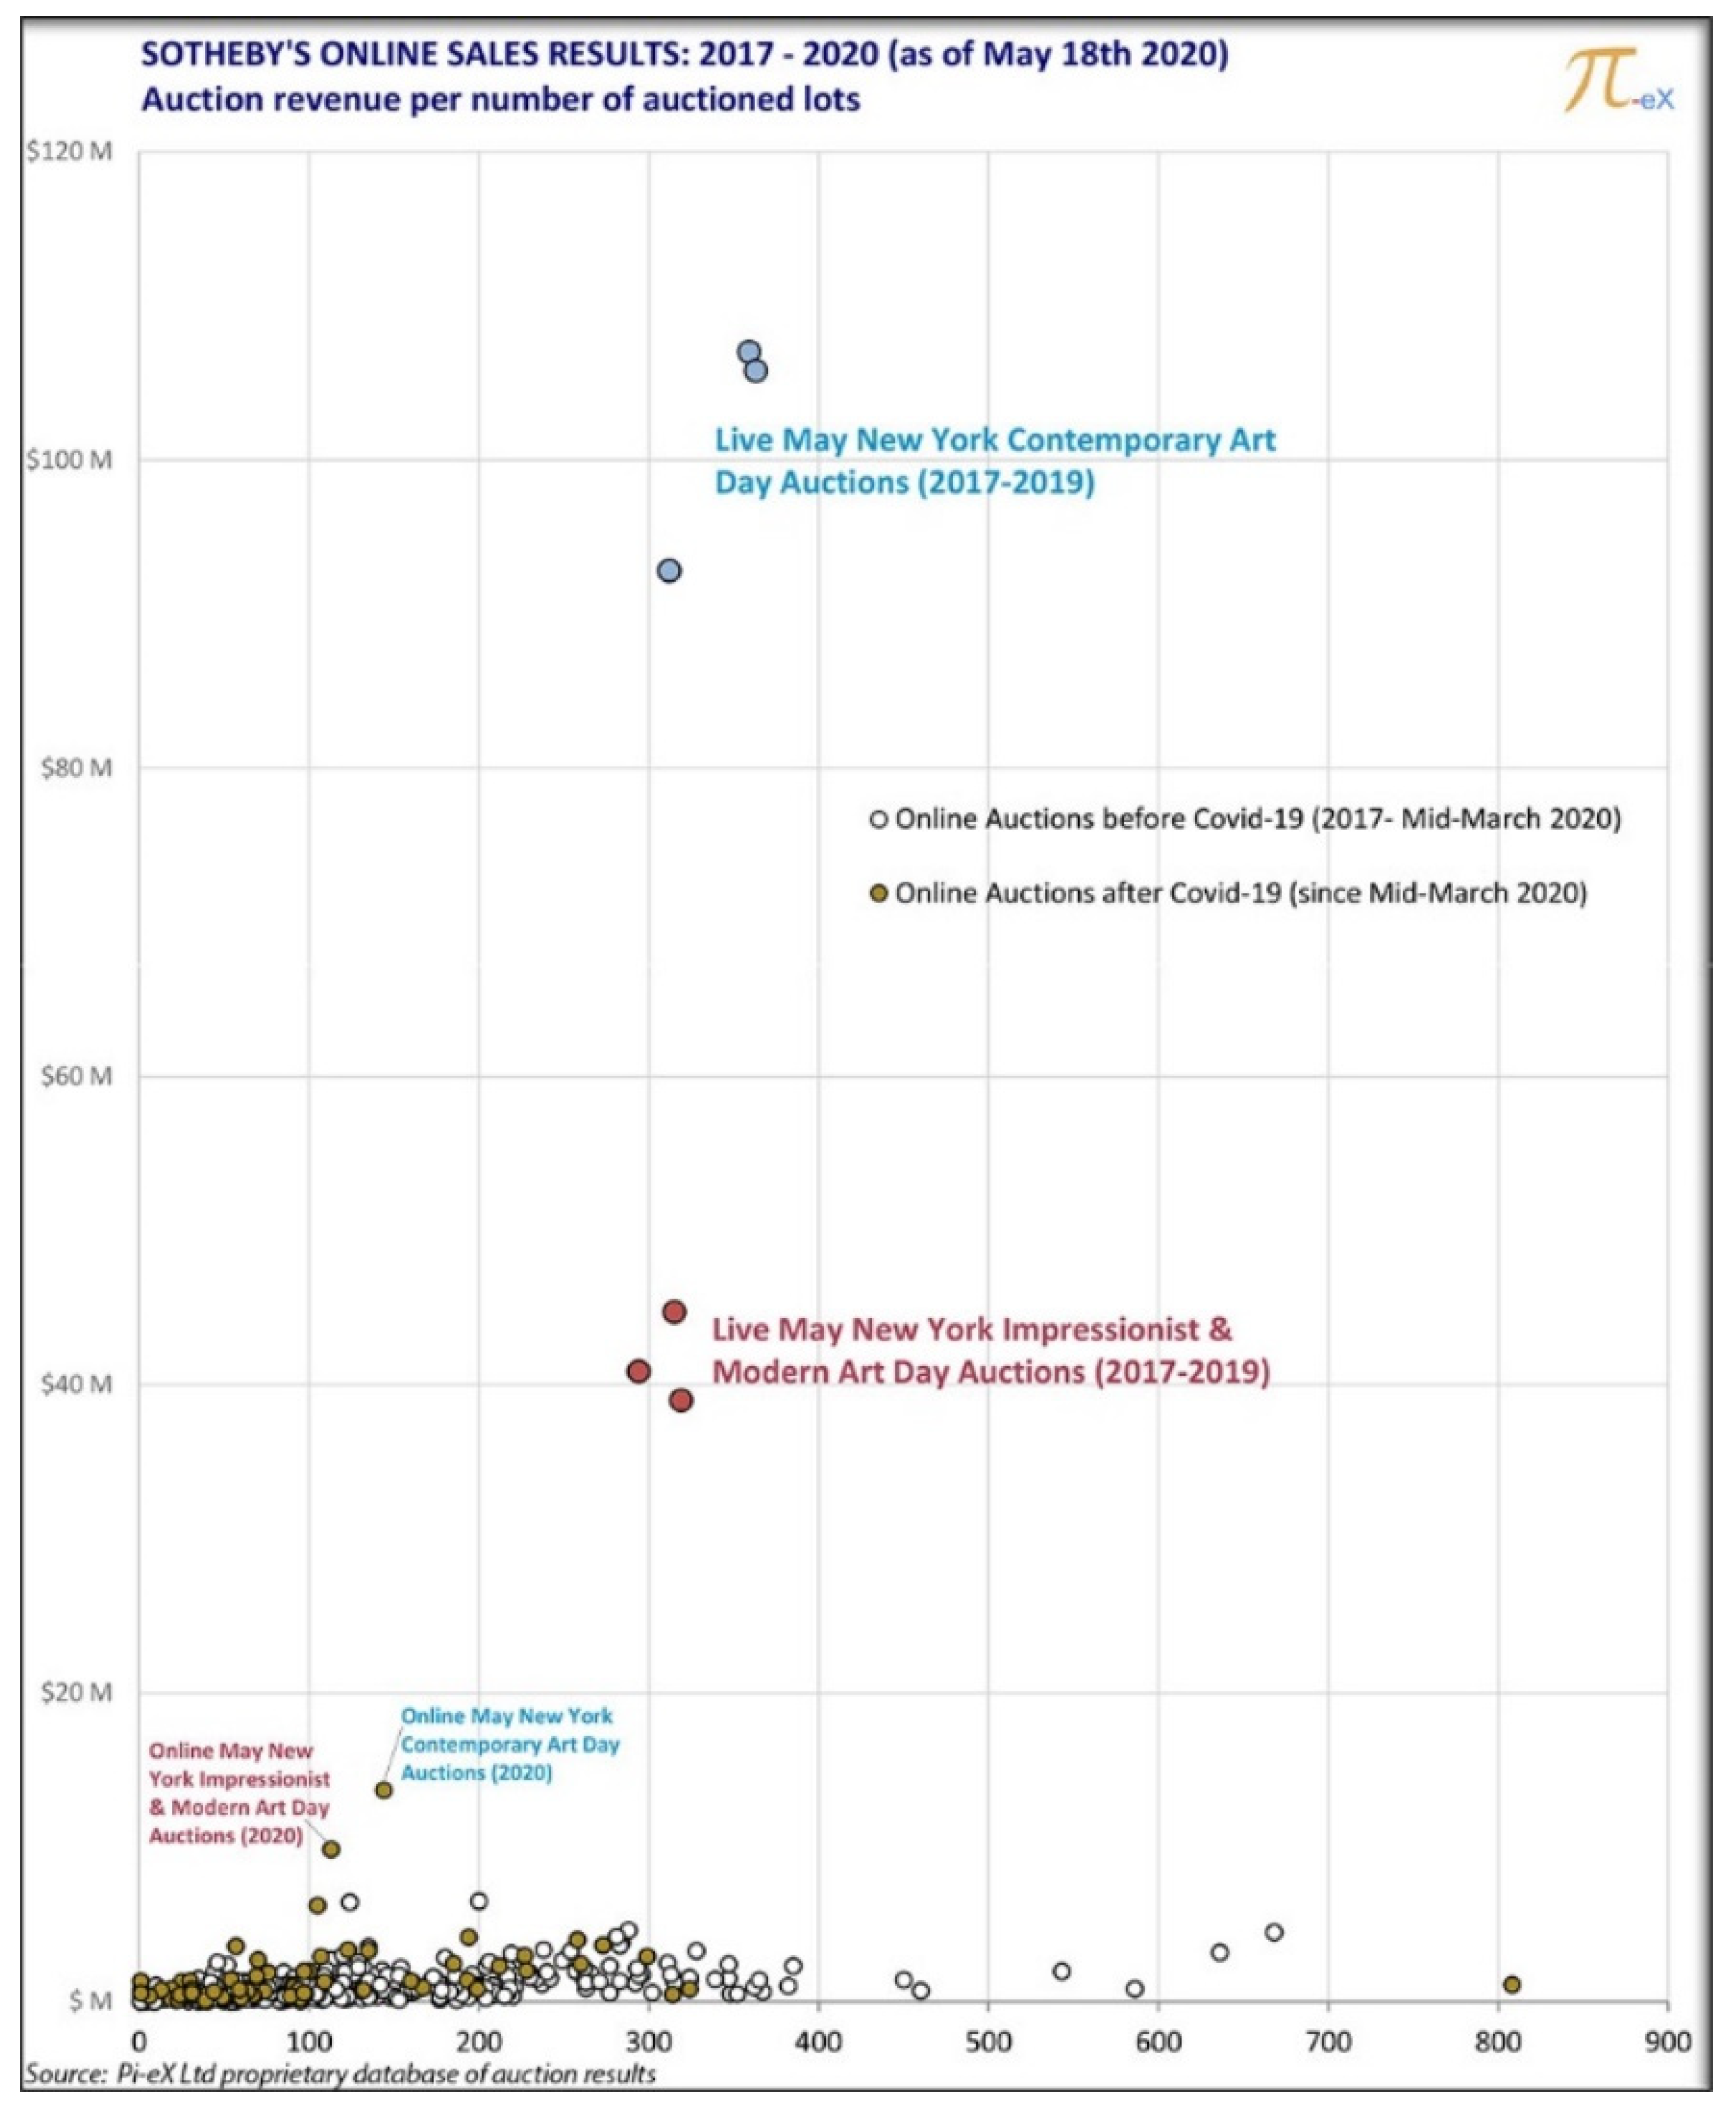
There is no doubt that during the COVID-19 crisis, online only auctions were a lifesaver for the auction houses. Switching to online only sales was the right strategy and Sotheby’s, which implemented this strategy first, certainly benefited from its first mover advantage. Still, the auction house itself seemed to recognize that a pure online format would limit its ability to sell higher price point artworks. During the first lockdown in May 2020, while all live auctions had stopped, Sotheby’s made the decision to arrange both its Marquee New York “Contemporary Art Day Sale” and “Impressionist & Modern Art Day Sale” in an online only format, respectively, from 4–14 May 2020 and 4–18 May 2020. This was a notably different strategy than the other auction houses, as Christie’s and Phillips both simply postponed all their May New York Marquee sales to July. In the absence of competitive offering, the online only sales could have proved to be a tremendous success. They were not. Sure, they generated a level of revenue never seen before for online auctions (Figure 7), but the totals—respectively, USD 13.7 million and USD 9.9 million (Table 7)—were disappointing compared to revenue generated by the Marquee Day sales in a live format just a year before: respectively, USD 106 million and USD 45 million. While the number of lots scheduled in the online only sales was lower, the sale also suffered from a lower selling price than the live format: on average, the selling price generated by sold lots in the May 2020 online day sales was around USD 95,000 versus USD 291,000 for the contemporary art live sale in May 2019 and USD 88,000 for the Impressionist Day online sale in May 2020 versus USD 114,000 for the Impressionist Live Day sale in May 2019.
Given the results, it is little surprising that Sotheby’s made the decision to arrange additional live formats for its Marquee Day sales in New York in June 2020. The live auctions arranged in the last days of June 2020 in a hybrid format (with a live auctioneer but no public in the salesroom) brought in over USD 50 million for the contemporary art sale (USD 241,000 per sold lot) and almost USD 17 million for the Impressionist Art sale (almost USD 100,000 per sold lot), proving that a live format still allowed the auction house to obtain higher selling prices than an online only format.
With the full reopening of auction rooms in 2021, the auction houses had to make a choice between continuing the move online or returning to the traditional live format.
Sotheby’s experience with the May New York repeating day sales in May and June 2020 showed that despite the progress made during the COVID-19 pandemic, the online format still did not generate as much revenue as an auction arranged in a live format, especially for contemporary art sales. This confirmed that the live format continued to be the optimal format for traditional art buyers.
Sotheby’s, therefore, made the decision to return its key sales to a live format, while continuing to experience online with medium size sales and multiplying new smaller online sales. Interestingly, in May 2021, Sotheby’s decided to arrange its New York Contemporary Art Day sale in a live format, generating over USD 80 million (USD 315,000 per sold lot), while its New York Impressionist Art Day sale was again offered in an online only format. It brought in USD 26 million to Sotheby’s (USD 138,000 per sold lot), showing an impressive growth trend.
As of end of June 2021, the published calendar of auctions to be offered both at Christie’s and Phillips also showed that the auction houses made the strategic decision to return to the live auction format as much as possible. They certainly have not stopped arranging online only sales, but their pace is much slower than Sotheby’s. They also continue to position their online sales as complementary to their live offering rather than as replacement. For example, Phillips’ Gallery One series of online auctions, launched in March 2021, are separate from Phillip’s traditional calendar. Located in a different section of the auction house’s website, Gallery One auctions are run weekly, starting and closing on Thursdays, before the history and results of the sales quietly disappear from the auction house’s website.
As shown in Figure 6, the return to the live format allowed revenue from live auctions to bounce back to a larger scale and at a faster pace than compared to revenue generated by online only auctions.
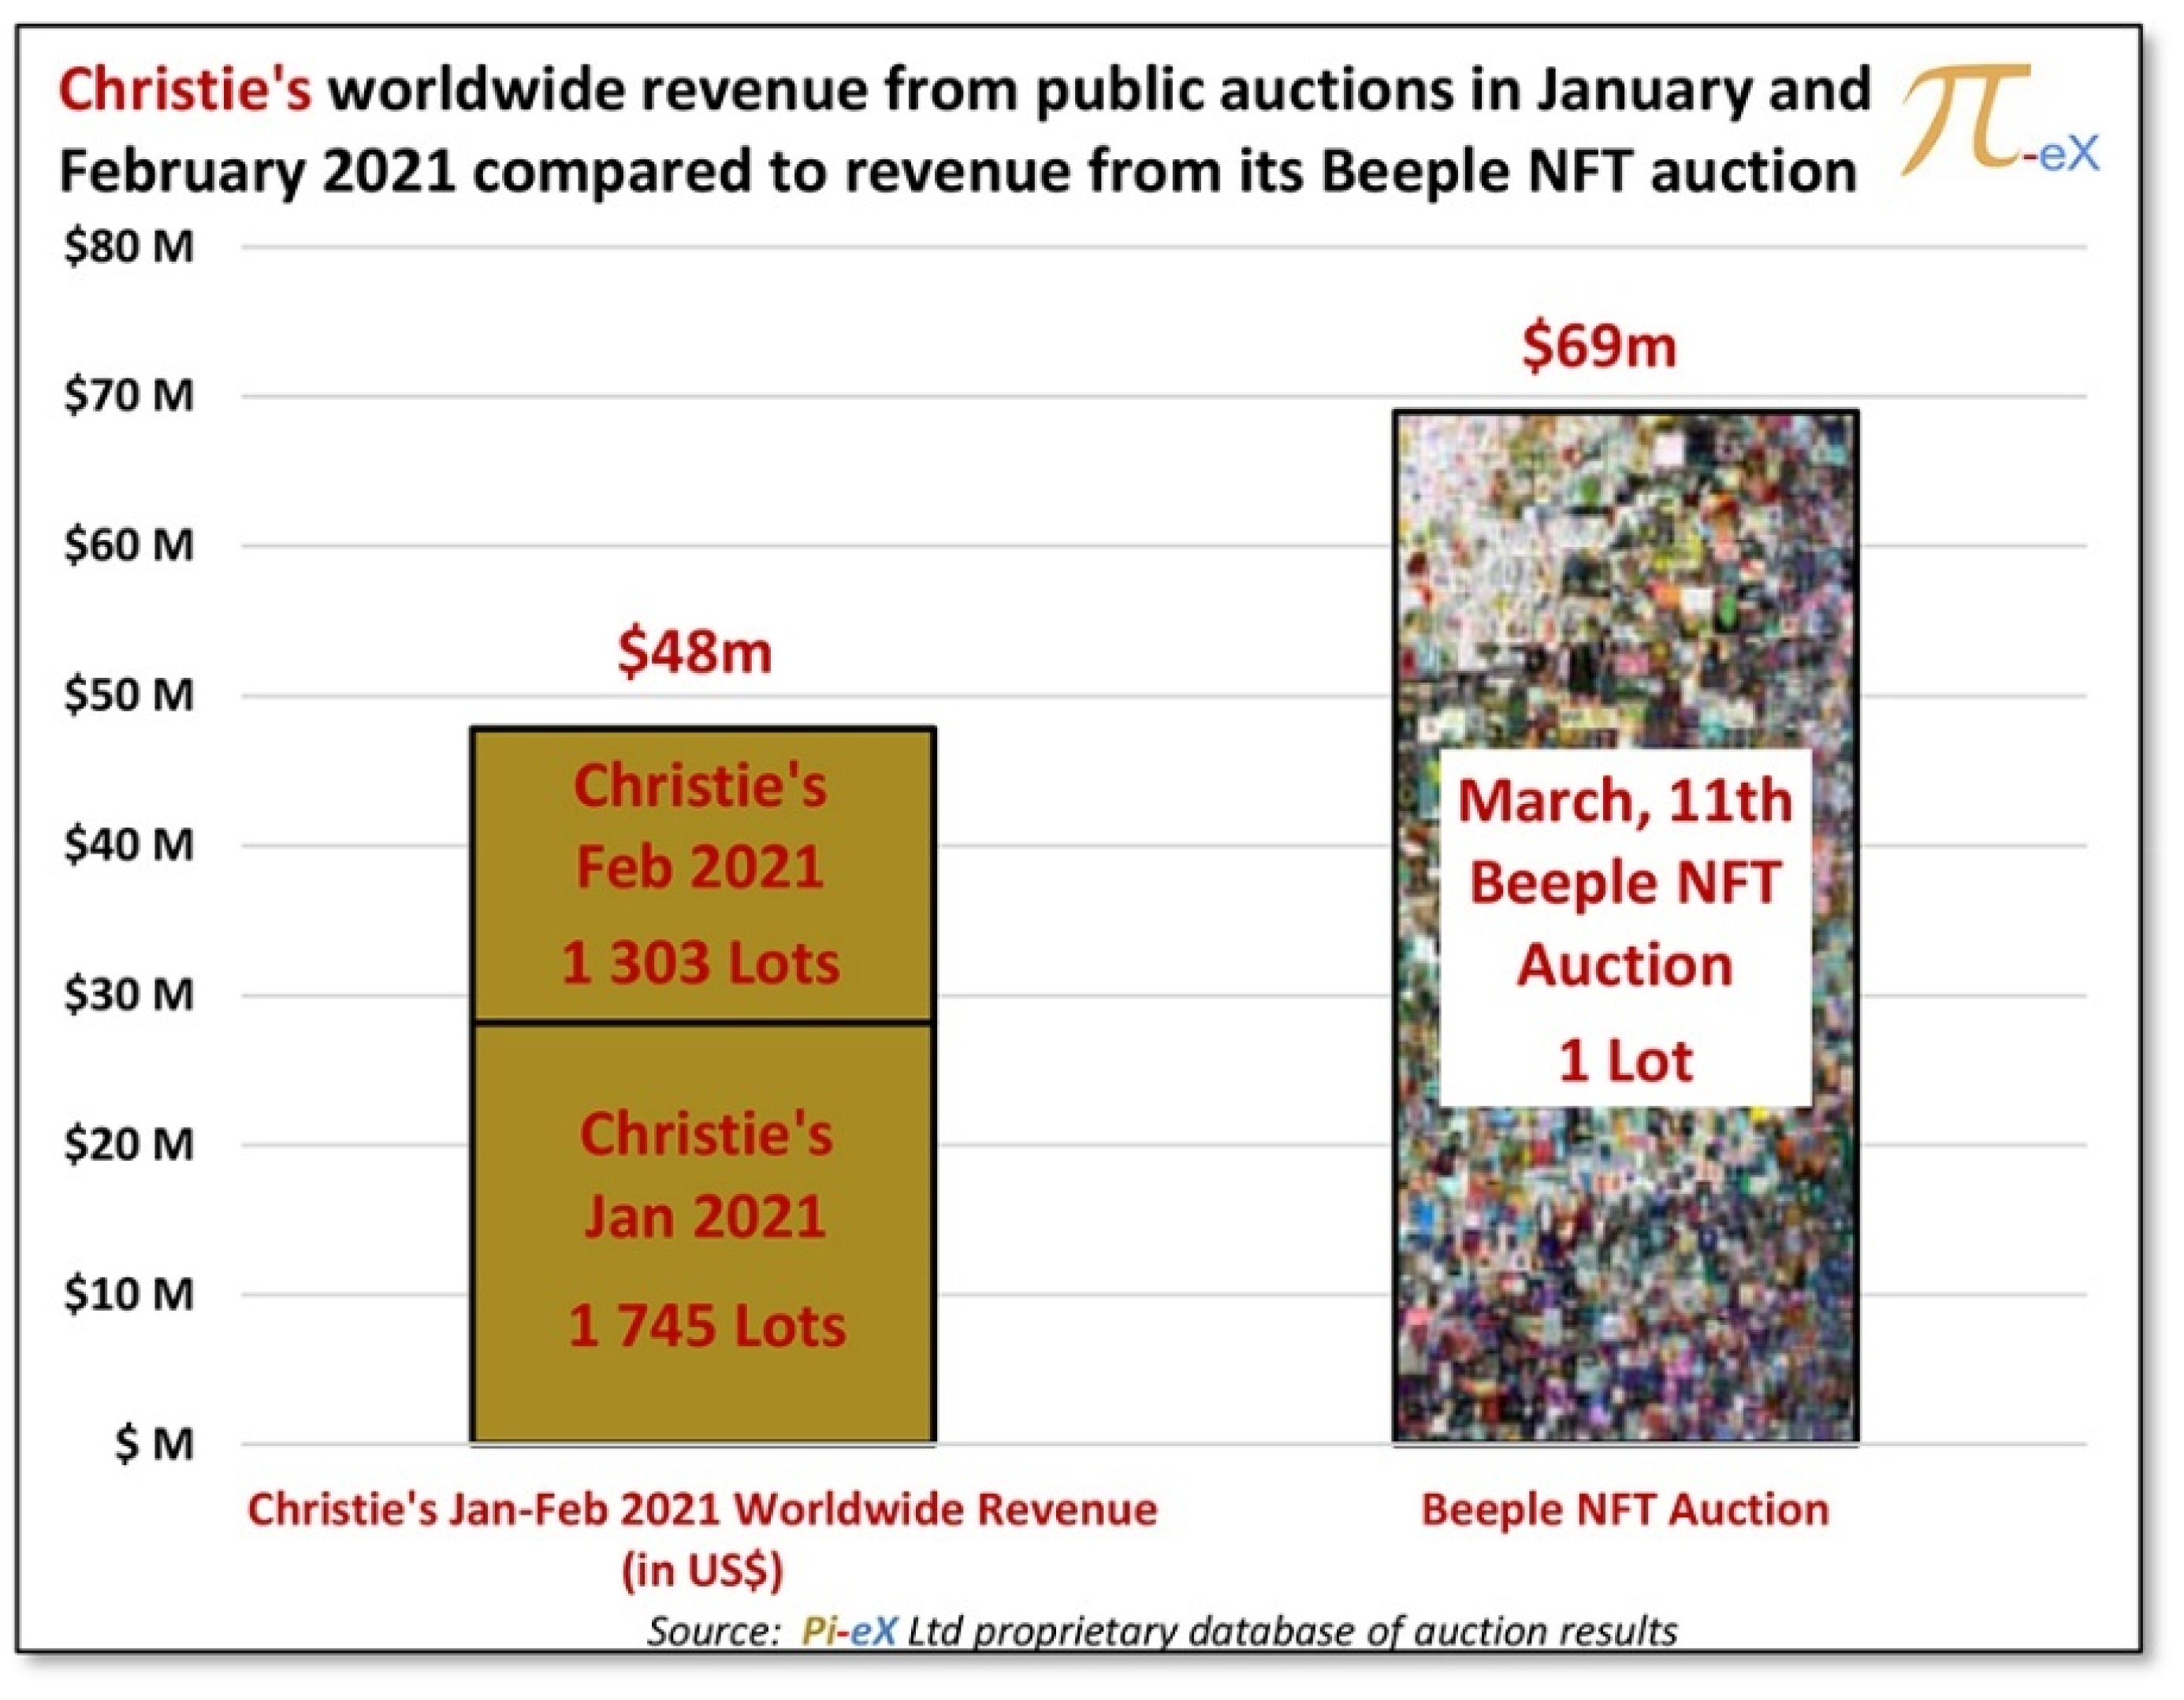
While not fully replacing the auctions’ live format, online only auctions certainly opened new opportunities for the auction houses. In March 2021, at a time when the number of online auctions was at its highest but revenue from online auctions continued to remain significantly lower than revenue from live auctions, one online auction captured the attention of everyone in the art world and even outside the art world. The auction was “Beeple|The First 5000 Days” arranged by Christie’s New York on 11 March 2021. Over the previous two months, January and February 2021, Christie’s had seen significantly lower revenue than in the previous year (ahead of the COVID-19 pandemic) despite cataloguing 44% more lots than in 2020 (Table 8). However, this was to change as with one online auction offering one unique lot, an NFT minted by the artist Beeple, Christie’s was able to generate significantly more revenue (USD 69 million versus USD 48 million) than by offering 3048 lots over the previous two months of January and February 2021 (Figure 8).
The combination of a non-fungible token (NFT) and an online sale at Christie’s, opened the door of the fine art auction world to the crypto-community. Crypto investors were already investing and collecting NFTs and digital art for years but only on specific platforms that allowed them to trade the blockchain based smart contracts, for example, Nifty Gateway, OpenSea, and Rarible. Before the COVID-19 pandemic, this all seemed like a “geek” experiment that could hardly affect the traditional art world.14
By bringing NFT to its online platform and adding the possibility to pay in cryptocurrencies, Christie’s created the perfect formula, and the Beeple sale made history on 11 March 2020.15,16 Soon enough, Sotheby’s and Phillips jumped on the bandwagon and arranged their own NFT sales: On 16 April 2021, Sotheby’s auctioned the “PAK’ Collection” for USD 16 m, and Phillips offered the “MDJ multiplicated NFT” for USD 4 m on 23 April 2021. Even though revenue from NFT auctions has been decreasing as the novelty effect seems to have started to wear off, it is undeniable that NFTs have changed the auction landscape in a manner Artificial Intelligence (AI) based artworks never did.17 Most importantly, NFTs have proven to be the perfect items to sell in an online only format. As shown earlier, prices for traditional art obtained via online only sales remain lower than when auctioned via live sales. The contrary seems to apply to NFTs, as most online only sales have generated tremendous interest and bidding while the few sales of NFT arranged live have resulted in very shallow bidding so far.
While traditional auction houses’ collectors still showed a preference for buying artworks in live auctions, NFTs offering in online auctions turned out to be the perfect combination to target the new segment of crypto millionaires, opening new growth opportunities for the auction houses.18 At last, Christie’s, Sotheby’s, and Phillips found the perfect new buyers for their online platforms: a group of people with seemingly unlimited resources who share similar values, are fully comfortable in an online only environment, easily reachable via social media, and who are, most importantly, not afraid to spend a large amount of money online, especially if it is crypto-currency.

3.3. Comparing the COVID-19 Crisis to Previous Art Market Crisis

Previous art market crises in 2008–2009 and in 2016 have been researched extensively over the years. Research findings, however, are often based on a year-by-year analysis of estimations of the overall size of the global art market (yearly TEFAF reports and UBS reports in 201719 and 202120), the total value of fine art public auctions transactions (yearly Art Price reports21), or the evolution of various art price indexes.22 While this allows for an understanding of the crises at a macro level yearly, it may not reflect the impact that the crises had on the market month after month. By applying Pi-eX’s 12-month rolling methodology to the total combined revenue obtained at Christie’s, Sotheby’s, and Phillips, we compared—on a monthly basis—the impact of the COVID-19 crisis versus the 2008–2009 and 2016 crises. We believe our analysis provides an insightful reading of what art stakeholders experienced each month during each crisis and shows how fundamentally different the COVID-19 crisis was from previous crises. Overall, the crisis inflicted on the public auction market by COVID-19 was not the worst both in terms of revenue loss and impact on the bottom line. It was, however, a crisis fueled by complex operational issues and followed by the fastest technological adoption ever seen in the art market.

3.3.1. COVID-19 Crisis versus the 2008–2009 Financial Crisis

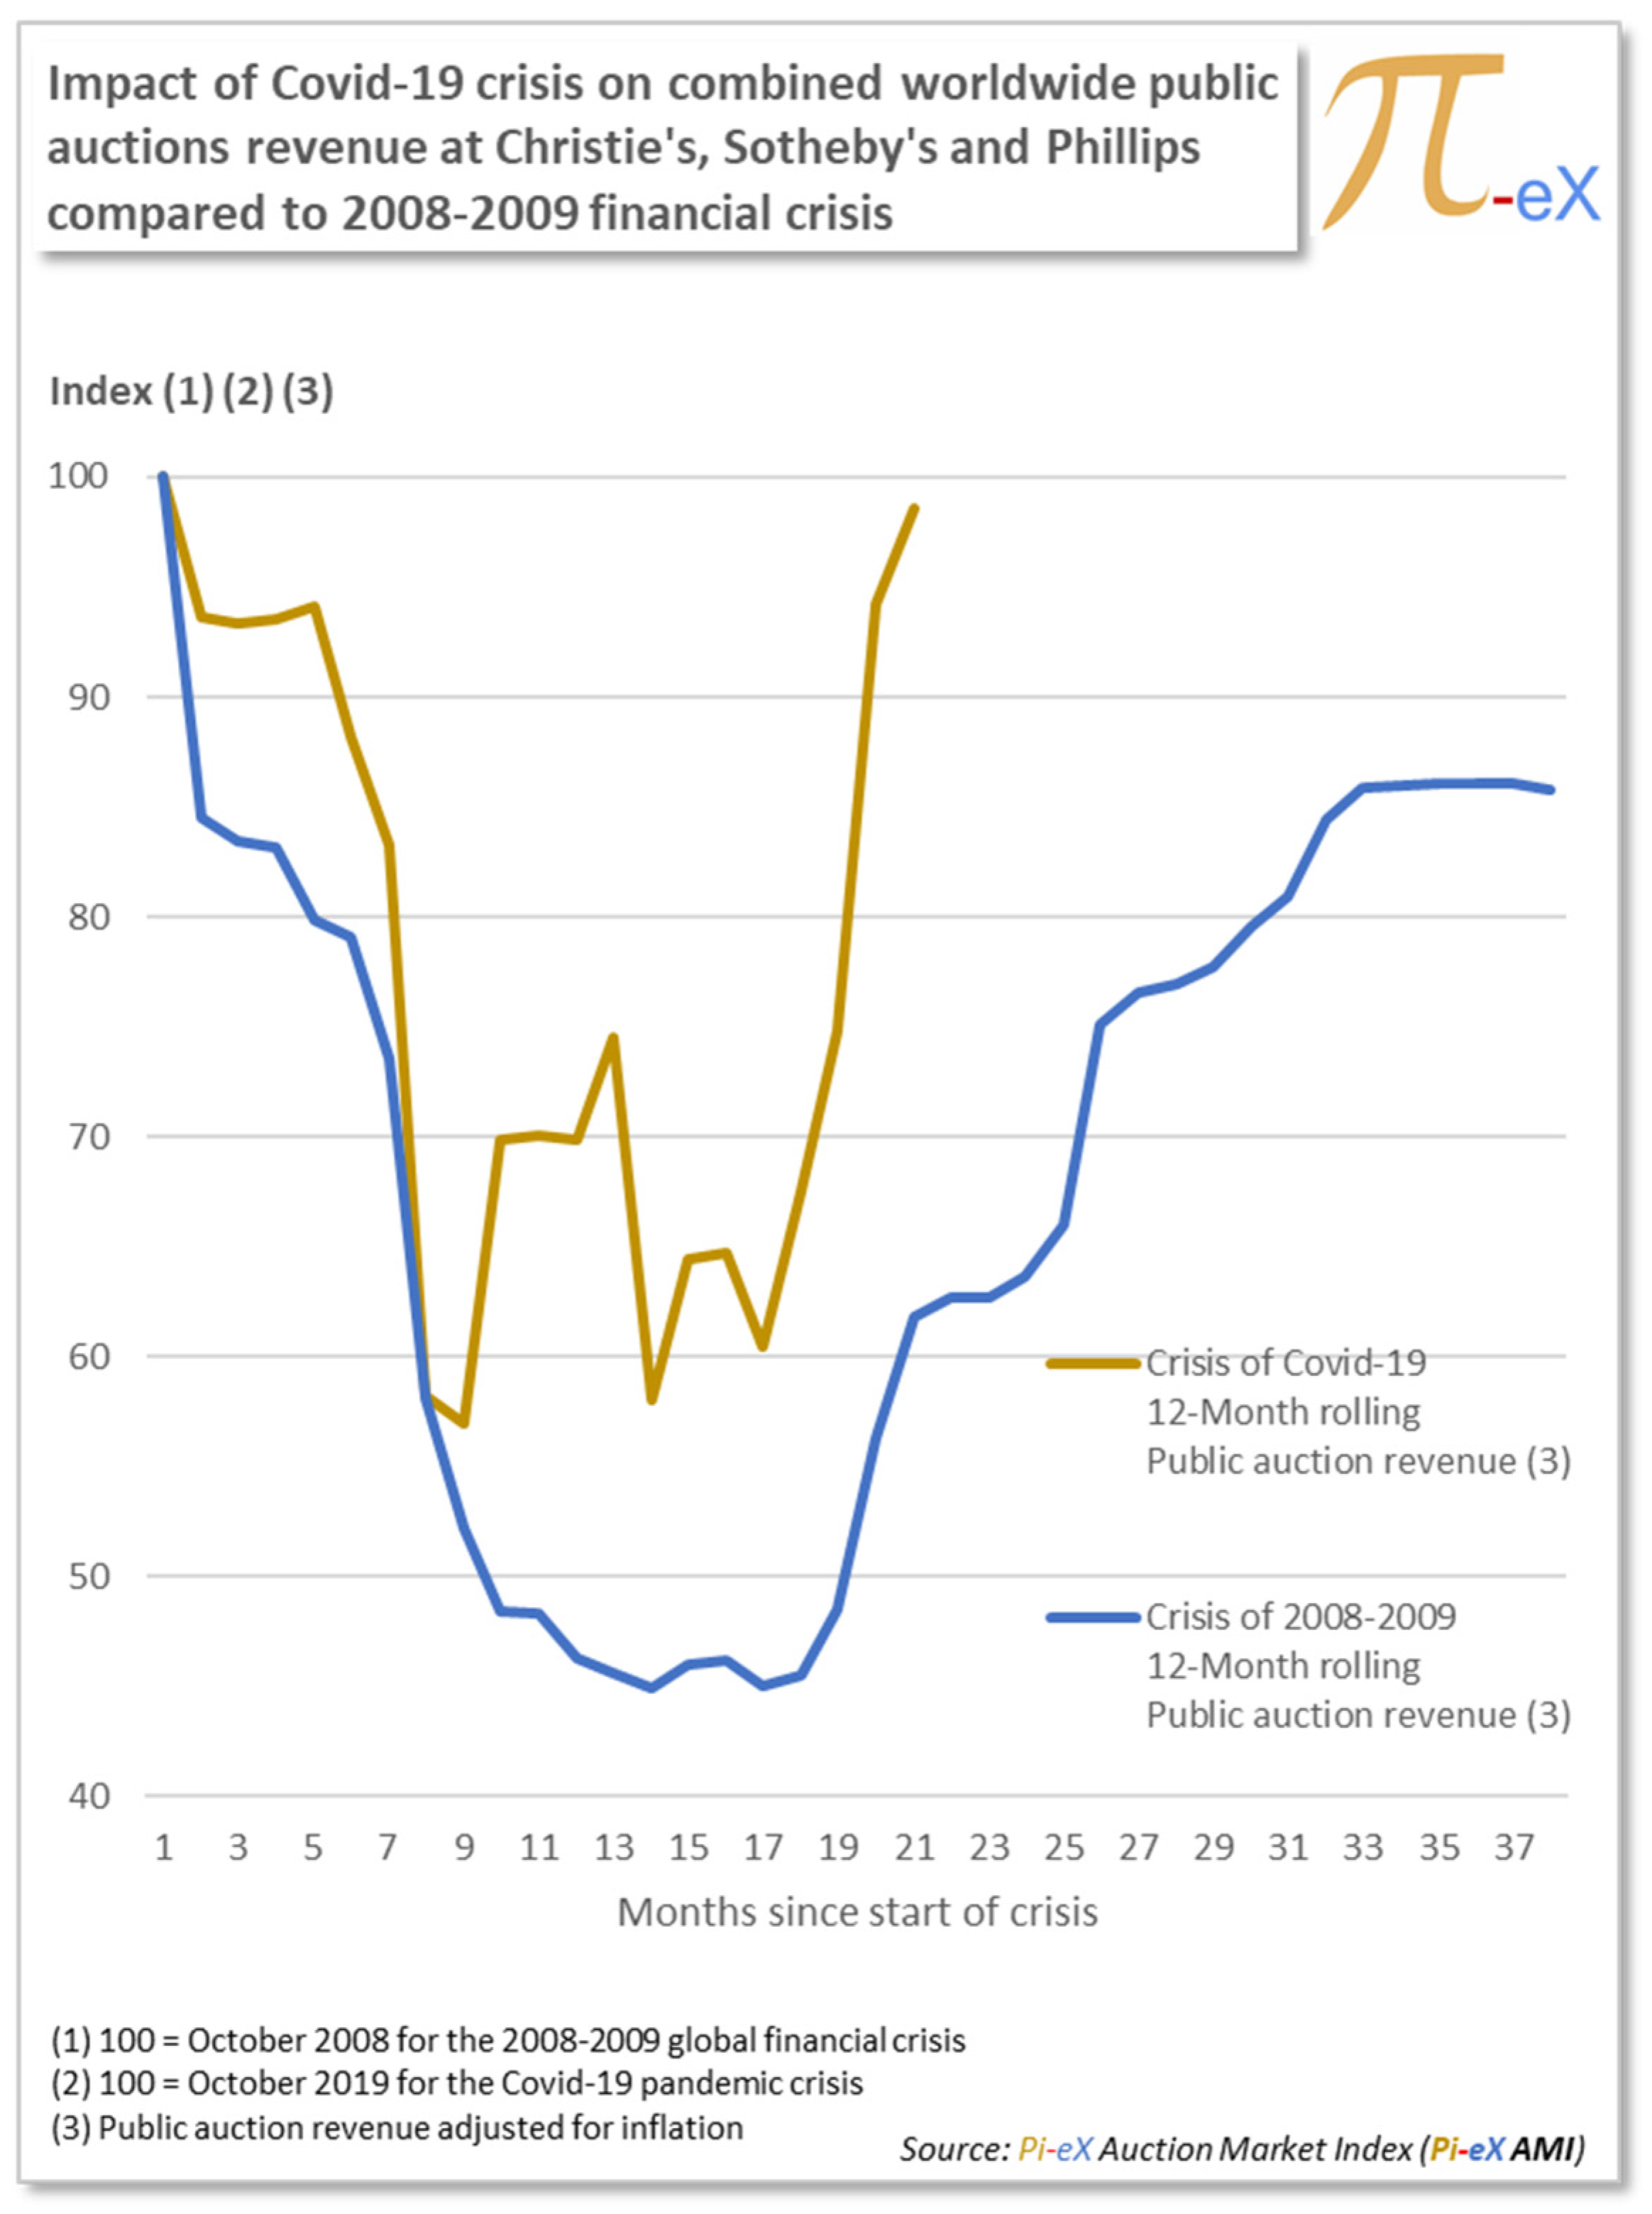
The 2008–2009 financial crisis had the worse effect on the public auction trade at the top three auction houses. Within 14 months, the 12-month rolling revenue (adjusted for inflation) plummeted 60% from a high USD 11.2 billion in October 2008 to a low USD 5.0 billion in November 2009 (Table 9). The 2008 auction market crisis, characterized by a U-shape, was driven by the global financial crisis, which started early 2007 as a mortgage crisis and accelerated in October 2008 with the bankruptcy of Lehman Brothers Inc. and the collapse of the financial markets worldwide, leaving equity investors with tremendous wealth loss and no place to hide.23 Faced with what was named the “largest destruction of equity value in history”, art collectors and investors suffered major liquidity issues, which dramatically affected the art market: With both sellers and buyers short on cash, the public auction market experienced a deep and long downturn period (in blue in Figure 9) from October 2008 to November 2009 (14 months) during which both value and volume of art sales converged downward.24 This was followed by a rather long stagnation period from November 2009 to April 2010 (5 months) at the bottom of the curve. Only in April 2010 did the recovery period start as both the volume of art traded finally tended upward thanks to an increase in the number of lots catalogued at auctions fueled by the return of demand from art buyers.25 It took, however, another four years before the combined revenue at the top three auction houses managed to reach its pre 2008 financial crisis level.
The impact of the COVID-19 crisis on public auctions was neither as deep nor as long. It happened at a time when the level of trade at Christie’s, Sotheby’s, and Phillips over the previous 12 months had already started to slow down from USD 9.1 B in October 2019 to USD 8.6 B by February 2020 (month 5 in Table 9). Uncertainty brought by demonstrations in Hong Kong during the fall 2019 art fairs and auction weeks plus the early signs of the pandemic in China beginning of 2020 had resulted in decreasing trade at public auctions in China and even in London in February 2020, where Chinese buyers were noticeably rare.
In Europe, UK, and the US, the impact of the COVID-19 pandemic on trade at auctions was immediately visible starting March 2020, when the countries announced their first lockdowns. With auction rooms closed, employees forced to work from home, and collectors unable to view artworks before buying, the auction houses had little choice but to cancel, postpone, or move most scheduled live auctions online. This resulted in a plummeting of auction revenue from USD 8.6 billion in February 2020 to USD 5.2 billion by end of June 2020 (month 9 in Table 9). During this period, the online only auctions arranged by the auction houses failed to compensate for the missing revenue from live auctions.26 In addition to the challenge of selling original artworks online only, which the auction houses had experienced for years, the conditions of the online only auction sales arranged between March and June 2020 were not very appealing to buyers as they had to agree to “pay now” for “delivery whenever possible”. In fact, while auction houses’ employees could move sales online, they were not able to handle and ship lots after sales as the auction houses were not considered an “essential business”; therefore, their handling and shipping departments remained closed in many countries until the end of the first lockdown.
By June 2020, however, offices reopened, and the auction houses launched the new format of hybrid auctions ran by a live auctioneer without public in the room. Postponed auctions (mostly key repeating Marquee sales in New York, Hong Kong, London, and Paris) were rescheduled starting at the end of June (month 9 in Table 9), and revenue immediately bounced back by end of July 2020 to USD 6.4 billion (month 10 in Table 9). The sudden increase in revenue shows how the COVID-19 crisis was mostly a scheduling and operational crisis. It did not affect buyers’ purchasing power contrarily to the 2008–2009 financial crisis. If anything, it seemed that buyers in 2020 had more appetite to collect and more capital to spend once they got out of lockdown.
Further scheduling challenges in 2020 are visible in the “W” shape of the COVID-19 crisis. After a few months of growth, the 12-month rolling revenue fell again from USD 6.8 billion in October 2020 (month 13 in Table 9) to USD 5.3 billion in November 2020 (month 14) as the scheduling of the key New York November Marquee sales was moved initially to October and then repeated in December 2020 due to (1) the uncertainty of the US 2020 presidential elections and (2) a potential second COVID-19 lockdown in New York. While the shift of revenue from one month to another month may not matter in some industries, in the art and auction business, it can have major consequences on prices and value. Historically, the auction business is arranged around a traditional calendar that sees a large majority of auctions occurring repeatedly during the same month. Changes in the calendar, if not advertised ahead of time, can potential affect the sometime fragile equilibrium of demand and supply at auction.
Since February 2021 (month 17 in Table 9) the 12-month rolling revenue has bounced back from USD 5.5 billion to USD 9 billion in June 2021 (month 21) as the auction houses have returned to their traditional auction calendar.

3.3.2. COVID-19 Crisis versus the 2016 Crisis

Compared to the 2016 crisis, the COVID-19 crisis was more dramatic in the early months of the crisis, both in terms of speed and in depth.
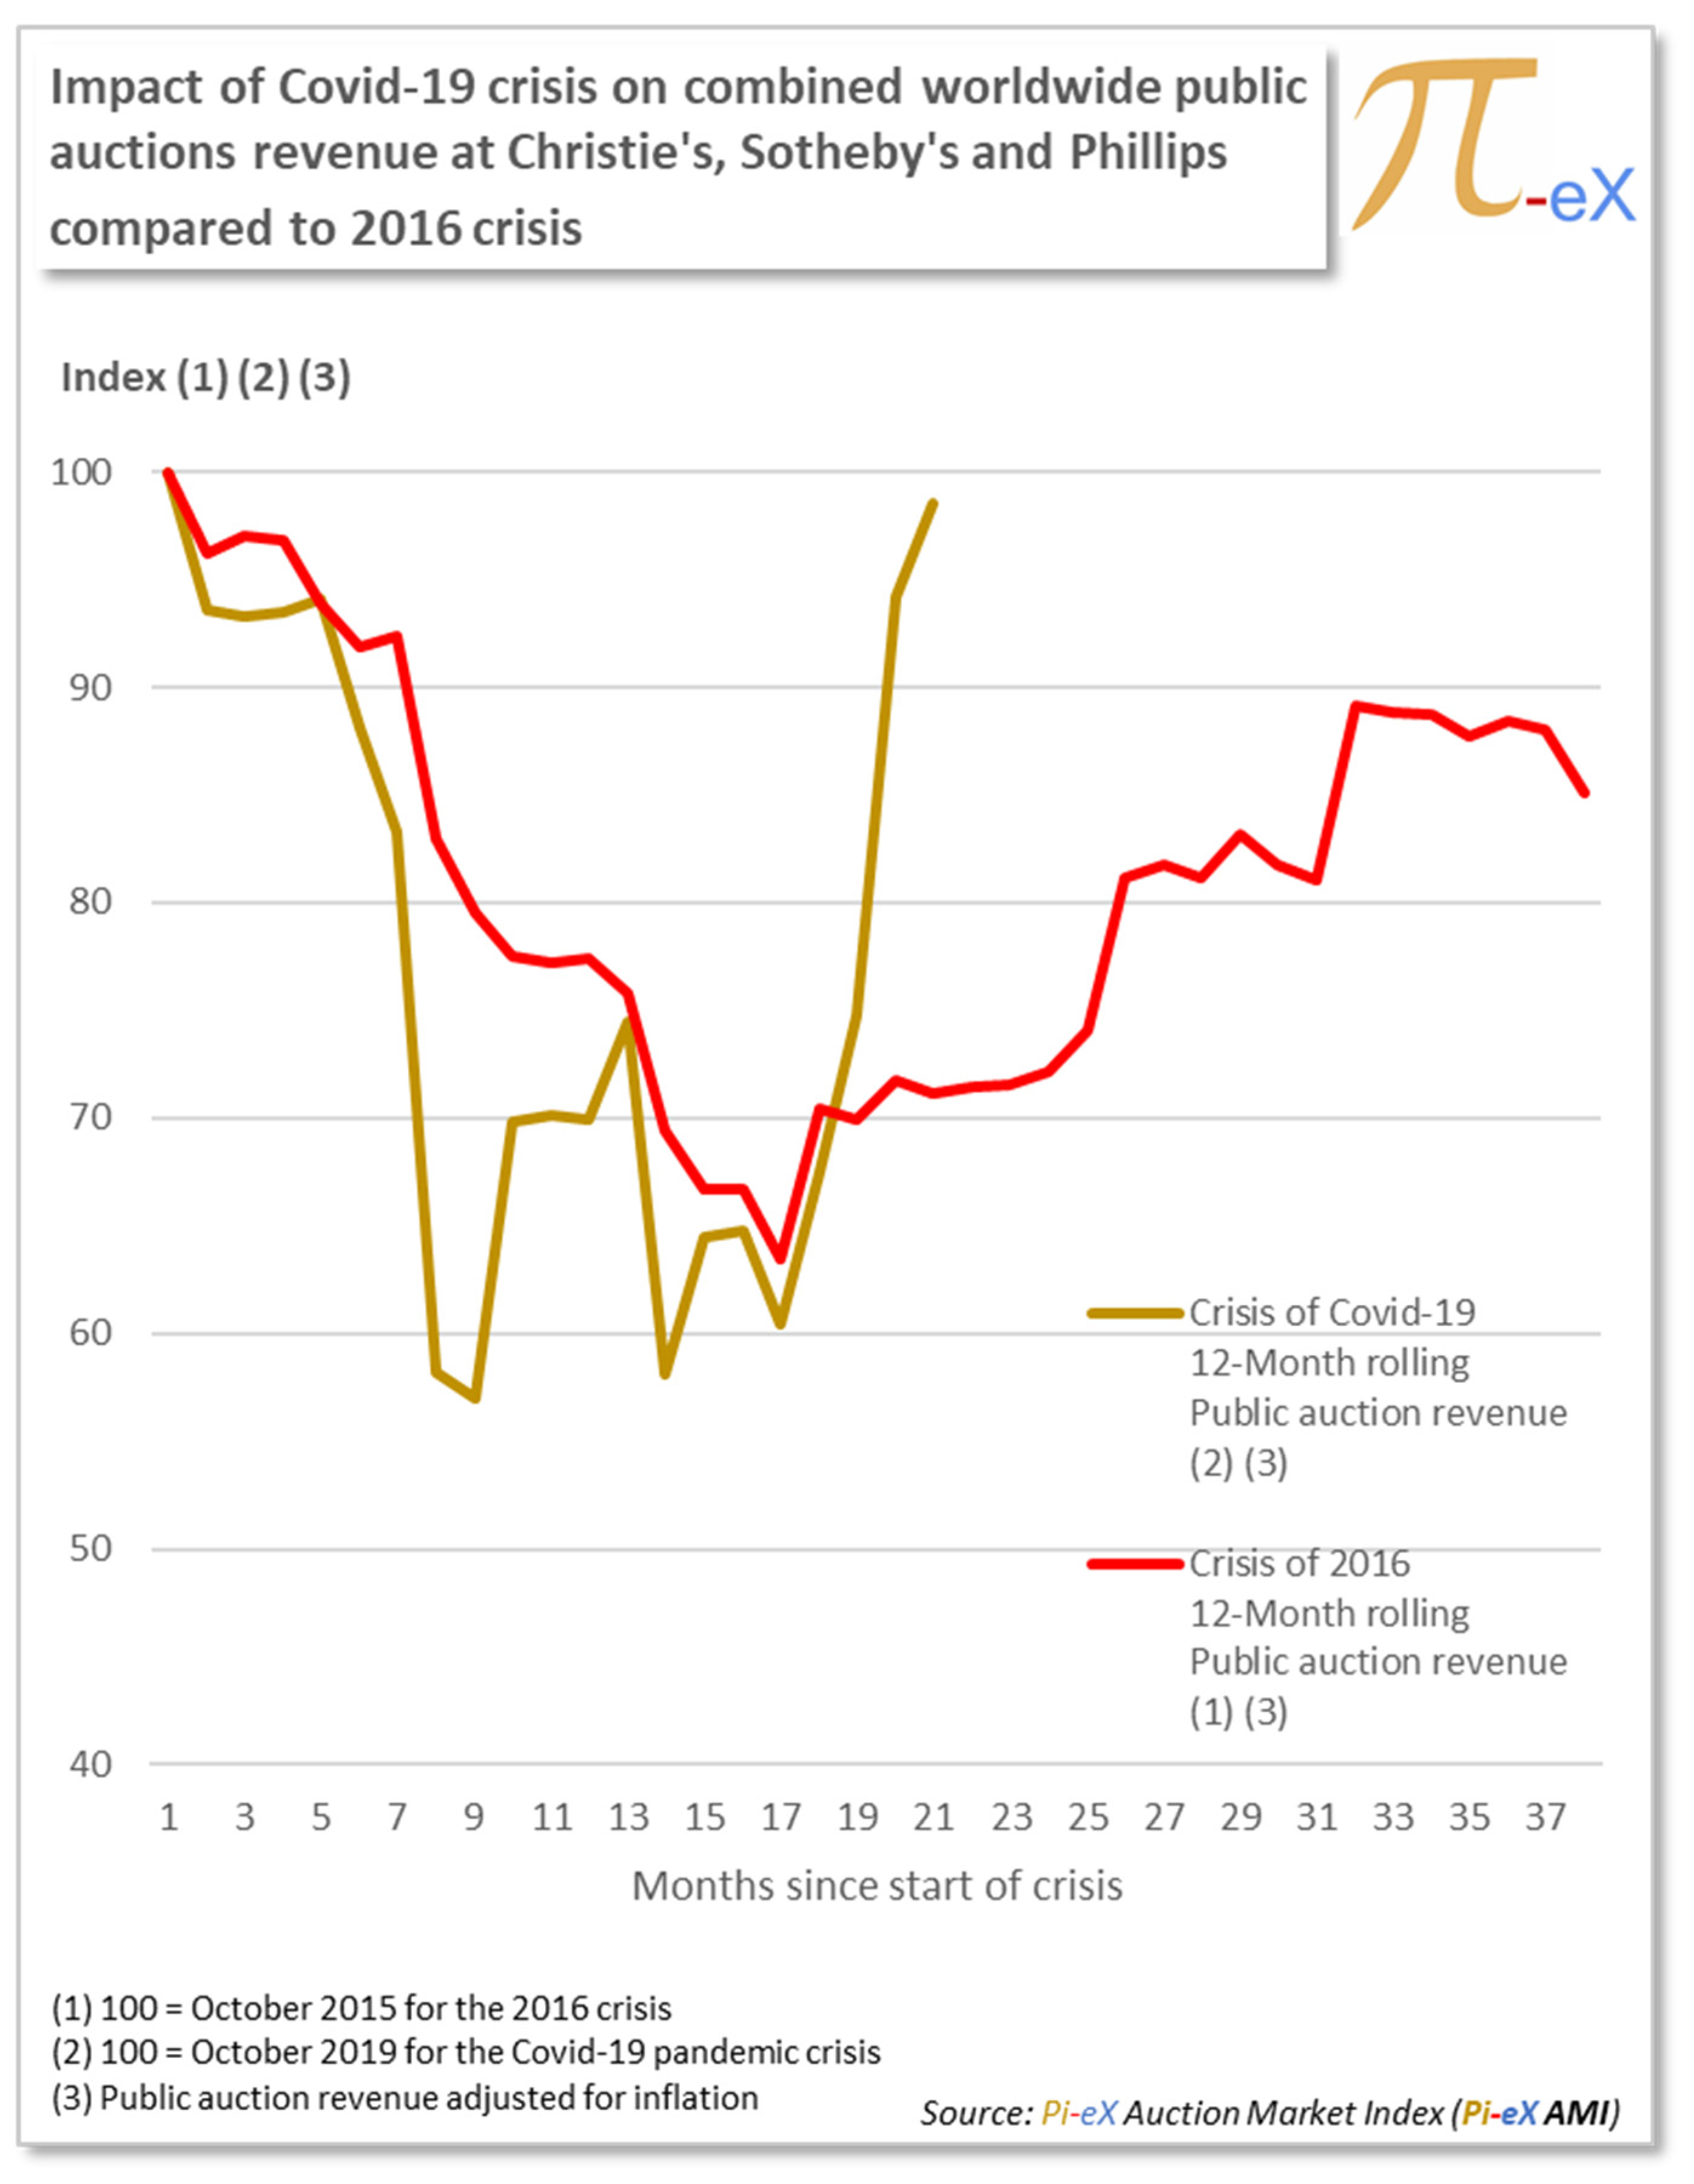
During the COVID-19 crisis, the total 12-month rolling revenue at the top three auction houses plummeted 43% within 8 months (from October 2019 to June 2020) from USD 9.1 billion to USD 5.2 billion (Table 10). This compares to a drop of 37% within 16 months for the 2016 crisis, from USD 12 billion in October 2015 to USD 7.6 billion in February 2017. Contrarily to the 2008–2009 financial crisis, the 2016 crisis at public auctions cannot be attributed to one particular event but rather to a high level of uncertainty in the world at the time: in January 2016 (month 4 in Table 10), the year started with a crash in the Chinese stock market, which sent shockwaves across the world; moreover, 2016 was the year of the Brexit referendum in the UK (June/month 9 in Table 10) and the US 2016 Presidential elections (November/month 14 in Table 10). The TEFAF 2017 report outlined that public auctions in the US were most affected by the 2016 decline (−41% in 2016 versus 2015); this was particularly true for the Marquee sales in New York, which take place twice a year (in May and in November) and include some of the most expensive artworks traded.27 Figure 10 shows indeed that the decrease during the 2016 crisis is strongest in month 8 (May 2016) and month 14 (November 2016) (Table 10). These are the months of the Impressionist and Contemporary Marquee sales in New York, which historically contribute to a large share of the yearly revenue. Without a key event initiating the crisis, the 2016 crisis showed a slower and longer erosion of public auction revenue, as well as a slower and longer recovery period, characterized by a wide V-shape. In the end, public trading at the top three auction houses never regained its pre-2016 crisis level since.
In a sharp contrast, as of June 2021, results at public auctions show that revenue has already almost returned to the pre-COVID-19 level. The return of normality after months of operational disruptions combined with the structural changes implemented by the auction houses during the pandemic could clearly continue to push the public auction market to new historic highs.

4. Conclusions

The COVID-19 pandemic affected the public auction market in a manner that has little historical comparisons. The distinctive W-shape of the impact of the COVID-19 pandemic on trade at public auctions reflects the tribulations experienced by the auction houses as they struggled to cancel and postpone live auctions, move online, and create new auction formats better adapted to the online world. As the auction houses adjusted to the new reality, revenue bounced back in the beginning of summer 2020 but fell again after the summer before finally starting to grow sustainability in spring 2021. Through their struggle, the top three auction houses eventually managed to transform their businesses from a world of mostly live auctions to a mix of live and online reality. After years of investments in their online infrastructures, the COVID-19 pandemic may have provided them with the right conditions to finally convince some art collectors about the benefits of the new digital world but most importantly to find a new group of collectors who are most comfortable online. With new opportunities appearing thanks to the rise in demand for NFTs and the rapid growth of new virtual communities of NFT collectors, the auction houses definitely are in a better place to leverage their improved infrastructures and provide the art world with an offering reflecting both the past and the future of art. At least one thing is certain: the public auction world will never return to the pre-Covid reality.

Funding

This project received no external funding.

Data Availability Statement

Data were obtained from Pi-eX Ltd. All data were collected independently by Pi-eX Ltd. over the past 7 years from public information published by the auction houses and by attending live and online auctions. The data presented in this article are available with the permission of Pi-eX Ltd. Restrictions apply to the availability of any further data related to the subject.

Conflicts of Interest

The author declares no conflict of interest. Pi-eX Ltd. is an independent third-party data and research provider whose mission is to independently highlight trends in the global art market.

Notes

1
“Top Three Houses See 79 Percent Year-over-Year Drop in Second Quarter of 2020”, by Angelica Villa in August 2020, published by The Art Market Monitor (Villa 2020).
2
Pownall (2017). TEFAF Art Market Report.
3
In their article “Imperfect Data, Art Markets and Internet Research”, the authors highlight why current and aggregate data on auction markets, both offline and online, can be hard to come by. (Van Miegroet et al. 2019).
4
The dominance of Christie’s and Sotheby’s in the art market is highlighted in Don Thompson’s book “The Supermodel and the Brillo Box”, Part 4 “The Auction Houses” (Thompson 2014, p. 137).
5
In his book “Art Law and the Business of Art”, Martin Wilson, Chief General Councel, Phillips Auctioneers, describes in details the various forms of online auctions (Wilson 2019, chp. 7, p. 164).
6
The 2017 TEFAF Art Market Report (Pownall 2017) provides detailed information on the development of online sales and in particular the history of online sales at Christie’s and Sotheby’s.
7
Christie’s Announces New $20 Million Investment as Digital Engagement Drives Growth in the Art Market”, Press Release by Christie’s to announce further investment in its digital platform (Christie’s 2014).
8
Sotheby’s and the cybermasses: The most famous name in the art world has gone online. Does it know what it’s doing?”, in 29th January 2000 published in the Economist, see (The Economist 2000).
9
Sotheby’s and Amazon.com Strike a Deal to Sell on Line”, by Carol Vogel in 17th June 1999 published in the New York Times, see (Vogel 1999).
10
Live Auctions End at Christie’s South Ken. Will Online Sales Fill the Void?”, by Scott Reyburn in 21st July 2017published in the New York Times, see (Reyburn 2017b).
11
Fewer and Smaller: A New Normal for London’s Summer Auctions”, Interview of Guillaume Cerutti by Scott Reyburn in 23rd June 2017 published in the New York Times, see (Reyburn 2017a).
12
Sotheby’s Drops Buyer’s Premium for Online only Sales”, based on Sotheby’s CEO Letter to shareholders and clients released in 8-k filling with the SEC, see (Maneker 2017).
13
For further information on the state of the public auction market as of the end of the first semester 2020, see Sotheby’s Reports $2.5 Billion in Sales (Reyburn 2020).
14
As recently as April 2019, the chance of blockchain making an impact on the traditional art market was seen as distant (Ali et al. 2019).
15
See Artnet article “An NFT Artwork by Beeple Just Sold for an Unbelievable $69 Million at Christie’s—Making Him the Third Most Expensive Living Artist at Auction”, (Kinsella 2021).
16
See The Art Newspaper article “WTAF? Beeple NFT work sells for astonishing $69.3m at Christie’s after flurry of last-minute bids nearly crashes website”, (Jhala 2021).
17
For a state of AI-Generated Art sales at public auctions in the Fall of 2019, see (Goldstein 2019).
18
For a description of new speculative NFT buyers versus blue-chip art collectors, see the New York Times article “As Auctioneers and Artists Rush Into NFTs, Many Collectors Stay Away” (Small 2021).
19
The Art Market 2017” published by Art Basel and UBS shows how Sales at public auction of fine and decorative art and antiques came under pressure in 2016 with aggreate value falling by 26% (McAndrew 2017).
20
The Art Market 2021” published by Art Basel and UBS shows Sales at public auction of fine and decorative art and antiques suffered a decline of 30% in 2020 versus 2019 (McAndrew 2021).
21
Art Price report “2009 Art Market Trends” provides an annual reading of the impact of the 2008-2009 crisis versus previous years.
22
“Reconsidering hedonic art price indexes”, Economic Letters (Collins et al. 2009).
23
Broad analysis of the effect of the 2008–2009 financial crisis on financial markets “No Place To Hide: The Global Crisis in Equity Markets in 2008/09” (Bartram and Bodnar 2009).
24
Dynamics of public auctions transactions from 2002 to 2015 “Transformations of the Art Market in the World—Quantitative Approach” (Bialynicka-Birula 2017).
25
Analysis of art prices during macro economic cycles in the 21st century “The Art Market at Times of Economic Turbulence and High Inequality” (Solimano 2019).
26
Early impact of the COVID-19 pandemic on public auction trade “Top Auction Houses Saw 40 Percent Drop in Q1 Sales Revenue Because of Pandemic: Report” (Villa 2020).
27
Review of the art market in 2016 “The art market is a ‘catastrophe’” (Richter 2016).

References

  1. Ali, Doha, Erin McDermott, Noah Michaud, and Mitchell Parekh. 2019. Online Auctions at Christie’s & Sotheby’s. DALMI Working Paper on Art & Markets No. 19213. Available online: https://www.dukedalmi.org/wpcontent/uploads/19213-Working-Paper.pdf (accessed on 20 October 2021).
  2. Bartram, Söhnke M., and Gordon M. Bodnar. 2009. No Place To Hide: The Global Crisis in Equity Markets in 2008/09. MPRA Paper No. 15955. Available online: https://mpra.ub.uni-muenchen.de/15955/ (accessed on 20 October 2021).
  3. Bialynicka-Birula, Joanna. 2017. Transformations of the Art Market in the World—Quantitative Approach. Institute of Economic Research Working Papers, No. 13/2017. Available online: http://hdl.handle.net/10419/219836 (accessed on 20 October 2021).
  4. Christie’s. 2014. Christie’s Announces New $20 Million Investment as Digital Engagement Drives Growth in the Art Market. Businesswire. Available online: https://www.businesswire.com/news/home/20140506006831/en/Christie%E2%80%99s-Announces-20-Million-Investment-Digital-Engagement (accessed on 20 October 2021).
  5. Collins, Alan, Antonello Scorcu, and Roberto Zanola. 2009. Reconsidering hedonic art price indexes. Economics Letters 104: 57–60. [Google Scholar] [CrossRef]
  6. Goldstein, Caroline. 2019. Has the AI-Generated Art Bubble Already Burst? Buyers Greeted Two Newly Offered Works at Sotheby’s with Lackluster Demand. Artnet News. Available online: https://news.artnet.com/market/obvious-art-sale-sothebys-1705608 (accessed on 27 June 2021).
  7. Jhala, Kabir. 2021. WTAF? Beeple NFT Work Sells for Astonishing $69.3m at Christie’s after Flurry of Last-Minute Bids Nearly Crashes Website. The Art Newspaper. Available online: https://www.theartnewspaper.com/2021/03/11/wtaf-beeple-nft-work-sells-for-astonishing-dollar693m-at-christies-after-flurry-of-last-minute-bids-nearly-crashes-website (accessed on 20 October 2021).
  8. Kinsella, Eileen. 2021. An NFT Artwork by Beeple Just Sold for an Unbelievable $69 Million at Christie’s—Making Him the Third Most Expensive Living Artist at Auction. Artnet. Available online: https://news.artnet.com/market/christies-nft-beeple-69-million-1951036 (accessed on 20 October 2021).
  9. Maneker, Marion. 2017. Sotheby’s Drops Buyer’s Premium for Online-Only Sales. Art Market Monitor. August. Available online: https://www.artmarketmonitor.com/2017/08/22/sothebys-drops-buyers-premium-for-online-only-sales/ (accessed on 20 October 2021).
  10. McAndrew, Clare. 2017. The Art Market 2017. Art Basel & UBS Report. Basel: Arts Economics. [Google Scholar]
  11. McAndrew, Clare. 2021. The Art Market 2021. Art Basel & UBS Report. Basel: Arts Economics. [Google Scholar]
  12. Pownall, Rachel. 2017. TEFAF Art Market Report. Maasatricht: The European Fine Art Foundation. [Google Scholar]
  13. Reyburn, Scott. 2017a. Fewer and Smaller: A New Normal for London’s Summer Auctions. New York Times. June. Available online: https://www.nytimes.com/2017/06/23/arts/christies-sothebys-london-art-auctions.html (accessed on 20 October 2021).
  14. Reyburn, Scott. 2017b. Live Auctions End at Christie’s South Ken. Will Online Sales Fill the Void? New York Times. July. Available online: https://www.nytimes.com/2017/07/21/arts/design/christies-south-kensington-auction.html (accessed on 20 October 2021).
  15. Reyburn, Scott. 2020. Sotheby’s Reports $2.5 Billion in Sales. New York Times. August. Available online: https://www.nytimes.com/2020/08/03/arts/design/sothebys-sales.html (accessed on 27 June 2021).
  16. Richter, Wolf. 2016. The Art Market is a ‘Catastrophe’. Business. Insider. Available online: https://www.businessinsider.com/the-art-market-is-a-catastrophe-2016-5?r=US&IR=T (accessed on 20 October 2021).
  17. Small, Zachary. 2021. As Auctioneers and Artists Rush into NFTs, Many Collectors Stay Away. New York Times. Available online: https://www.nytimes.com/2021/04/28/arts/design/nfts-art-collectors-copyright.html (accessed on 20 October 2021).
  18. Solimano, Andres. 2019. The Art Market at Times of Economic Turbulence and High Inequality. European Investment Bank. Available online: https://institute.eib.org/wp-content/uploads/2019/06/Art-Market-Economic-Trubulence-Inequality-Paper-Solimano.pdf (accessed on 20 October 2021).
  19. The Economist. 2000. Sotheby’s and the Cybermasses: The Most Famous Name in the Art World Has Gone Online. Does It Know What It’s Doing? The Economist. January. Available online: https://www.economist.com/moreover/2000/01/27/sothebys-and-the-cybermasses (accessed on 20 October 2021).
  20. Thompson, Donald N. 2014. The Supermodel and the Brillo Box. Houndmills: Palgrave McMillan, pp. 137–38. [Google Scholar]
  21. Van Miegroet, Hans J., Kaylee P. Alexander, and Leunissen Fiene. 2019. Imperfect Data, Art Markets and Internet Research. Arts 8: 76. [Google Scholar] [CrossRef] [Green Version]
  22. Villa, Angelica. 2020. Top Three Houses See 79 Percent Year-over-Year Drop in Second Quarter of 2020: Report. Art Market Monitor. August. Available online: https://www.artmarketmonitor.com/2020/08/05/top-three-houses-see-79-percent-year-over-year-drop-in-second-quarter-of-2020-report/ (accessed on 27 June 2021).
  23. Vogel, Carol. 1999. Sotheby’s and Amazon.com Strike a Deal to Sell on line. New York Times. June. Available online: https://www.nytimes.com/1999/06/17/business/sotheby-s-and-amazoncom-strike-a-deal-to-sell-on-line.html (accessed on 20 October 2021).
  24. Wilson, Martin. 2019. Art Law and the Business of Art. Cheltenham: Edward Elgar Publishing, pp. 164–71. [Google Scholar]
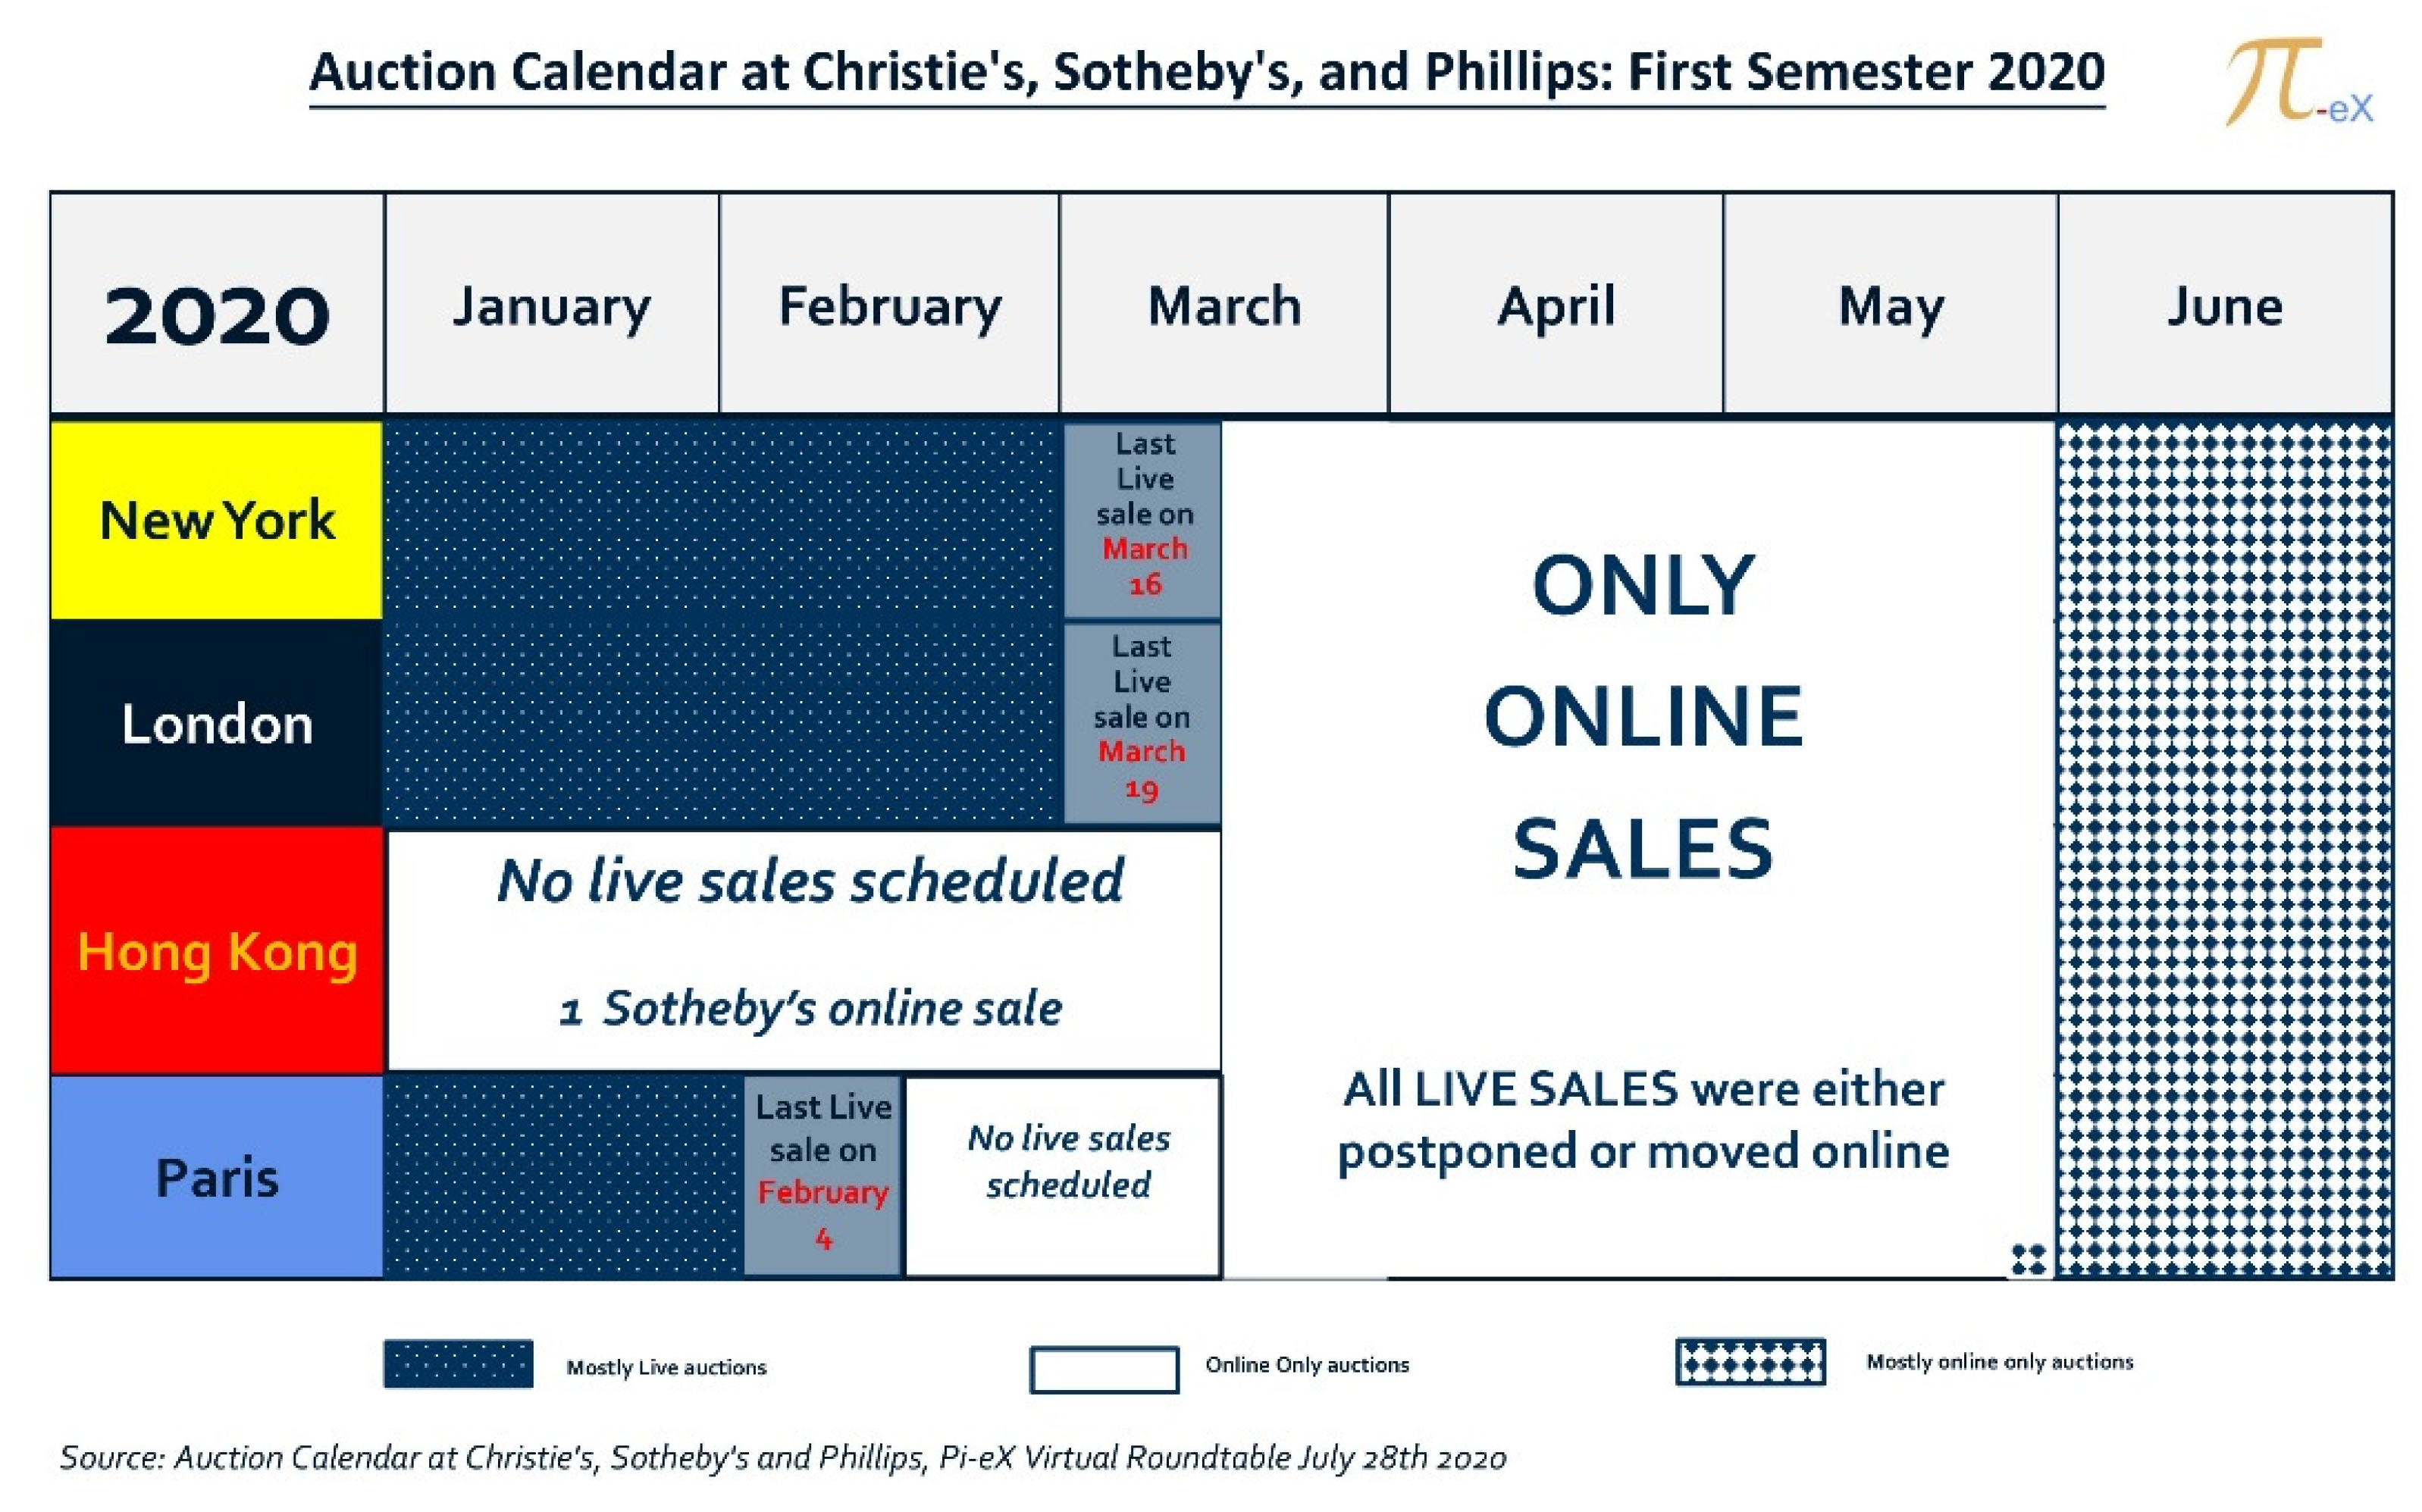
Figure 1. Auction calendar at top three auction houses for the first semester 2020.
Arts 10 00074 g001
Figure 2. Number of auctions by format (live or online only) arranged by top three auction houses from January 2019 to June 2020.
Arts 10 00074 g002
Figure 3. Number of auctions by format (live or online only) arranged by top three auction houses over the first semester (from 2015 to 2020).
Arts 10 00074 g003
Figure 4. Twelve-month rolling total number of online only auctions arranged at Christie’s, Sotheby’s, and Phillips (from 2017 to end of June 2021).
Arts 10 00074 g004
Figure 5. Online auctions at Christie’s, Sotheby’s, and Phillips as a percentage of the 12-month rolling total number of auctions arranged (from January 2017 to end of June 2021).
Arts 10 00074 g005
Figure 6. Twelve-month rolling total revenue from live and online only auctions arranged at Christie’s, Sotheby’s, and Phillips (from January 2017 to end of June 2021).
Arts 10 00074 g006
Figure 7. Online only versus live Marquee Contemporary and Impressionist Day Sales in May in New York at Sotheby’s (from 2017 to May 2021).
Arts 10 00074 g007
Figure 8. Comparison between Beeple’s NFT auction (11 March 2021) and Christie’s worldwide monthly results in January and February 2021.
Arts 10 00074 g008
Figure 9. Crisis comparison of impact on public auction revenue (3) at Christie’s, Sotheby’s, and Phillips; 2008–2009 crisis versus COVID-19 crisis—as of end of June 2021.
Arts 10 00074 g009
Figure 10. Crisis comparison of impact on public auction revenue at Christie’s, Sotheby’s, and Phillips: 2016 crisis versus COVID-19 crisis—as of end of June 2021.
Arts 10 00074 g010
Table 1. Date of last and first live auction before and after the first Covid lockdowns. Source: Pi-eX Ltd. proprietary database of auction results.
CityLast Live Auction before First Covid LockdownFirst Live Auction after First Covid Lockdown
New York16 March 202018 June 2020
London19 March 202010 June 2020
Hong Kong8 December 20195 June 2020
Paris4 February 202026 May 2020
Table 2. Number of auctions by format (live or online only) arranged by top three auction houses from January 2019 to June 2020. Source: Pi-eX Ltd. proprietary database of auction results.
Number of Auctions Arranged by Christie’s, Sotheby’s, and PhillipsLive
Auctions
Online only
Auctions
# per Month% of Total# per Month % of Total
Jan-192184%416%
Feb-191552%1448%
Mar-195478%1522%
Apr-196185%1115%
May-197877%2323%
Jun-196078%1722%
Jul-193156%2444%
Aug-19113%788%
Sep-193966%2034%
Oct-198686%1414%
Nov-199679%2621%
Dec-196267%3133%
Jan-201878%522%
Feb-201350%1350%
Mar-201240%1860%
Apr-2000%30100%
May-2035%5695%
Jun-202723%8977%
Table 3. Number of auctions by format (live or online only) arranged by top three auction houses over the first semester (from 2015 to 2020). Source: Pi-eX Ltd. proprietary database of auction results.
Number of Auctions Arranged by Christie’s, Sotheby’s, and PhillipsLive
Auctions
# per Month % of Total
Online Only
Auctions
# per Month % of Total
First Semester 2015343100% 0%
First Semester 2016332100% 0%
First Semester 201731696%144%
First Semester 201827985%4815%
First Semester 201928977%8423%
First Semester 20207326%21174%
Table 4. Twelve-month rolling total number of online only auctions arranged at Christie’s, Sotheby’s, and Phillips (from 2017–2021). Source: Pi-eX Ltd proprietary database of auction results.
12 Month-Rolling Total Number
of Online Only Auctions
MonthChristie’sSotheby’sPhillips
Jan-17
Feb-17
Mar-17
Apr-17
May-178
Jun-1714
Jul-1720
Aug-1724
Sep-1730
Oct-17391
Nov-17501
Dec-17611
Jan-18631
Feb-18673
Mar-18744
Apr-18795
May-18838
Jun-188313
Jul-1887181
Aug-1886192
Sep-1883252
Oct-1877363
Nov-1880453
Dec-1881575
Jan-1981595
Feb-1981666
Mar-1979756
Apr-1979797
May-1979877
Jun-1981908
Jul-1979999
Aug-19801018
Sep-19851069
Oct-198410410
Nov-198310810
Dec-198211410
Jan-208111610
Feb-208311310
Mar-208111711
Apr-208113215
May-208315820
Jun-2010620225
Jul-2013623625
Aug-2014625825
Sep-2015828827
Oct-2018432728
Nov-2019636229
Dec-2020540730
Jan-2121141530
Feb-2121342231
Mar-2122144431
Apr-2123545529
May-2123544525
Jun-2122242219
Table 5. Online auctions at Christie’s, Sotheby’s, and Phillips as a percentage of the 12-month rolling total number of auctions arranged at the top three auction houses (from January 2017 to end of June 2021). Source: Pi-eX Ltd. proprietary database of auction results.
12 Month-Rolling Total Number
of Auctions
MonthOnline AuctionsAll AuctionsOnline as a % of Total
Jan-17 6730%
Feb-17 6590%
Mar-17 6670%
Apr-17 6640%
May-1786691%
Jun-17146722%
Jul-17206723%
Aug-17246754%
Sep-17306814%
Oct-17406866%
Nov-17516887%
Dec-17626959%
Jan-18646879%
Feb-187069410%
Mar-187869811%
Apr-188468712%
May-189170013%
Jun-189669014%
Jul-1810670415%
Aug-1810770415%
Sep-1811070116%
Oct-1811671316%
Nov-1812872318%
Dec-1814373220%
Jan-1914574120%
Feb-1915375020%
Mar-1916075621%
Apr-1916576522%
May-1917376323%
Jun-1917977823%
Jul-1918779124%
Aug-1918979324%
Sep-1920080325%
Oct-1919880425%
Nov-1920180325%
Dec-1920681025%
Jan-2020780826%
Feb-2020680526%
Mar-2020976627%
Apr-2022872431%
May-2026168238%
Jun-2033372146%
Jul-2039781849%
Aug-2042984951%
Sep-2047387854%
Oct-2053992258%
Nov-2058791564%
Dec-2064297066%
Jan-2165697567%
Feb-2166697468%
Mar-21696102968%
Apr-21719108766%
May-21705112263%
Jun-21663109860%
Table 6. Twelve-month rolling total revenue from live and online only auctions arranged at Christie’s, Sotheby’s, and Phillips (from 2017–2021). Source: Pi-eX Ltd. proprietary database of auction results.
12 Month-Rolling Total Revenue
In USD (*)
MonthLive AuctionsOnline Only
Auctions
Online as a % of Total
Jan-17$9.2 B$ M0%
Feb-17$8.7 B$ M0%
Mar-17$9.7 B$ M0%
Apr-17$9.7 B$ M0%
May-17$10. B$4 M0%
Jun-17$9.9 B$9 M0%
Jul-17$9.9 B$18 M0%
Aug-17$9.9 B$21 M0%
Sep-17$10. B$25 M0%
Oct-17$10.3 B$33 M0%
Nov-17$11.4 B$44 M0%
Dec-17$11.4 B$57 M0%
Jan-18$11.3 B$58 M1%
Feb-18$11.6 B$64 M1%
Mar-18$11.4 B$71 M1%
Apr-18$11.4 B$76 M1%
May-18$12.6 B$87 M1%
Jun-18$12.6 B$101 M1%
Jul-18$12.5 B$106 M1%
Aug-18$12.4 B$106 M1%
Sep-18$12.5 B$111 M1%
Oct-18$12.5 B$115 M1%
Nov-18$12.1 B$120 M1%
Dec-18$12.1 B$133 M1%
Jan-19$12.2 B$133 M1%
Feb-19$12.1 B$135 M1%
Mar-19$11.9 B$143 M1%
Apr-19$11.8 B$146 M1%
May-19$10.9 B$155 M1%
Jun-19$10.9 B$148 M1%
Jul-19$10.9 B$154 M1%
Aug-19$10.9 B$156 M1%
Sep-19$10.7 B$163 M1%
Oct-19$10.9 B$161 M1%
Nov-19$10.3 B$164 M2%
Dec-19$10.2 B$165 M2%
Jan-20$10.3 B$167 M2%
Feb-20$10.3 B$175 M2%
Mar-20$9.7 B$189 M2%
Apr-20$9.1 B$224 M2%
May-20$6.2 B$289 M4%
Jun-20$5.9 B$439 M7%
Jul-20$7.3 B$552 M7%
Aug-20$7.3 B$582 M7%
Sep-20$7.2 B$634 M8%
Oct-20$7.7 B$727 M9%
Nov-20$5.7 B$844 M13%
Dec-20$6.3 B$945 M13%
Jan-21$6.3 B$975 M13%
Feb-21$5.8 B$998 M15%
Mar-21$6.5 B$1170 M15%
Apr-21$7.2 B$1261 M15%
May-21$9.5 B$1291 M12%
Jun-21$10.1 B$1264 M11%
(*) Not adjusted for inflation.
Table 7. Online only versus live Marquee Contemporary and Impressionist Day Sales in May in New York at Sotheby’s (from 2017 to May 2021). Source: Pi-eX Ltd. proprietary database of auction results.
Total Revenue in USD (*)Contemporary
Art
Impressionist & Modern Art
Sotheby’s New York May Marquee SalesLive Day SaleOnline Only Day SalesLive Day SaleOnline Only Day Sales
May-17$92.8 M $39.0 M
May-18$107.0 M $40.9 M
May-19$105.8 M $44.7 M
May-20$51.5 M$13.7 M$16.7 M$9.9 M
May-21$80.1 M $26.2 M
(*) Not adjusted for inflation.
Table 8. Comparison between Beeple’s NFT auction (11th March 2021) and Christie’s worldwide monthly results in January and February 2021. Source: Pi-eX Ltd. proprietary database of auction results.
20212020
Christie’sWorldwide Revenue (in US$) (*)# of Lots Catalogued at AuctionsWorldwide Revenue (in US$)# of Lots Catalogued at Auctions
January$28 M1745 $40 M954
February$20 M1303 $269 M1 170
(*) Not adjusted for inflation.
Table 9. 2008–2009 crisis versus COVID-19 crisis comparison of impact on public auction revenue at Christie’s, Sotheby’s, and Phillips (as of end of June 2021). Source: Pi-eX Ltd. proprietary database of auction results.
Crisis of 2008–2009
12-Month Rolling
Public Auction Revenue (Adjusted for Inflation)
Crisis of Covid-19
12-Month Rolling
Public Auction Revenue (Adjusted for Inflation)
Timeline in USD
(2) (3)
Indexed vs. October 2008 in USD
(2) (3)
Indexed vs. October 2019
Month 1 (1)$11.2 B100$9.1 B100
Month 2$9.5 B84$8.5 B94
Month 3$9.3 B83$8.5 B93
Month 4$9.3 B83$8.5 B93
Month 5$8.9 B80$8.6 B94
Month 6$8.8 B79$8. B88
Month 7$8.2 B74$7.6 B83
Month 8$6.5 B58$5.3 B58
Month 9$5.8 B52$5.2 B57
Month 10$5.4 B48$6.4 B70
Month 11$5.4 B48$6.4 B70
Month 12$5.2 B46$6.4 B70
Month 13$5.1 B46$6.8 B74
Month 14$5. B45$5.3 B58
Month 15$5.1 B46$5.9 B64
Month 16$5.2 B46$5.9 B65
Month 17$5. B45$5.5 B60
Month 18$5.1 B45$6.1 B68
Month 19$5.4 B48$6.8 B75
Month 20$6.3 B56$8.6 B94
Month 21$6.9 B62$9. B99
Month 22$7. B63
Month 23$7. B63
Month 24$7.1 B64
Month 25$7.4 B66
Month 26$8.4 B75
Month 27$8.6 B77
Month 28$8.6 B77
Month 29$8.7 B78
Month 30$8.9 B80
Month 31$9.1 B81
Month 32$9.4 B84
Month 33$9.6 B86
Month 34$9.6 B86
Month 35$9.6 B86
Month 36$9.6 B86
Month 37$9.6 B86
Month 38$9.6 B86
(1) Month 1 is October 2008 for the crisis of 2008–2009 and October 2019 for the COVID-19 crisis (2) Combined 12-month rolling worldwide revenue from public auction at Christie’s, Sotheby’s, and Phillips. (3) Revenue adjusted for inflation.
Table 10. Crisis comparison of impact on public auction revenue at Christie’s, Sotheby’s, and Phillips: 2016 crisis versus COVID-19 crisis—as of end of June 2021. Source: Pi-eX Ltd. proprietary database of auction results.
Crisis of 2016
12-Month Rolling
Public Auction Revenue (Adjusted for Inflation)
Crisis of Covid-19
12-Month Rolling
Public Auction Revenue (Adjusted for Inflation)
Timeline in USD
(2) (3)
Indexed vs October 2008 in USD
(2) (3)
Indexed vs October 2019
Month 1 (1)$12. B100$9.1 B100
Month 2$11.5 B96$8.5 B94
Month 3$11.6 B97$8.5 B93
Month 4$11.6 B97$8.5 B93
Month 5$11.2 B94$8.6 B94
Month 6$11. B92$8. B88
Month 7$11. B92$7.6 B83
Month 8$9.9 B83$5.3 B58
Month 9$9.5 B80$5.2 B57
Month 10$9.3 B78$6.4 B70
Month 11$9.2 B77$6.4 B70
Month 12$9.3 B77$6.4 B70
Month 13$9.1 B76$6.8 B74
Month 14$8.3 B69$5.3 B58
Month 15$8. B67$5.9 B64
Month 16$8. B67$5.9 B65
Month 17$7.6 B63$5.5 B60
Month 18$8.4 B70$6.1 B68
Month 19$8.4 B70$6.8 B75
Month 20$8.6 B72$8.6 B94
Month 21$8.5 B71$9. B99
Month 22$8.5 B71
Month 23$8.6 B72
Month 24$8.6 B72
Month 25$8.9 B74
Month 26$9.7 B81
Month 27$9.8 B82
Month 28$9.7 B81
Month 29$9.9 B83
Month 30$9.8 B82
Month 31$9.7 B81
Month 32$10.7 B89
Month 33$10.6 B89
Month 34$10.6 B89
Month 35$10.5 B88
Month 36$10.6 B88
Month 37$10.5 B88
Month 38$10.2 B85
(1) Month 1 is October 2015 for the crisis of 2016 and October 2019 for the COVID-19 crisis (2) Combined 12-month rolling worldwide revenue from public auction at Christie’s, Sotheby’s, and Phillips. (3) Revenue adjusted for inflation.
Publisher’s Note: MDPI stays neutral with regard to jurisdictional claims in published maps and institutional affiliations.