Article

A Solar Thermal Application for Mongolian Detached Houses: An Energy, Environmental, and Economic Analysis Based on Dynamic Simulations

1
Department of Architecture and Industrial Design, University of Campania Luigi Vanvitelli, 81031 Aversa, Italy
2
School of Engineering and Applied Science, National University of Mongolia, Ulaanbaatar 14201, Mongolia
3
Graduate School of Bio-Applications and Systems Engineering, Tokyo University of Agriculture and Technology, Tokyo 184-8588, Japan
*
Author to whom correspondence should be addressed.
Buildings 2019, 9(8), 185; https://doi.org/10.3390/buildings9080185
Submission received: 28 June 2019 / Revised: 2 August 2019 / Accepted: 7 August 2019 / Published: 14 August 2019

Abstract

:
Ulaanbaatar (Mongolia) is the coldest capital city in the world with approximately 98% of its heating demand satisfied by means of coal-burning stoves. This leads to enormous air pollutant emissions, with Ulaanbaatar being one of the top five most polluted cities in the world. In this study, an innovative solar hybrid heating system for the Mongolian scenario was used, which was based on the operation of a solar field composed of four series-connected evacuated tube heat pipe collectors, coupled with a thermal energy storage. The solar hybrid heating system was simulated and analyzed using the software TRNSYS. The simulations were designed to satisfy the heating demand of a typical single-family detached house located in Ulaanbaatar and were carried out with and without considering the soiling effects on the solar system operation. The overall performance of the proposed plant was compared with those associated with different fossil fuel-based Mongolian conventional heating systems, in order to assess the potential energy, environmental and economic benefits. The results highlighted that the proposed plant allowed for the obtainment of significant reductions in terms of primary energy consumption (up to 34.6%), global CO2 equivalent emissions (up to 52.3%), and operating costs (up to 49.6%), even if the expected return on the investment could be unacceptable.

1. Introduction

The use of raw coal for heating purposes in detached houses is still in practice, especially in cold regions. Mongolia is one of the coldest regions in the world and its heating demand during the winter is very relevant. In Mongolia, approximately 45% of the total population lives in the capital city of Ulaanbaatar; approximately 60% of the total households are located in the Ger districts of Ulaanbaatar, with approximately 98% of them using raw coal to satisfy the overall heating demand [1]. The significant use of raw coal during the winter leads to catastrophic air pollutant emissions, including carbon dioxide, sulphur dioxide, nitrogen oxides, and particulate matter, with Ulaanbaatar being one of the top five most polluted cities in the world [2]. The data collected by the Government of Mongolia highlighted how the pollution levels were several times higher than the recommended daily average concentration, with very serious potential health consequences (particularly for children) [2].
Given the considerable negative impact of air pollution, greater efforts are needed to prevent and treat the health impacts in Ulaanbaatar. A holistic approach to tackle the issue is mandatory, urging stakeholders to invest not only in immediate measures to reduce the impacts of air pollution on health, but also in cleaner energy solutions to be adopted in a sustainable way.
In Ulaanbaatar, the most economically and technically feasible solution to be implemented for replacing the coal-based heating systems is using an electric heater. However, this option has the following disadvantages [3]:
  • Electric heaters increase the electric peaks demand by a significant amount during the cold period causing frequent blackouts, which are currently one of the most relevant problems in Mongolia [4].
  • The annual current expenses associated with the use of electric heaters are relatively high for people who live in a detached house, in comparison with those associated with the adoption of a coal-burning stove.
  • The maximum power load for households in the Ger districts of Ulaanbaatar is generally lower than 4 kW [5]. Therefore, using a fully electric heating system would require upgrading the power level supplied by the local electric utility to the end-users.
  • Centralized power plants in Mongolia use coal to produce electricity, which implies that the application of electric heaters does not contribute to the reduction of global CO2 equivalent emissions (even if it decreases the local air pollution), in comparison to distributed coal-burning stoves with a greater conversion efficiency.
Solar energy, as a pollution-free, inexhaustible, and affordable energy resource, is considered one of the most promising options for both energy-saving as well as the reduction of harmful emissions at global and local levels. However, the Mongolian government is not strongly supporting solar thermal systems, mainly because of the huge investments involved. In addition, it should be highlighted how there is a significant lack of studies that have assessed the operation of such systems in cold regions (even though the performance of solar applications is greatly affected by climatic conditions). With reference to this last point, it can be noticed how a demonstration house in Ulaanbaatar that optimized solar energy gains by incorporating energy efficient techniques and passive solar elements into its design was built and analyzed by Dawes et al. [6]. A solar heating system integrated with a thermal energy storage tank filled with a phase-change material and combined with finned heat pipes was developed for Mongolian cities by Bai et al., who then also experimentally studied these systems [7]. Mori and Kawamura [8] investigated the performance of a solar water heating system combined with a heat-pump unit from both experimental and simulation points of view, while operating in a cold region. Therefore, the review of the current literature shows how the exploitation of solar energy for heating purposes in cold regions has been poorly investigated and additional studies are required to explore its potential.
Numerous studies have analyzed and compared the performance of different types of solar collectors, which have highlighted how evacuated tube collectors are more appropriate in cold and harsh regions, when compared to other technologies [9,10,11,12]. However, Ayompe et al. [13] have stated that the on-site thermal performance of the evacuated tube solar collectors has yet to be well-investigated, especially in cold and harsh cities. There are three common types of evacuated tube solar collectors [14]—(a) water-in-glass evacuated tube solar collectors, (b) U-type evacuated tube solar collectors, and (c) evacuated tube heat pipe solar collectors. In comparison to the other types of evacuated tube collectors, evacuated tube heat pipe collectors show a reduced efficiency, but lower pressure drops and, in addition, are easier to install and maintain [15,16,17].
Several external factors relating to the geographical location and environmental conditions can have a significant impact on the performance of a solar-energy system. Among them, soiling is a commonly overlooked or underestimated issue that can be a bind for the viability of a solar installation. The reduction in solar intensity reaching the solar converter due to the soiling effect has been evaluated and documented over the past five decades, and this reduction can typically be in the range of 20% to 50%, or even more [18]. Several analyses have been carried out to evaluate the soiling effect on the performance of photovoltaic systems [19,20,21] and flat plate collectors [22,23,24], however, studies focusing on evacuated tube collectors are relatively poor. El-Nashar [25] investigated the impact of dust deposition on two evacuated tube collector blocks (with each block consisting of 168 panels connected together in a series/parallel arrangement) and found that the daily amount of heat collected by a dusty block could drop to 60%–70% of its initial value, if left without cleaning for a whole year. El-Nashar [26,27] also assessed the influence of dust deposition on the operating performance of a solar desalination plant in Abu Dhabi from the experimental and simulation points of view. The results showed that distillate production can drop by approximately 40% when the transmittance of the glass tubes drops from its clean condition value of 0.98 to a very dusty value of 0.70. An empirical correlation for calculating the reduction in light transmittance has been identified. No studies investigating the effects of dust deposition on the performance of evacuated tube solar thermal collectors operating in cold areas with a great deal of air pollution (such as Mongolia) are available in current literature, except the work performed by the authors [28] where a method capable of predicting the dust deposition rate and the related change in transmittance of glass tubes, using weather data, has been developed and validated based on long- and short-term experimental tests performed in Ulaanbaatar.
In this paper, a solar hybrid heating system mainly consisting of: (i) A sensible thermal energy storage with a single internal heat exchanger; (ii) a solar field composed of four series-connected evacuated tube heat pipe collectors thermally interacting with the tank through the internal heat exchanger; (iii) an auxiliary electric heater immersed in the storage; (iv) a low-pressure coal-burning stove has been modelled, simulated and analyzed by means of the commercial TRaNsient SYStems (TRNSYS) software platform (version 17) [29]. The system is devoted to satisfying the heating demand of a typical single-family detached house situated in the Chingeltei Ger district of Ulaanbaatar city in Mongolia during the entire heating season. The simulations were performed also considering the effects of dust deposition on the overall performance of the solar system by means of a method able to predict the dust deposition rate and the related change in transmittance of glass tubes developed and validated by the authors based on long- and short-term experimental tests performed in Ulaanbaatar.
The results have been compared with those associated with different fossil fuel-based conventional heating systems (representative of solutions commonly used in Mongolian residences) in terms of: (a) Primary energy consumption; (b) consumption of coal; (c) global carbon dioxide equivalent emissions; (d) operating costs according to the Mongolian scenario.
The main aims of the paper can be summarized as follows:
  • To propose an innovative solar thermal system for Mongolian applications potentially capable of mitigating the energy, environmental and economic effects of traditional Mongolian heating systems;
  • To develop a simulation model to predict the performance of the proposed solar thermal system in Mongolia under different operating conditions and control logics;
  • To assess the feasibility of using solar thermal collectors during the heating period for Mongolian applications;
  • To estimate the degrading effects of dust deposition on the glazing of solar thermal collectors on the overall performance of the proposed heating plant;
  • To assess the potential benefits associated with the proposed plant with respect to the current Mongolian scenario from energy, environmental and economic points of view.
The final simulation results highlighted how, in comparison to the Mongolian conventional heating systems assumed as references, the proposed solar system is able to achieve significant reductions in terms primary energy consumption, the amount of burned coal, global carbon dioxide equivalent emissions as well as the operating costs (even if the expected return on investment could be unacceptable). In addition, this study revealed that the effects of dust deposition on evacuated tube heat pipe collectors on the overall energy, environmental and economic performances of the proposed heating plant are very relevant.

2. Description of the Proposed Plant

Figure 1 shows the scheme of the system configuration analyzed in this study.
The proposed plant basically consists of a sensible thermal energy storage (TES) with a single internal heat exchanger (IHE), solar field collectors (SFC) composed of four series-connected evacuated tube heat pipe panels thermally interacting with the tank through the internal heat exchanger, an auxiliary electric heater (EH) immersed in the storage, a low-pressure coal-burning stove (COS), four parallel-connected radiators (RAD), a solar circuit pump (SP), a radiators circuit pump (RP) and 7 thermostats (T).
Two different closed loops can be easily distinguished in Figure 1:
  • The solar thermal collectors circuit (including the solar thermal panels, the solar circuit pump and the heat exchanger immersed into the storage);
  • The space heating circuit (including the tank, the coal stove, the radiators circuit pump as well as the radiators).
The heat carrier fluid inside the solar thermal collectors circuit was a mixture (50%/50% by volume) of water and ethylene glycol (cwg = 3.26 kJ/kgK, ρwg = 1069.0 kg/m3) in order to protect the system from the ill effects of freezing, while pure water (cw = 4.19 kJ/kgK, ρw = 1000.0 kg/m3) flowed into the space heating loop.
The system aims to satisfy the space heating demand of a typical single-family detached house situated in the Chingeltei Ger district of Ulaanbaatar city in Mongolia (longitude: 106°54′ East; latitude: 47°57′ North).
The heating purposes were covered by heating the pure water contained in the storage. The solar thermal collectors, the coal-burning stove as well as the electric heater co-operate in order to guarantee the desired thermal comfort. The solar energy captured by the solar thermal collectors is transferred, through the heat exchanger IHE, into the thermal energy storage. From the tank, if there is a heating demand, the solar energy is transferred into the distribution network and then to the end-users for space heating purposes through the group of radiators installed inside the house and supplied by the storage. The coal stove as well as the electric heater are used to supplement the space heating demand when the solar energy collected and stored in the tank cannot meet the thermal energy requirements.
All the electric requirements were satisfied with the electricity supplied by the central grid.
The system was simulated using the commercial TRNSYS software platform (version 17) [29] developed by the University of Wisconsin. It is one of the most popular advanced dynamic building energy simulation programs [30,31,32], with it modelling every physical piece of the thermodynamic equipment with a component (named Type) that is a FORTRAN source code model. In this study, the component modules were selected from the TRNSYS libraries and enhanced by the measurements, the manufacturer performance data or information available in current scientific literature. The simulations were performed with reference to the duration of the heating season with a two-minute simulation time-step.
The proposed plant has been modelled and operated according to the on-site characteristics of a solar hybrid heating system, indicated as the Triple System, experimentally investigated by the authors in a previous paper [33] while serving the same Mongolian detached house.
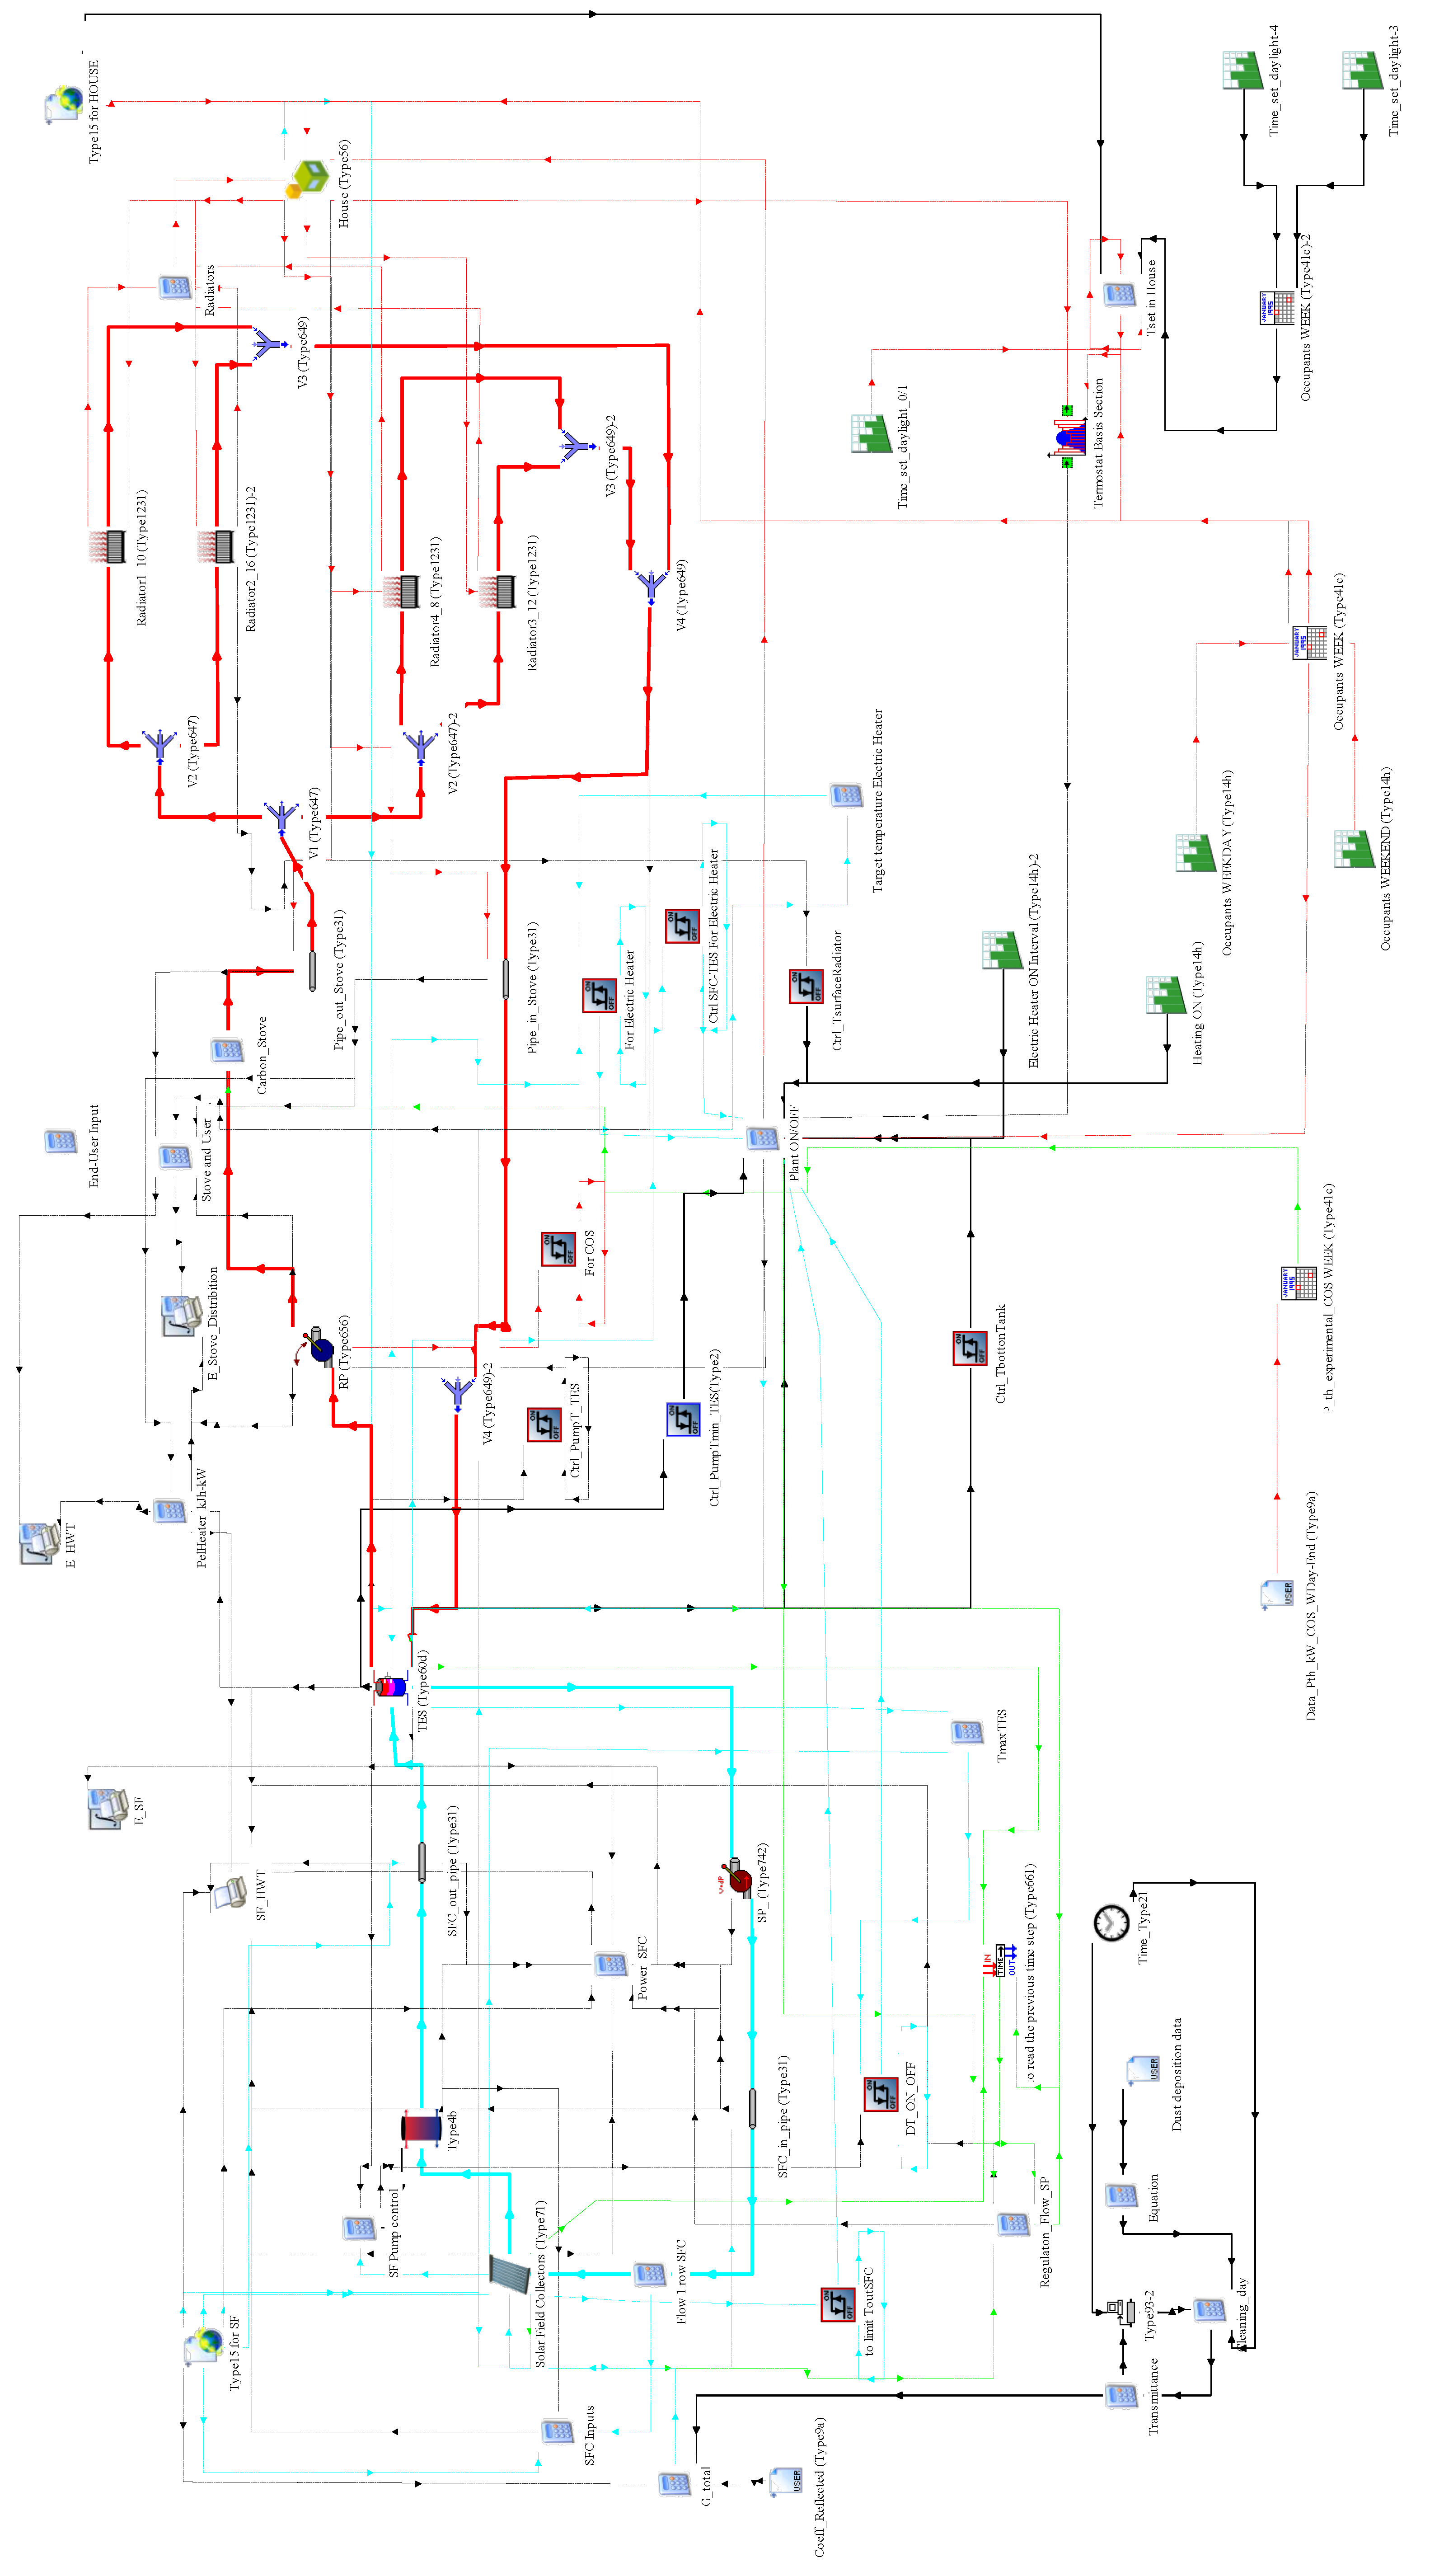
Figure 2 reports the screenshot of the project developed in the TRNSYS environment together with the main types used in this study. In the following sub-sections, the main characteristics of the system components together with the features of the TRNSYS Types as well as the control logics are described in detail.

2.1. Description of the Detached House

A typical single-family detached house, representative of the residential buildings currently in use in the Chingeltei Ger district of Ulaanbaatar in Mongolia, was investigated. The residence is composed of two main portions:
  • A base section, with a total floor area of 48 m2 and a volume of 144.0 m3;
  • An additional section, with a total floor area of 10 m2 and a volume of 22.1 m3.
Only the base section (where the low-pressure coal-burning stove as well as the radiators are located and installed) is heated, while the indoor temperature of the additional section is not controlled at any time. The additional section contains the thermal energy storage with the immersed electric heater and is separated by the base section through an internal wall.
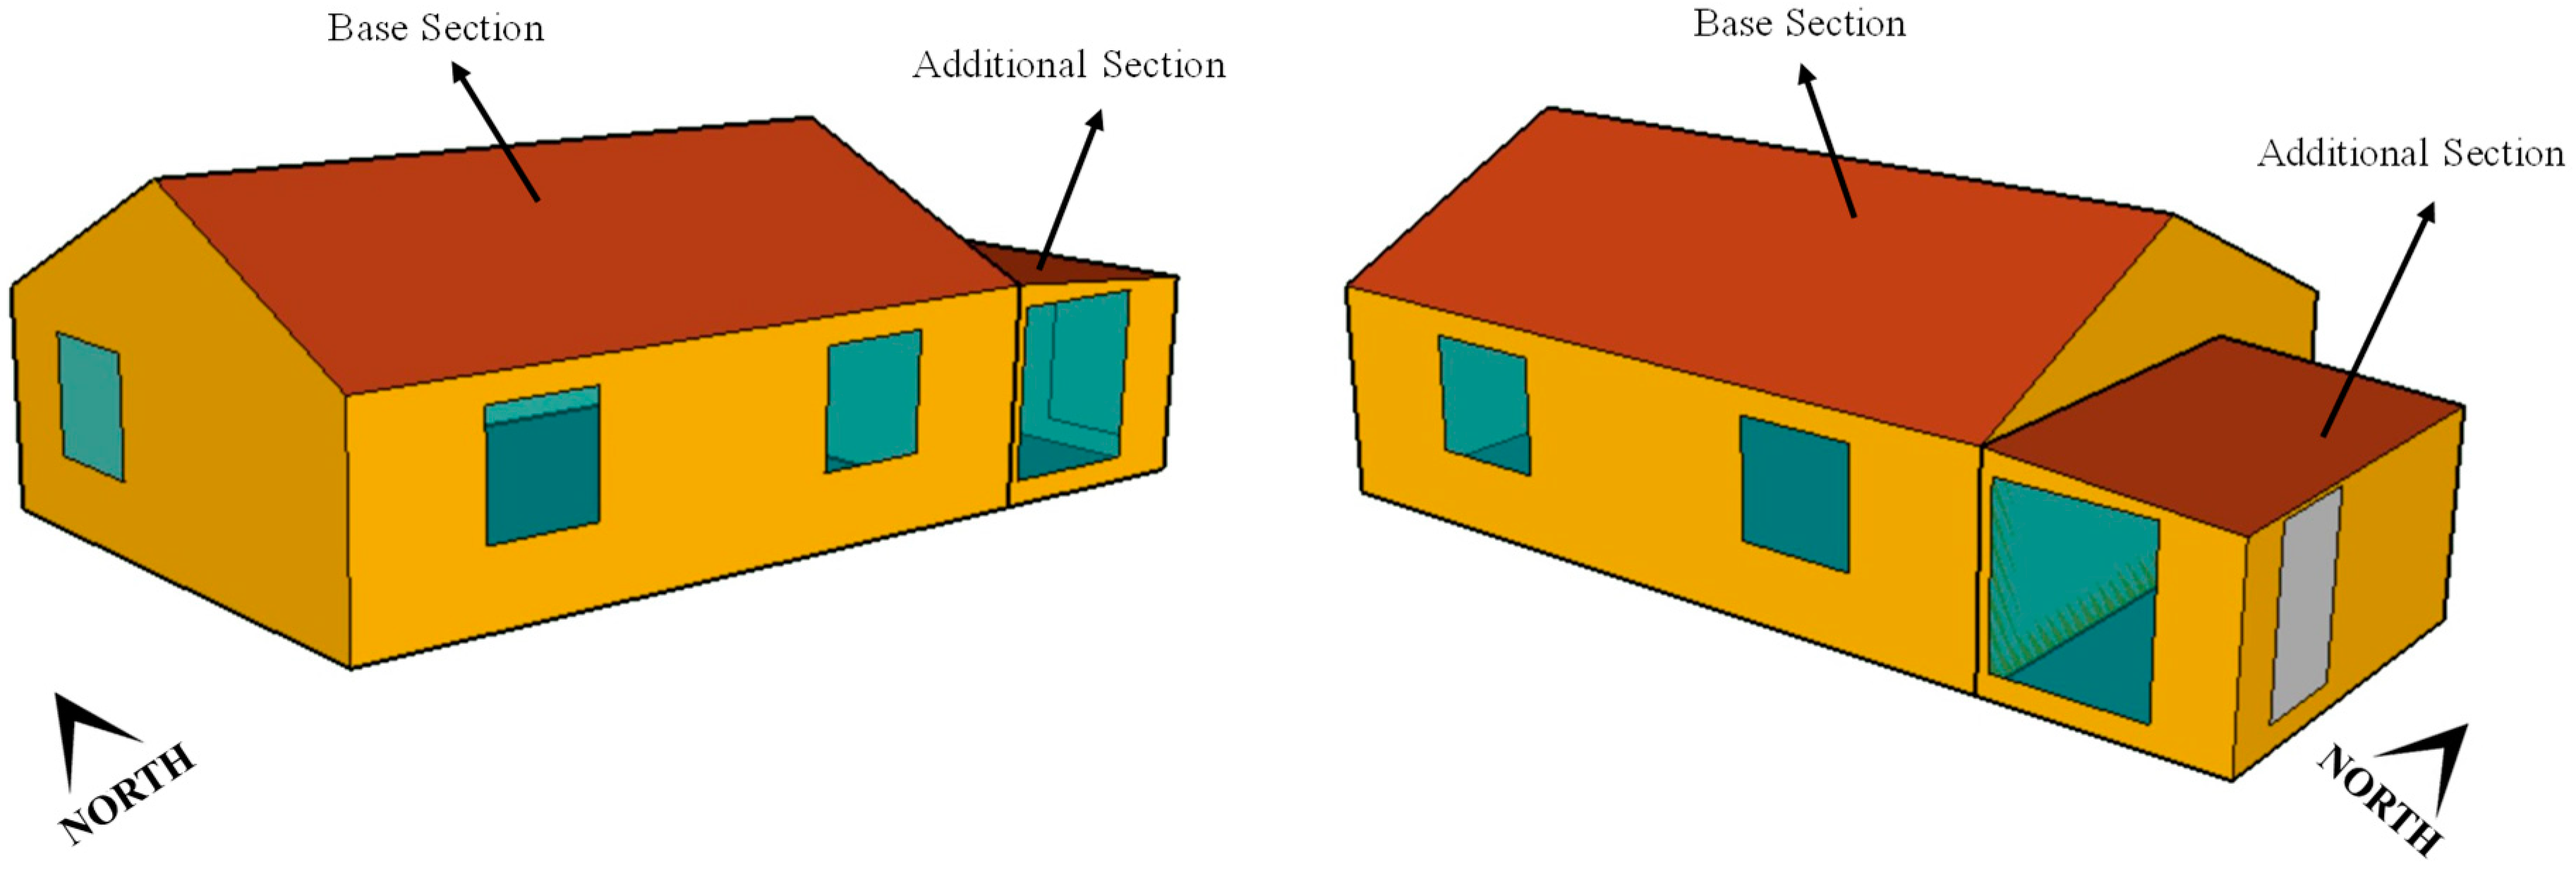
Figure 3 shows the model of the house (obtained by using the software SketchUp Pro [34]) where both the base and additional sections are highlighted.
The main characteristics of the external walls of the house are indicated in Table 1 and Table 2. In particular, the orientation, azimuth, surface slope, floor area, internal (absi,wall) and external (abse,wall) solar absorptances, internal (hi,wall) and external (he,wall) convective heat transfer coefficients, wall thermal transmittance (Uwall), material, thickness (s) and thermal conductivity (λ) of the layers were reported for each wall type. The values of hi,wall and he,wall were derived from the European Standard EN ISO 6946:2007 [35], while the values of λ were defined based on literature data.
The main characteristics of the windows of the base section are reported in Table 3. In particular, the orientation, azimuth, internal (hi,window) and external (he,window) convective heat transfer coefficients, frame transmittance Uframe, glazing transmittance Uglazing, window type, spacing gas, glazing width, spacing width, frame area Aframe and window (glazing + frame) area Awindow were specified.
The values of hi,window and he,window were obtained from the European Standard EN ISO 10077-1:2006 [36], while the other parameters were defined according to manufacturer data.
The house is equipped with two doors. The first door is facing East and is characterized by a total area of 1.8 m2 with a thermal transmittance equal to 2.5 W/m2K. The second door is placed internally between the base section and the additional section, with a total area of 2.9 m2 and a thermal transmittance equal to 2.5 W/m2K.
The air change of infiltration induced by the wind and stack effect on the building envelope was assumed equal to 1.6 h−1 for the base section as an average of the reference values suggested by Tong et al. [37] for Mongolian residential applications.
Figure 4a shows the assumed occupancy profiles, i.e., the number of occupants of the base section as a function of the time during weekdays and weekends. The profiles reported in Figure 4a are based on the on-site survey activities performed with reference to typical residences in the Chingeltei Ger district of Ulaanbaatar.
Sensible heat coming from each occupant was assumed equal to 65 W according to the values recommended by the Standard ISO 7730 [38].
The room temperature inside the base section was set to be kept at the values indicated in Figure 4b only from 7.00 a.m. to 11.00 p.m. (period with at least one occupant being inside the house in the case of the occupants are not sleeping) as a function of the outside temperature.
The duration of the heating period was assumed to be from 1 October up to 31 May.
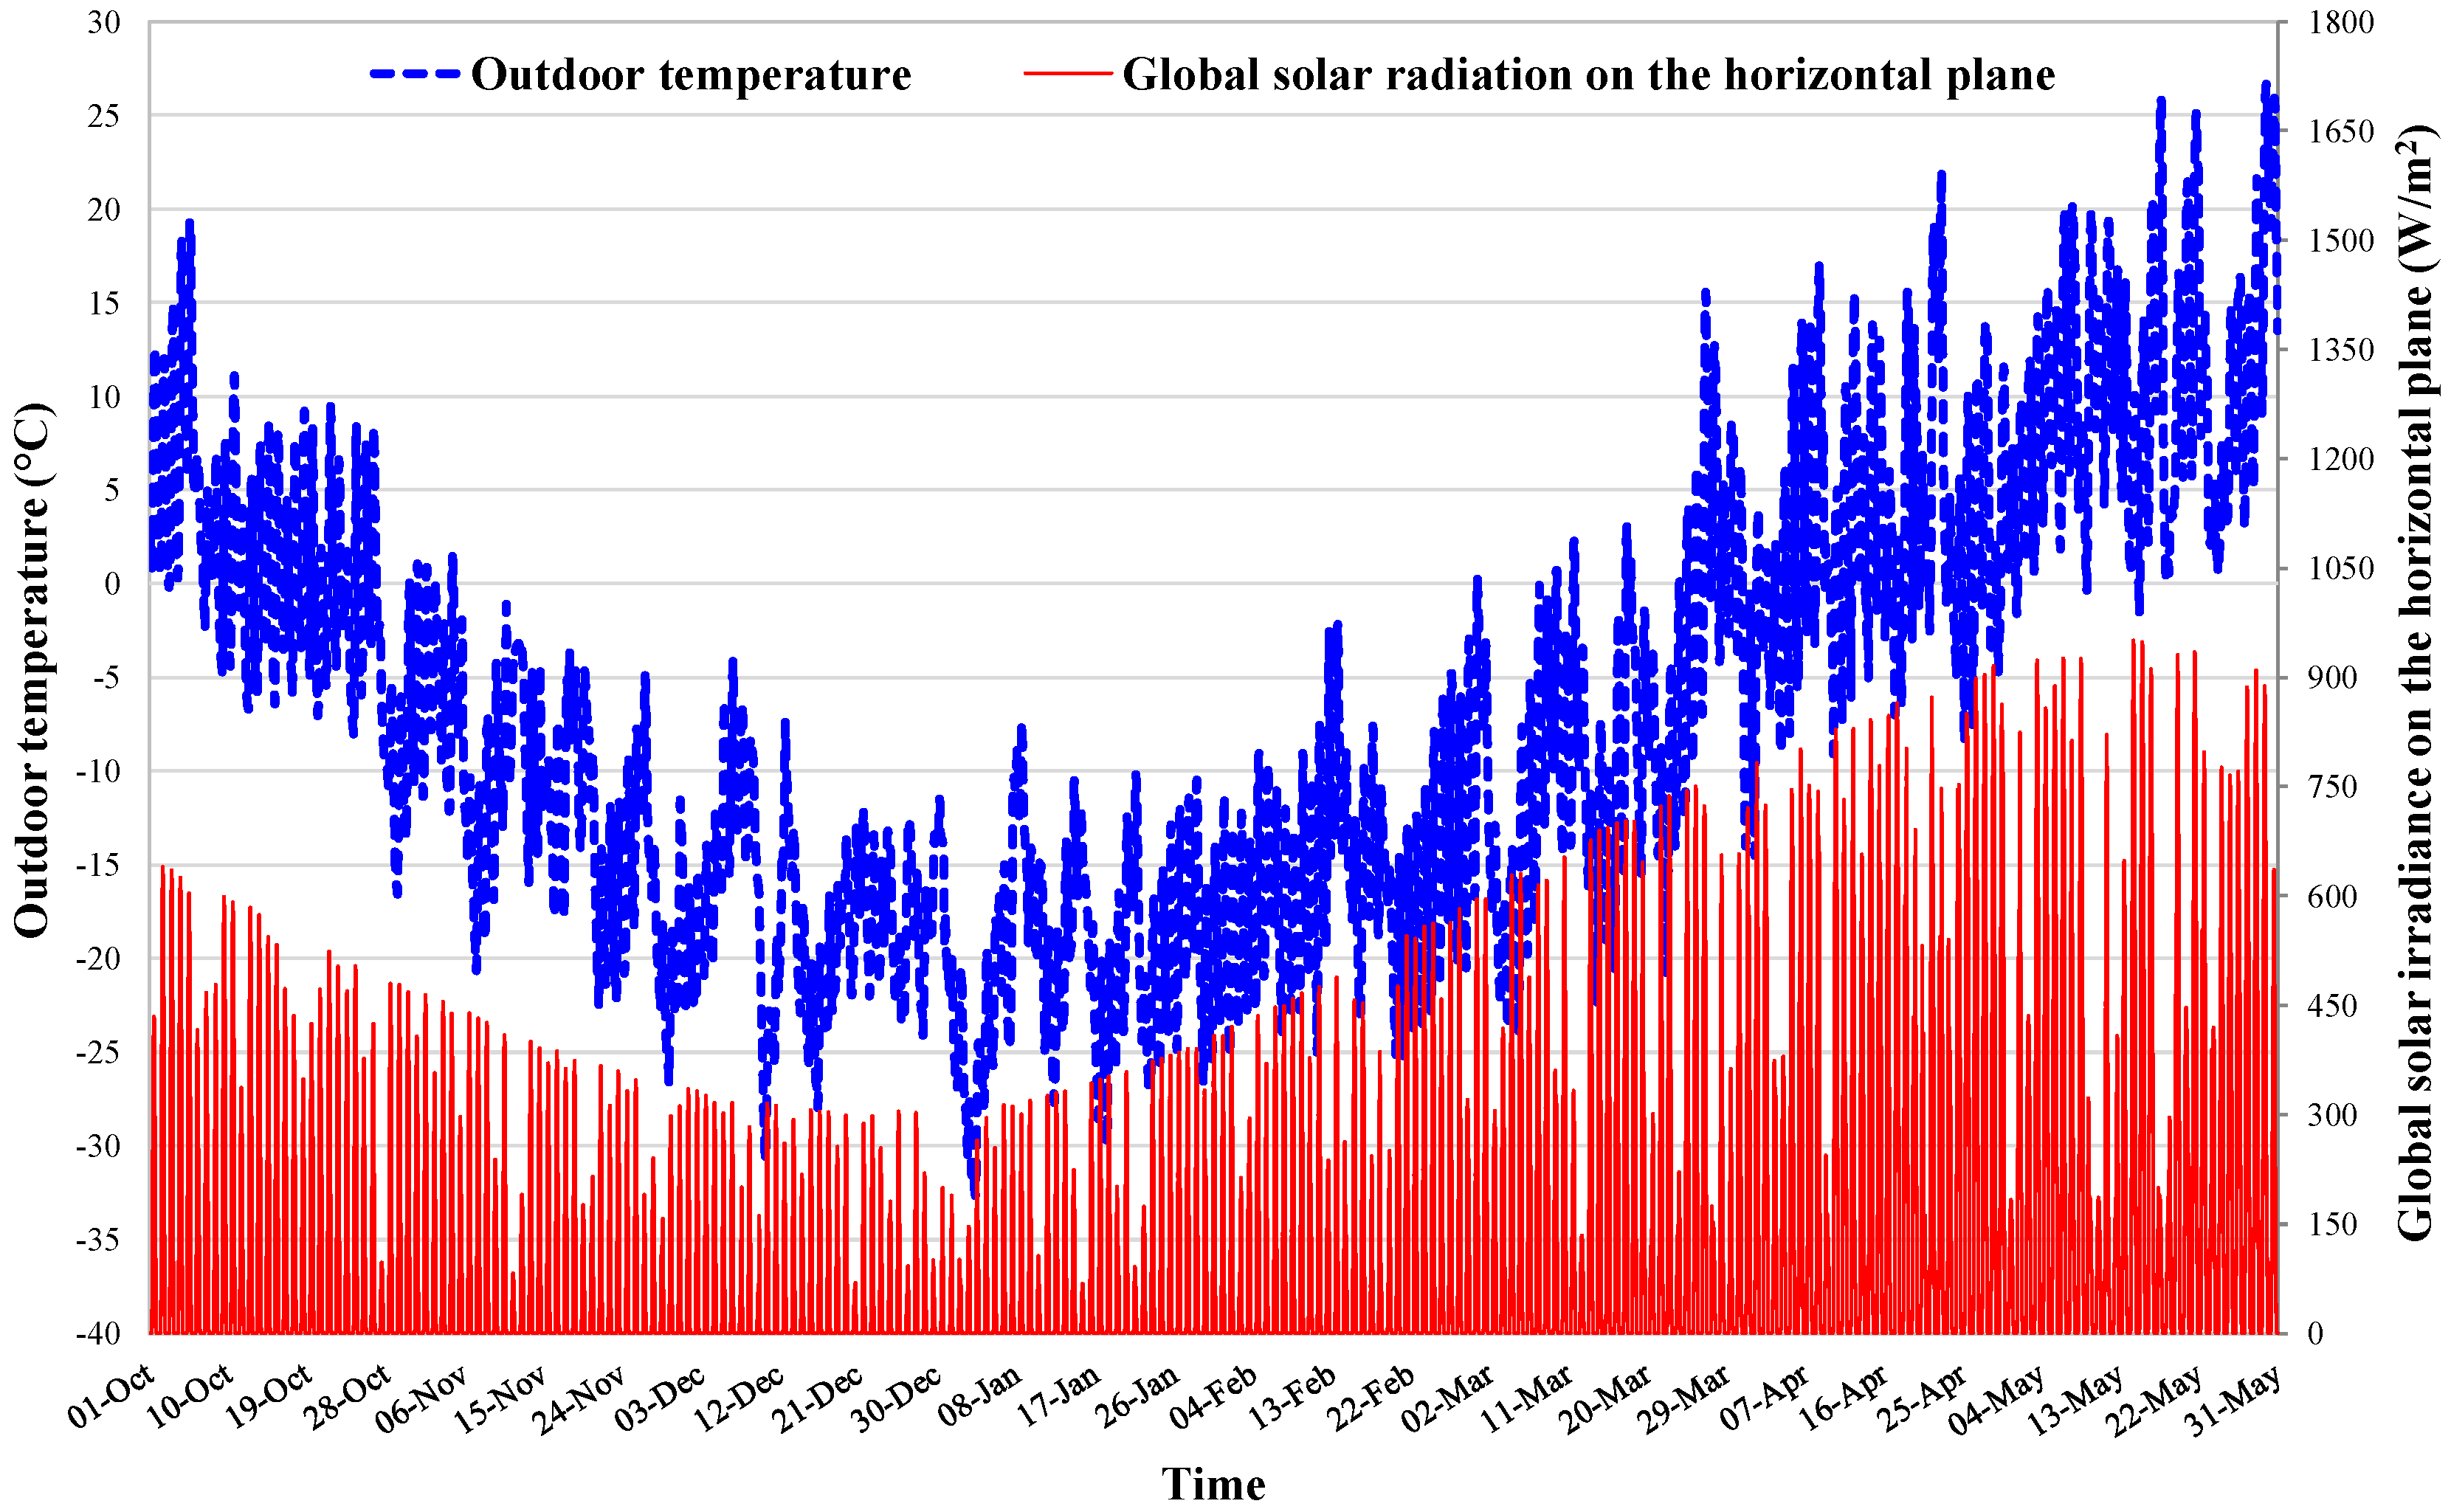
TRNSYS Type 56 (multi-zone building model) has been used to model and simulate the typical Mongolian detached house and related loads/gains. A specific EnergyPlus weather data file [39] was considered for modelling the weather data of Ulaanbaatar in terms of outdoor temperature and solar global irradiance (beam and diffuse). According to the above-mentioned weather data file, Figure 5 highlights how in Ulaanbaatar, the outside temperature is between −32.7 °C and +26.7 °C, while the maximum global solar irradiance on the horizontal plane is approximately 950 W/m2.

2.2. Description of the Thermal Energy Storage

A vertical cylindrical fluid-filled sensible energy storage (TES) equipped with an internal heat exchanger (IHE) allowing to store the solar energy recovered by the solar thermal collectors was adopted. The tank is characterized by one inlet and one outlet for the connection to the space heating circuit.
TRNSYS Type 534 was used to model and simulate the storage. This type is based on the assumption that the tanks can be divided into N fully-mixed equal sub-volumes. For each sub-volume, the transient state mass and energy balances are considered, making it possible to calculate the thermal stratification in the component. This instance further assumes that losses from each tank node are equal. In this paper, the storage was modelled with 10 isothermal temperature layers to better represent the thermal stratification, where the top layer was 1 and the bottom layer was 10.
The main characteristics of the tank are reported in Table 4.

2.3. Description of the Solar Thermal Collectors Circuit

The solar circuit is composed of four series-connected evacuated tube heat pipe collectors (SFC) manufactured by the Chinese company Jiangsu Sunrain Solar Energy Co., Ltd. (model TZ58-1800-30) [40]. The installation angle between the collectors’ surface and the horizontal plane is 60° with an azimuth equal to 10° (as in the experimental set-up). The total aperture area of the solar system is 11.36 m2.
TRNSYS Type 71 was used for modelling and simulating the performance of solar thermal collectors with their thermal efficiency ηSFC predicted by using the following formula:
η SFC = η 0 a 1 ( T m T amb ) / G a 2 ( T m T amb ) 2 / G
where Tamb is the external temperature, G is the global solar irradiance and Tm is the average temperature between the inlet (TSFC,in) and outlet (TSFC,out) of the solar thermal collectors. Based on the results of the experimental tests performed by the Institut für Thermodynamik und Wärmetechnik Universität Stuttgart [41] according to the European Standard EN 12975-2:2006 [42], the intercept efficiency η0, the first order efficiency coefficient a1 and the second order efficiency coefficient a2 are, respectively, 0.592, 1.889 W/m2K and 0.011 W/m2K2 with reference to the aperture area. The transverse and longitudinal incidence angle modifiers were also defined according to the information provided by the manufacturer. A fictional thermal energy storage is included into the TRNSYS project in order to take into account the thermal capacity of solar collectors. In particular, a fluid-filled fully-mixed sensible energy tank (modelled and simulated by means of TRNSYS Type 4b) with a volume of 216 L (loss coefficient equal to 1.889 W/m2K) was considered according to the thermal capacity (66.24 kJ/m2K) suggested by the manufacturer [40].
The experimental performance of the solar collector circuit was evaluated during October 2015 and April 2016 and then contrasted against the simulation results of the above-described model by the authors in a previous work [43]. The calibrated model exhibited a reasonable agreement when compared with the measured points with a percentage difference in terms of daily efficiency ranging between −5.8% and 11.7%. Therefore, it can be concluded that the TRNSYS model gives an accurate representation of the performance of solar thermal collectors during their operation under real conditions.
The dust deposition tests were conducted between October 2015 and May 2016 under the real environmental conditions in Ulaanbaatar [28]. The experiments highlighted that the daily glass tube transmittance during the ith day τi can be estimated by using the following formula:
τ i = τ i 1 ( A x i + B y i + C z 1 , i + D z 2 , i )
where τi−1 is the daily glass tube transmittance during the (i−1)th day, xi is the daily average PM10 emissions (mg/m3), i.e., the emissions of particles with aerodynamic diameters less than or equal to 10 m, during the ith day, yi is the daily average wind factor during the ith day, z1,i is the daily average rain rate (mm) during the ith day and z2,i is the daily average snow rate (mm) during the ith day; A, B, C and D are empirically-derived constants (A = 1.67 m3/mg, B = 101, C = −3.01 mm−1 and D = −2.69 mm−1).
All the variables in Equation (2) can be directly measured except the daily average wind factor yi. This parameter was calculated as follows:
y i = 1 N i = 1 N [ 1 e [ L ( S Q ) ] ] w
where N is the number of experimentally investigated glass tubes (N = 7), S is the wind speed (m/s), w is a factor indicating the wind direction (w=1 if the wind comes from South, South-East or South-West, while w = 0 for the other wind directions), L and Q are empirically-derived constants (L = −0.007 s/m, Q = 0.2 m/s) [28].
Equation (2) was validated against the measured data. According to the experimental measurements for clean tubes, the glass tube transmittance can assume a maximum value of 0.96 while the system is operating under clean conditions without the dust deposition.

2.4. Description of the Solar Thermal Collectors Circuit

The coal-burning stove (COS) is manufactured by the Mongolian company BURHANI GAL, Ltd (model: DULAAN-II) [44]. According to the catalogue data [44], the nominal thermal output is 6.0 kWth with a thermal efficiency equal to 71%. The thermal output of the stove was experimentally evaluated by the following formula:
P COS , th = V ˙ w ρ w c w ( T COS , out T COS , in ) = A v w ρ w c w ( T COS , out T COS , in )
where:
-
PCOS,th is the thermal power produced by the stove;
-
V ˙ w , ρw, cw and vw represent, respectively, the volumetric flow rate, the density, the specific heat and the velocity of the heat carrier fluid flowing inside the stove;
-
A is the area of cross section of the tube inside which the heat carrier fluid is flowing;
-
TCOS,out and TCOS,in are, respectively, the temperature of the heat carrier fluid at the inlet and outlet of the stove.
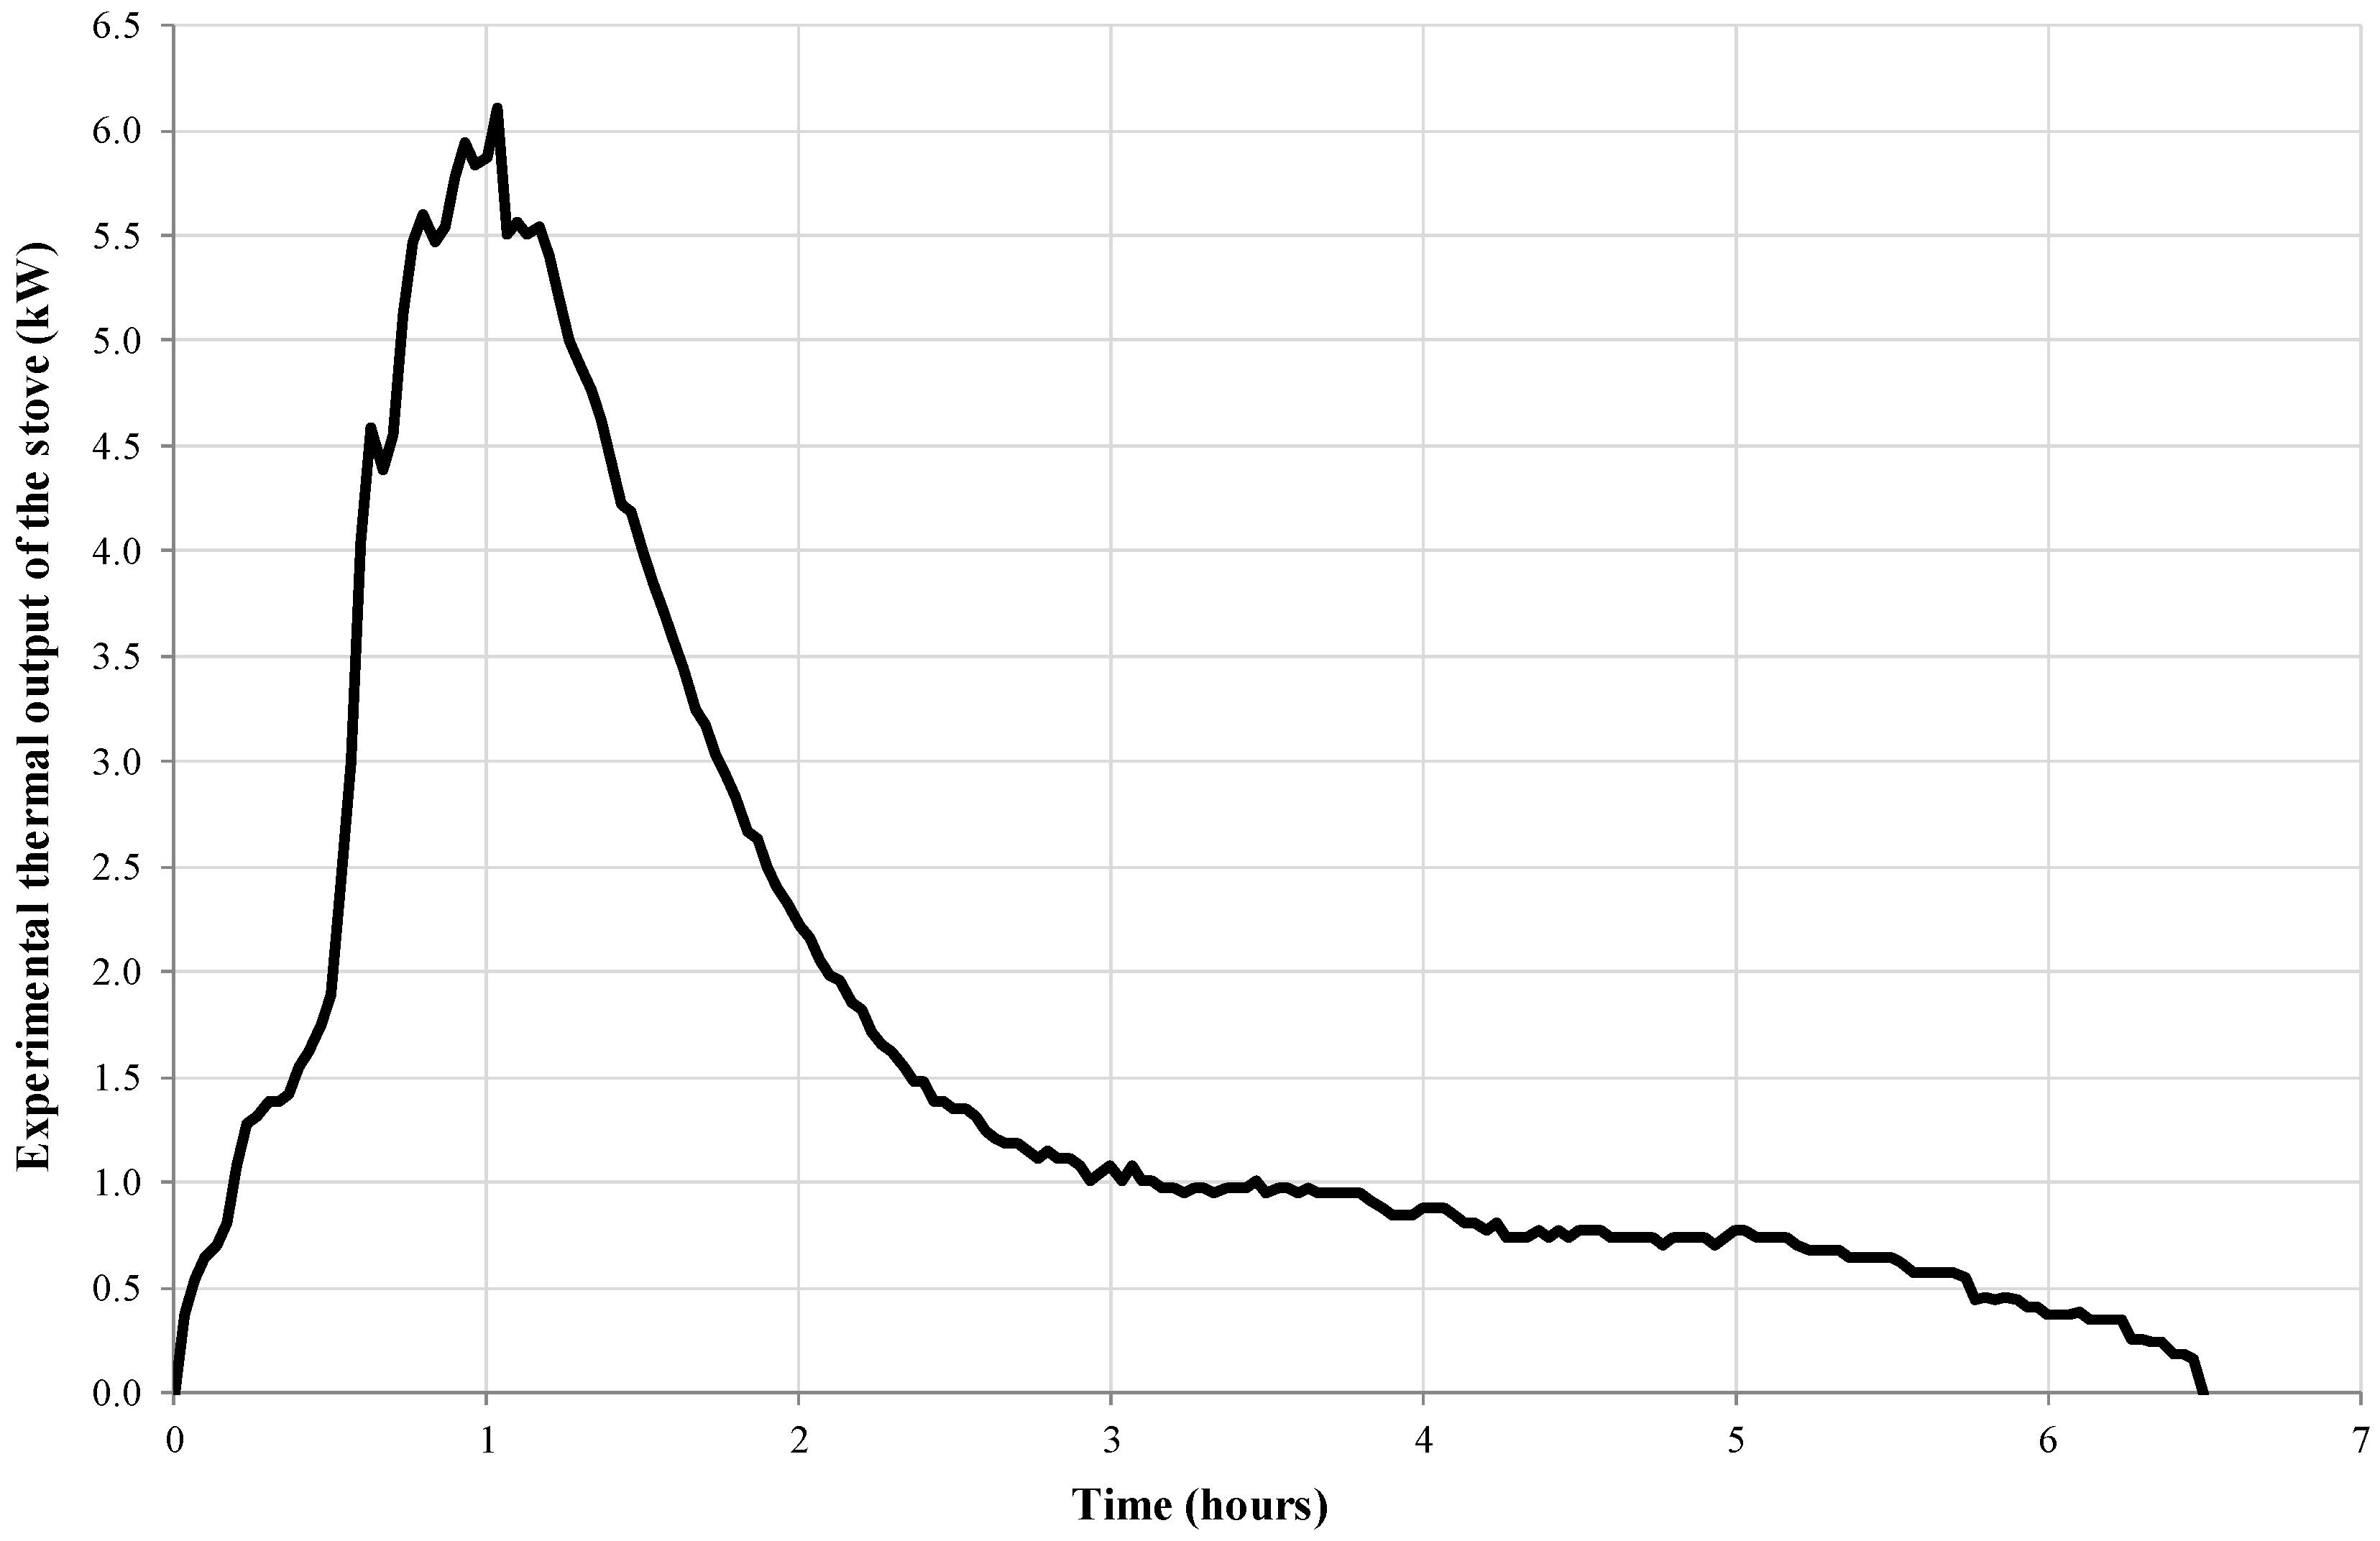
A specific experiment was performed in order to obtain the thermal output of the stove PCOS,th as a function of the time. In particular, the test was carried out by (i) fully charging the stove with the maximum allowed amount of stove before the start and (ii) then waiting for the complete consumption of the charged coal without recharging during the operation.
The values of ρw, cw and A were assumed equal to 1000 kg/m3, 4.19 kJ/kgK and 6.6 cm2, respectively. The values of vw were measured by means of a ultrasonic flowmeter (model TDS-100F) [45], while TCOS,out and TCOS,in were obtained by using Pt-100 temperature sensors [46].
Figure 6 reports the values of PCOS,th as a function of the time obtained from the experimental data. This figure highlights that the thermal output of the stove increases with the time up to a maximum value of approximately 6 kW (according to the manufacturer data [44]) and then decreases becoming equal to zero after approximately 6.5 hours of operation.
The uncertainty associated with the measured values was calculated by using the procedure suggested by the Guide to the expression of uncertainty in measurement [47]. According to [47], the uncertainty u associated with a measurand R that depends upon a number of input quantities R1, …, RN can be performed by the following formula:
u ( r ) = i = 1 N ( f / x i ) 2 u 2 ( x i )
where f is the functional relationship between R and R1, …, RN and r is an estimation of the measure and R is obtained by substituting the measured values r1, …, rN of the parameters R1,…, RN in the Equation (5). As a consequence, the relative uncertainty of PCOS,th can be calculated as follows by applying the propagation of uncertainties [48]:
u ( P COS , th ) / P COS , th = u 2 ( v w ) / v w 2 + u 2 ( T COS , out ) / ( T COS , out T COS , in ) 2 + + u 2 ( T COS , in ) / ( T COS , out T COS , in ) 2
According to the manufacturers data [45,46], the uncertainty associated with the measurement of vw is equal to 1% of the reading, while the measurement uncertainty of TCOS,out and TCOS,in is 0.3 °C. Therefore, the relative uncertainty of PCOS,th ranges from 2.5% up to 26.5%, with an average value equal to 12.9%.
The stove was simulated via TRNSYS Type 9a by assuming a simulated thermal output of the stove exactly equal to the experimental profile reported in Figure 6 where the stove is fully charged at the starting point and it is not recharged during the operation.
The heating rate of the auxiliary electric heater (EH) was set to 3.0 kWel by assuming that the consumed power was entirely converted into its thermal output. The electric resistance was positioned into the storage with a height above the bottom of 0.4 m.

2.5. Description of Radiators

The four parallel-connected aluminum radiators (RAD) commercialized by the Italian company Fondital S.p.A. (model: Calidor Super Aleternum) [49] were installed inside the base section of the house as terminal hydraulic units. They were supplied by the thermal energy storage and supplemented by the coal-burning stove.
The radiators were modelled by using TRNSYS Type 1231. In particular, each single radiator is composed of 24 sections and it is characterized by a design capacity of 5434.6 kJ/h with a design delta-T exponent of 1.3268 (in the case of design surface temperature and design air temperature equal to 50 °C and 20 °C, respectively).

2.6. Description of Auxiliaries

A single pair of supply and return pipes was used for both the solar thermal collector circuit as well as the space heating circuit.
The pipe connecting the thermal energy storage with the inlet of the solar thermal collector circuit has a length of 15 m and an inner diameter of 0.017 m, while the pipe from the outlet of the solar field to the tank is characterized by a length of 11 m with an inner diameter of 0.017 m. Both pipes of the space heating circuit were modelled with a length of 30 m and an inner diameter of 0.025 m.
TRNSYS Type 31 was used to model and simulate the pipes and calculate the related heat losses by considering a loss coefficient equal to 7.64 kJ/(hm2K).
The solar circuit pump was modelled as a variable speed pump (with a volumetric flow rate ranging between 2.0 and 6.6 l/min/collector) by using TRNSYS Type 742, while TRNSYS Type 656 was used for modelling and simulating the single-speed pump (with a mass flow rate equal to 540 kg/h) of the space heating circuit. The electricity consumption of both pumps is assumed equal to 93 W during operation.

2.7. Description of Control Logics

The operation strategies used in this study for the proposed system are summarized in Table 5, Table 6 and Table 7. The logics controlling the operation of main components are defined according to the usual operation in Mongolian residential applications.
The control strategies of the solar circuit pump are defined according to the one suggested by the manufacturer of the solar thermal collectors [40]. In particular, during normal operation (i.e., temperature at the outlet of the solar thermal collectors TSFC,out < 130 °C and temperature at top of thermal energy storage TTES,top < 80 °C), the activation of the solar circuit pump is based on the switch-on temperature difference ∆TON equal to the difference between the current values of the temperature at the outlet of the solar field TSFC,out and the temperature at node 6 of thermal energy storage TTES,6. In particular, the solar circulation pump is triggered and the volumetric flow rate reaches its minimum value (2.0 l/min/collector) in the case of ∆TON ≥ 8 °C. Then, the volumetric flow rate of the solar circuit pump is adjusted between 2.0 l/min/collector and 6.6 l/min/collector depending on the standard temperature difference (STD) between the inlet and outlet of the internal heat exchanger (IHE) immersed in the thermal energy storage. When the STD becomes higher than 8 °C, the speed of the pump is increased by 0.2 l/min automatically (under the precondition that the maximum flow rate is not exceeded) trying to maintain STD = 8 °C. On the other hand, the volumetric flow rate is reduced by 0.2 l/min automatically (under the precondition that the minimum flow rate is not exceeded) if STD becomes lower than 8 °C (but larger than 4 °C). The solar circulation pump is switched off when ∆TON becomes lower than 4 °C.
In the case of the temperature at the outlet of solar collectors rising up to 130 °C, the solar circulation pump is stopped. Then, the pump restarts when the temperature of the fluid exiting the solar field drops to 120 °C. When the tank temperature at the top TTES,top becomes equal to 80 °C, the solar circulation pump is stopped. However, when the temperature at the collectors outlet rises up to 110 °C, the solar circulation pump is triggered again even if the tank temperature at the top is already at its maximum value (80 °C) and the pump works until TTES,top increases up to its emergency stop temperature of 95 °C.
The heat carrier fluid (pure water) can flow through the radiators (with a constant mass flow rate, defined according to the manufacturer data [49], equal to 540 kg/h) only from 7.00 a.m. up to 11.00 p.m. (the radiators pump is switched off out of this period) in the cases when there is a call for heat triggered by a thermostat installed inside the house. The room temperature is set to be kept at the values indicated in Figure 4b, with a dead band of 3.0 °C. This means that, as indicate in Table 5, when the room temperature Troom is 1.5 °C lower than the target room temperature Troom,target, the thermostat calls for heat from the tank. The call for a heat signal is disabled when Troom becomes 1.5 °C higher than Troom,target.
The electric heater can be operated only from 4.30 a.m. up to 11.00 p.m. (it is not used out of this period) in order to cooperate with the solar field and the stove in maintaining the set-point temperature at the top of the thermal energy storage TTES,top,target. The values of TTES,top,target depend on (i) the outdoor temperature Tamb, activation state of both (ii) solar circuit pump and (iii) radiators pump, as well as (iv) the period of the day according to the conditions indicated in Table 6. As reported in Table 5, the electric heater is activated in the case of the actual temperature at the top of the storage TTES,top being 5 °C lower than TTES,top,target and it continues to operate trying to achieve the set-point temperature at the top of the thermal energy storage while providing its rated thermal output of 3.0 kW.
The 6 kWth coal-burning stove is fully charged and activated at 7.00 a.m. every-day. Then it is recharged (in order to replace the amount of consumed coal) at the following times (the number of charging points is greater when the degradation effects of dust deposition on solar collectors have to be balanced):
  • 7.00 a.m., 4.00 p.m., 8.00 p.m. (in the case of the soiling effects are neglected);
  • 7.00 a.m., 10.00 a.m., 4.00 p.m., 8.00 p.m. (in the case of the soiling effects are taken into account).
Figure 7a,b report the thermal power produced by the coal-burning stove (with and without the effects of dust deposition, respectively) assumed in the simulations during the daily operation according to both the experimental trend reported in Figure 6 as well as the above-mentioned charging points. The heat produced by the stove and reported in Figure 7a,b is delivered to the space heating circuit only when the radiators pump is activated (Table 5 and Table 6), but the coal is burning continuously even if the heat carrier fluid is not flowing through the radiators. Therefore, the coal consumption is taken into account also when the heating circuit is not operating (according to the actual operation of the stoves in Mongolia).
The on/off differential controllers were modelled in TRNSYS by using Type 2 in order to generate an on signal when the watched value fell below the user-specified set-point by a certain amount and then, the systems were turned off when the watched variable approached the set-point within a specified amount.
The parameters affecting the control logics of the proposed system were calibrated based on an iterative approach in order to (i) take into account the usual operation of heating systems in the Ger districts of Ulaanbaatar, (ii) maintain the house indoor air temperature within the desired temperature ranges during 95% of the entire simulation period, as well as (iii) minimize both primary energy consumption and carbon dioxide equivalent emissions.

3. Reference Systems

The performance of the proposed plant (PS), described in Figure 1, are compared from the energy, environmental and economic points of view with those associated with three different conventional heating systems assumed as references while serving the same detached house.
The plants assumed as references were derived from the proposed system by removing one or more components.
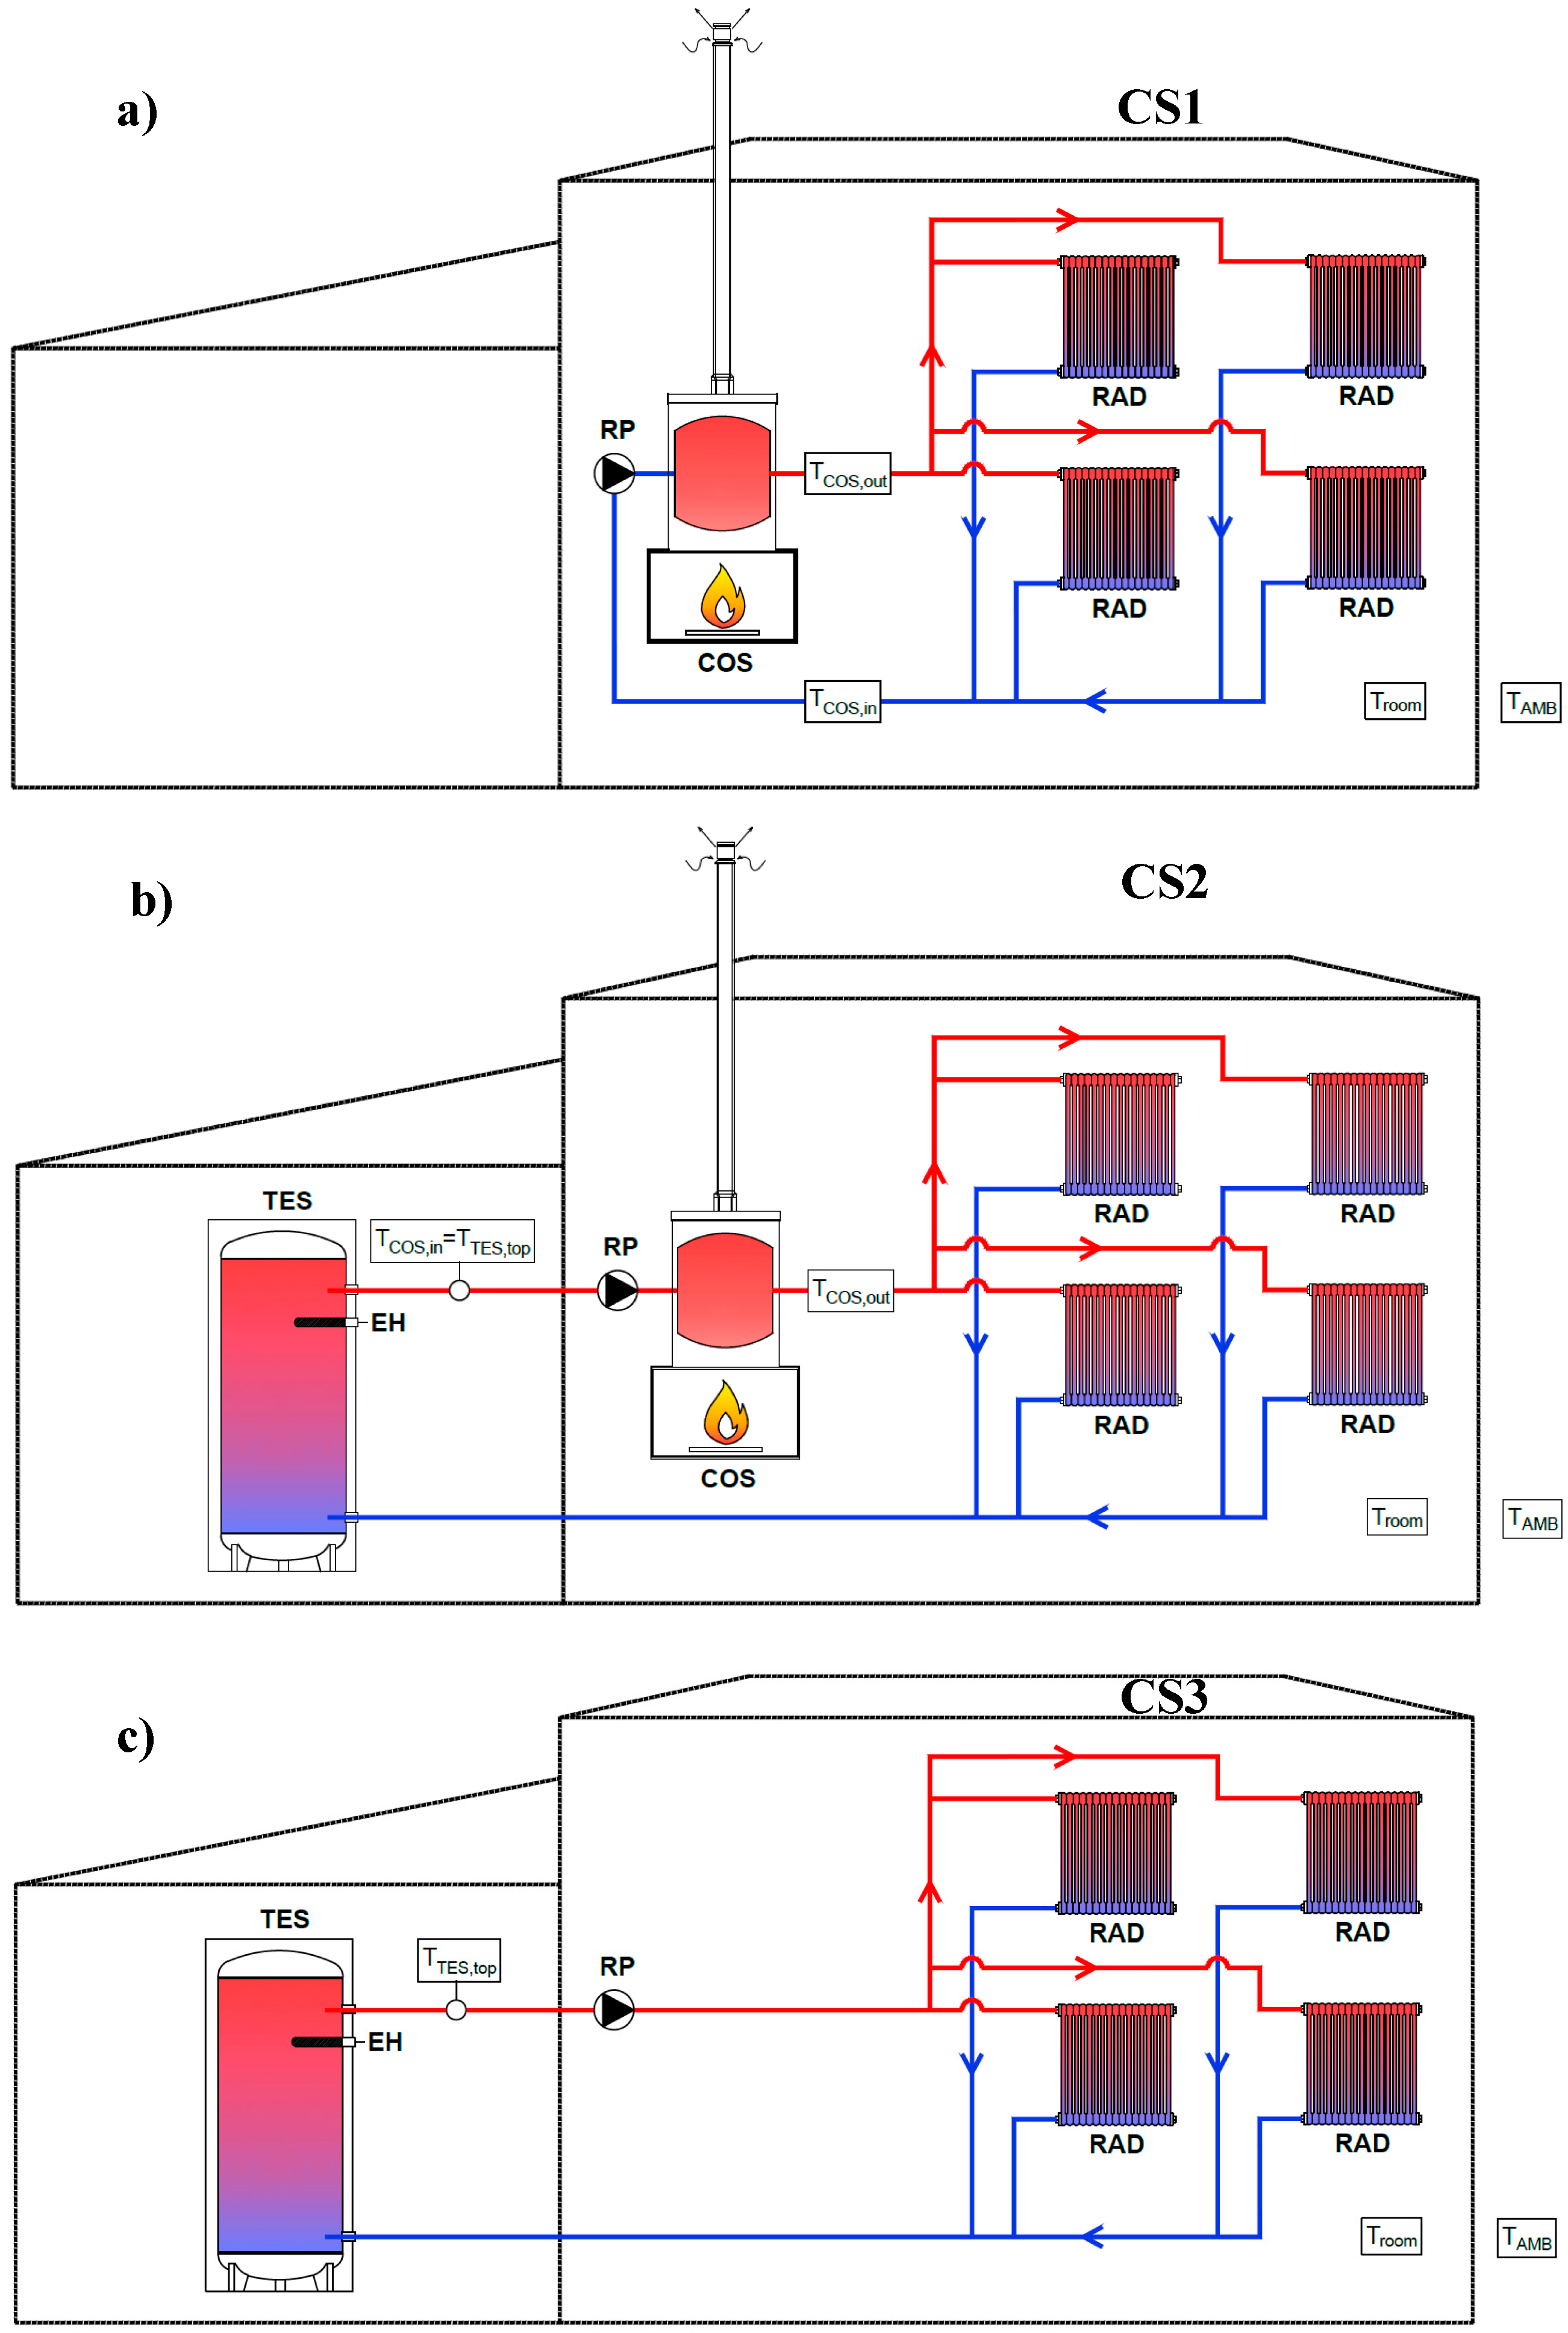
The first conventional heating system (CS1) is the most representative heating system in the Ger districts of Ulaanbaatar taking into account that 98% of the total households use only raw coal to satisfy the heating demand [1]. This system only consists of a low-pressure coal-burning stove, with a nominal thermal output of 9.0 kWth, supplying the radiators installed inside the house. The thermal output of the 9.0 kWth stove was theoretically derived from that one reported in Figure 6 with a scaling factor equal to 1.5. The second reference system (CS2) was obtained from the proposed system by removing the entire solar circuit (solar collectors, solar circuit pump, heat exchanger immersed in the storage and pipes) without any other modifications. Therefore, in this case, the heating demand is satisfied by both the coal-burning stove as well as the electric heater installed inside the tank.
The third reference system (CS3) was composed of a thermal energy storage with an immersed electric heater (with a nominal electric output of 9.0 kW) supplying the radiators. Even if a fully electric heating system with the entire elimination of the coal does not represent a realistic option for Mongolian applications in the current situation due to the reasons highlighted in Section 1. Introduction of this paper, the proposed system was also compared with CS3 in order to explore and assess the theoretical benefits/drawbacks associated with a potential future scenario.
Figure 8a–c report the schematics of the conventional heating systems CS1, CS2 and CS3, respectively. The main control algorithms and strategies of the conventional heating systems CS1, CS2 and CS3 are described in Table 7.
The parameters affecting the control logics of the conventional heating systems were calibrated based on an iterative approach in order to (i) take into account the usual operation of heating systems in the Ger districts of Ulaanbaatar as well as (ii) maintain the house indoor air temperature within the desired temperature ranges during 95% of the entire simulation period.
Figure 9a,b report the thermal power produced by the coal-burning stove (for CS1 and CS2, respectively) assumed in the simulations during the daily operation according to the experimental trend reported in Figure 6 as well as the charging points indicated in Table 7. As assumed for the proposed system, the heat produced by the stove and reported in Figure 9a,b was delivered to the space heating circuit only when the radiators pump was activated (Table 7), but the coal was burning continuously even if the heat carrier fluid was not flowing through the radiators. Therefore, the coal consumption for both CS1 and CS2 is taken into account also when the heating circuit is not.

4. Methods of Analysis

The comparison between the proposed Triple System and the reference heating systems was performed in terms of primary energy consumption, the amount of coal that is burned, carbon dioxide equivalent emissions and operating costs by adopting the approaches/parameters described in the following sub-sections.

4.1. Energy Analysis

The energy comparison was carried out by calculating the index named primary energy saving (PES):
PES = ( E p CS E p PS ) / E p CS
where E p PS is the primary energy consumed by the proposed system and E p CS is the primary energy associated with the conventional system. The terms in Equation (7) are defined as follows:
E p PS = E COS , p + E EH , p + E SP , p + E RP , p = E COS , th / η COS + E EH , el / η PP + E SP , el / η PP + E RP , el / η PP
E p CS 1 = E COS , p + E RP , p = E COS , th / η COS + E RP , el / η PP
E p CS 2 = E COS , p + E EH , p + E RP , p = E COS , th / η COS + E EH , el / η PP + E RP , el / η PP
E p CS 3 = E EH , p + E RP , p = E EH , el / η PP + E RP , el / η PP
where E COS , p , E EH , p , E SP , p , E RP , p represent the primary energy consumed by the coal-burning stove (relating to the periods during which the coal is burning, even if the thermal output of the stove is not delivered to the space heating circuit), the electric heater, the solar circuit pump and the radiators circuit pump, respectively. E COS , th is the total thermal energy produced by the coal-burning stove (relating to the periods during which the coal is burning, even if the thermal output of the stove is not delivered to the space heating circuit). E EH , el , E SP , el , E RP , el indicate the electric energy consumed by the electric heater, the solar circuit pump and the radiators circuit pump, respectively. Further, ηCOS is the thermal efficiency of coal-burning stove (assumed equal to 0.71 according to the manufacturer data [44]) and ηPP is the power plant average efficiency in Mongolia, including transmission losses (assumed equal to 33% [50]).

4.2. Environmental Analysis

The assessment of the environmental impact was performed in terms of both the amount of coal that is burned as well as carbon dioxide equivalent emissions.
The amount of coal used by the stove included in the proposed and conventional systems CS1 and CS2 (the conventional system CS3 does not use the stove) was calculated as follows:
m coal = E COS , p / LHV coal
where LHVcoal is the lower heating value of coal (assumed equal to 14630 kJ/kgcoal according to the Mongolian scenario [51]).
The calculation of the carbon dioxide equivalent emissions has been performed in this study through an energy output-based emission factor approach [52]. According to this approach, the mass mx of a given pollutant x emitted while producing the energy output E can be calculated as:
m x = u x E E
where u x E is the energy output-based emission factor, that is, the specific emissions of x per unit of E.
The mass of carbon dioxide equivalent emissions associated with the proposed and conventional systems was determined as reported below:
m CO 2 PS = β E COS , p + α ( E EH , el + E SP , el + E RP , el )
m CO 2 CS 1 = β E COS , p + α E RP , el
m CO 2 CS 2 = β E COS , p + α ( E EH , el + E RP , el )
m CO 2 CS 3 = α ( E EH , el + E RP , el )
where is the CO2 equivalent emission factor for electricity production and represents the CO2 equivalent emission factor associated with coal-burning. According to the values suggested in [53] for the Mongolian scenario, the emission factor α was assumed to be equal to 1.06 kg CO2/kWhel and the emission factor β was considered of 0.78 kg CO2/kWhp.
The environmental comparison between the proposed and conventional systems was carried out by means of the following indicators:
Δ m coal = ( m coal CS m coal PS ) / m coal CS
Δ CO 2 = ( m CO 2 CS m CO 2 PS ) / m CO 2 CS
where m coal PS and m CO 2 PS represent, respectively, the mass of coal and the mass of carbon dioxide equivalent emissions associated with the proposed system, while m coal CS and m CO 2 CS indicate the mass of coal and carbon dioxide equivalent emissions associated with the conventional systems.

4.3. Economic Analysis

The economic analysis was performed in terms of operating costs.
The operating costs of the proposed system were compared with those of the conventional systems by means of the following parameter:
Δ OC = ( OC CS OC PS ) / OC CS
where OC PS represents the operating costs associated with the proposed system and OC CS represents the operating costs associated with the conventional systems calculated as follows:
OC PS = UC coal m coal + UC el ( E EH , el + E SP , el + E RP , el )
OC CS 1 = UC coal m coal + UC el E RP , el
OC CS 2 = UC coal m coal + UC el ( E EH , el + E RP , el )
OC CS 3 = UC el ( E EH , el + E RP , el )
where UCcoal is the unit cost of coal and UCel is the unit cost of electric energy. In this paper, the following constant values were assumed according to the Mongolian scenario: UCcoal = 0.048 €/kgcoal [54], UCel = 0.053 €/kWhel [55]. According to the new rules for electric energy utilization in the Ger district of Ulaanbaatar, the price of electricity is assumed equal to zero between midnight and 6.00 a.m.
In order to estimate the expected return on investment, the so-called simple pay-back period (SPB), i.e., the number of years required to recover the extra investment cost associated with the proposed system with respect to the reference systems, was calculated. It was defined as follows:
SPB = ( CC PS CC CS ) / ( OC CS OC PS )
where:
  • CCPS is the capital cost of the proposed system;
  • CCCS represents the capital costs of the conventional systems;
  • OCPS is the operating cost of the proposed system due to the consumption of electricity and coal Equation (21);
  • OCCS represents the operating costs of the conventional systems (Equation (22) for CS1, Equation (23) for CS2, Equation (24) for CS3).
The maintenance costs as well as the labor costs were neglected in calculating the values of SPB.
The capital costs of the proposed system CCPS and conventional systems CCCS were defined as reported below:
CC PS = CC SFC + CC COS _ 6 kW + CC TES + CC EH _ 3 kW + CC SP + CC RP
CC CS 1 = CC COS _ 9 kW + CC RP
CC CS 2 = CC COS _ 6 kW + CC TES + CC EH _ 3 kW + CC RP
CC CS 3 = CC TES + CC EH _ 9 kW + CC RP
where:
  • CCSFC is the capital cost of the four series-connected evacuated tube heat pipe collectors (assumed equal to 12 €/tube, according to the values suggested by Ramos et al. [56], for a total cost of the entire solar field equal to 1440 €);
  • CCTES is the capital cost of the thermal energy storage (assumed equal to 1000 €, according to manufacturer data [57]);
  • CCCOS_6kW represents the capital cost of the 6 kWth coal-burning stove (assumed equal to 190 €, according to manufacturer data [44]);
  • CCCOS_9kW represents the capital cost of the 9 kWth coal-burning stove (assumed equal to 250 €, according to manufacturer data [44]);
  • CCEH_3kW is the capital cost of the 3 kWel electric heater (assumed equal to 200 €, according to manufacturer data [57]);
  • CCEH_9kW is the capital cost of the 9 kWel electric heater (assumed equal to 250 €, according to manufacturer data [57]);
  • CCSP is the capital cost of the solar pump and controller (assumed equal to 360 €, according to the values suggested by Ramos et al. [56]);
  • CCRP is the capital cost of the radiators pump (assumed equal to 167 €, according to the values suggested by Ramos et al. [56]).

5. Results and Discussion

The proposed and reference systems were modelled and simulated in the TRNSYS environment (version 17) during the period running from 1 October to 31 May with a simulation time-step equal to two minutes.
The proposed system has been analyzed in the following two cases:
case (1)
The dust deposition effects on the performance of the solar thermal collectors are neglected by assuming the glass tubes perfectly clean during the whole heating season;
case (2)
The dust deposition effects on the performance of the solar thermal collectors are taken into account by means of Equation (2) as a function of the operating conditions.
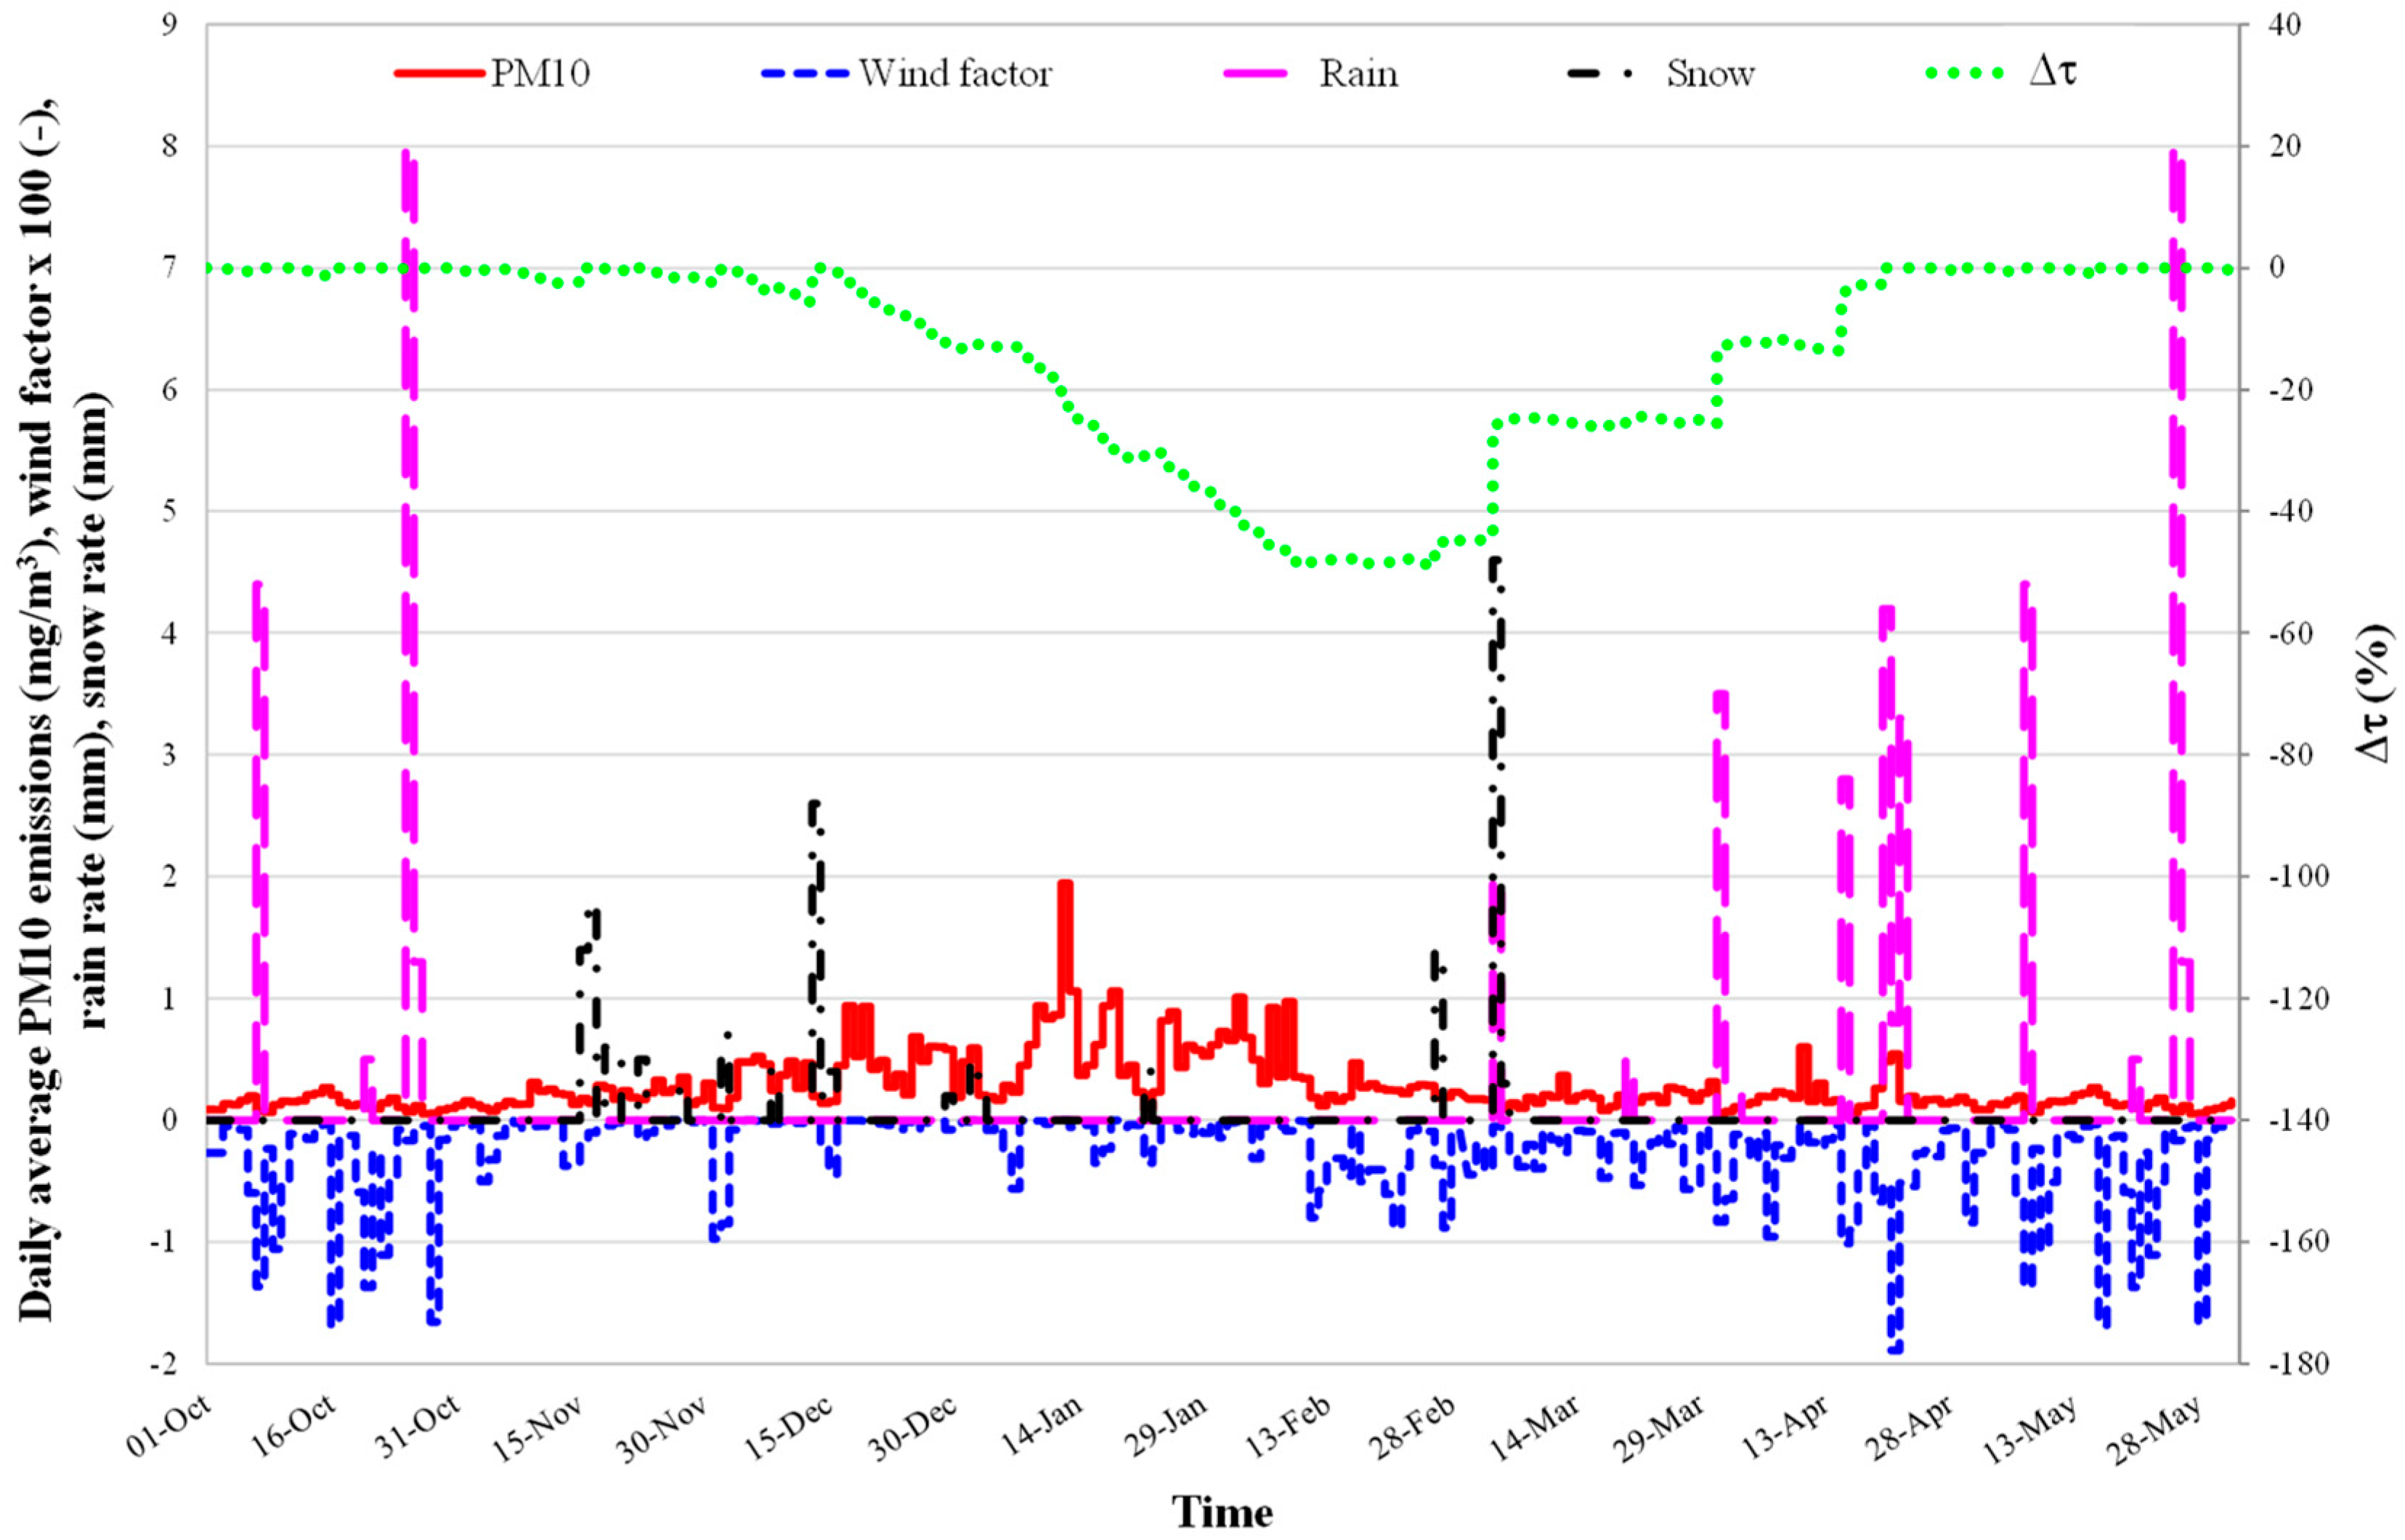
Figure 10 indicates the daily average PM10 emissions xi, the daily average wind factor yi (multiplied by 100), the daily average rain rate z1,i and the daily average snow rate z2,i measured by the authors in Ulaanbaatar during the period from October 2015 up to May 2016 [28] and used to run the simulations in this study in the above-mentioned case (2) with the dust deposition effects being taken into account. In the same figure, the percentage difference between the daily average glass tube transmittance including the effects of dust deposition τw,dust (calculated based on Equation (2)) and the daily average glass tube transmittance without the dust deposition effects τw/o,dust (equal to 0.96) is reported as a function of the simulation time according to the experimental values of xi, yi, z1,i and z2,i:
Δ τ = ( τ w , dust τ w / o , dust ) / τ w / o , dust
This figure highlights that rain is prevalent until the end of October, followed by snow from the middle of November until the beginning of March. After that, the rain starts again in March. In addition, it can be noted how the PM10 emissions during December, January and February are very significant (up to 2 mg/m3). Both rain and snow contribute to cleaning the tubes, while PM10 emissions reduce the transmittance of glass. The daily average wind factor (defined by Equation (3)) can be negative or positive: If the wind speed is high, yi becomes negative, meaning that the wind removes the dust from the tubes surface. In the case of the wind speed being low, yi is positive enhancing the dust deposition. In Figure 10, the values of yi are always negative. This means that the wind helps in cleaning the tubes as well as enhancing their transmittance during the whole heating season (mainly in October, April and May).
Figure 10 highlights that the combined effects of PM10 emissions, wind, rain and snow are substantial and reduce the nominal value of thermal transmittance without the dust deposition (0.96) by about 49.1%. The reduction of τ is significant from the beginning of December up to the end of February due to the fact that PM10 emissions are relevant, while the contribution of rain, snow and wind in cleaning the tubes is limited.
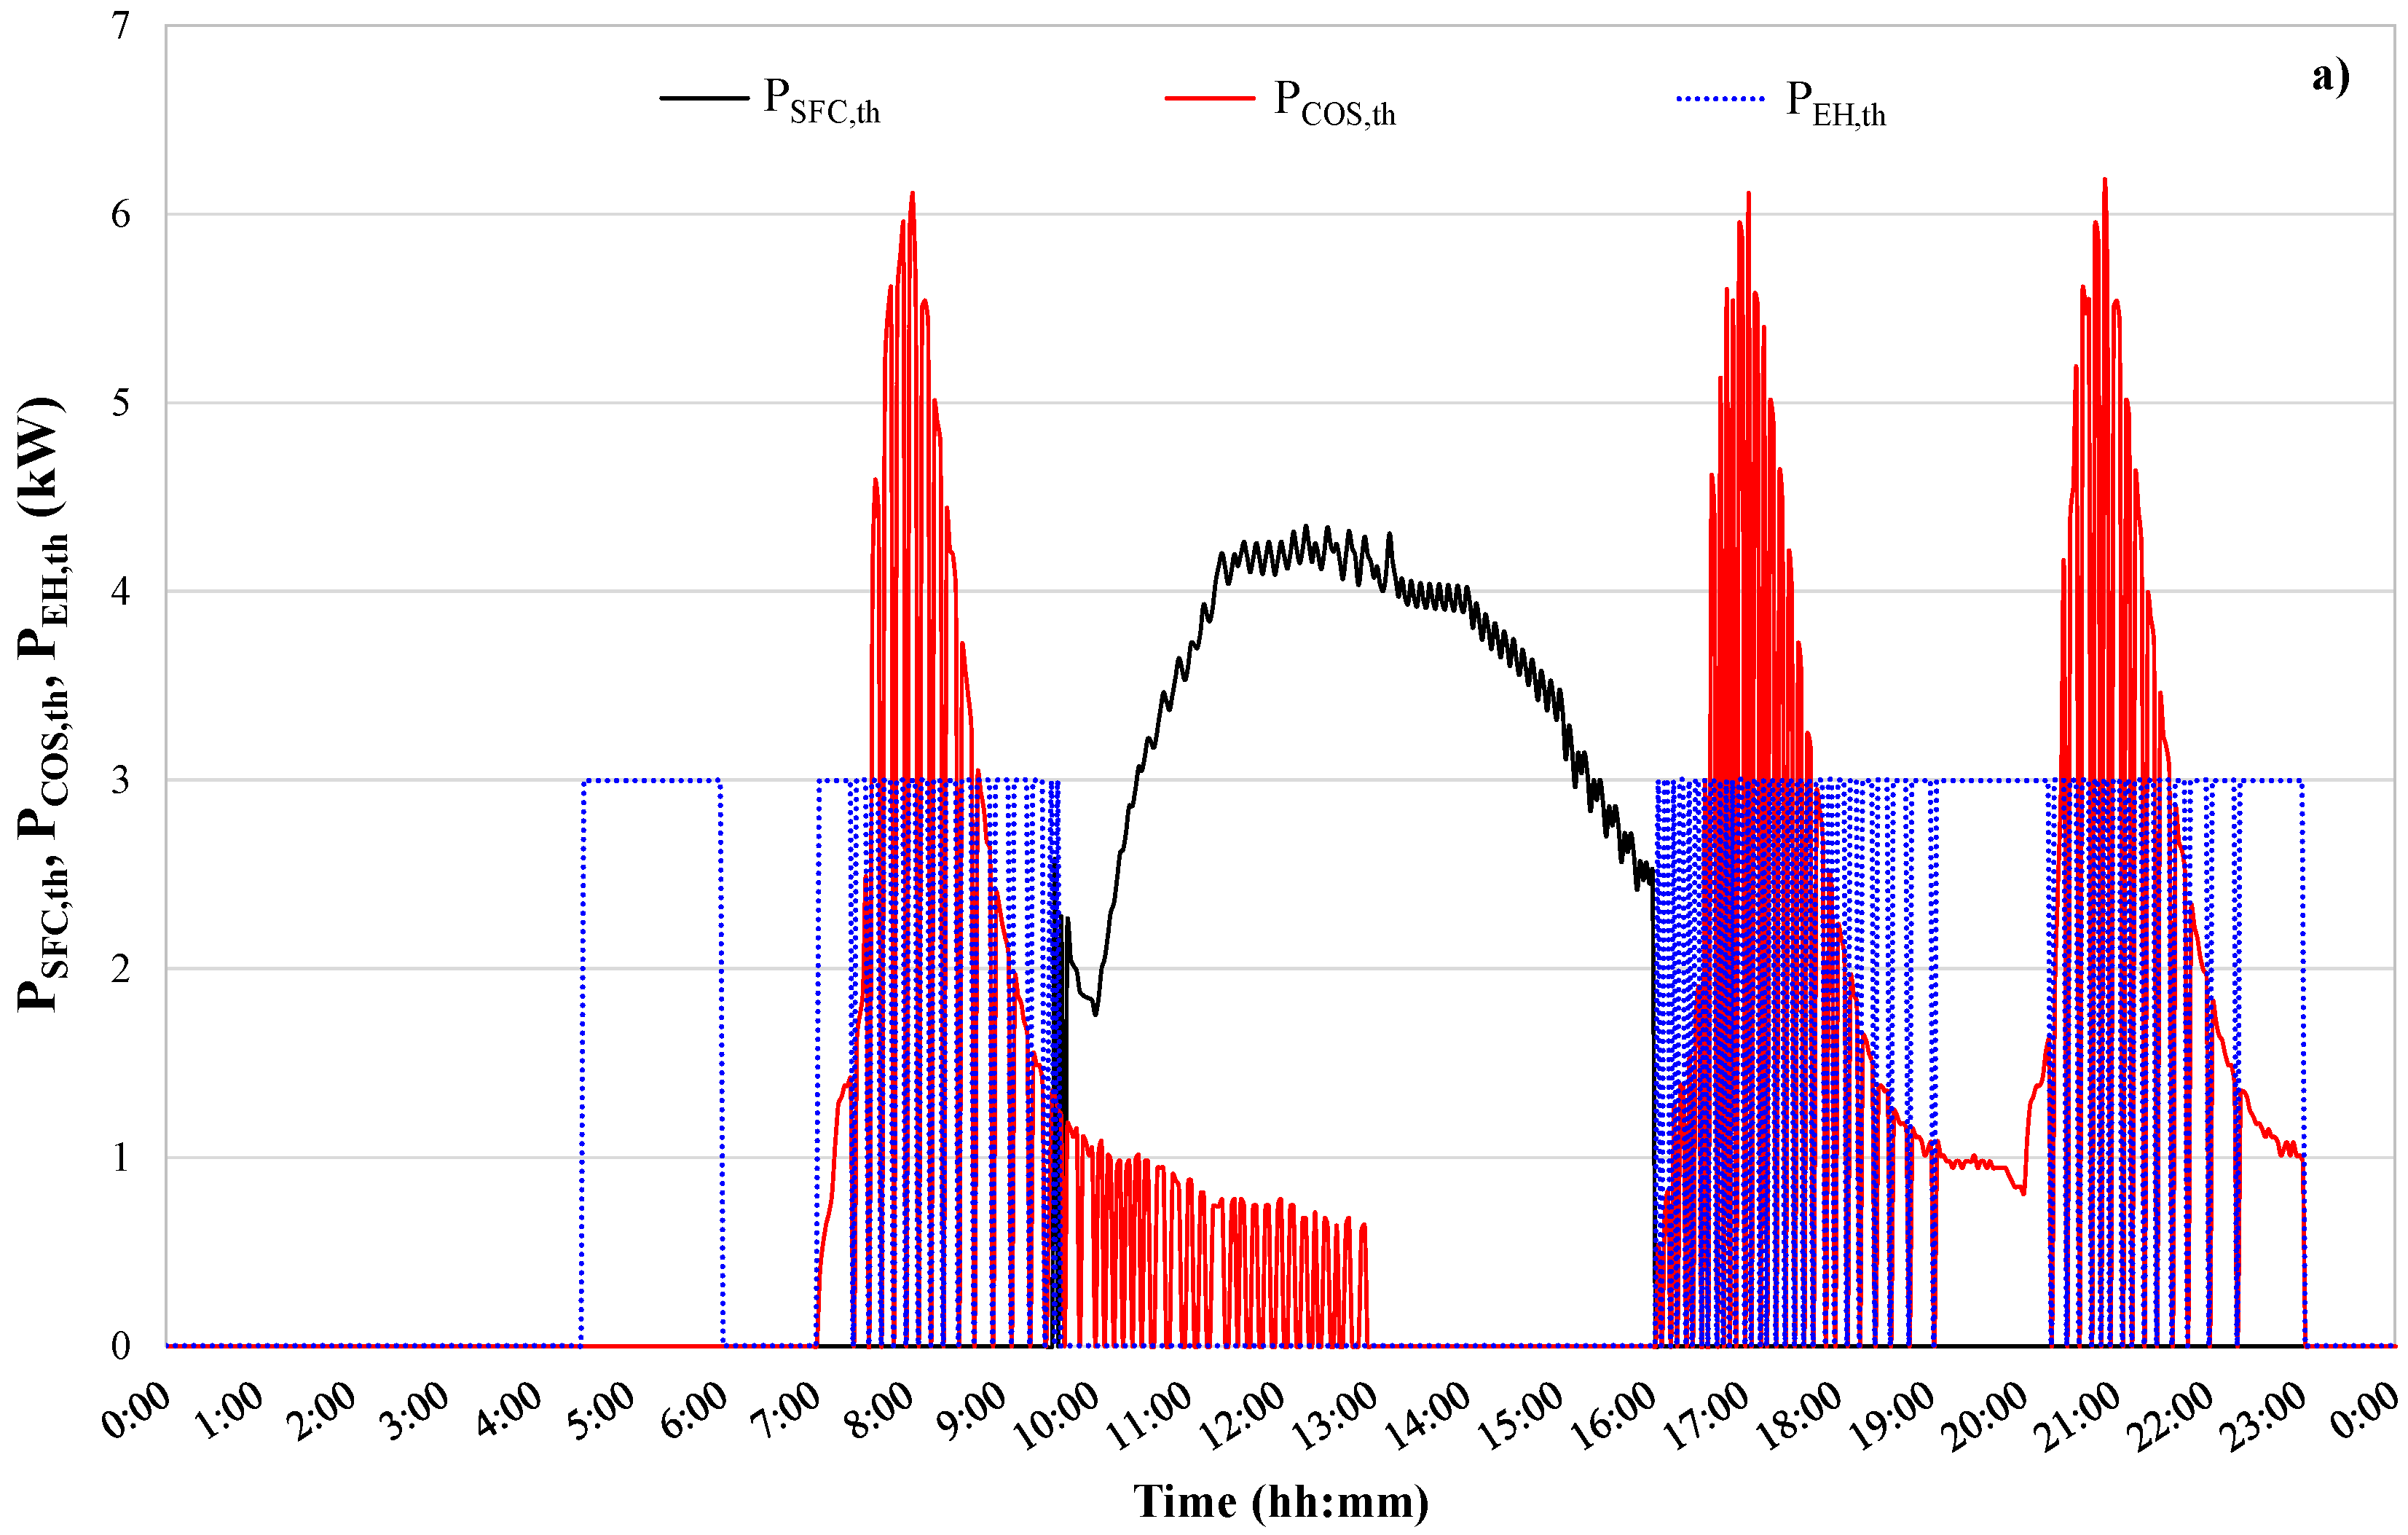
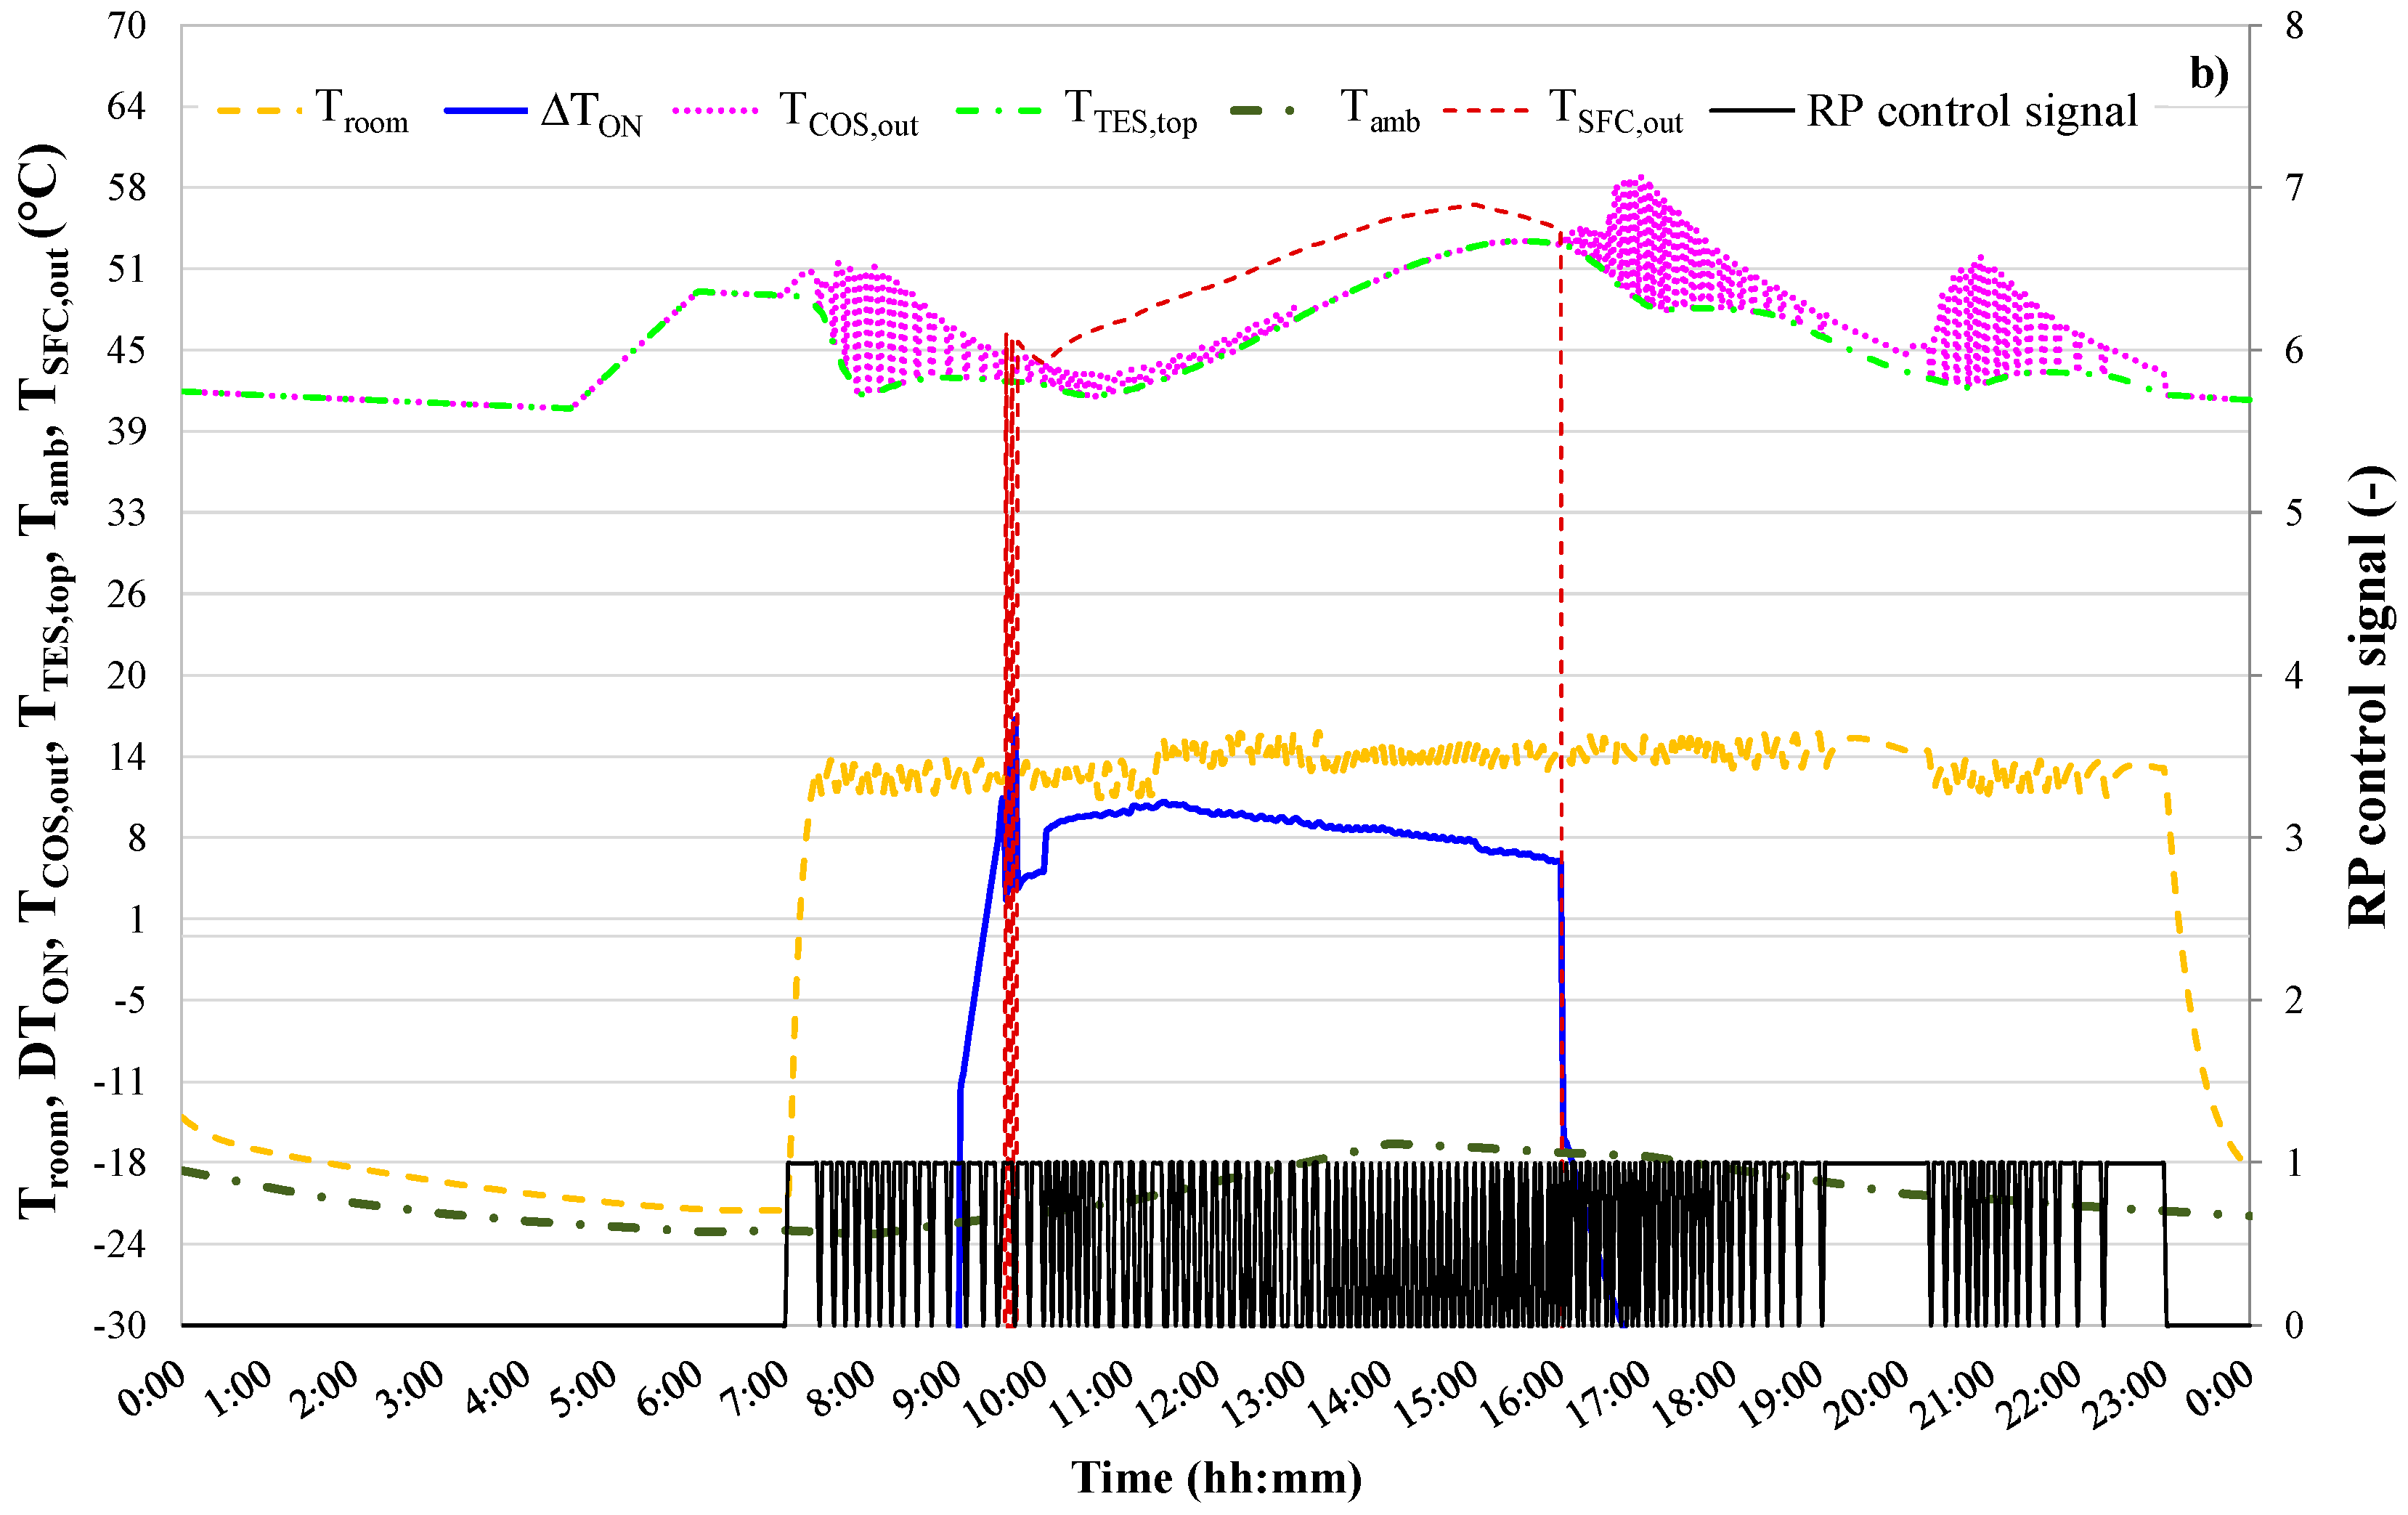
Figure 11a,b describe the operation of the proposed plant (without the dust deposition effects) during a typical day (Sunday, 1 December), highlighting the daily trends of the thermal power recovered from the solar thermal collectors PSFC,th, the thermal power delivered to the space heating circuit by the coal-burning stove PCOS,th, the thermal power provided by the electric heater PEH,th, the control signal of the radiators pump (RP), the temperature level inside the house Troom, the temperature difference ∆TON, the temperature at the outlet of the coal stove TCOS,out, the temperature at the top of the thermal energy storage TTES,top, the outdoor temperature Tamb as well as the temperature at the outlet of the solar field TSFC,out a function of the time.
From this figure, it can be derived that:
  • The indoor air temperature Troom is generally within the desirable thermal comfort levels indicated in Figure 4b as a function of Tamb;
  • Solar energy is recovered by the solar thermal collectors only from approximately 9:25 up to approximately 16:00, i.e., when the switch-on temperature difference ∆TON is higher than 8.0 °C. The solar circuit pump is switched off in the case of ∆TON becomes lower than 4.0 °C. The maximum thermal power recovered by the solar field is approximately 4.3 kW, while the maximum temperature at the outlet of solar thermal collectors is equal to approximately 56 °C;
  • The radiators circuit pump is switched on (RP control signal = 1) when Troom falls below the user-specified set-point (Figure 4b) by 1.5 °C and then is turned off (RP control signal = 0) when Troom exceeds the target (Figure 4b) by 1.5 °C;
  • The coal-burning produces the thermal power reported in Figure 7a, but its thermal output is delivered to the space heating circuit only when the radiators pump is on (RP control signal = 1);
  • The maximum temperature at the outlet of the coal-burning stove is 58.2 °C;
  • The temperature at the top of the thermal energy storage is between 40.0 °C and 53.4 °C due to the contributions of the solar field, the electric heater as well as the stove.
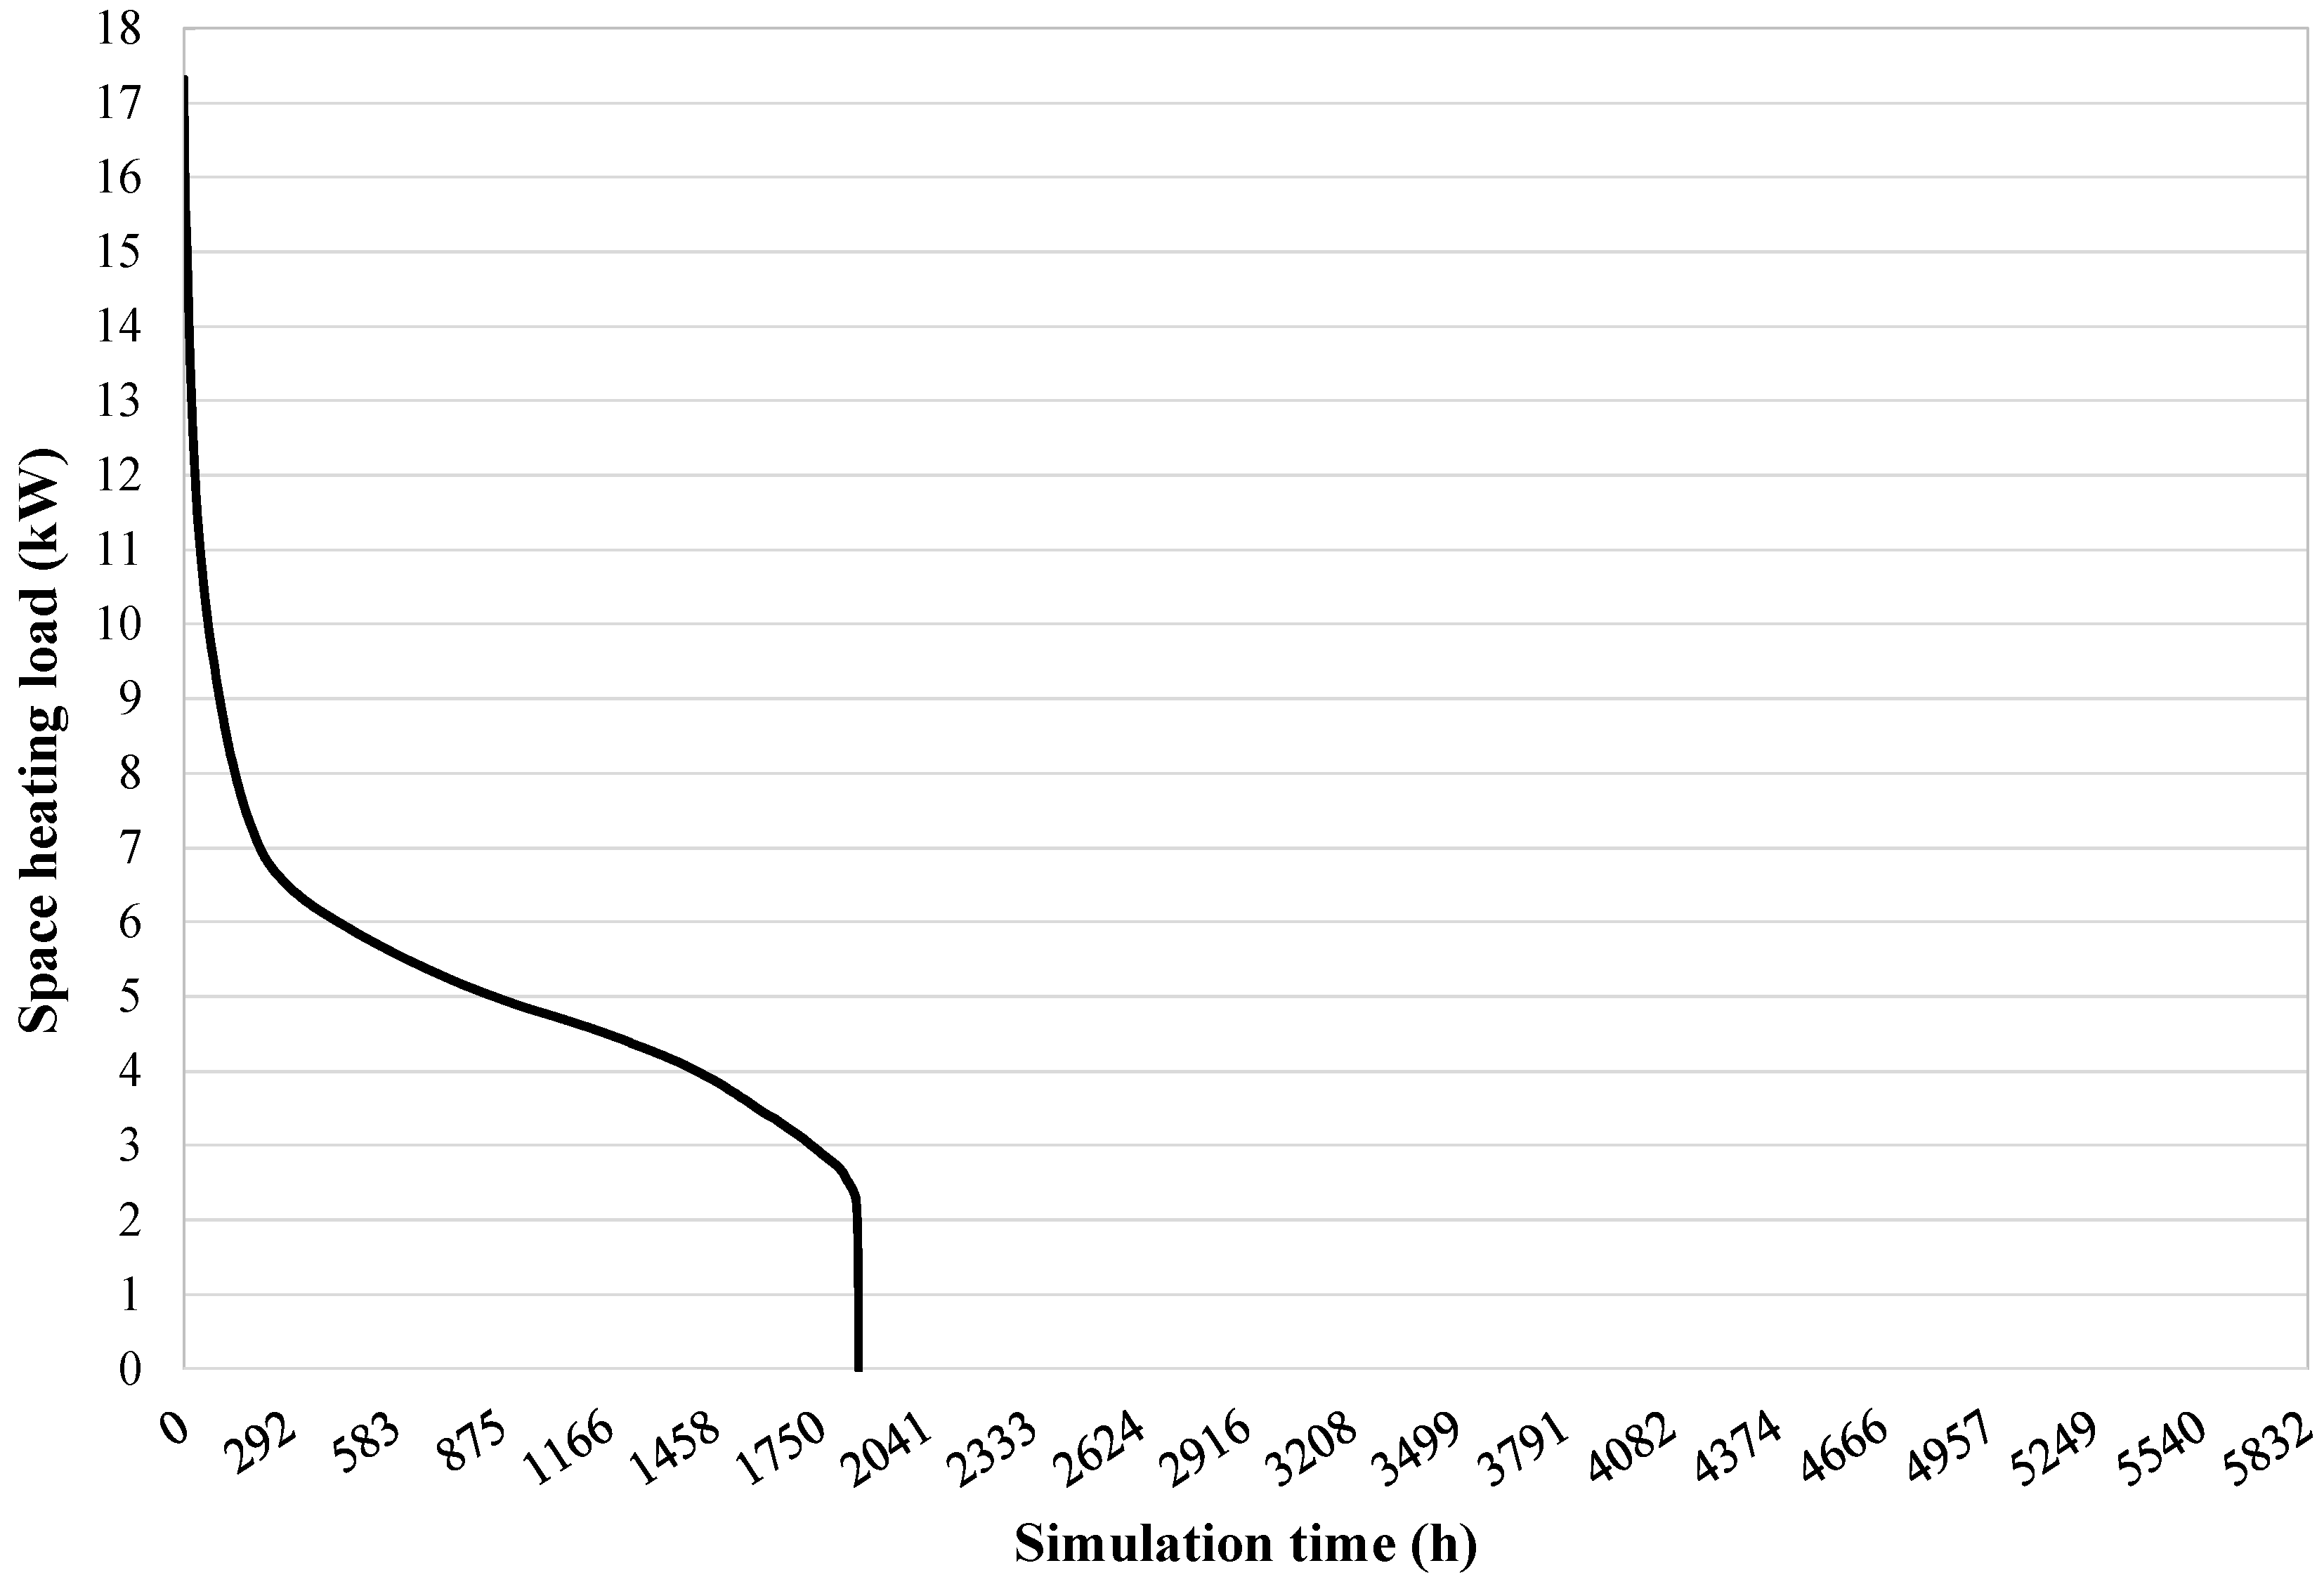
Figure 12 reports the load-duration diagram associated with the entire heating season (characterized by a total duration of 5832 hours) with the heat-demand values sorted in descending order for the proposed plant (without the dust deposition effects). This figure shows how the space heating demand has a duration of approximately 1852 hours (equal to about 32% of the duration of the entire heating season), with the maximum thermal power transferred to the indoor air through the radiators being equal to approximately 17.3 kW.
Figure 13 indicates the energy flows associated with the whole simulation period from 1 October up to 31 May as a function of the plant configuration. The seasonal values of the thermal energy supplied to the house, the solar energy recovered by the solar thermal collectors and then transferred into the storage, the thermal energy delivered by the coal-burning stove to the heat carrier fluid, the thermal energy provided by the electric heater, the electric energy consumption of both the solar circuit pump and the radiators circuit pump as well as the total heat losses through the pipes of both the solar circuit and the radiators circuit are reported. With reference to the proposed system without the effects of dust deposition, Figure 13 shows that:
  • The contribution of the solar source is significant when taking into account that the solar energy recovered from the solar thermal collectors and then injected into the storage is equal to approximately 38.0% of the total thermal energy supplied by the combination of solar source, electric heater and stove. The remaining thermal energy required for heating purposes is supplied by both the electric heater (by approximately 32.2%) as well as the coal-burning stove (by approximately 29.8%);
  • The electricity consumption of both pumps is not negligible, with it representing approximately 7.4% of the overall electric demand due to both pumps and electric heater (with the electric energy consumed by the radiators circuit pump approximately 27.6% greater than that one required by the solar circuit pump);
  • The heat losses associated with the pipes of both the solar circuit as well as the radiators circuit are relevant (approximately 20.3% of the overall thermal energy demand of the house).
Figure 13 also highlights how, in comparison to the operation of the proposed system without considering the soiling effects, the impact of dust deposition significantly reduces the thermal energy recovered by the solar thermal collectors by approximately −20.9%, causing a greater consumption of both the electric heater (by approximately +5.12%) as well as the coal-burning stove (by approximately +21.5%).
This figure also indicates that, in the case of the conventional system CS2, the thermal energy demand of the house is mainly covered by the electric heater (by approximately 46.1%), with the remaining energy supplied by the stove.
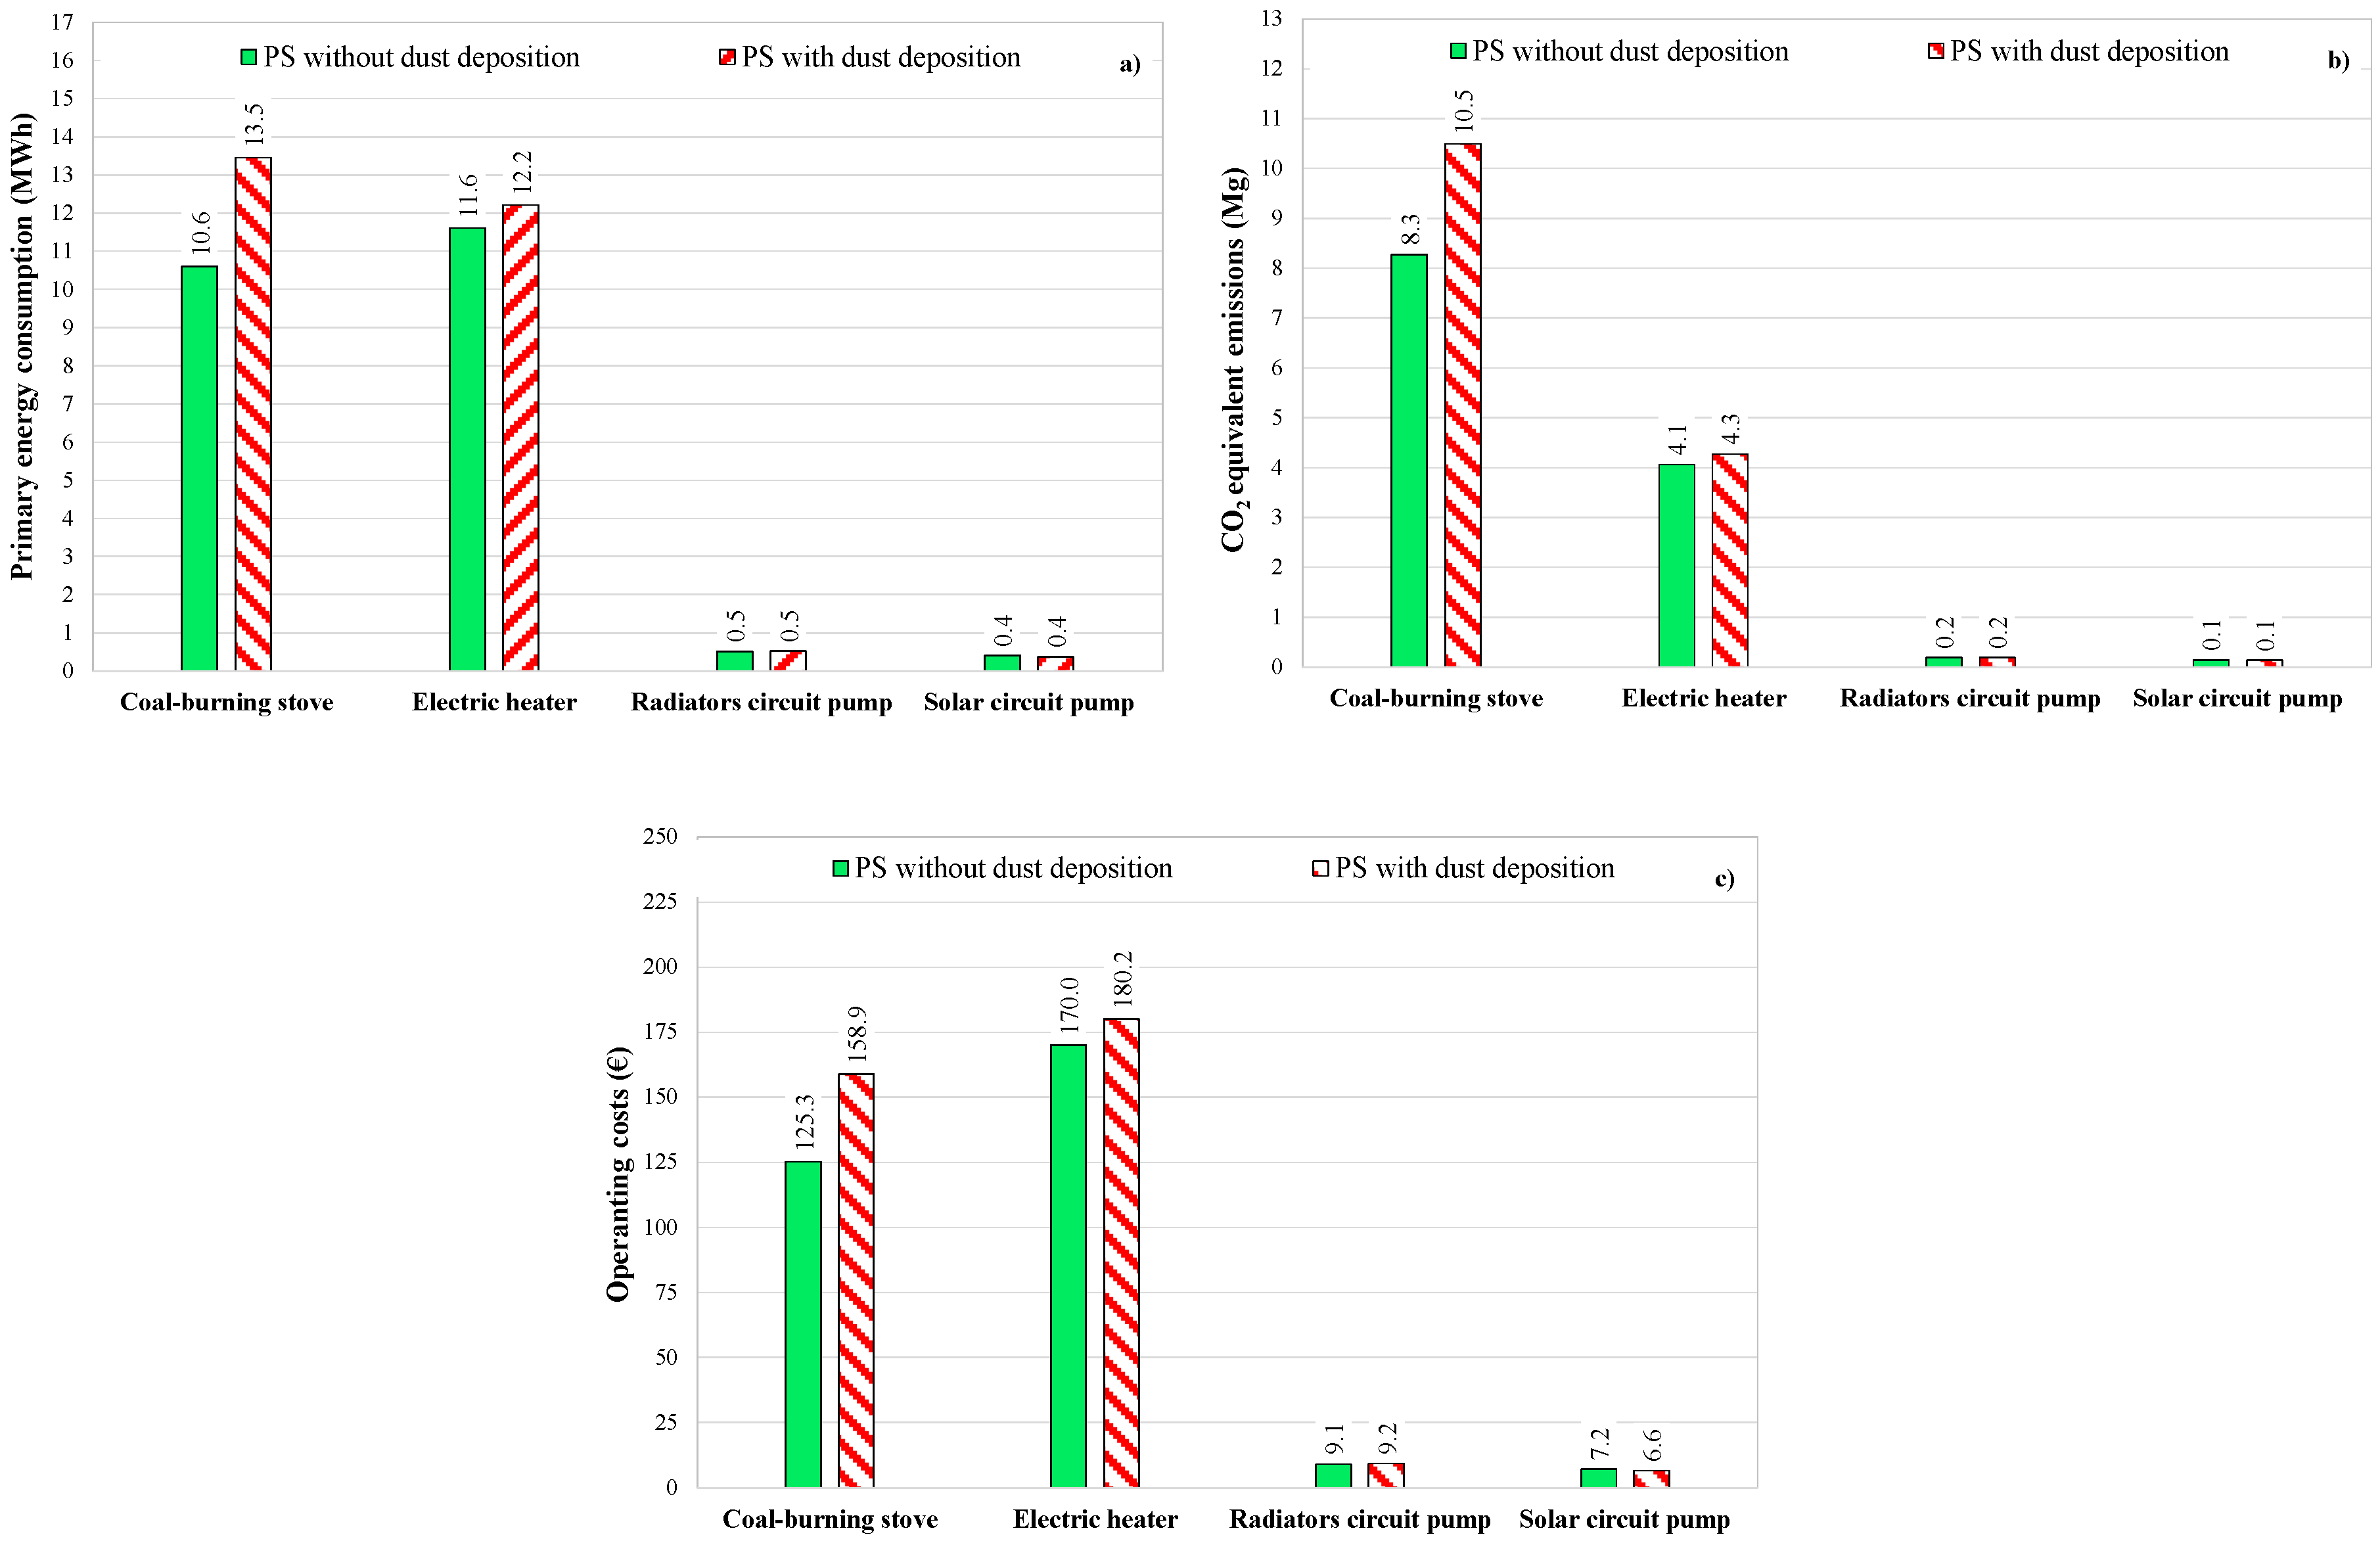
Figure 14a–c presents the single contributions of each component of the proposed system (with and without dust deposition) to the overall primary energy consumption (Figure 14a), CO2 equivalent emissions (Figure 14b) as well as the operating costs (Figure 14c) with reference to the entire heating season.
The amount of coal that is burned for heating purposes is, respectively, approximately 2610.0 kg with the tubes always clean and 3311.0 kg in the case of the effects of dust deposition are taken into account. In terms of primary energy consumption (Figure 14a), it can be stated that the Ep associated with the stove is the largest part in the case with the dust. When the dust is neglected, the electric heater is mainly contributing to the overall Ep consumption. Figure 14b shows that the stove is in charge of the largest contribution in terms of carbon dioxide equivalent emissions. It is equal to approximately 69.6% and 65.4%, respectively, with and without considering the soiling effects. The costs associated with the operation of the coal-burning stove represent approximately 44.8% (with the effects of the dust) and 40.2% (without the effects of the dust) of the overall operating costs of the proposed system (as highlighted in Figure 14c).
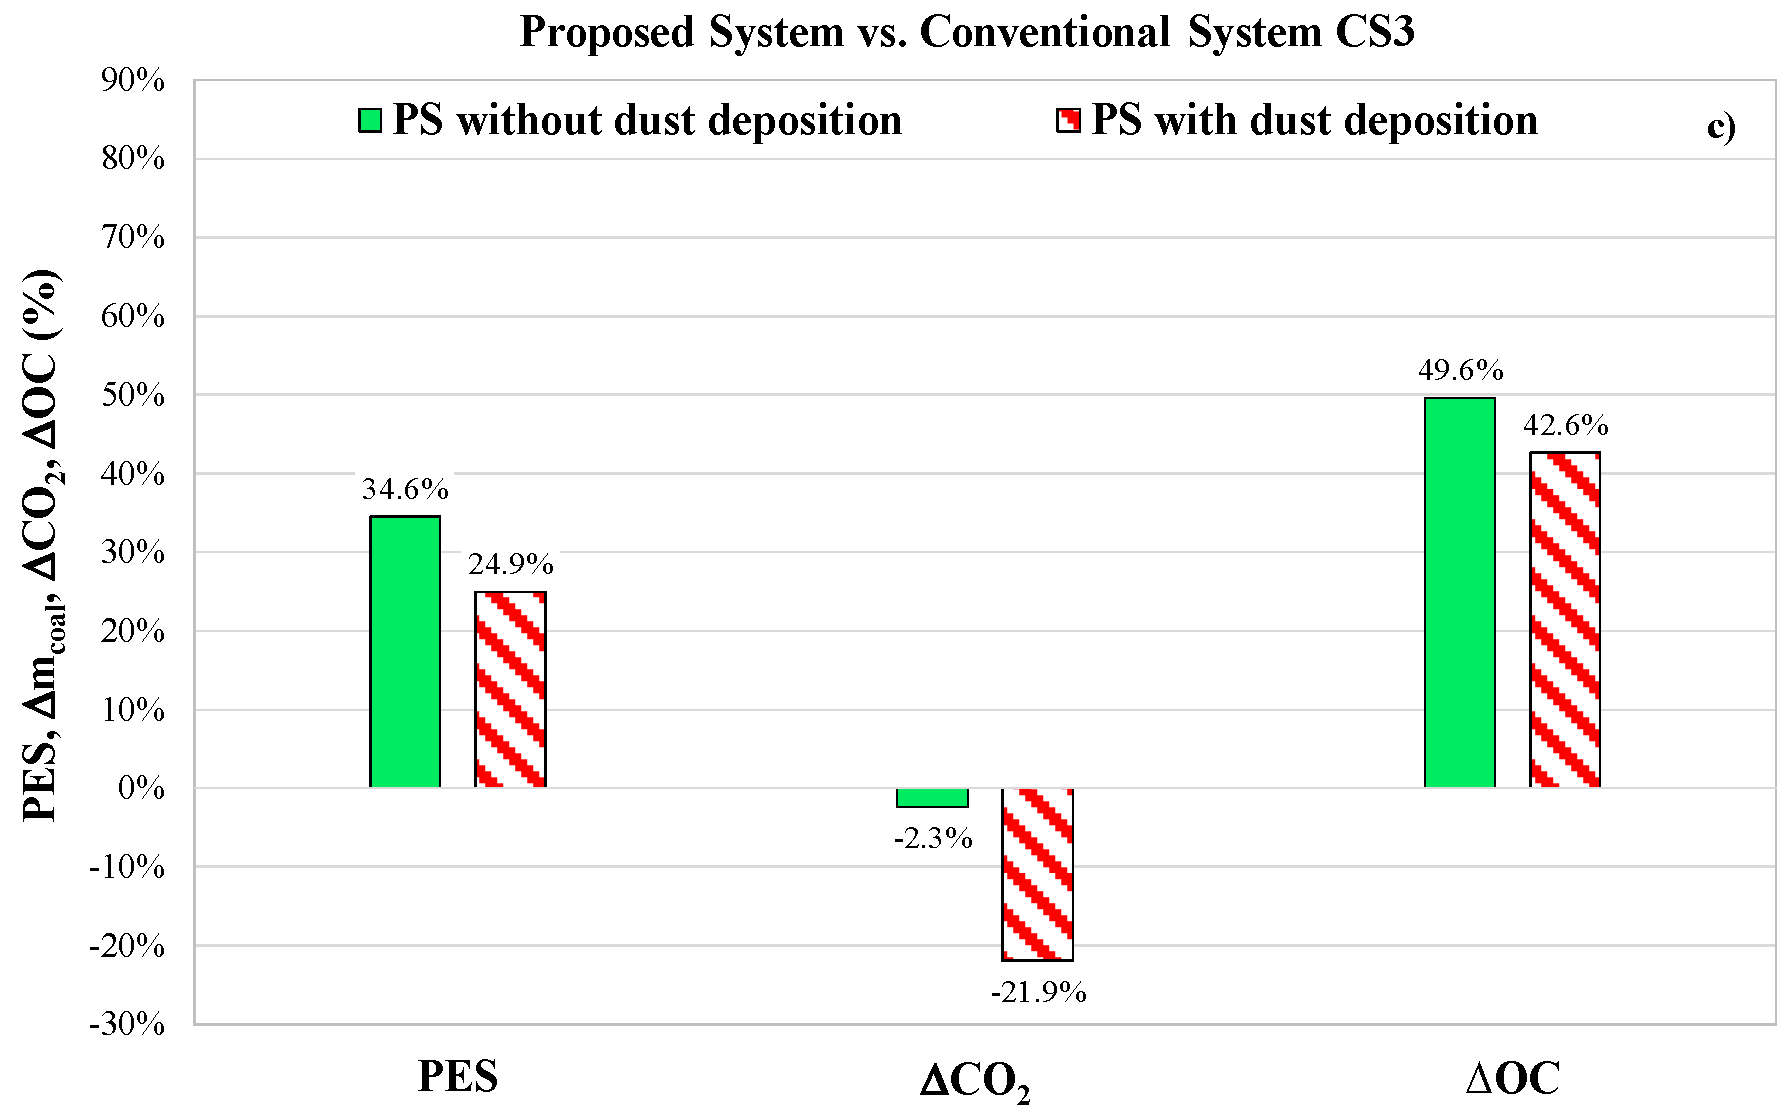
Figure 15a–c report the seasonal values of PES (Equation (7)), ∆mcoal (Equation (18)), ∆CO2 (Equation (19)) and ∆OC (Equation (20)) calculated by comparing the proposed system (with and without the effects of dust deposition) and the conventional systems CS1 (Figure 15a), CS2 (Figure 15b) and CS3 (Figure 15c). In Figure 15c, the values of ∆mcoal are not indicated taking into account that coal is not used in the conventional system CS3.
Firstly, it should be highlighted that the simulation results indicate that the thermal comfort (house indoor air temperature within the desired temperature ranges) is guaranteed during approximately 95% of the entire simulation period for both the proposed plant (with and without considering the dust deposition effects) as well as the three reference systems by confirming that (i) the proposed and conventional systems are well designed/operated as well as (ii) they can be compared from the energy, environmental and economic points of view.
Figure 15a–c highlight that:
  • The proposed system is able to achieve relevant reductions in terms of both the amount of coal that is burned as well as the carbon dioxide equivalent emissions in comparison to the conventional heating systems CS1 and CS2. In particular, the values of ∆mcoal range from 15.8% up to 68.6%, while ∆CO2 is between 21.1% and 52.3%. The maximum value of both ∆mcoal and ∆CO2 are obtained when the proposed system (without the dust deposition effects) is compared with the conventional system CS1, while both ∆mcoal and ∆CO2 assume the lowest values when the proposed system (with the soiling effects) is contrasted with the conventional system CS2;
  • The conventional system CS3 is characterized by lower carbon dioxide equivalent emissions with respect to the proposed system, even if the total primary energy consumption of PS is lower than CS3. This is mainly due to the fact that the CO2 equivalent emission factor associated with the coal-burning (0.78 kg CO2/kWhp) is very high. In particular, the difference is negligible (∆CO2 = −2.3%) in the case of the soiling effects not being considered, but it becomes quite relevant (∆CO2 = −21.9%) when the impact of the dust deposition is taken into account;
  • The proposed system significantly reduces the primary energy consumption (PES > 0), whatever the conventional system assumed as a reference. In particular, the maximum PES (+34.6%) is obtained when the proposed system (without the dust deposition effects) is compared with the conventional system CS3, while the minimum PES (+22.6%) is achieved when the proposed system (with the soiling effects) is contrasted with the conventional system CS1;
  • The proposed system is also able to reduce the operating costs by a percentage in the range 13.0% ÷ 49.6% (the maximum value of ∆OC can be obtained in the case of the conventional heating system CS3 is assumed as a reference without considering the soiling effects, while the minimum saving in terms of operating costs relates to the case when the proposed system is contrasted with CS1 taking into account the effects of dust deposition);
  • In comparison to the conventional system CS1 (that is the most common heating system in the Ger districts of Ulaanbaatar taking into account that 98% of the total households use only raw coal to satisfy the heating demand [1]), the proposed system obtains significant benefits due to the reduction of primary energy consumption by approximately 32.5%, the amount of coal that is burned by approximately 68.6%, the carbon dioxide equivalent emissions by approximately 52.3% and operating costs by approximately 23.3% in the case of the soiling effects not being considered;
  • The impact of dust deposition on the overall energy, environmental and economic performance of the proposed system is very significant. In comparison to the performance of the proposed system with perfectly clean glass tubes, the soiling effect reduces the potential PES by approximately 9.7 ÷ 10.0%, the potential ∆mcoal by approximately 8.4 ÷ 17.8%, the potential ∆CO2 by approximately 9.1 ÷ 19.6% as well as the potential ∆OC by approximately 7.0 ÷ 10.6%. The most relevant effects of the dust deposition in terms of both PES (−10.0%) and ∆OC (−10.6%) can be recognized when the proposed system is compared with CS1. This clearly means that an appropriate cleaning strategy and timing of the solar field has to be identified in the future in order to fully exploit the potential benefits associated with the utilization of solar source.
Table 8 reports the values of the simple pay-back periods (SPB) as a function of the conventional system, assumed as a reference, with and without the dust deposition.
This table highlights that:
  • The duration of the simple pay-back period (32.5–61.9 years) is not acceptable when the proposed system is compared with the conventional system CS1 (mainly due to the capital costs of evacuated tube heat pipe collectors), so that significant economic incentives by the Mongolian Government supporting the application of solar collectors are strictly required;
  • The values of SPB are reasonable when the proposed plant is contrasted with the reference systems CS2 and CS3, with the lowest values obtained when the case of the conventional plant CS3 is considered (6.1–7.1 years);
  • The impact of dust deposition in terms of the simple pay-back period is relevant, with the values of SPB significantly increasing (from 16% up to 90%) when the soiling effects are taken into account with respect to the case without the dust deposition.

6. Conclusions

In Mongolia, approximately 45% of the total population lives in the capital city of Ulaanbaatar and approximately 60% of the total households are located in the Ger districts of Ulaanbaatar, with approximately 98% of them using raw coal to satisfy the overall heating demand. The significant usage of raw coal during the winter leads to catastrophic air pollutant emissions, with Ulaanbaatar being one of the top 5 most polluted cities in the world. Even if solar energy is considered one of the most promising options for energy saving and reduction of harmful emissions at global and local levels, the exploitation of solar systems for heating purposes in cold regions has been poorly investigated up to now and further studies are necessary to explore its potential. In addition, almost no studies investigating the effects of the dust deposition on the performance of solar applications operating in cold areas with a great deal of air pollution (such as Mongolia) are available in current literature.
A solar hybrid heating system mainly consisting of a thermal energy storage, a solar field composed of four series-connected evacuated tube heat pipe collectors, an auxiliary electric heater, as well as a low-pressure coal-burning stove was modelled, simulated and analyzed by means of the commercial TRNSYS software platform (version 17) while satisfying the heating demand of a typical detached house situated in Ulaanbaatar (Mongolia).
The simulations results were compared with those associated with the operation of the following 3 different fossil fuel-based conventional heating systems (currently used in Mongolian residences) in order to assess the potential savings in terms of primary energy consumption, the amount of burned coal, carbon dioxide equivalent emissions as well as operating costs according to the Mongolian scenario:
-
CS1: The conventional system is only equipped with a low-pressure coal-burning stove;
-
CS2: The conventional system is equipped with a low-pressure coal-burning stove together with an electric heater installed inside a thermal energy storage;
-
CS3: The conventional system is only equipped with an electric heater immersed into a thermal energy storage.
The simulation results highlighted that:
-
The proposed system (PS) allows the reduction of the primary energy as well as the operating costs in comparison to all the reference heating systems. The largest savings can be obtained when the performance of PS is contrasted with those associated with CS3;
-
The proposed system is not convenient from an environmental point of view only with respect to the conventional system CS3. The largest savings in terms of global CO2 equivalent emissions are achieved in comparison to CS1;
-
The expected return on the investment is not acceptable when the proposed system is compared with the conventional system CS1 (economic incentives supporting the application of solar systems are required), while it is reasonable with respect to the reference plants CS2 and CS3.
The main findings of the paper can be summarized in more detail as follows:
  • in comparison to the Mongolian conventional heating systems assumed as references, the proposed system is potentially able to reduce the primary energy consumption by up to 34.6%, the amount of burned coal by up to 68.6%, the carbon dioxide equivalent emissions by up to 52.3% as well as the operating costs by up to 49.6%;
  • The proposed triple system allows a significant reduction of primary energy consumption (by approximately 32.5%), the amount of coal that is burned (by approximately 68.6%), the carbon dioxide equivalent emissions (by approximately 52.3%) and the operating costs (by approximately 23.6%) in comparison to the most common heating system (CS1) in the Ger districts of Ulaanbaatar [1];
  • Using solar thermal collectors for heating purposes can contribute to covering a relevant percentage (approximately 38%) of the heating demand of Mongolian residential applications;
  • The effects of the dust deposition on glass tubes on the overall energy, environmental and economic performance of the proposed system are very relevant taking into account that the potential energy, environmental and economic savings are reduced from 7.0% up to 17.8% with respect to the case without the soiling effects. As a consequence, the cleaning strategy and timing of the solar collectors have to be investigated in more detail.
In order to facilitate the future implementation of the proposed system and support the decision-makers in carrying out the introduction of such plants, the authors would like to:
-
Contrast the simulation results with the experimental data in order to assess the feasibility of the simulation models;
-
Perform a sensitivity analysis with the aim of evaluating the effects of both the size and technology of both the solar collectors as well as the thermal energy storage on the overall energy, environmental and economic performance of the proposed system;
-
Evaluate alternative control logics in order to find the one capable of maximizing the associated benefits;
-
Define and assess different cleaning strategies of solar collectors in order to identify the one that allows for the maximization of the amount of energy provided by the solar technology for heating purposes.

Author Contributions

Conceptualization: A.R., P.E., A.C., A.A. (Atsushi Akisawa), A.A. (Amarbayar Adiyabat) and S.S.; data curation: A.R., P.E., A.C.; formal analysis: A.R., P.E., A.C. and A.A. (Amarbayar Adiyabat); funding acquisition: A.R., A.C. and S.S.; investigation: A.R., P.E., A.C. and A.A. (Amarbayar Adiyabat); methodology: A.R., P.E., A.C., A.A. (Atsushi Akisawa), A.A. (Amarbayar Adiyabat) and S.S.; project administration: A.R., P.E., A.C., A.A. (Atsushi Akisawa), A.A. (Amarbayar Adiyabat) and S.S.; resources: A.R., P.E., A.C., A.A. (Atsushi Akisawa), A.A. (Amarbayar Adiyabat) and S.S.; supervision: A.R., A.A. (Atsushi Akisawa), A.A. (Amarbayar Adiyabat) and S.S.; Validation: A.R., P.E., A.C., A.A. (Atsushi Akisawa), A.A. (Amarbayar Adiyabat) and S.S.; visualization: A.R., P.E., A.C.; writing–original draft: A.R., P.E., A.C., A.A. (Atsushi Akisawa), A.A. (Amarbayar Adiyabat) and S.S.

Funding

The APC was funded by the “V:ALERE 2019 program” of the University of Campania Luigi Vanvitelli (Italy).

Acknowledgments

For the publication of this article the authors would like to thank the “V:ALERE 2019 program” of the University of Campania Luigi Vanvitelli (Italy) that assigns contributions for the diffusion of open access research products.

Conflicts of Interest

The authors declare no conflicts of interest.

Nomenclature

Latin letters
Aarea (m2), empirically-derived constant (m3/mg)
a1first order efficiency coefficient (W/m2K)
a2second order efficiency coefficient (W/m2K2)
abssolar absorptance coefficient (-)
Bempirically-derived constant (-)
Cempirically-derived constant (mm−1)
cspecific heat (kJ/kgK)
CCcapital cost (€)
CO2carbon dioxide
COSlow-pressure coal-burning stove
CSconventional system
CS1conventional system 1
CS2conventional system 2
CS3conventional system 3
Dempirically-derived constant (mm−1)
Eenergy (kWh, kJ)
EHelectric heater
ffunction
Gglobal solar irradiance (W/m2)
hconvective heat transfer coefficient (W/m2K)
IHEinternal heat exchanger
Lempirically-derived constant (s/m)
LHVlower heating value (kJ/kg)
mmass (kg)
Nnumber of experimentally investigated glass tubes (-)
OCoperating cost (€)
Ppower (kW)
PESprimary energy saving (%)
PM10particles with aerodynamic diameters less than or equal to 10 μm
PSproposed system
Qempirically-derived constant (m/s)
Rmeasurand
RADradiator
RPradiators pump
sthickness (m)
SFCsolar field collectors
SPsolar pump
SPBsimple pay-back period (years)
STDStandard Temperature Difference (°C)
Ttemperature (°C)
Tamboutdoor air temperature (°C)
Tmaverage temperature between inlet and outlet of solar thermal collectors (°C)
Troomindoor air temperature (°C)
Troom,targetset-point of indoor air temperature (°C)
TTES,6temperature at node 6 of the thermal energy storage (°C)
TTES,toptemperature at top layer (node 1) of the thermal energy storage (°C)
TTES,top,targettarget temperature at top layer (node 1) of the thermal energy storage (°C)
TESthermal energy storage
Uthermal transmittance (W/m2K)
UCunit cost (€/kWhel, €/kgcoal)
uuncertainty
u x E energy output-based emission factor (kg/kWh, kg/kJ)
vvelocity (m/s)
V ˙ volumetric flow rate (m3/h)
wfactor indicating the wind direction (-)
xgeneric pollutant
xidaily average PM10 emissions during the ith day (mg/m3)
yidaily average wind factor during the ith day (-)
z1,idaily average rain rate during the ith day (mm)
z2,idaily average snow rate during the ith day (mm)
Greeks
αCO2 equivalent emission factor for electricity production (kgCO2/kWhel)
βCO2 equivalent emission factor of coal-burning (kgCO2/kWhp)
difference
∆TONswitch on temperature difference (°C)
ηthermal efficiency
η0intercept efficiency
λthermal conductivity (W/mK)
ρdensity (kg/m3)
τglass tube transmittance (-)
Superscripts/Subscripts
CO2carbon dioxide
coalcoal
COScoal-burning stove
COS_6kW6 kW coal-burning stove
COS_9kW9 kW coal-burning stove
CSconventional system
CS1conventional system 1
CS2conventional system 2
CS3conventional system 3
dustdust deposition on glass tubes
eexternal
EHelectric heater
EH_3kW3 kWel electric heater
EH_9kW9 kWel electric heater
elelectric
frameframe of windows
glazingglazing of windows
iinternal
ininlet
outoutlet
pprimary
PPpower plant
PSproposed system
RPradiators circuit pump
SFCsolar field collectors
SPsolar circuit pump
TESthermal energy storage
ththermal
wwater, with
wallwall of the house
wgmixture of water and ethylene glycol (50%/50% by volume)
windowwindow of the house
w/owithout

References

  1. World Bank Group. Mongolia-Heating Stove Market. Trends in Poor, Peri-Urban. Ger Areas of Ulaanbaatar and Selected Markets Outside Ulaanbaatar; Stocktaking Report of the Mongolia Clean Stoves Initiative (English); World Bank Group: Washington, DC, USA, 2013; Available online: http://documents.worldbank.org/curated/en/388091468323667110/Mongolia-Heating-stove-market-trends-in-poor-peri-urban-ger-areas-of-Ulaanbaatar-and-selected-markets-outside-Ulaanbaatar-stocktaking-report-of-the-Mongolia-clean-stoves-initiative (accessed on 27 June 2019).
  2. Gheorghe, A.; Ankhbayar, B.; van Nieuwenhuyzen, H.; de Sa, R. Mongolia’s Air Pollution Crisis: A Call to Action to Protect Children’s Health; National Center for Public Health and UNICEF: Ulaanbaatar, Mongolia, 2018; Available online: https://www.unicef.org/mongolia/Mongolia_air_pollution_crisis_ENG.pdf (accessed on 13 August 2019).
  3. Erdenedavaa, P.; Rosato, A.; Adiyabat, A.; Akisawa, A.; Sibilio, S.; Ciervo, A. Model analysis of solar thermal system with the effect of dust deposition on the collectors. Energies 2018, 11, 1795. [Google Scholar] [CrossRef]
  4. Namjil, E. Overview of Energy/Electricity Demand and Renewable Energy Potential in Mongolia; Asia Super Grid Workshop: Seoul, Korea, 2016; Available online: https://www.renewable-ei.org/images/pdf/20160525/Enebish_Namjil.pdf (accessed on 27 June 2019).
  5. Pillarisetti, A.; Ma, R.; Buyan, M.; Nanzad, B.; Argo, Y.; Yang, X.; Smith, K.R. Advanced household heat pumps for air pollution control: A pilot field study in Ulaanbaatar, the coldest capital city in the world. Environ. Res. 2019, 176, 108381. [Google Scholar] [CrossRef] [PubMed]
  6. Dawes, J.; Galbaatar, L.N. Domestic Solar Space Heating in Mongolia: Design and Demonstration. Environ. Eng. Renew. Energy 1998, 109–118. [Google Scholar] [CrossRef]
  7. Bai, Y.; He, X.; Liu, Y.; Duan, J.; Wang, Y.; Hana, X. Experimental investigation of a solar thermal storage heater assembled with finned heat pipe and collective vacuum tubes. Energy Convers. Manag. 2018, 166, 463–473. [Google Scholar] [CrossRef]
  8. Mori, T.; Kawamura, A. Design of Solar Water Heating System for Detached House in Cold Climate Area. Energy Procedia 2014, 48, 1393–1400. [Google Scholar] [CrossRef] [Green Version]
  9. Zambolin, E.; Del Col, D. Experimental analysis of thermal performance of flat plate and evacuated tube solar collectors in stationary standard and daily conditions. Sol. Energy 2010, 84, 1382–1396. [Google Scholar] [CrossRef]
  10. Kocer, A.; Atmaca, I.; Ertikin, C. A comparison of flat plate and evacuated tube solar collectors with f-chart method. J. Therm. Sci. Technol. 2015, 35, 77–86. [Google Scholar]
  11. Najera-Trejo, M.; Martin-Domínguez, I.R.; Escobedo-Bretado, J.A. Economic feasibility of flat plate vs. evacuated tube solar collectors in a combisystem. Energy Procedia 2016, 91, 477–485. [Google Scholar] [CrossRef]
  12. Shuk, R.; Sumathy, K.; Erickson, P.; Gong, J. Recent advances in the solar water heating systems: A review. Renew. Sustain. Energy Rev. 2013, 19, 173–190. [Google Scholar] [CrossRef]
  13. Ayompe, L.M.; Duffy, A. Thermal performance analysis of a solar water heating system with heat pipe evacuated tube collector using data from a field trial. Sol. Energy 2013, 90, 17–28. [Google Scholar] [CrossRef] [Green Version]
  14. Abd-Elhady, M.S.; Nasreldin, M.; Elsheikh, M.N. Improving the performance of evacuated tube heat pipe collectors using oil and foamed metals. Ain Shams Eng. J. 2018, 9, 2683–2689. [Google Scholar] [CrossRef]
  15. Nkwetta, D.N.; Smyth, M.; Haghighat, F. Experimental performance evaluation and comparative analyses of heat pipe and direct flow augmented solar collectors. Appl. Therm. Eng. 2013, 60, 225–233. [Google Scholar] [CrossRef]
  16. Ong, K.S.; Tong, W.L. System performance of U-Tube and heat pipe solar water heaters. J. Appl. Sci. Eng. 2012, 15, 105–110. [Google Scholar]
  17. Jack, S.; Katenbrink, N.; Schubert, F. Evaluation methods for heat pipes in solar thermal collectors e test equipment and first result. In Proceedings of the ISES Solar World Congress, Kassel, Germany, 28 August–2 September 2011. [Google Scholar]
  18. Sarver, T.; Al-Qaraghuli, A.; Kazmerski, L.L. A comprehensive review of the impact of dust on the use of solar energy: History, investigations, results, literature, and mitigation approaches. Renew. Sustain. Energy Rev. 2013, 22, 698–733. [Google Scholar] [CrossRef]
  19. Mani, M.; Pillai, R. Impact of dust on solar photovoltaic (PV) performance: Research status, challenges and recommendations. Renew. Sustain. Energy Rev. 2010, 14, 3124–3131. [Google Scholar] [CrossRef]
  20. Adinoyi, M.J.; Said, S.A.M. Effect of dust accumulation on the power outputs of solar photovoltaic modules. Renew. Energy 2013, 60, 633–636. [Google Scholar] [CrossRef]
  21. Saidan, M.; Albaali, A.G.; Alasis, E.; Kaldellis, J.K. Experimental study on the effect of dust deposition on solar photovoltaic panels in desert environment. Renew. Energy 2016, 92, 499–505. [Google Scholar] [CrossRef]
  22. Zhao, J.; Wang, Z.; Wang, K.; Liu, J. Dust effect on thermal performance of flat plate solar collectors. J. Sol. Energy Eng. 2014, 137, 014502. [Google Scholar]
  23. Hegazy, A.A. Effect of dust accumulation on solar transmittance through glass covers of plate-type collectors. Renew. Energy 2001, 22, 525–540. [Google Scholar] [CrossRef]
  24. Cuddihy, E.F. Surface soiling: Theoretical mechanisms and evaluation of low soiling coatings. In Proceedings of the Flat-plate Solar Array Project Research Forum on Quantifying Degradation, Williamsburg, VA, USA, 6–8 December 1982. [Google Scholar]
  25. El-Nashar, A.M. Effect of dust accumulation on the performance of evacuated tube collectors. Sol. Energy 1994, 53, 105–115. [Google Scholar] [CrossRef]
  26. El-Nashar, A.M. Effect of dust deposition on the performance of a solar desalination plant operating in an arid desert area. Sol. Energy 2003, 75, 421–431. [Google Scholar] [CrossRef]
  27. El-Nashar, A.M. Seasonal effect of dust deposition on a field of evacuated tube collectors on the performance of a solar desalination plant. Desalination 2009, 239, 66–81. [Google Scholar] [CrossRef]
  28. Erdenedavaa, P.; Akisawa, A.; Adiyabat, A.; Otgonjanchiv, E. Observation and modeling of dust deposition on glass tube of evacuated solar thermal collectors in Mongolia. Renew. Energy 2019, 130, 613–621. [Google Scholar] [CrossRef]
  29. TRNSYS. The Transient Energy System Simulation Tool. Available online: http://www.trnsys.com (accessed on 11 June 2019).
  30. Antoniadis, C.N.; Martinopoulos, G. Optimization of a building integrated solar thermal system with seasonal storage using TRNSYS. Renew. Energy 2019, 137, 56–66. [Google Scholar] [CrossRef]
  31. Shrivastava, R.L.; Kumar, V.; Untawale, S.P. Modeling and simulation of solar water heater: A TRNSYS perspective. Renew. Sustain. Energy Rev. 2017, 67, 126–143. [Google Scholar] [CrossRef]
  32. Sibilio, S.; Rosato, A.; Ciampi, G.; Scorpio, M.; Akisawa, A. Building-integrated trigeneration system: Energy, environmental and economic dynamic performance assessment for Italian residential applications. Renew. Sustain. Energy Rev. 2017, 68, 920–933. [Google Scholar] [CrossRef]
  33. Erdenedavaa, P.; Akisawa, A.; Adiyabat, A.; Otgonjanchiv, E. Performance analysis of solar thermal system for heating of a detached house in harsh cold region of Mongolia. Renew. Energy 2018, 117, 217–226. [Google Scholar] [CrossRef]
  34. SketchUp Pro. Available online: https://www.sketchup.com/products/sketchup-pro (accessed on 11 June 2019).
  35. ISO. EUROPEAN STANDARD EN ISO 6946:2007. Building Components and Building Elements–Thermal Resistance and Thermal Transmittance–Calculation Method; ISO: Switzerland, 2007. [Google Scholar]
  36. ISO. EUROPEAN STANDARD EN ISO 10077-1:2006. Thermal performance of Windows, Doors and Shutters–Calculation of Thermal Transmittance, Part 1: General; ISO: Switzerland, 2006. [Google Scholar]
  37. Tong, J.C.-K.; Tse, J.M.-Y.; Jones, P.J. Development of thermal evaluation tool for detached houses in Mongolia. Energy Build. 2018, 173, 81–90. [Google Scholar] [CrossRef]
  38. ISO. EUROPEAN STANDARD EN ISO 7730:2005. Ergonomics of the Thermal Environment–Analytical Determination and Interpretation of Thermal Comfort Using Calculation of the PMV and PPD Indices and Local Thermal Comfort Criteria; ISO: Geneva, Switzerland, 2005. [Google Scholar]
  39. EnergyPlus. Weather Data. Available online: https://energyplus.net/weather-location/asia_wmo_region_2/MNG//MNG_Ulaanbataar.442920_IWEC (accessed on 11 June 2019).
  40. Jiangsu Sunrain Solar Energy Co. Available online: http://www.cccme.org.cn/shop/cccme6658/index.aspx (accessed on 11 June 2019).
  41. Test Report, Thermal Performance of a Solar Collector. Available online: https://www.igte.uni-stuttgart.de/en/publications/publikationen-forschungs-und-testzentrum-fuer-solaranlagen-00001/dokumente_tzs/jahresberichte_tests2010.pdf (accessed on 13 August 2019).
  42. UNI. EUROPEAN STANDARD UNI EN 12975-2:2006, Thermal Solar Systems and Components—Solar Collectors—Part 2: Test Methods; UNI: Milan, Italy, 2006; Available online: http://store.uni.com/catalogo/index.php/en-12975-2-2006.html?___store=en&josso_back_to=http%3A%2F%2Fstore.uni.com%2Fjosso-security-check.php&josso_cmd=login_optional&josso_partnerapp_host=store.uni.com&___from_store=it (accessed on 11 June 2019).
  43. Erdenedavaa, P.; Rosato, A.; Akisawa, A.; Adiyabat, A.; Ciervo, A.; Sibilio, S. Performance of solar collectors under Mongolian climatic conditions: Comparison between experimental and preliminary simulation results. In Proceedings of the Grand Renewable Energy 2018—International Conference and Exhibition, Pacifico Yokohama, Japan, 17–22 June 2018. [Google Scholar]
  44. Гэрийн ба халаалтын зуух. Available online: https://www.slideshare.net/NCRAPM/academid-uguh-hurliin-iltgel (accessed on 13 August 2019).
  45. ALAVA. Available online: http://www.grupoalava.com/repositorio/13a0/pdf/6942/2/caudalimetro-ultrasonico-de-bajo-coste-portatil---a1tds.pdf?d=1 (accessed on 11 June 2019).
  46. Eurotherm. Available online: https://www.eurotherm.co.uk/products/sensors/resistance-temperature-detector (accessed on 11 June 2019).
  47. UNI. UNI CEI ENV 13005:2000. Guide to the Expression of Uncertainty in Measurement (GUM); UNI: Milan, Italy, 2000. [Google Scholar]
  48. Mastrullo, R.M.A.; Rosato, A.; Vanoli, G.P.; Thome, J.R. A methodology to select the experimental plant instrumentation based on an a priori analysis of measurement errors and instrumentation cost. Int. Commun. Heat Mass Transf. 2008, 35, 689–695. [Google Scholar] [CrossRef]
  49. Fondital Spa. Available online: http://www.fondital.com/ww/en/ (accessed on 11 June 2019).
  50. Mongolian Energy Regulatory Commission. Statistics of Power System, Electricity Statistical Book; Mongolian Energy Regulatory Commission: Mongolia, Ulaanbaatar, 2014. [Google Scholar]
  51. World Bank. Mongolia: Heating in Poor, Peri-Urban Ger Areas of Ulaanbaatar; Asia Sustainable and Alternative Energy Program; World Bank: Washington, DC, USA, 2009. [Google Scholar]
  52. Chicco, G.; Mancarella, P. Assessment of the greenhouse gas emissions from cogeneration and trigeneration systems. Part I: Models and indicators. Energy 2008, 33, 410–417. [Google Scholar] [CrossRef]
  53. IGES. List of Grid Emission Factors. Available online: https://pub.iges.or.jp/pub/list-grid-emission-factor (accessed on 11 June 2019).
  54. Unegui.mn. Available online: https://www.unegui.mn/thrmzh-barilgyin-material-tlsh-thij-ed/tlee-nrstlsh/ulan-bator/ (accessed on 11 June 2019).
  55. Mongolian Energy Regulatory Commission. Available online: http://erc.gov.mn/index.php?newsid=675# (accessed on 11 June 2019).
  56. Ramos, A.; Chatzopoulou, M.A.; Guarracino, I.; Freeman, J.; Markides, C.N. Hybrid photovoltaic-thermal solar systems for combined heating, cooling and power provision in the urban environment. Energy Convers. Manag. 2017, 150, 838–850. [Google Scholar] [CrossRef]
  57. Paradigma. PS9000. Available online: http://www.paradigmaitalia.it/serbatoio-accumuloacqua-calda-riscaldamento/boiler-accumulo-acqua-calda/accumulo-solaretermico (accessed on 30 July 2019).
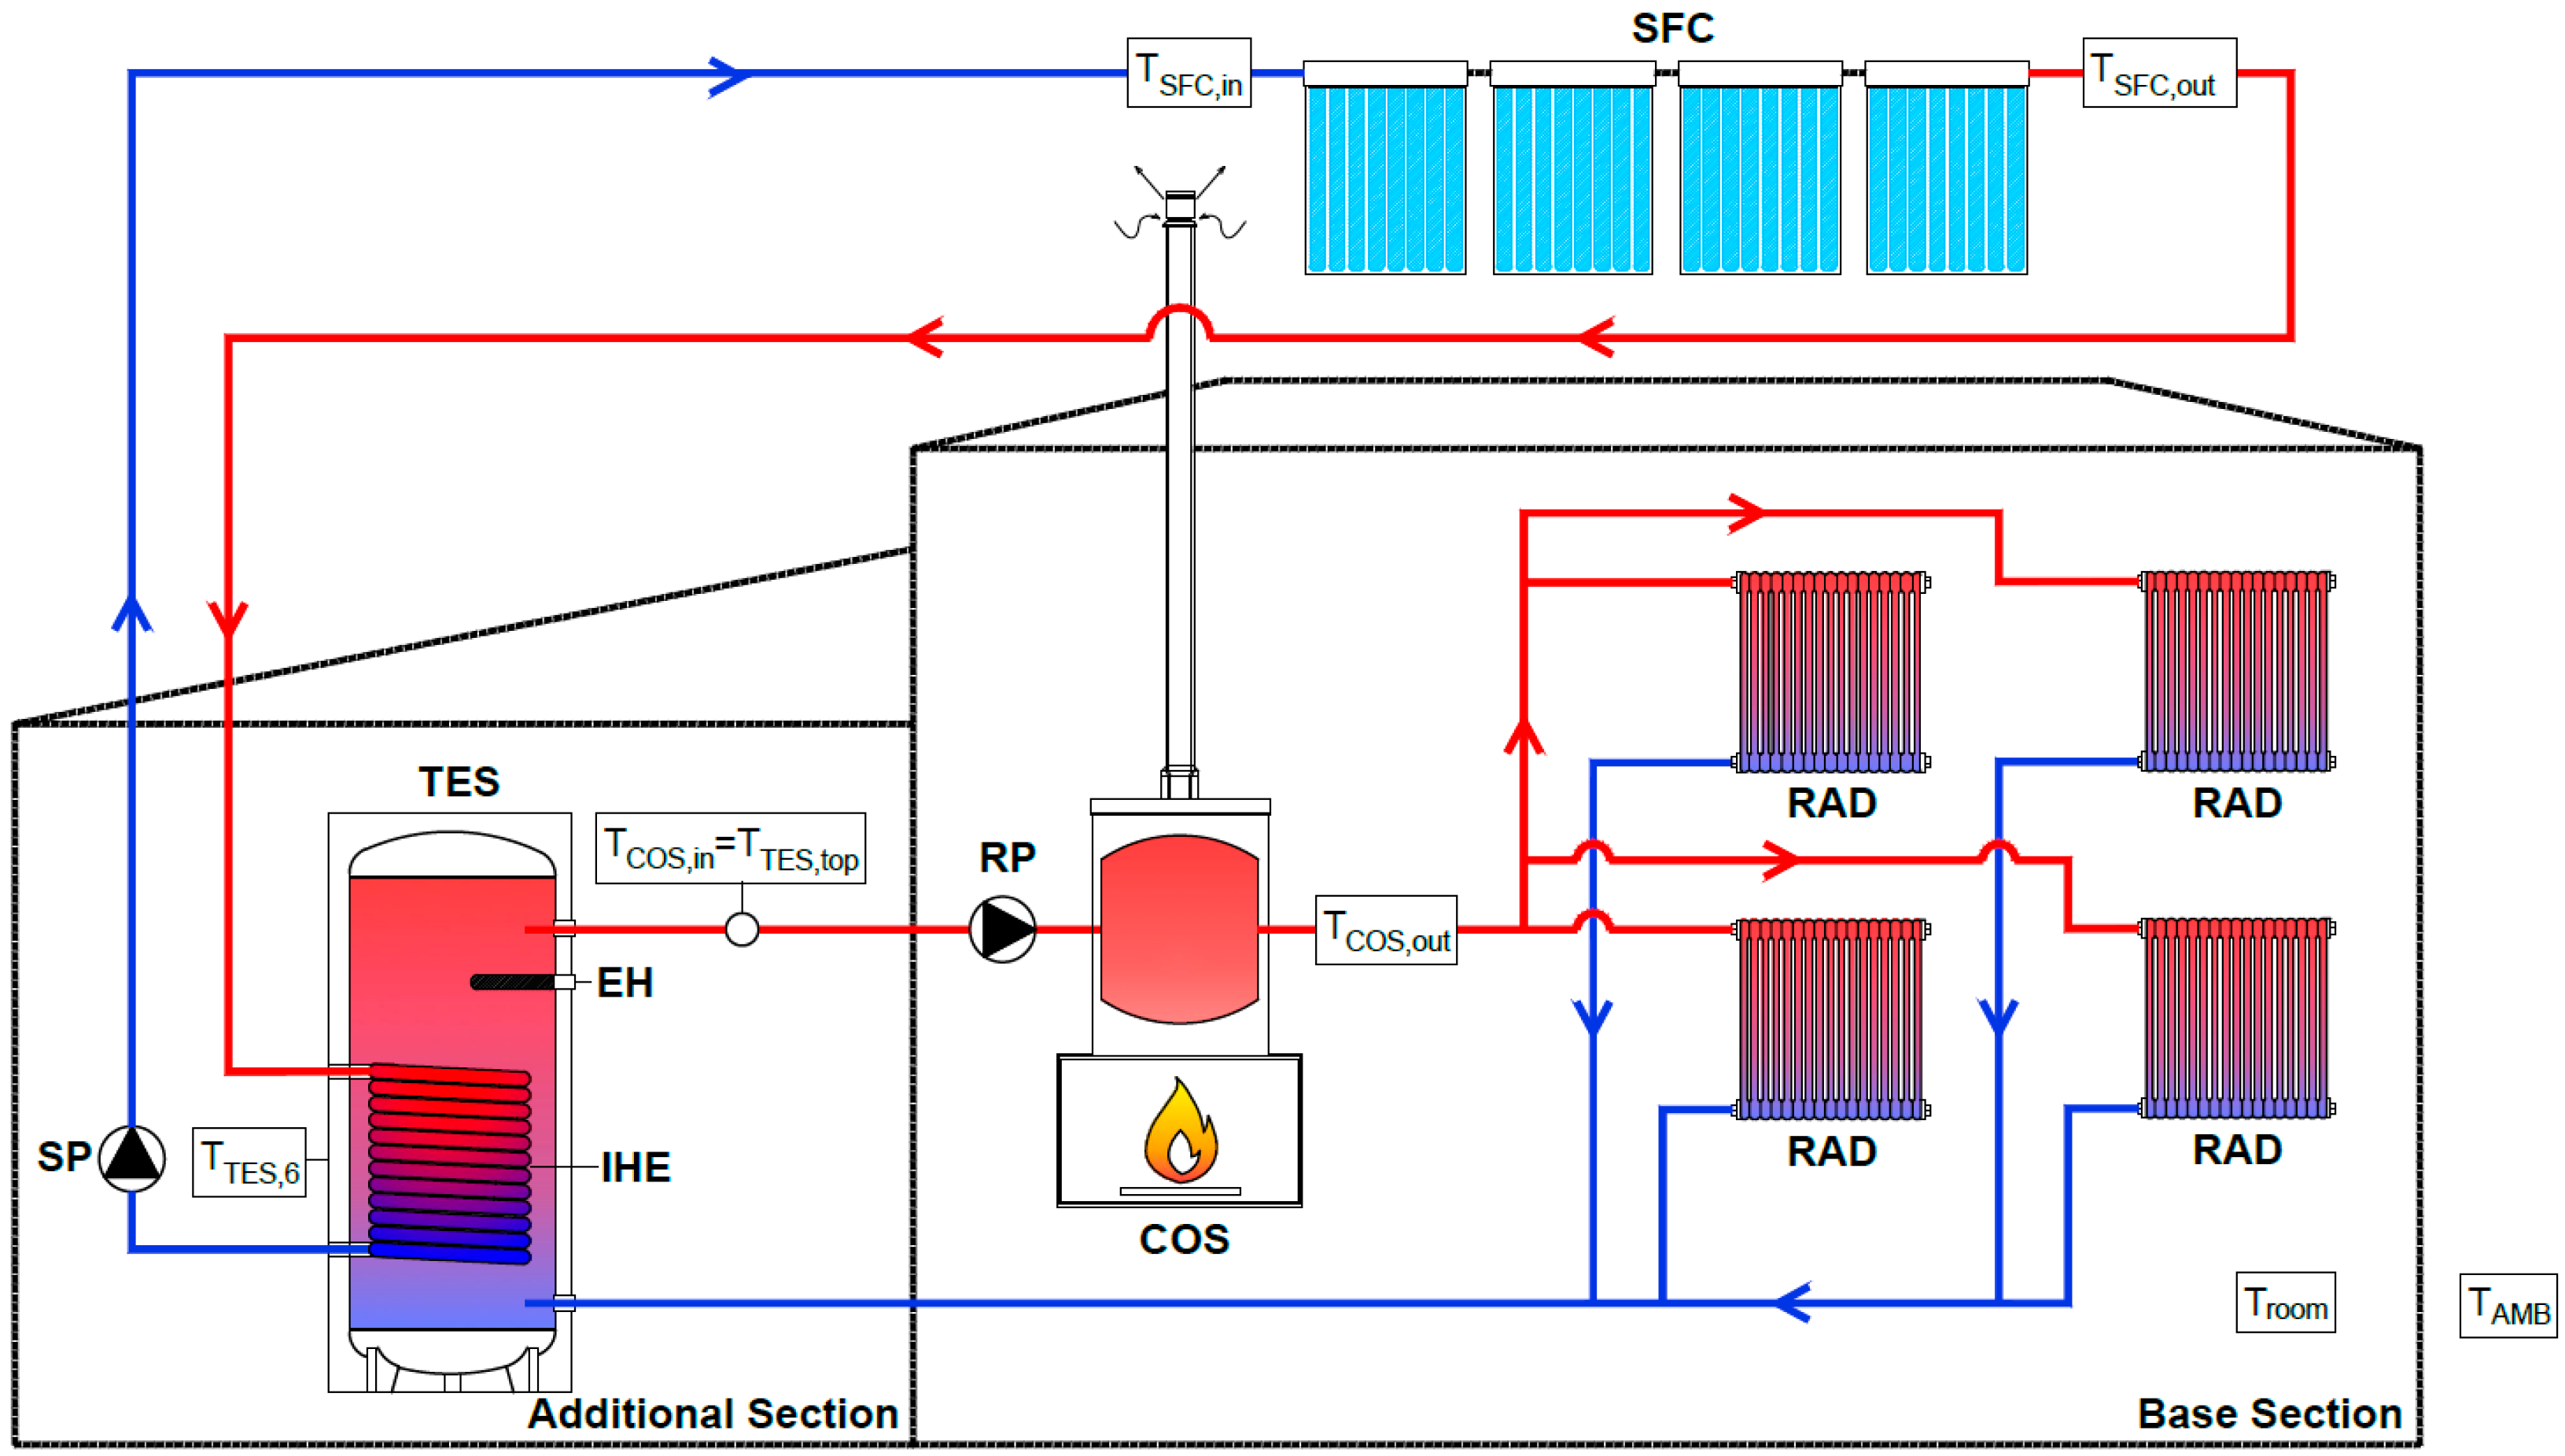
Figure 1. Schematic of the proposed plant.
Buildings 09 00185 g001
Figure 2. Scheme of the TRNSYS project.
Buildings 09 00185 g002
Figure 3. Architectural model of the Mongolian detached house.
Buildings 09 00185 g003
Figure 4. The daily profiles of the number of occupants as a function of the time (a) and the target room temperature as a function of the outside temperature (b).
Buildings 09 00185 g004
Figure 5. The outdoor temperature and global solar radiation on the horizontal plane during the heating season in Ulaanbaatar [39].
Buildings 09 00185 g005
Figure 6. Experimental thermal output of the stove as a function of the time.
Buildings 09 00185 g006
Figure 7. Daily thermal power produced by the stove for (a) the proposed system without dust deposition and (b) the proposed system with dust deposition.
Buildings 09 00185 g007
Figure 8. Schematics of the conventional heating system CS1 (a), the conventional heating system CS2 (b) and the conventional heating system CS3 (c).
Buildings 09 00185 g008
Figure 9. Daily thermal power produced by the stove for (a) the conventional heating system CS1 and (b) the conventional heating system CS2.
Buildings 09 00185 g009
Figure 10. The experimental daily average PM10 emissions, wind factor, rain rate and snow rate in Ulaanbaatar from October 2015 up to May 2016, together with the percentage reduction of daily average glass tube transmittance due to the dust deposition.
Buildings 09 00185 g010
Figure 11. Thermal outputs (a) and the radiators circuit pump (RP) control signal together with temperature levels (b) associated with the operation of the proposed system during a typical day (Sunday, 1 December).
Buildings 09 00185 g011aBuildings 09 00185 g011b
Figure 12. Space heating load-duration diagram for the proposed system without dust deposition.
Buildings 09 00185 g012
Figure 13. The energy flows associated with the operation of the proposed system (with and without dust deposition) as well as the conventional systems CS1, CS2 and CS3.
Buildings 09 00185 g013
Figure 14. Primary energy consumption (a), CO2 equivalent emissions (b) and operating costs (c) associated with the components of the proposed system (with and without dust deposition effects) during the heating season.
Buildings 09 00185 g014
Figure 15. Seasonal values of primary energy saving (PES), ∆CO2, ∆mcoal and ∆OC associated with the proposed system (with and without dust deposition effects) when compared with the conventional system CS1 (a), the conventional system CS2 (b) and the conventional system CS3 (c).
Buildings 09 00185 g015aBuildings 09 00185 g015b
Table 1. The materials of the walls of the house.
Layer Material
(from Outside to Inside)
Thickness
s (m)
Thermal Conductivity
λ (W/mK)
Floor of Base SectionConcrete0.3001.160
Floor of Additional SectionConcrete0.1501.160
Roof (Part 1 and Part 2) of Base Section and Roof of Additional Section Timber block0.0050.140
Expanded polystyrene0.0700.033
Timber panel0.0150.033
Gypsum panel0.0050.170
Vertical walls of Base Section Bricks0.1000.810
Glass wool0.0300.037
Timber block0.1500.140
Gypsum panel0.0050.170
Vertical walls of Additional SectionBricks0.2500.810
Cement render0.0100.350
Internal wall Sand and cement render0.0100.350
Timber block0.1500.140
Gypsum panel0.0050.170
Table 2. The characteristics of the walls of the house.
BASE SECTION
Element TypeOrientation/Azimuth
(°)
Surface Slope
(°)
Wall Area without Windows
(m2)
absi,wall/abse,wall
(-)
hi,wall/he,wall
(W/m2K)
Uwall
(W/m2K)
FloorHorizontal/-048.000.6/0.60.70/20.003.87
Roof (Part 1)South/102526.480.6/0.65.00/20.000.38
Roof (Part 2)North/1902526.480.6/0.65.00/20.000.38
Front wallSouth/109015.400.6/0.62.50/20.000.49
Back wallNorth/1909018.400.6/0.62.50/20.000.49
Left side wallWest/1009016.500.6/0.62.50/20.000.49
Right side wall (Part 1)East/280908.800.6/0.62.50/20.000.49
Right side wall (Part 2)Internal wall906.300.6/0.62.50/2.500.89
ADDITIONAL SECTION
FloorHorizontal/-010.000.6/0.60.70/20.007.73
RoofEast/2804.3510.030.6/0.65.00/20.000.38
Front wallSouth/10902.620.6/0.62.50/20.002.97
Back wallNorth/190905.520.6/0.62.50/20.002.97
Right side wallEast/280906.650.6/0.62.50/20.002.97
Left side wallInternal wall906.300.6/0.62.50/2.500.89
Table 3. The characteristics of the windows of the house.
BASIS SECTION
Number of WindowsOrientation/Azimuth (°)hi,window/he,window (W/m2K)Uframe/Uglazing (W/m2K)Window TypeSpacing GasGeometry
(mm)
Aframe (m2)Awindow (m2)
2South/102.50/20.006.00/2.83Double glazingAir4/16/40.2251.275
1West/100
ADDITIONAL SECTION
1South/102.50/20.006.00/2.83Double glazingAir4/16/40.4352.465
Table 4. The main characteristics of the thermal energy storage.
Tank volume0.5 m3
Tank internal height1.695 m
Height of flow inlet/outlet0.2 m/1.6 m
Tank loss coefficient2.34 kJ/hm2K
Height of heat exchanger inlet1.4 m
Height of heat exchanger outlet0.25 m
Heat exchanger inside diameter0.021 m
Heat exchanger outside diameter0.024 m
Total surface area of heat exchanger1.3 m2
Heat exchanger length17.5 m
Heat exchanger material conductivity1436.4 kJ/hmK
Table 5. The main control algorithms and strategies of the proposed system (PS).
ComponentONOFF
Solar circuit pump
(during normal operation)
∆TON = (TSFC,out − TTES,6) ≥ 8 °C∆TON = (TSFC,out − TTES,6) < 4 °C
Radiators pump from 7.00 a.m. to 11.00 p.m.Troom ≤ Troom,target − 1.5 °CTroom ≥ Troom,target + 1.5 °C
Electric heater from 4.30 a.m. to 11.00 p.m.TTES,top ≤ TTES,top,target − 5 °CTTES,top ≥ TTES,top,target
Table 6. Set-point temperature at the top of the thermal energy storage for the operation of the proposed system.
Activation StateTTES,top,target (°C)
Solar Circuit PumpRadiators Pump4.30 a.m.–7.00 a.m. 7.00 a.m.–11.00 p.m.
Tamb > −10 °COFF or ONOFF or ON3535
Tamb ≤ −10 °COFFON5555
OFF5535
ONON5535
OFF
Table 7. The main control algorithms and strategies of the conventional heating systems CS1, CS2 and CS3.
Charging Times of the Stove
(hh:mm)
Component
Radiators PumpElectric Heater
Conventional system CS17:00
9:00
10:30
12:00
13:30
15:00
16:30
18:00
19:30
21:00
22:30
ONTroom ≤ Troom,target − 1.5 °C-
OFFTroom ≥ Troom,target + 1.5 °C-
Conventional system CS27:00
10:30
14:00
17:30
21:00
ONTroom ≤ Troom,target − 1.5 °CTTES,top ≤ 45 °C
AND
Radiators pump ON
OFFTroom ≥ Troom,target + 1.5 °CTTES,top ≥ 55 °C
OR
Radiators pump OFF
Conventional system CS3-ONTroom ≤ Troom,target − 1.5 °CTTES,top ≤ 40 °C
OFFTroom ≥ Troom,target + 1.5 °CTTES,top ≥ 55 °C
Table 8. Simple pay-back periods as a function of the conventional system.
Without Dust DepositionWith Dust Deposition
PS vs. CS132.5 years61.9 years
PS vs. CS28.5 years10.7 years
PS vs. CS36.1 years7.1 years