Identification of the Best 3D Viewpoint within the BIM Model: Application to Visual Tasks Related to Facility Management


Abstract
1. Introduction
1.1. Context
1.2. Viewpoint Management Algorihtm
1.3. Case Study and Research Questions
- Effectiveness, i.e., how well users accomplish their objectives with the system;
- Efficiency, i.e., the resources used to accomplish the objectives;
- Satisfaction, i.e., users’ feelings about the use of the system.
- The success rate in performing the visual task;
- The accuracy with which the visual task is executed;
- The certainty degree with which the user undertakes the visual task;
- The speed in carrying out the visual task.
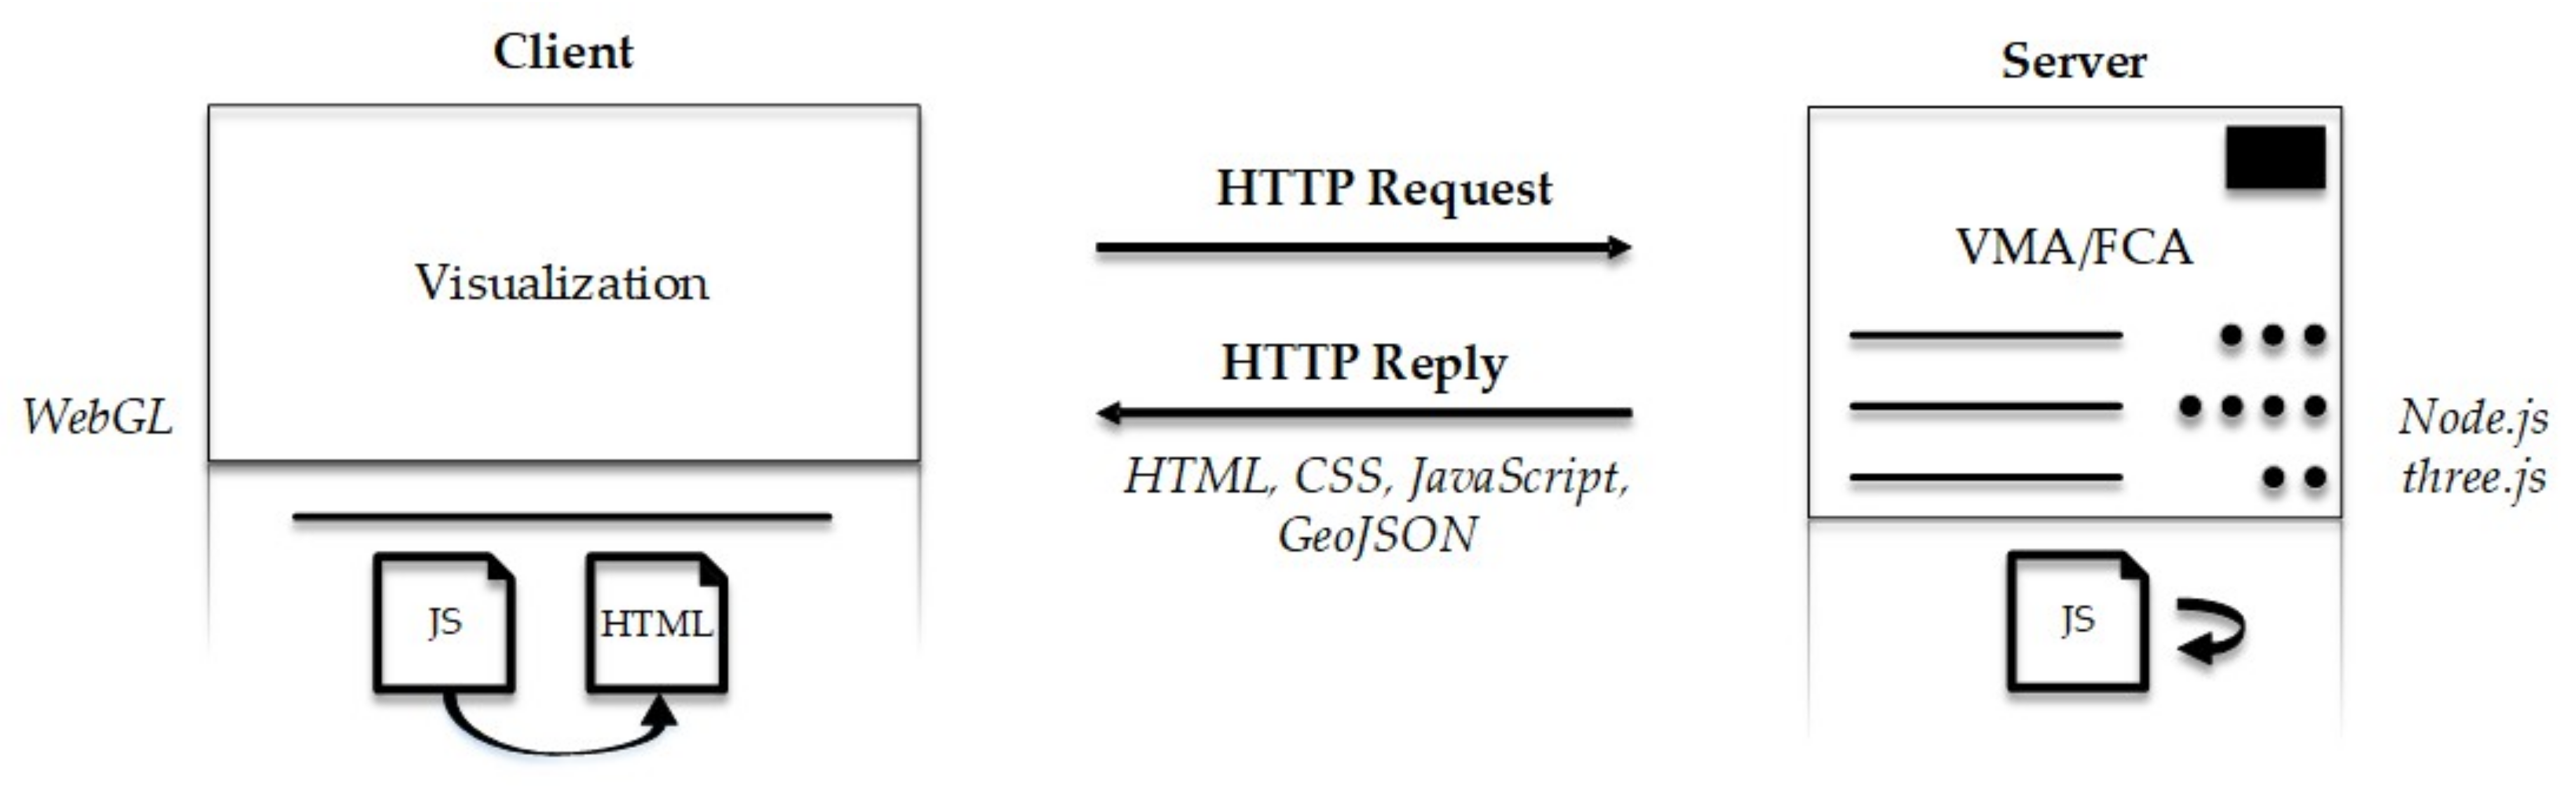
1.4. Software Architecture
2. Experimentation design
2.1. Empirical Approach
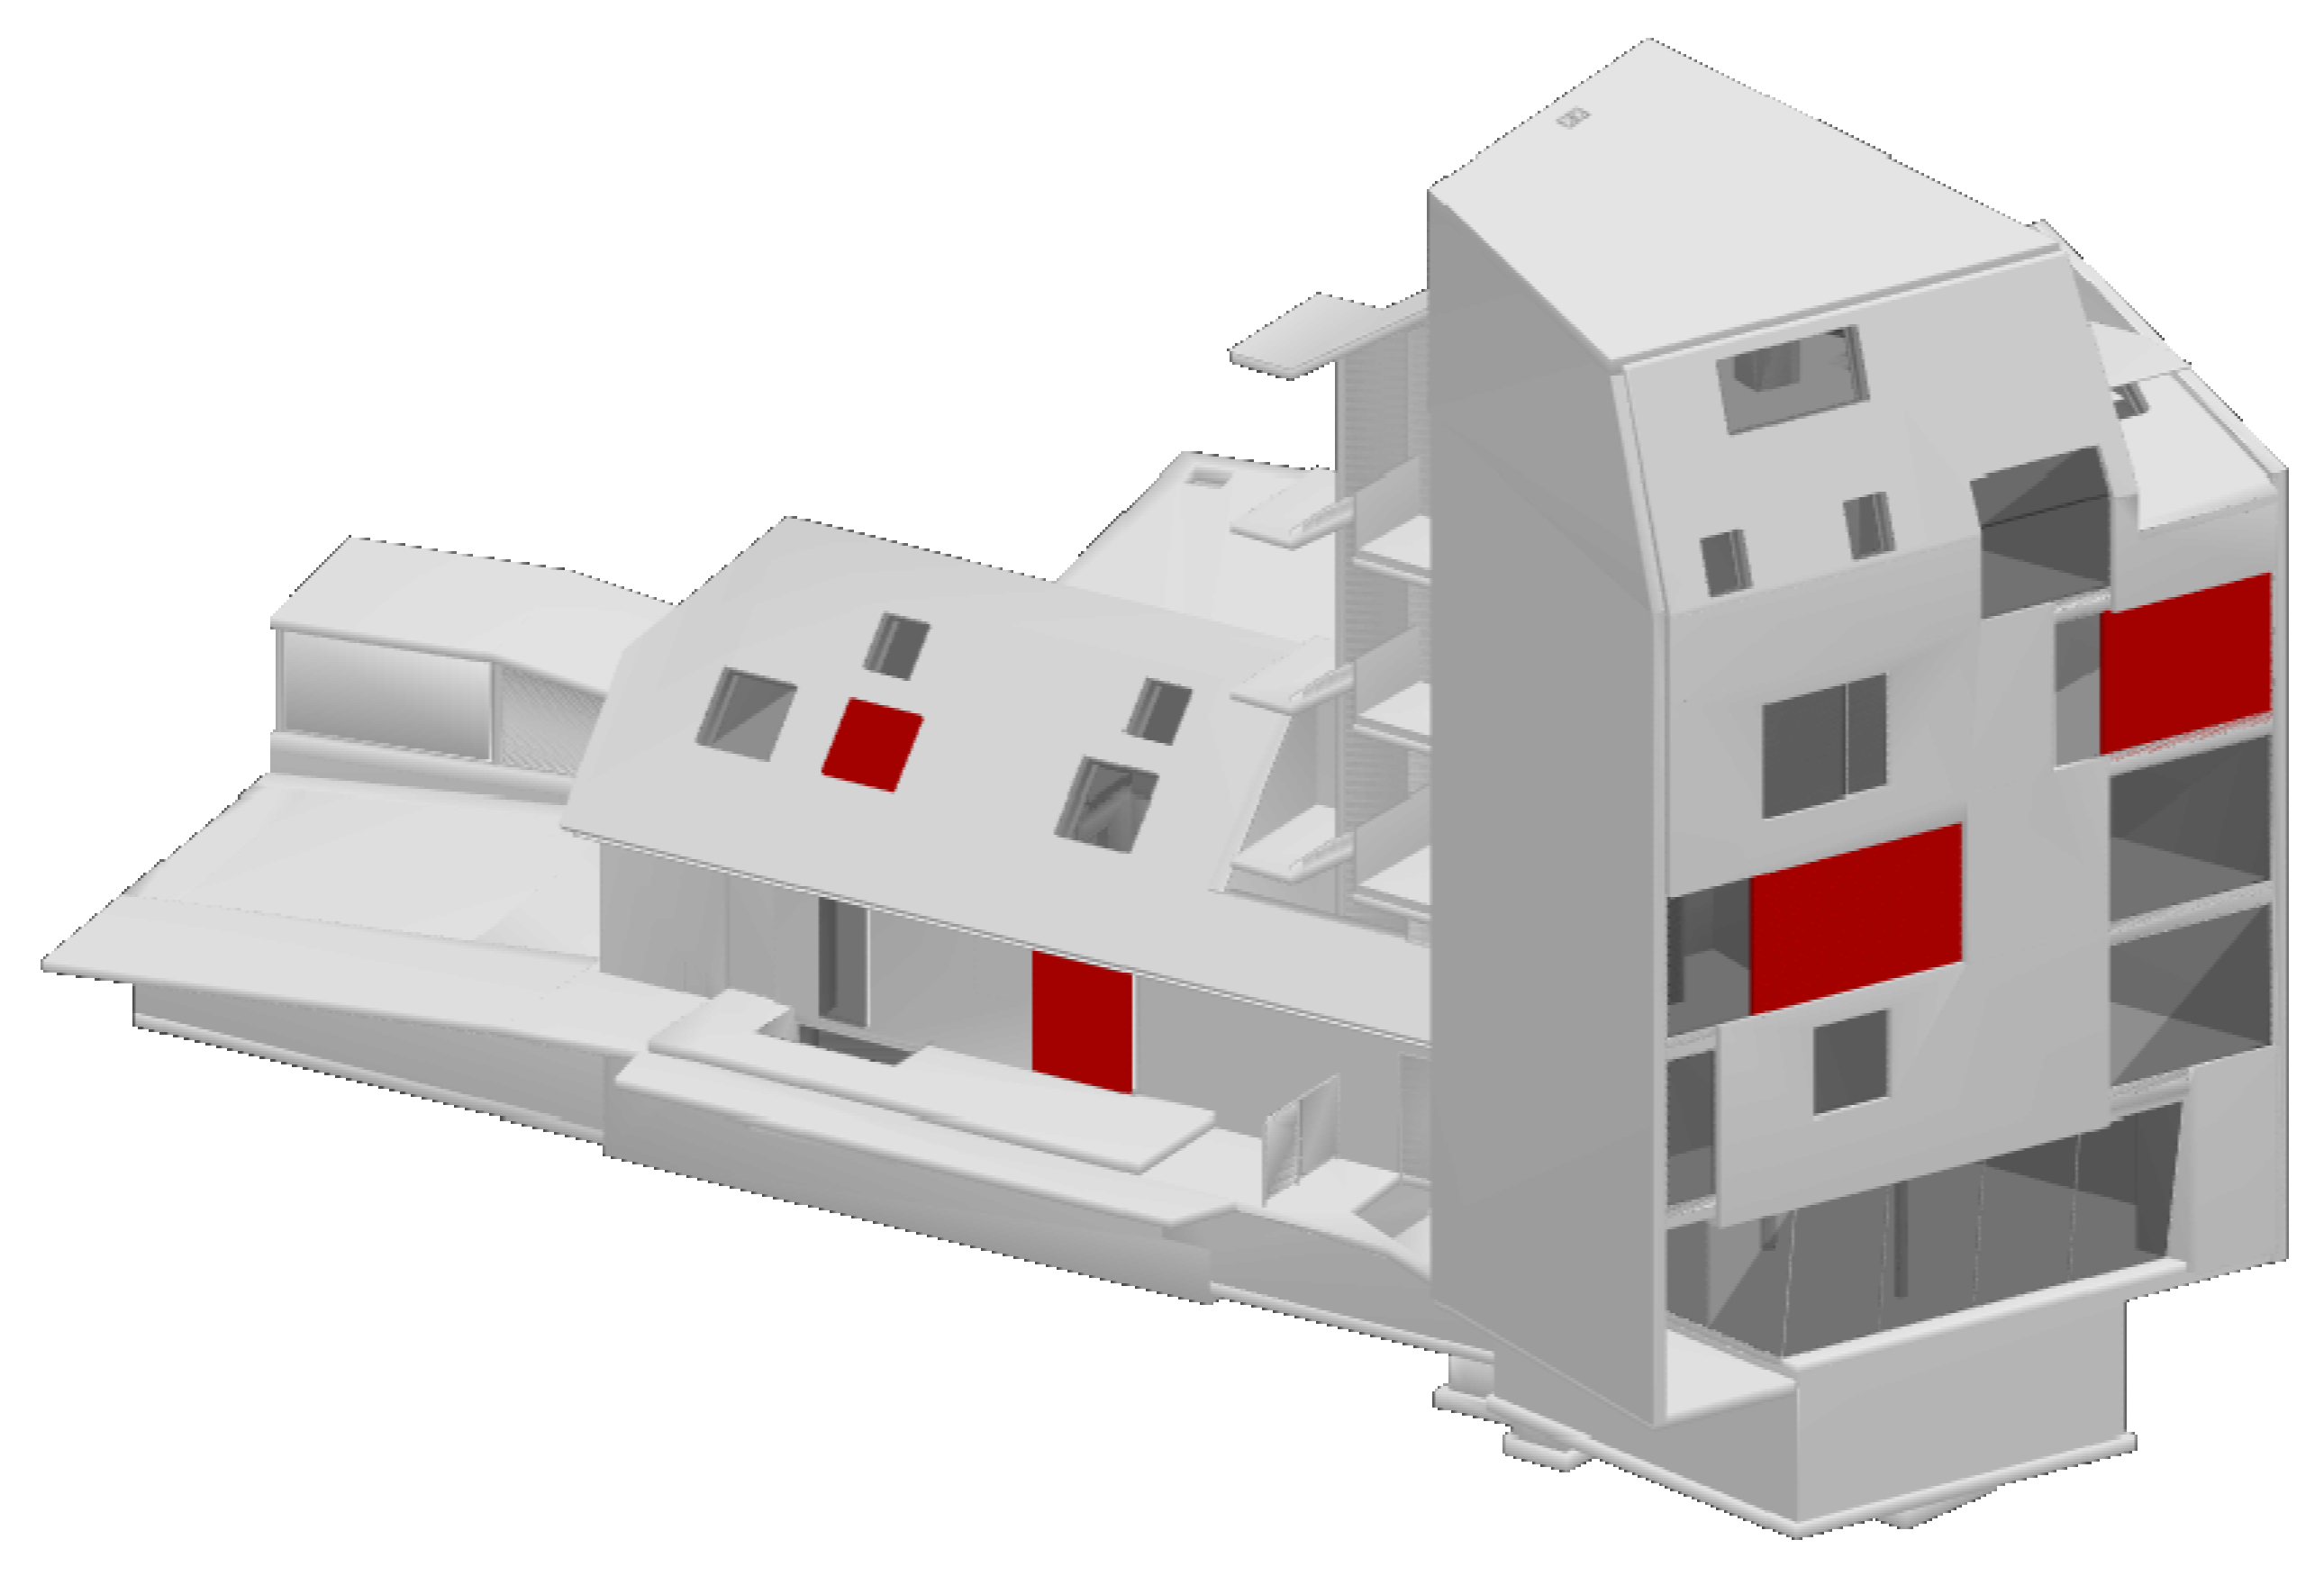
2.2. 3D Building Model
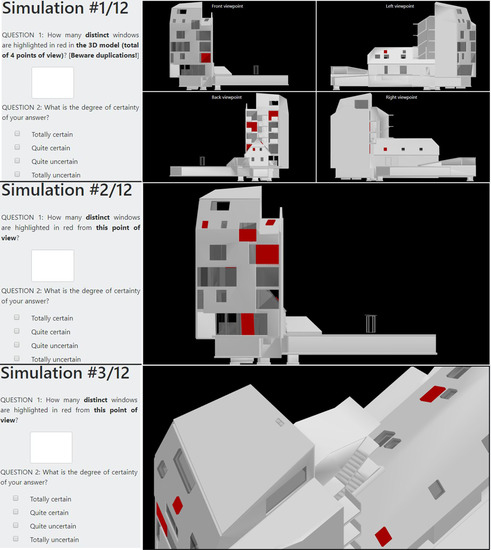
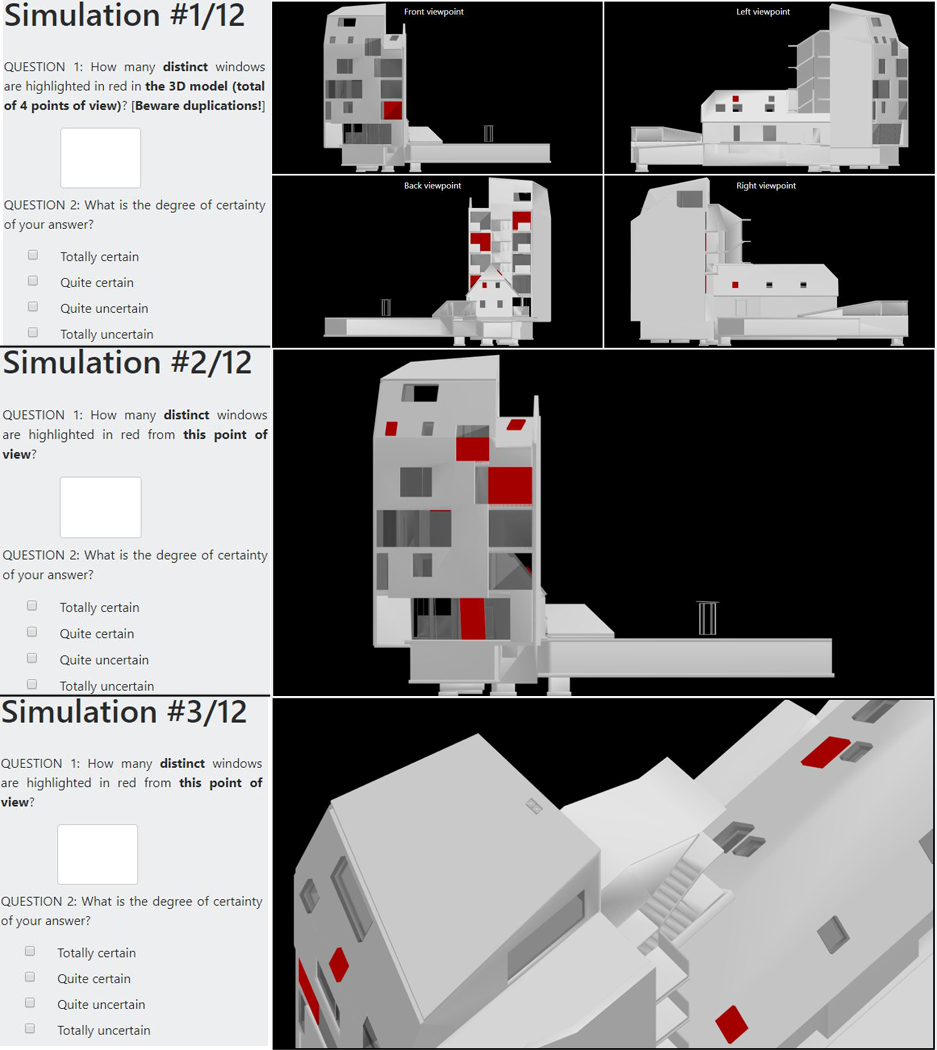
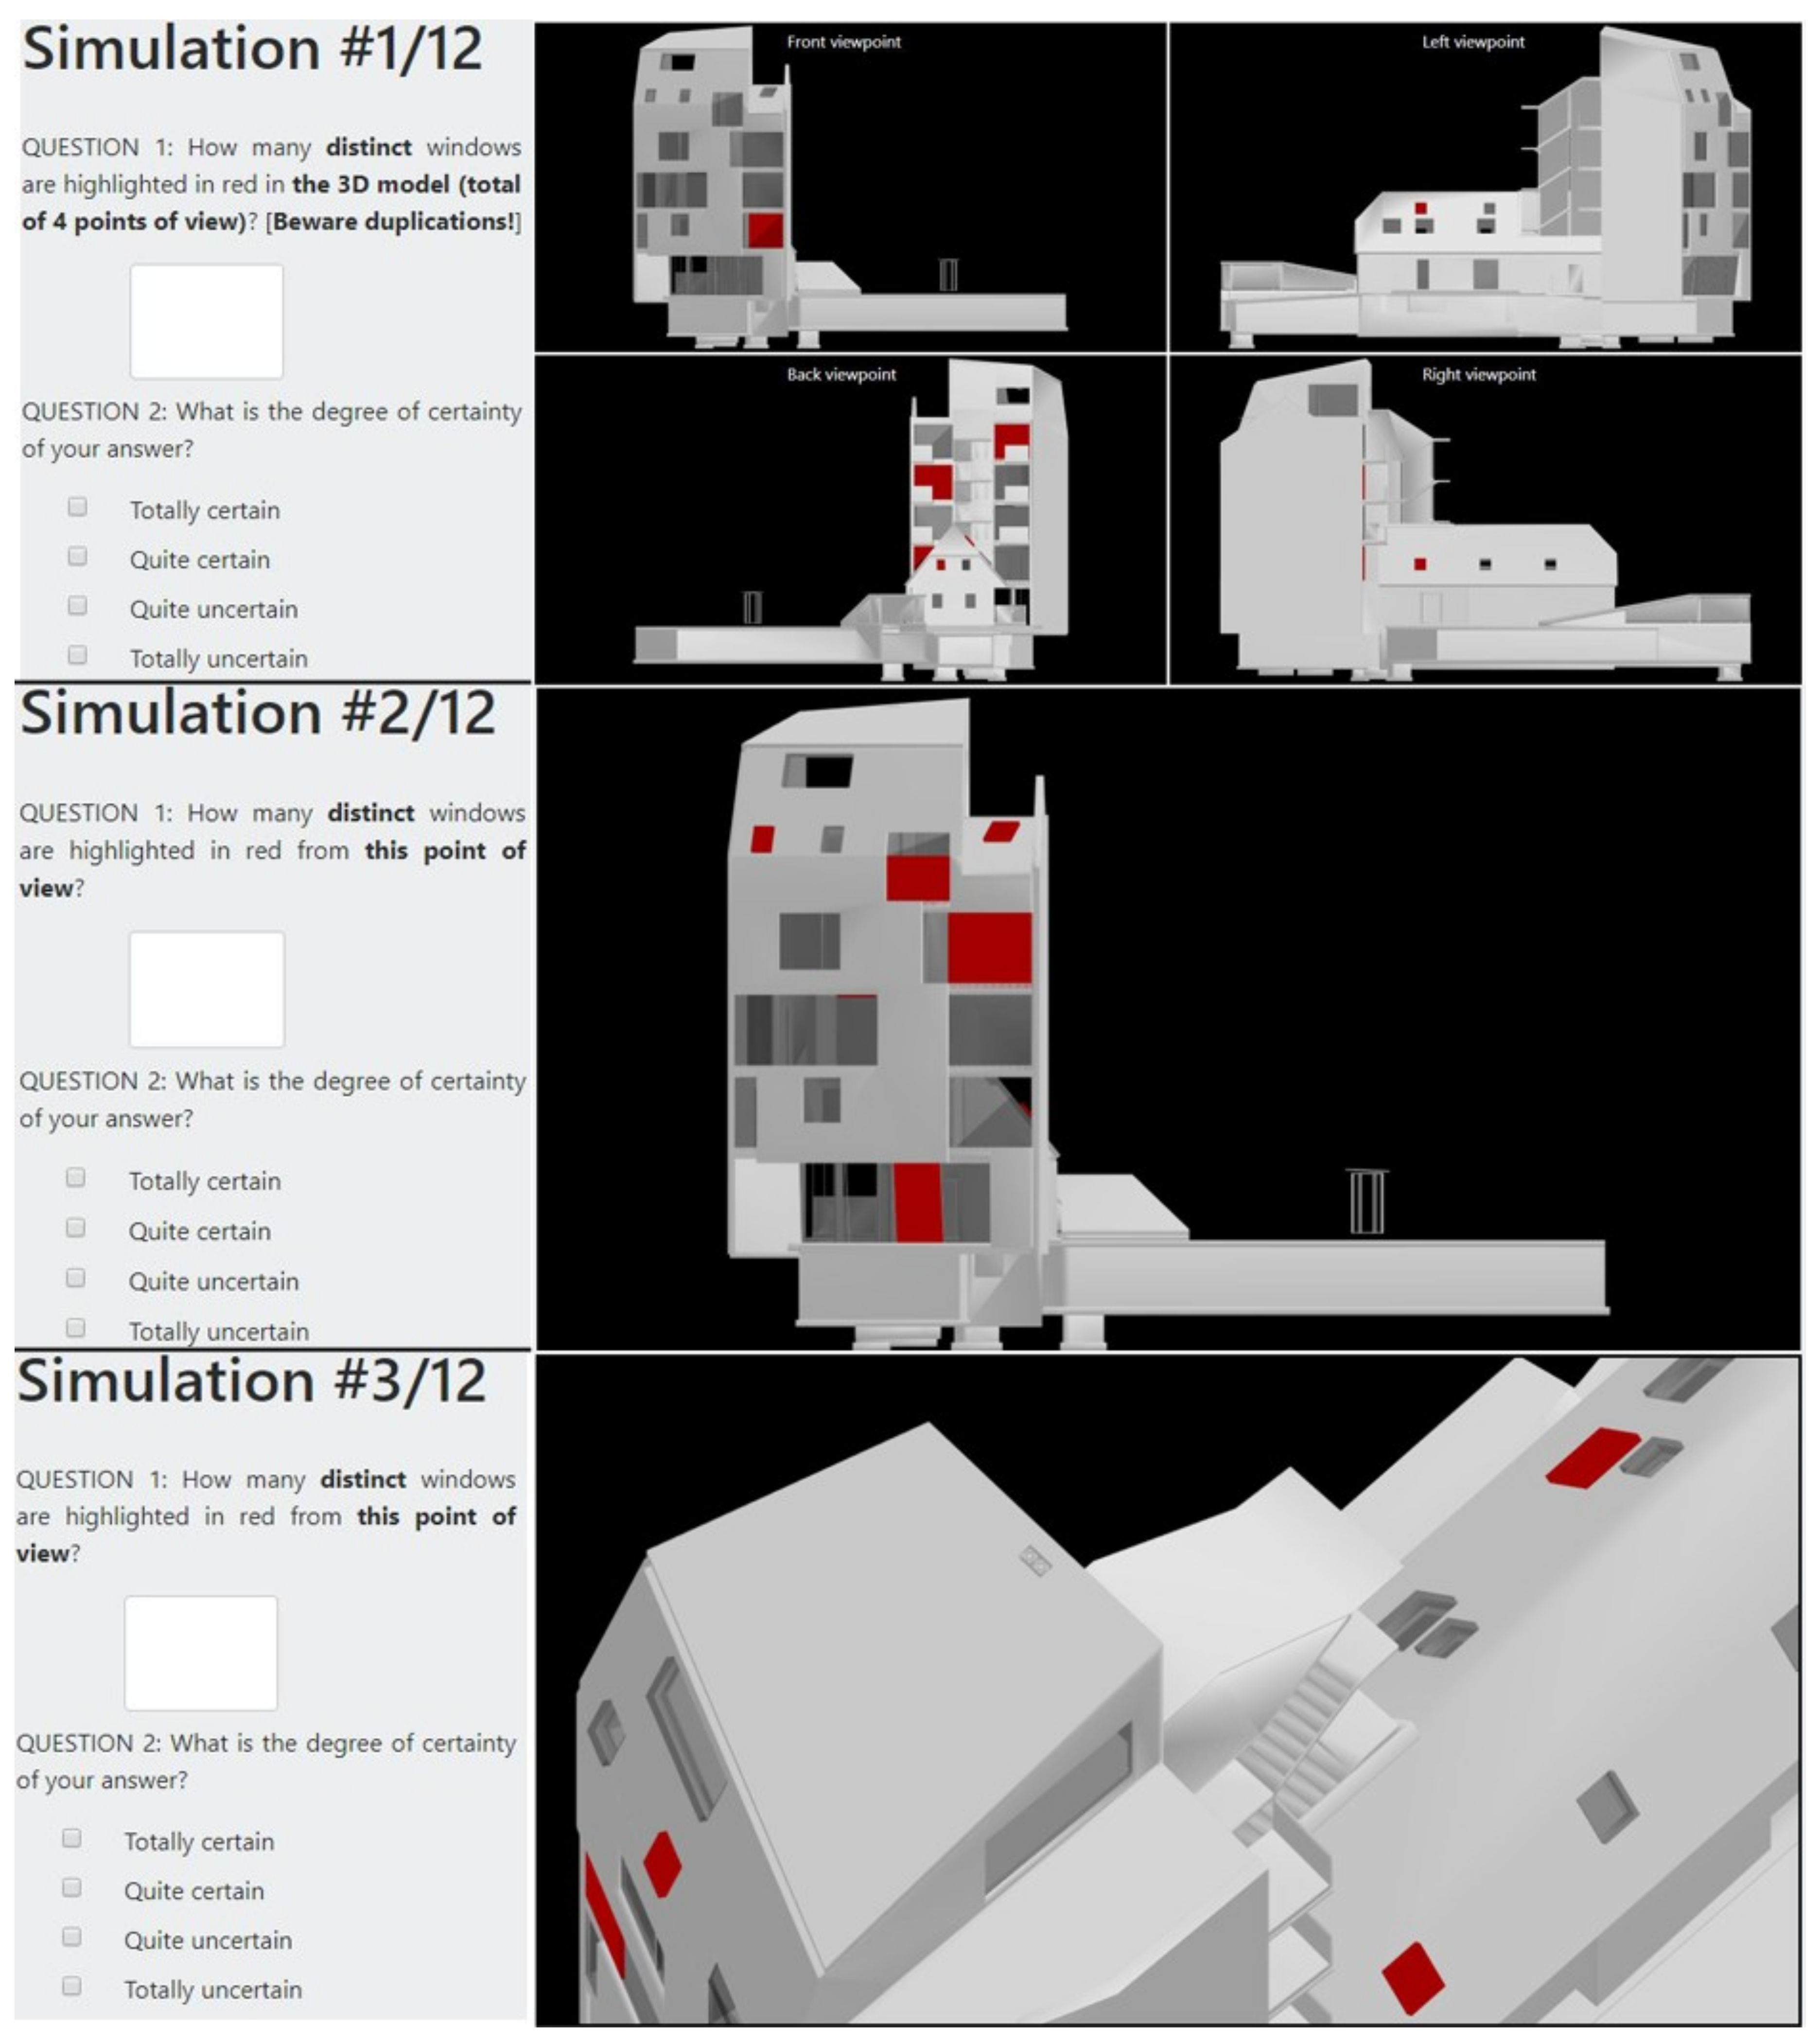
- The traditional four side points of view (4 simulations out of 12);
- A single side point of view, i.e., either from a front, back, left, or right viewpoint (4 simulations out of 12);
- Or a point of view that maximizes the visibility of 3D geometric objects’ view area inside the viewport, and is provided by the viewpoint management algorithm (4 simulations of out 12).
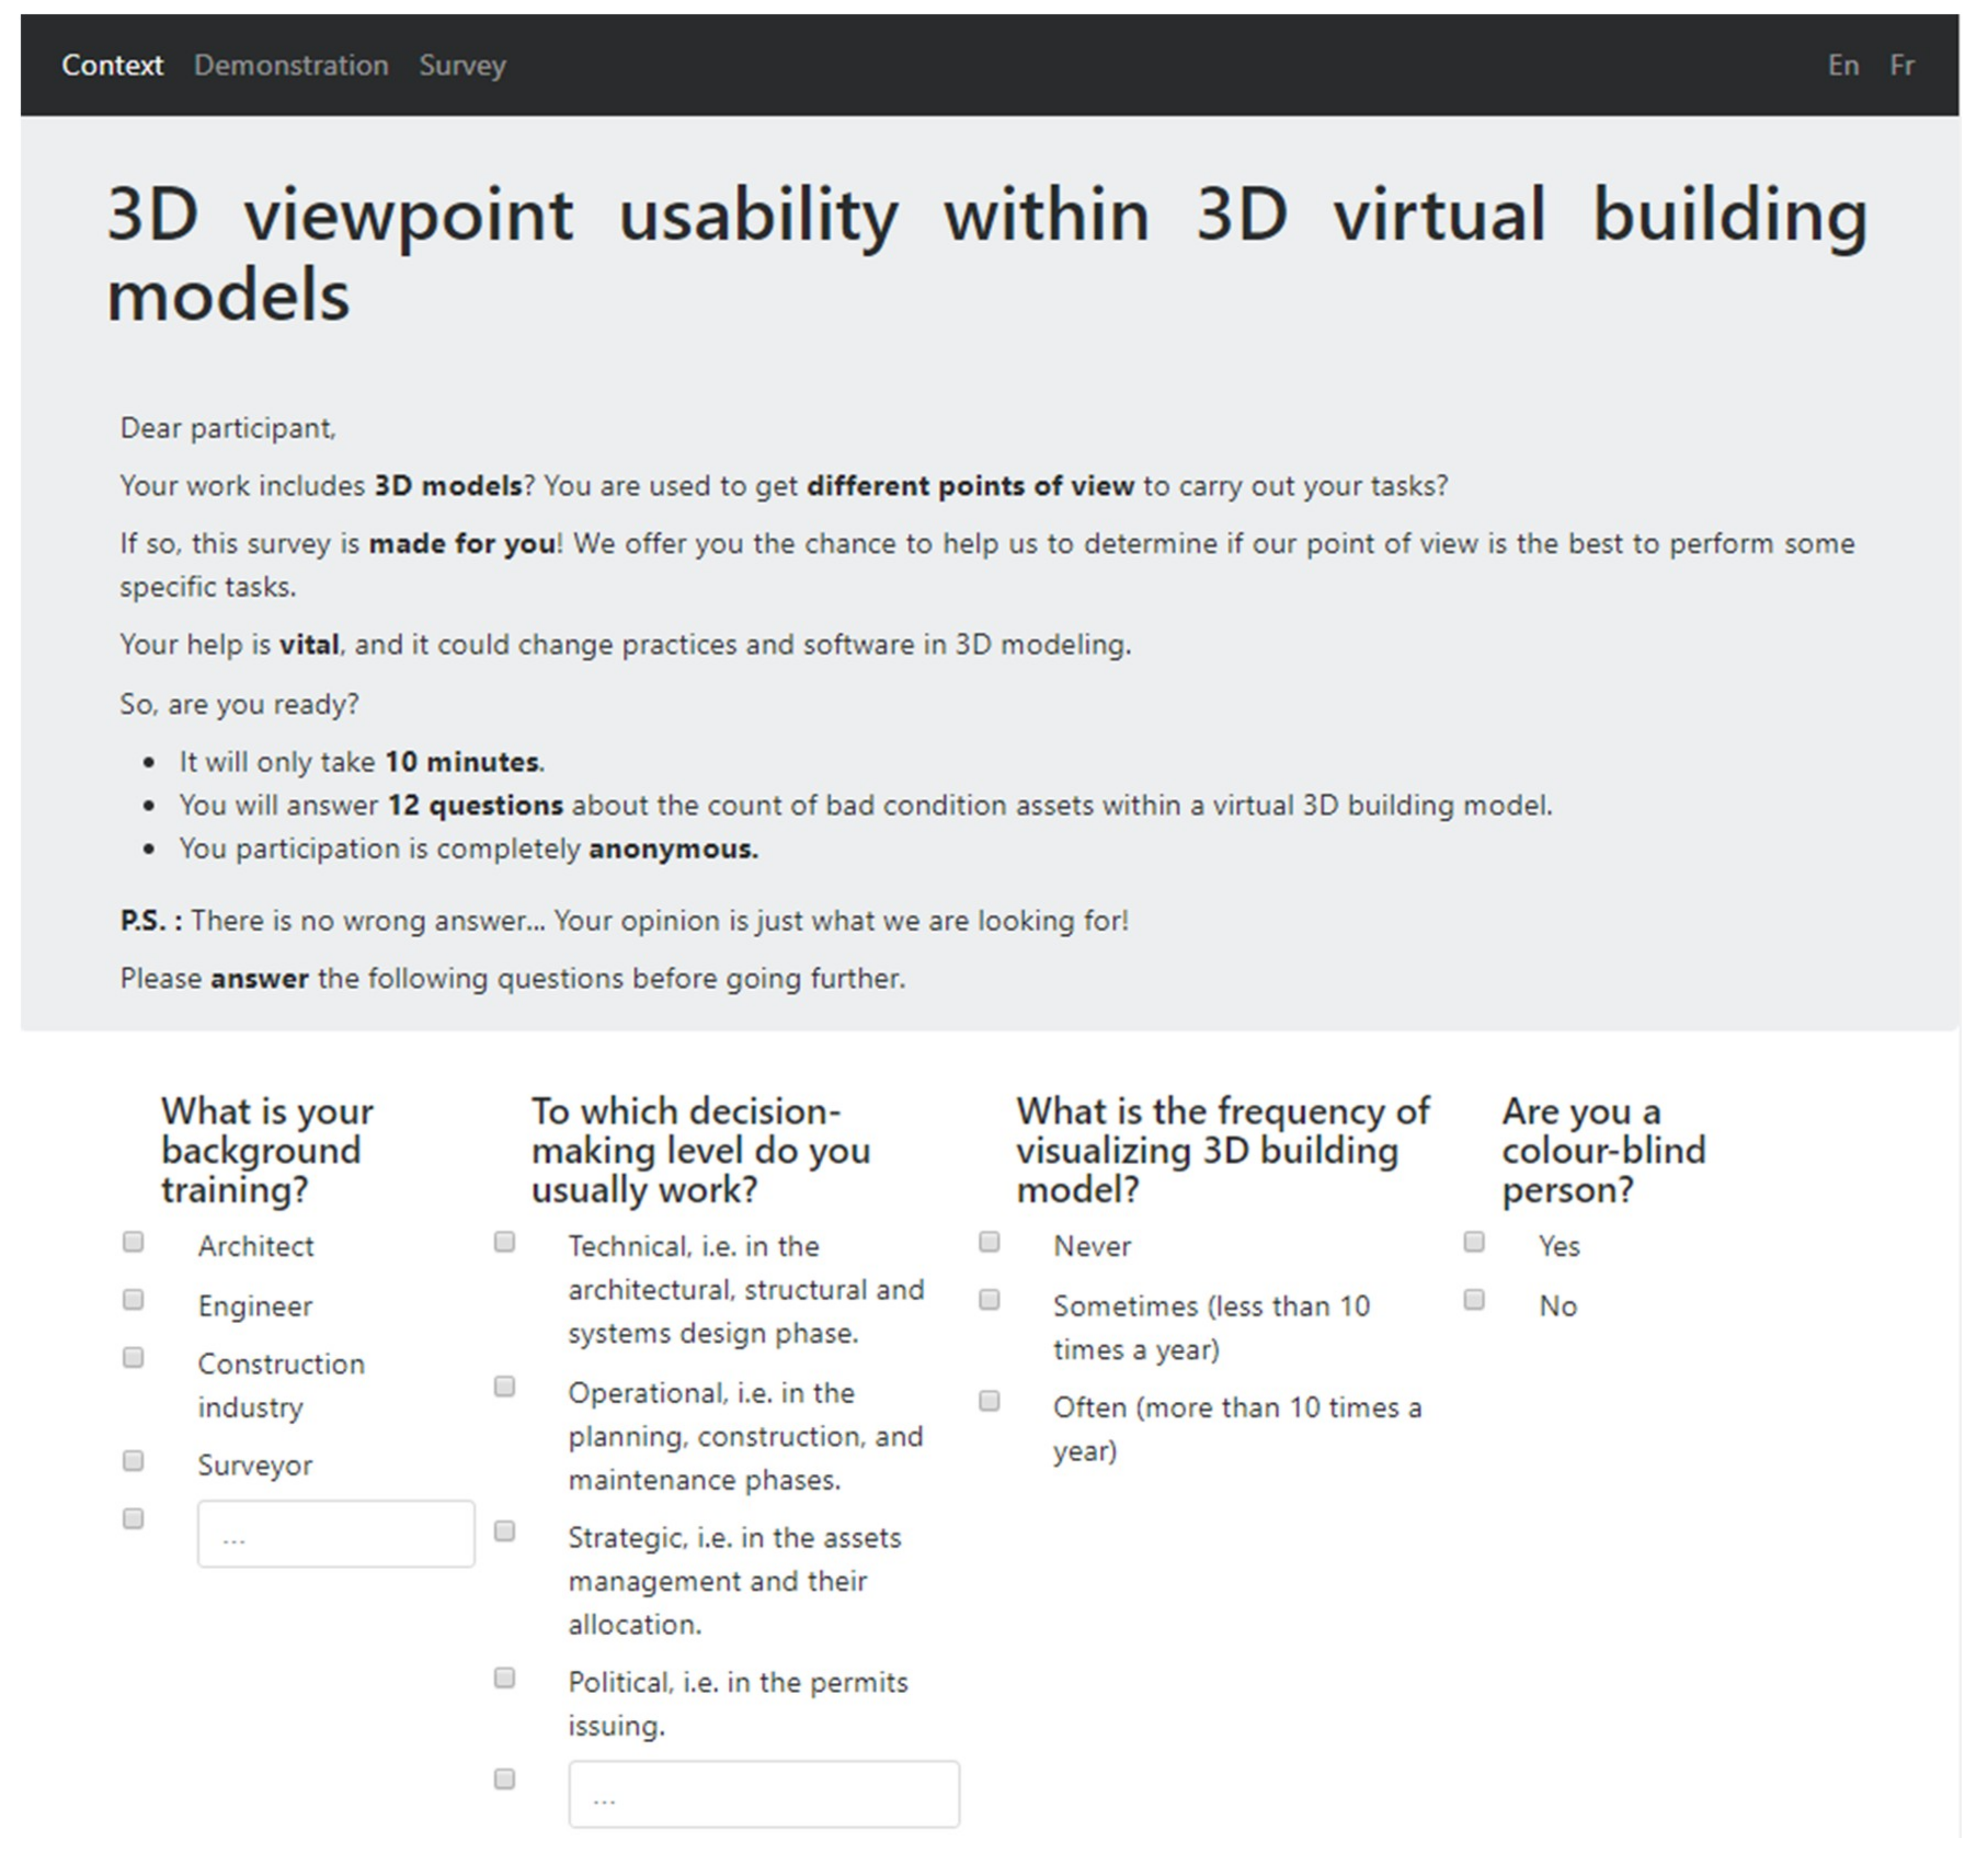
2.3. Online Questionaire
- The first section is related to the participant’s attributes. For this purpose, the participant must answer four questions linked to: His/her training background, the decision level to which he/she usually works, his/her frequency of visualizing 3D building models, his/her potential color perception deficiency.
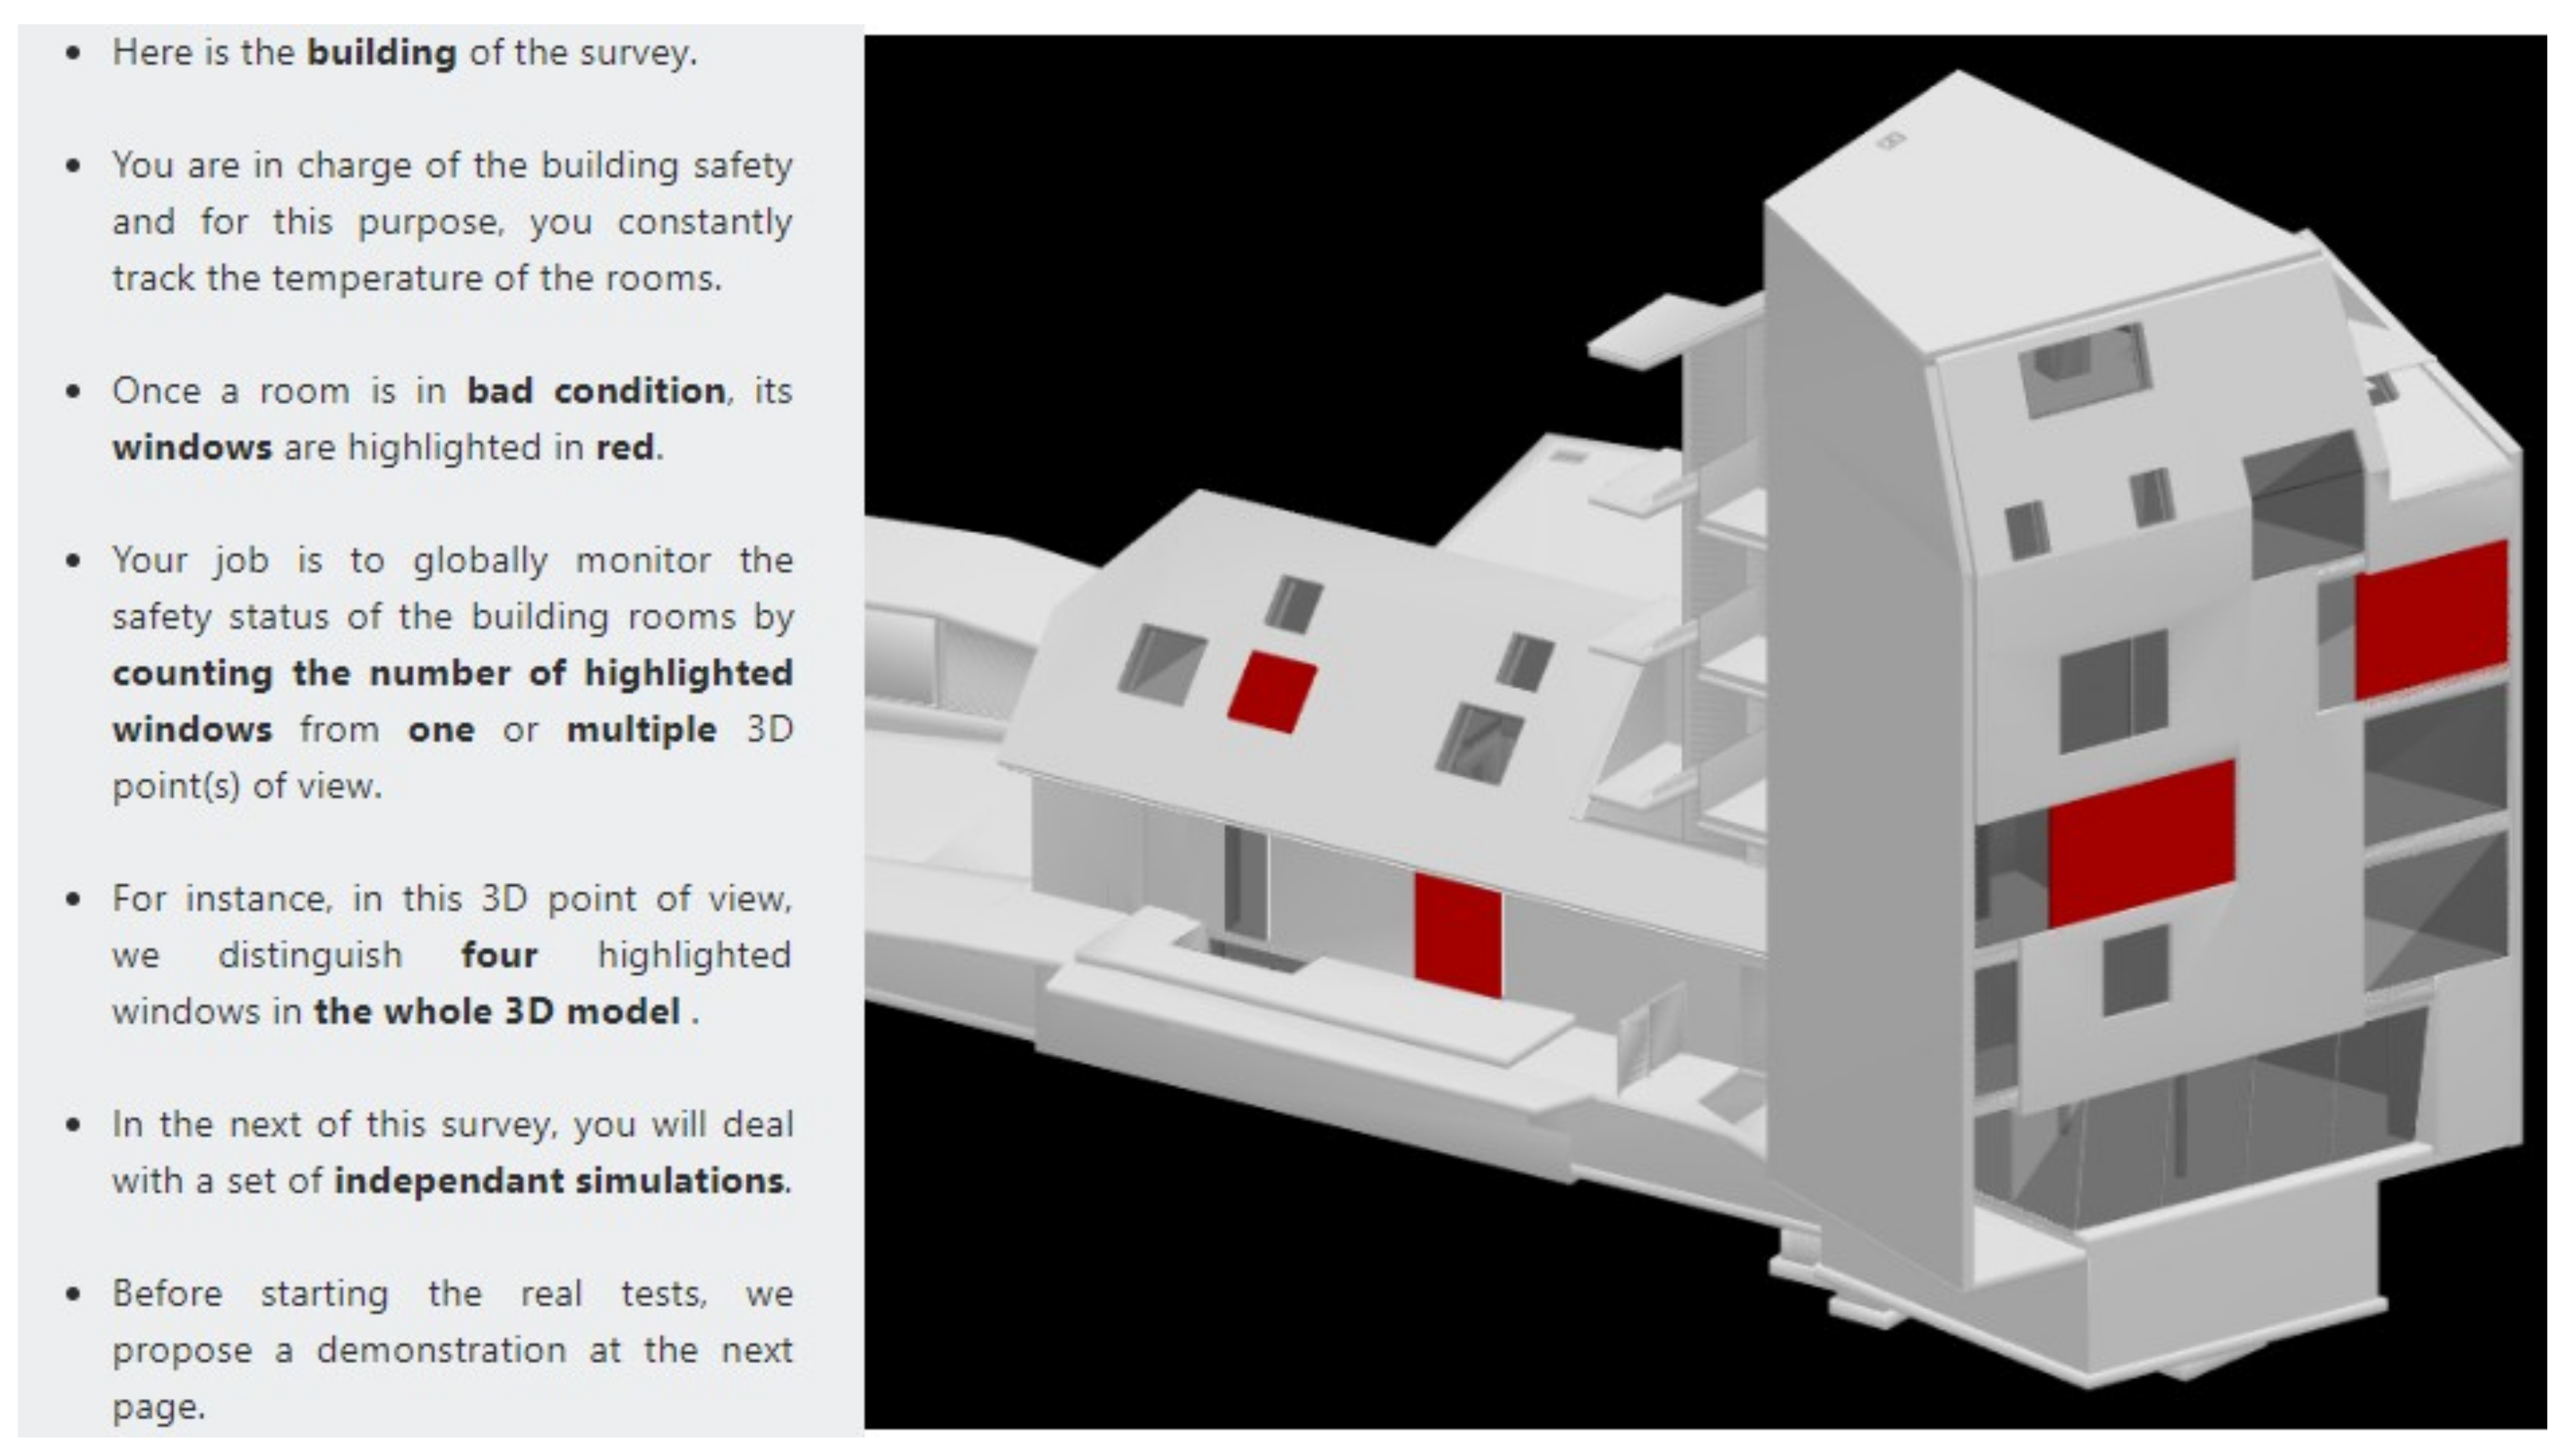
- The second section presents the 3D building model of the survey, sets the context of the case study, and proposes a demonstration test from which the participant gets acquainted with the questions and the procedure for answering.
- The third section is the survey. The participant must answer twelve questions related to fictive too-high temperature incidents occurring inside the building. As a reminder, three kinds of viewpoint are provided: The traditional four side points of view, a single point of view, and the point of view provided by the viewpoint management algorithm.
- Question 1: How many distinct windows are highlighted in red in the 3D model?
- Question 2: What is the degree of certainty of your answer? Possible options: Totally certain, quite certain, quite uncertain, and totally uncertain.
3. Results
3.1. Participants’ Profile
- Background training: 13 surveyors, 13 engineers, nine architects, and one expert from the industry construction.
- Decision-making level: Most of the participants (27 out of 36) usually work at the technical level (i.e., in the architectural, structural, or systems design phases); six work at the operational level (i.e., in the planning, construction, or maintenance phases); and three participants work at the strategic level (i.e., in the assets management and their allocation).
- 3D visualization experience: More than half of the participants (29 out of 36) were used to visualizing 3D building models: 21 on a regular basis (i.e., more than ten times a year) and 8 more sporadically (i.e., less than ten time a year). Note that only seven participants had never visualized 3D building models before the experiment.
3.2. Statistical Analysis: Overview
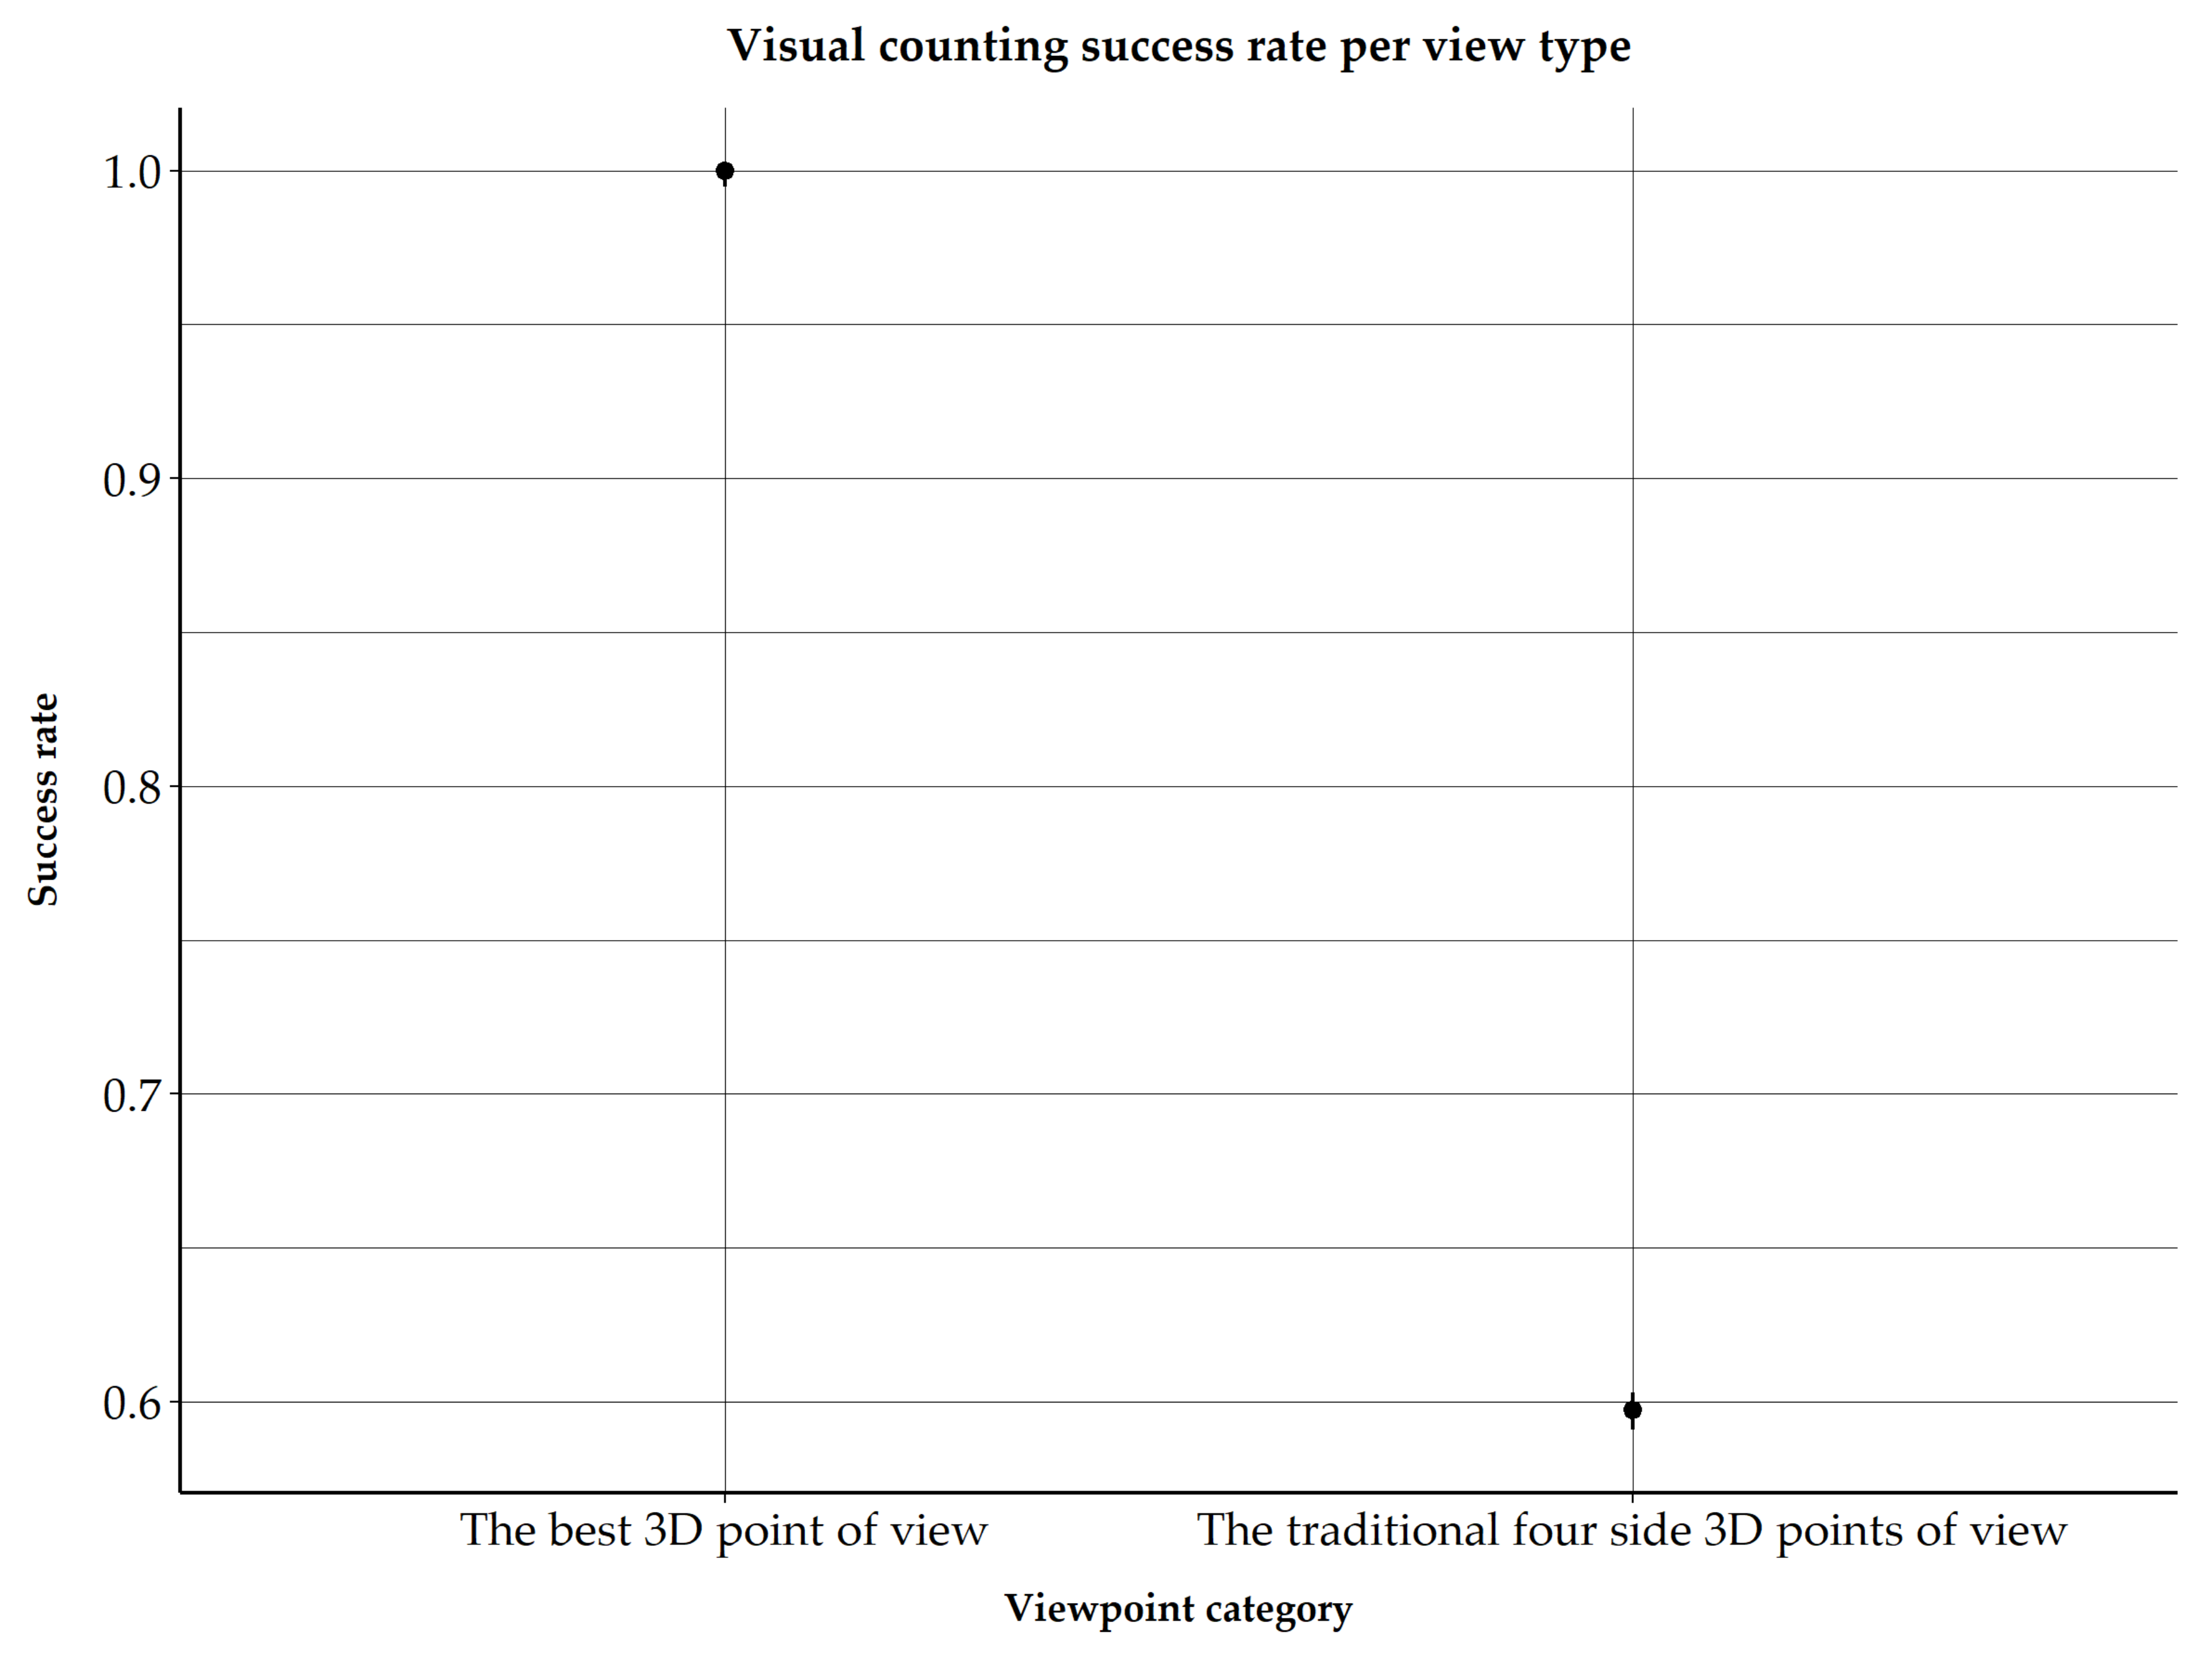
3.3. Is a 3D Viewpoint Based on the Maximization of 3D Geometric Objects’ View Area More Successful for Visual Counting of a Set of Objects Within a Virtual 3D Building Model?
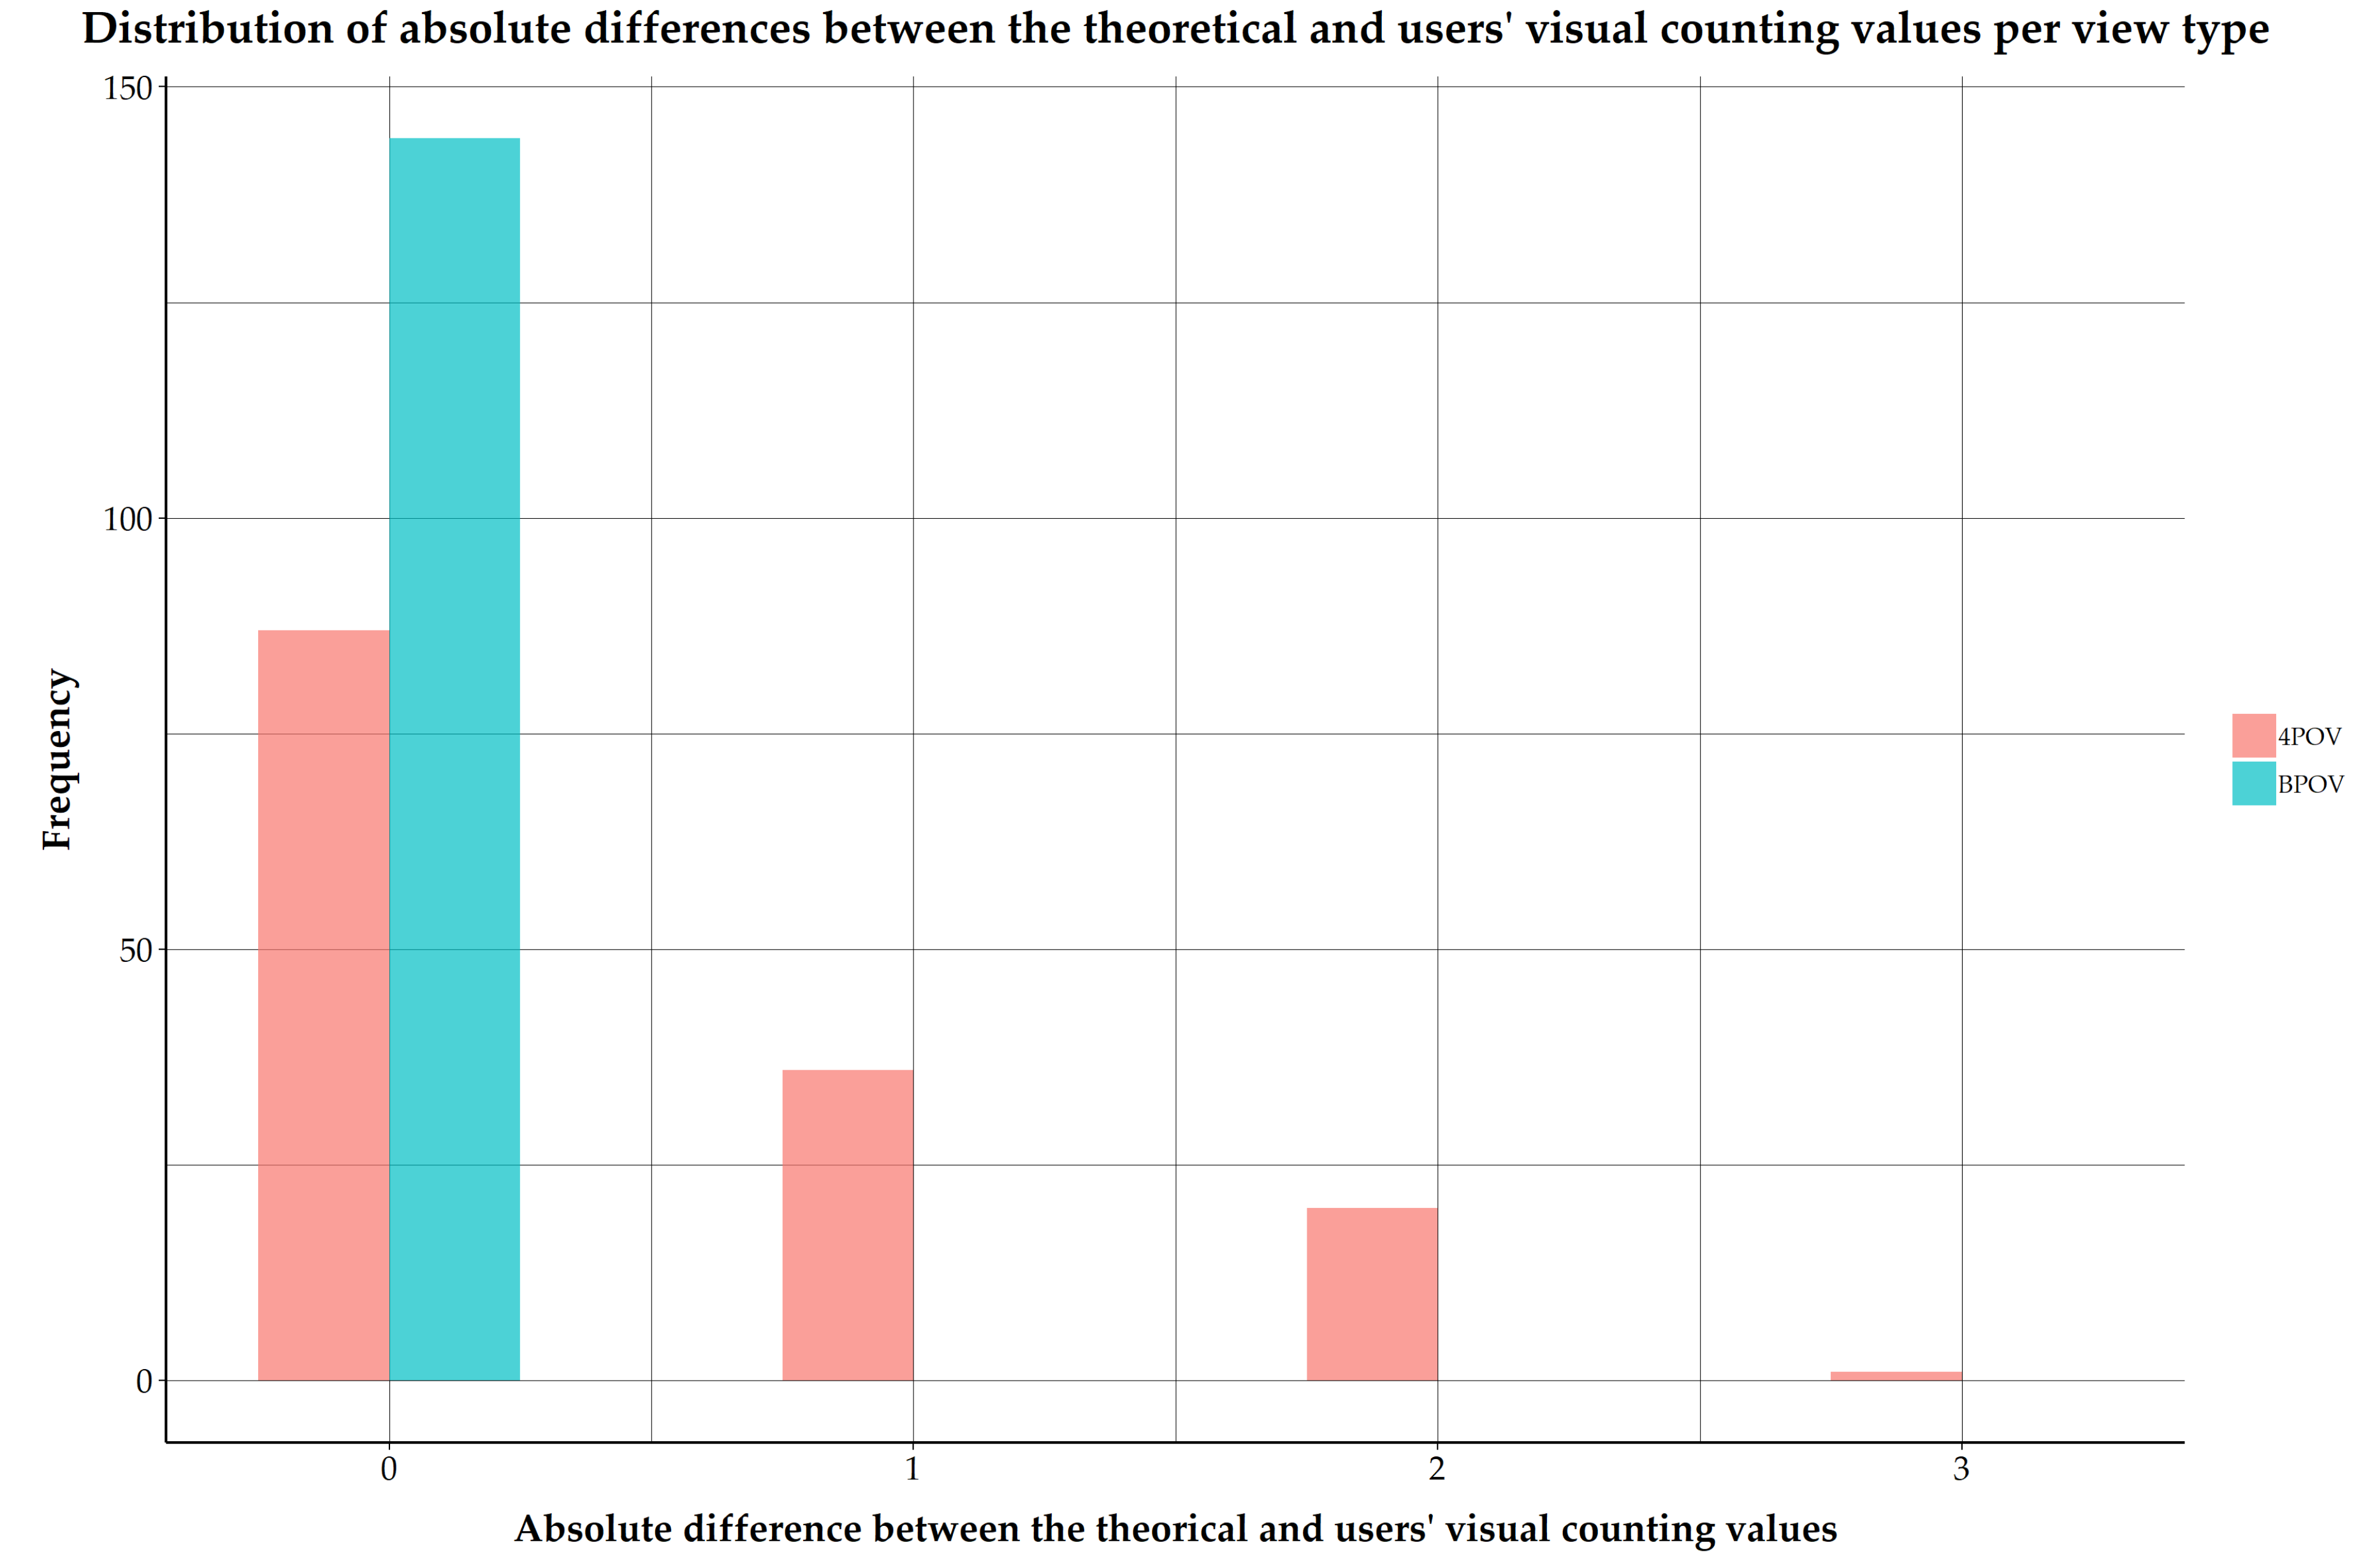
3.4. Is a 3D Viewpoint Based on the Maximization of 3D Geometric Objects’ View Area More Accurate for Visual Counting of a Set of Objects Within a Virtual 3D Building Model?
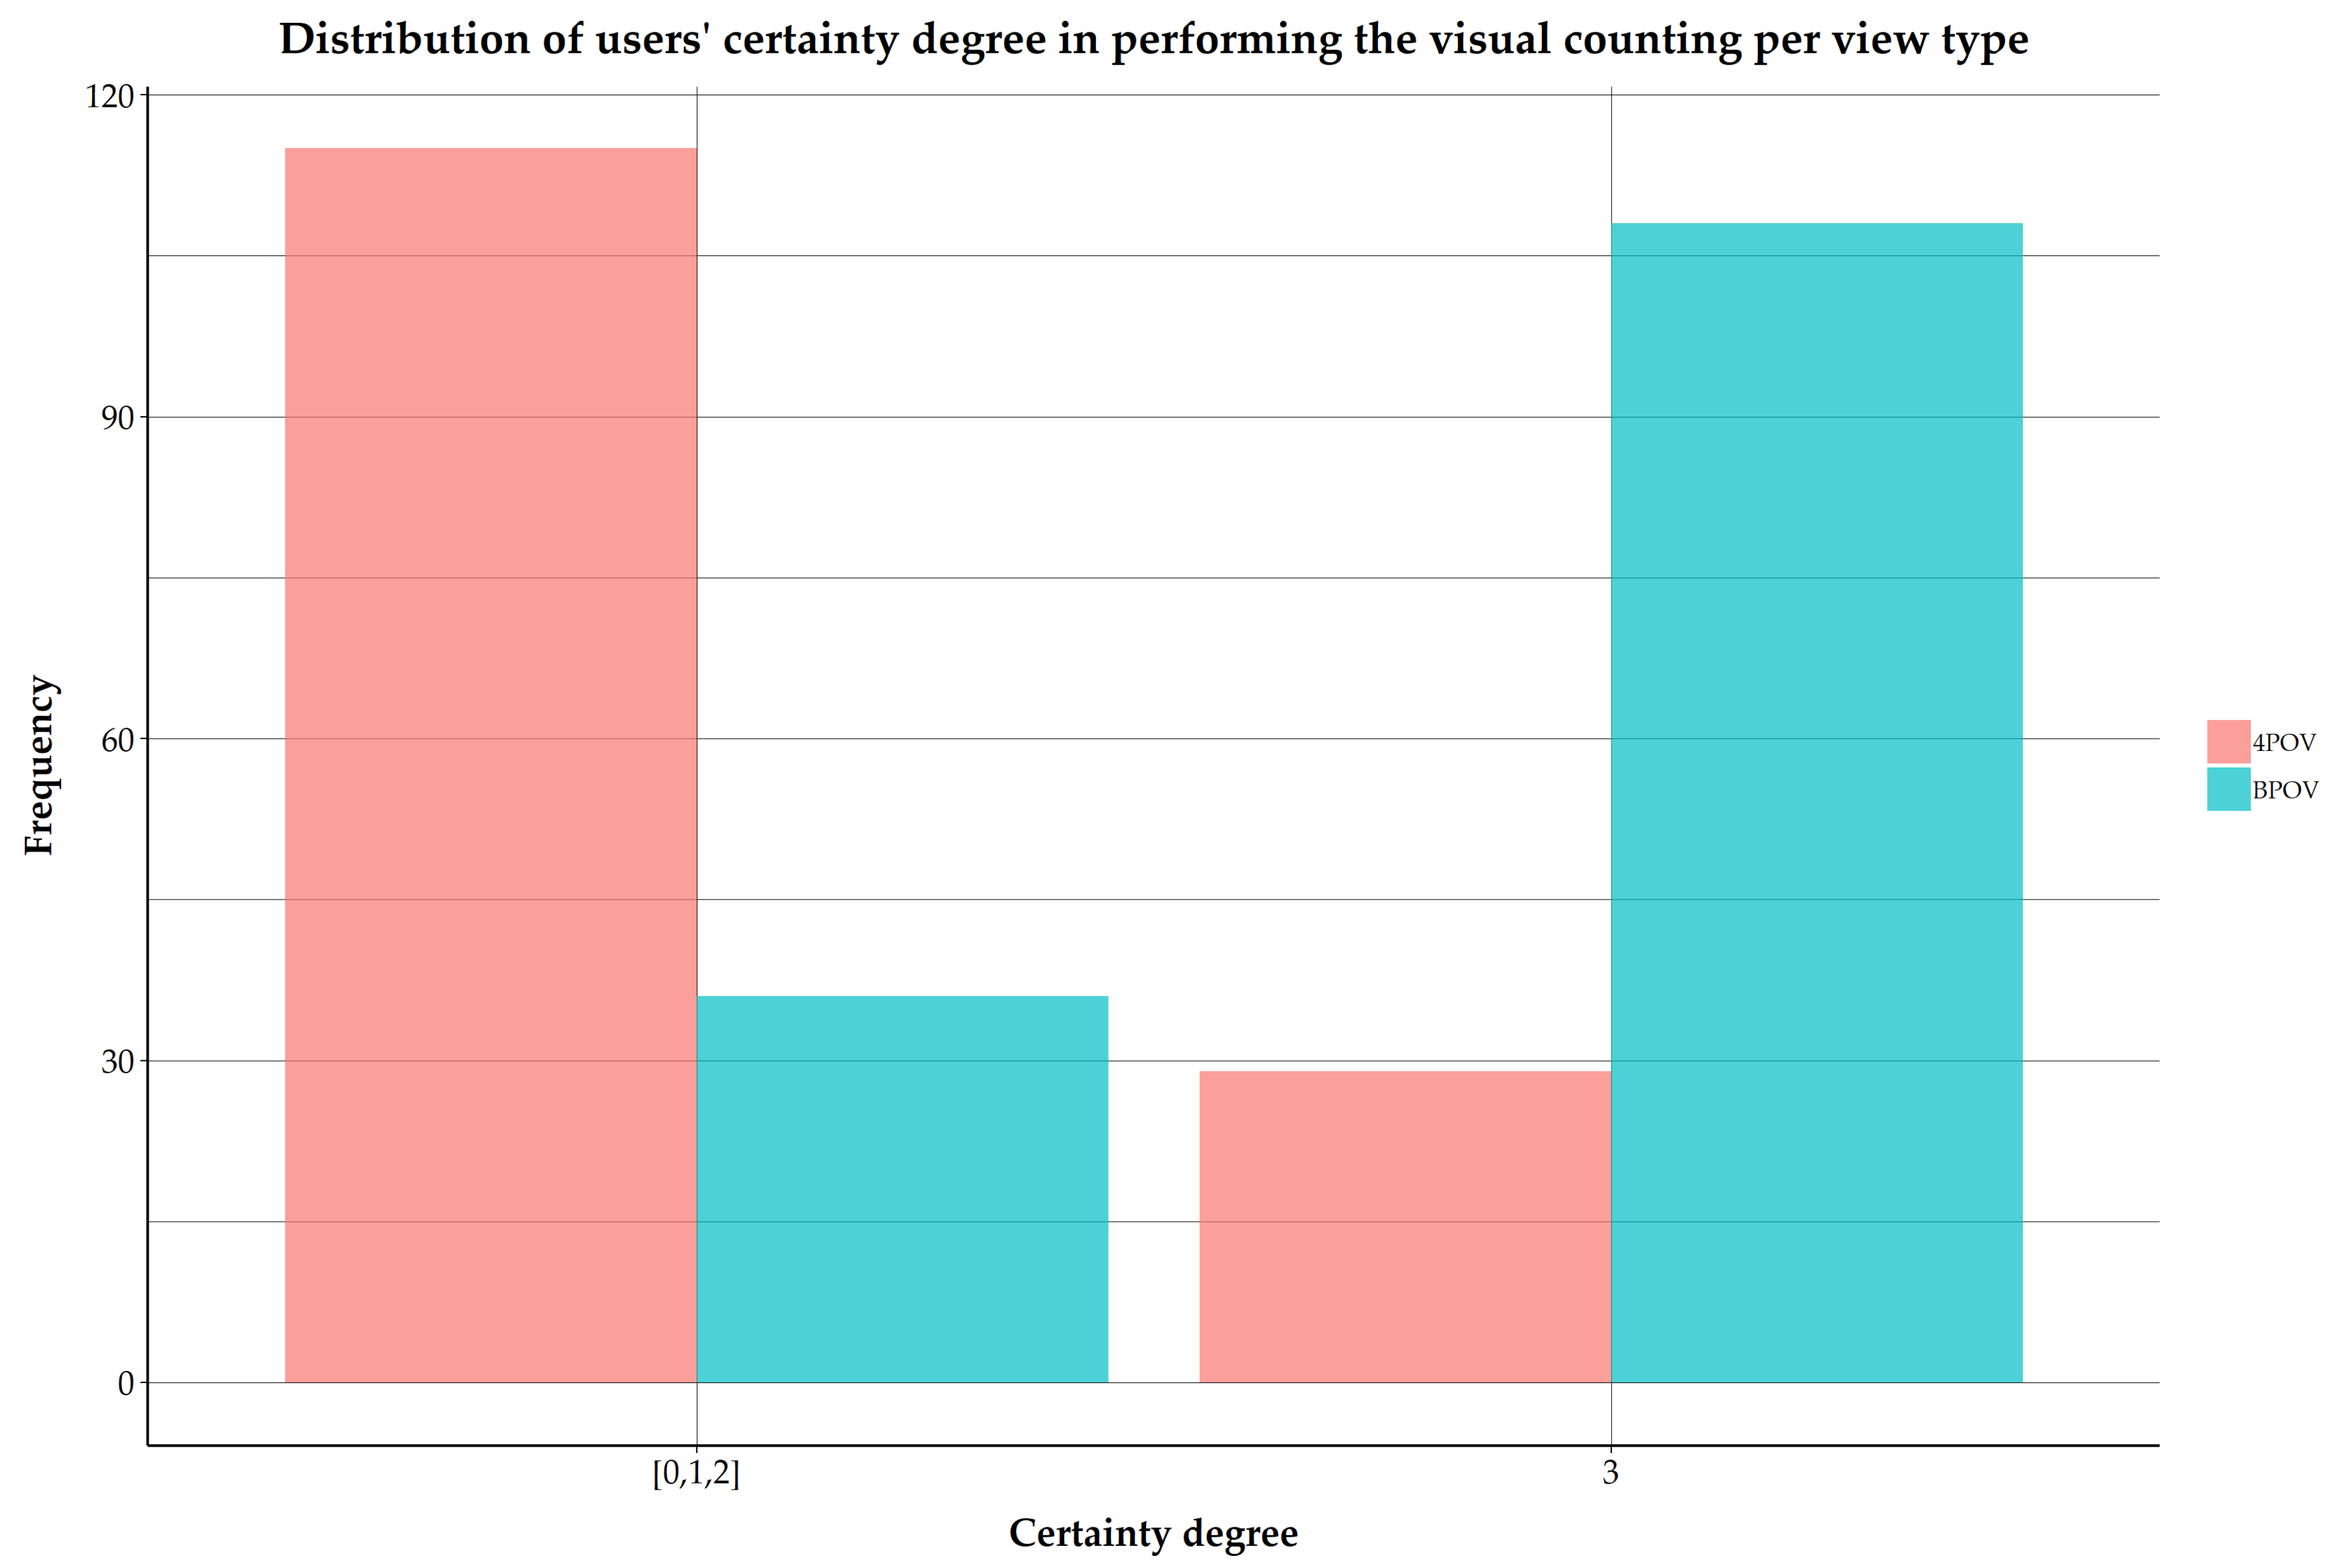
3.5. Does a 3D Viewpoint Based on the Maximization of 3D Geometric Objects’ View Area Enhance the User’s Certainty When Visually Counting a Set of Objects within a Virtual 3D Building Model?
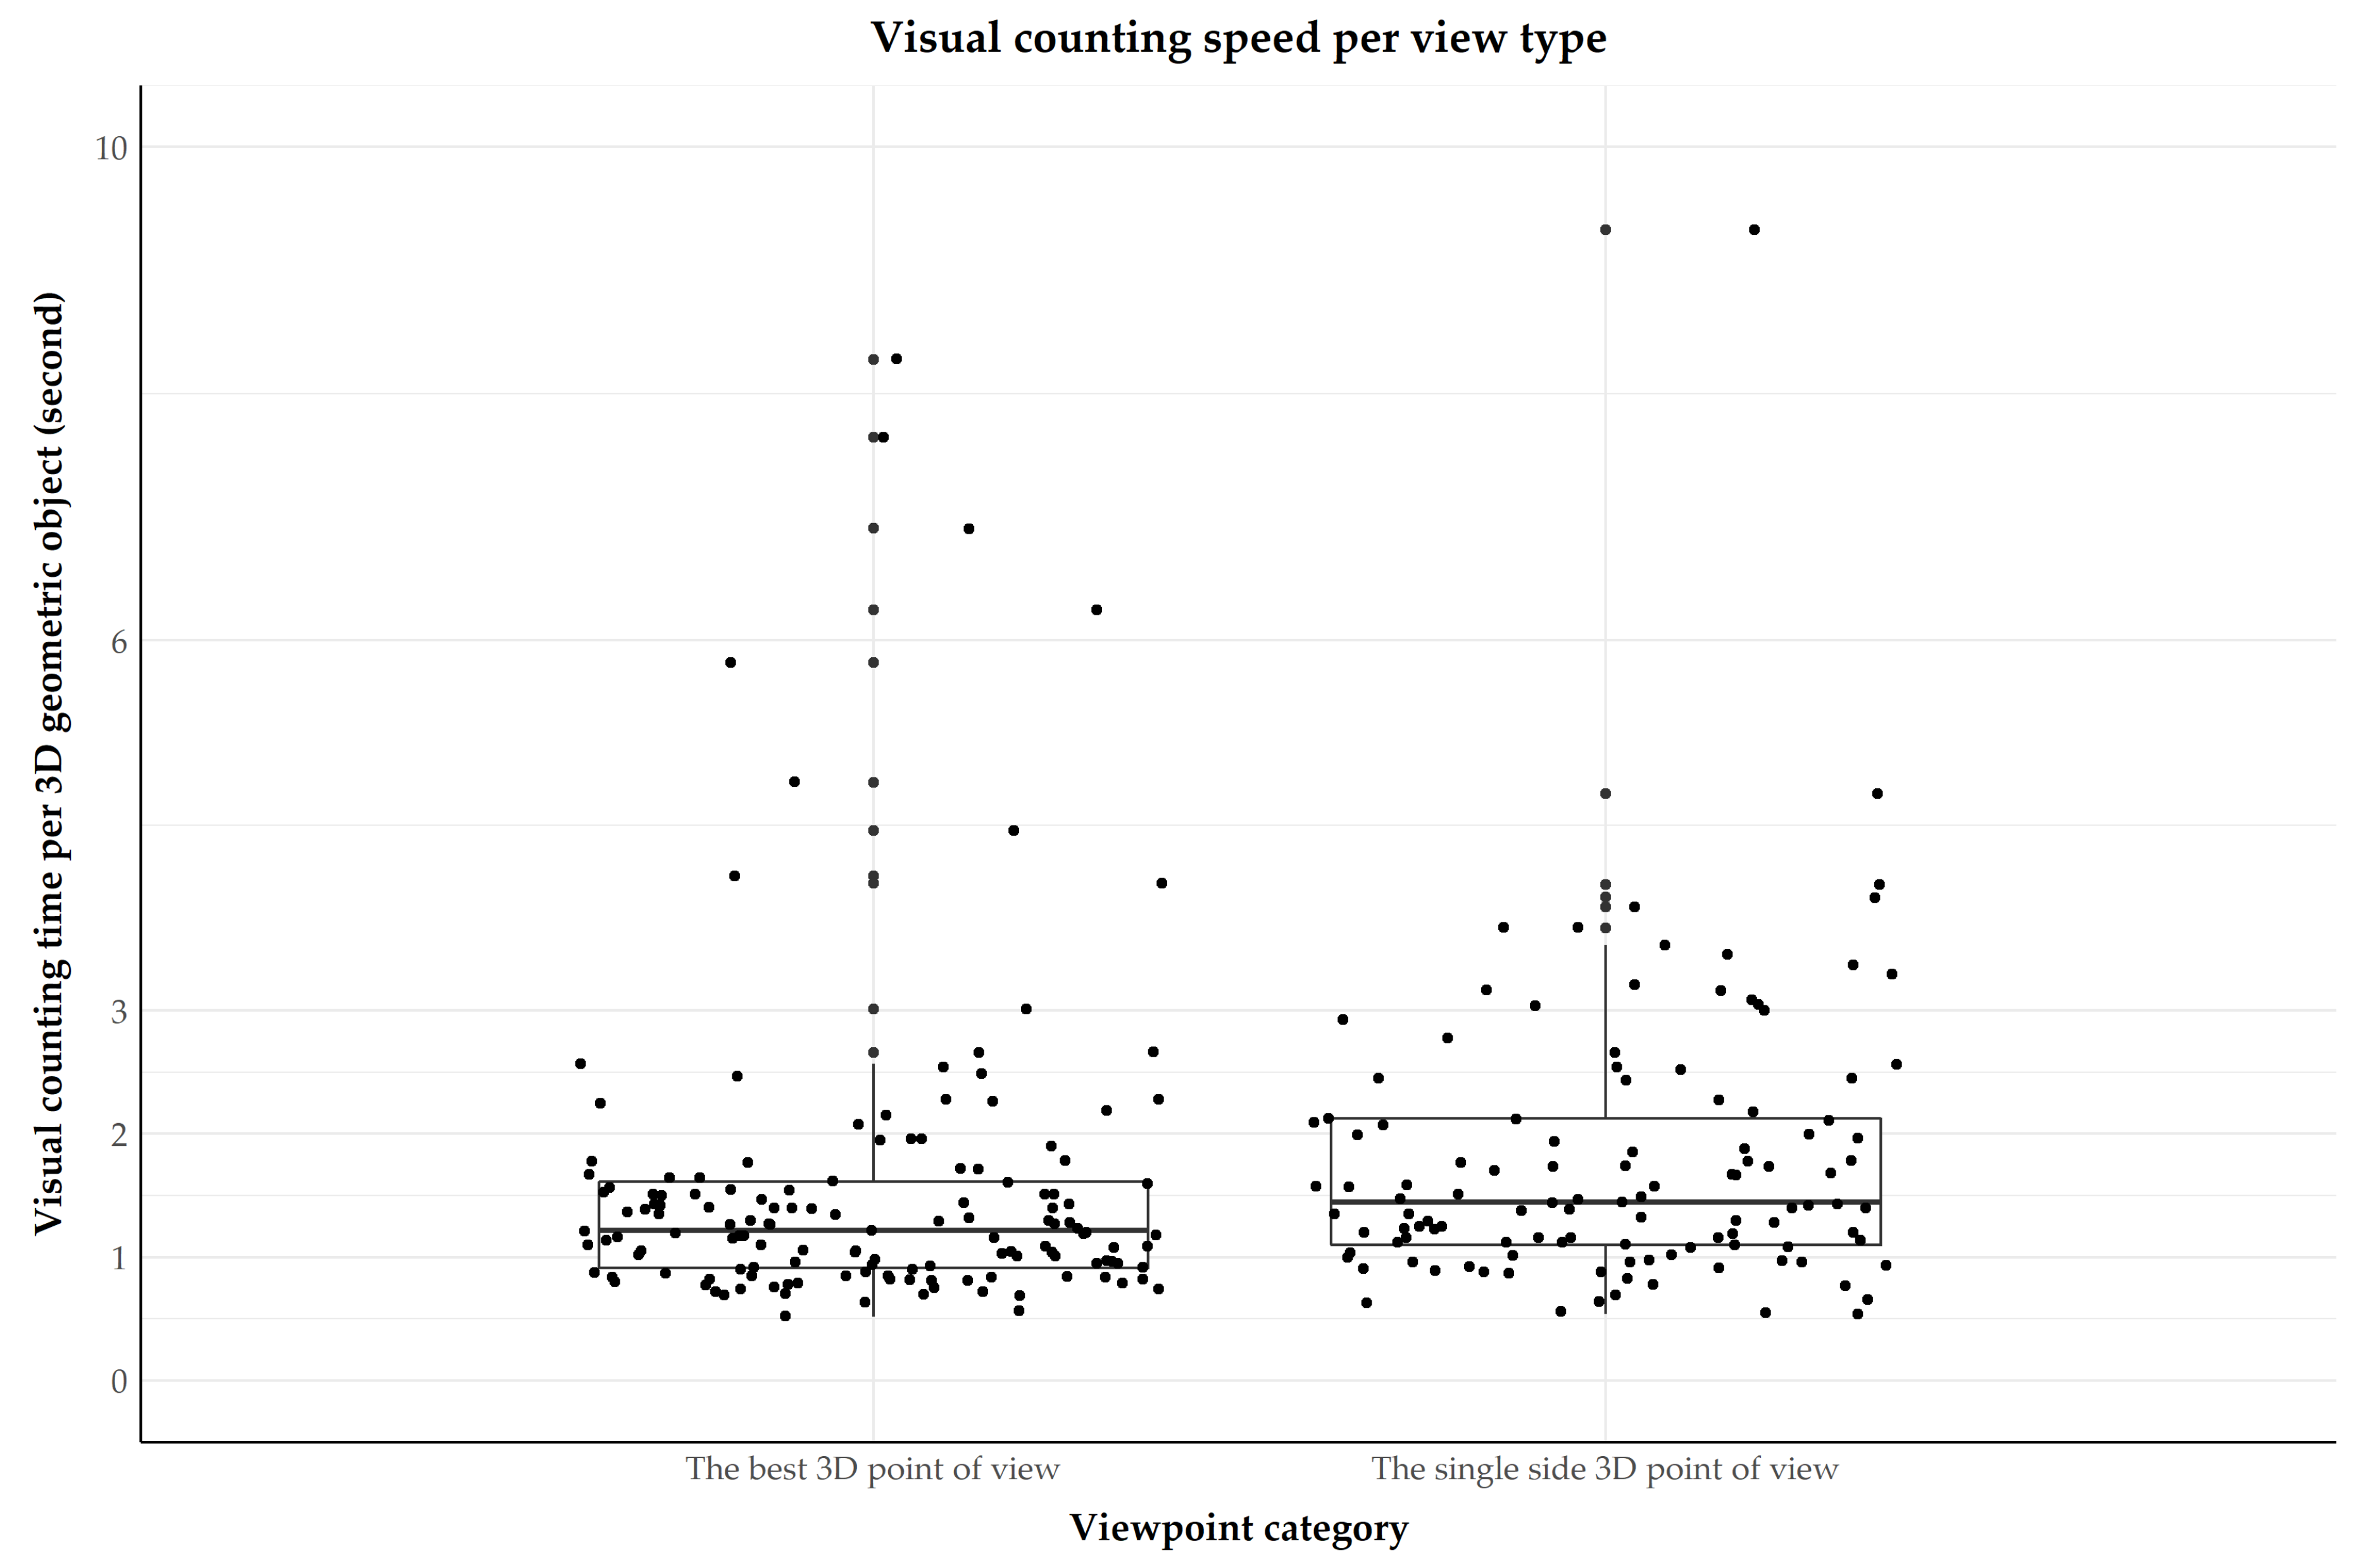
3.6. Does a 3D Viewpoint Based on the Maximization of 3D Geometric Objects’ View Area Make the Visual Counting of a Set of Objects Faster within a Virtual 3D Building Model?
3.7. Do The User’s Attributes (Background Training, Decision-Making Level, Experience in 3D Visualization) Influence the Usability of the 3D Viewpoint that Maximizes the 3D Geometric Objects’ View Area Inside the Viewport?
4. Discussion
4.1. Back to the Research Questions
4.2. 3D Viewpoint in the 3D Geovisualization Process
4.3. Limitations and Perspectives
5. Conclusions
Author Contributions
Funding
Acknowledgments
Conflicts of Interest
References
- Azhar, S. Building information modeling (BIM): Trends, benefits, risks, and challenges for the AEC industry. Leadersh. Manag. Eng. 2011, 11, 241–252. [Google Scholar] [CrossRef]
- Czmoch, I.; Pękala, A. Traditional design versus BIM based design. Proc. Eng. 2014, 91, 210–215. [Google Scholar] [CrossRef]
- Abbasnejad, B.; Moud, H.I. BIM and basic challenges associated with its definitions, interpretations and expectations. Int. J. Eng. Res. Appl. 2013, 3, 287–294. [Google Scholar]
- Wetzel, E.M.; Thabet, W.Y. The Use of a BIM-Based Framework to Support Safe Facility Management Processes; Virginia Polytechnic Institute and State University: Blacksburg, VA, USA, 2016. [Google Scholar]
- Becerik-Gerber, B.; Jazizadeh, F.; Li, N.; Calis, G. Application areas and data requirements for BIM-enabled facilities management. J. Constr. Eng. Manag. 2012, 138, 431–442. [Google Scholar] [CrossRef]
- Wang, Y.; Wang, X.; Wang, J.; Yung, P.; Jun, G. Engagement of facilities management in design stage through BIM: Framework and a case study. Adv. Civ. Eng. 2013, 2013, 1–8. [Google Scholar] [CrossRef]
- Zhang, X.; Arayici, Y.; Wu, S.; Abbott, C.; Aouad, G. Integrating BIM and GIS for large scale (building) asset management: A critical review. In Proceedings of the 12th International Conference on Civil Structural and Environmental Engineering Computing, Madeira, Portugal, 1–4 September 2009. [Google Scholar]
- Akcamete, A.; Liu, X.; Akinci, B.; Garrett, J.H. Integrating and visualizing maintenance and repair work orders in BIM: Lessons learned from a prototype. In Proceedings of the 11th International Conference on Construction Applications of Virtual Reality (CONVR), Weimar, Germany, 3–4 November 2011. [Google Scholar]
- Kyle, B.R.; Vanier, D.J.; Kosovac, B.; Froese, T.M. Visualizer: An interactive, graphical, decision-support tool for service life prediction for asset managers. In Proceedings of the 9th International Conference on durability of building materials and components, Brisbane, Australia, 17–20 March 2002. [Google Scholar]
- Motamedi, A.; Hammad, A.; Asen, Y. Knowledge-assisted BIM-based visual analytics for failure root cause detection in facilities management. Autom. Constr. 2014, 43, 73–83. [Google Scholar] [CrossRef]
- Akcamete, A.; Akinci, B.; Garrett, J.H. Potential utilization of building information models for planning maintenance activities. In Proceedings of the International Conference on Computing in Civil and Building Engineering, Nottingham, UK, 30 June–2 July 2010. [Google Scholar]
- Lee, W.-L.; Tsai, M.-H.; Yang, C.-H.; Juang, J.-R.; Su, J.-Y. V3DM+: BIM interactive collaboration system for facility management. Vis. Eng. 2016, 4, 15. [Google Scholar] [CrossRef][Green Version]
- Li, X.; Zhu, H. Modeling and visualization of underground structures. J. Comput. Civ. Eng. 2009, 23, 348–354. [Google Scholar] [CrossRef]
- Elmqvist, N.; Tudoreanu, M.E. Occlusion management in immersive and desktop 3D virtual environments: Theory and evaluation. IJVR 2007, 6, 13. [Google Scholar]
- Azhar, S.; Nadeem, A.; Mok, J.Y.N.; Leung, B.H.Y. Building information modeling (BIM): A new paradigm for visual interactive modeling and simulation for construction projects. In Proceedings of the Advancing and Integrating Construction Education, Research and Practice, Karachi, Pakistan, 4–5 August 2008; pp. 435–446. [Google Scholar]
- Neuville, R.; Poux, F.; Hallot, P.; Billen, R. Towards a normalised 3D geovisualisation: The viewpoint management. ISPRS Ann. Photogramm. Remote Sens. Spat. Inf. Sci. 2016, 4, 179–186. [Google Scholar] [CrossRef]
- Neuville, R.; Pouliot, J.; Poux, F.; Billen, R. 3D viewpoint management and navigation in urban planning: Application to the exploratory phase. Remote Sens. 2019, 11, 236. [Google Scholar] [CrossRef]
- Pouliot, J.; Badard, T.; Desgagné, E.; Bédard, K.; Thomas, V. Development of a web geological feature server (WGFS) for sharing and querying of 3D objects. In Advances in 3D Geoinformation Systems; van Oosterom, P., Zlatanova, S., Penninga, F., Fendel, E.M., Eds.; Springer: Berlin/Heidelberg, Germany, 2008; pp. 115–130. ISBN 978-3-540-72134-5. [Google Scholar]
- American Society of Civil Engineers. Glossary of the Mapping Sciences; ASCE Publications: New York, NY, USA, 1994. [Google Scholar]
- Neuville, R.; Pouliot, J.; Poux, F.; De Rudder, L.; Billen, R. A formalized 3D geovisualization illustrated to selectivity purpose of virtual 3D city model. ISPRS Int. J. Geo. Inf. 2018, 7, 194. [Google Scholar] [CrossRef]
- Poux, F.; Neuville, R.; Hallot, P.; Van Wersch, L.; Luczfalvy Jancsó, A.; Billen, R. Digital Investigations of an Archaeological Smart Point Cloud: A Real Time Web-Based Platform To Manage the Visualisation of Semantical Queries. In Proceedings of the The International Archives of the Photogrammetry, Remote Sensing and Spatial Information Sciences, Florence, Italy, 16 May 2017; Volume XLII-5/W1, pp. 581–588. [Google Scholar]
- Bertin, J. Sémiologie Graphique: Les Diagrammes, les Réseaux et les Cartes; Gauthier-Villars, Mouton and Cie.: Paris, France, 1967. [Google Scholar]
- Pouliot, J.; Wang, C.; Fuchs, V.; Hubert, F.; Bédard, M. Experiments with notaries about the semiology of 3D cadastral models. ISPRS Int. Arch. Photogramm. Remote Sens. Spat. Inf. Sci. 2013, XL-2/W2, 53–57. [Google Scholar] [CrossRef]
- Rautenbach, V.; Coetzee, S.; Schiewe, J.; Çöltekin, A. An assessment of visual variables for the cartographic design of 3D informal settlement models. In Proceedings of the 27th International Cartographic Conference, Rio de Janeiro, Brazil, 23–28 August 2015. [Google Scholar]
- Van Velsen, L.; Van Der Geest, T.; Klaassen, R.; Steehouder, M. User-centered evaluation of adaptive and adaptable systems: A literature review. Knowl. Eng. Rev. 2008, 23, 261–281. [Google Scholar] [CrossRef]
- Oosterom, P.V.; Stoter, J.; Ploeger, H.; Thompson, R.; Karki, S. World-wide inventory of the status of 3D cadastres in 2010 and expectations for 2014. In Proceedings of the FIG Working Week 2011, Marrakech, Morocco, 18–22 May 2011. [Google Scholar]
- Shojaei, D.; Kalantari, M.; Bishop, I.D.; Rajabifard, A.; Aien, A. Visualization requirements for 3D cadastral systems. Comput. Environ. Urban Syst. 2013, 41, 39–54. [Google Scholar] [CrossRef]
- Wang, C.; Pouliot, J.; Hubert, F. How users perceive transparency in the 3D visualization of cadastre: Testing its usability in an online questionnaire. GeoInformatica 2017, 21, 599–618. [Google Scholar] [CrossRef]
- Abran, A.; Khelifi, A.; Suryn, W. Usability meanings and interpretations in ISO standards. Softw. Qual. J. 2003, 11, 325–338. [Google Scholar] [CrossRef]
- Green, M. Toward a perceptual science of multidimensional data visualization: Bertin and beyond. ERGO/GERO Hum. Factors Sci. 1998, 8, 1–30. [Google Scholar]
- Wallach, D.; Scholz, S.C. User-centered design: Why and how to put users first in software development. In Software for People; Maedche, A., Botzenhardt, A., Neer, L., Eds.; Springer: Berlin/Heidelberg, Germany, 2012; pp. 11–38. ISBN 978-3-642-31370-7. [Google Scholar]
- Lazar, J.; Feng, J.H.; Hochheiser, H. Research Methods in Human-Computer Interaction; Wiley: Hoboken, NJ, USA, 2010. [Google Scholar]
- Virzi, R. Refining the test phase of usability evaluation: How many subjects is enough? Hum. Factors 1992, 34, 457–468. [Google Scholar] [CrossRef]
- Semmo, A.; Trapp, M.; Jobst, M.; Döllner, J. Cartography-oriented design of 3D geospatial information visualization—Overview and techniques. Cartogr. J. 2015, 52, 95–106. [Google Scholar] [CrossRef]
- Open Geospatial Consortium. Web Terrain Server (WTS), Number OGC 01-061, Version: 0.3.2. 2001.
- Elmqvist, N.; Tsigas, P. A taxonomy of 3D occlusion management techniques. In Proceedings of the IEEE 2007 Virtual Reality Conference, VR’07, Charlotte, NC, USA, 10–14 March 2007; pp. 51–58. [Google Scholar]
- Polonsky, O.; Patané, G.; Biasotti, S.; Gotsman, C.; Spagnuolo, M. What’s in an image? Towards the computation of the “best” view of an object. Vis. Comput. 2005, 21, 840–847. [Google Scholar] [CrossRef]
- Vazquez, P.-P.; Feixas, M.; Sbert, M.; Heidrich, W. Viewpoint selection using viewpoint entropy. In Proceedings of the Vision Modeling and Visualization Conference, Aka GlbH, Stuttgart, Germany, 21–23 November 2001; pp. 273–280. [Google Scholar]
- Lee, C.H.; Varshney, A.; Jacobs, D.W. Mesh saliency. ACM Trans. Graph. 2005, 24, 656–659. [Google Scholar] [CrossRef]
- Page, D.L.; Koschan, A.F.; Sukumar, S.R.; Roui-Abidi, B.; Abidi, M.A. Shape analysis algorithm based on information theory. In Proceedings 2003 International Conference on Image Processing (Cat. No.03CH37429); IEEE: Barcelona, Spain, 2003; Volume 1, pp. 229–232. [Google Scholar]
- Azhar, S.; Sattineni, A.; Hein, M. BIM undergraduate capstone thesis: Student perceptions and lessons learned. In Proceedings of the 46th ASC Annual Conference, Boston, MA, USA, 17 July 2010; pp. 1–8. [Google Scholar]
- Yan, W.; Culp, C.; Graf, R. Integrating BIM and gaming for real-time interactive architectural visualization. Autom. Constr. 2011, 20, 446–458. [Google Scholar] [CrossRef]


| Research Question | Criterion | Type of Input Data | Statistical Method | Alpha |
|---|---|---|---|---|
| Success rate | Effectiveness | Quantitative (ratio and discrete) | Exact binomial | 5% |
| Accuracy | Effectiveness | Quantitative (ratio and continuous) | Student’s t test | 5% |
| Speed | Effectiveness | Quantitative (ratio and continuous) | ANOVA (one-way) | 5% |
| Certainty | Satisfaction | Qualitative (ordinal) | Chi-2 | 5% |
© 2019 by the authors. Licensee MDPI, Basel, Switzerland. This article is an open access article distributed under the terms and conditions of the Creative Commons Attribution (CC BY) license (http://creativecommons.org/licenses/by/4.0/).
Share and Cite
Neuville, R.; Pouliot, J.; Billen, R. Identification of the Best 3D Viewpoint within the BIM Model: Application to Visual Tasks Related to Facility Management. Buildings 2019, 9, 167. https://doi.org/10.3390/buildings9070167
Neuville R, Pouliot J, Billen R. Identification of the Best 3D Viewpoint within the BIM Model: Application to Visual Tasks Related to Facility Management. Buildings. 2019; 9(7):167. https://doi.org/10.3390/buildings9070167
Chicago/Turabian StyleNeuville, Romain, Jacynthe Pouliot, and Roland Billen. 2019. "Identification of the Best 3D Viewpoint within the BIM Model: Application to Visual Tasks Related to Facility Management" Buildings 9, no. 7: 167. https://doi.org/10.3390/buildings9070167
APA StyleNeuville, R., Pouliot, J., & Billen, R. (2019). Identification of the Best 3D Viewpoint within the BIM Model: Application to Visual Tasks Related to Facility Management. Buildings, 9(7), 167. https://doi.org/10.3390/buildings9070167