Abstract
A study was conducted to identify the primary sources and types of construction and demolition (C&D) waste, determine current and potential management actions which can be applied to the respective wastes, and assess the potential benefits, barriers, and recommendations towards the implementation of a C&D waste management plan in Trinidad and Tobago—a Caribbean Small Island Developing State (SIDS). This process is lacking locally, and will benefit decision makers and other stakeholders in proper management of C&D waste. Currently, the primary method of waste disposal is landfilling. The structured questionnaire survey method was used to collect the data, and data were analyzed by descriptive statistics and one-way ANOVA with appropriate post-tests. Results showed that wood, plastic, cardboard, gypsum board, and steel were identified as the most wasted materials on site, with the top sources being attributable to design, operations, and residual causes. It can be inferred that if materials are not being reused, they are being landfilled, as these were the two primary waste treatment methods identified as being used for all materials. If waste management practice gathers enough support from all respective authorities and stakeholders, the general consensus is that all materials listed have recycle/reuse potential in Trinidad and Tobago. The top agreed upon advantages of C&D waste management were all directly related to sustainability, and the barriers to implementation identified were related to general lack of support from respective stakeholders and authorities. From the overall results, it can be concluded that there is not enough evidence to suggest that larger contractors have more positive attitudes and behaviors towards C&D waste management. Although the data are local, the findings from this research can be used as guidelines by the other Caribbean SIDS nations in formulating/comparing their own waste management practices.
1. Introduction
1.1. Background
Over the past few years, sustainability has become a topic that is being marketed by governmental organizations and educational institutions globally. From observation, Trinidad and Tobago, a Caribbean Small Island Developing State (SIDS), is lagging behind in efforts to become more sustainable, as wastage continues and landfill use increases. Currently, landfilling is the primary method of final waste disposal in Trinidad and Tobago. Approximately one thousand (1000) tonnes of waste is disposed of per day, divided among nine (9) operating disposal sites in Trinidad and Tobago; the four (4) main landfill sites being the Beetham site, the Forres Park site, the Guanapo site, and the Guapo site [1]. Solid waste management in Trinidad and Tobago has become an issue of growing concern over the past few years, due to a rapid increase in the overall quantity of waste being generated due to industrialization and residential and commercial development. This increase in solid waste generation has resulted in a rapid decrease in the capacity of the four (4) aforementioned primary landfills [1]. The Trinidad and Tobago Solid Waste Management Company Limited (SWMCOL) was created in 1980 for “management, control, collection, treatment and disposal of all waste, either alone or jointly with other companies, statutory authorities, or persons” [2]. SWMCOL has produced records indicating that large quantities of recyclable and reusable materials (paper, plastics, metals, and organics) are being deposited at landfills for final disposal. Elimination of these recyclable/reusable materials could thus lead to an extension of existing landfill lifespans and improved efficiency in waste collection systems.
Landfills are usually the final disposal facility of construction and demolition (C&D) waste; the Australian construction industry accounts for approximately 15% per annum of all solid waste being disposed of in landfills, and similar quantities have been recorded in other countries. In an effort to reduce the amount of waste being deposited into landfills, an Australian branch of an international construction company decided to implement C&D waste management policies on their sites. The results of the policy trial yielded cost savings, 15% less waste being generated on site before recycling, and 43% less waste going to landfills [3]. C&D waste management plans therefore have the potential to help reduce landfill usage as well as promote sustainability due to reuse and recycling [4]. Reuse and recycling increases the longevity of materials and reduces the amount of raw material extracted from the earth, and decreases the energy demand to process and manufacture new materials.
1.2. Problem Statement
“Construction by nature is not environmentally friendly; it generates tremendous C&D waste resulting from various construction activities” [5]. Trinidad’s dependency on the use of non-renewable energy has led to the 2012 Environmental Performance Index rating the country poorly in relation to the environment and sustainability. At present, Trinidad and Tobago is faced with challenges in waste management, and some landfills that have been past their maximum capacity since 1980 are still in use; furthermore, two (2) sectors which have been identified as key areas for development of a green economy are waste management and construction [6]. In 2017, the Planning and Development Commission mandated Solid Waste Management Company Limited (SWMCOL) to undertake the functions of a Waste Recycling Authority as the government strives to alleviate the burden on landfills and modernize local waste disposal [2]. It is believed that this new system and functions of SWMCOL will promote and encourage waste recovery via recycling and reuse, the creation and implementation of financial incentives to encourage recovery, and promotion of business opportunities that may arise from creating a culture of waste minimization [2].
In light of this, the construction industry of Trinidad and Tobago should also begin implementation of sound waste management practices to aid in the development of a green economy.
1.3. Objectives
The objectives of this study are:
I. To identify primary sources, causes of waste, and the top agreed upon types of waste from construction projects.
II. To determine current and potential waste management actions which can be applied to respective waste (reduce, reuse, recycle, or dispose).
III. To assess the potential benefits, barriers, and recommendations towards the implementation of C&D waste management plans.
1.4. Status on C&D Waste Sources and Management
Other researchers have classified waste as resources created by activities which generate costs, but add no value to the client’s final product [5]. While many bodies and authors tend towards a tangible definition of what construction waste is, some researchers [7] opt for a broader definition of the term and categorize it into three groups; material waste, labor waste, and machinery waste.
C&D waste usually contributes significantly to the total municipal solid waste, ranging between 20% and 30%, based on a Canadian study [8]. In the Netherlands, construction and demolition waste accounts for approximately 26% of total waste (by weight) annually, in Australia, it accounts for approximately 20% to 30% of total waste entering landfills, and in the United States, approximately 20% of the total waste is C&D. Slightly smaller percentages were observed in Germany and Finland, with 19% and 13–15% of the landfill waste being attributed, respectively [4].
The aforementioned percentages are quite significant when compared to India’s records, which indicate that 14.5 million tonnes of construction waste is generated annually. This quantity represents a meager 1.5% of the total solid waste generated annually [9]. These data may be misleading, however, as according to a group of researchers [10], this figure only accounts for waste that is properly disposed, and not illegal roadside dumping or dumping on empty plots of land, which are not documented. Much in tune with the previous statement, the Central Pollution Control Board of India has estimated that the construction industry is accountable for 25% of solid waste generated per annum, according to a group of researchers [11].
Waste can occur during several stages of a construction project, and can originate from multiple sources. Table 1 shows the sources and causes of waste production during construction projects. The information provided here is extracted from References [12] and [13].
Table 1.
Sources and Causes of Waste Production during Construction Projects.
Due to the resource intensive nature of construction waste, strategic management plans are necessary [5]. The ultimate goal of any waste management plan is to minimize or eliminate the quantity of waste being produced by a process. It was observed [14,15] that researchers worldwide have devised a list of 11 practices to assist with waste management, as follows:
- Standardization of design
- Stock control to minimize over ordering
- Environmental education to the workforce
- Provision of recycling and waste disposal companies as part of the supply chain
- On time/just in time deliveries
- Penalties for poor waste management
- Incentives and tender premiums for waste minimization
- Waste auditing
- Increased use of offsite techniques
- Use of on-site compactors
- Reverse logistics
Two (2) methodologies have been identified [3] to reduce the amount of construction waste that reaches landfills, as follows:
1. The use of source reduction techniques, that is, identifying sources of waste production throughout various phases of a project, from design to procurement and construction, and implementing strategies to reduce waste.
2. The improvement of waste management on site.
Similarly, research identified that the four (4) main actions taken to manage construction waste are reduction, reuse, recycling, and disposal, with reduction being the most environmentally friendly, as it can prevent the generation of waste altogether [7].
Waste reduction measures include good material management practices as well as designing to eliminate waste. When waste is unavoidable, the other measures of reuse, recycling, and disposal can be applied [8].
The European Waste Catalogue (EWC) classifies C&D waste into the following eight (8) categories or types of waste [16]:
- Concrete, bricks, tiles, and ceramics
- Wood, glass, and plastic
- Bituminous mixtures, coal tar, and tarred products
- Metals (including their alloys)
- Soil (including excavated soil from contaminated sites), stones, and dredging spoil
- Insulation materials and asbestos-containing construction materials
- Gypsum-based construction material
- Other construction and demolition waste
The examined literature identifies the typical types of C&D material waste found on sites as being similar to those identified above, and for which waste management concepts can be utilized [10]. Wang et al. (2010) did an investigation into on-site sorting of construction waste in Shenzhen, China, and found that six (6) critical success factors (CSFs) are required for effective on-site sorting of construction waste [17]. Another study on simulation and comparative analysis of waste [18] provided more in-depth information on the specific methods of planning and handling wastes and their effectiveness.
Within the past two (2) decades, Trinidad and Tobago has experienced an increase in standard of living, commercialization, and infrastructural and industrial development, resulting in an increase in the quantity and type of waste being generated. There has also been an increase in the volume of packaging materials and construction materials entering the waste stream as a result of growth in manufacturing and built developments. Moreover, waste management in Trinidad and Tobago is a challenging affair, due to the increases in waste generation, limited availability of land, and fragile ecosystem typically associated with small developing island states. This challenge is further compounded due to the following [19]:
- At present there is little separation of waste before disposal
- Reuse and recycling is scarcely practiced
- There are a limited number of landfills in unsanitary conditions
- Weak legislative and management systems
- A general lack of public awareness related to waste management practices
The administrative framework for waste management in Trinidad and Tobago also complicates matters, as it is governed by three (3) ministries, i.e., Ministry of Local Government, Ministry of Public Utilities, and Ministry of the Environment and Water Resources, one (1) state agency (SWMCOL), one (1) statutory authority, the Environmental Management Authority (EMA), and the Tobago House of Assembly (THA). A lack of coordination and clear indication of responsibility on some occasions have thus led to inefficient and ineffective waste management. Recent research has reported that utilization and awareness level of C&D wastes is low in Trinidad and Tobago. Waste management is not being practiced formally by a relatively large proportion of contractors, and only a small number of individuals within the industry have received training in waste management [1,6].
1.5. Significance of the Research
From the literature reviewed, it is clear that, when properly implemented, a C&D waste management plan will provide many benefits: to contractors in the form of cost savings, to the environment in the form of resource efficiency, and to the general public by improving public health and reducing social issues caused by waste. The multitude of benefits can be summarized under the three (3) pillars of sustainability; however, there are several factors that directly and indirectly affect successful implementation of C&D waste management plans. These include education and awareness, and support from relevant authorities and stakeholders.
No systematic studies are available on sources and types of wastes, waste management actions, and potential benefits for C&D wastes and barriers to implementations in developing and emerging countries, which have a pressing need for effective C&D waste management plans.
The knowledge gained from this research can be used as guidelines by the other Caribbean SIDS nations in formulating/comparing their own waste management practices.
2. Materials and Methods
Data were collected through the structured questionnaire survey that was divided into four sections:
Section I—General Information. Section I focused on general information such as ‘type of construction,’ ‘work executed for,’ ‘size of firms,’ and others, and it consisted of seven (7) questions. The data of Section I were collected in a previous study, and have been reported elsewhere [20]. However, they were also used in this study to provide context for the present study. The independent variables were placed in this section.
Section II—Sources and Types of Waste;
Section III—Waste Management Actions which can be performed; and
Section IV—Potential Benefits of C&D Waste Management and Barriers to Implementation.
Section II consisted of questions on ‘sources and types of wastes,’ and it asked about the ‘level of agreement’ on which materials are most wasted in the construction site out of 14 commonly used construction materials, and primary cause of waste generation out of 18 possible types of generation;
Section III consisted of questions on what waste management actions out of four common types of actions are utilized;
Section IV focused on ‘potential benefits of C&D waste management and barriers to implementation.’ It asked the questions on ‘level of agreement’ with the advantages of C&D waste out of seven (7) advantages, the level of agreement that may hinder the implementation of C&D waste management techniques due to 15 factors, and level of agreement on the factors those can help in increasing C&D waste management actions out of seven (7) options.
Supplementary Materials shows the questions with different sections. A pilot survey was done to confirm the final structure of the survey. This was done with five individuals. Respondents of this exercise were not selected to participate in the actual survey. The pilot survey finalized the user friendliness and effectiveness of the actual survey.
The dependent variables were: sources and types of wastes; waste management actions; and potential benefits of C&D wastes, as stated in Sections II, III, and IV. The dependent variables were measured primarily using five (5) ordinal levels of a Likert scale (see Supplementary Materials), with some dichotomous and categorical scales. The primary independent variable was ‘contractor size.’
Following primary data collection via these questionnaires, statistical analyses were performed to establish relationships such as cause and effect between variables, which can assist in proving or disproving the hypothesis, finding solutions, and/or making recommendations to improve the situation. A total of 100 questionnaires were distributed. The questionnaire were both emailed and distributed personally. The study was conducted during March 2018 to May 2018.
2.1. Sampling Methodology
The overall population of the study was construction industry contractors registered in Trinidad and Tobago. The Ministry of the Attorney General and Legal Affairs has an ‘online companies registry,’ however, the search engine is limited to searching registered companies by name and not category. Due to the unavailability of an accurate total list of construction industry contractors registered in Trinidad and Tobago, a purposive non-probability sampling method was utilized. The target sample was some contractors registered with the Trinidad & Tobago Contractors Association (TTCA), as well as contractors prequalified with a local state enterprise. This is similar to what has been done by other researchers, as they targeted contractors registered with the Construction Industry Development Board of Malaysia [21]. A senior member of staff from each company, preferentially holding a relevant management or supervision position, was targeted by the survey.
2.2. Sample Size
The sample size is an important consideration. The Kish Equation (1965) was used. The formula is (n = (n1)/(1 + (n1/N)). The following values are declared:
N = 100
S = 0.5
V = 0.06
The sample size is calculated as follows:
n1= s2/v2 = (0.5)2/(0.06)2 = 69.44, Therefore, (69.44)/(1+ (69.44/100)) = 41
An additional two respondents were added to the recommended sample size.
Therefore, the research sample size = 43.
From the TTCA members listing, approximately 25 contractors were invited to participate in the survey. A total 75 contractors from the state enterprise prequalification list were invited. In total, 100 questionnaires were issued to derive a response rate of 43%. This is an acceptable response rate, as demonstrated by others whose similar surveys gave on average a 27% response rate [22].
2.3. Data Analysis
The Statistical Package for the Social Sciences (SPSS) software was used for the analysis of survey data. Descriptive statistics were used to determine mean, standard deviation, standard errors, lower bound, and upper bound (for a 95% confidence interval of the mean). The one-way analysis of variance (one-way ANOVA) test was used for inferential statistics. The standard assumptions of the one-way ANOVA were maintained. The important assumption of the ANOVA is the ‘homogeneity of the variances.’ This test was first performed using Levene’s Test to check whether the assumption of ‘homogeneity of variances’ was violated for any variables. If there were no violations, then ANOVA results were used for all the cases. The W statistic was used to obtain a corresponding significance value, p. If p < 0.05, the ‘homogeneity of variances’ was considered to be violated, and the Brown–Forsythe and Weltch F test results were used to determine the statistical significance ((XLSTAT 2017). The numbers in the Likert scale was used with uniform changes in the degree of choice, to maintain the assumption that the variables may be approximated as interval data. The responders were aware of the nature of the equal spacing assumption.
If the ANOVA rejects H0 and the significance of difference is established, a Tukey HSD (honest significant difference) test was performed to establish exactly where the significances lie. The HSD value is used to find a score in Tukey’s critical value table (not shown here). If the calculated HSD is > Tukey’s critical value, the means are statistically significant [23,24]. The one-way ANOVA determines whether there are any statistically significant differences between the means of more than one independent group of a categorical variable. The p used for this test was p = 0.05. The following hypotheses were used:
Hypothesis 0. (H0).
No significant between the means of the groups being tested.
Hypothesis 1. (H1).
Significant difference between the means of the groups being tested.
H0 is accepted if p ≥ 0.05, and rejected if p < 0.05.
3. Results and Discussion
3.1. Survey Feedback and General Information
A total of 100 questionnaires were distributed, of which 45 were completed and returned. This means that the response rate was 45%. This is more than the 43% that was anticipated.
As mentioned in an above section, the data of Section I of the questionnaire were collected in a previous study and reported elsewhere [12]. However, they were used in this study to provide a context for the present study. The data show that managing directors (31%), project engineers (17.8%), and project managers (15.6%) were the top three professions. Engineers, quality engineers, and safety officers, along with others, made up the lowest score. Table 2 shows the details.
Table 2.
Table illustrating the professions of respondents within the contractor firms.
The types of construction projects undertaken by the firms were ranked in the following order, based on the counts received. The ranks are: (1) General; (2) Buildings; (3) Infrastructure; (4) Mechanical and Electrical Plumbing; (5) Building Facades; and (6) Industrial Piping. Table 3 shows all the percentages. It was also found that, in most instances, each contractor performed at least two types of construction work.
Table 3.
Table illustrating the types of construction projects undertaken by the contractor firms.
The sizes of the contractor firms were approximately distributed as follows: Micro ($500K–1M Annual Turnover) = 6.7%; Small ($1M–$5M Annual Turnover) = 28.9%; Medium ($5M–$15M Annual Turnover) = 28.9% and Large (> 15M Annual turnover) = 35.6%. Due to the small number of observations received for the group categorized as Micro, this group was excluded from the statistical tests performed. Table 4 shows all the sizes.
Table 4.
Table illustrating the sizes of the contractor firms.
The experience of construction industry was as follows: 4.4% had 1–5 years of experience, 26.7% had 6–10 years of experience, 33.3% had 10–15 years of experience, and 35.6% had more than 15 years of experience. Across these varying levels of experience, the varied degrees of education were recorded as follows: Primary: 2.2%, Secondary: 8.9%, Trade/Technical: 4.4%, Diploma: 13.3%, Bachelor’s: 35.6%, and Master’s: 35.6%. Based on the observations received from the general information section of the survey, it was deemed that all respondents were suitably educated and/or experienced within the construction industry.
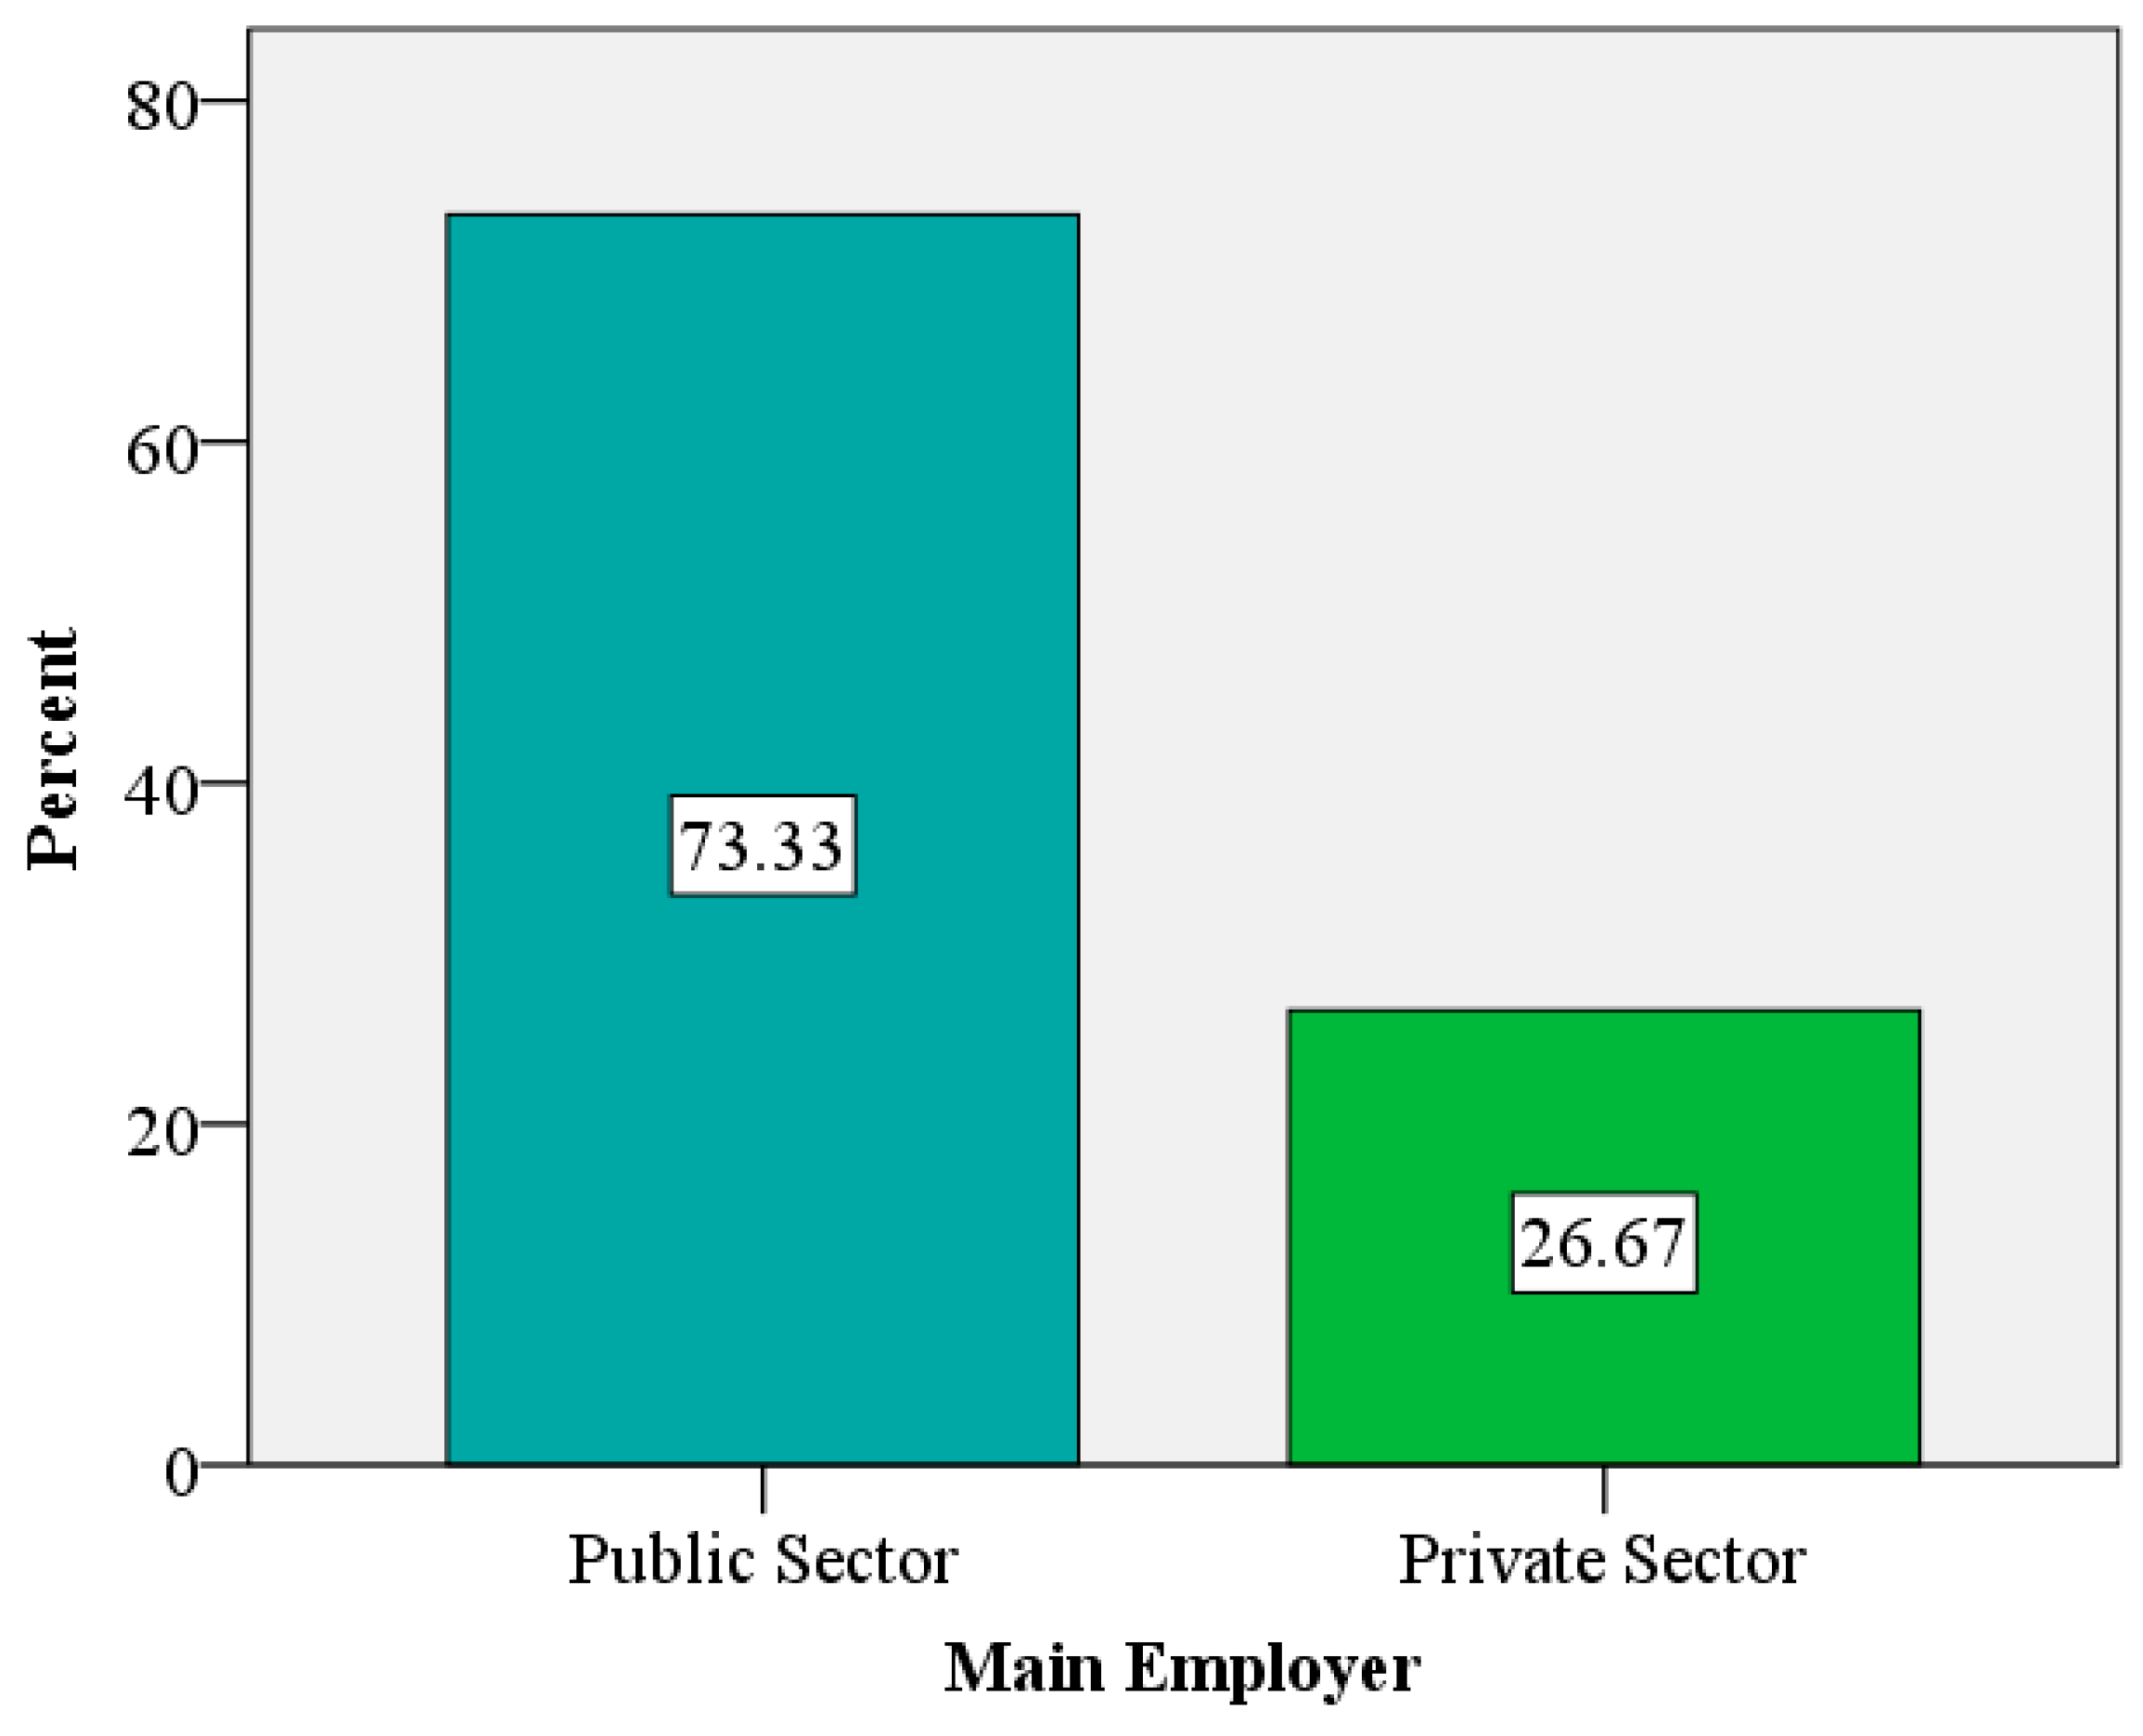
Of the 45 observations, 33 (73.3%) indicated that public sector clients were their main employer, while the remaining 12 (26.7%) indicated that the private sector was their main source of employment.
Figure 1 illustrates that the majority of contractors observed execute works primarily for the public sector (73.3%) for the state of Trinidad and Tobago, and the remaining 27.3% work primarily for the private sector.
Figure 1.
Main sources of employment for contractors.
3.2. Sources and Types of Waste
The materials that are most prone to wastage on construction sites were investigated through Question 8. Respondents were presented with a list of materials, and then asked to indicate their level of agreement with which materials were most wasted on their construction sites. The descriptive statistics, such as number of respondents, mean, standard deviation, standard errors, and lower bound and upper bound (for 95% confidence interval of mean) are provided in Table A1 in Appendix A. The results show that the respondents displayed a relatively negative attitude towards non-wastage of the materials listed. The total mean score for approximately 50% of the materials was below the neutral value of 3, indicating that participants agreed that these materials were most wasted on their sites.
Materials wasted can be ranked as follows, from most agreed wasted to least agreed wasted:
- Wood
- Plastic
- Cardboard
- Gypsum
- Steel
- Ceramic
- Brick and Block
- Aluminum
- Concrete
- Paint
- Glass
- Insulation
- Asphalt
It was observed that wood was the most agreed wasted material, and asphalt the least wasted.
A one-way ANOVA was then performed to assess relationships between contractor size and materials most wasted on construction sites. The test of ‘homogeneity of variances’ was first performed, as shown in Table 5, to check the validity of the ANOVA.
Table 5.
Test of ‘homogeneity of variances’ for materials most wasted on construction sites.
The significance value for each variable was >0.05; therefore, the assumption of ‘homogeneity of variances’ was not violated for any of the variables. ANOVA results were therefore used for all cases. The ANOVA results are highlighted below:
The ANOVA revealed that: Asphalt [F(2,37) = 2.324, p = 0.112]; Concrete [F(2,38) = 2.007, p = 0.148]; Steel [F(2,36) = 1.206, p = 0.311]; Brick and Block [F(2,37) = 2.757, p = 0.077]; Insulation [F(2,36) = 1.594, p = 0.217]; Glass [F(2,36) = 0.77, p = 0.926]; Ceramic [F(2,36) = 1.551, p = 0.226]; Aluminum [F(2,36) = 0.632, p = 0.537]; Plastic [F(2,37) = 1.762, p = 0.186]; Paint [F(2,36) = 2.127, p = 0.134]; Wood [F(2,38) = 0.343, p = 0.712]; Gypsum [F(2,35) = 1.553, p = 0.226]; Cardboard [F(2,36) = 1.454, p = 0.247].
The significance value p for each variable was > 0.05. As such, the null hypothesis, H0, was accepted, and it can be concluded that there is not enough evidence to suggest statistically significant differences between the means of contractor sizes for each material wasted.
Investigating materials most wasted was Question 9, which aimed at investigating the primary causes/sources of waste generation on construction sites. Descriptive statistics, such as number of respondents, mean, standard deviation, standard errors, and lower bound and upper bound (for 95% confidence interval of mean) are provided in Table A2 in Appendix A. The results show that the respondents displayed a relatively negative attitude with respect to the primary causes of waste generation on their construction sites, frequently agreeing that materials were indeed wasted by the causes listed. The total mean score for approximately 80% of the causes listed was below the neutral value of 3, indicating that participants agreed that these causes led to waste generation on their sites.
The primary causes of waste generation can be ranked as follows, from most agreed cause to least agreed cause:
- Wastage due to cutting
- Change of design
- Error by workers on site
- Lack of on-site materials control and management plans
- Wastage due to application process
- Severe weather conditions
- Errors in tender documents
- Poor storage of materials
- Over-mixing of materials
- Incomplete design
- Errors in ordering materials
- Wastage due to theft
- Incorrect use of material
- Transportation damage
- Accidents on site
- Equipment malfunction
- Material suppliers’ error
It was observed that “wastage due to cutting” was the most common agreed cause/source of waste and “material suppliers’ error” was the least common cause/source.
A one-way ANOVA was then performed to assess relationships between contractor size and materials most wasted on construction sites. The test of ‘homogeneity of variances’ was first performed, as shown in Table 6, to check the validity of ANOVA.
Table 6.
Test of ‘homogeneity of variances’ for primary cause of waste generation on sites.
With the exception of “(d) errors in ordering materials,” “(n) over-mixing of materials,” and “(q) lack of on-site materials control and management plans,” the significance value for every other variable was >0.05; therefore, ‘homogeneity of variances’ was not violated for these variables and the ANOVA results were used. The ANOVA results are highlighted below.
The ANOVA revealed that: Cause (a) [F(2,39) = 1.868, p = 0.168]; Cause (b) [F(2,39) = 3.639, p = 0.036]; Cause (c) [F(2,39) = 1.314, p = 0.280]; Cause (e) [F(2,39) = 1.215, p = 0.308]; Cause (f) [F(2,39) = 1.253, p = 0.297]; Cause (g) [F(2,39) = 1.647, p = 0.206]; Cause (h) [F(2,39) = 0.259, p = 0.773]; Cause (i) [F(2,39) = 1.743, p = 0.188]; Cause (j) [F(2,39) = 0.318, p = 0.730]; Cause k) [ F(2,39) = 1.086, p = 0.348]; Cause (l) [F(2,39) = 0.169, p = 0.845]; Cause (m) [F(2,39) = 0.587, p = 0.561]; Cause (o) [F(2,38) = 0.299, p = 0.743]; Cause (p) [F(2,39) = 0.624, p = 0.541].
For “(b) errors in tender documents” the significance value p was <0.05, rejecting the null hypothesis, H0 and implying that there exists a statistically significant difference between the means of contractor sizes for this cause/source. From examining the means, it was observed that there was a significant difference (at the 0.05 significance level) between the Large and Medium categories. Small was not significantly different from either Large or Medium. It can be inferred that the Medium category is less likely to experience wastage due to errors in tender documents than Large.
For criteria “(d) Error in ordering materials,” “(n) over-mixing of materials” and “(q) lack of on-site materials control and management plans,” all had significance values < 0.05; therefore, there was a violation of ‘homogeneity of variances’. In these cases, the Brown–Forsythe and Welch F test results were used to assess the statistical significance of the variables. The robust tests of equality of means for primary causes of waste generation are shown in Table 7 below:
Table 7.
Robust tests of equality of means for primary causes of waste generation on sites.
The Welch and Brown–Forsythe revealed that for: Cause (d) [F(2,23.95) = 6.215, p = 0.007] and [F(2,25.57) = 3.452, p = 0.047], respectively; Cause (n) [F(2,24.22) = 1.105, p = 0.347] and [F(2,29.88) = 0.790, p = 0.463], respectively; Cause (q) [F(2,23.97) = 1.034, p = 0.371] and [F(2,29.67) = 0.715, p = 0.497], respectively.
For “(d) error in ordering materials” the significance value p was <0.05, rejecting the null hypothesis, H0, and implying that there exists a statistically significant difference between the means of contractor sizes for this cause/source.
From examining the means, it was observed that there was a significant difference (at the 0.05 significance level) between the Large and Medium categories. Small was not significantly different from either Large or Medium. It can be inferred that the Medium category is less likely to experience wastage due to errors in ordering materials than the Large. All other dependent variables had a significance value of p > 0.05. As such, the null hypothesis, H0, was accepted and it can be concluded that there is not enough evidence to suggest statistically significant differences between the means of contractor sizes for these causes/sources.
3.3. Waste Management Actions that Can be Performed
How contractors currently treat their material waste was then investigated via Question 10. Recycle/reuse, composting, incineration, and landfilling were the treatment options given for each material waste, and respondents were given the opportunity to select multiple options per waste material. The results are shown as follows in Table 8.
Table 8.
Current treatment methods for material waste.
From the data collected, steel appears to be the material that is most efficiently used, as it had the highest recycle/reuse count and the lowest landfilling count. Following in a similar manner to steel were wood, asphalt, aluminum, and paint, all having > 50% of respondents indicate recycle/reuse and <50% indicate landfilling.
On the opposite end of the spectrum is concrete, as it had one of the lower recycle/reuse counts and the highest landfilling count. Following in similar nature to concrete were ceramic, cardboard, gypsum, plastic, glass and insulation, all having < 50% of respondents indicate recycle/reuse and >50% indicate landfilling. Overall, however, it can be observed that the main treatment methods for material waste on Trinidad and Tobago’s construction sites are recycle/reuse and landfilling. Incineration was rarely sighted as a treatment method, and composting even less so.
Through Question 11, respondents were asked to indicate their level of agreement with which of the previously listed materials had good potential for recycle/reuse in Trinidad and Tobago. Descriptive statistics such as number of respondents, mean, standard deviation, standard errors, and lower bound and upper bound (for 95% confidence interval of mean) are provided in Table A3 in Appendix A. The results indicate that, overall, participants agreed that these materials have some sort of recycle/reuse potential in Trinidad and Tobago, as all means were above the neutral value of 3. The materials can be ranked as follows, from most agreed recycle/reuse potential to least agreed:
- Steel
- Asphalt
- Plastic
- Aluminum
- Wood
- Brick and Block
- Glass
- Ceramic
- Cardboard
- Concrete
- Paint
- Insulation
- Gypsum Board
Overall, steel appeared to be the material with most agreed recycle/reuse potential, and gypsum board the least. Current treatment methods reflect these results.
A one-way ANOVA was then performed to assess relationships between contractor size and materials most wasted on construction sites. The test of ‘homogeneity of variances’ was first performed, as shown in Table 9, to check the validity of the ANOVA.
Table 9.
Test of ‘homogeneity of variances’ for materials with good recycle/reuse potential.
With the exception of “steel,” “glass,” and “cardboard,” the significance value for every other variable was > 0.05; therefore, the assumption relating to ‘homogeneity of variances’ was not violated for these other variables, and the ANOVA results were used.
The ANOVA results are highlighted below:
The ANOVA revealed that: Asphalt [F(2,38) = 1.721, p = 0.192]; Concrete [F(2,37) = 2.585, p = 0.089]; Brick [F(2,38) = 1.111, p = 0.340]; Insulation [F(2,38) = 1.496, p = 0.237]; Ceramic [F(2,36) = 0.658, p = 0.524]; Aluminum [F(2,38) = 0.736, p = 0.486]; Plastic [F(2,38) = 0.447, p = 0.643]; Paint [F(2,38) = 3.361, p = 0.045]; Wood [F(2,38) = 1.192, p = 0.315]; Gypsum [F(2,38) = 0.700, p = 0.503].
For “Paint,” the significance value p was < 0.05, rejecting the null hypothesis, H0, and implying that there exists a statistically significant difference between the means of contractor sizes for this material’s recycle/reuse potential. From examining the means, it was observed that there was a significant difference (at the 0.05 significance level) between the Large and Medium categories. Small was not significantly different from either Large or Medium. The Medium category displayed the most positive attitude towards paint having reuse/recycle potential.
“Steel,” “glass,” and “cardboard” had significance values ≤ 0.05; therefore, the assumption of ‘homogeneity of variances’ was violated. In these cases, the Brown–Forsythe and Welch F test results were used to assess the statistical significance of these variables. Table 10 shows the robust tests of equality of means for materials with good recycle/reuse potential.
Table 10.
Robust tests of equality of means for materials with good recycle/reuse potential.
All other dependent variables, inclusive of those tested via Welch and Brown–Forsythe, had a significance value p > 0.05. As such, the null hypothesis, H0, was accepted and it can be concluded that there is not enough evidence to suggest statistically significant differences between the means of contractor sizes for these materials’ recycle/reuse potential.
3.4. Potential Benefits of C&D Waste Management and Barriers to Implementation
Question 12 listed potential advantages of successful implementation of C&D waste management. Respondents were asked to indicate their level of agreement with each advantage of C&D waste management. The results are provided in Table A4 in Appendix A. Results show that the respondents displayed relatively positive attitudes towards the advantages, as the total mean score for each advantage was above the neutral value of 3. This indicates that, overall, participants agreed with these advantages. The advantages can be ranked as follows, from most agreed advantage to least agreed:
- Reduction in negative environmental impacts due to waste
- Reduction in public health and social issues caused by waste
- Improved resource efficiency
- Purchase cost savings due to reduced wastage of materials
- Increased longevity of landfills
- Waste disposal savings
A one-way ANOVA was then performed to assess relationships between contractor size and materials most wasted on construction sites. The test of ‘homogeneity of variances’ was first performed, as shown in Table 11, to check the validity of the ANOVA.
Table 11.
Test of ‘homogeneity of variances’ for advantages of construction and demolition (C&D) waste management.
The significance value for each variable was > 0.05; therefore, ‘homogeneity of variances’ was not violated for any of the variables. The ANOVA results are highlighted below:
The ANOVA revealed that: Advantage (a) [F(2,39) = 2.199, p = 0.124]; Advantage (b) [F(2,39) = 2.176, p = 0.127]; Advantage (c) [F(2,39) = 0.505, p = 0.607]; Advantage (d) [F(2,39) = 1.819, p = 0.176]; Advantage e) [F(2,39) = 1.449, p = 0.247]; Advantage( f) [F(2,39) = 0.464, p = 0.632].
The significance value p for each variable was > 0.05. As such, the null hypothesis, H0, was accepted, and it can be concluded that there is not enough evidence to suggest statistically significant differences between the means of contractor sizes for advantages of C&D waste management.
Another benefit or advantage of proper and effective implementation of C&D waste management is sustainability. Question 13 proceeded to ask respondents whether they believed sustainability and sustainable development were major benefits of C&D waste management implementation. The results are provided in Table 12, as follows:
Table 12.
Results for sustainability and sustainable development being a major benefit of C&D waste management.
It was observed that all individuals who responded did so in a positive manner, indicating that, no matter the firm size category they belonged to, all respondents agreed that sustainability would be a major benefit of C&D waste management implementation.
C&D waste management may provide several advantages, as previously explored, however, like most plans, there are factors which can hinder successful implementation. Question 14 aimed to investigate respondents’ attitudes towards some of the barriers to C&D waste management implementation. Descriptive statistics, such as number of respondents, mean, standard deviation, standard errors, and lower bound and upper bound (for 95% confidence interval of mean) are provided in Table A5 in Appendix A.
Results indicate that, overall, respondents agreed that the factors listed would hinder implementation of C&D waste management to some degree, as the total mean score for each factor was above the neutral value of 3. The hindering factors can be ranked as follows, from most agreed to least agreed:
- Lack of education and awareness of C&D waste management
- Lack of enforcement of waste management legislation and policies
- Lack of material recycling facilities
- No penalties for poor waste management practices
- No incentives offered for practicing C&D waste management
- Poor legislation and policies relating to waste management
- Lack of ownership of waste on sites due to multiple contractors
- Lack of implementation of green building codes and specifications
- Lack of support of C&D waste management by clients
- Lack of implementation frameworks and guidelines
- Designers do not design with waste management in mind
- Perception that there is no net benefit from implementing C&D waste management
- Congestion on construction sites
- C&D waste management is too costly to implement
A one-way ANOVA was then performed to assess relationships between contractor size and materials most wasted on construction sites. The test of ‘homogeneity of variances’ was first performed, as shown in Table 13, to check the validity of the ANOVA.
Table 13.
Test of ‘homogeneity of variances’ for hindrance factors.
With the exception of “(a) congestion on construction sites,” “(h) lack of material recycling facilities,” “(i) lack of implementation of green building codes and specifications,” and “(n) lack of support of C&D waste management by clients,” the significance value for every other variable was > 0.05; therefore, assumption of ‘homogeneity of variances’ was not violated for these variables and the ANOVA results were used.
The ANOVA results are highlighted below:
The ANOVA revealed that: Factor (b) [F(2,39) = 1.727, p = 0.191]; Factor (c) [F(2,38) = 1.944, p = 0.157]; Factor (d) [F(2,39) = 1.839, p = 0.172]; Factor (e) [F(2,39) = 2.181, p = 0.126]; Factor (f) [F(2,39) = 2.979, p = 0.063]; Factor (g) [F(2,39) = 2.917, p = 0.066]; Factor (j) [F(2,39) = 1.206, p = 0.310]; Factor (k) [F(2,39) = 1.864, p = 0.169]; Factor (l) [F(2,39) = 0.343, p = 0.712]; Factor (m) [F(2,39) = 0.391, p = 0.679]. The significance value p for each variable was >0.05. As such, the null hypothesis, H0, was accepted, and it can be concluded that there is not enough evidence to suggest statistically significant differences between the means of contractor sizes for these factors which may hinder C&D waste management implementation.
The criteria “(a) congestion on construction sites,” “(h) lack of material recycling facilities,” “(i) lack of implementation of green building codes and specifications,” and “(n) lack of support of C&D waste management by clients,” had significance values < 0.05; therefore, there was a violation of assumption of ‘homogeneity of variances.’ In these cases, the Brown–Forsythe and Welch F test results were used to assess the statistical significance of these variables. Table 14 shows the robust tests of equality of means for hindrance factors.
Table 14.
Robust tests of equality of means for hindrance factors.
The Welch and Brown–Forsythe revealed that: Factor (a) [F(2,23.91) = 3.750, p = 0.039] and [F(2,27.03) = 2.691, p = 0.086], respectively; Factor (h) [F(2,23.25) = 1.924, p = 0.169] and [F(2,30.60) = 1.852, p = 0.174], respectively; Factor (i) [F(2,24.74) = 1.593, p = 0.224] and [F(2,32.19) = 1.791, p = 0.183], respectively; Factor (n) [F(2,24.84) = 1.085, p = 0.353] and [F(2,33.00) = 1.146, p = 0.330], respectively
The Welch and Brown–Forsythe revealed conflicting results for “(a) congestion on construction sites.” The Brown–Forsythe accepted the null hypothesis, H0, with significance value P > 0.05, whereas the Welch rejected the null hypothesis, H0, with significance value P < 0.05. Given that both ANOVA and Brown–Forsythe accepted the null hypothesis, H0, we can conclude that there is not enough evidence to suggest statistically significant differences, while acknowledging the fact that a Type II error may exist if the Welch test was indeed correct.
Question 15 listed six (6) factors which may assist with increasing the utilization of C&D waste management. Participants were asked to express their degrees of agreement with each factor. Descriptive statistics, such as number of respondents, mean, standard deviation, standard errors, and lower bound and upper bound (for 95% confidence interval of mean), are provided in Table A6 in Appendix A. Results reveal that the respondents displayed relatively positive attitudes towards the factors which can help increase C&D waste management implementation, as the total mean score for each factor was above the neutral value of 3. This indicates that, overall, participants agreed with these factors. The factors can be ranked as follows, from most agreed to least agreed:
- Offering of incentives and tender premiums related to waste management
- Increased awareness and dissemination of knowledge about C&D waste management
- Increased support of C&D waste management from clients
- Increased implementation of green building codes and specifications
- Introduction of penalties for poor waste management practices
- Increased landfill charges
A one-way ANOVA was then performed to assess relationships between contractor size and materials most wasted on construction sites. The test of ‘homogeneity of variances’ was first performed, as shown in Table 15, to check the validity of the ANOVA.
Table 15.
Test of ‘homogeneity of variances’ for factors which can help increase utilization of C&D waste management.
With the exception of “(b) increased implementation of green building codes and specifications” and “(c) increased landfill charges,” the significance value for every other variable was >0.05; therefore the assumption relating to ‘homogeneity of variances’ was not violated for these variables and the ANOVA results were used.
The ANOVA results are highlighted below:
The ANOVA revealed that: Factor (a) [F(2,39) = 0.635, p = 0.535]; Factor (d) [F(2,39) = 1.781, p = 0.182]; Factor (e) [F(2,39) = 0.060, p = 0.942]; Factor (f) [F(2,39) = 0.060, p = 0.942].
The significance value p for each variable was > 0.05. As such, the null hypothesis, H0, was accepted, and it can be concluded that there is not enough evidence to suggest statistically significant differences between the means of contractor sizes for factors which may help increase utilization of C&D waste management.
The Welch and Brown–Forsythe revealed that for: Factor (b) [F(2,25.05) = 0.564, p = 0.576] and [F(2,35.59) = 0.544, p = 0.585], respectively; Factor (c) [F(2,22.92) = 1.182, p = 0.325] and [F(2,31.80) = 1.005, p = 0.377], respectively.
The criteria “(b) increased implementation of green building codes and specifications” and “(c) increased landfill charges,” have significance values <0.05; therefore there was a violation of ‘homogeneity of variances.’ In these cases, the Brown–Forsythe and Welch F tests result were used to assess the statistical significance of these variables. Table 16 provides the information of robust tests of equality of means for factors which can help increase utilization of C&D waste management.
Table 16.
Robust tests of equality of means for factors which can help increase utilization of C&D waste management.
Similarly, the significance value p for each respective variable was > 0.05. As such, the null hypothesis, H0, was accepted, and it can be concluded that there is not enough evidence to suggest statistically significant differences between the means of contractor sizes for factors which may help increase utilization of C&D waste management.
3.5. Additional Feedback
The questionnaire provided an “other” option for several questions, as well as one (1) open ended question at the end. These enabled participants to input data based on their personal experiences relating to the topic and share their insight. The following outlines some of the feedback that was received:
- One (1) respondent indicated that the establishment of a waste-to-energy (WTE) Plant would help with the implementation and use of C&D waste management plans. WTE, also referred to as combustion with energy recovery, involves the sorting of waste to remove recyclable and hazardous materials. The remaining waste is then combusted to produce energy, usually in the form of electricity. According to the US experience, the introduction of WTE plants have decreased the environmental and health impacts caused by municipal solid waste, as well as increasing recycle rates by 17.8%.
- Other respondents agreed that proper waste management should be implemented nationwide with stringent laws and penalties, and supported by proper training and education.
- Respondents placed emphasis on education of the workforce and public about waste management, further stating that failure to do so will inevitably result in negative environmental impacts as well as health and social issues.
The feedback received alludes to the conclusion that the respondents have a negative perception of the current state of waste management in Trinidad and Tobago. They are aware of the negative impacts that will result if waste remains poorly managed, but they see potential for improvement once support is gathered.
4. Conclusions
Based on the results, it was revealed that the top five (5) materials identified as being most wasted on construction sites in Trinidad and Tobago were: (1) Wood; (2) Plastic; (3) Cardboard; (4) Gypsum board; (5) Steel.
The top five (5) causes of waste were identified as: (1) Wastage due to cutting; (2) Change of design; (3) Lack of on-site materials control and management; (4) Wastage due to application process of materials
The results further showed that currently, reuse and landfilling are the two (2) primary treatment method selected to deal with all types of material waste. Composting is used to some degree for wood, gypsum board, and cardboard, and incineration is used to some degree for insulation, plastic, paint, wood, gypsum board, and cardboard. With respect to potential actions, the means for recycle/reuse of all materials were on the positive side of the agreement scale. The top five (5) materials identified as having recycle/reuse potential were: (1) Steel; (2) Asphalt; (3) Plastic; (4) Wood; (5) Aluminum
The top five (5) advantages/benefits of implementing C&D waste management plans, based on agreement levels of respondents, were as follows: (1) Reduction in negative environmental impacts due to waste; (2) Reduction in public health and social issues caused by waste; (3) Improved resource efficiency; (4) Purchase cost savings due to reduced wastage of materials; (5) Increased longevity of landfills.
Interestingly enough, the top three (3) rated benefits are not directly related to financial gain for contractor organizations, they fall more into the environmental and social pillars of sustainability. Following this, all respondents responded positively to sustainability being a major benefit of effective implementation of C&D waste management.
Out of the 14 potential barriers listed, respondents identified these factors as the top 5 factors acting as hindrances to the implementation of C&D waste management in Trinidad and Tobago: (1) Lack of education and awareness of C&D waste management; (2) Lack of enforcement of waste management legislation and policies; (3) Lack of material recycling facilities; (4) No penalties for poor waste management practices; and (5) No incentives offered for practicing C&D waste management.
Almost in direct response to the hindrances listed above were the top five (5) factors agreed as being able to assist with promotion of C&D waste management plan implementation. These factors can be perceived as recommendations to help improve the status of C&D waste management utilization, and they include: (1) The offering of incentives and tender premiums related to waste management; (2) Increasing awareness and dissemination of knowledge about C&D waste management; (3) Increasing support of C&D waste management from clients; (4) Increasing implementation of green building codes and specifications; (5) Introducing penalties for poor waste management practices.
As to hypothesis that larger contractors will have a more positive attitude towards construction and demolition waste management as alternative hypothesis, the majority of tests accepted the null hypothesis, which means no significant difference, and the few that rejected it suggested varying relationships, not consistent with larger being more positive. In light of this, it can be concluded that there is not enough evidence to suggest larger contractors have more positive attitudes towards C&D waste management in Trinidad and Tobago.
Supplementary Materials
Supplementary materials can be found at https://www.mdpi.com/2075-5309/9/6/150/s1.
Author Contributions
N.N.: Initial conceptualization, part of the manuscript, draft methodology and discussions, validation, formal analysis, data curation, and investigation. I.R.: Supervision and guidance of the work, revised methodology, part of the manuscript, review and editing, validation, data curation, investigation, project administration. G.H.: Part of the manuscript and modified the entire manuscript; revised methodology, writing—review and editing, validation, data curation, investigation.
Funding
This research received no external funding.
Conflicts of Interest
The authors declare no conflict of interest.
Appendix A: Tables of Results for Descriptive Statistics
Table A1.
Results for materials most wasted on construction sites. (Lower Value = Higher Level of Agreement; Min. = 1.0 Max. = 5.0).
Table A1.
Results for materials most wasted on construction sites. (Lower Value = Higher Level of Agreement; Min. = 1.0 Max. = 5.0).
| Materials Firm | N | Mean | Std. Deviation | Std. Error | 95% Confidence Interval for Mean | ||
|---|---|---|---|---|---|---|---|
| Lower Bound | Upper Bound | ||||||
| Asphalt | Small | 13 | 3.6154 | 0.76795 | 0.21299 | 3.1513 | 4.0795 |
| Medium | 13 | 3.7692 | 0.72501 | 0.20108 | 3.3311 | 4.2074 | |
| Large | 14 | 3.1429 | 0.86444 | 0.23103 | 2.6437 | 3.6420 | |
| Total | 40 | 3.5000 | 0.81650 | 0.12910 | 3.2389 | 3.7611 | |
| Concrete | Small | 13 | 3.0000 | 1.15470 | 0.32026 | 2.3022 | 3.6978 |
| Medium | 13 | 3.6154 | 0.86972 | 0.24122 | 3.0898 | 4.1410 | |
| Large | 15 | 2.8667 | 1.06010 | 0.27372 | 2.2796 | 3.4537 | |
| Total | 41 | 3.1463 | 1.06210 | 0.16587 | 2.8111 | 3.4816 | |
| Steel | Small | 11 | 2.5455 | 1.12815 | 0.34015 | 1.7876 | 3.3034 |
| Medium | 13 | 3.2308 | 0.92681 | 0.25705 | 2.6707 | 3.7908 | |
| Large | 15 | 2.6667 | 1.39728 | 0.36078 | 1.8929 | 3.4405 | |
| Total | 39 | 2.8205 | 1.18925 | 0.19043 | 2.4350 | 3.2060 | |
| Brick and Block | Small | 13 | 3.0769 | 1.03775 | 0.28782 | 2.4498 | 3.7040 |
| Medium | 13 | 3.3846 | 0.96077 | 0.26647 | 2.8040 | 3.9652 | |
| Large | 14 | 2.4286 | 1.22250 | 0.32673 | 1.7227 | 3.1344 | |
| Total | 40 | 2.9500 | 1.13114 | 0.17885 | 2.5882 | 3.3118 | |
| Insulation | Small | 13 | 3.0769 | 0.75955 | 0.21066 | 2.6179 | 3.5359 |
| Medium | 12 | 3.5833 | 0.66856 | 0.19300 | 3.1586 | 4.0081 | |
| Large | 14 | 3.4286 | 0.75593 | 0.20203 | 2.9921 | 3.8650 | |
| Total | 39 | 3.3590 | 0.74294 | 0.11897 | 3.1181 | 3.5998 | |
| Glass | Small | 13 | 3.3846 | 1.12090 | 0.31088 | 2.7073 | 4.0620 |
| Medium | 12 | 3.4167 | 0.51493 | 0.14865 | 3.0895 | 3.7438 | |
| Large | 14 | 3.2857 | 0.91387 | 0.24424 | 2.7581 | 3.8134 | |
| Total | 39 | 3.3590 | 0.87320 | 0.13982 | 3.0759 | 3.6420 | |
| Ceramic | Small | 13 | 2.5385 | 0.87706 | 0.24325 | 2.0085 | 3.0685 |
| Medium | 12 | 3.1667 | 0.83485 | 0.24100 | 2.6362 | 3.6971 | |
| Large | 14 | 2.8571 | 0.94926 | 0.25370 | 2.3091 | 3.4052 | |
| Total | 39 | 2.8462 | 0.90433 | 0.14481 | 2.5530 | 3.1393 | |
| Aluminum | Small | 13 | 2.9231 | 0.95407 | 0.26461 | 2.3465 | 3.4996 |
| Medium | 12 | 3.3333 | 0.65134 | 0.18803 | 2.9195 | 3.7472 | |
| Large | 14 | 3.0714 | 1.07161 | 0.28640 | 2.4527 | 3.6902 | |
| Total | 39 | 3.1026 | 0.91176 | 0.14600 | 2.8070 | 3.3981 | |
| Plastic | Small | 13 | 2.0000 | 0.91287 | 0.25318 | 1.4484 | 2.5516 |
| Medium | 12 | 2.7500 | 0.96531 | 0.27866 | 2.1367 | 3.3633 | |
| Large | 15 | 2.4667 | 1.12546 | 0.29059 | 1.8434 | 3.0899 | |
| Total | 40 | 2.4000 | 1.03280 | 0.16330 | 2.0697 | 2.7303 | |
| Paint | Small | 13 | 3.2308 | 1.09193 | 0.30285 | 2.5709 | 3.8906 |
| Medium | 12 | 3.6667 | 0.65134 | 0.18803 | 3.2528 | 4.0805 | |
| Large | 14 | 2.9286 | 0.91687 | 0.24505 | 2.3992 | 3.4580 | |
| Total | 39 | 3.2564 | 0.93803 | 0.15020 | 2.9523 | 3.5605 | |
| Wood | Small | 13 | 2.0769 | 0.86232 | 0.23916 | 1.5558 | 2.5980 |
| Medium | 13 | 2.2308 | 0.83205 | 0.23077 | 1.7280 | 2.7336 | |
| Large | 15 | 1.9333 | 1.09978 | 0.28396 | 1.3243 | 2.5424 | |
| Total | 41 | 2.0732 | 0.93248 | 0.14563 | 1.7788 | 2.3675 | |
| Gypsum | Small | 12 | 2.4167 | 0.51493 | 0.14865 | 2.0895 | 2.7438 |
| Medium | 12 | 3.0000 | 0.95346 | 0.27524 | 2.3942 | 3.6058 | |
| Large | 14 | 2.9286 | 1.07161 | 0.28640 | 2.3098 | 3.5473 | |
| Total | 38 | 2.7895 | .90518 | 0.14684 | 2.4919 | 3.0870 | |
| Cardboard | Small | 13 | 2.3077 | 1.03155 | 0.28610 | 1.6843 | 2.9311 |
| Medium | 12 | 3.0000 | 0.95346 | 0.27524 | 2.3942 | 3.6058 | |
| Large | 14 | 2.7143 | 1.06904 | 0.28571 | 2.0970 | 3.3315 | |
| Total | 39 | 2.6667 | 1.03449 | 0.16565 | 2.3313 | 3.0020 | |
Table A2.
Results for primary causes of waste generation on construction sites. (lower value = higher level of agreement; Min. = 1.0 Max. = 5.0).
Table A2.
Results for primary causes of waste generation on construction sites. (lower value = higher level of agreement; Min. = 1.0 Max. = 5.0).
| Cause Firm | N | Mean | Std. Deviation | Std. Error | 95% Confidence Interval for Mean | ||
|---|---|---|---|---|---|---|---|
| Lower Bound | Upper Bound | ||||||
| (a) Incomplete design | Small | 13 | 2.6154 | 1.12090 | 0.31088 | 1.9380 | 3.2927 |
| Medium | 13 | 3.1538 | 0.98710 | 0.27377 | 2.5573 | 3.7503 | |
| Large | 16 | 2.3750 | 1.14746 | 0.28687 | 1.7636 | 2.9864 | |
| Total | 42 | 2.6905 | 1.11504 | 0.17205 | 2.3430 | 3.0379 | |
| (b) Errors in tender documents | Small | 13 | 2.6923 | 0.85485 | 0.23709 | 2.1757 | 3.2089 |
| Medium | 13 | 3.1538 | 0.89872 | 0.24926 | 2.6108 | 3.6969 | |
| Large | 16 | 2.2500 | 0.93095 | 0.23274 | 1.7539 | 2.7461 | |
| Total | 42 | 2.6667 | 0.95424 | 0.14724 | 2.3693 | 2.9640 | |
| (c) Change of design | Small | 13 | 1.8462 | 0.68874 | 0.19102 | 1.4300 | 2.2624 |
| Medium | 13 | 2.3077 | 0.94733 | 0.26274 | 1.7352 | 2.8802 | |
| Large | 16 | 1.9375 | 0.68007 | 0.17002 | 1.5751 | 2.2999 | |
| Total | 42 | 2.0238 | 0.78050 | 0.12043 | 1.7806 | 2.2670 | |
| (d) Errors in ordering materials | Small | 13 | 2.6154 | 1.32530 | 0.36757 | 1.8145 | 3.4163 |
| Medium | 13 | 3.3077 | 0.63043 | 0.17485 | 2.9267 | 3.6887 | |
| Large | 16 | 2.3750 | 0.80623 | 0.20156 | 1.9454 | 2.8046 | |
| Total | 42 | 2.7381 | 1.01356 | 0.15639 | 2.4222 | 3.0539 | |
| (e) Material suppliers’ error | Small | 13 | 3.6154 | 0.76795 | 0.21299 | 3.1513 | 4.0795 |
| Medium | 13 | 3.3846 | 0.86972 | 0.24122 | 2.8590 | 3.9102 | |
| Large | 16 | 3.1250 | 0.88506 | 0.22127 | 2.6534 | 3.5966 | |
| Total | 42 | 3.3571 | 0.85029 | 0.13120 | 3.0922 | 3.6221 | |
| (f) Poor storage of materials | Small | 13 | 2.6154 | 1.38675 | 0.38462 | 1.7774 | 3.4534 |
| Medium | 13 | 3.0769 | 1.11516 | 0.30929 | 2.4030 | 3.7508 | |
| Large | 16 | 2.3750 | 1.08781 | 0.27195 | 1.7953 | 2.9547 | |
| Total | 42 | 2.6667 | 1.20298 | 0.18562 | 2.2918 | 3.0415 | |
| (g) Transportation damage | Small | 13 | 2.7692 | 1.01274 | 0.28088 | 2.1572 | 3.3812 |
| Medium | 13 | 3.3077 | 0.94733 | 0.26274 | 2.7352 | 3.8802 | |
| Large | 16 | 2.7500 | 0.77460 | 0.19365 | 2.3372 | 3.1628 | |
| Total | 42 | 2.9286 | 0.92110 | 0.14213 | 2.6415 | 3.2156 | |
| (h) Errors by workers on site | Small | 13 | 2.0769 | 1.03775 | 0.28782 | 1.4498 | 2.7040 |
| Medium | 13 | 2.3077 | 0.94733 | 0.26274 | 1.7352 | 2.8802 | |
| Large | 16 | 2.1250 | 0.61914 | 0.15478 | 1.7951 | 2.4549 | |
| Total | 42 | 2.1667 | 0.85302 | 0.13162 | 1.9008 | 2.4325 | |
| (i) Equipment malfunction | Small | 13 | 3.2308 | 0.83205 | 0.23077 | 2.7280 | 3.7336 |
| Medium | 13 | 3.2308 | 0.72501 | 0.20108 | 2.7926 | 3.6689 | |
| Large | 16 | 2.7500 | 0.85635 | 0.21409 | 2.2937 | 3.2063 | |
| Total | 42 | 3.0476 | 0.82499 | 0.12730 | 2.7905 | 3.3047 | |
| (j) Severe weather conditions | Small | 13 | 2.7692 | 1.01274 | 0.28088 | 2.1572 | 3.3812 |
| Medium | 13 | 2.4615 | 0.77625 | 0.21529 | 1.9925 | 2.9306 | |
| Large | 16 | 2.5625 | 1.15289 | 0.28822 | 1.9482 | 3.1768 | |
| Total | 42 | 2.5952 | 0.98920 | 0.15264 | 2.2870 | 2.9035 | |
| (k) Accidents on site | Small | 13 | 3.2308 | 0.83205 | 0.23077 | 2.7280 | 3.7336 |
| Medium | 13 | 2.7692 | 0.83205 | 0.23077 | 2.2664 | 3.2720 | |
| Large | 16 | 3.0625 | 0.77190 | 0.19298 | 2.6512 | 3.4738 | |
| Total | 42 | 3.0238 | 0.81114 | 0.12516 | 2.7710 | 3.2766 | |
| (l) Incorrect use of material | Small | 13 | 3.0000 | 1.00000 | 0.27735 | 2.3957 | 3.6043 |
| Medium | 13 | 2.7692 | 1.01274 | 0.28088 | 2.1572 | 3.3812 | |
| Large | 16 | 2.8750 | 1.02470 | 0.25617 | 2.3290 | 3.4210 | |
| Total | 42 | 2.8810 | 0.99271 | 0.15318 | 2.5716 | 3.1903 | |
| (m) Wastage due to cutting | Small | 13 | 2.0000 | 1.08012 | 0.29957 | 1.3473 | 2.6527 |
| Medium | 13 | 2.1538 | 0.89872 | 0.24926 | 1.6108 | 2.6969 | |
| Large | 16 | 1.8125 | 0.54391 | 0.13598 | 1.5227 | 2.1023 | |
| Total | 42 | 1.9762 | 0.84068 | 0.12972 | 1.7142 | 2.2382 | |
| (n) Overmixing of materials | Small | 13 | 2.7692 | 1.36344 | 0.37815 | 1.9453 | 3.5932 |
| Medium | 13 | 2.9231 | 0.86232 | 0.23916 | 2.4020 | 3.4442 | |
| Large | 16 | 2.4375 | 0.89209 | 0.22302 | 1.9621 | 2.9129 | |
| Total | 42 | 2.6905 | 1.04737 | 0.16161 | 2.3641 | 3.0169 | |
| (o) Wastage due to application process | Small | 13 | 2.3846 | 1.04391 | 0.28953 | 1.7538 | 3.0154 |
| Medium | 12 | 2.6667 | 0.88763 | 0.25624 | 2.1027 | 3.2306 | |
| Large | 16 | 2.5000 | 0.81650 | 0.20412 | 2.0649 | 2.9351 | |
| Total | 41 | 2.5122 | 0.89783 | 0.14022 | 2.2288 | 2.7956 | |
| (p) Wastage due to theft | Small | 13 | 2.5385 | 1.05003 | 0.29123 | 1.9039 | 3.1730 |
| Medium | 13 | 2.8462 | 0.98710 | 0.27377 | 2.2497 | 3.4427 | |
| Large | 16 | 2.9375 | 0.92871 | 0.23218 | 2.4426 | 3.4324 | |
| Total | 42 | 2.7857 | 0.97620 | 0.15063 | 2.4815 | 3.0899 | |
| (q) Lack of onsite materials control and management plans | Small | 13 | 2.4615 | 1.45002 | 0.40216 | 1.5853 | 3.3378 |
| Medium | 13 | 2.6923 | 0.94733 | 0.26274 | 2.1198 | 3.2648 | |
| Large | 16 | 2.1875 | 0.91059 | 0.22765 | 1.7023 | 2.6727 | |
| Total | 42 | 2.4286 | 1.10747 | 0.17089 | 2.0835 | 2.7737 | |
Table A3.
Results for material waste with good recycle/reuse potential (Lower Value = Lower Level of Agreement; Min. = 1.0 Max. = 5.0).
Table A3.
Results for material waste with good recycle/reuse potential (Lower Value = Lower Level of Agreement; Min. = 1.0 Max. = 5.0).
| Materials Firm | N | Mean | Std. Deviation | Std. Error | 95% Confidence Interval for Mean | ||
|---|---|---|---|---|---|---|---|
| Lower Bound | Upper Bound | ||||||
| Asphalt | Small | 13 | 4.6923 | 0.48038 | 0.13323 | 4.4020 | 4.9826 |
| Medium | 13 | 4.3846 | 0.65044 | 0.18040 | 3.9916 | 4.7777 | |
| Large | 15 | 4.7333 | 0.45774 | 0.11819 | 4.4798 | 4.9868 | |
| Total | 41 | 4.6098 | 0.54213 | 0.08467 | 4.4386 | 4.7809 | |
| Concrete | Small | 13 | 3.0000 | 1.29099 | 0.35806 | 2.2199 | 3.7801 |
| Medium | 12 | 3.9167 | 0.99620 | 0.28758 | 3.2837 | 4.5496 | |
| Large | 15 | 3.9333 | 1.27988 | 0.33046 | 3.2246 | 4.6421 | |
| Total | 40 | 3.6250 | 1.25448 | 0.19835 | 3.2238 | 4.0262 | |
| Steel | Small | 13 | 4.4615 | 0.51887 | 0.14391 | 4.1480 | 4.7751 |
| Medium | 13 | 4.5385 | 0.66023 | 0.18311 | 4.1395 | 4.9374 | |
| Large | 15 | 4.8000 | 0.41404 | 0.10690 | 4.5707 | 5.0293 | |
| Total | 41 | 4.6098 | 0.54213 | 0.08467 | 4.4386 | 4.7809 | |
| Brick and Block | Small | 13 | 4.2308 | 0.83205 | 0.23077 | 3.7280 | 4.7336 |
| Medium | 13 | 4.1538 | 0.89872 | 0.24926 | 3.6108 | 4.6969 | |
| Large | 15 | 3.7333 | 1.09978 | 0.28396 | 3.1243 | 4.3424 | |
| Total | 41 | 4.0244 | 0.96145 | 0.15015 | 3.7209 | 4.3279 | |
| Insulation | Small | 13 | 3.0769 | 1.11516 | 0.30929 | 2.4030 | 3.7508 |
| Medium | 13 | 3.6923 | 0.85485 | 0.23709 | 3.1757 | 4.2089 | |
| Large | 15 | 3.4000 | 0.73679 | 0.19024 | 2.9920 | 3.8080 | |
| Total | 41 | 3.3902 | 0.91864 | 0.14347 | 3.1003 | 3.6802 | |
| Glass | Small | 13 | 3.4615 | 1.26592 | 0.35110 | 2.6965 | 4.2265 |
| Medium | 13 | 4.0000 | 1.00000 | 0.27735 | 3.3957 | 4.6043 | |
| Large | 15 | 4.3333 | 0.61721 | 0.15936 | 3.9915 | 4.6751 | |
| Total | 41 | 3.9512 | 1.02350 | 0.15984 | 3.6282 | 4.2743 | |
| Ceramic | Small | 12 | 3.3333 | 1.23091 | 0.35533 | 2.5512 | 4.1154 |
| Medium | 12 | 3.7500 | 1.05529 | 0.30464 | 3.0795 | 4.4205 | |
| Large | 15 | 3.8000 | 1.08233 | 0.27946 | 3.2006 | 4.3994 | |
| Total | 39 | 3.6410 | 1.11183 | 0.17804 | 3.2806 | 4.0014 | |
| Aluminum | Small | 13 | 4.3846 | 0.65044 | 0.18040 | 3.9916 | 4.7777 |
| Medium | 13 | 4.1538 | 0.89872 | 0.24926 | 3.6108 | 4.6969 | |
| Large | 15 | 4.4667 | 0.51640 | 0.13333 | 4.1807 | 4.7526 | |
| Total | 41 | 4.3415 | 0.69317 | 0.10826 | 4.1227 | 4.5603 | |
| Plastic | Small | 13 | 4.6154 | 0.86972 | 0.24122 | 4.0898 | 5.1410 |
| Medium | 13 | 4.5385 | 0.87706 | 0.24325 | 4.0085 | 5.0685 | |
| Large | 15 | 4.3333 | 0.72375 | 0.18687 | 3.9325 | 4.7341 | |
| Total | 41 | 4.4878 | 0.81000 | 0.12650 | 4.2321 | 4.7435 | |
| Paint | Small | 13 | 3.5385 | 1.12660 | 0.31246 | 2.8577 | 4.2193 |
| Medium | 13 | 3.9231 | 0.64051 | 0.17765 | 3.5360 | 4.3101 | |
| Large | 15 | 3.0000 | 1.00000 | 0.25820 | 2.4462 | 3.5538 | |
| Total | 41 | 3.4634 | 1.00244 | 0.15655 | 3.1470 | 3.7798 | |
| Wood | Small | 13 | 4.3846 | 0.50637 | 0.14044 | 4.0786 | 4.6906 |
| Medium | 13 | 3.9231 | 0.64051 | 0.17765 | 3.5360 | 4.3101 | |
| Large | 15 | 4.2000 | 1.01419 | 0.26186 | 3.6384 | 4.7616 | |
| Total | 41 | 4.1707 | 0.77144 | 0.12048 | 3.9272 | 4.4142 | |
| Gypsum Board | Small | 13 | 3.0769 | 0.86232 | 0.23916 | 2.5558 | 3.5980 |
| Medium | 13 | 3.3077 | 0.94733 | 0.26274 | 2.7352 | 3.8802 | |
| Large | 15 | 3.5333 | 1.18723 | 0.30654 | 2.8759 | 4.1908 | |
| Total | 41 | 3.3171 | 1.01092 | 0.15788 | 2.9980 | 3.6362 | |
| Cardboard | Small | 13 | 3.2308 | 1.36344 | 0.37815 | 2.4068 | 4.0547 |
| Medium | 13 | 4.0000 | 0.81650 | 0.22646 | 3.5066 | 4.4934 | |
| Large | 15 | 3.6667 | 1.23443 | 0.31873 | 2.9831 | 4.3503 | |
| Total | 41 | 3.6341 | 1.17805 | 0.18398 | 3.2623 | 4.0060 | |
Table A4.
Table of results for advantages of C&D waste management. (Lower value = lower level of agreement; Min.= 1.0 Max. = 5.0).
Table A4.
Table of results for advantages of C&D waste management. (Lower value = lower level of agreement; Min.= 1.0 Max. = 5.0).
| Advantages Firm | N | Mean | Std. Deviation | Std. Error | 95% Confidence Interval for Mean | ||
|---|---|---|---|---|---|---|---|
| Lower Bound | Upper Bound | ||||||
| (a) Increased longevity of landfills | Small | 13 | 4.4615 | 0.66023 | 0.18311 | 4.0626 | 4.8605 |
| Medium | 13 | 4.4615 | 0.66023 | 0.18311 | 4.0626 | 4.8605 | |
| Large | 16 | 3.8750 | 1.14746 | 0.28687 | 3.2636 | 4.4864 | |
| Total | 42 | 4.2381 | 0.90553 | 0.13973 | 3.9559 | 4.5203 | |
| (b) Purchase cost savings due to reduced wastage of materials | Small | 13 | 3.9231 | 1.03775 | 0.28782 | 3.2960 | 4.5502 |
| Medium | 13 | 4.5385 | 0.51887 | 0.14391 | 4.2249 | 4.8520 | |
| Large | 16 | 4.3750 | 0.71880 | 0.17970 | 3.9920 | 4.7580 | |
| Total | 42 | 4.2857 | 0.80504 | 0.12422 | 4.0348 | 4.5366 | |
| (c) Improved resource efficiency | Small | 13 | 4.3846 | 0.50637 | 0.14044 | 4.0786 | 4.6906 |
| Medium | 13 | 4.3846 | 0.50637 | 0.14044 | 4.0786 | 4.6906 | |
| Large | 16 | 4.5625 | 0.62915 | 0.15729 | 4.2272 | 4.8978 | |
| Total | 42 | 4.4524 | 0.55005 | 0.08487 | 4.2810 | 4.6238 | |
| (d) Waste disposal savings | Small | 13 | 3.5385 | 0.96742 | 0.26831 | 2.9539 | 4.1231 |
| Medium | 13 | 4.0769 | 0.75955 | 0.21066 | 3.6179 | 4.5359 | |
| Large | 16 | 4.0625 | 0.77190 | 0.19298 | 3.6512 | 4.4738 | |
| Total | 42 | 3.9048 | 0.84995 | 0.13115 | 3.6399 | 4.1696 | |
| (e) Reduction in negative environmental impacts due to waste | Small | 13 | 4.7692 | 0.43853 | 0.12163 | 4.5042 | 5.0342 |
| Medium | 13 | 4.4615 | 0.51887 | 0.14391 | 4.1480 | 4.7751 | |
| Large | 16 | 4.6875 | 0.47871 | 0.11968 | 4.4324 | 4.9426 | |
| Total | 42 | 4.6429 | 0.48497 | 0.07483 | 4.4917 | 4.7940 | |
| (f) Reduction in public health and social issues caused by waste | Small | 13 | 4.6923 | 0.48038 | 0.13323 | 4.4020 | 4.9826 |
| Medium | 13 | 4.5385 | 0.51887 | 0.14391 | 4.2249 | 4.8520 | |
| Large | 16 | 4.5000 | 0.63246 | 0.15811 | 4.1630 | 4.8370 | |
| Total | 42 | 4.5714 | 0.54740 | 0.08447 | 4.4008 | 4.7420 | |
Table A5.
Results for factors which may hinder implementation of C&D waste management. (Lower value = lower level of agreement; Min. = 1.0 Max. = 5.0.)
Table A5.
Results for factors which may hinder implementation of C&D waste management. (Lower value = lower level of agreement; Min. = 1.0 Max. = 5.0.)
| Hindrance Factors Firm | N | Mean | Std. Deviation | Std. Error | 95% Confidence Interval for Mean | ||
|---|---|---|---|---|---|---|---|
| Lower Bound | Upper Bound | ||||||
| (a) Congestion on sites | Small | 13 | 3.4615 | 1.12660 | 0.31246 | 2.7807 | 4.1423 |
| Medium | 13 | 4.2308 | 0.43853 | 0.12163 | 3.9658 | 4.4958 | |
| Large | 16 | 3.7500 | 0.85635 | 0.21409 | 3.2937 | 4.2063 | |
| Total | 42 | 3.8095 | 0.89000 | 0.13733 | 3.5322 | 4.0869 | |
| (b) Lack of ownership of waste on sites due to multiple contractors and sub-contractors | Small | 13 | 4.5385 | 0.51887 | 0.14391 | 4.2249 | 4.8520 |
| Medium | 13 | 4.1538 | 0.55470 | 0.15385 | 3.8186 | 4.4890 | |
| Large | 16 | 4.0625 | 0.92871 | 0.23218 | 3.5676 | 4.5574 | |
| Total | 42 | 4.2381 | 0.72615 | 0.11205 | 4.0118 | 4.4644 | |
| (c) Lack of education and awareness of C&D waste management | Small | 13 | 4.5385 | 0.51887 | 0.14391 | 4.2249 | 4.8520 |
| Medium | 13 | 4.1538 | 0.68874 | 0.19102 | 3.7376 | 4.5700 | |
| Large | 15 | 4.5333 | 0.51640 | 0.13333 | 4.2474 | 4.8193 | |
| Total | 41 | 4.4146 | 0.59058 | 0.09223 | 4.2282 | 4.6010 | |
| (d) No penalties for poor waste management practices | Small | 13 | 4.4615 | 0.51887 | 0.14391 | 4.1480 | 4.7751 |
| Medium | 13 | 4.0000 | 0.81650 | 0.22646 | 3.5066 | 4.4934 | |
| Large | 16 | 4.4375 | 0.72744 | 0.18186 | 4.0499 | 4.8251 | |
| Total | 42 | 4.3095 | 0.71527 | 0.11037 | 4.0866 | 4.5324 | |
| (e) No incentives offered for practicing C&D waste management | Small | 13 | 4.3077 | 0.85485 | 0.23709 | 3.7911 | 4.8243 |
| Medium | 13 | 3.9231 | 0.75955 | 0.21066 | 3.4641 | 4.3821 | |
| Large | 16 | 4.5000 | 0.63246 | 0.15811 | 4.1630 | 4.8370 | |
| Total | 42 | 4.2619 | 0.76699 | 0.11835 | 4.0229 | 4.5009 | |
| (f) Perception that there is no net benefit from implementing C&D waste management | Small | 13 | 3.8462 | 0.89872 | 0.24926 | 3.3031 | 4.3892 |
| Medium | 13 | 3.6154 | 0.86972 | 0.24122 | 3.0898 | 4.1410 | |
| Large | 16 | 4.3125 | 0.60208 | 0.15052 | 3.9917 | 4.6333 | |
| Total | 42 | 3.9524 | 0.82499 | 0.12730 | 3.6953 | 4.2095 | |
| (g) C&D waste management is too costly to implement | Small | 13 | 3.6154 | 1.19293 | 0.33086 | 2.8945 | 4.3363 |
| Medium | 13 | 2.7692 | 0.92681 | 0.25705 | 2.2092 | 3.3293 | |
| Large | 16 | 3.5000 | 0.81650 | 0.20412 | 3.0649 | 3.9351 | |
| Total | 42 | 3.3095 | 1.02382 | 0.15798 | 2.9905 | 3.6286 | |
| (h) Lack of material recycling facilities | Small | 12 | 4.5833 | 0.66856 | 0.19300 | 4.1586 | 5.0081 |
| Medium | 13 | 4.1538 | 0.37553 | 0.10415 | 3.9269 | 4.3808 | |
| Large | 16 | 4.3125 | 0.60208 | 0.15052 | 3.9917 | 4.6333 | |
| Total | 41 | 4.3415 | 0.57488 | 0.08978 | 4.1600 | 4.5229 | |
| (i) Lack of implementation of green building codes and specifications | Small | 13 | 4.3846 | 0.65044 | 0.18040 | 3.9916 | 4.7777 |
| Medium | 13 | 4.0000 | 0.40825 | 0.11323 | 3.7533 | 4.2467 | |
| Large | 16 | 4.1250 | 0.50000 | 0.12500 | 3.8586 | 4.3914 | |
| Total | 42 | 4.1667 | 0.53723 | 0.08290 | 3.9993 | 4.3341 | |
| (j) Poor legislation and policies relating to waste management in T&T | Small | 13 | 4.4615 | 0.66023 | 0.18311 | 4.0626 | 4.8605 |
| Medium | 13 | 4.2308 | 0.43853 | 0.12163 | 3.9658 | 4.4958 | |
| Large | 16 | 4.0625 | 0.85391 | 0.21348 | 3.6075 | 4.5175 | |
| Total | 42 | 4.2381 | 0.69175 | 0.10674 | 4.0225 | 4.4537 | |
| (k) Lack of enforcement of waste management legislation and policies | Small | 13 | 4.6923 | 0.63043 | 0.17485 | 4.3113 | 5.0733 |
| Medium | 13 | 4.3077 | 0.48038 | 0.13323 | 4.0174 | 4.5980 | |
| Large | 16 | 4.2500 | 0.77460 | 0.19365 | 3.8372 | 4.6628 | |
| Total | 42 | 4.4048 | 0.66478 | 0.10258 | 4.1976 | 4.6119 | |
| (l) Lack of implementation frameworks and guidelines | Small | 13 | 4.2308 | 0.83205 | 0.23077 | 3.7280 | 4.7336 |
| Medium | 13 | 4.0000 | 0.70711 | 0.19612 | 3.5727 | 4.4273 | |
| Large | 16 | 4.0625 | 0.68007 | 0.17002 | 3.7001 | 4.4249 | |
| Total | 42 | 4.0952 | 0.72615 | 0.11205 | 3.8690 | 4.3215 | |
| (m) Designers do not design with waste management in mind | Small | 13 | 3.9231 | 0.86232 | 0.23916 | 3.4020 | 4.4442 |
| Medium | 13 | 4.1538 | 0.55470 | 0.15385 | 3.8186 | 4.4890 | |
| Large | 16 | 4.0625 | 0.57373 | 0.14343 | 3.7568 | 4.3682 | |
| Total | 42 | 4.0476 | 0.66083 | 0.10197 | 3.8417 | 4.2535 | |
| (n) Lack of support of C&D waste management by clients | Small | 13 | 4.3077 | 0.63043 | 0.17485 | 3.9267 | 4.6887 |
| Medium | 13 | 4.0000 | 0.40825 | 0.11323 | 3.7533 | 4.2467 | |
| Large | 16 | 4.1250 | 0.50000 | 0.12500 | 3.8586 | 4.3914 | |
| Total | 42 | 4.1429 | 0.52132 | 0.08044 | 3.9804 | 4.3053 | |
Table A6.
Results for factors which can help increase utilization of C&D waste management (lower value = lower level of agreement; Min. = 1.0 Max. = 5.0).
Table A6.
Results for factors which can help increase utilization of C&D waste management (lower value = lower level of agreement; Min. = 1.0 Max. = 5.0).
| Help Factors Firm | N | Mean | Std. Deviation | Std. Error | 95% Confidence Interval for Mean | ||
|---|---|---|---|---|---|---|---|
| Lower Bound | Upper Bound | ||||||
| (a) Increased support of C&D waste management from clients | Small | 13 | 4.4615 | 0.51887 | 0.14391 | 4.1480 | 4.7751 |
| Medium | 13 | 4.2308 | 0.43853 | 0.12163 | 3.9658 | 4.4958 | |
| Large | 16 | 4.3125 | 0.60208 | 0.15052 | 3.9917 | 4.6333 | |
| Total | 42 | 4.3333 | 0.52576 | 0.08113 | 4.1695 | 4.4972 | |
| (b) Increased implementation of green building codes | Small | 13 | 4.4615 | 0.66023 | 0.18311 | 4.0626 | 4.8605 |
| Medium | 13 | 4.2308 | 0.43853 | 0.12163 | 3.9658 | 4.4958 | |
| Large | 16 | 4.2500 | 0.77460 | 0.19365 | 3.8372 | 4.6628 | |
| Total | 42 | 4.3095 | 0.64347 | 0.09929 | 4.1090 | 4.5100 | |
| (c) Increased landfill charges | Small | 13 | 3.3077 | 1.10940 | 0.30769 | 2.6373 | 3.9781 |
| Medium | 13 | 3.5385 | 0.51887 | 0.14391 | 3.2249 | 3.8520 | |
| Large | 16 | 3.0000 | 1.31656 | 0.32914 | 2.2985 | 3.7015 | |
| Total | 42 | 3.2619 | 1.06059 | 0.16365 | 2.9314 | 3.5924 | |
| (d) Introduction of penalties for poor waste management practices | Small | 13 | 4.3077 | 0.63043 | 0.17485 | 3.9267 | 4.6887 |
| Medium | 13 | 4.4615 | 0.51887 | 0.14391 | 4.1480 | 4.7751 | |
| Large | 16 | 4.0625 | 0.57373 | 0.14343 | 3.7568 | 4.3682 | |
| Total | 42 | 4.2619 | 0.58683 | 0.09055 | 4.0790 | 4.4448 | |
| (e) Offering of incentives and tender premiums related to waste management | Small | 13 | 4.5385 | 0.66023 | 0.18311 | 4.1395 | 4.9374 |
| Medium | 13 | 4.4615 | 0.51887 | 0.14391 | 4.1480 | 4.7751 | |
| Large | 16 | 4.5000 | 0.51640 | 0.12910 | 4.2248 | 4.7752 | |
| Total | 42 | 4.5000 | 0.55216 | 0.08520 | 4.3279 | 4.6721 | |
| (f) Increased awareness and dissemination of knowledge | Small | 13 | 4.5385 | 0.66023 | 0.18311 | 4.1395 | 4.9374 |
| Medium | 13 | 4.4615 | 0.51887 | 0.14391 | 4.1480 | 4.7751 | |
| Large | 16 | 4.5000 | 0.51640 | 0.12910 | 4.2248 | 4.7752 | |
| Total | 42 | 4.5000 | 0.55216 | 0.08520 | 4.3279 | 4.6721 | |
References
- MEWR (Ministry of the Environment and Water Resources). National Waste Recycling Policy; MEWR: Port-of-Spain, Trinidad and Tobago, 2015.
- Boodram, K. SWMCOL to Begin Recycling. Trinidad Express Newspaper, 23 March 2017. [Google Scholar]
- Mcdonald, B.; Smithers, M. Implementing a Waste Management Plan during the Construction Phase of a Project: A Case Study. Constr. Manag. Econ. 1998, 16, 71–78. [Google Scholar] [CrossRef]
- Yuan, H.; Shen, L. Trend of the Research on Construction and Demolition Waste Management. Waste Manag. 2011, 31, 670–679. [Google Scholar] [CrossRef] [PubMed]
- Mydin, M.O.; Khor, J.C.; Sani, N.M. Approaches to Construction Waste Management in Malaysia. MATEC Web Conf. 2014, 17, 01014. [Google Scholar] [CrossRef]
- MOLSMED (Ministry of Labour and Small and Micro Enterprise Development). Green Enterprise Development Policy for Micro and Small Enterprises and Cooperatives 2013 to 2016; MOLSMED: Port of Spain, Trinidad and Tobago, 2013.
- Yuan, H.P.; Shen, L.Y.; Hao, J.L.; Lu, W.S. A Model for Cost–benefit Analysis of Construction and Demolition Waste Management throughout the Waste Chain. Resour. Conserv. Recycl. 2011, 55, 604–612. [Google Scholar] [CrossRef]
- Yehesis, M.; Hewage, K.; Alam, M.; Eskicioglu, S.; Eskicioglu, C.; Sadiq, R. An Overview of Construction and Demolition Waste Management in Canada: A Lifecycle Analysis Approach to Sustainability. Clean Technol. Environ. Policy 2013, 15, 81–91. [Google Scholar] [CrossRef]
- Pappu, A.; Saxena, M.; Asolekar, S.R. Solid Wastes Generation in India and Their Recycling Potential in Building Materials. Build. Environ. 2007, 42, 2311–2320. [Google Scholar] [CrossRef]
- Talyan, V.; Dahiya, R.P.; Sreekrishnan, T.R. State of municipal solid waste management in Delhi, the capital of India. Waste Manag. 2008, 28, 1276–1287. [Google Scholar] [CrossRef] [PubMed]
- Ponnada, M.; Kameswari, P. Construction and Demolition Waste Management—A Review. Int. J. Adv. Sci. Technol. 2015, 84, 19–46. [Google Scholar] [CrossRef]
- Bossink, B.A.G.; Brouwers, H.J.H. Construction waste: Quantification and source evaluation. J. Constr. Eng. Manag. 1996, 122, 55–60. [Google Scholar] [CrossRef]
- Nagapan, S.; Abdul-Rahman, I.; Asmi, A. A review of construction waste cause factors. In Proceedings of the Asian Conference of Real Estate (ACRE): Sustainable Growth Managing Challenges, Johr Bahru, Malaysia, 3–5 October 2011. [Google Scholar]
- Mohammed, A.; Deepthi, B.; Tahsin, T.S.; Monty, S.T.M. Construction Waste Management in India: An Exploratory Study. Constr. Innov. 2012, 12, 133–155. [Google Scholar]
- Weisheng, L.; Hongping, Y. Off-site Sorting of Construction Waste: What Can We Learn from Hong Kong. Resour. Conserv. Recycl. 2012, 69, 100–108. [Google Scholar]
- Weisheng, L.; Hongping, Y.; Li, J.; Hao, J.L.; Mi, X.; Ding, Z. An Empirical Investigation of Construction and Demolition Waste Generation Rates in Shenzhen City, South China. Waste Manag. 2011, 31, 680–687. [Google Scholar]
- Wang, J.; Hongping, Y.; Xiangping, K.; Weisheng, L. Critical success factors for on-site sorting of construction waste: A China study. Resour. Conserv. Recycl. 2010, 54, 931–936. [Google Scholar] [CrossRef]
- Gomez-Soberon, J.M.; Gomez-Soberon, M.C.; Cabrera-Covarrubias, F.G.; Arredondo-Rea, S.P.; Alamaral-Sanchez, J.L.; Gomez-Soberon, L.A.; Ortega-Rastrojo, M. Simulation and comparative analysis of waste in concrete slabs. In Proceedings of the International Conference on Advances in Civil, Structural and Construction Engineering (CSCE 2014), Rome, Italy, 7–8 June 2014. [Google Scholar]
- Environmental Management Authority (EMA). State of the Environment Report 2011; EMA: Port of Spain, Trinidad and Tobago, 2011. [Google Scholar]
- Narcis, N.; Ray, I. Utilization and Awareness of Construction and Demolition (C&D) Waste Management to Promote the Sustainable Development: Case Study of Trinidad and Tobago. In Advances in Sustainable Construction Materials (ASCM); Lecture Notes in Civil Engineering; Springer-Nature: New Dehli, India, (accepted).
- Begum, R.A.; Siwar, C.; Pereira, J.J.; Jaafar, A.H. Attitude and Behavioral Factors in Waste Management in the Construction Industry of Malaysia. Resour. Conserv. Recycl. 2009, 53, 321–328. [Google Scholar] [CrossRef]
- Olawale, Y.; Sun, M. A Survey of Construction Project Cost and Time Control Practices in the UK; School of the Built and Natural Environment, University of the West of England: Bristol, UK, 2015. [Google Scholar]
- Statistics How to. Available online: http://www.statisticshowto.com/tukey-test-honest-significant-difference/ (accessed on 11 December 2018).
- Sow, M.T. Using ANOVA to Examine the Relationship between Safety and Security and Humaan Development. J. Int. Bus. Econ. 2014, 2, 101–106. [Google Scholar] [CrossRef]
© 2019 by the authors. Licensee MDPI, Basel, Switzerland. This article is an open access article distributed under the terms and conditions of the Creative Commons Attribution (CC BY) license (http://creativecommons.org/licenses/by/4.0/).