Article

Monitored Indoor Environmental Quality of a Mass Timber Office Building: A Case Study

1
Energy Studies in Buildings Laboratory, Department of Architecture, University of Oregon, Eugene, OR 97403, USA
2
Biology and the Built Environment Center, University of Oregon, Eugene, OR 97403, USA
3
Mechanical and Materials Engineering, Portland State University, Portland, OR 97201, USA
4
School of Civil & Construction Engineering, Oregon State University, Corvallis, OR 97331, USA
5
Department of Wood Science & Engineering, Oregon State University, Corvallis, OR 97331, USA
*
Author to whom correspondence should be addressed.
Buildings 2019, 9(6), 142; https://doi.org/10.3390/buildings9060142
Submission received: 14 May 2019 / Revised: 8 June 2019 / Accepted: 11 June 2019 / Published: 13 June 2019

Abstract

:
A broad range of building performance monitoring, sampling, and evaluation was conducted periodically after construction and spanning more than a year, for an occupied office building constructed using mass timber elements such as cross-laminated timber (CLT) floor and roof panels, as well as glue-laminated timber (GLT) beams and columns. This case study contributes research on monitoring indoor environmental quality in buildings, describing one of the few studies of an occupied mass timber building, and analyzing data in three areas that impact occupant experience: indoor air quality, bacterial community composition, and floor vibration. As a whole, the building was found to perform well. Volatile organic compounds (VOCs), including formaldehyde, were analyzed using multiple methods. Formaldehyde was found to be present in the building, though levels were below most recommended exposure limits. The source of formaldehyde was not able to be identified in this study. The richness of the bacterial community was affected by the height of sampling with respect to the floor, and richness and composition was affected by the location within the building. Floor vibration was observed to be below recognized human comfort thresholds.

1. Introduction

Mass timber wood products are gaining adoption in US buildings through changes to building codes and standards [1,2], as well as specialized manufacturing facilities coming on-line. Prefabricated panelized products like Cross-Laminated Timber (CLT), Dowel-Laminated Timber (DLT), Nail-Laminated Timber (NLT) and Mass Plywood Panels (MPP) are now able to be used as structural floor, roof and wall assemblies. These structural elements impact the type and distribution of major materials used throughout a mass timber building as compared to other construction types. They often take the place of concrete or steel, and their relatively lightweight may impact floor vibrational performance (serviceability). They often remain exposed as interior finished surfaces, changing the makeup of surface to air volume of interior materials, and possibly impacting indoor air chemistry and indoor microbial community dynamics.
Indoor Environmental Quality (IEQ) of buildings include aspects of the built environment that affect occupant health and well-being, and commonly includes factors such as indoor air quality, thermal comfort, visual comfort and acoustic comfort [3]. Occupant satisfaction and productivity are common metrics of IEQ, with short-term and long-term health effects for occupants being more challenging to quantify, and understanding of source characterization and exposure assessment continuing to evolve [4]. The contribution of wood in creating healthy environments is discussed in several studies, many of which are based on occupant feedback rather than on quantitative monitoring data (acoustic comfort in residential timber buildings [5], thermal comfort and air quality [6], general ‘perceived’ IEQ [7]). Most quantitative IEQ studies are limited to measurements in a laboratory environment or in unoccupied buildings (acoustic performance of assemblies [8], floor vibration performance [9,10]). In a few exceptions IEQ data were collected in occupied buildings, however, in most cases these full-scale studies monitored data related to one single IEQ performance indicator (thermal comfort [11,12]; contribution of wood nonstructural elements to air quality [13]).
This case study contributes to research on monitoring IEQ in buildings, describing one of the few studies of an occupied mass timber building, and using exposure measurement methods for three important factors: indoor air quality, indoor bacterial community and vibrational comfort. Other IEQ indicators such as acoustic performance and occupant response were investigated in the study, but data were too limited; therefore, these indicators are omitted in this paper.
A newly constructed and occupied building offers layers of building performance complexity. Simply adding finishes and furnishings to a wood structure successively changes the Volatile organic compound (VOC) profile and concentrations, with barrier and sink effects reducing or delaying some emissions [14]. Introducing occupants, occupant behavior, and variable environmental conditions such as temperature and humidity fluctuations also affect indoor air quality. Monitoring indoor air quality of an occupied mass timber building, including characterizing VOCs that are present, will help to inform future research on primary emissions from CLT and secondary reaction products in indoor air that may be sourced in part from CLT.
The indoor microbial community is primarily sourced from indoor occupants and from outdoor microbial communities which are dispersed indoors from outdoor-sourced ventilation or occupant traffic [15]. It is unknown whether the use of CLT building materials would directly contribute to the indoor microbial community, either by direct deposition of microorganisms from materials into general dust, or through the contribution of solid or gaseous chemicals which might affect microorganisms. Due to the unique combination of occupants, building materials, local environmental conditions, and geographic location, the microbial communities in buildings tend to be highly variable between different structures. Thus, we sought to compare passive sampling height and open office location for the implications each may have on indoor microbial community.
The mass of CLT buildings, when compared to conventional concrete buildings, might pose a challenge for vibrational serviceability design. Some design criteria for controlling floor vibrations are difficult to incorporate in general design guides, as they are dependent on variable conditions, such as live loads [16]. Monitoring floor vibration of mass timber systems is therefore important to inform serviceability design criteria for new types of construction systems.
This case study investigates performance of a mass timber building; how building materials and assemblies impact indoor air quality, indoor bacterial community, and vibration in an office environment of an occupied mass timber building. The case study site is Albina Yard, which was constructed in Portland, Oregon in 2016 and was the first mass timber office building in the U.S. to use domestically sourced and produced CLT [17]. It is a 1500 m2, four-story building with a footprint of approximately 14 m × 26 m and is comprised of office and ground floor retail space. Its rectangular building form is elongated in the east-west direction with predominately glazed east and west façades. Floor and roof assemblies at Albina Yard use 105 mm thick three-lamella (3-lam) CLT as structural diaphragm with panels spanning in the E-W direction, and are supported by glue-laminated timber (GLT) beams and columns. GLT beams are 171 mm × 610 mm and 171 mm × 457 mm, and columns are 222 mm × 305 mm and 222 mm × 229 mm, with larger cross-sections of both occurring at the perimeter of the building. All three structural components are left unfinished and exposed at the ceiling. Light-framed shear walls constitute the lateral load resisting system. East and west exposures are floor to ceiling structural GLT window walls with small operable awning units at the floor level. The majority of the fourth floor is an open-plan office layout with computer workstations, a kitchen area and an adjacent alcove housing server, copier and printer equipment. Other spaces include large and small conference rooms, a laser cutter room and restrooms. Finish surface materials found on this level include painted gypsum wall board, carpet floor covering and exposed unfinished CLT ceiling. The floor assembly is comprised of 105 mm 3-lam CLT, 25 mm gypcrete topping, and carpet squares without a pad.

2. Materials and Methods

2.1. Indoor Air Quality

A range of direct-measurement continuous monitoring air quality sensors were deployed during four week-long periods spread over more than a year and capturing predominantly heating season building operation in December 2016 (week 1), March 2017 (week 2), October 2017 (week 3) and January 2018 (week 4). Sensors were deployed as a contained air quality monitoring kit at two indoor locations, in the northeast and southwest corners of the fourth-floor open office space (Figure 1), to capture potential influence of window operation as well as differences in solar orientation. Indoor air quality monitoring kits included sensors measuring the following: air velocity, barometric pressure, carbon dioxide, carbon monoxide, formaldehyde, ozone, particulate matter, radon, relative humidity, solar radiation, temperature, and total volatile organic compounds. A similar air quality monitoring kit, excluding radon and including wind speed and direction sensors was deployed in an outdoor ground-level patio location onsite. Table 1 lists air quality sensors and samplers with results reported in this study.
During sampling weeks 3 and 4, passive whole air helium diffusion sampling (HeDS) for analysis of VOCs was added to the indoor kits [18]. 1-liter canisters (Entech, Bottle-Vac) filled with helium to a slight positive pressure were deployed in triplicate at each location. A calibrated orifice exchanged a portion of the helium in each canister with ambient air over the week, providing, in theory, a near constant sampling rate. After the collection period, canisters were again filled with helium to the initial pressure and weighed to calculate helium dilution factors. An outdoor whole air sample was captured on the roof using a 6-liter evacuated canister (Entech, Silonite Canister) and flow controller. Additional one-minute grab samples were also captured at various indoor locations using 1-liter evacuated canisters with a calibrated orifice. In the laboratory, proton transfer reaction-time of flight-mass spectrometry (PTR-TOF-MS) [19,20] was used for quantification of VOCs following a described method with specific operational parameters described elsewhere [21,22], connecting canisters directly to the PTR-TOF-MS (PTR-TOF 1000, Ionicon Analytik GmbH, Innsbruck, Austria) inlet for analysis.
Outside of these four weeks of intensive monitoring, GrayWolf FM-801 formaldehyde monitors were also deployed for longer periods in three indoor locations that varied in use and ventilation rate (Figure 1). One location, the northeast corner of the open office, was a location common to the sample weeks with full monitoring equipment. A storage closet with no mechanical ventilation was monitored, as was the laser cutter room with additional dedicated mechanical exhaust.

2.2. Bacterial Community

Dust was collected from the indoor open office environment in three locations and from one outdoor ground-level patio location with passive sampling integrated into the air quality monitoring kits. Samples were collected using 150 mm × 15 mm sterile polystyrene petri dishes. Both petri dish lids and bases were used as settling dishes, with 6 collection plate surfaces per sample. At each indoor monitoring kit, plates were deployed at three heights: on top of the kit at 1.12 m above finish floor, on a shelf within the kit enclosure at 0.88 m above finish floor, and below the kit at finish floor level. Only the shelf within the kit was used for sampling at the outdoor location. Plates were allowed to sit at ambient conditions for a period of one week, then sealed with parafilm and stored in sampling bags for transport to the laboratory.
Plates were stored at −20 °C in the laboratory until DNA extraction was performed, at which point, dust from all six plate surfaces per sample was collected using sterile nylon-flocked swabs and 100 µL of phosphate-buffered solution per dish surface. Swab tips and PBS solution were added directly to bead tubes for extraction. Nucleic acids were extracted using the MoBio PowerSoil DNA Extraction Kit (MoBio, Carlsbad, CA, USA) following kit instructions.
The V3 and V4 (319F-806R) regions of the 16S rRNA gene were polymerase chain reaction (PCR) -amplified following a previously described protocol [23], and amplicons were purified with a bead-based clean-up using Mag-Bind RxnPure Plus (Omega Bio-tek, Norcross, GA, USA). Cleaned DNA was quantified using Quant-iT dsDNA assay kit, and pooled with equal concentrations of amplicons for Illumina Miseq ver 4 paired-end sequencing using a 250-cycle kit. Sequence data is available from the National Center for Biotechnology Information (NCBI)’s Sequence Read Archive (SRA) under BioProject Accession PRJNA532899.
DNA sequence filtering, noise reduction, dereplication, sequence variant picking, chimera removal and taxonomic identification were performed within the DADA2 package [24] of the R statistical platform (R Core Team 2018). The first and last 10 bases were trimmed from sequences, with an additional 10 bases trimmed from the ends of reverse sequences to remove low-quality bases. Max expected errors were 2 for forward and 3 for reverse sequences, with no ambiguous bases accepted, and any residual phiX DNA removed. The Silva ver. 132 database was used for taxonomy [25], and both DNA extraction and PCR negative controls were used to identify potential contaminants and remove sequence variants from samples [26]. Sequences were rarified to 4450 per sample. Analysis was performed with R packages phyloseq [27], vegan [28], DESEQ2 (on non-rarefied data) [29], and visualized with ggplot2 [30]. Species’ richness was compared using generalized linear mixed effects model via the lme4 package [31], with the year collected as a fixed effect.

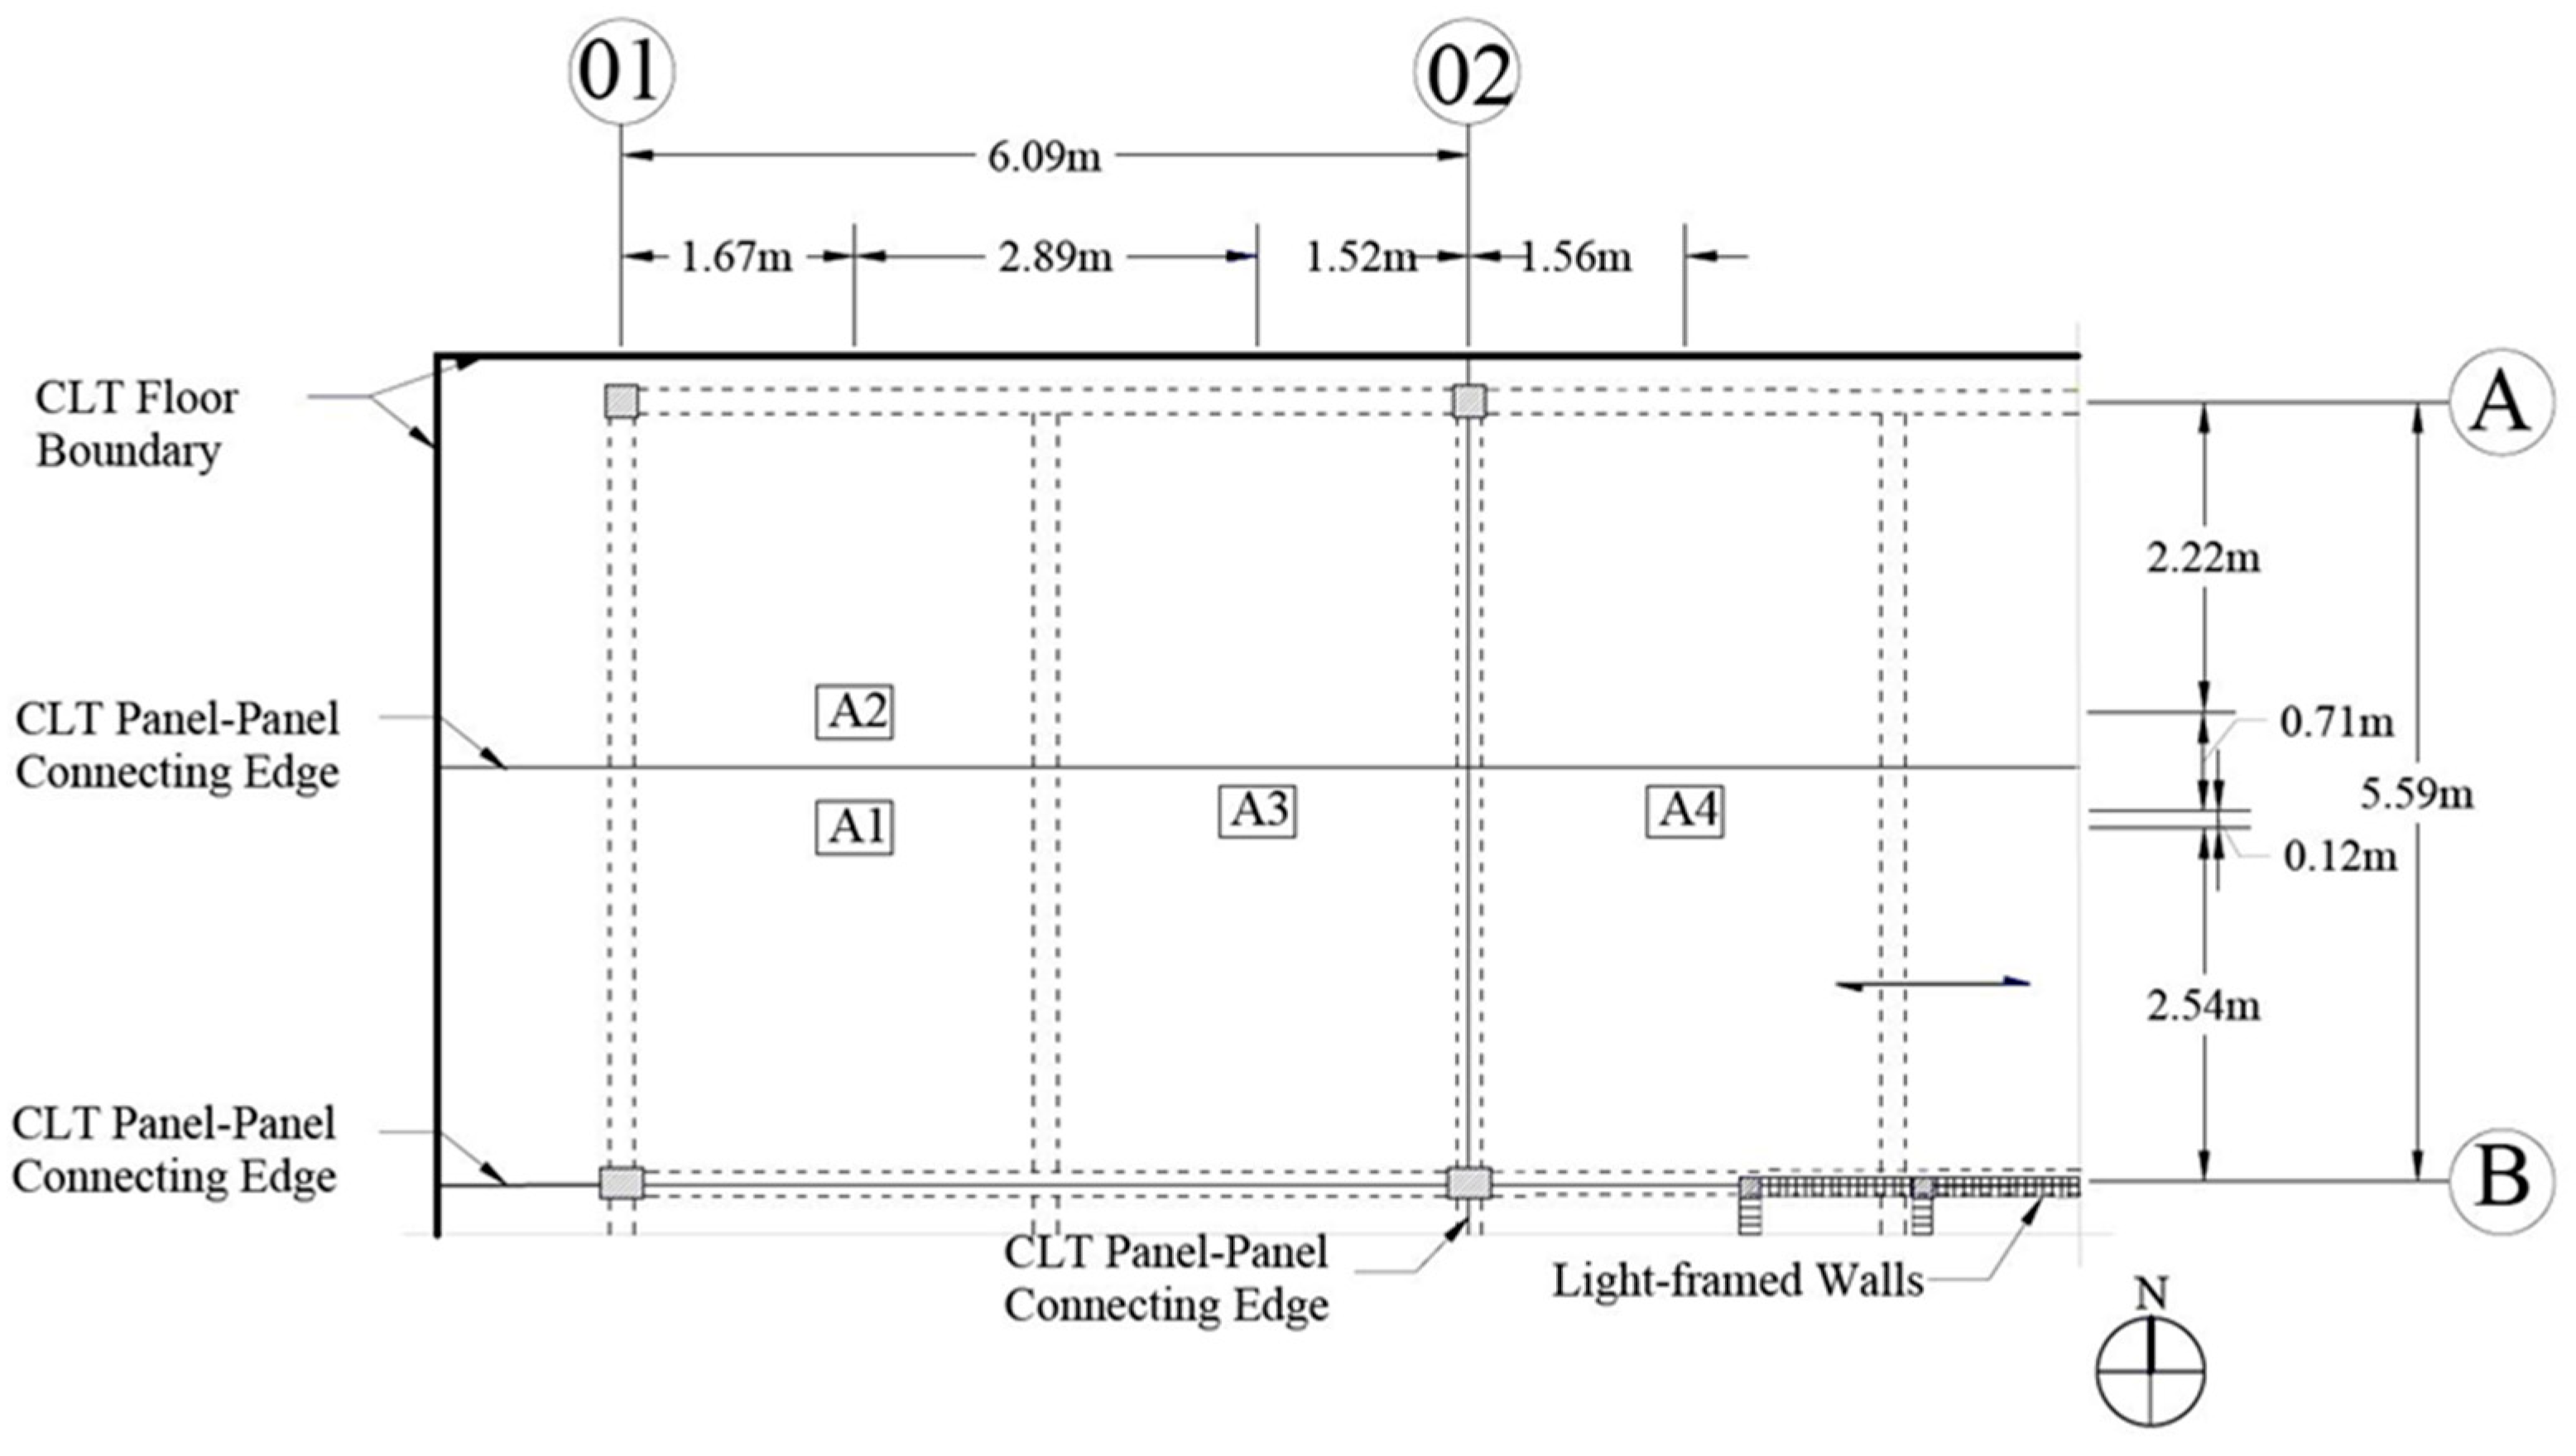
2.3. Vertical Vibration

A floor vibration study was conducted during week 4 and focused on a section of the fourth-floor open office area subject to footfall and various impacts from office activities, and followed a dynamic monitoring study [32]. The purpose was to measure the vertical floor accelerations, capturing the floor response to passersby. Acceleration response time-series were collected to measure peak vertical floor acceleration responses associated with regular office activities and to understand the frequency content of the response within the range of human comfort for comparison with existing design standards [33,34,35].
Figure 2 shows the northwest portion of the floor plan with locations where accelerometers were installed. To measure the vertical accelerations triggered by footfall, four uniaxial accelerometers were installed on the floor, which were placed close to the mid-span of three consecutive structural bays. The accelerometers were secured in access points to the base of floor boxes that were fixed to the CLT floor panels and then connected to a data acquisition system through BNC cables, and data stored in a laptop computer. The laptop was remotely accessible, allowing for data to be monitored and stored. Table 2 below contains a summary of the equipment used.
A data-recording trigger was set for recording events of interest. When the floor vertical acceleration at any of the accelerometers reached a value of +/−0.02 g (g = 9.81 m/s2), all accelerometers would record for a total duration of 10 seconds, starting 0.125 s before the triggering event to ensure that the triggering signal was included in the data. The threshold value was selected by recording normal walking at distances similar to the estimated distances between the on-site pathways and the locations of accelerometers. An event was considered relevant if its time domain profile matched the profile of a normal walk at approximately two steps per second. This was determined in a lab environment and confirmed onsite during installation. Data collection was performed at 2048 Hz, over a one-week period, totaling 1130 events.
To evaluate the frequency content of the signals collected, power spectral densities (PSDs) of the signals were evaluated using the pwelch algorithm in MATLAB’s signal processing toolbox (MathWorks, 2018). In the pwelch function, a data window size of two seconds and overlap size of half-second was used for averaging purposes. The following processing steps were conducted before the PSDs were evaluated: Band-pass finite impulse response (FIR) filter with cutoff range of 0.5–20 Hz and filter order of 4098; Down-sampling from the original sampling frequency of 2048 Hz to a sampling frequency of 256 Hz.

3. Results & Discussion

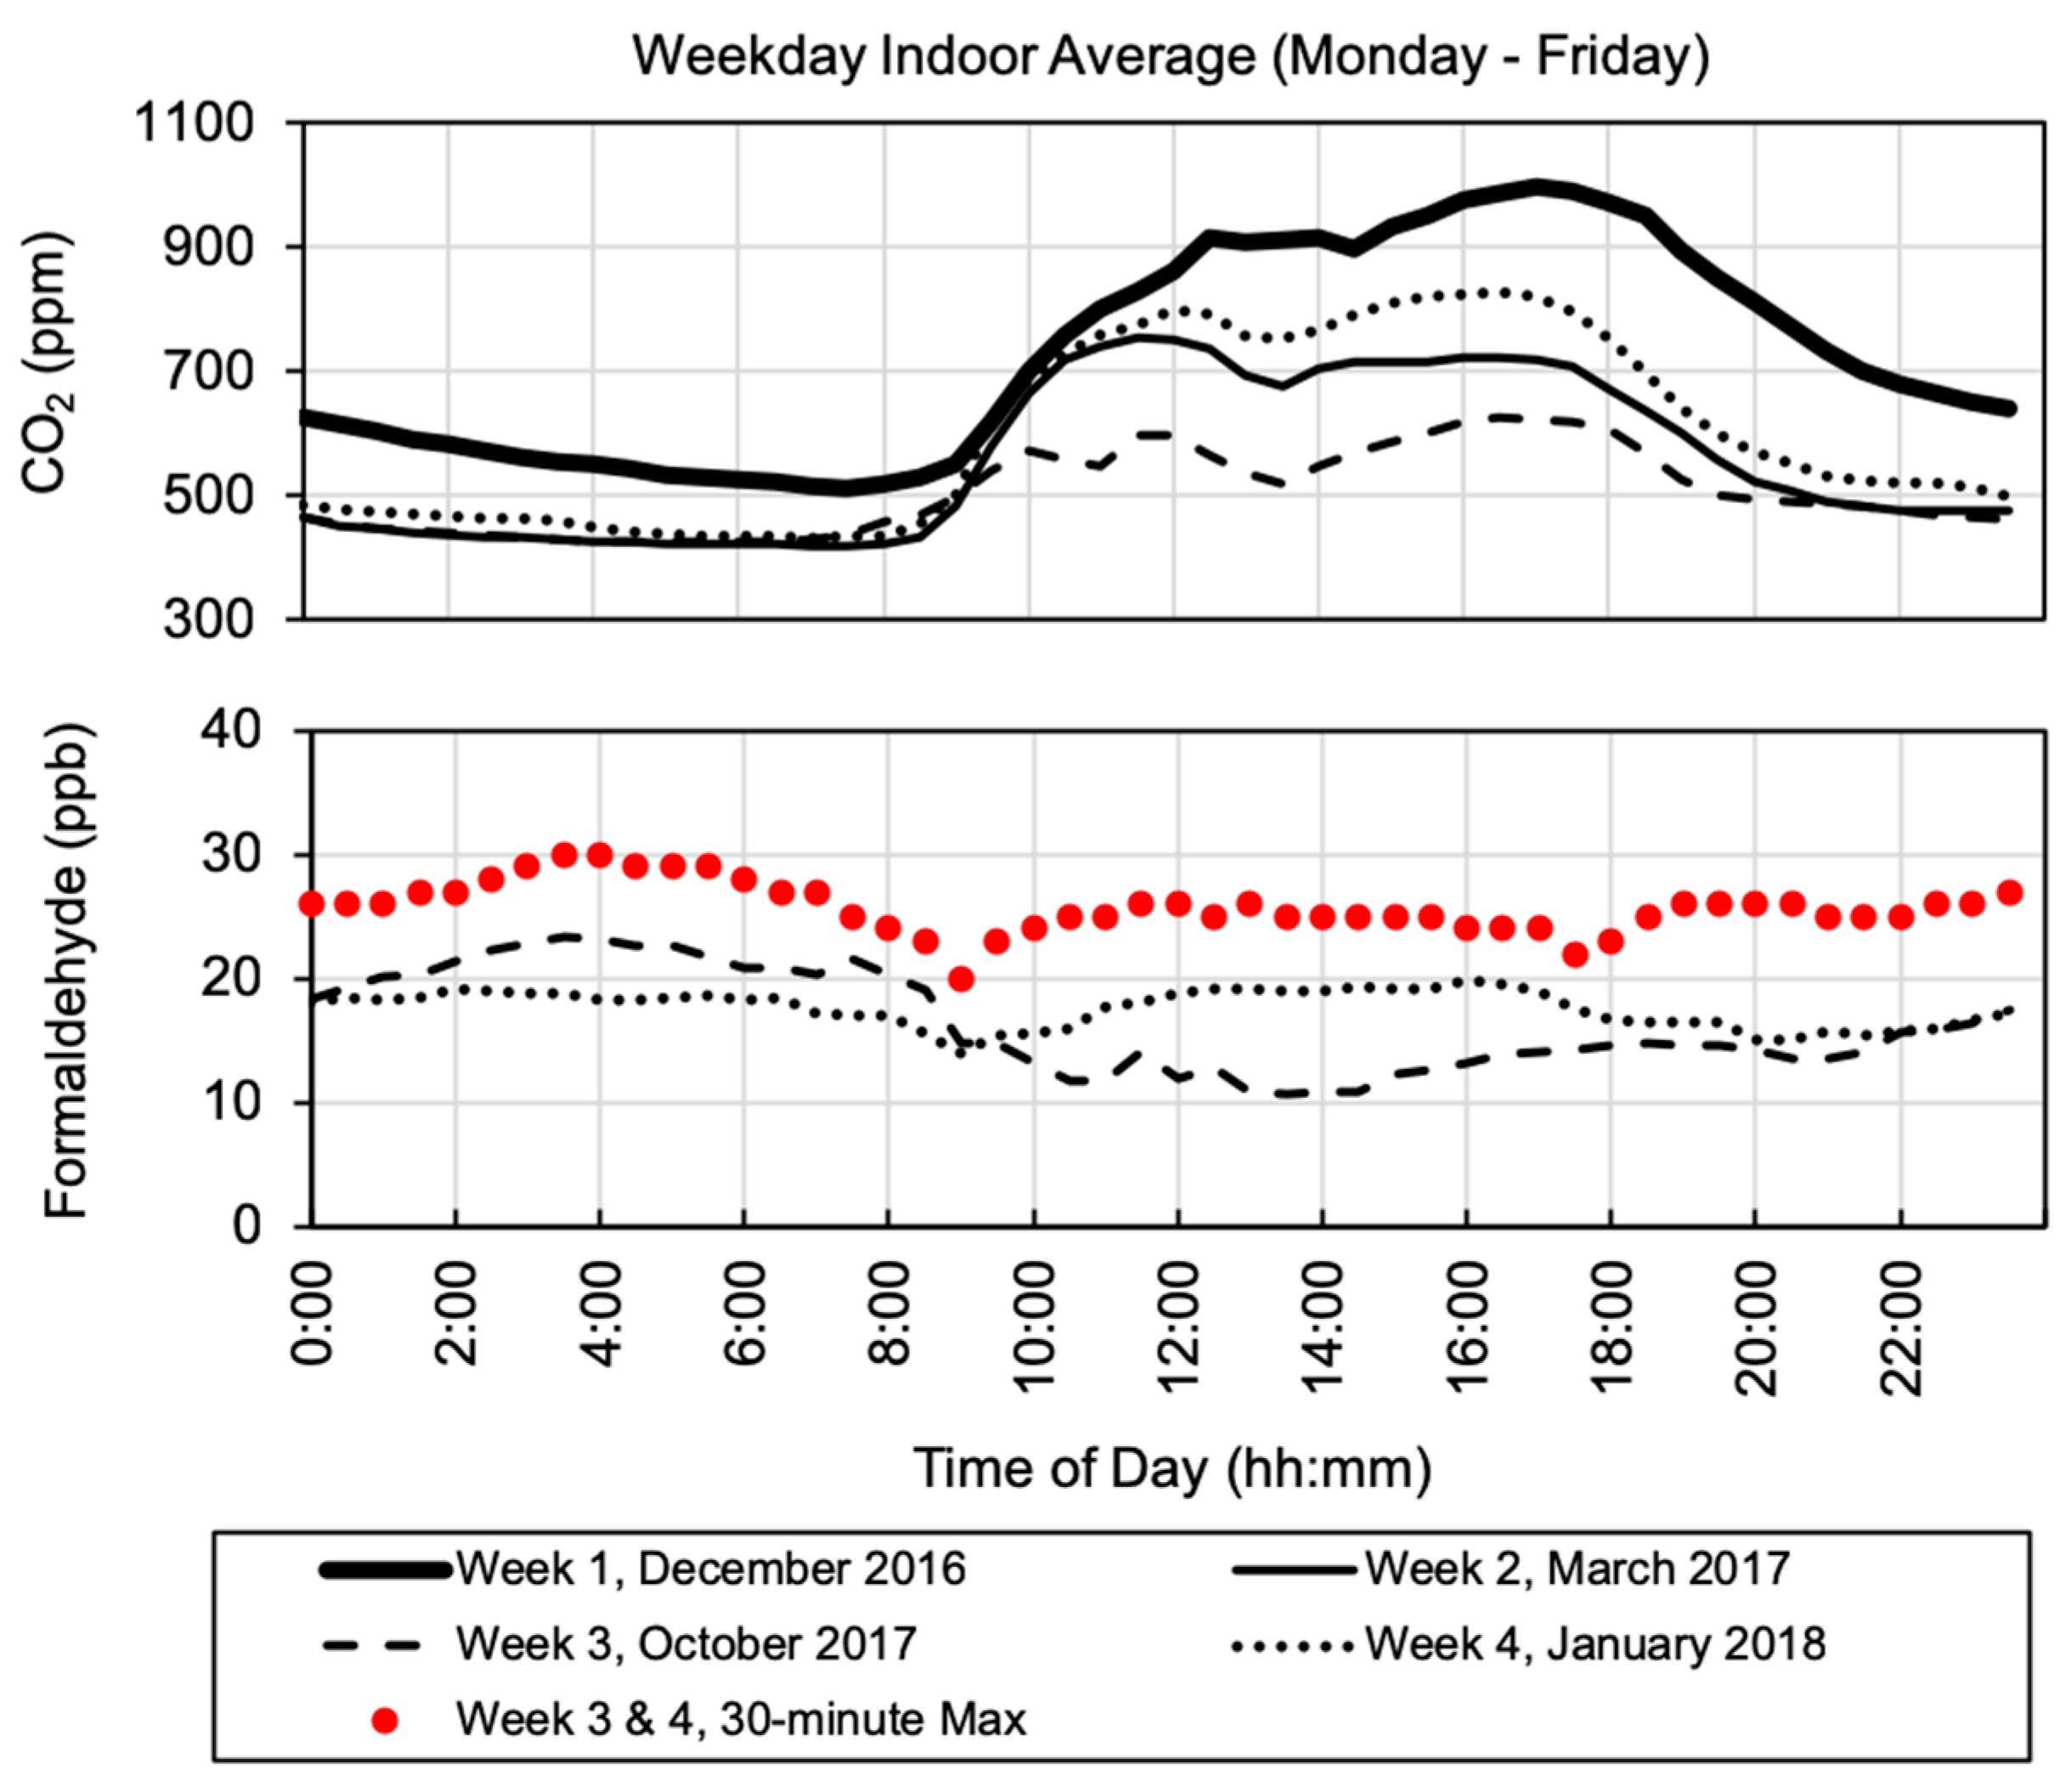
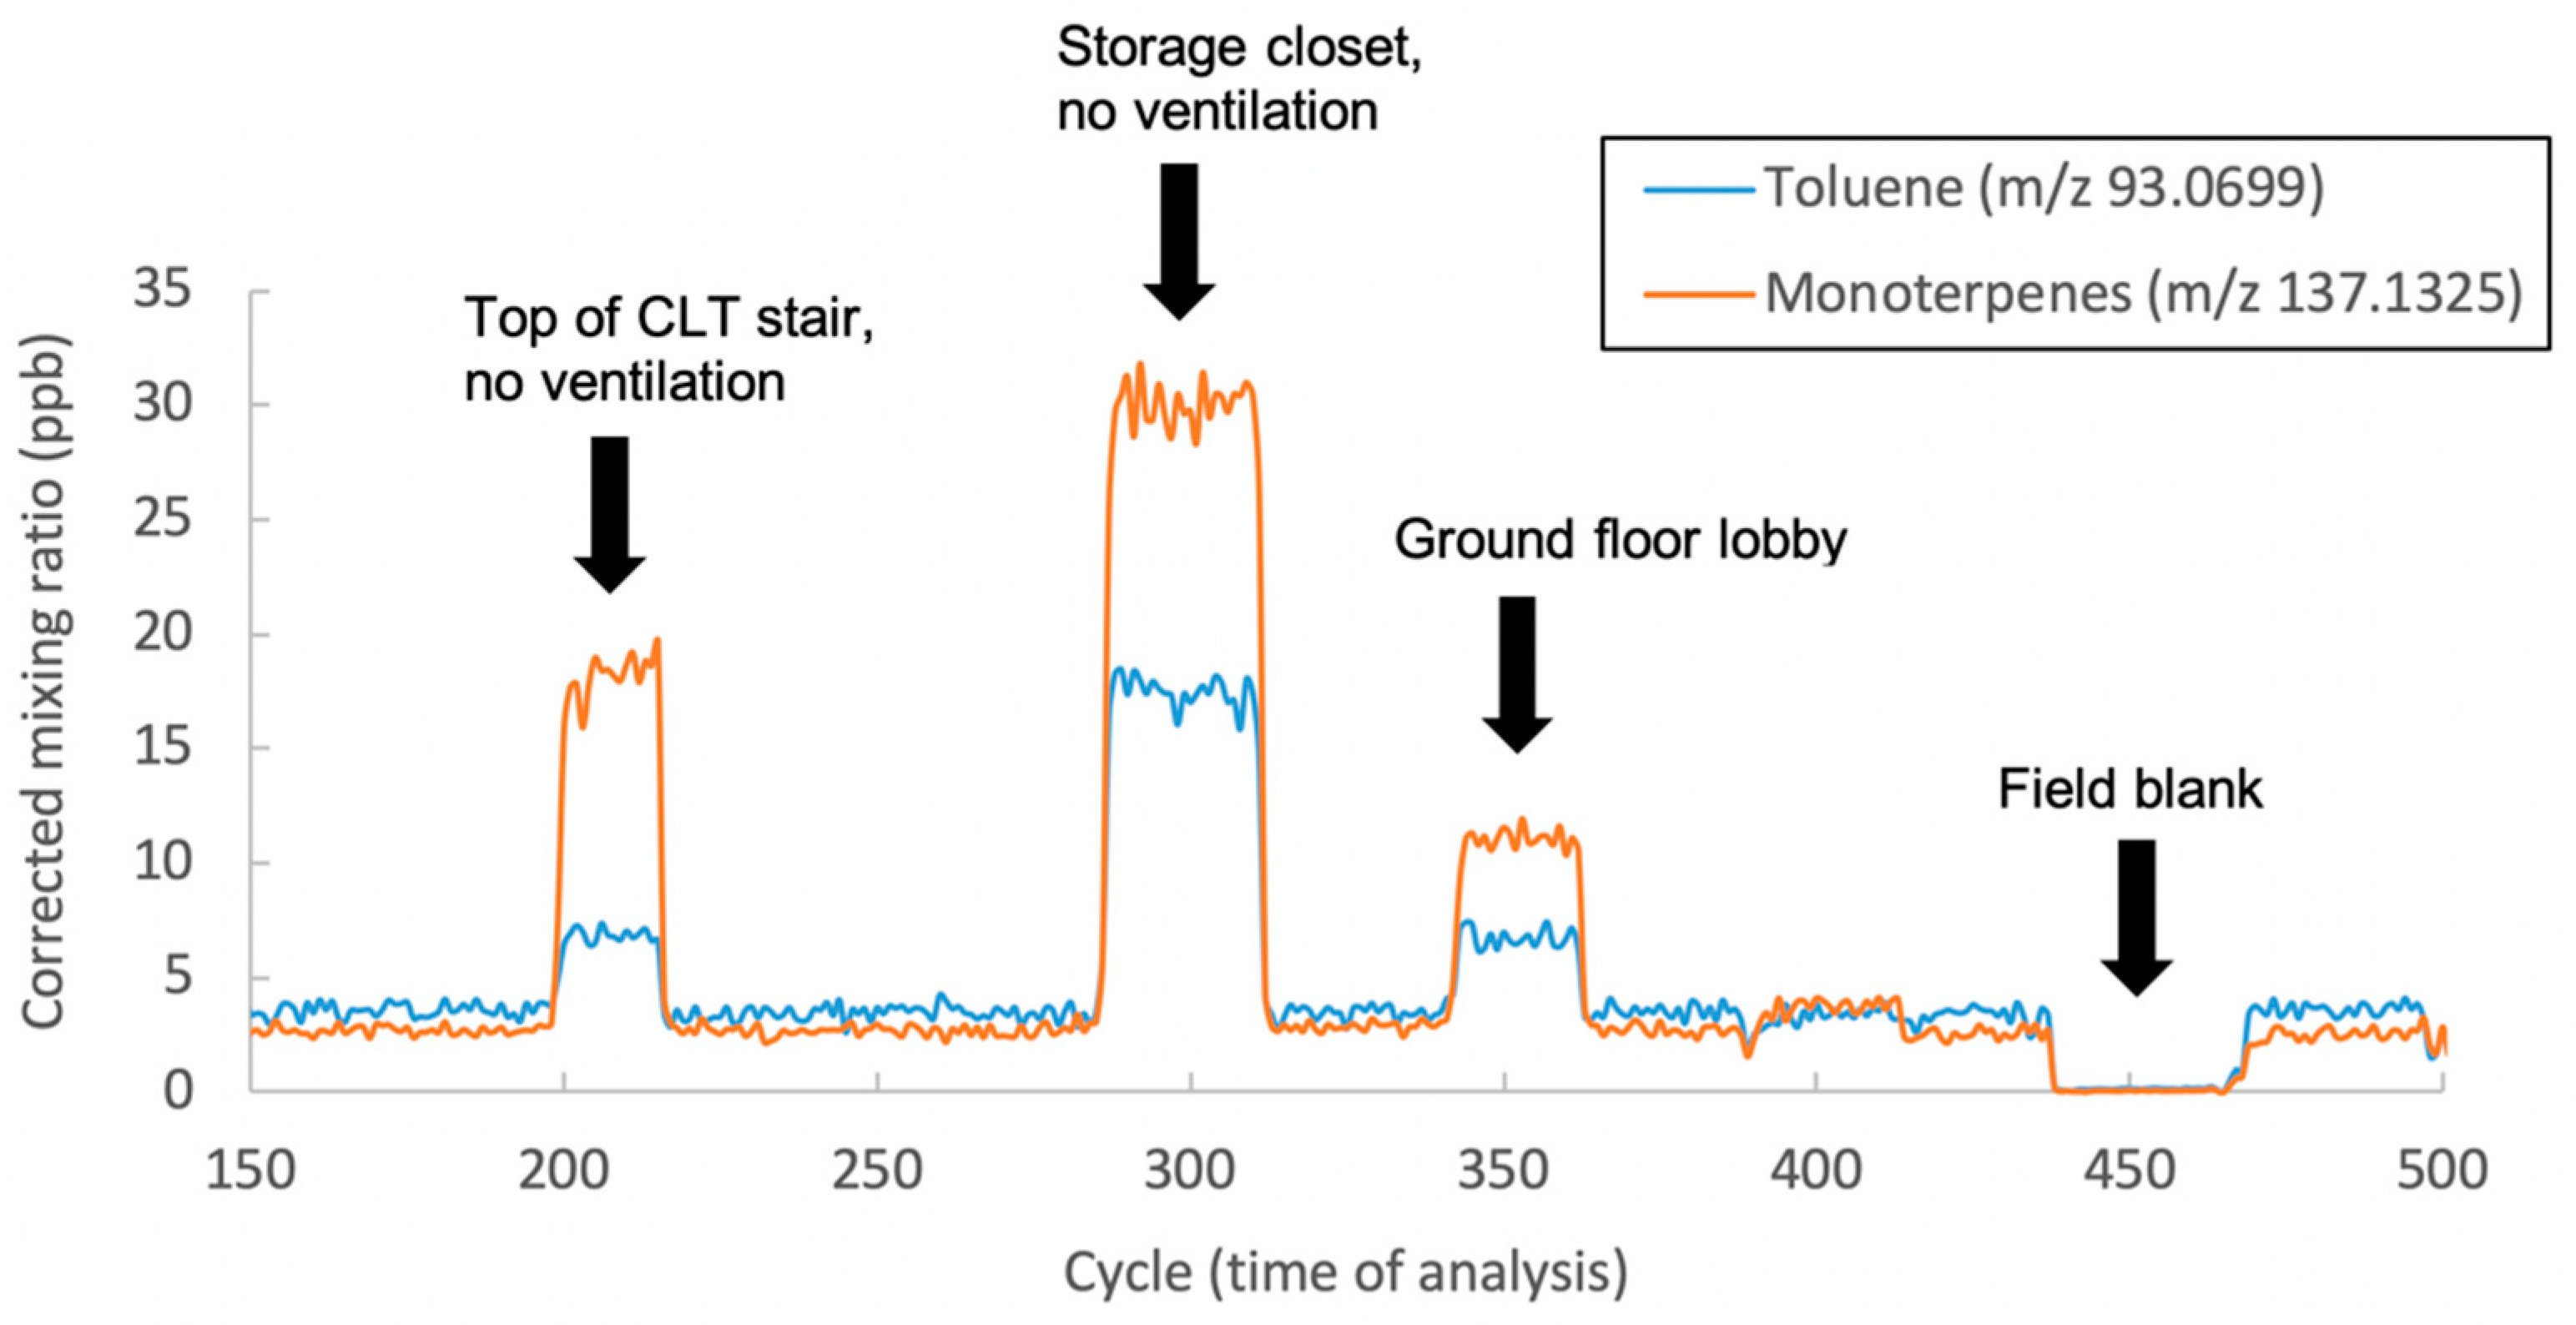
3.1. Indoor Air Quality

Carbon dioxide (CO2) levels in indoor air are tied to occupancy and ventilation, as humans exhale CO2 and ventilation rate reduces indoor concentrations by exchanging indoor air with outdoor air. A workplace exposure limit of 5000 ppm as an 8-hour time-weighted average (TWA) set by the Occupational Safety and Health Administration (OSHA) has been the standard commonly referenced. More recently CO2 has been investigated as a direct indoor air pollutant and not just an indicator of ventilation rate required for the dilution of other human associated indoor air pollutants in buildings. It has been shown that CO2 concentrations as low as 1000 ppm impact occupant decision making performance [36] and demonstrated declines in cognitive test scores of office workers [37].
In reviewing week 1 of collected air quality monitoring data from this study, CO2 levels were safe and typical for an office. However, one-minute trend data revealed that the mechanical ventilation system may not be operating as intended. It was discovered that an outside air damper for the ERV was closed. The issue was remedied and the result can be seen in Figure 3, where weekday average CO2 concentrations are reduced from week 1 levels in subsequent monitored weeks.
Formaldehyde (HCHO) is a common indoor air pollutant that has been classified as a known human carcinogen [38]. Indoor air sources include emissions from building materials, particularly in new construction, as emission rates from new materials decrease over time. Secondary formation of HCHO can also occur in indoor air, for example, from ozone-initiated reaction with terpenes [39,40]. There are numerous potential indoor as well as outdoor sources of HCHO, these include the use of consumer products and human activities indoors, industrial and vehicle emissions are among urban atmospheric sources outdoors. The 2010 World Health Organization (WHO) Guidelines for Indoor Air Quality recommend a 30-minute exposure limit of 0.1 mg/m3 (81 ppb) for formaldehyde to prevent both short-term and long-term health effects [41]. Permissible and recommended exposure limits do vary by agency, ranging both higher and lower than the WHO guideline. However, the WHO guideline continues to be supported, even found to be “highly precautionary” [42].
HCHO results from week 3 & 4 captured with a GrayWolf FM-801 formaldehyde meter are reported in Figure 3 as weekday average values by time of day and the maximum 30-minute value recorded by time of day for both monitored periods. The overall maximum was 30 ppb in the open office for these two weeks, below the WHO guideline.
The same sensors were deployed for longer monitoring periods in two additional spaces along with the open office: the laser cutter room with additional exhaust ventilation and a storage closet with no mechanical exhaust. No attempts were made to control access to either space or influence occupant behavior and both rooms were accessed and used as required of normal business operations. The laser cutter room, with dedicated exhaust ventilation, saw slightly lower HCHO on average than the open office, and the storage closet saw higher values, with a maximum 30-minute reading of 63 ppb recorded in the storage closet.
VOCs were also analyzed from various locations throughout the building using one-minute grab samples captured with evacuated canisters. Grab samples offered a quick method of collecting additional samples beyond the weeklong time-integrated HeDS samples collected at the monitoring kit locations. They were also useful for sampling locations where monitoring equipment could not be deployed for the week. Locations included the ground floor lobby which has some additional natural ventilation from building occupants entering and exiting the building, the top of the main stair constructed of CLT and without mechanical ventilation and the storage closet mentioned above.
Six common VOCs were selected for analysis: acetone, formaldehyde, methanol, benzene, toluene and monoterpenes. All have outdoor and indoor sources and all of them except benzene and toluene are known to be emitted from wood products, but each one has other possible sources and secondary reactions also complicate identifying a specific source for any of them within the scope and methods of this study. Monoterpenes are emitted from wood products [43] and also derived from the biosynthesis of plants, as are acetone, formaldehyde and methanol [44,45]. Acetone and methanol are also often related to urban and industrial activities [46] with many different sources. Formaldehyde is also known to be among the VOCs emitted by cleaning products and detergents [47]. Benzene and toluene are known as BTEX and mainly emitted from vehicle exhaust [48] but also from some detergents, rubbers, resins, and cigarettes [49,50]. Figure 4 shows results for toluene and monoterpenes, compounds with indoor and outdoor sources, as each canister is connected and disconnected from the PTR-TOF-MS for analysis. A field blank was also analyzed. Again, the storage closet with no intended ventilation, was found to have the highest levels of both compounds (30 ppb Monoterpenes, 17 ppb Toluene).
HeDS is not an established sampling method for indoor air quality and further inter-comparison with established methods is needed. This preliminary investigation of the method, paired with PTR-TOF-MS analysis, was selected because it provided a low-cost, simple to deploy, silent method of collecting a whole air sample [18]. Replicate samples were, on average, within 34% for five of six VOCs selected: acetone, formaldehyde, methanol, benzene, and monoterpenes. Figure 5 shows HeDS results from week 3 for the two open office monitoring kit locations as well as an outdoor sample taken with an evacuated canister on the roof.

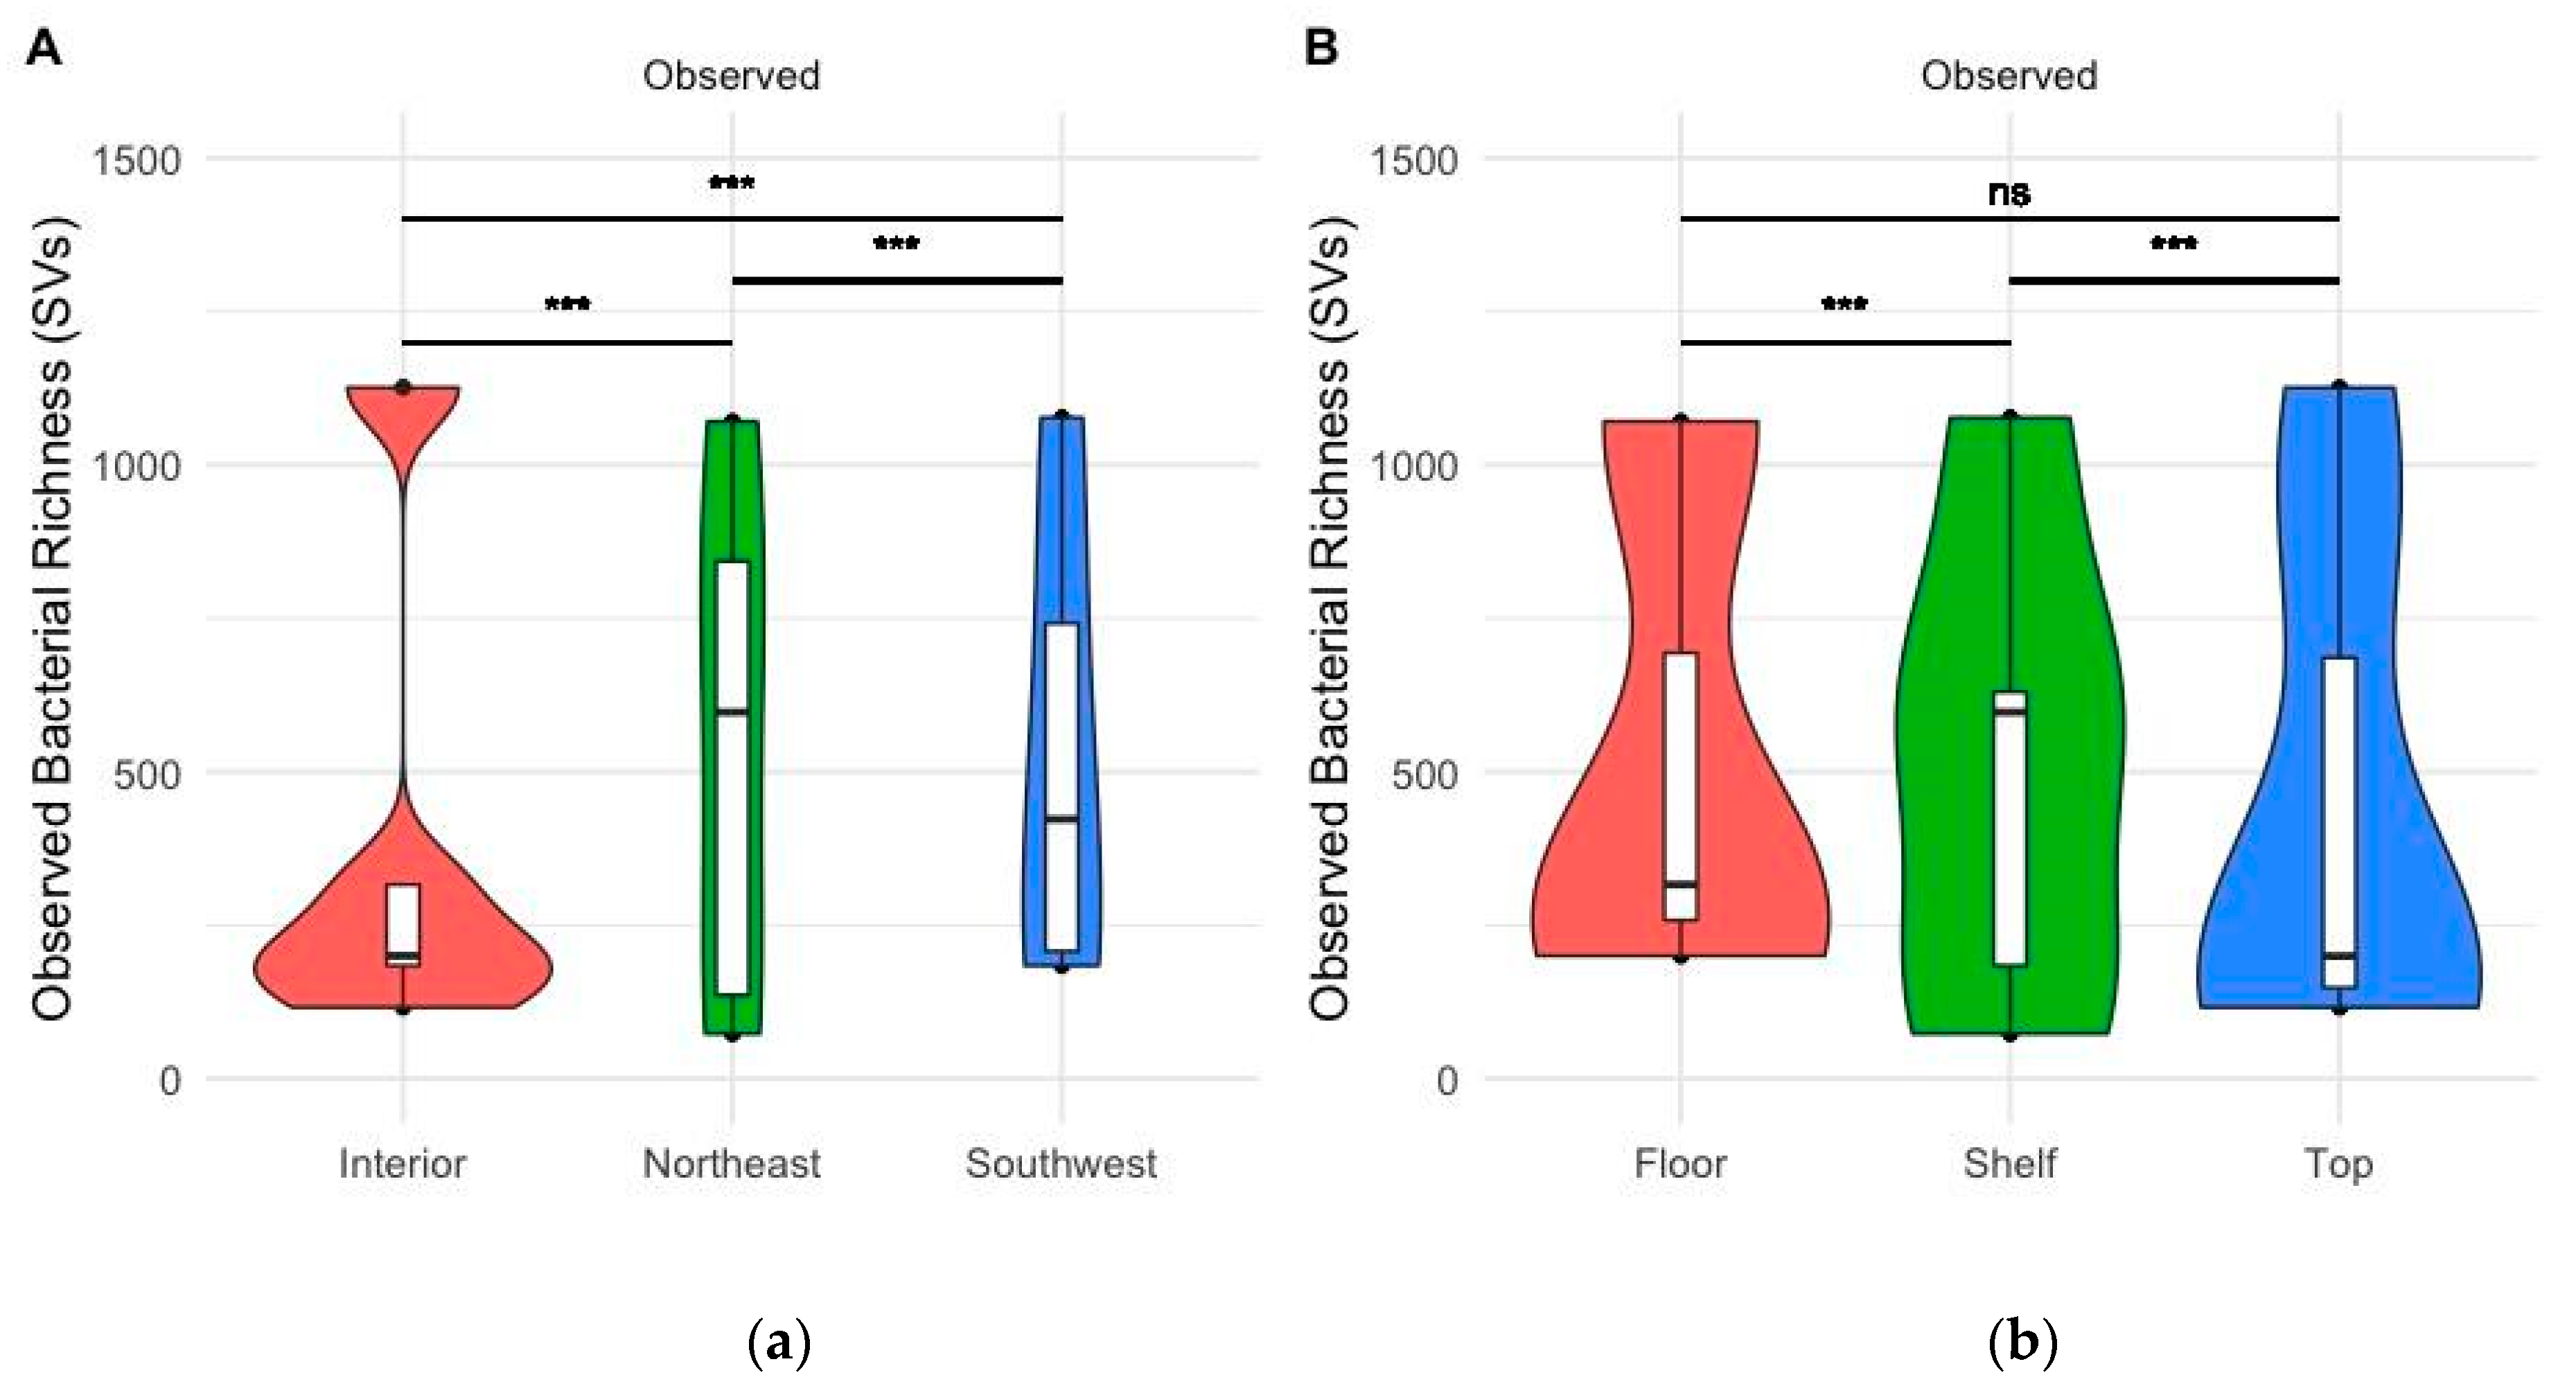
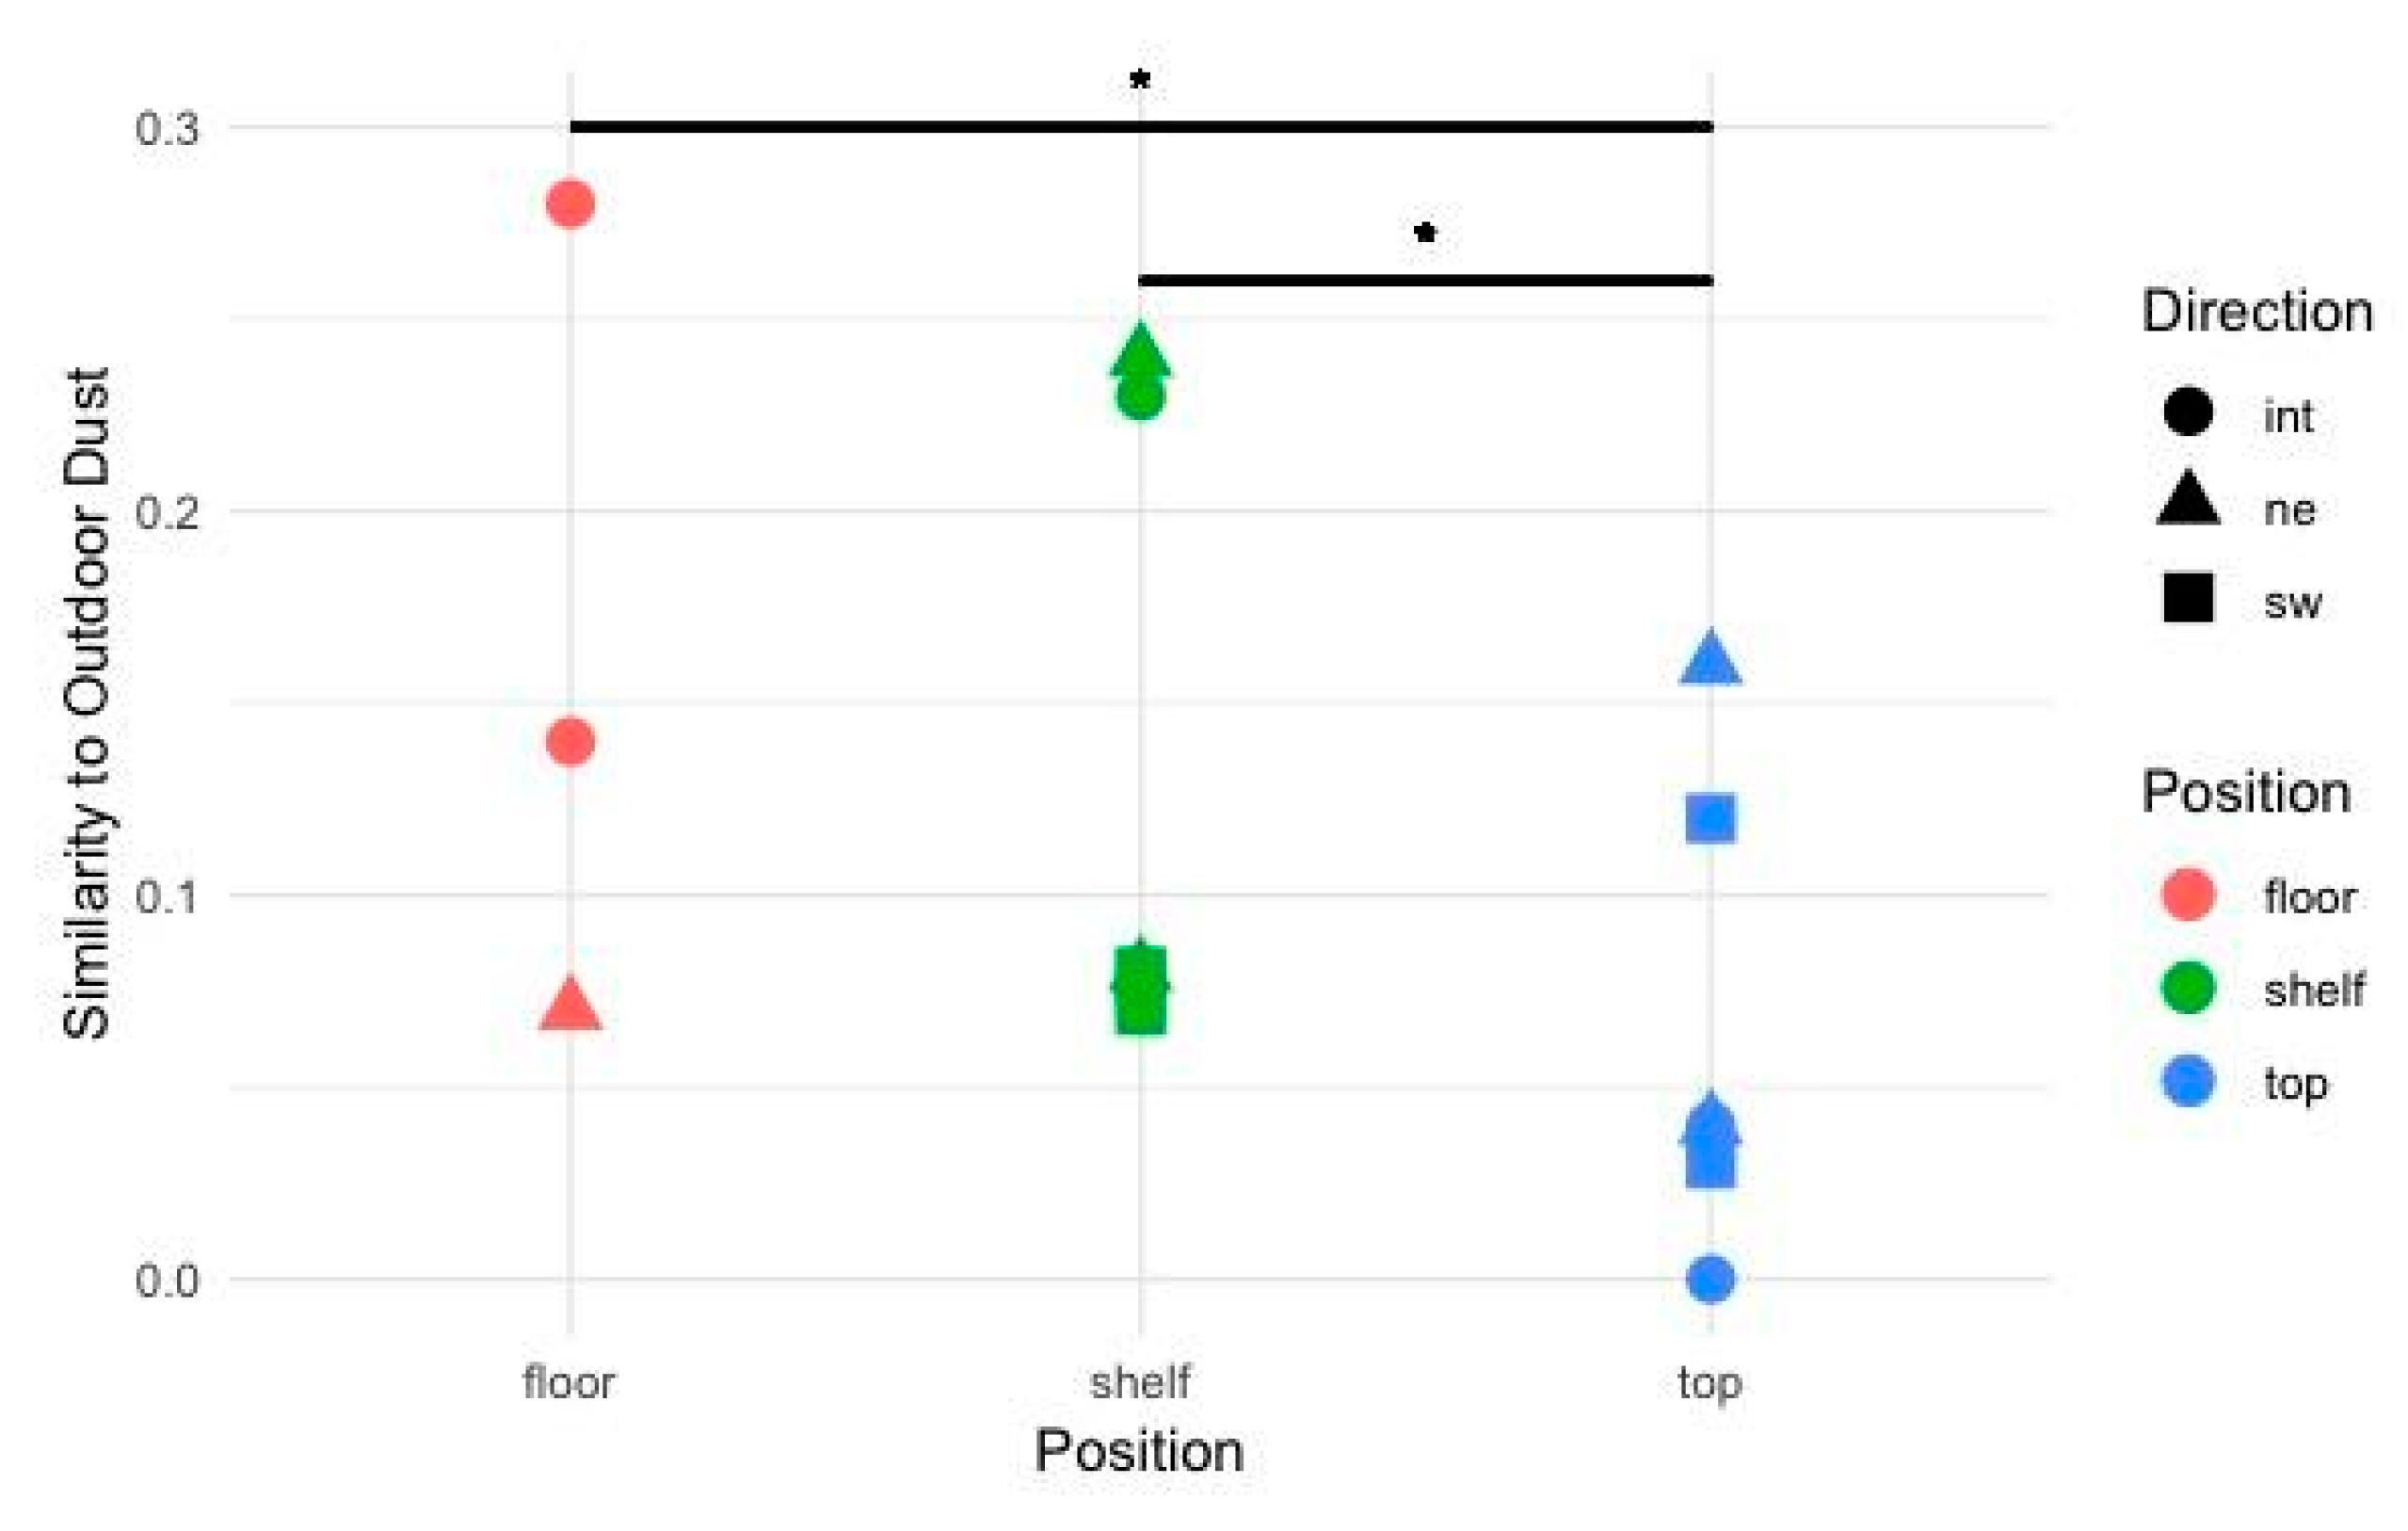
3.2. Bacterial Community

The mean number of bacterial species observed in dust was affected by the sampling location within the room as well as the height of sampling, although there was a large amount of variation among samples (Figure 6). The interior of the building hosted significantly fewer bacterial species than either the northeast or southwest corners (glmer, p = 0.001), and the northeast corner had a higher number than the southwest corner. This may reflect both occupant usage and window ventilation patterns, as both contribute to adding microorganisms to the indoor environment [15,51]. On average, settled dust at the shelf level (0.88 m high) contained more bacterial species (p = 0.001) than either the floor or the top (1.12 m high) of the sampling unit (Figure 6).
Disturbance of floor surfaces can resuspend settled or tracked-in microorganisms [52], which distribute within a space based on air currents and thermal plumes, which can pose a differential exposure to occupants relative to height above the floor and particle size [52,53]. The shelf level is covered and minimally screened, though is otherwise quite similar in sampling location to the top of the monitoring kit, suggesting this geometry may contribute to the sample collected. The increase in species richness may reflect the positioning between two microbial populations; larger particles which settle out of air to floor surfaces and are resuspended during traffic, and smaller particles which are more apt to stay airborne but were less likely to be disturbed from the shelf settling dish, leading to a combined accrual of more bacterial species. The bacterial community collected at shelf-height was trending towards having fewer bacteria sourced from outdoor air than the floor (Figure 7), but only the top samples had significantly fewer bacterial species that were likely sourced from outdoor air.
The bacterial community in buildings is not often connected to the occupant experience with several exceptions: visible microbial growth and building damage or odor complaints, triggering of asthma or allergy symptoms or facilitating the spread of infectious disease. Due to the recency of this building’s construction, microbial overgrowth was not a concern, and due to lacking occupant health data, we are unable to comment. However, microbial communities may impact building occupants in positive, neutral or negative ways which we are largely unaware of. Exploring these spatial patterns can be used to form hypotheses about microbial accrual or transit in spaces, and determine the potential for interaction with occupants.

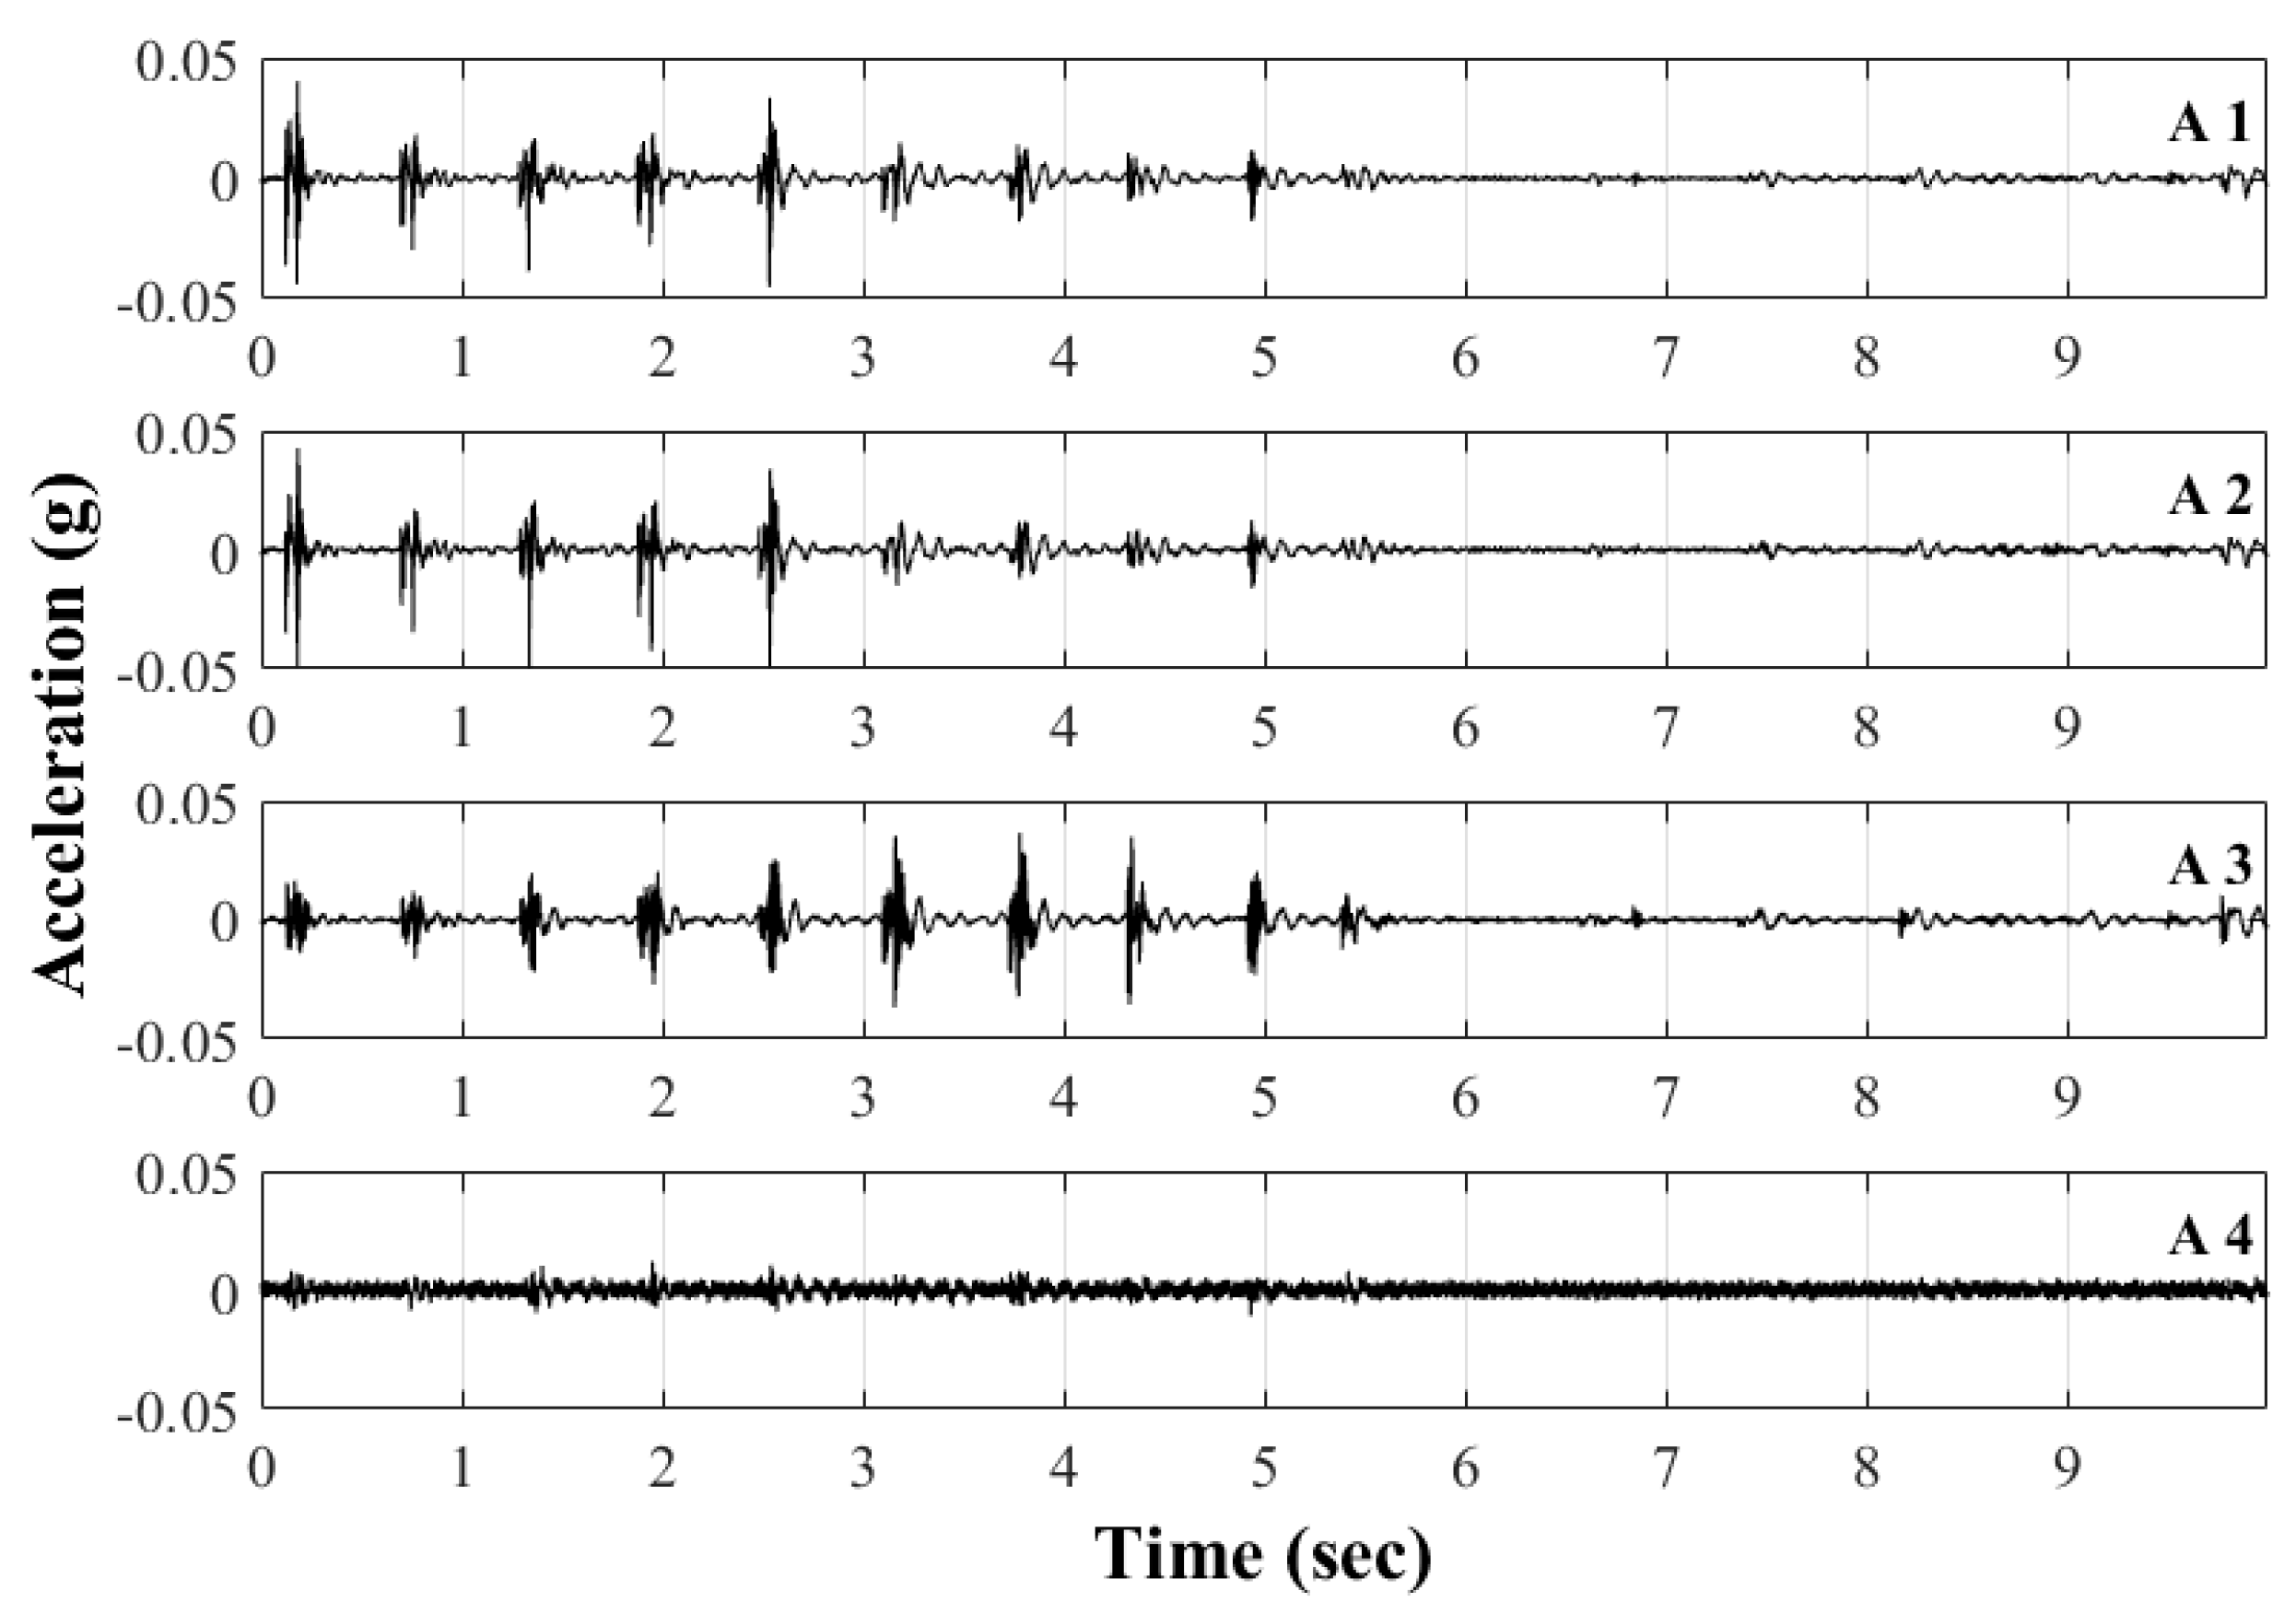
3.3. Vertical Vibration

Figure 8 displays a ten second segment of footfall-triggered data. Accelerometers A1 through A3 show the response of a person walking at an approximate pace corresponding to 1.7 Hz. The recurring footfall signal is not as distinctly visible in accelerometer A4 data. The peak acceleration measured in this data set is approximately 0.05 g at accelerometers A2, which is indicative that the person was walking nearest to that accelerometer. In addition, it can be seen that as the amplitude of the motion in A2 is reduced, at approximately t = 3 s, and increased at A3, indicating the direction of the movement of the passerby from west to east.
Figure 9 shows the corresponding PSDs plots to the data records shown in Figure 8, in the frequency range of 0 to 30 Hz. A major frequency peak is observed at a frequency of 9.90 Hz, and smaller amplitudes for the frequency peaks in the range of 10–20 Hz, while the amplitudes in the frequency ranging 0–8 Hz shows amplitudes at approximately 1.7 × 10⁻⁵ g2/Hz and below.
Murray (1999) presented an extensive review of research aimed at quantifying the response of humans to floor vibration [54]. The following factors, affecting the perception and tolerance level of the human were identified: (a) the frequency of vibration, (b) the magnitude of vibration, (c) the duration of motion, (d) the occupant’s body orientation and (d) the occupant’s activity. Procedures for evaluation of the effect of vibrations on humans are presented in documents such as ISO 2631 (2003) and ISO 10137 (2007), where the peak acceleration is used as the threshold for human comfort in offices or residences subjected to vibration frequencies between 4 Hz and 8 Hz is 0.005 g, or 0.5% of gravity [55,56]. The lower threshold within the frequency range of 4 to 8 Hz can be explained by studies showing that humans are particularly sensitive to vibrations with frequencies in the 5-8 Hz range [54].
Eurocode 5 (2004) [34], which is viewed to be more stringent on floor vibrations than American standards [55], places a serviceability limit for wood structures with a vertical natural frequency of less than 8 Hz. HIVOSS (2008), although geared for footbridges, identifies the critical range for vertical vibrations that produce discomfort, which includes frequencies in the range of 1.25 Hz to 4.6 Hz [35]. The measured floor vibrations at Albina Yard place the fundamental frequency at 9.90 Hz, outside of the human discomfort range presented in [34,55,56]. The findings provide confidence in the floor design solution and span lengths.

4. Conclusions

This case study investigated performance aspects of a mass timber building that relate to occupant experience. Exposure measurements were conducted for three indoor environmental quality (IEQ) factors to better understand how cross-laminated timber (CLT) and glue-laminated timber (GLT) wood products and systems impact indoor air quality, indoor bacterial community, and vibrational comfort in an office environment of a mass timber building.
Indoor air quality was analyzed using both direct-measurement continuous monitoring and passive air sampling techniques. Indoor and outdoor concentrations were collected and compared. Multiple data collection periods and locations in the building were considered. In locations with low or no ventilation, like a storage closet, we observed elevated monoterpene levels compared to well-ventilated areas like an entryway. We speculate this difference is likely due to accumulation of monoterpenes emitted from materials and potentially indoor chemistry occurring in these spaces. Follow-up studies deploying real-time volatile organic compound instrumentation, like chemical ionization - time of flight - mass spectrometry, in CLT buildings would shed light on the VOC sources and chemistry occurring in buildings using substantial CLT structural elements. CO2 data collected during the first sampling week was used to initiate further investigation of the mechanical ventilation system and correct a damper position issue. Formaldehyde, toluene and monoterpenes were observed to vary in concentration across spaces that also varied by ventilation rate.
The height of passive bacterial sampling and the sampling location within the building had a small but measurable effect on the bacterial communities in settled dust, confirming the effect of localized conditions on the accrued microbial community. It also suggests the capacity to intentionally select a microbial community by integrating environmental conditions (i.e. outdoor air), and holds implications for individual occupant exposure to indoor microbial communities based on location within a building.
Footfall triggered vibrational accelerations were observed in monitored data to be within the serviceability range for human comfort. While it is well known that floor dynamic response depends on both structural and non-structural components, the satisfactory vibration performance of the studied floor mainly relies on structural features, such as relative short spans and thickness of the CLT floor panels.

Author Contributions

Conceptualization, M.R., A.B, E.T.G. and K.V.D.W.; methodology, J.S., S.L.I., A.L. (Andrew Loia), D.N., I.M., M.R., A.B., E.T.G. and K.V.D.W.; validation, S.L.I., M.R., E.T.G. and K.V.D.W.; formal analysis, J.S., S.L.I., A.L. (Aurélie Laguerre), I.M. and D.N.; investigation, J.S., A.L. (Aurélie Laguerre), A.L. (Andrew Loia), G.M., I.M., D.N., M.R. and A.B.; resources, M.R., A.B., E.T.G. and K.V.D.W.; data curation, J.S., S.L.I., A.L. (Aurélie Laguerre), I.M. and D.N.; writing—original draft preparation, J.S., S.L.I., A.L. (Aurélie Laguerre) and I.M.; writing—review and editing, J.S., S.L.I., A.L. (Aurélie Laguerre), A.L. (Andrew Loia), G.M., I.M., D.N., M.R., A.B, E.T.G. and K.V.D.W.; visualization, J.S., S.L.I., A.L. (Aurélie Laguerre), I.M. and D.N.; supervision, M.R., A.B, E.T.G. and K.V.D.W.; project administration, M.P. and K.V.D.W.; funding acquisition, M.R., A.B, E.T.G. and K.V.D.W.

Funding

This work was funded by a grant with the U.S. Department of Agriculture’s Agricultural Research Service [USDA ARS Agreement No. 58-0202-5-001], a grant to the Biology and the Built Environment Center from the Alfred P. Sloan Foundation [grant no. G-2015-14023], and by start-up funds provided by Portland State University.

Acknowledgments

The authors wish to acknowledge the building owner, Reworks Inc., for providing access to the building; the building architect and fourth-floor occupant, Lever Architecture, for providing access to their office and occupant survey feedback. The authors would like to thank Leslie Dietz and Susie Nunez at the University of Oregon for their contribution to molecular biology laboratory work; Mark Fretz, Alejandro Manzo, and Daniel Roth at the University of Oregon for their contribution to fieldwork.

Conflicts of Interest

The authors declare no conflict of interest. The funders had no role in the design of the study; in the collection, analyses, or interpretation of data; in the writing of the manuscript, or in the decision to publish the results.

References

  1. ICC (International Code Council). International Building Code; ICC: Falls Church, VA, USA, 2015. [Google Scholar]
  2. AWC (American Wood Council). National Design Specification for Wood Construction; AWC: Leesburg, VA, USA, 2015. [Google Scholar]
  3. Arif, M.; Katafygiotou, M.; Mazroei, A.; Kaushik, A.; Elsarrag, E. Impact of indoor environmental quality on occupant well-being and comfort: A review of the literature. Int. J. Sustain. Built Environ. 2016, 5, 1–11. [Google Scholar]
  4. Mitchell, C.S.; Zhang, J.; Sigsgaard, T.; Jantunen, M.; Lioy, P.J.; Samson, R.; Karol, M.H. Current state of the science: Health effects and indoor environmental quality. Environ. Health Perspect. 2007, 115, 958–964. [Google Scholar] [CrossRef] [PubMed]
  5. Bard, D.; Vardaxis, N.G.; Sondergard, E. Acoustic Comfort Investigation in Residential Timber Buildings in Sweden. J. Sustain. Archit. Civ. Eng. 2019, 1, 78–89. [Google Scholar]
  6. Kuusk, K.; Kaiser, A.; Lolli, N.; Johansson, J.; Hasu, T.; Gunnarshaug Lien, A.; Arumägi, E.; Kalbe, K.; Hallik, J.; Kurnitski, J. Energy Performance, Indoor Air Quality and Comfort in New Nearly Zero Energy Day-care Centres in Northern Climatic Conditions. J. Sustain. Archit. Civ. Eng. 2019, 1, 7–16. [Google Scholar]
  7. Verma, I.; Cronhjort, Y.; Kuittinen, M. Design for care—Use of wood in public buildings. In Proceedings of the WCTE 2016, Vienna, Austria, 22–25 August 2016. [Google Scholar]
  8. Martins, C.; Santos, P.; Almeida, P.; Godinho, L.; Dias, A. Acoustic performance of timber and timber-concrete floors. Constr. Build. Mater. 2015, 101, 684–691. [Google Scholar] [CrossRef]
  9. Casagrande, D.; Giongo, I.; Pederzolli, F.; Franciosi, A.; Piazza, M. Analytical, numerical and experimental assessment of vibration performance in timber floors. Eng. Struct. 2018, 168, 748–758. [Google Scholar] [CrossRef]
  10. Jarnerö, K.; Brandt, A.; Olsson, A. Vibration properties of a timber floor assessed in laboratory and during construction. Eng. Struct. 2015, 82, 44–54. [Google Scholar] [CrossRef]
  11. Adekunle, T.O.; Nikolopoulou, M. Thermal comfort, summertime temperatures and overheating in prefabricated timber housing. Build. Environ. 2016, 103, 21–35. [Google Scholar] [CrossRef]
  12. Albatici, R.; Gadotti, A.; Rossa, G.; Frattari, A. Comparison of thermal comfort conditions in multi-storey timber frame and cross-laminated residential buildings. J. Sustain. Archit. Civ. Eng. 2017, 19, 40–48. [Google Scholar] [CrossRef]
  13. Nyrud, A.; Bringslimark, T.; Englund, F. Wood use in a hospital environment: VOC emissions and air quality. Eur. J. Wood Wood Prod. 2012, 70, 541–543. [Google Scholar] [CrossRef]
  14. Höllbacher, E.; Ters, T.; Rieder-Gradinger, C.; Srebotnik, E. Influences of interior fitting processes on the indoor air quality of two model rooms. Eur. J. Wood Wood Prod. 2016, 74, 693–701. [Google Scholar] [CrossRef]
  15. Kembel, S.W.; Jones, E.; Kline, J.; Northcutt, D.; Stenson, J.; Womack, A.M.; Green, J.L. Architectural design influences the diversity and structure of the built environment microbiome. ISME J. 2012, 6, 1469. [Google Scholar] [CrossRef] [PubMed]
  16. Weckendorf, J.; Toratti, T.; Smith, I.; Tannert, T. Vibration serviceability performance of timber floors. Eur. J. Wood Wood Prod. 2016, 74, 353–367. [Google Scholar] [CrossRef]
  17. Lever Architecture. Available online: https://leverarchitecture.com/projects/albina_yard (accessed on 14 May 2019).
  18. Laguerre, A.; Stenson, J.; Van Den Wymelenberg, K.; Gall, E.T. Preliminary investigation of helium diffusion sampling for monitoring of indoor volatile organic compounds. In Proceedings of the Indoor Air 2018, Philadelphia, PA, USA, 22–28 July 2018. [Google Scholar]
  19. Lindinger, W.; Hansel, A.; Jordan, A. On-Line Monitoring of Volatile Organic Compounds at Pptv Levels by Means of Proton-Transfer-Reaction Mass Spectrometry (PTR-MS) Medical Applications, Food Control and Environmental Research. Int. J. Mass Spectrom. Ion Process. 1998, 173, 191–241. [Google Scholar] [CrossRef]
  20. Jordan, A.; Haidacher, S.; Hanel, G.; Hartungen, E.; Märk, L.; Seehauser, H.; Schottkowsky, R.; Sulzer, P.; Märk, T.D. A high resolution and high sensitivity proton-transfer-reaction time-of-flight mass spectrometer (PTR-TOF-MS). Int. J. Mass Spectrom. 2009, 286, 122–128. [Google Scholar] [CrossRef]
  21. Holzinger, R.; Kasper-Giebl, A.; Staudinger, M.; Schauer, G.; Röckmann, T. Analysis of the chemical composition of organic aerosol at the Mt. Sonnblick observatory using a novel high mass resolution thermal-desorption proton-transfer-reaction mass-spectrometer (hr-TD-PTR-MS). Atmos. Chem. Phys. 2010, 10, 10111–10128. [Google Scholar] [CrossRef] [Green Version]
  22. Chin, K.; Laguerre, A.; Ramasubramanian, P.; Pleshakov, D.; Stephens, B.; Gall, E.T. Emerging investigator series: Primary emissions, ozone reactivity, and byproduct emissions from building insulation materials. Environ. Sci. Process. Impacts 2019. [Google Scholar] [CrossRef] [PubMed]
  23. Kembel, S.W.; Meadow, J.F.; O’Connor, T.K.; Mhuireach, G.; Northcutt, D.; Kline, J.; Green, J.L. Architectural design drives the biogeography of indoor bacterial communities. PLoS ONE 2014, 9, e87093. [Google Scholar] [CrossRef] [PubMed]
  24. Callahan, B.J.; McMurdie, P.J.; Rosen, M.J.; Han, A.W.; Johnson, A.J.A.; Holmes, S.P. DADA2: High-resolution sample inference from Illumina amplicon data. Nat. Methods 2016, 13, 581. [Google Scholar] [CrossRef]
  25. Yilmaz, P.; Parfrey, L.W.; Yarza, P.; Gerken, J.; Pruesse, E.; Quast, C.; Glöckner, F.O. The SILVA and “all-species living tree project (LTP)” taxonomic frameworks. Nucleic Acids Res. 2013, 42, D643–D648. [Google Scholar] [CrossRef]
  26. DADA2 and Phyloseq Example. Available online: https://github.com/SueIshaq/Examples-DADA2-Phyloseq (accessed on 14 May 2019).
  27. McMurdie, P.J.; Holmes, S. phyloseq: An R package for reproducible interactive analysis and graphics of microbiome census data. PLoS ONE 2013, 8, e61217. [Google Scholar] [CrossRef] [PubMed]
  28. Oksanen, J.; Blanchet, F.G.; Friendly, M.; Kindt, R.; Legendre, P.; McGlinn, D.; Solymos, P. Vegan: Community Ecology Package. R package version 2.4–4. 2017. Available online: https://kityna.ga/548893pdf.pdf (accessed on 14 May 2019).
  29. Love, M.I.; Huber, W.; Anders, S. Moderated estimation of fold change and dispersion for RNA-SEQ data with DESeq2. Genome Biol. 2014, 15, 550. [Google Scholar] [CrossRef] [PubMed]
  30. Wickham, H.; Chang, W. ggplot2: An Implementation of the Grammar of Graphics. R package version 0.7. 2008. Available online: http://CRAN. R-project. org/package= ggplot2 (accessed on 14 May 2019).
  31. Bates, D.; Mächler, M.; Bolker, B.; Walker, S. Fitting linear mixed-effects models using lme4. arXiv 2015, arXiv:1406.5823. [Google Scholar]
  32. Mugabo, I.; Barbosa, A.; Riggio, M. Modal Identification Study of a Four-story Mass-timber Building. In Proceedings of the 2018 World Conference on Timber Engineering (WCTE 2018), Seoul, Korea, 20–23 August 2018. [Google Scholar]
  33. Murray, T.M.; Allen, D.E.; Ungar, E.E. Floor Vibrations due to Human Activity; AISC Steel Design Guide: Chicago, IL, USA, 1997. [Google Scholar]
  34. BSI. BS EN 1995-1-1: Eurocode 5: Design of Timber Structures–Part 1-1: General–Common Rules and Rules for Buildings; CEN: Brussels, Belgium, 2004. [Google Scholar]
  35. Feldmann, M.; Heinemeyer, C.; Lukic, M. Design of Footbridges. Guideline. Human Induced Vibrations of Steel Structure (Hivoss); European Commission JRC: Brussels, Belgium, 2004. [Google Scholar]
  36. Satish, U.; Mendell, M.J.; Shekhar, K.; Hotchi, T.; Sullivan, D.; Streufert, S.; Fisk, W.J. Is CO2 an indoor pollutant? Direct effects of low-to-moderate CO2 concentrations on human decision-making performance. Environ. Health Perspect. 2012, 120, 1671–1677. [Google Scholar] [CrossRef] [PubMed]
  37. Allen, J.G.; MacNaughton, P.; Satish, U.; Santanam, S.; Vallarino, J.; Spengler, J.D. Associations of cognitive function scores with carbon dioxide, ventilation, and volatile organic compound exposures in office workers: A controlled exposure study of green and conventional office environments. Environ. Health Perspect. 2016, 124, 805–812. [Google Scholar] [CrossRef] [PubMed]
  38. NTP (National Toxicology Program). Report on Carcinogens, 15th ed.; U.S. Department of Health and Human Services, Public Health Service: Research Triangle Park, NC, USA, 2016. Available online: https://ntp.niehs.nih.gov/go/roc14 (accessed on 14 May 2019).
  39. Huang, Y.T.; Chen, C.C.; Chen, Y.K.; Chiang, C.M.; Lee, C.Y. Environmental test chamber elucidation of ozone-initiated secondary pollutant emissions from painted wooden panels in buildings. Build. Environ. 2012, 50, 135–140. [Google Scholar] [CrossRef]
  40. Kagi, N.; Fujii, S.; Tamura, H.; Namiki, N. Secondary VOC emissions from flooring material surfaces exposed to ozone or UV irradiation. Build. Environ. 2009, 44, 1199–1205. [Google Scholar] [CrossRef]
  41. World Health Organization. WHO Guidelines for Indoor Air Quality: Selected Pollutants; WHO Regional Office for Europe: Copenhagen, Denmark, 2010. [Google Scholar]
  42. Nielsen, G.D.; Larsen, S.T.; Wolkoff, P. Re-evaluation of the WHO (2010) formaldehyde indoor air quality guideline for cancer risk assessment. Arch. Toxicol. 2017, 91, 35–61. [Google Scholar] [CrossRef]
  43. Salthammer, T.; Schwarz, A.; Fuhrmann, F. Emission of reactive compounds and secondary products from wood-based furniture coatings. Atmos. Environ. 1998, 33, 75–84. [Google Scholar] [CrossRef]
  44. Kesselmeier, J.; Staudt, M. Biogenic Volatile Organic Compounds (VOC): An overview on emission, physiology and ecology. J. Atmos. Chem. 1999, 33, 23–88. [Google Scholar] [CrossRef]
  45. Dorokhov, Y.L.; Sheshukova, E.V.; Komarova, T.V. Methanol in Plant Life. Front. Plant Sci. 2018, 9, 1623. [Google Scholar] [CrossRef] [PubMed] [Green Version]
  46. De Gouw, J.A.; Middlebrook, A.M.; Warneke, C.; Goldan, P.D.; Kuster, W.C.; Roberts, J.M.; Fehsenfeld, F.C.; Worsnop, D.R.; Canagaratna, M.R.; Pszenny, A.A.P.; et al. Budget of organic carbon in a polluted atmosphere: Results from the New England Air Quality Study in 2002. J. Geophys. Res. Atmos. 2005, 110, D16305. [Google Scholar] [CrossRef]
  47. Nazaroff, W.W.; Weschler, C.J. Cleaning products and air fresheners: Exposure to primary and secondary air pollutants. Atmos. Environ. 2004, 38, 2841–2865. [Google Scholar] [CrossRef]
  48. Truc, V.T.Q.; Kim Oanh, N.T. Roadside BTEX and other gaseous air pollutants in relation to emission sources. Atmos. Environ. 2007, 41, 7685–7697. [Google Scholar] [CrossRef]
  49. Guo, H.; Lee, S.C.; Li, W.M.; Cao, J.J. Source characterization of BTEX in indoor microenvironments in Hong Kong. Atmos. Environ. 2003, 37, 73–82. [Google Scholar] [CrossRef]
  50. Leusch, F.; Bartkow, M. A Short Primer on Benzene, Toluene, Ethylbenzene and Xylenes (BTEX) in the Environment and in Hydraulic Fracturing Fluids. Smart Water Research Centre 2010, Griffith University. Available online: https://www.ehp.qld.gov.au/management/coalseam-gas/pdf/btex-report.pdf (accessed on 2 April 2019).
  51. Meadow, J.F.; Altrichter, A.E.; Kembel, S.W.; Kline, J.; Mhuireach, G.; Moriyama, M.; Green, J.L. Indoor airborne bacterial communities are influenced by ventilation, occupancy, and outdoor air source. Indoor Air 2014, 24, 41–48. [Google Scholar] [CrossRef]
  52. Wu, T.; Täubel, M.; Holopainen, R.; Viitanen, A.K.; Vainiotalo, S.; Tuomi, T.; Boor, B.E. Infant and adult inhalation exposure to resuspended biological particulate matter. Environ. Sci. Technol. 2017, 52, 237–247. [Google Scholar] [CrossRef]
  53. Khare, P.; Marr, L.C. Simulation of vertical concentration gradient of influenza viruses in dust resuspended by walking. Indoor Air 2015, 25, 428–440. [Google Scholar] [CrossRef]
  54. Allen, D.E.; Onysko, D.M.; Murray, T.M. Minimizing Floor Vibration. Applied Technology Council: Redwood City, CA, USA, 1999; Volume 1. [Google Scholar]
  55. International Organization for Standardization. ISO 2631:2003. Mechanical Vibration and Shock—Evaluation of Human Exposure to Whole Body Vibration; ISO: Geneva, Switzerland, 2003. [Google Scholar]
  56. International Organization for Standardization. ISO 10137:2007. Bases for Design of Structures--Serviceability of Buildings and Walkways against Vibrations; ISO: Geneva, Switzerland, 2007. [Google Scholar]
Figure 1. Annotated Level 4 Plan of Albina Yard showing air quality and microbial, monitoring and sampling locations.
Buildings 09 00142 g001
Figure 2. Uniaxial accelerometer layout. The dashed lines represent GLT beams and girders. Dimensions refer to the center of the accelerometers.
Buildings 09 00142 g002
Figure 3. Weekday average indoor CO2 and HCHO by time of day monitored in the northeast corner of the fourth-floor open office area. Formaldehyde reported using GrayWolf FM-801.
Buildings 09 00142 g003
Figure 4. Results for toluene and monoterpenes over PTR-TOF-MS analysis time for one-minute grab samples from various building locations and one field blank canister.
Buildings 09 00142 g004
Figure 5. VOC results for five compounds from PTR-TOF-MS analysis of week 3 HeDS canisters from southwest and northeast indoor monitoring kit locations and from the outdoor evacuated canister location on the roof.
Buildings 09 00142 g005
Figure 6. Bacterial species’ richness in indoor settled-dust from different (a) locations within the building; (b) heights relative to the floor.
Buildings 09 00142 g006
Figure 7. Similarity of indoor air bacterial communities to on-site outdoor air bacterial communities. Communities sampled from the top of the unit were significantly less like outdoor bacterial communities than those from the floor or shelf height.
Buildings 09 00142 g007
Figure 8. Accelerometers time records triggered by footfall.
Buildings 09 00142 g008
Figure 9. PSDs plots of footfall triggered responses. Human discomfort critical range in red.
Buildings 09 00142 g009
Table 1. Air quality monitoring and sampling instrumentation used in reported results.
MakeModelParameter(s)
EntechBLV1A & HDS-F03Bottle-Vac Helium Diffusion Whole Air Sample (1 L)
EntechBLV1A & RS-QTS1Evacuated Bottle-Vac Whole Air Grab Sample (1 L)
EntechCS1200ES7Evacuated Canister Whole Air Outdoor Sample (6 L)
GrayWolfFM-801Formaldehyde (<20–1000 ppb, +/−4 ppb < 40 ppb, +/−10% of reading ≥ 40 ppb)
TSIVelocicalc IAQ Probe 986Carbon Dioxide (0–5000 ppm, +/−3% of reading or 50 ppm whichever is greater)
Table 2. Description of vibrational test equipment used.
ItemDescription
Accelerometers4–PCB 393B04
Data acquisition1–NI cDaq 9178
Connectors4–BNC cables
Data storage1–Laptop equipped with NI LabVIEW SignalExpress 2014

