Investigation of Wasteful Activities Using Lean Methodology: In Perspective of Kazakhstan’s Construction Industry


Abstract
:1. Introduction
2. Research Design
Data Collection
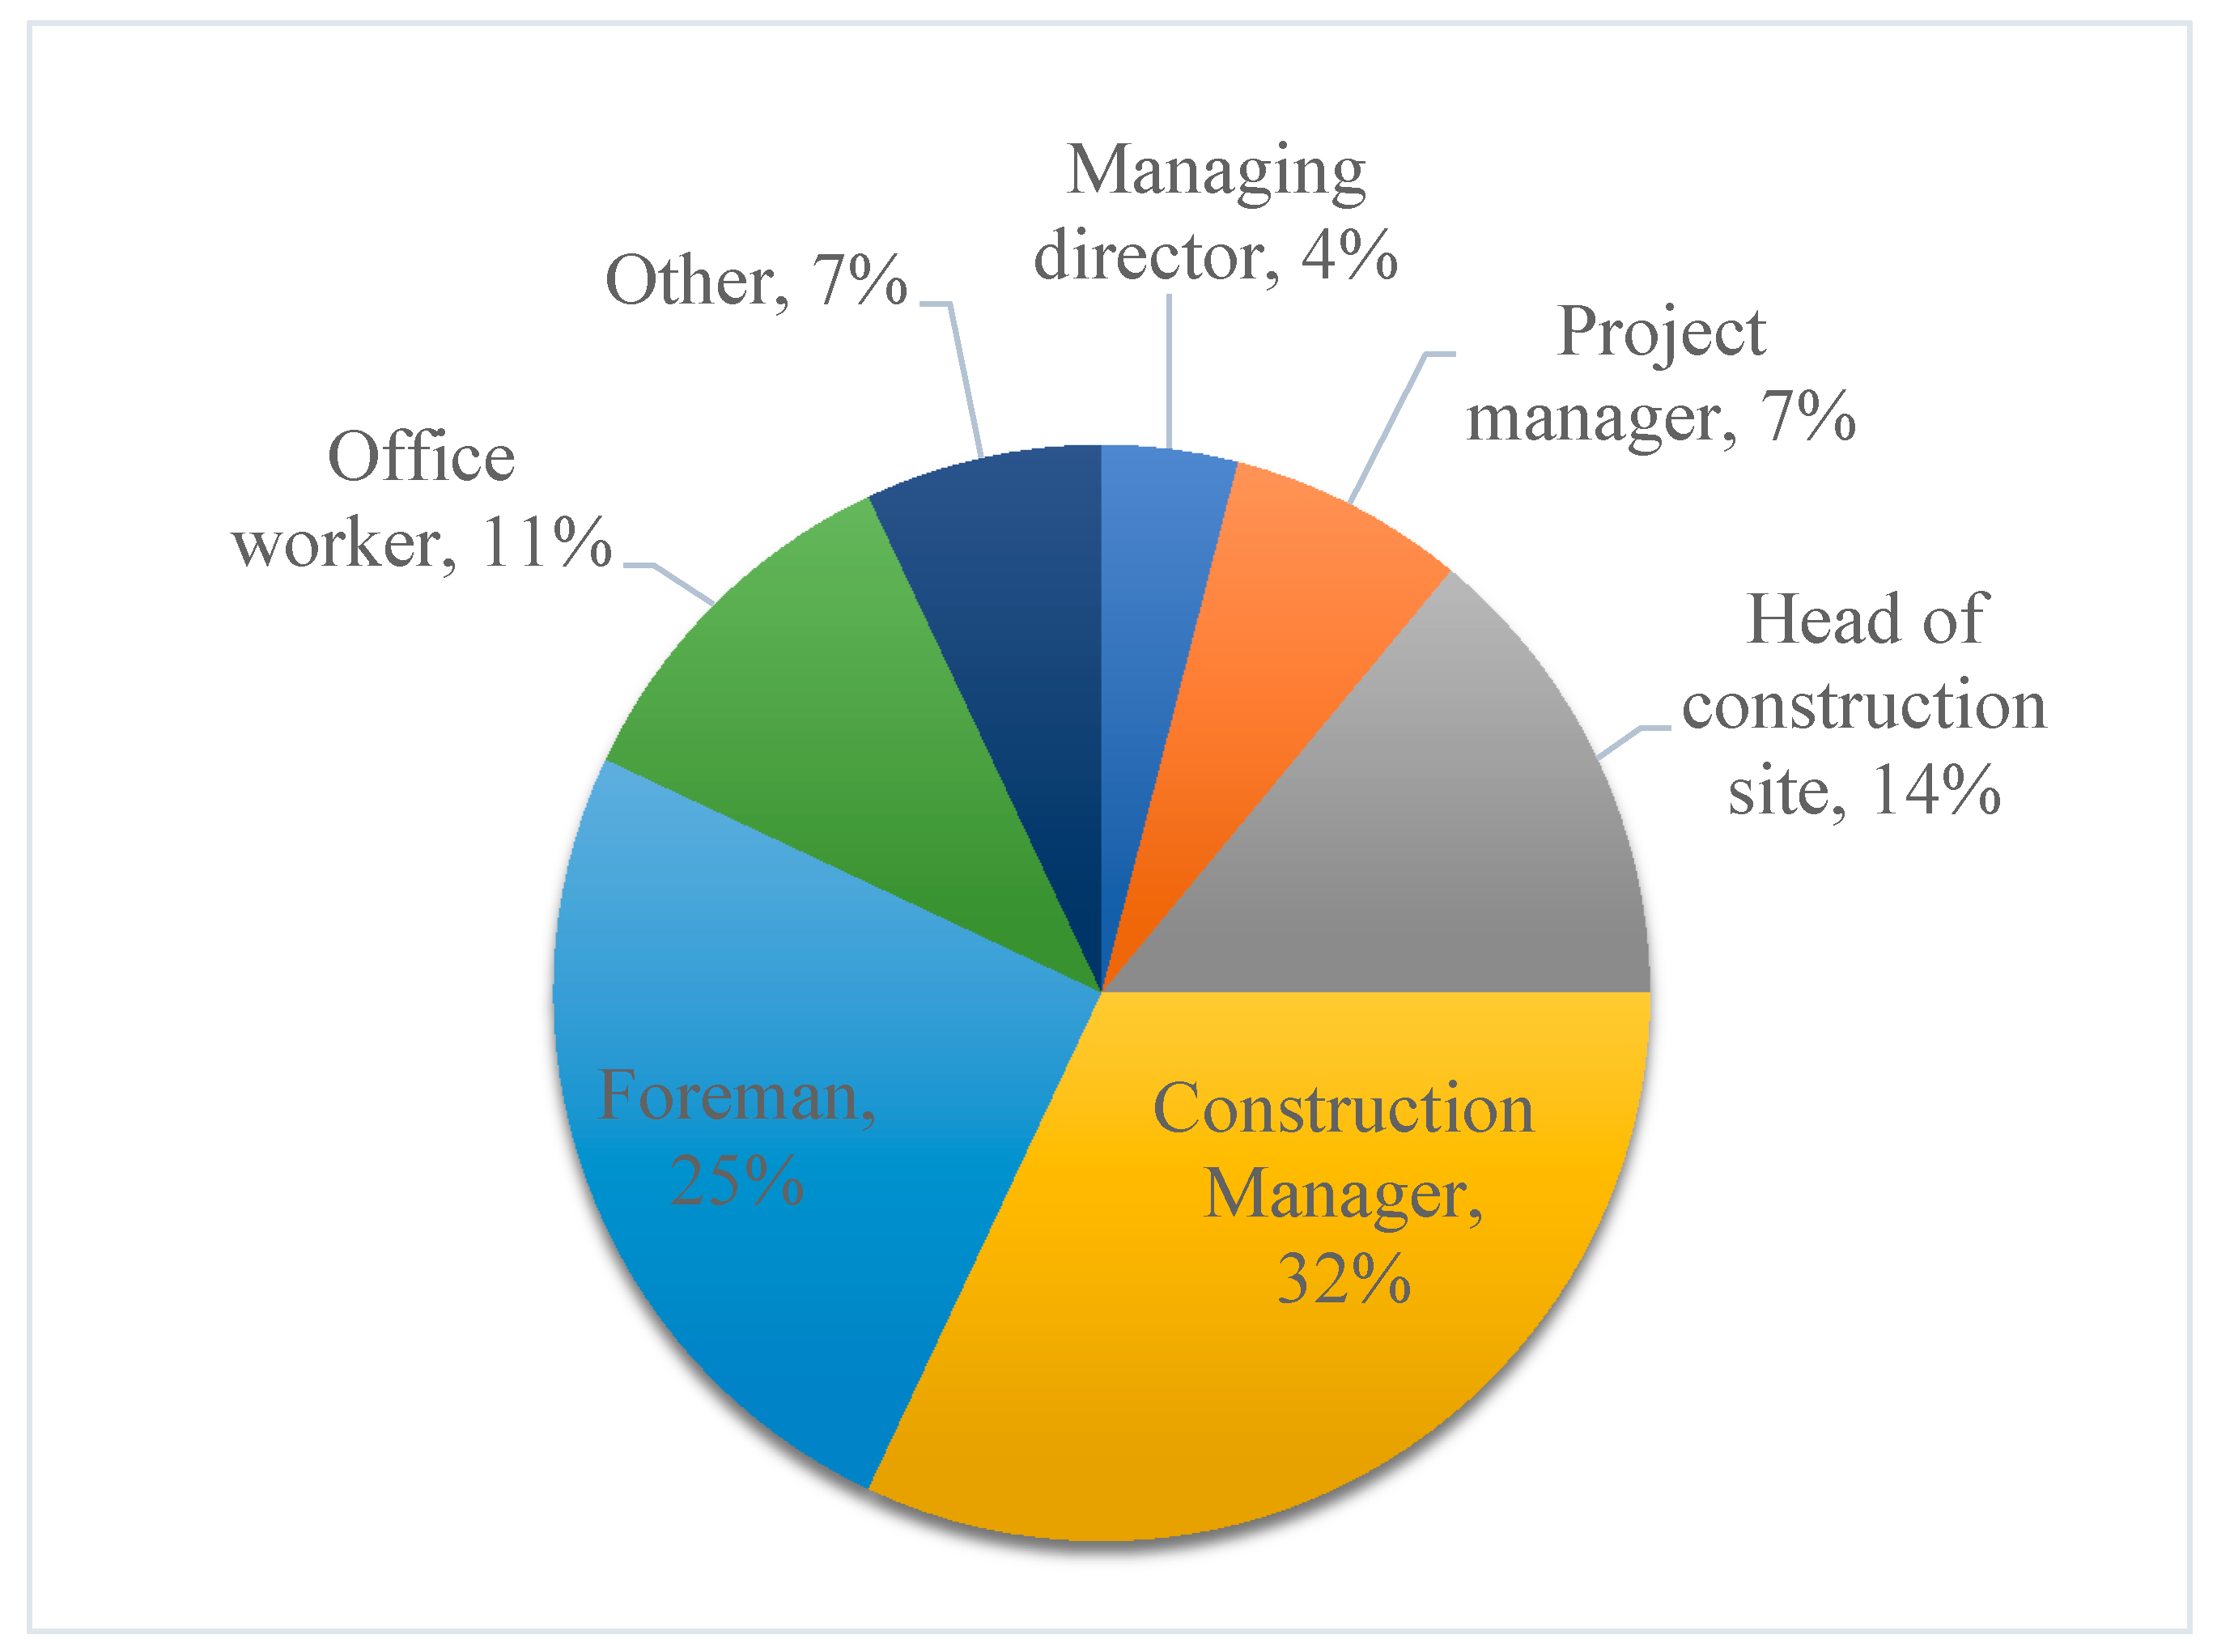
- Questions about the participant’s experience and roles in the project;
- Questions regarding knowledge of Lean methods;
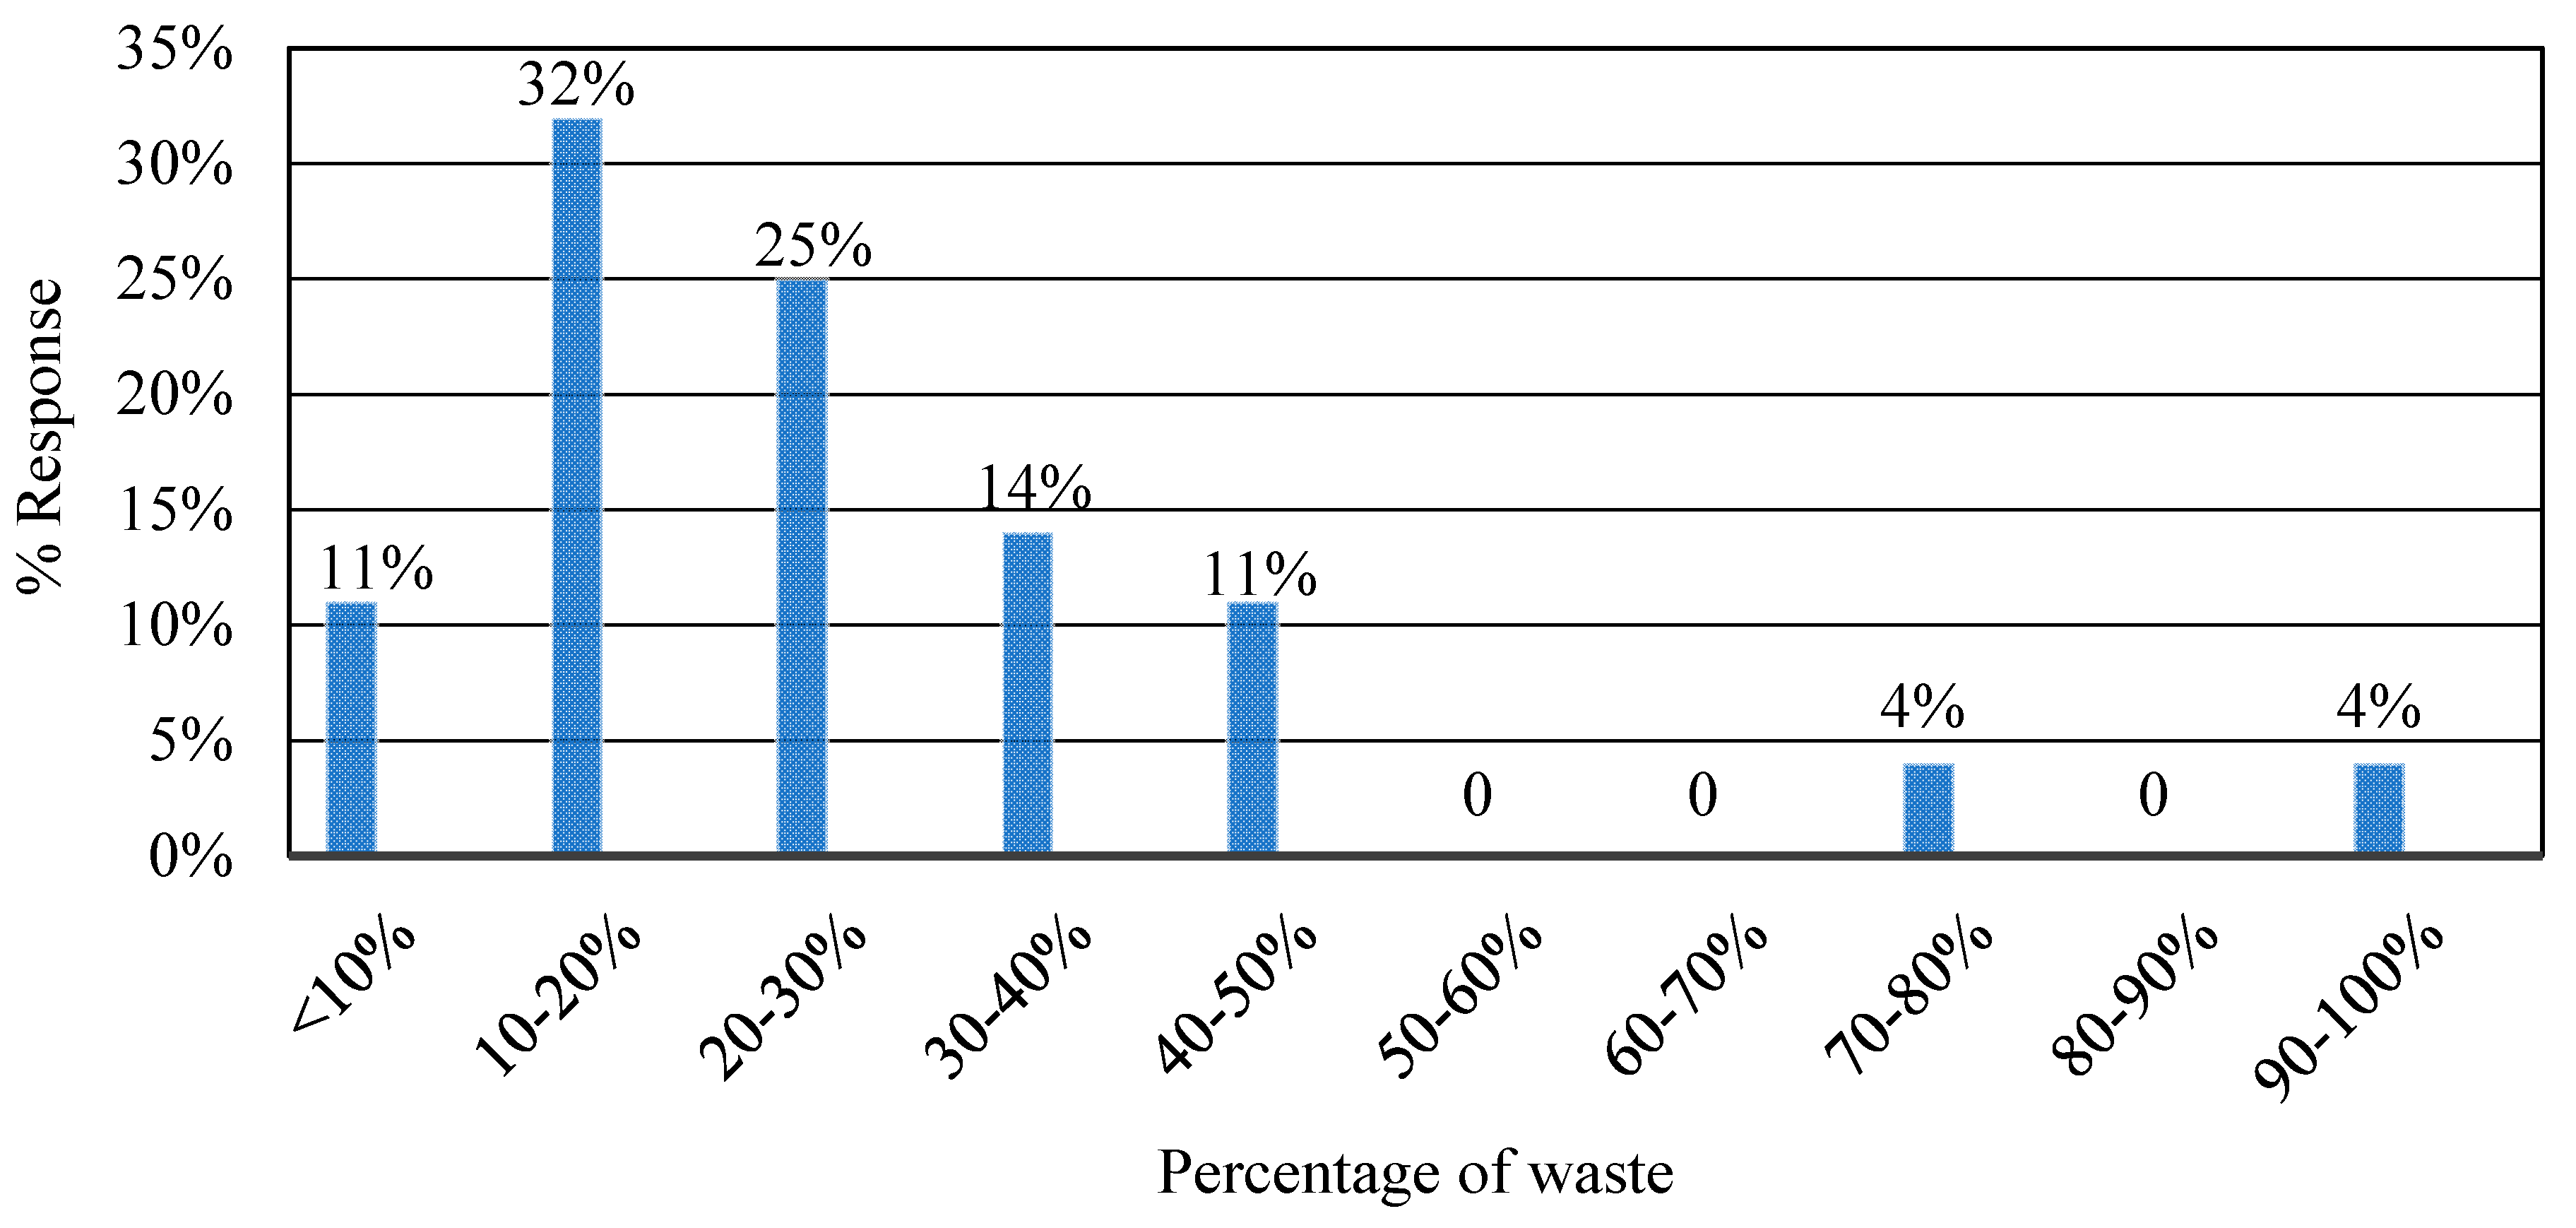
- Questions regarding waste/non-value adding activities in construction process; and
- Questions regarding Lean tools.
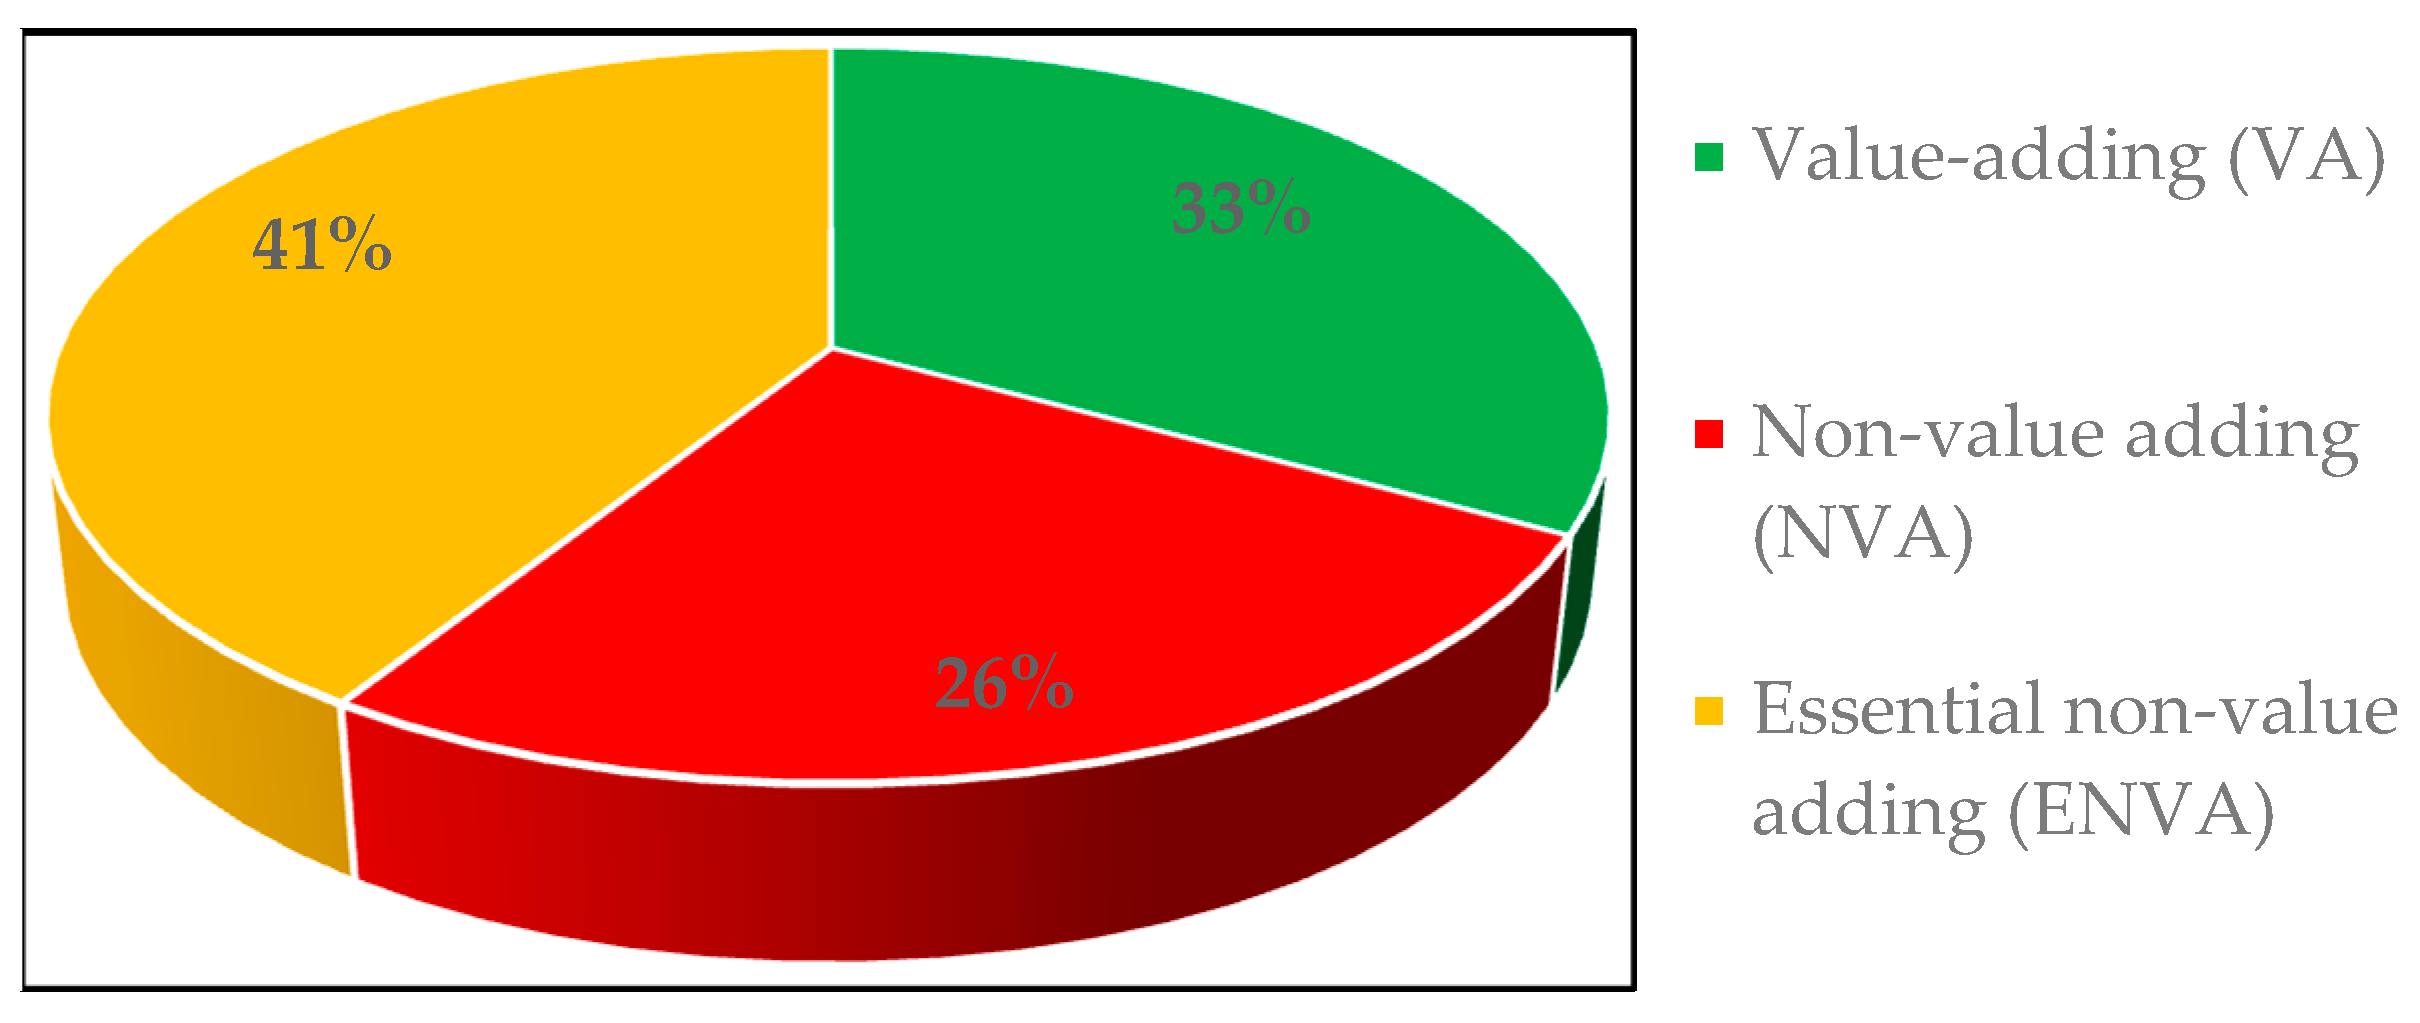
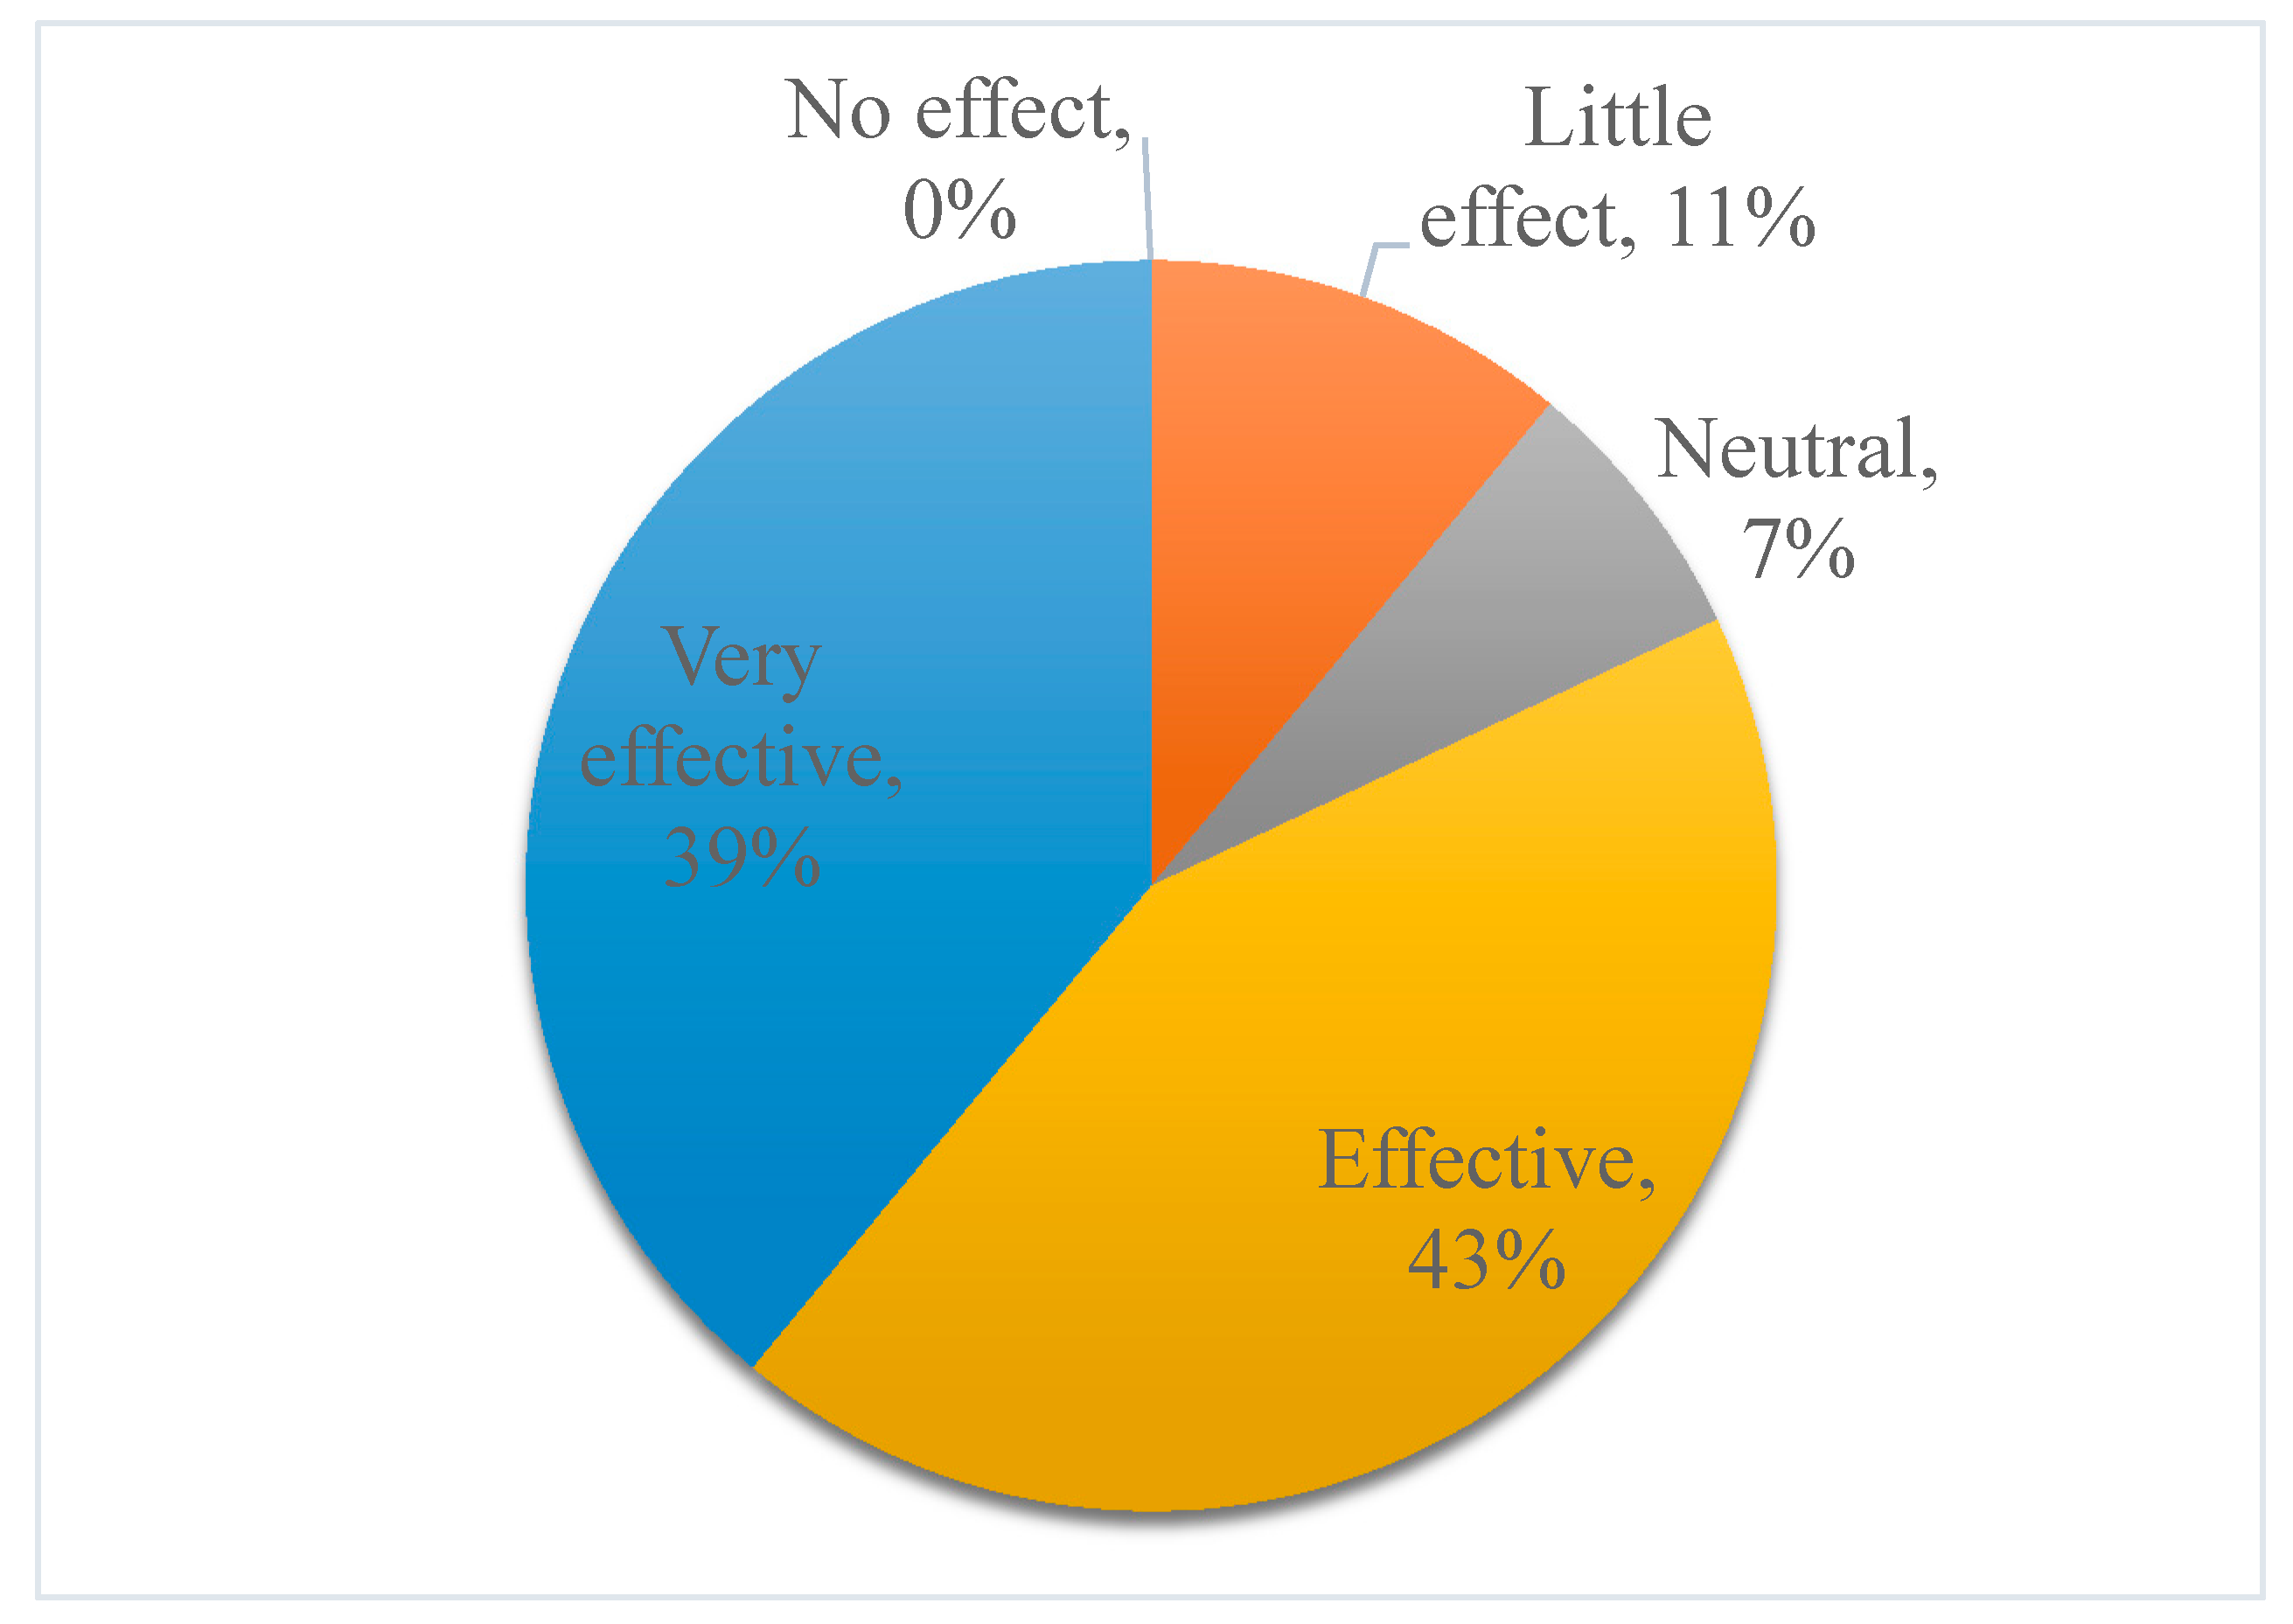
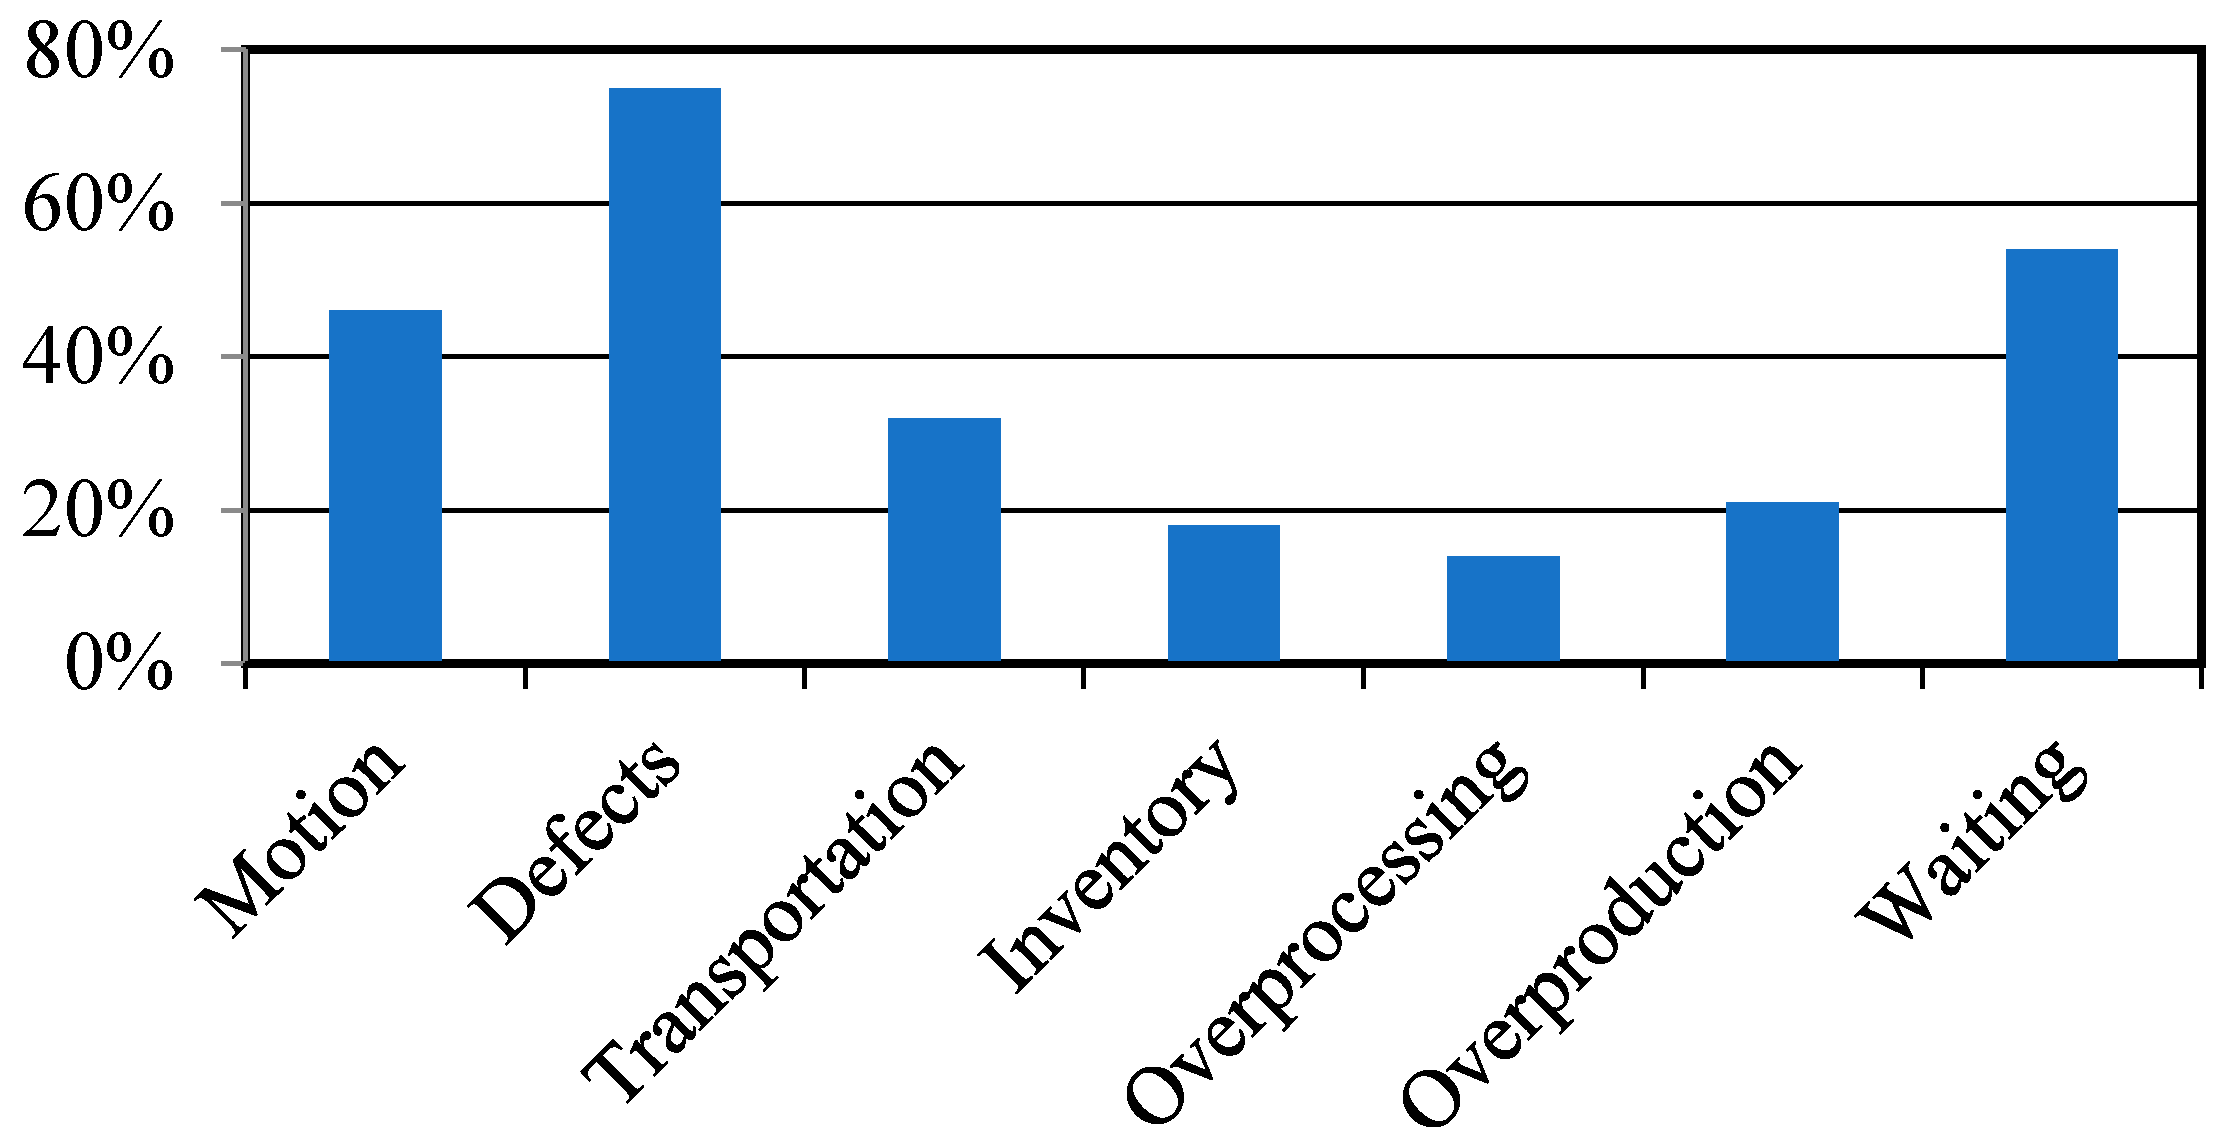
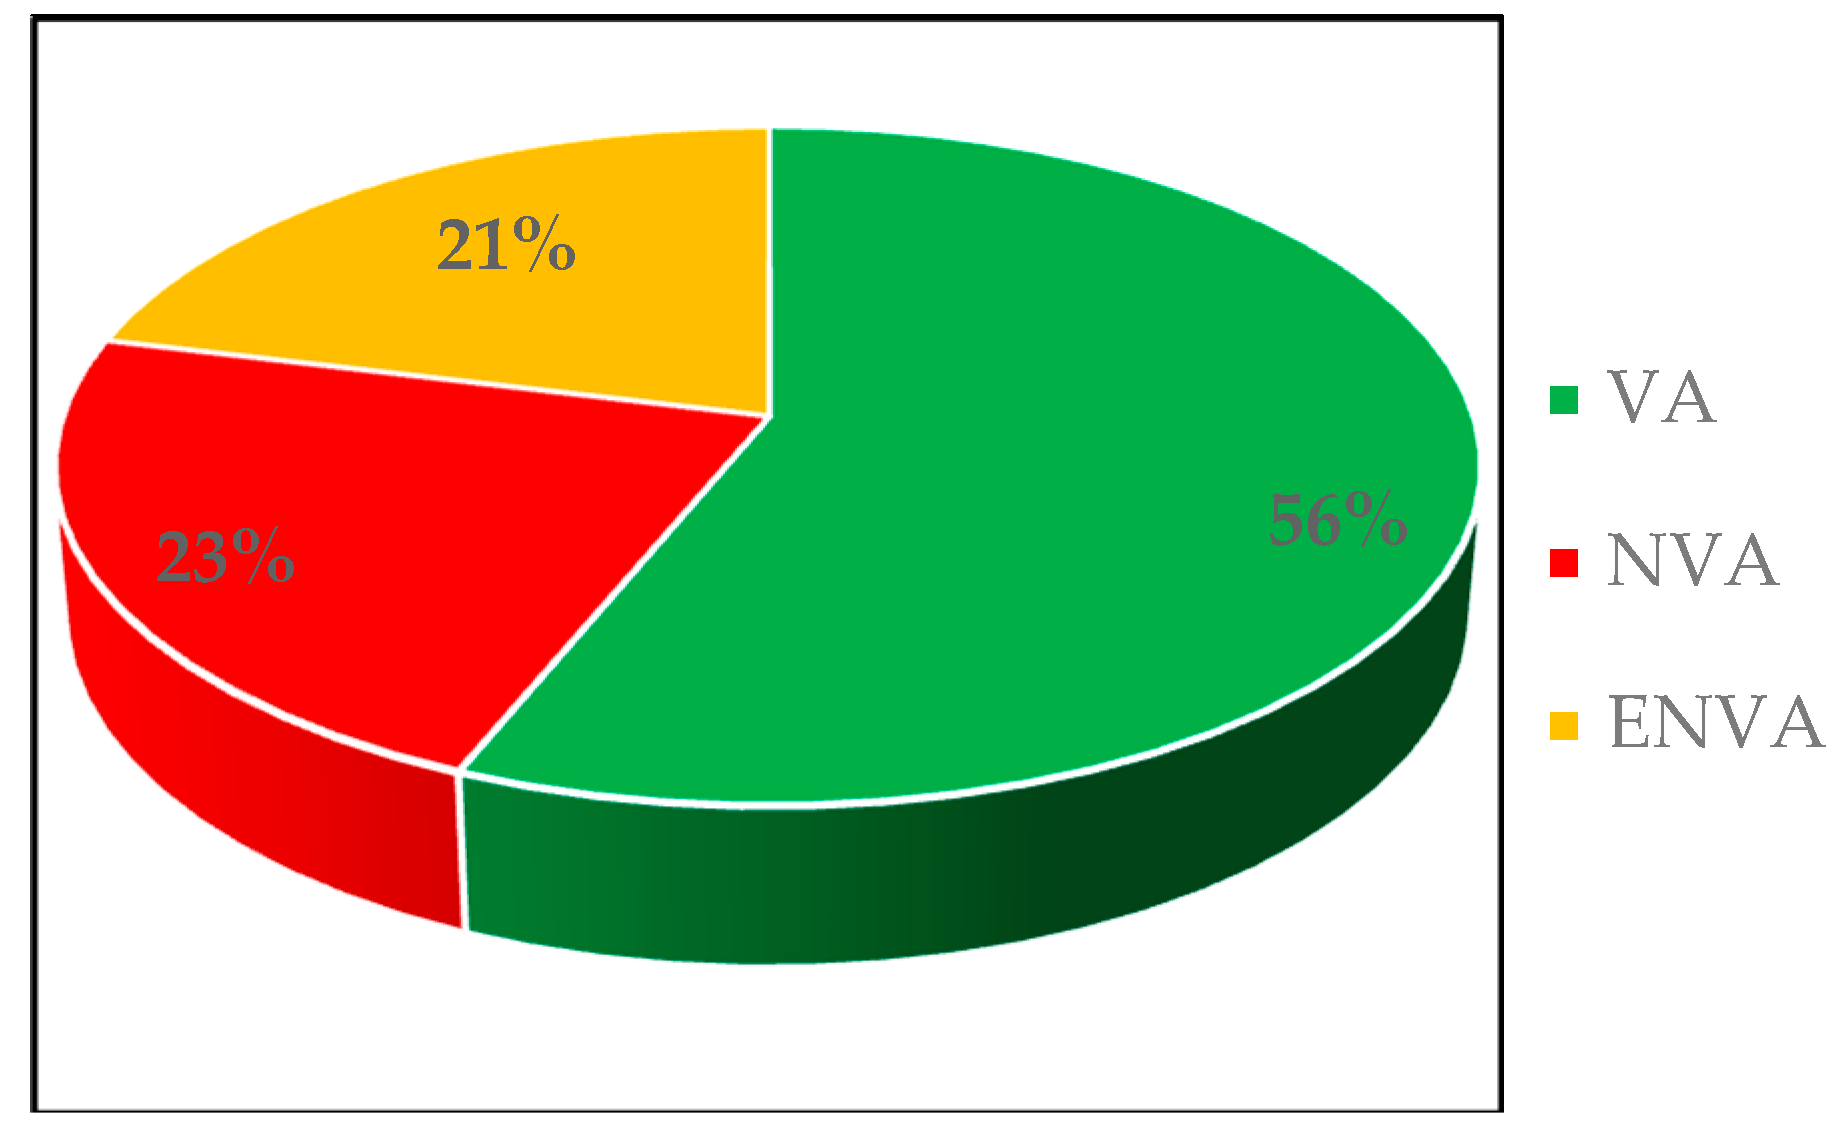
3. Results and Analysis
Survey Results
4. Conclusions and Discussion
Author Contributions
Funding
Acknowledgments
Conflicts of Interest
Appendix A
| Never | Rarely | Occasionally | Frequently | Very Frequently | |
| Motion waste | ◌ | ◌ | ◌ | ◌ | ◌ |
| Defect waste | ◌ | ◌ | ◌ | ◌ | ◌ |
| Transportation waste | ◌ | ◌ | ◌ | ◌ | ◌ |
| Inventory waste | ◌ | ◌ | ◌ | ◌ | ◌ |
| Overprocessing waste | ◌ | ◌ | ◌ | ◌ | ◌ |
| Overproduction waste | ◌ | ◌ | ◌ | ◌ | ◌ |
| Waiting waste | ◌ | ◌ | ◌ | ◌ | ◌ |
| Not Effective | Little Effective | Neutral | Effective | Very Effective | |
| Motion waste | ◌ | ◌ | ◌ | ◌ | ◌ |
| Defect waste | ◌ | ◌ | ◌ | ◌ | ◌ |
| Transportation waste | ◌ | ◌ | ◌ | ◌ | ◌ |
| Inventory waste | ◌ | ◌ | ◌ | ◌ | ◌ |
References
- Akintoye, A. Just-in-time application and implementation for building material management. Constr. Manag. Econ. 1995, 13, 105. [Google Scholar] [CrossRef]
- Lokotko, A.V.; Tret’yakova, T.M. Problems and Prospects of the Building Complex; Kazakh American Free University: Ust-Kamenogorsk, Kazakhstan, 2010. [Google Scholar]
- Hampson, K.D. Construction Innovation in the Australian Context; Canadian National Research Council, Institute for Research in Construction, International Workshop on Innovation Systems and the Construction Industry: Montreal, QC, Canada, 1997. [Google Scholar]
- Alwi, S.; Hampson, K.D.; Mohamed, S.A. Non value-adding activities in Australian construction projects. In Proceedings of the International Conference on Advancement in Design, Construction, Construction Management and Maintenance of Building Structure, Bali, Indonesia, 27–28 March 2002. [Google Scholar]
- Horman, M.; Kenley, R. the application of lean production to project management. In Proceedings of the 4th Annual Conference of the International Group for Lean Construction, Birmingham, UK, 1 January 1996. [Google Scholar]
- Aziz, R.F.; Hafez, S.M. applying lean thinking in construction and performance improvement. Alex. Eng. J. 2013, 52, 679–695. [Google Scholar] [CrossRef]
- Koskela, L. Lean production in construction. In Lean Construction; Alarcon, L., Ed.; CRC Press: Boca Raton, FL, USA, 1997; pp. 1–9. [Google Scholar]
- Koskela, L. Application of the New Production Philosophy to Construction; Stanford University, Center for Integrated Facility Engineering: Stanford, CA, USA.
- Javkhedar, A. Applying Lean Construction to Concrete Construction Projects. Master’s Thesis, University of Houston, Houston, TX, USA, 2006. [Google Scholar]
- Marhani, M.A.; Jaapar, A.; Bari, N.A.A.; Zawawi, M. sustainability through lean construction approach: A literature review. Procedia Soc. Behav. Sci. 2013, 101, 90–99. [Google Scholar] [CrossRef]
- Ohno, T. Toyota Production System: Beyond Large-Scale Production; Taylor & Francis: Abingdon-on-Thames, UK, 1988. [Google Scholar]
- Tomas, L. Lean in Construction Projects: Is Lean Suitable for All Construction Projects? Master’s Thesis, Royal Institute of Technology (KTH), Stockholm, Sweden, 2014. [Google Scholar]
- Horman, M.J.; Kenley, R. Quantifying levels of wasted time in construction with meta-analysis. J. Constr. Eng. Manag. 2005, 131, 52–61. [Google Scholar] [CrossRef]
- Jørgensen, B.; Emmitt, S. Lost in transition: The transfer of lean manufacturing to construction. Eng. Constr. Archit. Manag. 2008, 15, 383–398. [Google Scholar] [CrossRef]
- Nesensohn, C.; Bryde, D.; Pasquire, C. A measurement model for lean construction maturity. Lean Constr. J. 2016, 1–9. [Google Scholar]
- Babalola, O.; Ibem, E.O.; Ezema, I.C. Implementation of lean practices in the construction industry: A systematic review. Build. Environ. 2019, 148, 34–43. [Google Scholar] [CrossRef]
- Liker, J. The Toyota Way: 14 Management Principles from the World’s Greatest Manufacturer; McGraw-Hill: New York, NY, USA, 2003. [Google Scholar]
- Alkhoraif, A.; Rashid, H.; McLaughlin, P. Lean implementation in small and medium enterprises: Literature review. Oper. Res. Perspect. 2018, 100089. [Google Scholar] [CrossRef]
- Dubois, A.; Gadde, L.E. The construction industry as a loosely coupled system: Implications for productivity and innovation. Constr. Manag. Econ. 2002, 20, 621. [Google Scholar] [CrossRef]
- Reusch, P.J.A.; Reusch, P. How to develop lean project management? In Proceedings of the 2013 IEEE 7th International Conference on Intelligent Data Acquisition and Advanced Computing Systems (IDAACS), Berlin, Germany, 12–14 September 2013. [Google Scholar]
- Senaratne, S.; Wijesiri, D. Lean Construction as a strategic option: Testing its suitability and acceptability in Sri Lanka. Lean Constr. J. 2008, 34–48. [Google Scholar]
- Ballard, G.; Howell, G. Lean project management. Build. Res. Inf. 2003, 31, 119. [Google Scholar] [CrossRef]
- Erol, H.; Dikmen, I.; Birgonul, M.T. Measuring the impact of lean construction practices on project duration and variability: A simulation-based study on residential buildings. J. Civil Eng. Manage. 2017, 23, 241–251. [Google Scholar] [CrossRef]
- Nowotarski, P.; Pasławski, J.; Matyja, J. Improving construction processes using lean management methodologies–Cost case study. Procedia Eng. 2016, 161, 1037–1042. [Google Scholar] [CrossRef]
- Akers, P. Miracle in Kazakhstan: Creating a Lean Culture in 18 Months. Available online: https://leanconstructionblog.com/Miracle-in-Kazakhstan-Creating-a-Lean-Culture-in-18-Months.html (accessed on 20 March 2019).
- Stehn, L.; Höök, M. Lean principles in industrialized housing production: The need for a cultural change. Lean Constr. J. 2008, 20–33. [Google Scholar]
- Dierickx, J.; Aouam, T.; Limre, V. Comparison of Lean Management in Japanese and Belgian Manufacturing SMEs. Master’s Thesis, Ghent University, Ghent, Belgium, 2016. [Google Scholar]
- Kim, D. Exploratory Study of Lean Construction: Assessment of Lean Implementation. Ph.D. Thesis, The University of Texas at Austin, Austin, TX, USA, 2002. [Google Scholar]
- Ballard, G.; Howell, G. What kind of production is construction? In Proceedings of the 6th Annual Conference of the International Group for Lean Construction, Guarujá, Brazil, 13–15 August 1998. [Google Scholar]
- Yin, R.K. Case Study Research: Design and Methods; SAGE Publications: Thousand Oaks, CA, USA, 2009. [Google Scholar]
- O’Connor, R.; Swain, B. Implementing Lean in Construction: Lean Tools and Techniques-an Introduction; CIRIA, C730: London, UK, 2013. [Google Scholar]
- Seth, D.; Seth, N.; Dhariwal, P. Application of Value Stream Mapping (VSM) for lean and cycle time reduction in complex production environments: A case study. Prod. Plan. Control 2017, 28, 398–419. [Google Scholar] [CrossRef]
- Sayer, N.J.; Williams, B. Lean for Dummies; Wiley: Hoboken, NJ, USA, 2012. [Google Scholar]
- Arleroth, J.; Kristensson, H. Waste in Lean Construction—A Case Study of a PEAB Construction Site and the Development of a Lean Construction Tool. Master’ Thesis, Chalmers University of Technology, Göteborg, Sweden, 2011. [Google Scholar]
- Mossman, A. Why isn’t the UK construction industry going lean with gusto? Lean Constr. J. 2009, 24–36. [Google Scholar]
- Ismail, H.; Yusof, Z.M. Perceptions towards non-value-adding activities during the construction process. MATEC Web Conf. 2016, 66, 00015. [Google Scholar] [CrossRef]


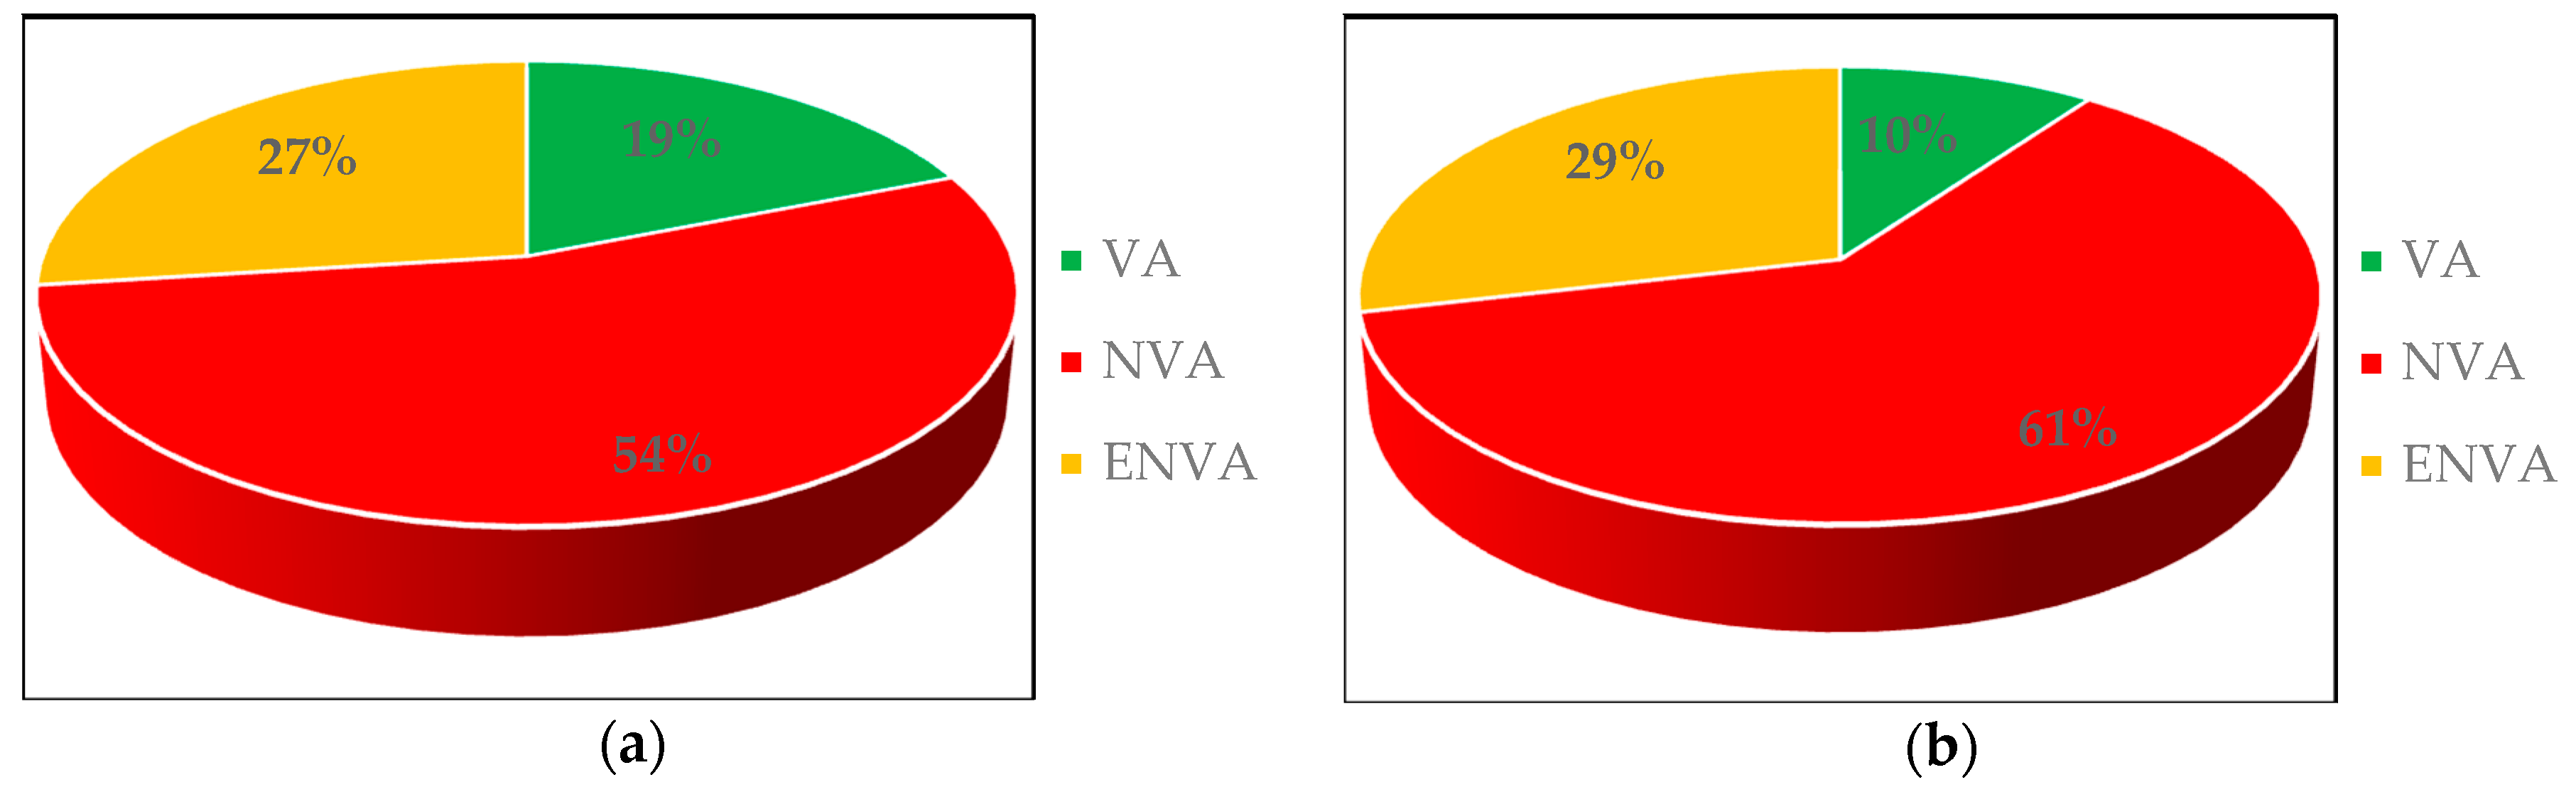
| No. | Detail of Work | Classification | Duration (s) | % Of Total Time |
|---|---|---|---|---|
| 1 | Lowering the crane boom | VA | 22.5 | 15 |
| 2 | Waiting while person 2 was walking | NVA | 6 | 4 |
| 3 | Waiting while person 2 and 3 were fixing the slab to slings | NVA | 17 | 11 |
| 4 | Lifting the crane boom | ENVA | 14.5 | 10 |
| 5 | Turning the crane boom | ENVA | 16 | 11 |
| 6 | Lowering the crane boom closer to the installation site | ENVA | 10 | 7 |
| 7 | Waiting while person 2 and 3 were laying the mortar | NVA | 26 | 17 |
| 8 | Waiting while person 2 and 3 were walking | NVA | 17 | 11 |
| 9 | Lowering the crane boom to the installation site | VA | 6 | 4 |
| 10 | Waiting while person 2 and 3 were positioning the slab | NVA | 10 | 7 |
| 11 | Waiting while person 2 and 3 were installing the floor slab | NVA | 5 | 3 |
| Total | 150 | 100 | ||
| No. | Detail of Work | Classification | Duration (s) | % Of Total Time |
|---|---|---|---|---|
| 1 | Waiting while person 1 was lowering the crane boom | NVA | 22.5 | 15 |
| 2 | Unnecessary walking | NVA | 6 | 4 |
| 3 | Fixing the slab to slings | ENVA | 17 | 11 |
| 4 | Waiting while person 1 was lifting the crane boom | NVA | 14.5 | 10 |
| 5 | Waiting while person 1 was turning the crane boom | NVA | 16 | 11 |
| 6 | Waiting while person 1 was lowering the crane boom closer to the installation site | NVA | 10 | 7 |
| 7 | Laying of mortar | ENVA | 26 | 17 |
| 8 | Unnecessary walking | NVA | 17 | 11 |
| 9 | Waiting while person 1 was lowering the crane boom to the installation site | NVA | 6 | 4 |
| 10 | Positioning of the slab | VA | 10 | 7 |
| 11 | Installation of the floor slab | VA | 5 | 3 |
| Total | 150 | 100 | ||
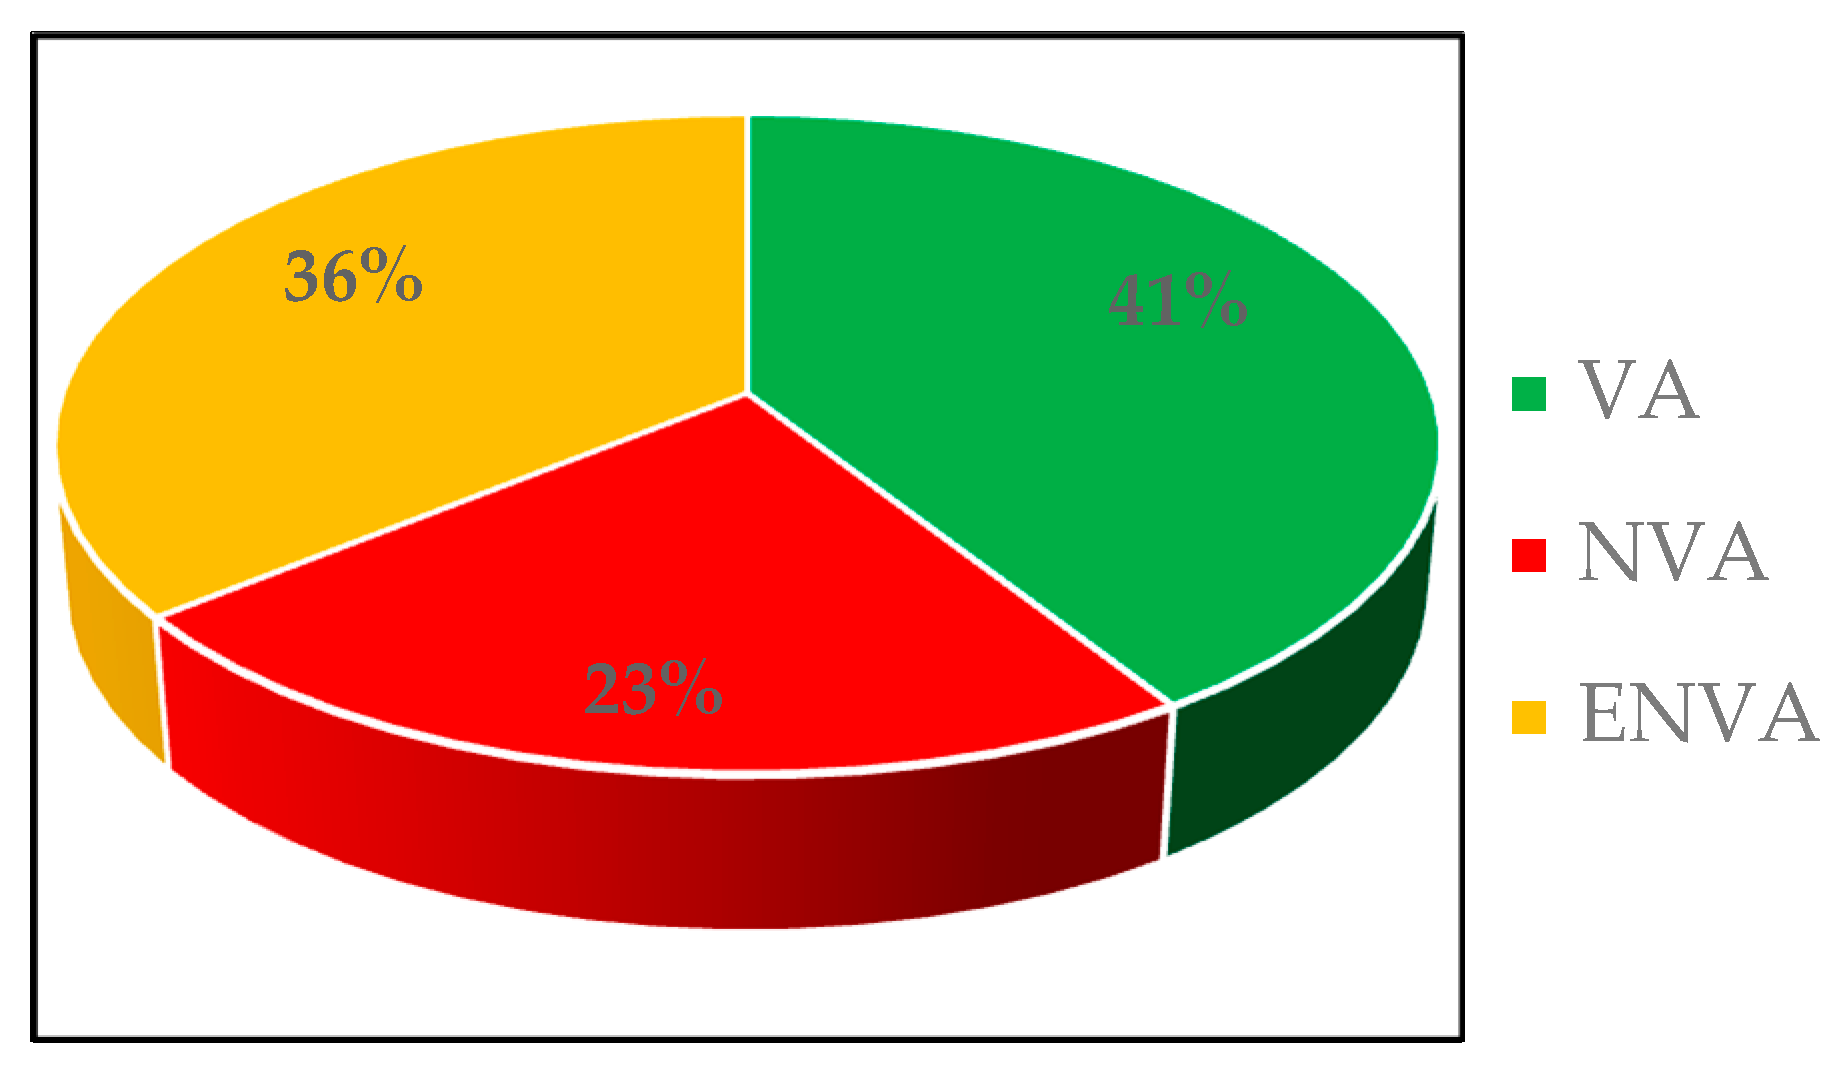
| No. | Detail of Work | Classification | Duration (s) | % Of Total Time |
|---|---|---|---|---|
| 1 | Searching for tools (pen and measuring tape) | NVA | 5 | 2 |
| 2 | Measuring the required size | ENVA | 14 | 6 |
| 3 | Marking the required size | ENVA | 18 | 7 |
| 4 | Cutting the required size | VA | 57 | 22 |
| 5 | Marking of openings | ENVA | 15 | 6 |
| 6 | Cutting of openings | VA | 47 | 19 |
| 7 | Grinding | ENVA | 20 | 8 |
| 8 | Transportation of tile | NVA | 26 | 10 |
| 9 | Discussion of work | ENVA | 24 | 9 |
| 10 | Unnecessary taking, waiting, and smoking | NVA | 28 | 11 |
| Total | 254 | 100 | ||
| Waste Type | RII | Ranking |
|---|---|---|
| Waiting | 3.71 | 1 |
| Defects | 3.61 | 2 |
| Motion | 3.54 | 3 |
| Transportation | 3.04 | 4 |
| Over-processing | 2.93 | 5.5 |
| Overproduction | 2.93 | 5.5 |
| Inventory | 2.79 | 7 |
| Type of Wasteful Activity | Activity Description |
|---|---|
| Motion | Walking to bring a block Walking to bring a leveling tool Walking to bring a perforator Walking to bring a bracket Walking to bring a key Unnecessary walking |
| Defects | Not observed |
| Transportation | Transportation of a tile |
| Inventory | Too much tools and materials Searching for tools (pen and measuring tape) |
| Over-processing | Painting second time |
| Overproduction | Not observed |
| Waiting | Waiting while person 2 was walking Waiting while person 2 and 3 were fixing the slab to slings Waiting while person 2 and 3 were laying the mortar Waiting while person 2 and 3 were walking Waiting while person 2 and 3 were positioning the slab Waiting while person 2 and 3 were installing the floor slab Waiting while person 1 was lowering the crane boom Waiting while person 1 was turning the crane boom Waiting while person 1 was lowering the crane boom closer to the installation site Waiting while person 1 was lowering the crane boom to the installation site |
| Motion | Transportation | Inventory | Over-Processing | Waiting | Preparation | Breaks | |
|---|---|---|---|---|---|---|---|
| Value Stream Mapping | √ | √ | √ | √ | √ | √ | √ |
| Increased Visualization | √ | √ | √ | √ | √ | √ | |
| 5S | √ | √ | √ | √ | √ | √ | |
| Last Planner System | √ | √ | √ | √ | √ | √ | √ |
| Lean Tools | RII | Ranking |
|---|---|---|
| Value Stream Mapping | 3.79 | 2.5 |
| Increased Visualization | 3.79 | 2.5 |
| 5S | 4.04 | 1 |
| Last Planner System | 3.71 | 4 |
© 2019 by the authors. Licensee MDPI, Basel, Switzerland. This article is an open access article distributed under the terms and conditions of the Creative Commons Attribution (CC BY) license (http://creativecommons.org/licenses/by/4.0/).
Share and Cite
Hossain, M.A.; Bissenova, A.; Kim, J.R. Investigation of Wasteful Activities Using Lean Methodology: In Perspective of Kazakhstan’s Construction Industry. Buildings 2019, 9, 113. https://doi.org/10.3390/buildings9050113
Hossain MA, Bissenova A, Kim JR. Investigation of Wasteful Activities Using Lean Methodology: In Perspective of Kazakhstan’s Construction Industry. Buildings. 2019; 9(5):113. https://doi.org/10.3390/buildings9050113
Chicago/Turabian StyleHossain, Md Aslam, Assel Bissenova, and Jong Ryeol Kim. 2019. "Investigation of Wasteful Activities Using Lean Methodology: In Perspective of Kazakhstan’s Construction Industry" Buildings 9, no. 5: 113. https://doi.org/10.3390/buildings9050113
APA StyleHossain, M. A., Bissenova, A., & Kim, J. R. (2019). Investigation of Wasteful Activities Using Lean Methodology: In Perspective of Kazakhstan’s Construction Industry. Buildings, 9(5), 113. https://doi.org/10.3390/buildings9050113