Article

Optimization of the Supplier Selection Process in Prefabrication Using BIM

1
College of Architecture and Civil Engineering, Beijing University of Technology, Beijing 100124, China
2
Faculty of Society and Design, Bond University, Gold Coast, QLD 4226, Australia
*
Author to whom correspondence should be addressed.
Buildings 2019, 9(10), 222; https://doi.org/10.3390/buildings9100222
Submission received: 22 June 2019 / Revised: 11 September 2019 / Accepted: 30 September 2019 / Published: 21 October 2019

Abstract

:
Prefabrication offers substantial benefits including reduction in construction waste, material waste, energy use, labor demands, and delivery time, and an improvement in project constructability and cost certainty. As the material cost accounts for nearly 70% of the total cost of the prefabrication project, to select a suitable material supplier plays an important role in such a project. The purpose of this study is to present a method for supporting supplier selection of a prefabrication project. The proposed method consists of three parts. First, a list of assessment criteria was established to evaluate the suitability of supplier alternatives. Second, Building Information Modelling (BIM) was adopted to provide sufficient information about the project requirements and suppliers’ profiles, which facilitates the storage and sharing of information. Finally, the Analytic Hierarchy Process (AHP) was used to rank the importance of the assessment criteria and obtain the score of supplier alternatives. The suppliers were ranked based on the total scores. To illustrate how to use the proposed method, it was applied to a real prefabrication project. The proposed method facilitates the supplier selection process by providing sufficient information in an effective way and by improving the understanding of the project requirements.

1. Introduction

Concern over the impact of construction projects on building environments is increasing [1,2,3,4]. Conventional approaches of design, construction, operation and demolition for building projects result in large amounts of energy consumption and construction wastes. The Architecture, Engineering, and Construction (AEC) industry needs to improve sustainable development in construction [5,6]. In order to meet the increased demands of sustainable development, new processes and technologies have been introduced [7,8,9]. Among these, prefabrication construction is emerging. Several studies stated that prefabrication can greatly reduce construction waste [10,11,12], greatly decrease energy consumption [13] and CO2 emission [14,15,16,17]. Compared to conventional building technologies, prefabrication can bring numerous benefits such as lower cost, higher construction speed, reduced dependency on labor, increased productivity, improved quality and safety, and greater control over the construction process [18,19,20,21,22,23]. Given these advantages, prefabrication construction has been highly regarded by the global construction industry for 40 years [24]. In China, this technique has attracted wide public attention and has been supported by the “Made in China 2025” policy [25]. In view of prefabrication’s great benefits, industry decision-makers have become even more interested in increasing its practical implementation [26]. Prior to making the decision, however, many aspects of prefabrication need to be thoroughly examined. The unique nature of prefabrication components requires effective management throughout the whole supply chain. Meanwhile, according to the findings of [27], the prefabrication supply chain is frequently impacted by many risks that impede the adoption of this technology. Supply chain management is complex because of the particular context of temporary multiple organizations [28], the difficulties in managing the networks of numerous different firms that provide materials and multiple services [29,30], and the challenges of relationship management [31]. Although many factors are involved, the challenge is still at risk from improper supplier selection [32]. According to [33], among the 21 barriers to employment of prefabrication, poor integration in the supply chain is second on the list. The selection of a supplier has a direct impact on the performance of a prefabrication project because the purchase of prefabricated products accounts for nearly 70% of the total project cost [34]. Project goals cannot be fully achieved without relying on reliable suppliers working on the project [35]. Therefore, the selection of a suitable supplier is an important step in strengthening the application of prefabrication.
Supplier selection is not a punctual act; it is usually a multi-faceted process. Various factors are critical to assess available suppliers [36]. If a supply alternative is the best option compared with all other alternatives, then the selection is straightforward. This is rarely the case, however, and a number of potential suppliers usually exist whose relative performance may vary considerably against different criteria. The old-style business norm that uses a single, simple criterion for competitive bidding is difficult to apply in this increasingly complex environment. Moreover, during the decision-making process, the experts are usually requested to provide their opinion based on unsorted information on a tight schedule. The selection process largely relies on experience and subjectivity of the participants. A method that can provide effective information and a comprehensive analysis of potential suppliers is required in order to improve the efficiency of the selection process. In this study, BIM was used to support supplier selection of a prefabrication project. The proposed method used BIM to sort and categorize information and vividly present the project purpose, which facilitates the decision-making process.
The proposed method mainly includes three parts. First, assessment criteria for evaluating supplier alternatives should be established. It is challenging to convert the requirements into useful criteria because they are usually expressed as qualitative concepts, while criteria are supposed to be quantitatively evaluated. In this study, a set of criteria is developed based on literature review and experts’ opinion. Moreover, a BIM model of a prefabrication project is developed due to its strength in modeling and visualization [37]. Information plays an important role in decision-making, and poor quality information inevitably results in poor decision-making [38]. The developed BIM model stores data and information to form the basis for decision-making and helps decision-makers examine various complexities and uncertainties. The current study uses BIM model to evaluate the capability of suppliers, which improves optimization, automation and simplification of the supplier selection process for prefabrication. Then, an opinion survey is conducted among project experts to rank the importance of the criteria and score the potential suppliers against the criteria using Analytic Hierarchy Process (AHP) technique.
This paper is organized as follows. The following section is the literature review. The third section presents the proposed method for supplier selection. In the fourth section, the proposed method is illustrated using a real prefabrication project case. The fifth section provides the results and discussion. The study then concludes with the findings, contributions and practical implications.

2. Literature Review

2.1. BIM in Prefabrication

Building Information Modelling (BIM) can facilitate prefabrication in many ways [39]. BIM can provide the quantity of material and specify material requirements, which improves ordering efficiency and thus decreases construction waste. Also, BIM can provide a 3D model to help users better understand the project. The wealth of project information stored in BIM facilitates communication among designers, contractors, manufacturers and clients [40]. This section introduces a review of BIM adopted in prefabrication. [41] explains how BIM can be used in a prefabrication house at different stages of the construction life cycle. [42] illustrated how BIM can be used to guide the installation of the PC components for developing a building. [43] indicated that the process of incorporating prefabrication and collaboration during the early stage of design is more effective with the adoption of BIM. [44] addressed that the use of BIM in off-site manufacturing can increase productivity and reduce delay problems in construction. Similarly, [45] stated that the application of BIM can increase efficiency at both the design and construction stages by reducing man hours, decreasing rework and delivery delays, and promoting effective communication. Although several studies have been performed in this area, there is no studies about the application of BIM in selection of suppliers for prefabrication components. In this study BIM is used to assist this decision-making process by aggregating the necessary information and clarifying details.

2.2. Methods in Multiple-Criteria Decision-Making for Supplier Selection

Supplier selection is one of the most essential decision-making issues in supply chain management [46]. Several studies have been conducted to evaluate the capabilities of the suppliers in the construction industry using different methods. For example, [47] developed a multi-criteria utility theory model to select an optimal sub-contractor for a construction project. In [48], the study applied a simple additive weighting model to generate scores for each assessed supplier. In [49], the study addressed the benefits of fuzzy principal component analysis because it avoids multicollinearity among the criteria and eliminates errors of subjective weighting. In [50], the study decided to evaluate suppliers using Technique for Order Preference by Similarity to Ideal Solution (TOPSIS) in their integrated model for construction material management due to its computational simplicity, applicability in multicriteria analysis, and long tradition of adoption in construction-related decision-making. In [51], the study used AHP weight assessment criteria to rank the supplier alternatives. [52] used a simple multi-attribute rating technique and compromise ranking method for contractor selection. [53] employed evidential reasoning for prequalifying construction contractors. [54] utilized the fuzzy set theory for contractor selection. [55] suggested that the methods can deal with multiple quantitative and qualitative factors including the Analytic Hierarchy Process (AHP), the Analytic Network Process (ANP), Case-Based Reasoning (CBR), Data Envelopment Analysis (DEA) and Genetic Algorithms (GA). Some studies also suggested the artificial intelligence methods such as case-based reasoning [56] and artificial neutral networks [57]. Although many techniques available, AHP is used in this study since its advantages in dealing with both quantitative and qualitative criteria [58] and its hierarchy structure consisting of goal, criteria, and sub-criteria [59].

2.3. Supplier Selection Criteria

The selection process requires the evaluation of potential suppliers based on different criteria [60]. Supplier selection is a multi-criteria decision-making issue which includes both qualitative and quantitative criteria [61]. There are many previous studies focusing on supplier selection criteria [46]. Appropriate selection criteria plays an important role in the supplier selection process [50]; therefore, selection criteria should be carefully investigated and involved in the selection process, and the weights of the criteria should be provided by industry professionals. For many years, cost was the only criterion for choosing a supplier. Recently, only concern of cost is not adequate to select an optimum supplier. The criteria for the selection process should consists of cost, quality, delivery performance and supplier capability [46]. According to [62], cost considered as the only criterion is not well-organized; a comprehensive multi-criteria method is required. As [62] stated, the adoption of multiple criteria can represent the diversification of the client’s total requirements and foster competitiveness among potential suppliers. Based on the findings of [63,64,65,66,67], quality, delivery, and product performance are the three most important criteria. [63,67,68,69,70] pointed out the desired attributes that suppliers are expected to fulfill, such as technological capability, financial health, and good services. According to [71], to select a suitable supplier, a comprehensive assessment of technical, quality, financial, logistical and legal aspects is required. As well, [72] addressed that quality, cost and delivery are the three most common evaluation criteria after a thorough review of existing literature on supplier selection. The study also provided a list of evaluation criteria for supplier selection, which includes production capability and flexibility, information and communication systems, innovation and R and D, technical capabilities and support, and financial status. Based on the findings of [73], some factors, such as quality systems, performance history, reputation and reference, amount of past business, the packing and handling process, geological location, procedure compliance, warranties and claim policies, and attitude and strategic fit are identified to be used as assessment criteria.

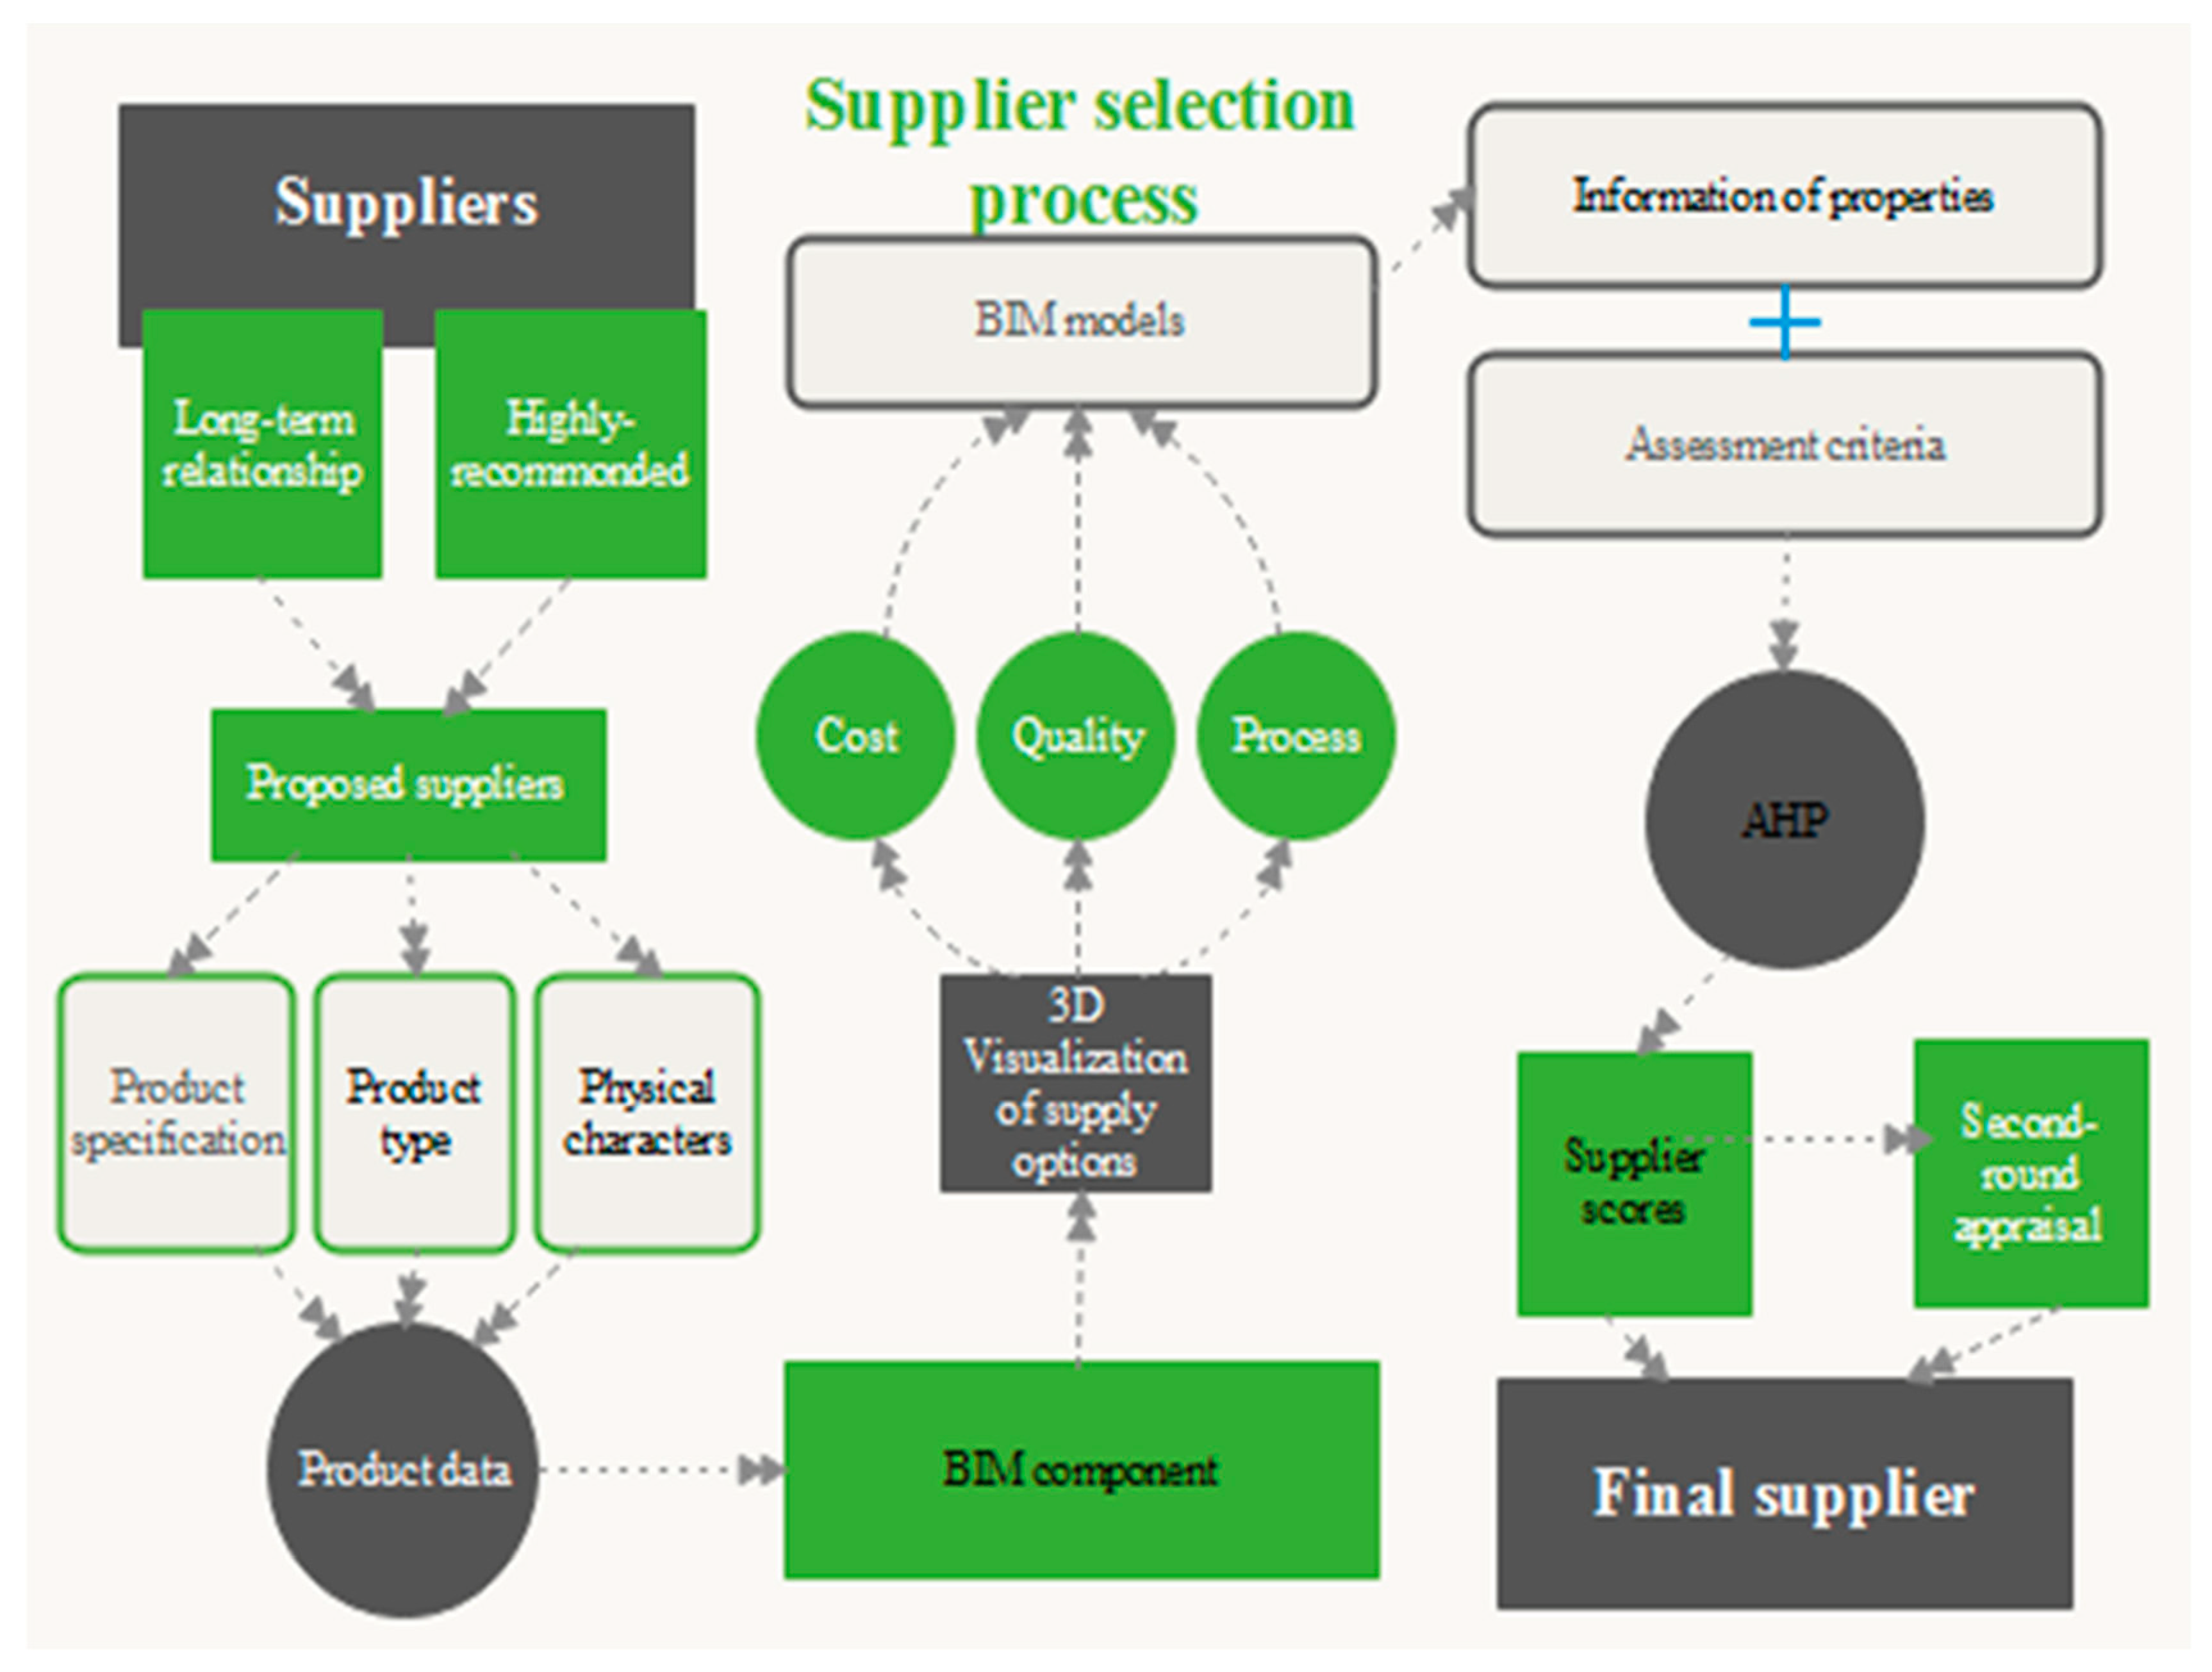
3. The Proposed Method

The proposed BIM-aid assessment process for material supplier selection consists of three phases. The assessment criteria for evaluating suppliers were obtained based on the literature review and opinions of experts. The next step is to collect all the required information to develop a BIM model of a prefabrication project. The bid information, including the type, unit price and specifications, should be collected and categorized in Revit library. An opinion survey is then conducted among industry experts, AHP technique is used to rank the weights of the criteria. Then the pair-wise comparison for supplier alternatives with regarded to each criterion is carried out by the experts. The total score of a supplier can be obtained by sum up the scores of the supplier on each criterion. Then, the supplier alternatives can be ranked based on their total score. The assessment process by using the proposed method is shown in Figure 1.

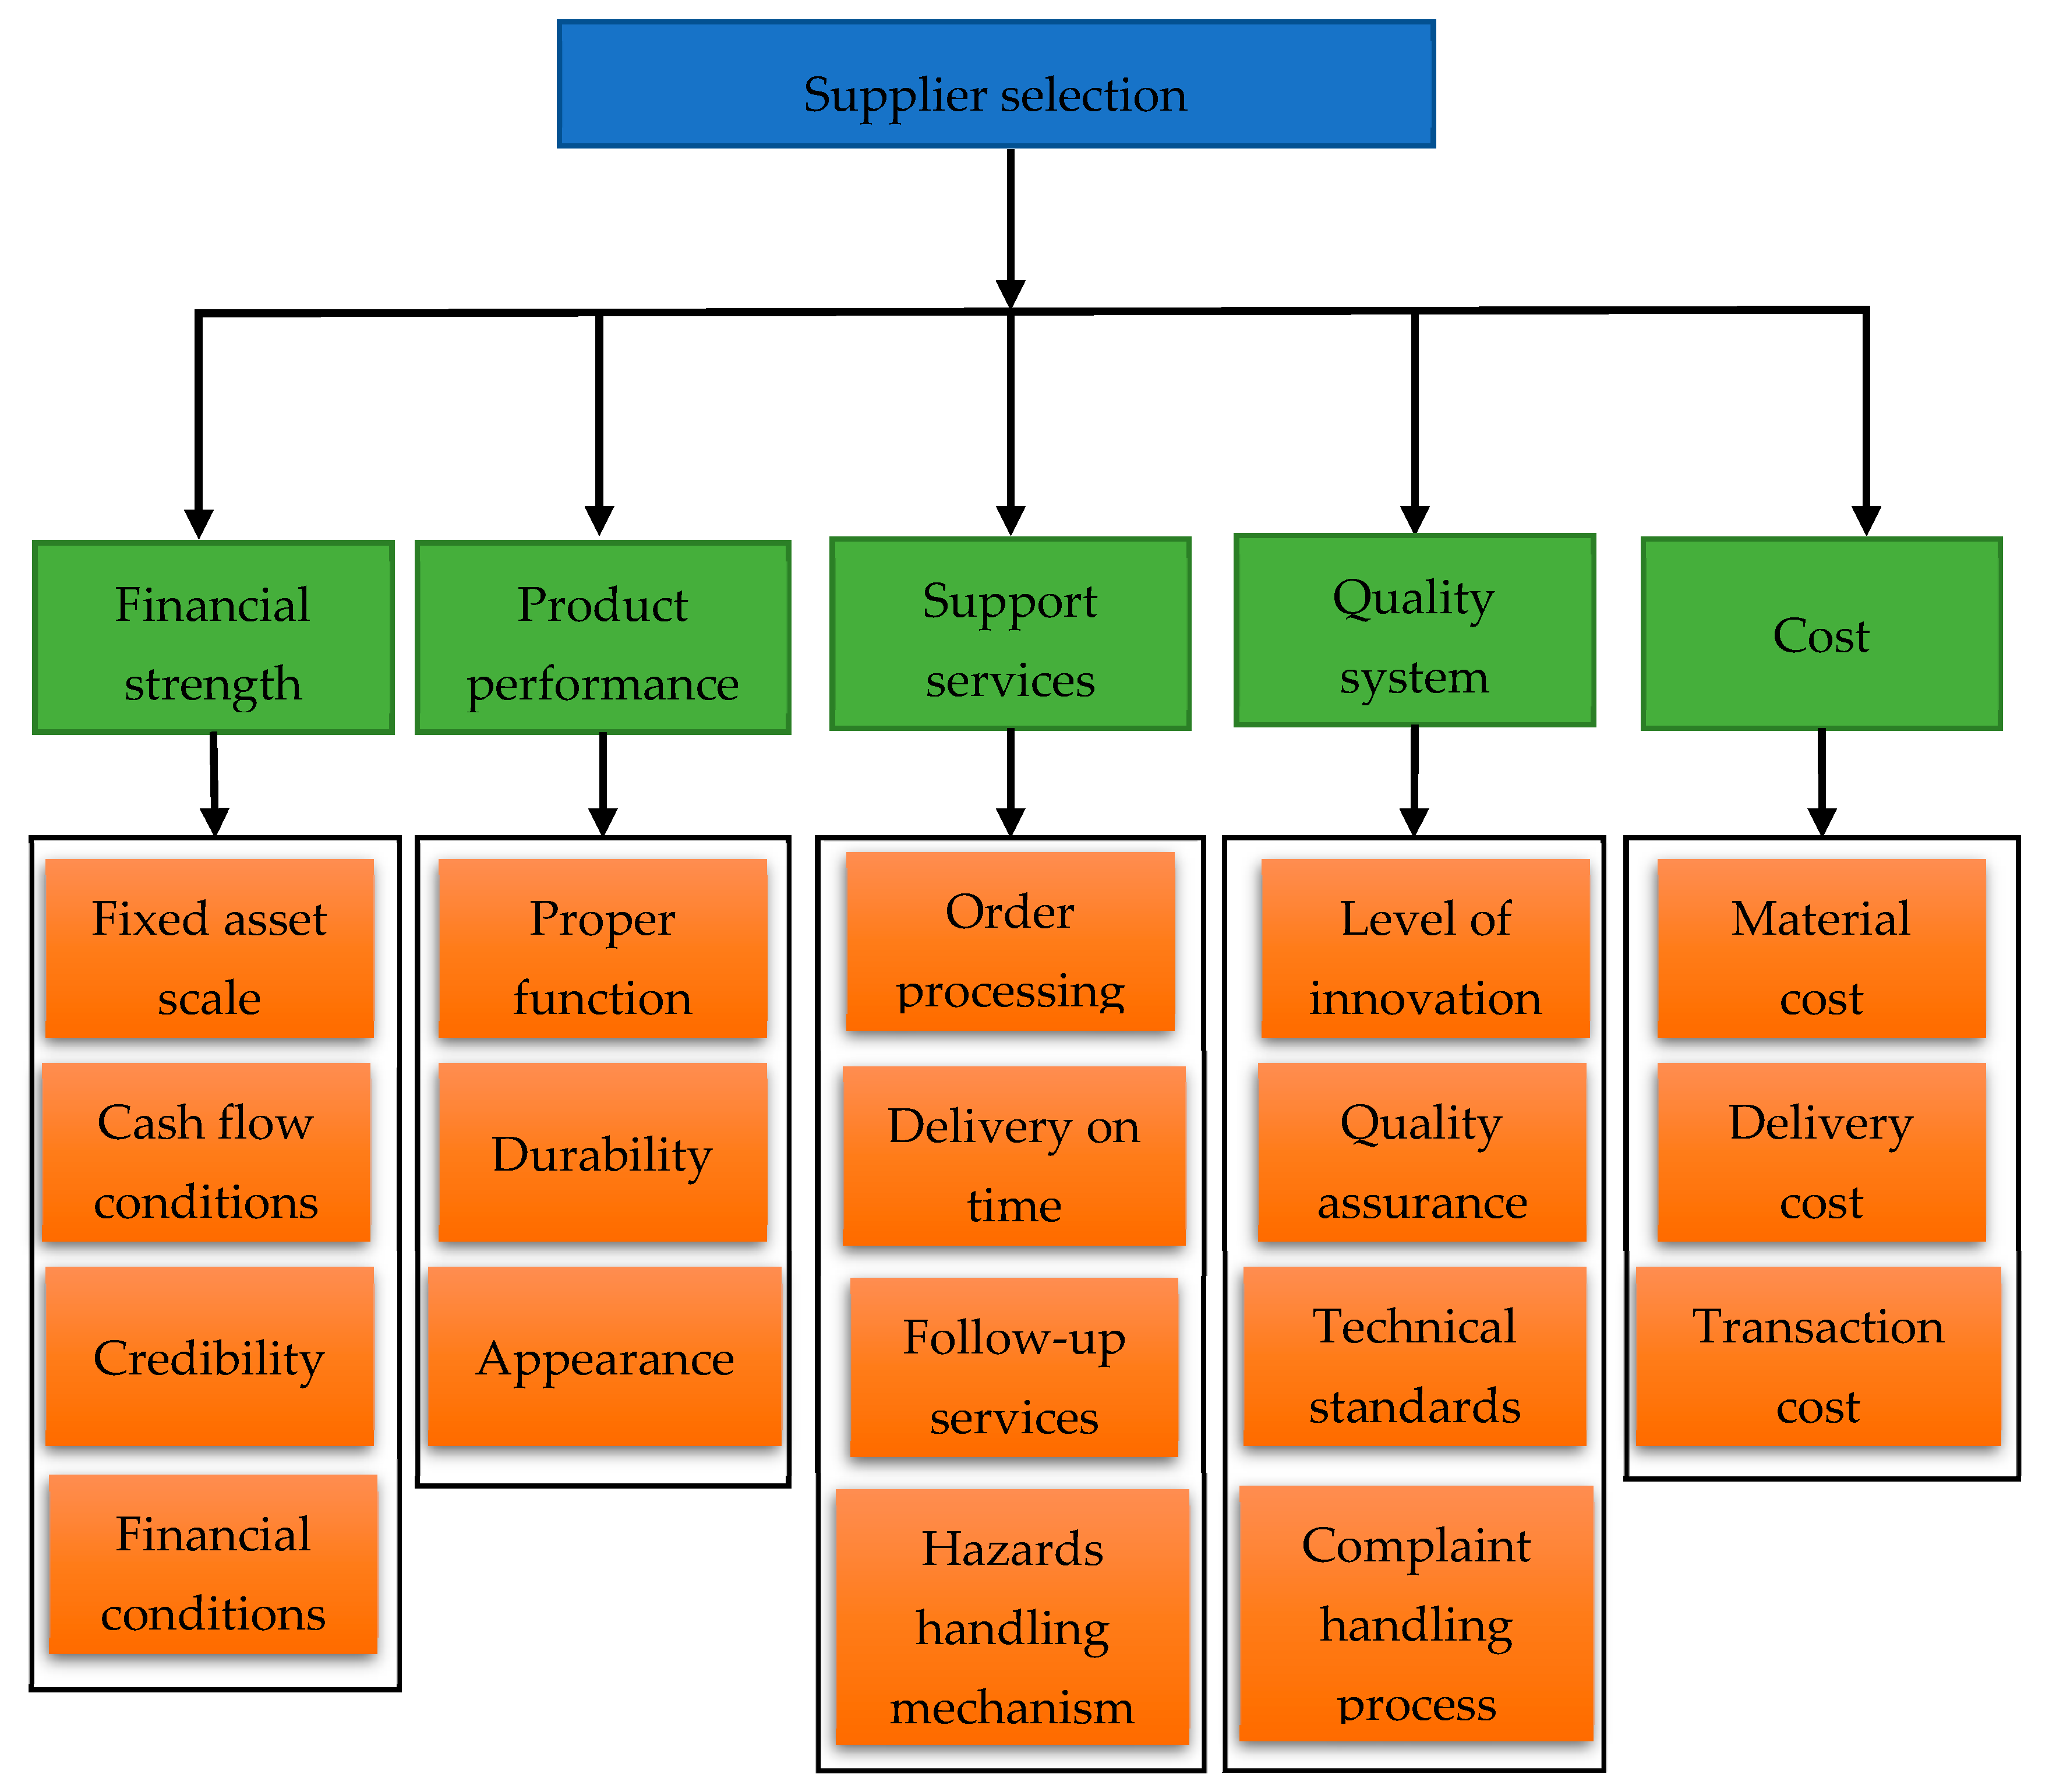
3.1. Assessment Criteria

The function of the criteria assessment is to stipulate the selection criteria for evaluating supplier alternatives and assign importance weights associated with each criterion based on project requirements and the client’s preferences. Moreover, professional insights from project participants, such as architects, engineers and contractors, should be accommodated into the criteria and selection process. Therefore, the assessment criteria are important because they can help decision-makers to identify potential requirements of the project. In this study, the assessment criteria were sourced from existing literature, and they were refined and categorized by academic and industry experts.
For applicable purpose, each criterion needs to be broken down into its sub-criteria to better define the requirements. The criteria for the supplier selection are shown in Figure 2. As shown in Figure 2, there are five criteria: Financial strength, product performance, support services, quality system, and cost. Financial status [72,74,75] is determined by fixed asset scale, cash flow conditions, credibility, and financial conditions. Proper function, durability, and appearance provide a measure of product performance [76,77,78]. Similarly, order processing, delivery on time [74,79], follow-up service [77,80,81], and hazards handling mechanism [72,74,82] are the sub-criteria to decide support services. Quality system is determined by the level of innovation [72,74], quality assurance [76,77,78], technical standards [83,84], quality standards, and complaint handling procedures [82]. Finally, the cost is composed of material price [79,81,82,85], delivery price [72], and transaction cost [72,74,86].

3.2. BIM Model

BIM can represent the physical and function features of a facility in a digital format, which consists of geometric and semantic information [87]. While geometric information can provide a quantity of objects, semantic information can offer information about the material. A BIM model provides a 3D vivid model of the project and clarifies project details, which enables users to better understand the project. Each prefabrication component can be easily identified in a BIM model, and the material type, dimensions and specifications can all be obtained. BIM can develop a project in a virtual environment prior to the project being constructed in reality, which helps in making informed decisions. A 3D model can present the faults to help users identify the errors and thus alleviate cost-related risks at the construction stage.
BIM can fully support the assessment of cost criterion. The quantities of material can be extracted from BIM using Revit Navisworks, and with this information, cost criterion is assessed. The total cost of the material can be obtained based on the quantity of material and unit price from bid information. Google Maps can also be used to assess the delivery distances. For this, the construction site and manufacturing plants can be linked in Google Maps using an address or postal code. Hence, the delivery cost can be obtained based on the transport distance derived from Google Maps. The transaction cost is usually calculated as percentage of the material cost. In the second assessment phase, the external quantitative or qualitative data can be incorporated into the Revit library by using direct links or Industry Foundation Classes (IFC) schema for evaluating qualitative criteria. Direct links and IFC schema are used to facilitate data interoperability during the assessment process.

3.3. Analytic Hierarchy Process (AHP)
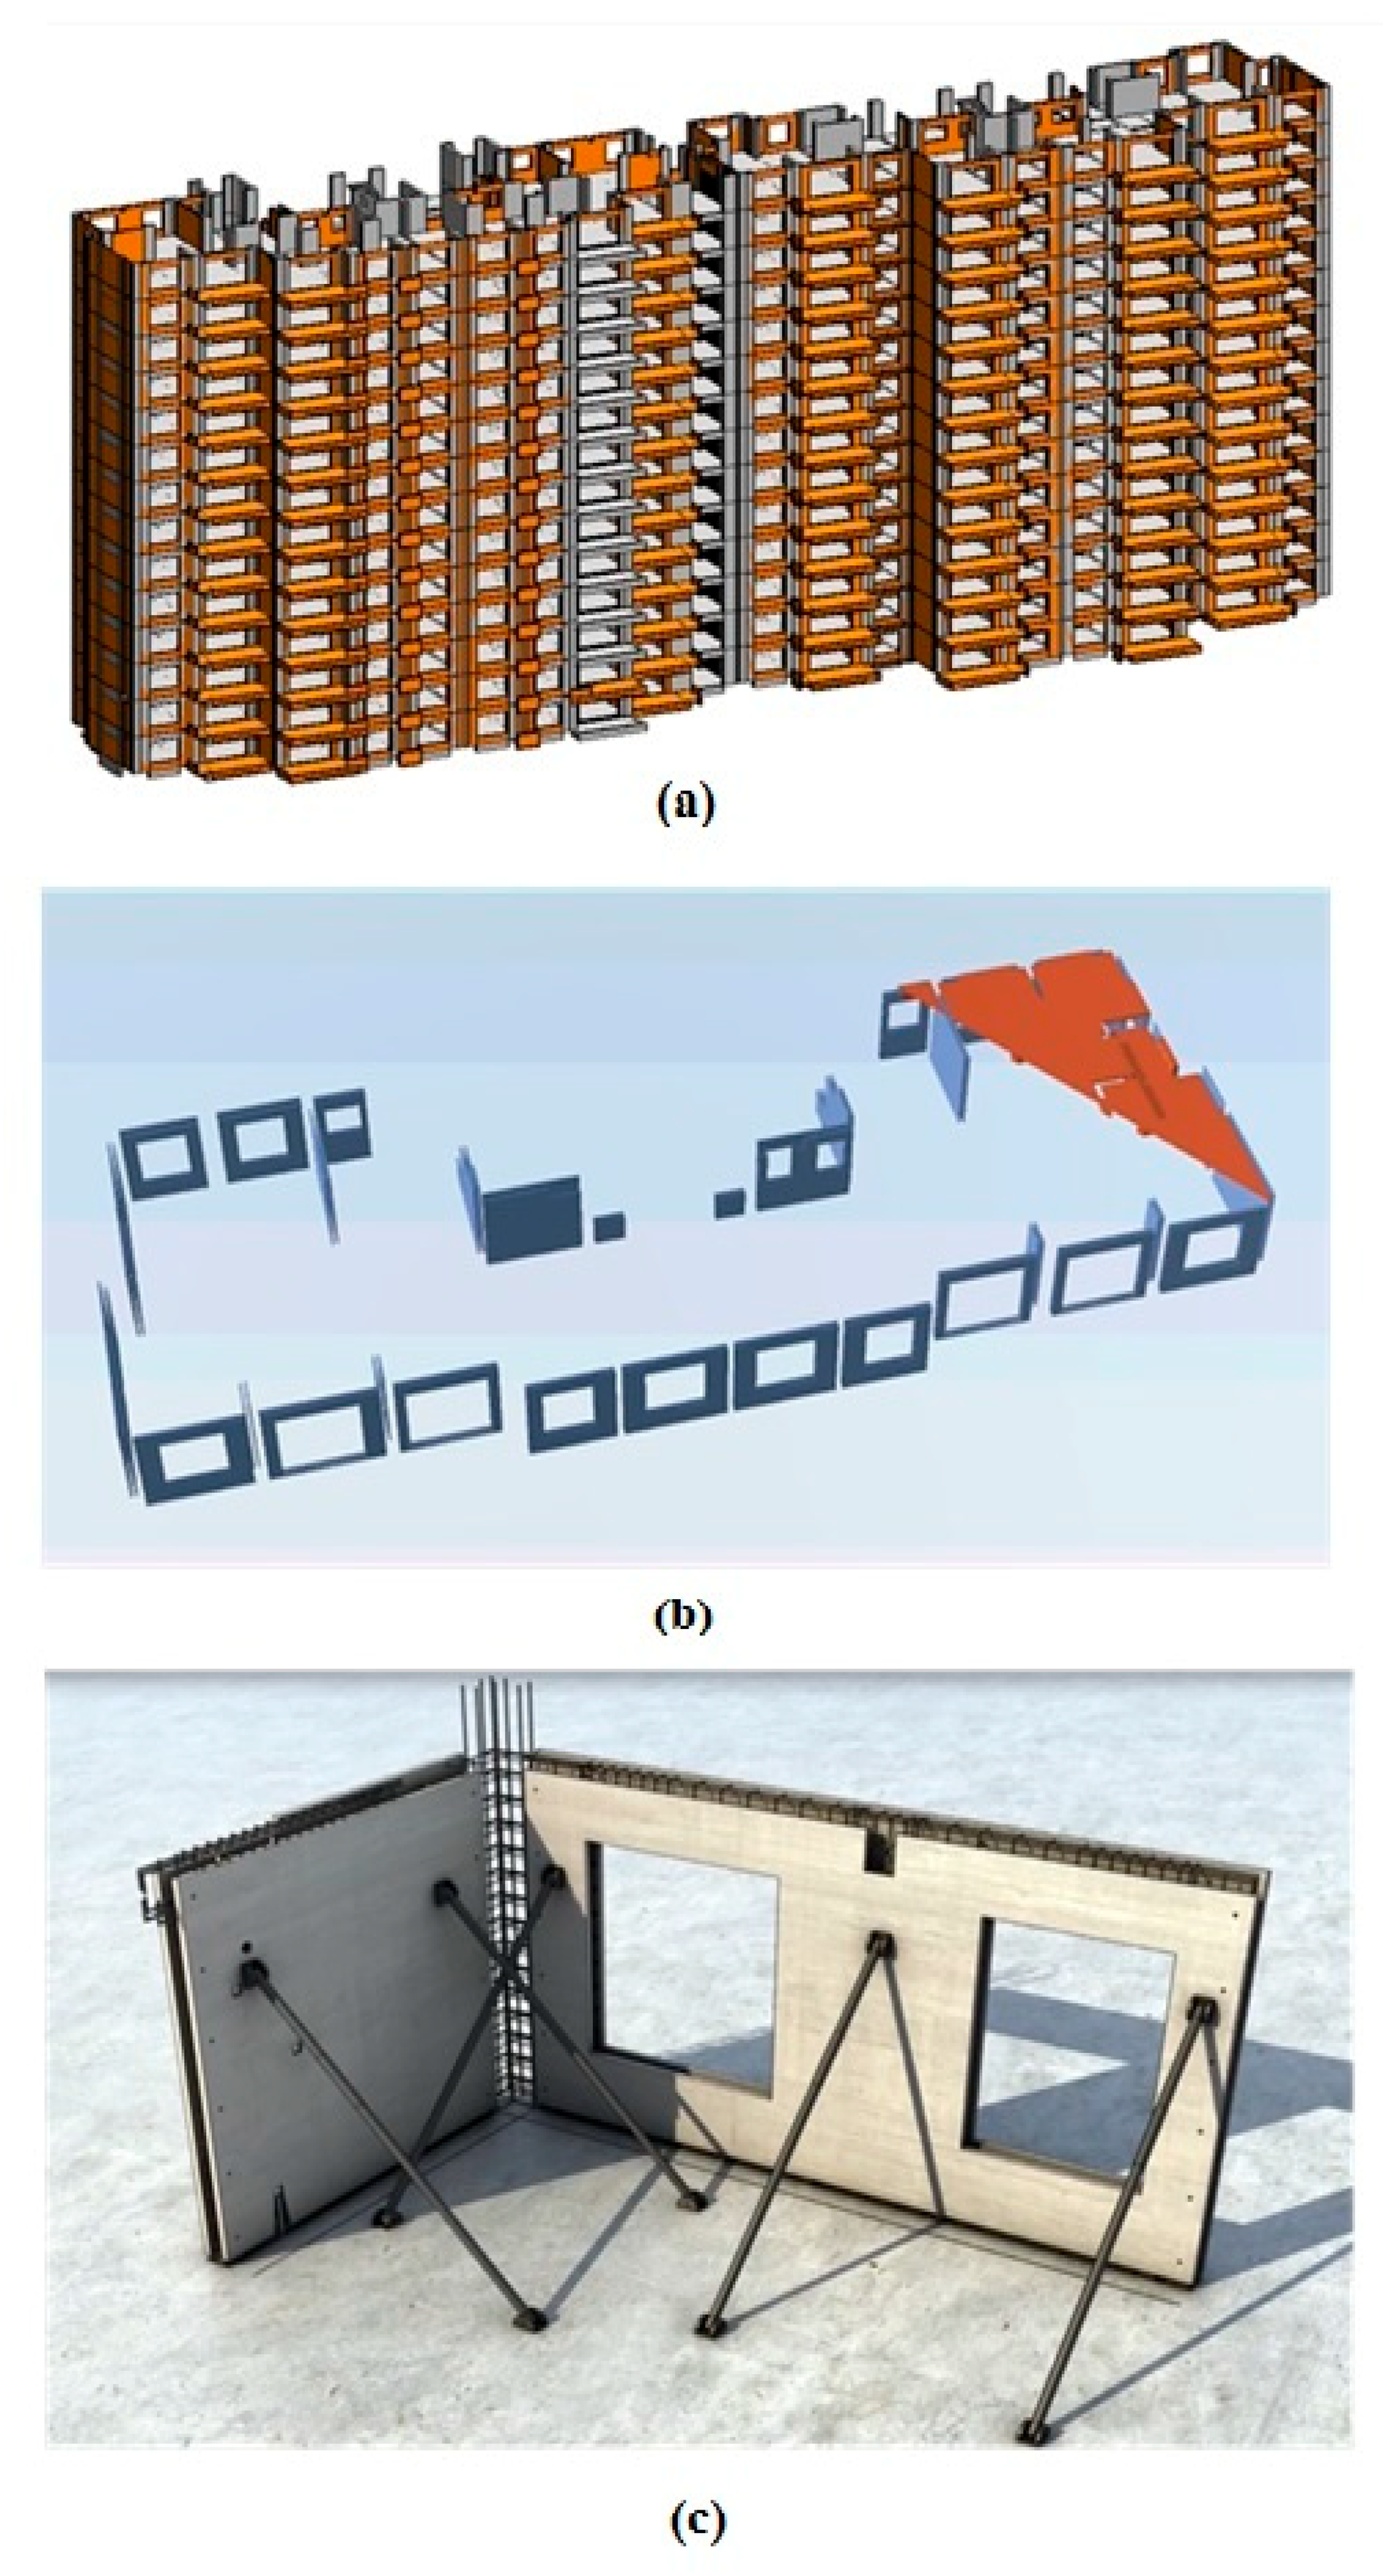
First introduced by [88], the Analytic Hierarchy Process (AHP) is one of methods that are usually used in the multi-criteria decision-making process to handle resource allocation and planning for the military. It has been widely used in decision analysis in many fields, including management, real estate, sociology, economics and business [89]. The AHP enables a model of a complex problem in a hierarchy structure developing relationships of the goals, criteria, sub-criteria and alternatives [90]. AHP was used in this study to obtain the importance weights of the assessment criteria and the scores of supplier alternatives.
First, a pair-wise comparison matrix was built to assess the relative importance of the sub-criteria based on their importance for supplier selection. A higher weight value indicates a greater importance, and a lower weight value indicates lesser importance. The importance of the criteria can be obtained. The importance of each criterion was ranked by the selected key project professionals. The opinions of the participants were collected using a 1/5-to-5 scale, where 1/5 represents “extremely less important than” and 5 represents “extremely more important than.” The rank scales are shown in Table 1. The importance rank of the criteria may vary depending on the opinions of the project participants. Hence, the mean of the scales should be produced.
a i j = t = 1 n a i j t n
where n is the number of survey participants; a i j t indicates the assigned value by the t-th participant.
Then, a matrix of pairwise comparison of all criteria is generated.
( 1 a 12 a 13 a 1 m a 21 1 a 23 a 2 m a m 1 a m 2 a m 3 1 )
where m is the number of assessment criteria; and a i j indicates the relative importance of the i-th criteria to the j-th criteria. For example, a 12 is the relative importance of the first criteria to the second criteria. Also, a i j × a j i = 1 .
The relative importance of i-th criterion can be calculated in Equation (3).
R I i = j = 1 m a i j
where R I i   is relative importance of criterion i; m is the number of criteria.
The normalized relative importance was calculated using Equation (4).
N R I i = j = 1 m a i j i = 1 m j = 1 m a i j
To calculate the global importance of a criterion, the Equation (5) can be used.
G I k x = i = 1 k N R I i
where G I k x   indicates the global importance of the x-th criterion; k is the number of sub-criteria of the x-th criterion.
In the next step, a pair-wise comparison matrix was developed to assess the relative performance of a potential supplier to the other potential suppliers with regards to a criterion. The total number of the matrix depends on the number of criteria. The sum of the scores of the potential suppliers can be calculated. A pairwise comparison of the supplier alternative with regarded to each criterion can be conducted. The opinions of the participants were collecting using 1/5-5 scale (1/5 = extremely worse than, 1 = equally good to, 5 = extremely better than). The rank scales are shown in Table 2. A pairwise comparison of suppliers against the x-th criterion is shown in the matrix.
( 1 b 12 b 13 b 1 l b 21 1 b 23 b 2 l a l 1 a l 2 a l 3 1 )
b i j = t = 1 n b i j t n
where l is the number of potential suppliers; b i j indicates the relative performance of supplier i compared to j supplier j with regard to the x-th criterion; n is the number of survey participants, b i j t indicates the assigned score by the t-th participant. For example, b 12 indicates the relative performance of the first supplier compared to the second supplier. Also, b i j × b j i = 1 .
Then the relative performance of supplier i with regarded to the x-th criterion can be calculated in Equation (8).
R P i x = j = 1 m b i j
where R P i k is the relative performance of the supplier i on the x-th criterion.
Then, the score of the supplier i on the x-th criterion can be calculated in Equation (9).
S i k = G I k x × R P i x
where S i k indicate the score of the supplier i on the x-th criterion; G I k x is the global importance of the x-th criterion; R P i x is the relative performance of the supplier i on the x-th criterion.
The total score of the supplier i can be computed in Equation (10).
T S i = k = 1 p S i k
where p is the number of assessment criterion; T S i is the total score of the supplier i.

4. Case Study

4.1. Prefabrication Project Information

The proposed method is illustrated using a real prefabrication building project. The prefabrication project is a mixed-use apartment complex building, located in Beijing, China. This 17-story complex features spacious apartments above a ground floor retail space with a total floor area of 21,580 m2 designed for service life of 100 years. The total surface area of the prefabricated wall is approximately 11,180 m2. The BIM model for the project was developed, as shown in Figure 3. A typical prefabrication project may comprise a variety of components with different supply options. The prefabricated wall panel is a load bearing element of the building that serves the primary function of support and transfer the building load, which considerably impact the building performance. The construction of prefabricated wall panels is usually regarded as the most important part of the project, in which a finish-to-start relationship is applied to every building level; thus, any delay encountered may delay the completion of the project. The proposed method was used to select a suitable supplier of prefabricated wall panels.

4.2. Assessment Process

The importance weights about the criteria and the scores of the supplier alternatives were obtained based on an opinion survey using Analytic Hierarchy Process (AHP) technique. After previous evaluation of the supplier alternatives, four suppliers are considered qualified to be evaluated. The opinion survey was conducted among 28 key project professionals: two from the executive level, 16 from the management level, eight from contractors, one from the legal department, and one from marketing. This composition was determined by the involved professional have depth knowledge of project requirements as well as the familiarities to the potential suppliers. Twenty-eight survey participants were assembled in a conference room, and the BIM model was displayed on the big screen to help them thoroughly understand the project. Other information was also provided in order to evaluate qualitative criteria. The BIM model is like a data repository to store both quantitative and qualitative information about the project.

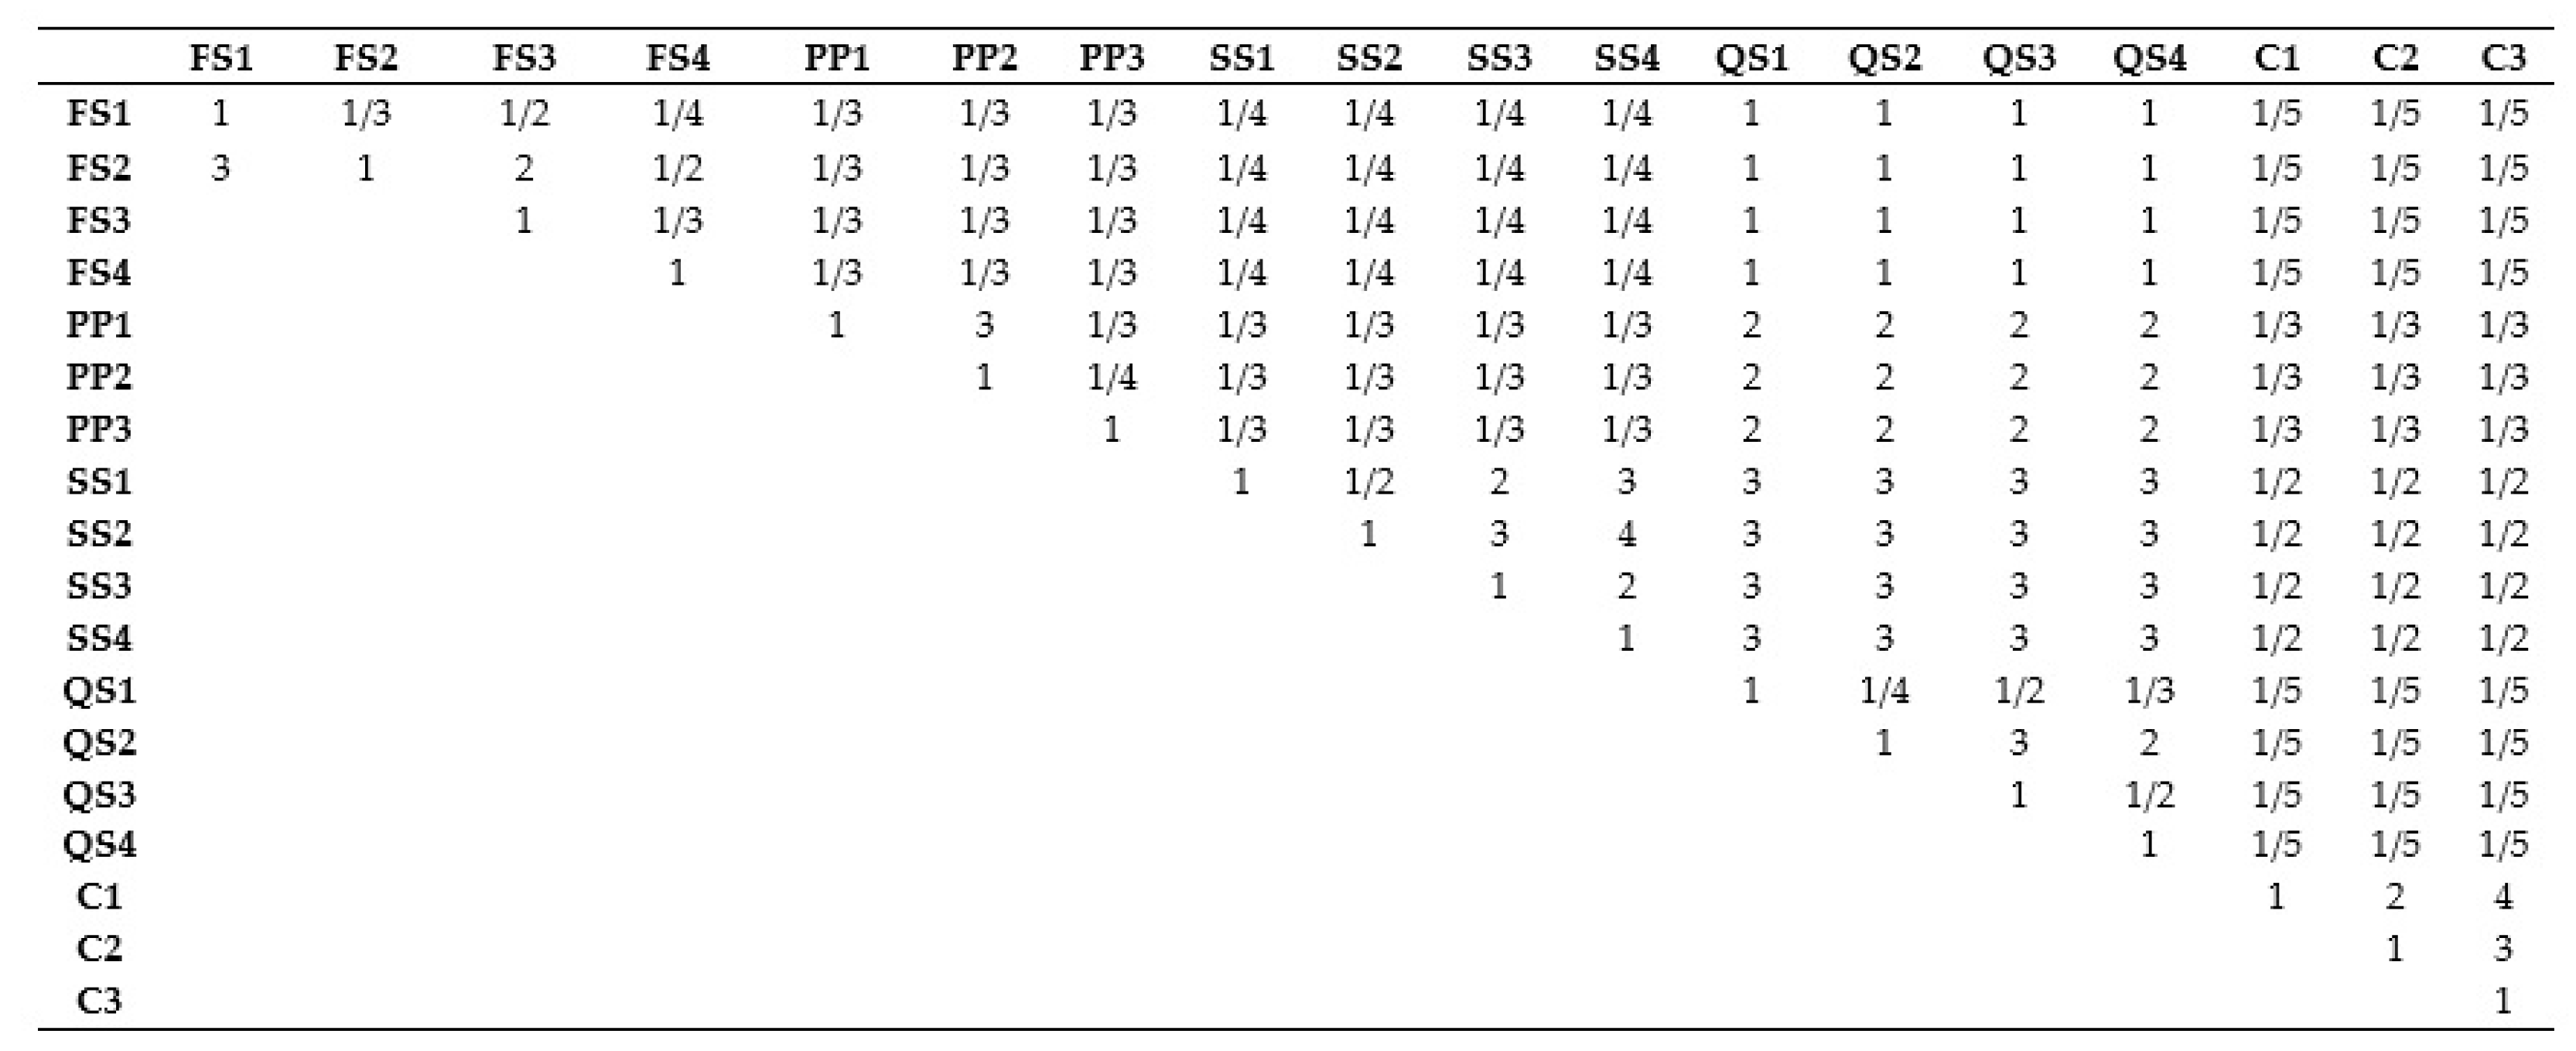
4.2.1. Important Weights of the Criteria

The experts were asked to rank the relative importance of the sub-criteria using scales (1/5 = extremely less important than, 1/4, 1/3, 1/2, 1 = equally important to, 2, 3, 4, 5 = extremely more important than) in order to calculate the importance weights of the criteria using the AHP technique. The pairwise competition for the sub-criteria is displayed in Figure 4. The relative importance of the sub-criteria can be obtained according to Equation (4), as shown in Table 3. Then the relative importance of the criteria can be obtained based on Equation (5), as shown in Table 4.

4.2.2. Cost Analysis

A BIM model can be developed based on 2D drawings. The CAD drawings were transferred into Revit to develop a 3D BIM model of the project which can provide sufficient and vivid information about the project. The industry professional can thoroughly understand the prefabrication project and information about the prefabrication components such as type, quantity, structural properties, dimensions and specifications. Then the required quantities of prefabrication components can be extracted using Navisworks. The product of the quantities of the prefabrication components and the unit prices of them sourced from bid information was obtained. The material costs of the prefabrication components of the four potential suppliers were obtained. The transportation distances between the construction site and the manufacturing plants of the four potential suppliers were then calculated using Google Maps. The delivery cost can be obtained based on the transportation distance, so the delivery costs of the four potential suppliers were obtained. The transaction cost can be calculated based on the sum of the material cost and delivery costs, which is usually 10% of the sum. Finally, the total costs of the four potential suppliers were obtained.
Supplier 1 and supplier 2 have relative lower material costs compared with supplier 3 and supplier 4. The material cost of supplier 2 is relatively higher than supplier 1, but the transportation distance of supplier 2 is shorter than supplier 1, so that the delivery cost is cheaper than that of supplier 1. The total cost of supplier 1 is still the lowest, while the total cost of supplier 4 is the highest. The total cost of supplier 3 and supplier 4 is higher than either supplier 1 or supplier 2. The survey participants were asked to rank the relative performance of one supplier to the other three suppliers with regard to cost criterion using scales (1/5 = extremely worse than, 1/4, 1/3, 1/2, 1 = equally good to, 2, 3, 4, 5 = extremely better than). The results are shown in Table 5. The scores of the four suppliers are different, as R P 1 1 = 12, R P 2 1 = 8.5, R P 3 1 = 2.08, and R P 4 1 = 3.45, respectively. Supplier 1 has the highest score on this criterion, while supplier 2 has the second highest score. Supplier 3 and supplier 4 have similar scores.

4.2.3. Financial Ability Evaluation

A comprehensive evaluation of the financial abilities of the suppliers was conduction in order to ascertain the suppliers have sound financial conditions. The selected suppliers have long-term relationships with the client. They all have sufficient cash flow to support their normal operations. Although some information is confidential, they can provide tax bills to show their financial conditions. Moreover, some experts also indicted that they have been operating their plants nearly 10 years. After the comprehensive evaluation, the survey participants were requested to rank the relative performance of one supplier to the other three suppliers with regarded to financial strength criterion using scales (1/5 = extremely worse than, 1/4, 1/3, 1/2, 1 = equally good to, 2, 3, 4, 5 = extremely better than). The results are shown in Table 6. The scores of the three suppliers on the financial strength criterion are same ( R P 1 2 = R P 3 2 = R P 4 2 = 3.5). While, supplier 2 gains a relative high score with R P 2 2 = 7 on this criterion.

4.2.4. Product Performance Evaluation

To evaluate the product performance criterion, the suppliers all declared that they can provide qualified products as the customers’ request them. Also, they are willing to provide a third-party report to prove the proper properties and durability of the prefabrication components. Additionally, they all agreed that if any faults of a product occur so that it is not approved to access the construction site, they can provide a new, qualified product promptly. Then, the survey participants were asked to rank the relative performance of one supplier to the other three suppliers with regard to product performance criterion using scales (1/5 = extremely worse than, 1/4, 1/3, 1/2, 1 = equally good to, 2, 3, 4, 5 = extremely better than). The results are shown in Table 7. The scores on this criterion supplier 1 and supplier 2 are similar, as R P 1 3 = 2.83 and R P 2 3 = 3. However, supplier 3 and supplier 4 have higher scores on this criterion with R P 3 3 = 8 and R P 4 3 = 7.

4.2.5. Support Service Assessment

In the support service criterion, the four suppliers provided satisfactory results since this concerns their reputation and value to customers. Suppliers 3 and 4 have a relatively shorter processing time period to deal with the order, while suppliers 1 and 2 may take longer. Moreover, the transportation distance of suppliers 3 and 4 are farther than suppliers 1 and 2, while supplier 2 has the shortest distance to the construction site. Also, traffic conditions of the transportation route from supplier 2 to the construction site is better than that of supplier 1. Comprehensively considering all the sub-criteria, the survey participants were asked to rank the relative performance of one supplier to the other three suppliers with regard to support services criterion using scales (1/5 = extremely worse than, 1/4, 1/3, 1/2, 1 = equally good to, 2, 3, 4, 5 = extremely better than). The results are shown in Table 8. The scores of the four suppliers are different, as R P 1 4 = 2.83, R P 2 4 = 9, R P 3 4 = 4.3, and R P 4 4 = 4, respectively. Supplier 2 has the highest score on this criterion, while supplier 1 has the lowest score. Supplier 3 and supplier 4 have similar scores.

4.2.6. Quality System Assessment

To evaluate the quality system of the four suppliers, they all can provide evidence to prove the quality of their products. They can provide evidence including production permits, quality certification and third-party test results of the products. Supplier 3 also provided video information about the manufacturing plant, equipment and manufacturing process of the PC elements. The survey participants were asked to rank the relative performance of one supplier to the other three suppliers with regard to quality system criterion using scales (1/5 = extremely worse than, 1/4, 1/3, 1/2, 1 = equally good to, 2, 3, 4, 5 = extremely better than). The results are shown in Table 9. Supplier 1 and supplier 2 have a same score with R P 1 5 = R P 2 5 = 3. While, supplier 3 and supplier 4 have a same score, as R P 3 5 = R P 4 5 = 6. Supplier 3 and supplier 4 have a higher score than supplier 1 and supplier 2 on this criterion.

4.2.7. Final Assessment Results

After a comprehensive evaluation of each supplier against the criteria, the scores for the four suppliers with regard to each criterion were then calculated based on Equation (9), and the total scores of the four suppliers can also be generated based on Equation (10). The results are shown in Table 10. The results indicate that supplier 2 has the highest total score ( T S 2 = 7.178), while supplier 1 has the second highest total score ( T S 1 = 6.018). The total score of supplier 4 ( T S 4 = 4.408) is lower than that of supplier 1, and supplier 3 yields the lowest total score ( T S 3 = 4.190). Therefore, supplier 2 is an optimal supplier with relative lower material cost and the lowest delivery cost. Also, it can provide satisfactory products and support services, and it has a sound financial background and a good quality assurance system.

5. Conclusions

Given the increasing demand for sustainable development in the Architecture, Engineering and Construction (AEC) industry, improving prefabrication performance is necessary for promoting the application of prefabrication. This study proposes a method to simplify the supplier selection process for prefabrication project. To illustrate how to use the proposed method, the method was applied to a case study that includes the supply of prefabricated wall panels in a prefabricated building project where four potential suppliers were evaluated and scored according to the criteria. The four potential suppliers were ranked according to the total score. The supplier 2 with the highest total score was selected as the optimal supplier of the prefabrication project. A satisfied result validates the effectiveness of the proposed method. The proposed method employs a BIM model in the supplier selection process. By using BIM, supplier assessment can be articulated with all other project disciplines, which facilitates the decision-making process. The BIM model can help users better understand the project and obtain sufficient and accurate information to make informed decisions.
The proposed method has three theoretical and practical contributions. First, the study provides a list of assessment criteria for comprehensively evaluating supplier alternatives for a prefabrication project. Second, the method uses BIM as a data repository to facilitate the decision-making process by vividly providing project data and information about the potential suppliers. The survey participants can better understand the prefabrication project and the potential suppliers than with the method that only uses 2D drawings and documentation. The sufficient and sorted information helps industry professionals to provide objective advices during the decision-making process. Moreover, the construction industry is generally regarded as a low-information-intensive industry compared to other industries. The adoption of BIM in the decision-making process prompts automation and informatization in the AEC industry. Finally, the study may help to improve the adoption of new tools in decision-making process.
With the help of BIM, the jobsite processes can be modeled and handed over to the manufacturers. The BIM model provides all the details of the prefabricated components that facilitate the production of prefabrication components. Moreover, the BIM model of the project can be used in the construction stage to improve project performance. Future studies will extend BIM model to project lifecycle for optimizing project management. To prompt the adoption of BIM in construction can bring many benefits such as improvement of sustainable development and automation in construction. The proposed method can be used in other projects in another region, but the assessment criteria for evaluating suppliers and importance weights of the criteria may be modified to fit the requirements of a new project in another region.

Author Contributions

Conceptualization, L.Z., J.M.; methodology, Z.L.; software, Z.L.; validation, L.Z., Z.L.; resources, L.Z.; writing—original draft preparation, L.Z.; writing—review and editing, J.M.; visualization, Z.L., Z.L.

Funding

This research was funded by National Key Research and Development Program of China, grant number 2018YFF0300300, Beijing University of Technology, grant number 004000514119067, and The APC was funded by the both grants.

Acknowledgments

The authors would like to thank the Beijing University of Technology for its support through the research project. The authors would like to thank China Communications Construction, China Railway Group Limited, China State Construction Engineering Corporation, and China Association of Technology Entrepreneurs for providing data to conduct this research. In addition, I would like to thank all practitioners who contribute in this project.

Conflicts of Interest

The authors declare no conflict of interest.

Abbreviations

AECArchitecture, Engineering and Construction
AHPAnalytic Hierarchy Process
ANNsArtificial Neutral Networks
ANPAnalytic Network Process
BIMBuilding Information Modelling
CADComputer-Aided Design
CBRCase-Based Reasoning
CCost
C1Material Cost
C2Delivery Cost
C3Transaction Cost
DEAData Envelopment Analysis
GAGenetic Algorithms
IFCIndustry Foundation Classes
FSFinancial Strength
FS1Fixed Asset Scale
FS2Cash Flow Conditions
FS3Credibility
FS4Financial Conditions
PCPrefabrication
PPProduct Performance
PP1Proper Function
PP2Durability
PP3Appearance
QSQuality System
QS1Level of Innovation
QS2Quality Assurance
QS3Technical Standards
QS4Complaint Handling Process
SSSupport Services
SS1Order Processing
SS2Delivery on Time
SS3Follow-up Services
SS4Hazards Handling Mechanism
TOPSISTechnique for Order Preference by Similarity to Ideal Solution

References

  1. Wong, J.K.W.; Kuan, K.L. Implementing ‘BEAM Plus’ for BIM-based sustainability analysis. Autom. Constr. 2014, 44, 163–175. [Google Scholar] [CrossRef]
  2. Dong, Y.H.; Ng, S.T. A life cycle assessment model for evaluating the environmental impacts of building construction in Hong Kong. Build. Environ. 2015, 89, 183–191. [Google Scholar] [CrossRef]
  3. Wen, T.J.; Siong, H.C.; Noor, Z.Z. Assessment of embodied energy and global warming potential of building construction using life cycle analysis approach: Case studies of residential buildings in Iskandar Malaysia. Energy Build. 2015, 93, 295–302. [Google Scholar] [CrossRef]
  4. Li, Y.; Chen, X.; Wang, X.; Xu, Y.; Chen, P.H. A review of studies on green building assessment methods by comparative analysis. Energy Build. 2017, 146, 152–159. [Google Scholar] [CrossRef]
  5. Horta, R.M.C. Sustainable Construction of Nearly Zero-Energy Buildings; Faculdade de Ciências e Tecnologia: Caparica, Portugal, 2012. [Google Scholar]
  6. Cardoso, L.P.S. Sustainable Refurbishment of Buildings Built before 1951; Universidade do Minho: Braga, Portugal, 2013. [Google Scholar]
  7. Araújo, C.; Almeida, M.; Bragança, L. Analysis of some Portuguese thermal regulation parameters. Energy Build. 2012, 58, 141–150. [Google Scholar] [CrossRef]
  8. Motawa, I.; Carter, K. Sustainable BIM-based evaluation of buildings. Proc. Soc. Behav. Sci. 2013, 74, 419–428. [Google Scholar] [CrossRef]
  9. Solla, M.; Ismail, L.H.; Yunus, R. Investigation on the potential of integrating BIM into green building assessment tools. ARPN J. Eng. Appl. Sci. 2016, 11, 2412–2418. [Google Scholar] [CrossRef]
  10. Akinade, O.O.; Oyedele, L.O.; Bilal, M.; Ajayi, S.O.; Owolabi, H.A.; Alaka, H.A.; Bello, S.A. Waste minimisation through deconstruction: A BIM based deconstructionability assessment score (BIM-DAS). Resour. Conserv. Recycl. 2015, 105, 167–176. [Google Scholar] [CrossRef]
  11. Jaillon, L.; Poon, C.S.; Chiang, Y.H. Quantifying waste reduction potential of using prefabrication in building construction in Hong Kong. Waste Manag. 2009, 29, 309–320. [Google Scholar] [CrossRef]
  12. Tam, V.W.Y.; Fung, I.W.H.; Sing, M.P.; Ogunlana, S.O. Best practice of prefabrication implementation in the Hong Kong public and private sectors. J. Clean. Prod. 2015, 109, 216–231. [Google Scholar] [CrossRef]
  13. Cao, X.; Li, X.; Zhu, Y.; Zhang, Z. A comparative study of environmental performance between prefabricated and traditional residential buildings in China. J. Clean. Prod. 2016, 109, 131–143. [Google Scholar] [CrossRef]
  14. Al-Hussein, M.; Manrique, J.D.; Mah, D. North Ridge CO2 Analysis Report: Comparison Between Modular and Onsite Construction; University of Alberta: Edmontom, AB, Canada, 2009. [Google Scholar]
  15. Mao, C.; Shen, Q.; Shen, L.; Tang, L. Comparative study of greenhouse gas emissions between off-site prefabrication and conventional construction methods: Two case studies of residential projects. Energy Build. 2013, 66, 165–176. [Google Scholar] [CrossRef] [Green Version]
  16. Ji, Y.; Li, K.; Liu, G.; Shrestha, A.; Jing, J. Comparing greenhouse gas emissions of precast in-situ and conventional construction methods. J. Clean. Prod. 2016. [Google Scholar] [CrossRef]
  17. Quale, J.; Eckelman, M.J.; Williams, K.W.; Sloditskie, G.; Zimmerman, J.B. Construction matters: Comparing environmental impacts of building modular and conventional homes in the United States. J. Ind. Ecol. 2012, 16, 243–253. [Google Scholar] [CrossRef]
  18. Vernikos, V.K.; Goodier, C.I.; Broyd, T.W.; Robery, P.C.; Gibb, A.G.F. Building Information Modelling and Its Effect on Off-Site Construction in UK Civil Engineering; Proceedings—Management, Procurement and Law; ICE: London, UK, 2014; pp. 152–159. [Google Scholar]
  19. Blismas, N.; Wakefield, R. Drivers, constraints and the future of offsite manufacture in Australia. Constr. Innov. 2009, 9, 72–83. [Google Scholar] [CrossRef] [Green Version]
  20. Zhai, X.; Reed, R.; Mills, A. Factors impeding the offsite production of housing construction in China: An investigation of current practice. Constr. Manag. Econ. 2014, 32, 40–52. [Google Scholar] [CrossRef]
  21. Patlakas, P.; Livingstone, A.; Hairstans, R. A BIM Platform for Offsite Timber Construction. In Proceedings of the Education and Research in Computer Aided Architectural Design in Europe, Vienna, Austria, 16–18 September 2015; pp. 16–18. [Google Scholar]
  22. Chen, Y.; Okudan, G.E.; Riley, D.R. Sustainable performance criteria for construction method selection in concrete buildings. Autom. Constr. 2010, 19, 235–244. [Google Scholar] [CrossRef]
  23. Martinez, S.; Jardon, A.; Navarro, J.M.; Gonzalez, P. Building industrialization: Robotized assembly of modular products. Assem. Autom. 2008, 28, 134–142. [Google Scholar] [CrossRef]
  24. Li, H.; Guo, H.L.; Skitmore, M.; Huang, T.; Chan, K.Y.N.; Chan, G. Rethinking prefabricated construction management using the VP-based IKEA model in Hong Kong. Constr. Manag. Econ. 2011, 29, 233–245. [Google Scholar] [CrossRef]
  25. Li, C.Z.; Xue, F.; Li, X.; Hong, J.; Shen, G.Q. An internet of things-enabled BIM platform for on-site assembly services in prefabricated construction. Autom. Constr. 2018, 89, 146–161. [Google Scholar] [CrossRef]
  26. Said, H. Prefabrication best practices and improvement opportunities for electrical construction. J. Constr. Eng. M 2015, 141. [Google Scholar] [CrossRef]
  27. Huang, W.K.; Xu, X.X.; Chen, K.; Wu, H.Y.; Li, Z.D. Causal Loop Analysis on the Impact of Schedule Risks in Prefabrication Housing Production in Hong Kong. In 21st International Symposium on Advancement of Construction Management and Real Estate; Chau, K., Chan, I., Lu, W., Webster, C., Eds.; Springer: Singapore, 2018. [Google Scholar]
  28. Cheng, J.C.P.; Law, K.H.; Bjornsson, H.; Jones, A.; Sriram, R.D. A service-oriented framework for construction supply chain integration. Autom. Constr. 2010, 19, 245–260. [Google Scholar] [CrossRef]
  29. Briscoe, G.; Dainty, A.R.J.; Millett, S. Construction supply chain partnerships: Skills, knowledge and attitudinal requirements. Eur. J. Purch. Supply Manag. 2001, 7, 243–255. [Google Scholar] [CrossRef]
  30. Dainty, A.R.J.; Grugulis, I.; Langford, D. Understanding construction employment: The need for a fresh research agenda. J. Pers. Rev. 2007, 36, 501–508. [Google Scholar] [CrossRef]
  31. Saad, M.; Jones, M.; James, P. A review of the progress towards the adoption of supply chain management(SCM) relationships in construction. Eur. J. Purch. Supply Manag. 2002, 8, 173–183. [Google Scholar] [CrossRef]
  32. Giunipero, L.C.; Eltantawy, R.A. Securing the upstream supply chain: A risk management approach. Int. J. Phys. Distr. Log. 2004, 34, 698–713. [Google Scholar] [CrossRef]
  33. Waskett, P. Current Practice and Potential Uses of Prefabrication; Department of Trade and Industry: London, UK, 2001. [Google Scholar]
  34. Langston, C. The reliability of currency and purchasing power parity conversion for international project cost benchmarking. Benchmarking Int. J. 2016, 23, 61–77. [Google Scholar] [CrossRef]
  35. Azambuja, M.; O’Brien, W.J. Construction Supply Chain Modelling: Issues and Perspectives. In Construction Supply Chain Management Handbook, 1st ed.; O’Brien, W.J., Formoso, C.T., Vrijhoef, R., London, K.A., Eds.; CRC Press: Boca Raton, FL, USA, 2009. [Google Scholar]
  36. Kumar, A.; Pal, A.; Vohra, A.; Gupta, S.; Manchanda, S.; Kumar Dash, M. Construction of capital procurement decision making model to optimize supplier selection using Fuzzy Delphi and AHP-DEMATEL. Benchmark. Int. J. 2018, 25, 1528–1547. [Google Scholar] [CrossRef]
  37. Merschbrock, C.; Nordahl-Rolfsen, C. BIM technology acceptance among reinforcement workers—The case of Oslo airports terminal 2. J. Inf. Technol. Constr. 2016, 21, 1–12. [Google Scholar]
  38. Elonen, S.; Artto, K.A. Problems in managing internal development projects in multi-project environments. Int. J. Proj. Manag 2003, 21, 395–402. [Google Scholar] [CrossRef] [Green Version]
  39. Abanda, F.H.; Tah, J.H.M.; Cheung, F.K.T. BIM in off-site manufacturing for buildings. J. Build. Eng. 2017, 14, 89–102. [Google Scholar] [CrossRef] [Green Version]
  40. Ezcan, V.; Isikdag, U.; Goulding, J.S. BIM and Off-Site Manufacturing: Recent Research and Opportunities. In Proceedings of the International Council for Research and Innovation in Building and Construction (CIB) World Building Congress, Brisbane, Australia, 5–9 May 2013. [Google Scholar]
  41. Samarasinghe, T.; Mendis, P.; Ngo, T.; Fernando, W.J.B.S. BIM Software Framework for Prefabricated Construction: Case Study Demonstrating BIM Implementation on a Modular House. In Proceedings of the 6th International Conference on Structural Engineering and Construction Management, Kandy, Sri Lanka, 11–13 December 2015. [Google Scholar]
  42. Sebastian, R.; Haak, W.; Vos, E. BIM Application for Integrated Design and Engineering in Small Scale Housing Development: A Pilot Project in the Netherlands. In Proceedings of the Future Trends in Architectural Management, International Symposium CIB-W096 2009 Taiwan, Tainan, Taiwan, 2–4 November 2009. [Google Scholar]
  43. Cowles, E.; Warner, P. Prefabrication and Modularization in Construction: 2013: Survey Results; FMI Corporation: Raleigh, NC, USA, 2013. [Google Scholar]
  44. Alaghbari, W.; Kadir, M.R.A.; Salim, A.; Ernawati. The significant factors causing delay of building construction projects in Malaysia. J. Eng. Constr. Arch. Manag. 2007, 14, 192–206. [Google Scholar] [CrossRef]
  45. Mitchell, C.A.; Keaveney, M. An Examination of the Potential of Building Information Modelling to Increase the Efficiency of Irish Contractors on Design and Build Projects. In Proceedings of the International Virtual Conference, Zilina, Slovakia, 25–29 March 2013. [Google Scholar]
  46. Taherdoost, H.; Brard, A. Analyzing the process of supplier selection criteria and methods. Proc. Manuf. 2019, 32, 1024–1034. [Google Scholar] [CrossRef]
  47. Arslan, G.; Kivrak, S.; Birgonul, M.; Dikmen, I. Improving sub-contractor selection process in construction projects: Web-based sub-contractor evaluation system (WEBSES). Autom. Constr. 2008, 17, 480–488. [Google Scholar] [CrossRef]
  48. Jaskowski, P.; Sobotka, A.; Czarnigowska, A. Decision model for planning material supply channels in construction. Autom. Constr. 2018, 90, 235–242. [Google Scholar] [CrossRef]
  49. Lam, K.C.; Tao, R.; Lam, C.K. A material supplier selection model for property developers using Fuzzy Principal Component Analysis. Autom. Constr. 2010, 19, 608–618. [Google Scholar] [CrossRef]
  50. Safa, M.; Shahi, A.; Haas, C.T.; Hipel, K.W. Supplier selection process in an integrated construction materials management model. Autom. Constr 2014, 48, 64–73. [Google Scholar] [CrossRef]
  51. Deng, X.; Hu, Y.; Deng, Y.; Mahadevan, S. Supplier selection using AHP methodology extended by D numbers. Expert Syst. Appl. 2014, 41, 156–167. [Google Scholar] [CrossRef]
  52. San, C.J. Contractor selection using multicriteria decision-making methods. J. Constr. Eng. Manag. 2011, 138, 751–758. [Google Scholar] [CrossRef]
  53. Sonmez, M.; Holt, G.; Yang, J.B.; Graham, G. Applying evidential reasoning to prequalifying construction contractors. ASCE J. Manag. Eng. 2002, 18, 111–119. [Google Scholar] [CrossRef]
  54. Singh, D.; Tiong, R. A fuzzy decision framework for contractor selection. ASCE J. Constr. Eng. Manag. 2005, 131, 62–70. [Google Scholar] [CrossRef]
  55. Ho, W.; Xu, X.; Dey, P.K. Multi-criteria decision making approaches for supplier evaluation and selection: A literature review. Eur. J. Oper. Res. 2010, 202, 16–24. [Google Scholar] [CrossRef]
  56. Faez, F.; Ghodsypour, S.H.; O’Brien, C. Vendor selection and order allocation using an integrated fuzzy case-based reasoning and mathematical programming model. Int. J. Prod. Econ. 2009, 121, 395–408. [Google Scholar] [CrossRef]
  57. Kuo, R.J.; Wang, Y.C.; Tien, F.C. Integration of artificial neural network and MADA methods for green supplier selection. J. Clean Prod. 2010, 18, 1161–1170. [Google Scholar] [CrossRef]
  58. Taherdoost, H. Decision Making Using the Analytic Hierarchy Process (AHP); A Step by Step Approach. Int. J. Econ. Manag. Syst. 2017, 2, 244–246. [Google Scholar]
  59. Saaty, T.L. Theory and Applications of the Analytic Network Process: Decision Making with Benefits, Opportunities, Costs, and Risks; RWS Publications: Pittsburgh, PA, USA, 2005. [Google Scholar]
  60. Cristea, C.; Cristea, M. A multi-criteria decision making approach for supplier selection in the flexible packaging industry. EDP Sci. 2017, 94, 06002. [Google Scholar] [CrossRef] [Green Version]
  61. Cengiza, A.E.; Ozdemirb, O.A.I.; Kusanb, H.; Cabuka, A. A Multi-Criteria Decision Model for Construction Material Supplier Selection. Proc. Eng. 2017, 194, 296–301. [Google Scholar] [CrossRef]
  62. Pal, O.; Gupta, A.K.; Garg, R.K. Supplier Selection Criteria and Methods in Supply Chains: A Review. Int. J. Econ. Manag. Eng. 2013, 7. [Google Scholar]
  63. Frödell, M. Criteria for achieving efficient contractor-supplier relations. Eng. Constr. Archit. Manag. 2011, 18, 381–393. [Google Scholar] [CrossRef]
  64. Jabbour, A.B.L.S.; Jabbour, C.J.C. Are supplier selection criteria going green? Case studies of companies in Brazil. Ind. Manag. Data Syst. 2009, 109, 477–495. [Google Scholar] [CrossRef]
  65. Kannan, V.R.; Tan, K.C. Supplier selection and assessment: Their impact on business performance. J. Supply Chain Manag 2002, 38, 11–21. [Google Scholar] [CrossRef]
  66. Katsikeas, C.C.; Paparoidamis, N.G.; Katsikea, E. Supply source selection criteria: The impact of supplier performance on distributor performance. Ind. Mark. Manag. 2004, 33, 755–764. [Google Scholar] [CrossRef]
  67. Ku, C.; Chang, C.; Ho, H. Global supplier selection using fuzzy analytic hierarchy process and fuzzy goal programming. Qual. Quant. 2010, 44, 623–640. [Google Scholar] [CrossRef]
  68. Park, J.; Shin, D.; Chang, T.W.; Park, J. An integrative framework for supplier relationship management. Ind. Manag. Data Syst. 2010, 110, 495–515. [Google Scholar] [CrossRef]
  69. Wang, W.P. A fuzzy linguistic computing approach to supplier evaluation. Appl. Math. Model 2010, 34, 3130–3141. [Google Scholar] [CrossRef]
  70. Wu, C.; Barnes, D. Formulating partner selection criteria for agile supply chains: A Dempster-Shafer belief acceptability optimization approach. Int. J. Prod. Econ. 2010, 125, 284–293. [Google Scholar] [CrossRef]
  71. Weele, A.J.; Van, J. Purchasing and Supply Chain Management: Analysis, Strategy, Planning and Practice; Cengage Learning: Andover, UK, 2014. [Google Scholar]
  72. Thanaraksakul, W.; Phruksaphanrat, B. Supplier Evaluation Framework Based on Balanced Scorecard with Integrated Corporate Social Responsibility Perspective. In Proceedings of the International Multi Conference of Engineers and Computer Scientist, Kowloon, Hong Kong, 18–20 March 2009. [Google Scholar]
  73. Beil, D. Supplier selection. Stephen M. Ross Sch. Bus. 2009, 6. [Google Scholar] [CrossRef]
  74. Florez-Lopez, R. Strategic supplier selection in the added-value perspective: A CI approach. Inf. Sci. (Ny) 2007, 177, 1169–1179. [Google Scholar] [CrossRef]
  75. Yu, J.-R.; Tsai, C.-C. A decision framework for supplier rating and purchase allocation: A case in the semiconductor industry. Comput. Ind. Eng. 2008, 55, 634–646. [Google Scholar] [CrossRef]
  76. Cakir, O.; Canbolat, M.S. A web-based decision support system for multi-criteria inventory classification using fuzzy AHP methodology. Expert. Syst. Appl. 2008, 35, 1367–1378. [Google Scholar] [CrossRef]
  77. Ustun, O.; Demirtas, E.A. Multi-period lot-sizing with supplier selection using achievement scalarizing functions. Comput. Ind. Eng. 2008, 54, 918–931. [Google Scholar] [CrossRef]
  78. Hsu, C.W.; Hu, A.H. Applying hazardous substance management to supplier selection using analytic network process. J. Clean Prod. 2009, 17, 255–264. [Google Scholar] [CrossRef]
  79. Wadhwa, V.; Ravindran, A.R. Vendor selection in outsourcing. Comput. Oper. Res. 2007, 34, 3725–3737. [Google Scholar] [CrossRef]
  80. Chan, F.T.S.; Kumar, N. Global supplier develoment considering risk factors using fuzzy extended AHP-based approach. Omega 2007, 35, 417–431. [Google Scholar] [CrossRef]
  81. Wang, J.W.; Cheng, C.H.; Huang, K.C. Fuzzy hierarchical TOPSIS for supplier selection. Appl. Soft Comput. 2008, 9, 377–386. [Google Scholar] [CrossRef]
  82. Xia, W.; Wu, Z. Supplier selection with multiple criteria in volume discount environments. Omega Int. J. Manag. Sci. 2007, 35, 494–504. [Google Scholar] [CrossRef]
  83. Ha, S.H.; Krishnan, R. A hybrid approach to supplier selection for the maintenance of a competitive supply chain. Expert Syst. Appl 2008, 34, 1303–1311. [Google Scholar] [CrossRef]
  84. Bottani, E.; Rizzi, A. An adapted multi-criteria approach to suppliers and product selection—An application oriented to lead-time reduction. Int. J. Prod. Econ. 2008, 111, 763–781. [Google Scholar] [CrossRef]
  85. Watt, D.J.; Kayis, B.; Willey, K. The relative importance of tender evaluation and contractor selection criteria. Int. J. Proj. Manag. 2010, 28, 51–60. [Google Scholar] [CrossRef]
  86. Sarkar, A.; Mohapatra, P.K.J. Evaluation of supplier capability and performance: A method for supply base reduction. J. Purch. Supply Manag. 2006, 12, 148–163. [Google Scholar] [CrossRef]
  87. NIST. National Building Information Modeling Standard Version 2; US National Institute of Building Science: Washington, DC, USA, 2012.
  88. Saaty, T.L. The Analytic Hierarchy Process; McGraw-Hill: New York, NY, USA, 1980. [Google Scholar]
  89. Vaidya, O.; Kumar, S. Analytic hierarchy process: An overview of applications. Eur. J. Oper. Res. 2006, 169, 1–29. [Google Scholar] [CrossRef]
  90. Saaty, T.L. Decision making with the analytic hierarchy process. Int. J. Serv. Sci. 2008, 1, 83–98. [Google Scholar] [CrossRef]
Figure 1. The assessment process using the proposed method.
Buildings 09 00222 g001
Figure 2. The hierarchy model for selection criteria.
Buildings 09 00222 g002
Figure 3. (a) The BIM model for the prefabrication project; (b) prefabrication components; (c) an example of prefabrication wall panel supported on the construction site.
Buildings 09 00222 g003
Figure 4. The results of pairwise comparison for the sub-criteria.
Buildings 09 00222 g004
Table 1. The rank scales of pairwise comparison for assessment criteria.
Please Compare the Level of Relative Importance between Criterion 1 and Criterion 2
1/51/41/31/212345
Extremely less important than Equally important to Extremely more important than
Table 2. The rank scales of pairwise comparison for supplier alternatives.
Please Compare the Level of Relative Performance between Supplier 1 and Supplier 2
1/51/41/31/212345
Extremely worse than Equally good to Extremely better than
Table 3. The priority results of the sub-criteria.
CriteriaSub-CriteriaImportance WeightRank
CostMaterial cost (C1)11.80%1
Delivery cost (C2)11.34%2
Transaction cost (C3)10.80%3
Financial strength (FS)Fixed asset scale (FS1)1.63%18
Cash flow conditions (FS2)2.41%14
Credibility (FS3)1.92%16
Financial conditions (FS4)3.06%12
Product performance (PP)Proper function (PP1)4.92%9
Durability (PP2)4.41%10
Appearance (PP3)5.59%8
Support services (SS)Order processing (SS1)8.29%5
Delivery on time (SS2)8.94%4
Follow-up services (SS3)7.80%6
Hazards handling mechanism (SS4)7.48%7
Quality system (QS)Level of innovation (QS1)1.75%17
Quality assurance (QS2)3.21%11
Technical standards (QS3)2.08%15
Complaint Handling Process (QS4)2.57%13
Table 4. The importance weights of the criteria.
CriteriaWeightRank
Cost33.93%1
Financial strength9.03%5
Product performance14.92%3
Support services32.51%2
Quality system9.61%4
Table 5. The results of pairwise comparison for supplier alternatives with regard to cost criterion.
Supplier 1Supplier 2Supplier 3Supplier 4Total
Supplier 1124512
Supplier 2 1348.5
Supplier 3 11/22.08
Supplier 4 13.45
Table 6. The results of pairwise comparison for supplier alternatives with regard to financial strength criterion.
Supplier 1Supplier 2Supplier 3Supplier 4Total
Supplier 111/2113.5
Supplier 2 1227
Supplier 3 113.5
Supplier 4 13.5
Table 7. The results of pairwise comparison for supplier alternatives with regard to product performance criterion.
Supplier 1Supplier 2Supplier 3Supplier 4Total
Supplier 1111/31/22.83
Supplier 2 11/21/23
Supplier 3 128
Supplier 4 17
Table 8. The results of pairwise comparison for supplier alternatives with regard to support services criterion.
Supplier 1Supplier 2Supplier 3Supplier 4Total
Supplier 111/311/22.83
Supplier 2 1329
Supplier 3 124.3
Supplier 4 14
Table 9. The results of pairwise comparison for supplier alternative with regard to quality system criterion.
Supplier 1Supplier 2Supplier 3Supplier 4Total
Supplier 1111/21/23
Supplier 2 11/21/23
Supplier 3 116
Supplier 4 16
Table 10. The results of scores of the suppliers.
SuppliersCostFinancial StrengthProduct PerformanceSupport ServicesQuality SystemTotalRank
Supplier 14.0720.3160.4220.9200.2886.0182
Supplier 22.8840.6320.4482.9260.2887.1781
Supplier 30.7060.3161.1941.3980.5774.1904
Supplier 41.1710.3161.0441.3000.5774.4083

