Effects of Climate Change for Thermal Comfort and Energy Performance of Residential Buildings in a Sub-Saharan African Climate

Abstract
:1. Introduction
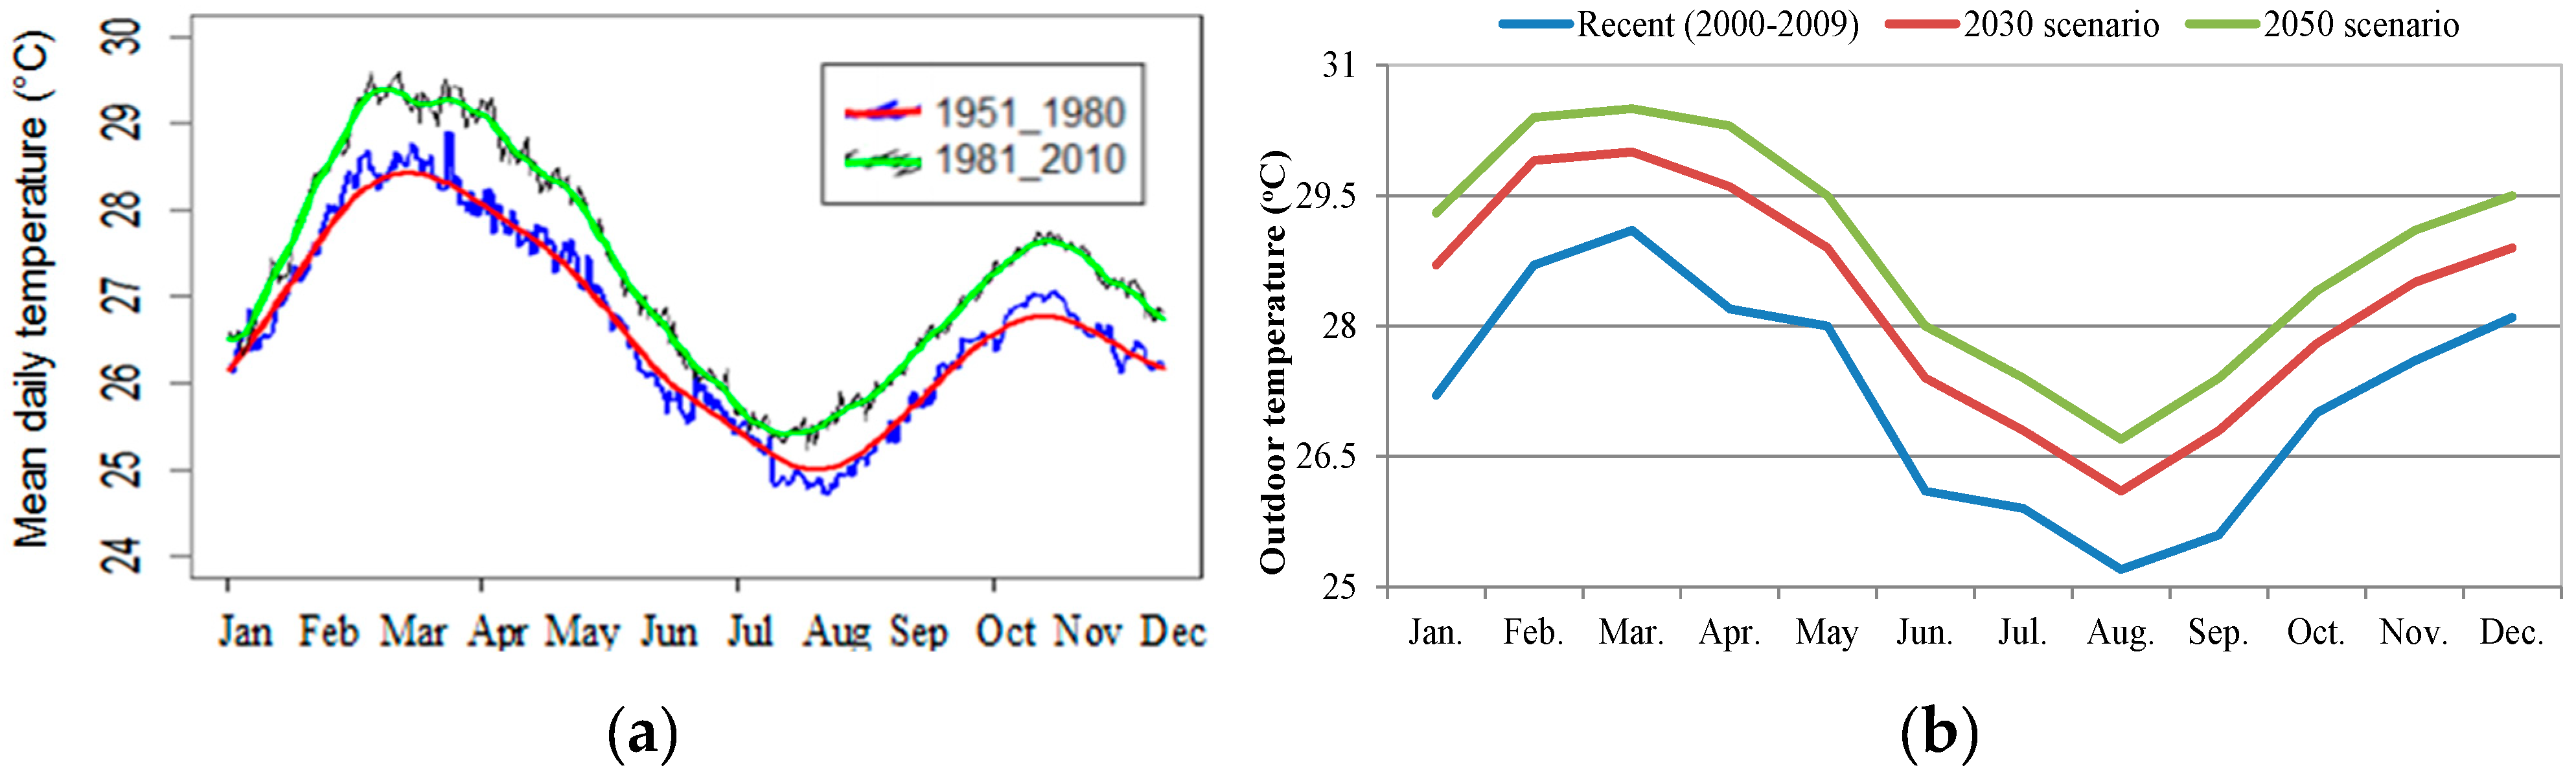
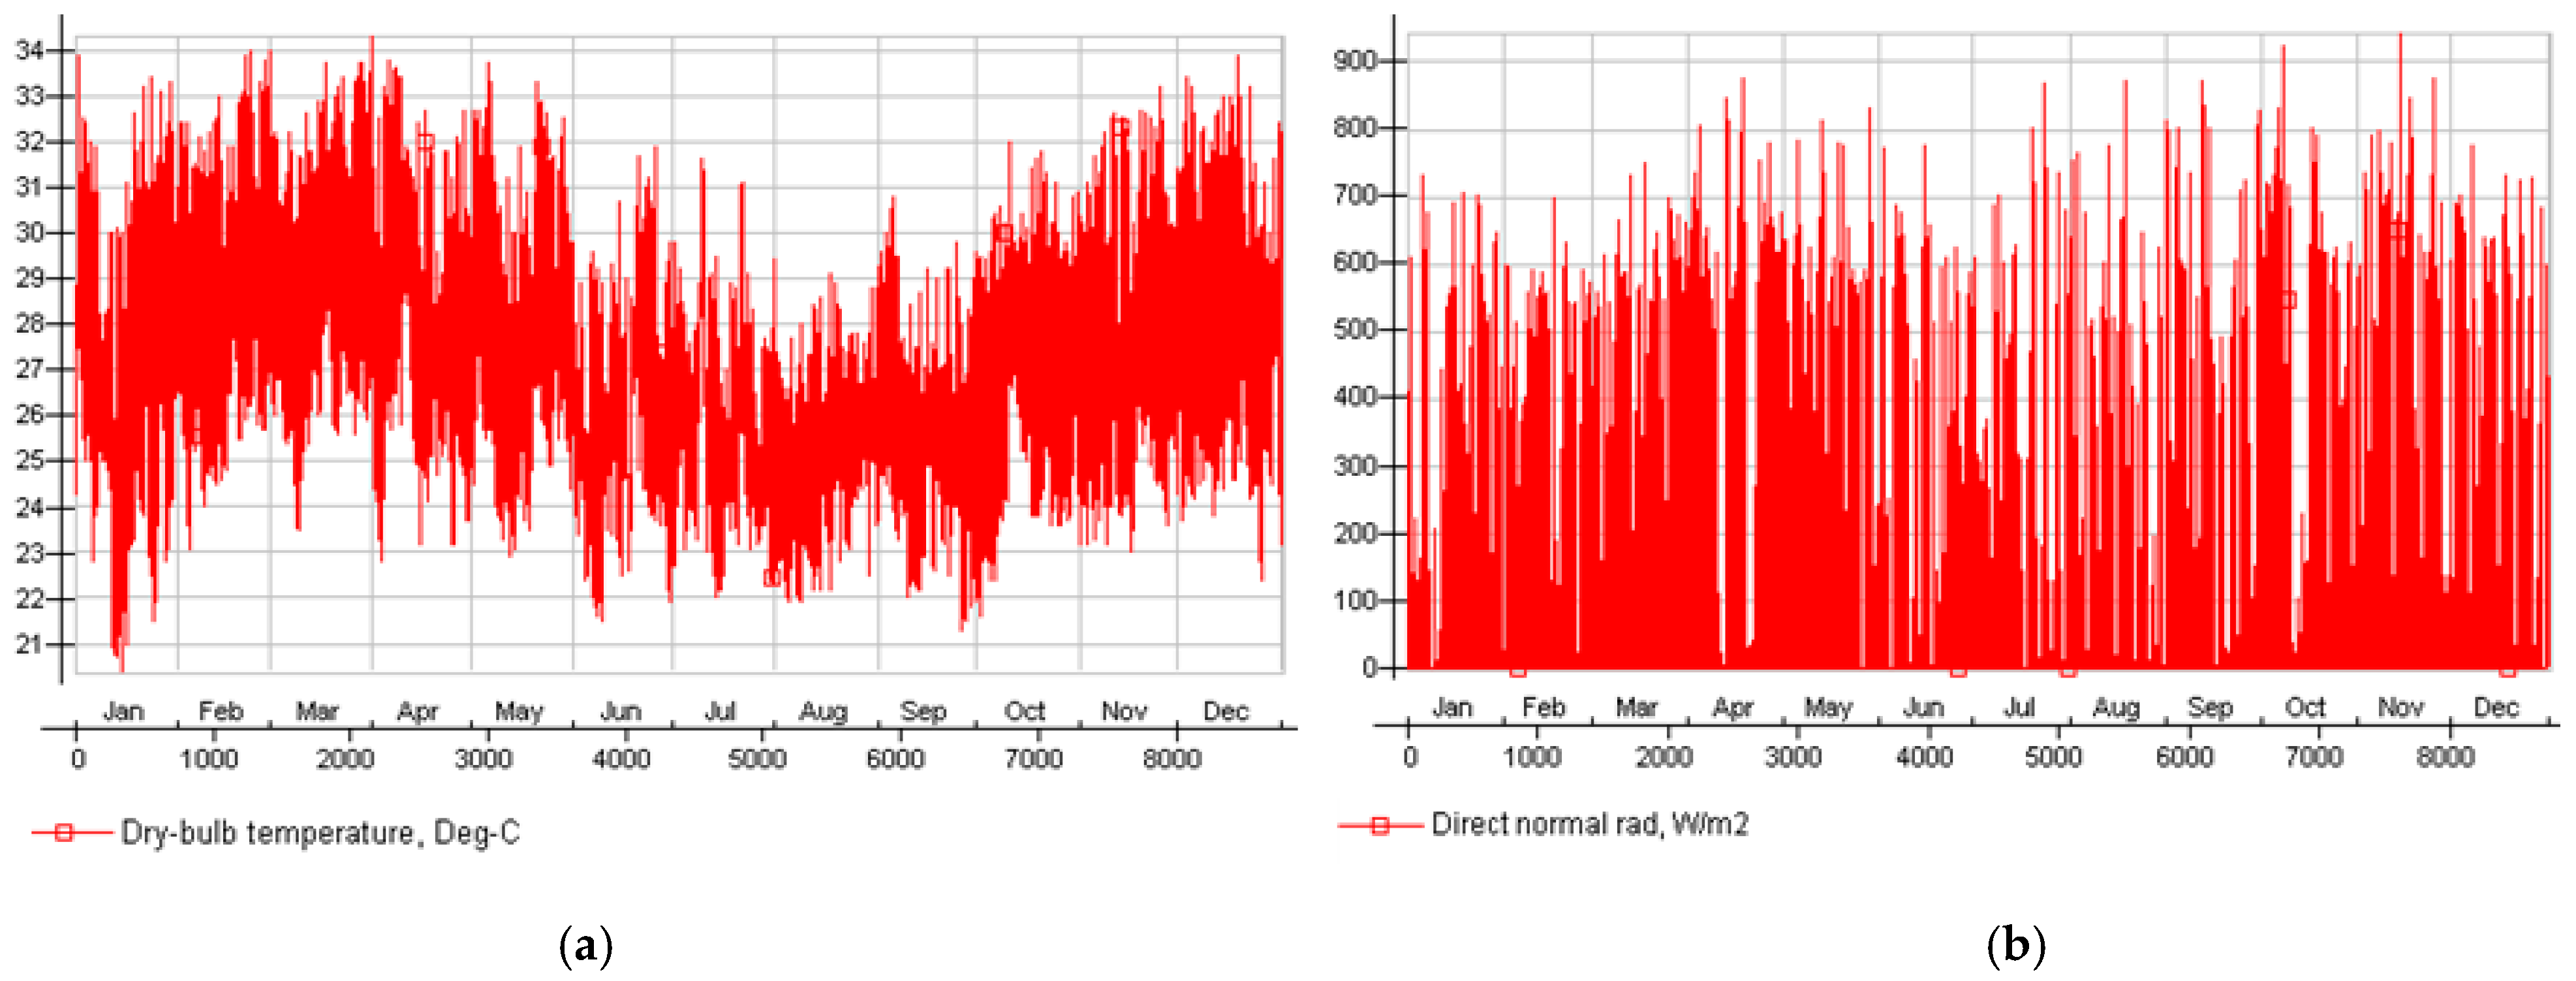
2. Current and Projected Climates
3. Methodology
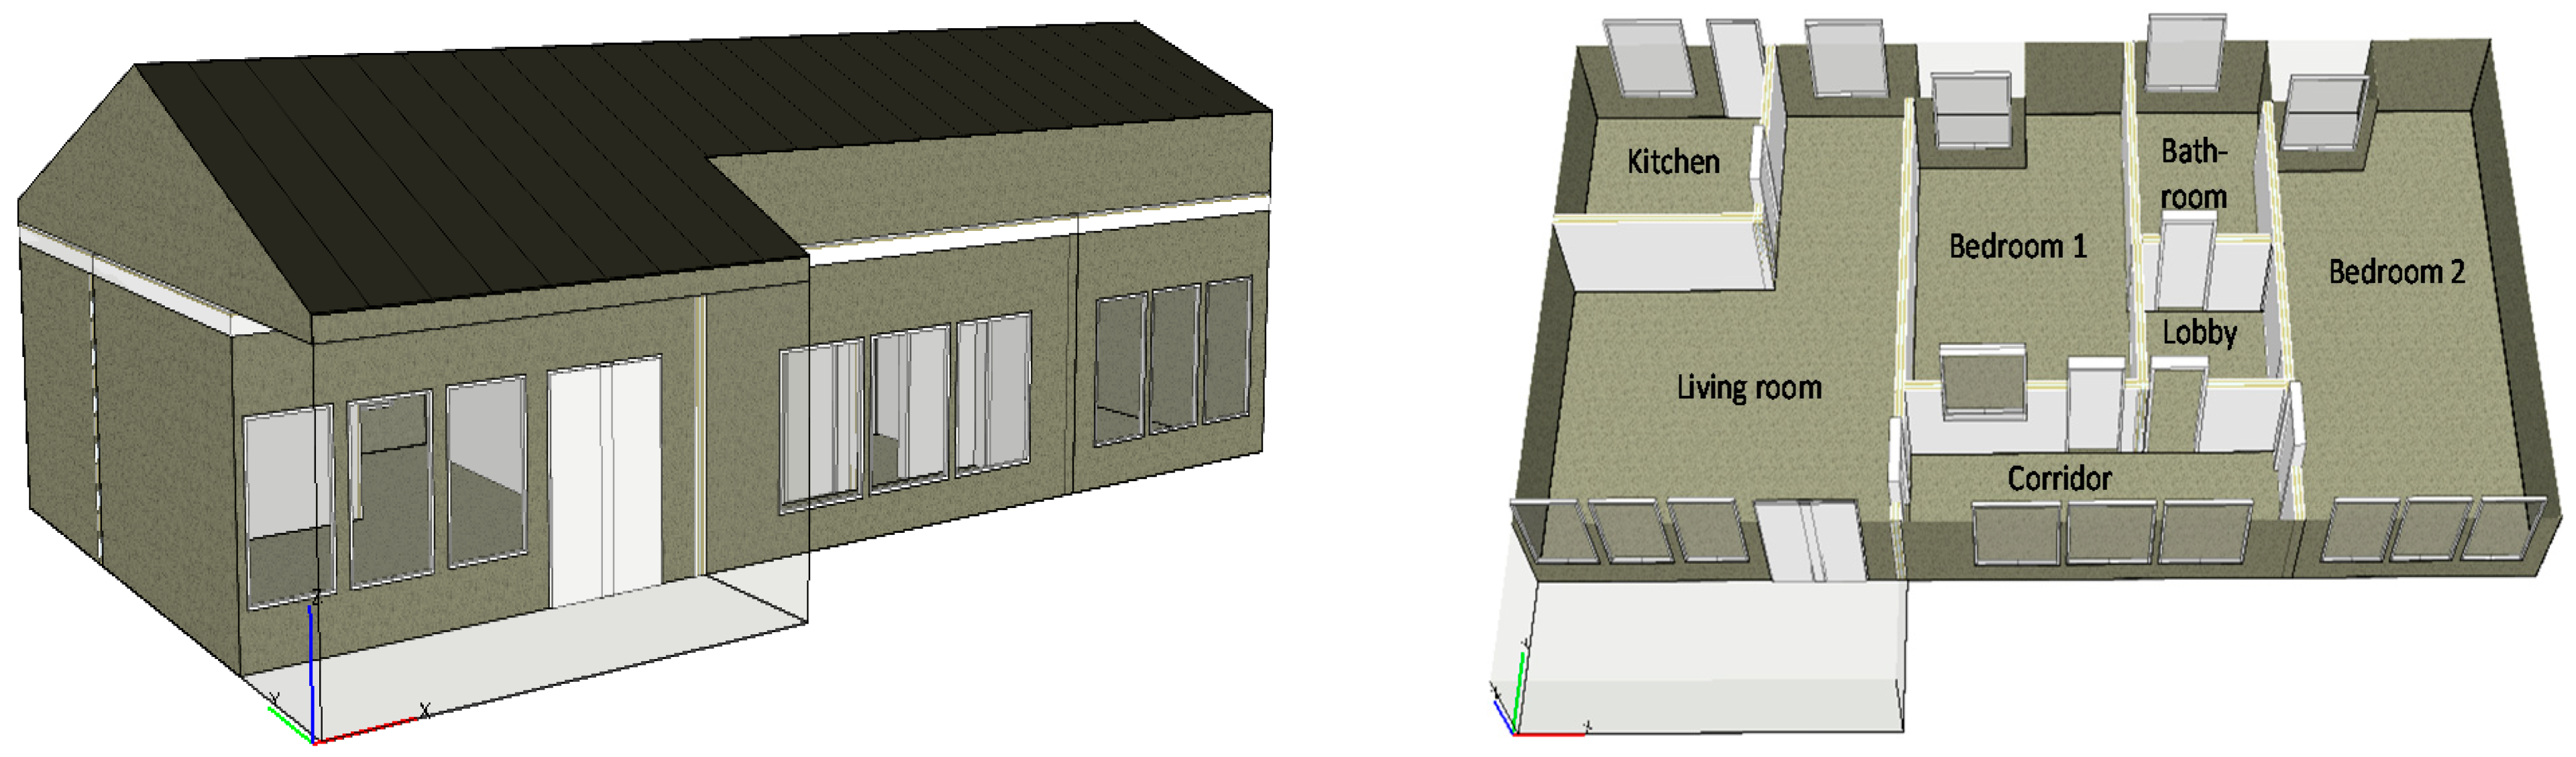
3.1. Building Description
3.2. Thermal Comfort and Energy-Use Simulations
3.3. Parametric Simulation of Strategies
3.3.1. Orientation
3.3.2. External Window Shading
3.3.3. Glazed Fraction
3.3.4. Improved Windows
3.3.5. Additional Insulation to Exterior Walls and Roof
3.3.6. Improved Building
3.4. Variation of Building Design and Location
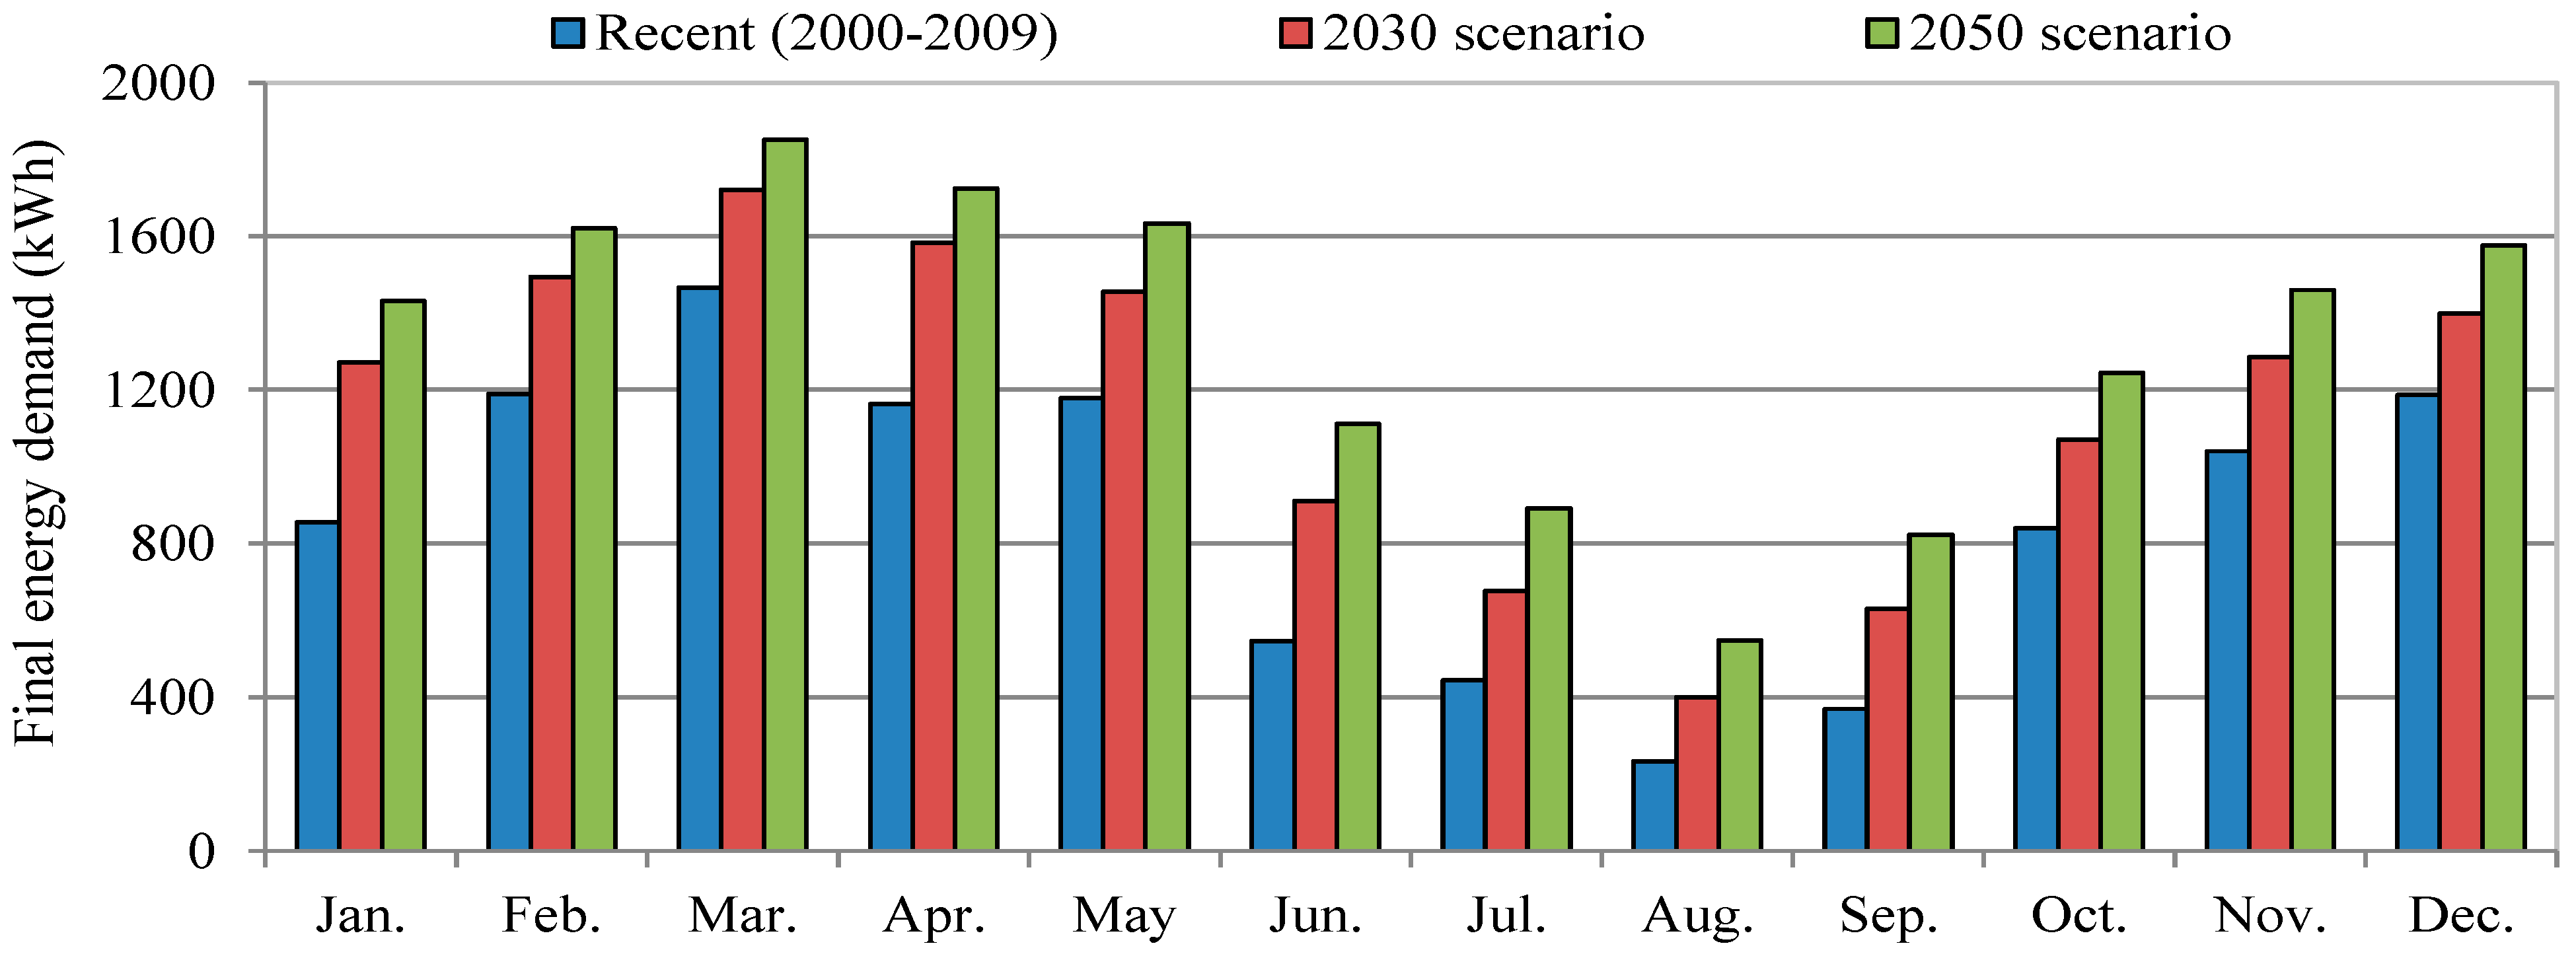
4. Results
4.1. Simulated Building
4.2. Parametric Study
4.3. Improved Building
5. Impact of Building Design and Location
6. Discussion and Conclusions
Author Contributions
Funding
Conflicts of Interest
References
- Intergovernmental Panel on Climate Change (IPCC). Climate Change 2014: Mitigation of Climate Change. Contribution of Working Group III to the Fifth Assessment Report of the Intergovernmental Panel on Climate Change; IPCC: Geneva, Switzerland, 2014. [Google Scholar]
- Stern, N.H.; Treasury, H.M.S. Stern Review: The economics of Climate Change; HM treasury: London, UK, 2006. [Google Scholar]
- Carbon Dioxide Information Analysis Center. Atmospheric Concentrations of CO2 from Mauna Loa, Hawaii. 2016. Available online: http://cdiac.ornl.gov/trends/co2/recent_mauna_loa_co2.html (accessed on 15 September 2016).
- NASA. NASA, NOAA Data Show 2016 Warmest Year on Record Globally. 2017. Available online: https://www.nasa.gov (accessed on 18 January 2017).
- Corlett, R.T. Essay 2: The impacts of climate change in the Tropics; State of the Tropics 2014 report; James Cook University: North Queensland, Australia, 2014. [Google Scholar]
- De Wilde, P.; Coley, D. The implications of a changing climate for buildings. Build. Environ. 2012, 55, 1–7. [Google Scholar] [CrossRef] [Green Version]
- Center for Climate and Energy Solutions. Hydropower. 2011. Available online: https://www.c2es.org/technology/factsheet/hydropower (accessed on 20 January 2017).
- Kyoto Protocol. United Nations Framework Convention on Climate Change. 1998. Available online: http://unfccc. int/resource/convkp/kpeng. html (accessed on 6 January 2018).
- COP21. United Nation Conference on Climate Change. 2015. Web. Available online: http://www.cop21.gouv.fr/en/more-details-about-the-agreement/ (accessed on 16 September 2019).
- The World Bank. Fact Sheet: The World Bank and Energy in Africa; The World Bank: Washington, DC, USA, 2013. [Google Scholar]
- Eshun, M.E.; Amoako-Tuffour, J. A review of the trends in Ghana’s power sector. Energy Sustain Soc. 2016, 6, 1–9. [Google Scholar] [CrossRef]
- Adom, P.K. Electricity consumption-economic growth nexus: the Ghanaian case. Int. J. Energy Econ. Policy 2011, 1, 18–31. [Google Scholar]
- Energy Commission of Ghana. National Energy Statistics (2007–2016). 2017. Available online: http://energycom.gov.gh/files/ENERGY_STATISTICS_2017.pdf (accessed on 12 April 2018).
- Amos-Abanyie, S.; Akuffo, F.O.; Quagrain, V. Unveiling energy saving techniques for cooling in residential buildings in Ghana. Int. J. Vent. 2009, 8, 23–35. [Google Scholar] [CrossRef]
- Uba, F.A.; Fiagbe, Y.A.K.; Sarsah, E.A. Simplified procedure for estimating air-conditioning cooling load in Ghana. Int. J. Sci. Technol. Res. 2013, 2, 38–46. [Google Scholar]
- Koranteng, C. Energy performance of office buildings in Ghana. J. Sci. Technol. (Ghana) 2010, 30, 114–127. [Google Scholar] [CrossRef]
- Koranteng, C.; Mahdavi, A. An investigation into the thermal performance of office buildings in Ghana. Energy Build. 2011, 43, 555–563. [Google Scholar] [CrossRef]
- Simons, B.; Koranteng, C.; Ayarkwa, J. Practical energy saving techniques for multi-storey office buildings in Accra, Ghana. Int. J. Eng. Comput. Sci. 2015, 4, 15262–15273. [Google Scholar] [CrossRef]
- Amato, A.D.; Ruth, M.; Kirshen, P.; Horwitz, J. Regional energy demand responses to climate change: Methodology and application to the Commonwealth of Massachusetts. Clim. Chang. 2005, 71, 175–201. [Google Scholar] [CrossRef]
- Berger, T.; Amann, C.; Formayer, H.; Korjenic, A.; Pospischal, B.; Neururer, C.; Smutny, R. Impacts of climate change upon cooling and heating energy demand of office buildings in Vienna, Austria. Energy Build. 2014, 80, 517–530. [Google Scholar] [CrossRef]
- Frank, T. Climate change impacts on building heating and cooling energy demand in Switzerland. Energy Build. 2005, 37, 1175–1185. [Google Scholar] [CrossRef]
- Jenkins, D.P.; Peacock, A.D.; Banfill, P.F.G. Will future low-carbon schools in the UK have an overheating problem? Build. Environ. 2009, 44, 490–501. [Google Scholar] [CrossRef]
- Jentsch, M.F.; Bahaj, A.S.; James, P.A.B. Climate change future proofing of buildings—Generation and assessment of building simulation weather files. Energy Build. 2008, 40, 2148–2168. [Google Scholar] [CrossRef]
- Karimpour, M.; Belusko, M.; Xing, K.; Boland, J.; Bruno, F. Impact of climate change on the design of energy efficient residential building envelopes. Energy Build. 2015, 87, 142–154. [Google Scholar] [CrossRef]
- Nik, V.M.; Mata, E.; Kalagasidis, A.S. Assessing the efficiency and robustness of the retrofitted building envelope against climate change. Energy Procedia 2015, 78, 955–960. [Google Scholar] [CrossRef]
- Tettey, U.Y.A.; Dodoo, A.; Gustavsson, L. Energy use implications of different design strategies for multi-storey residential buildings under future climates. Energy 2017, 138, 846–860. [Google Scholar] [CrossRef]
- Dodoo, A.; Gustavsson, L.; Bonakdar, F. Effects of future climate change scenarios on overheating risk and primary energy use for Swedish Residential Buildings. Energy Procedia 2014, 61, 1179–1182. [Google Scholar] [CrossRef]
- Olonscheck, M.; Holsten, A.; Kropp, J.P. Heating and cooling energy demand and related emissions of the German residential building stock under climate change. Energy Policy 2011, 39, 4795–4806. [Google Scholar] [CrossRef]
- Wang, X.; Chen, D.; Ren, Z. Assessment of climate change impact on residential building heating and cooling energy requirement in Australia. Build. Environ. 2010, 45, 1663–1682. [Google Scholar] [CrossRef]
- Yau, Y.H.; Hasbi, S. A review of climate change impacts on commercial buildings and their technical services in the tropics. Renew. Sustain. Energy Rev. 2013, 18, 430–441. [Google Scholar] [CrossRef]
- Radhi, H. Evaluating the potential impact of global warming on the UAE residential buildings—A contribution to reduce the CO2 emissions. Build. Environ. 2009, 44, 2451–2462. [Google Scholar] [CrossRef]
- Ouedraogo, B.; Levermore, G.; Parkinson, J. Future energy demand for public buildings in the context of climate change for Burkina Faso. Build. Environ. 2012, 49, 270–282. [Google Scholar] [CrossRef]
- Amos-Abanyie, S. Climate change and housing in Kumasi, Chapter 11. In Future of the Tree: Towards Growth and Development of Kumasi; Adarkwa, K.K., Ed.; University Printing Press (UPK), Kwame Nkrumah University of Science and Technology: Kumasi, Ghana, 2011. [Google Scholar]
- Encyclopædia Britannica. Ghana. 2018. Available online: https://www.britannica.com/place/Ghana (accessed on 12 April 2018).
- Atalla, T.; Gualdi, S.; Lanza, A. A global degree days database for energy-related applications. Energy 2018, 143, 1048–1055. [Google Scholar] [CrossRef] [Green Version]
- Meteotest. Meteonorm 7: Global Meteorological Database for Engineers, Planners and Education; Meteotest: Bern, Switzerland, 2015. [Google Scholar]
- Republic of Ghana. Ghana’s Third National Communication Report to the UNFCCC; MESTI: Accra, Ghana, 2016. [Google Scholar]
- Nakicenovic, N.; Swart, R. Special report on emissions scenarios. In Special Report on Emissions Scenarios; Nakicenovic, N., Swart, R., Eds.; Cambridge University Press: Cambridge, UK, 2010; 612p, ISBN 0521804930. [Google Scholar]
- Nik, V.M.; Sasic Kalagasidis, A. Impact study of the climate change on the energy performance of the building stock in Stockholm considering four climate uncertainties. Build. Environ. 2013, 60, 291–304. [Google Scholar] [CrossRef]
- Shen, P.; Lior, N. Vulnerability to climate change impacts of present renewable energy systems designed for achieving net-zero energy buildings. Energy 2016, 114, 1288–1305. [Google Scholar] [CrossRef]
- Shen, P. Impacts of climate change on U.S. building energy use by using downscaled hourly future weather data. Energy Build. 2017, 134, 61–70. [Google Scholar] [CrossRef]
- Equa Simulation AB. IDA Indoor Climate and Energy. 2016. Available online: http://www.equa.se/en/ida-ice/what-is-new/highlights-in-4–7 (accessed on 6 August 2018).
- Equa Simulation AB. Validation of IDA Indoor Climate and Energy 4.0 with Respect to CEN Standard EN 15255–2007 and EN 15265–2007; Equa Simulation AB: Stockholm, Sweden, 2010. [Google Scholar]
- Harvey, D. Energy and the New Reality 1-Energy Efficiency and the Demand for Energy Services; Routledge: Abingdon, UK, 2010. [Google Scholar]
- ISO 7730. Ergonomics of the Thermal Environment: Analytical Determination and Interpretation of Thermal Comfort Using Calculation of the PMV and PPD Indices and Local Thermal Comfort Criteria; International Organization for Standardization: Geneva, Switzerland, 2005. [Google Scholar]
- Groth, A. Energy Efficiency Building Design Guidelines for Botswana; Department of Energy Ministry of Minerals, Energy and Water Resources: Gaborone, Botswana, 2007. [Google Scholar]
- Abanda, F.; Byers, L. An investigation of the impact of building orientation on energy consumption in a domestic building using emerging BIM (Building Information Modelling). Energy 2016, 97, 517–527. [Google Scholar] [CrossRef]
- Haase, M.; Amato, A. An investigation of the potential for natural ventilation and building orientation to achieve thermal comfort in warm and humid climates. Sol. Energy 2009, 83, 389–399. [Google Scholar] [CrossRef]
- Andersson, B.; Place, W.; Kammerud, R.; Scofield, M.P. The impact of building orientation on residential heating and cooling. Energy Build. 1985, 8, 205–224. [Google Scholar] [CrossRef] [Green Version]
- Simons, B.; Koranteng, C.; Woanyah-Deladem, S. Thermal Comfort Evaluation of High Rise Buildings in Accra, Ghana; Department of Architecture, Research Center for Building Performance and Design: Accra, Ghana, 2012. [Google Scholar]
- Fang, Z.; Li, N.; Li, B.; Luo, G.; Huang, Y. The effect of building envelope insulation on cooling energy consumption in summer. Energy Build. 2014, 77, 197–205. [Google Scholar] [CrossRef]
- Nematchoua, M.K.; Raminosoa, C.R.R.; Mamiharijaona, R.; René, T.; Orosa, J.A.; Elvis, W.; Meukam, P. Study of the economical and optimum thermal insulation thickness for buildings in a wet and hot tropical climate: Case of Cameroon. Renew. Sustain. Energy Rev. 2015, 50, 1192–1202. [Google Scholar] [CrossRef] [Green Version]
- Stephan, A.; Crawford, R.H.; de Myttenaere, K. A comprehensive assessment of the life cycle energy demand of passive houses. Appl. Energy 2013, 112, 23–34. [Google Scholar] [CrossRef] [Green Version]
- Cellura, M.; Guarino, F.; Longo, S.; Mistretta, M. Energy life-cycle approach in net zero energy buildings balance: Operation and embodied energy of an Italian case study. Energy Build. 2014, 72, 371–381. [Google Scholar] [CrossRef]
- Janjua, S.Y.; Sarker, P.K.; Biswas, W.K. A Review of residential buildings’ sustainability performance using a life cycle assessment approach. J. Sustain. Res. 2019, 1, e190006. [Google Scholar] [CrossRef]


| Building Element | Description | Density | Specific Heat Capacity | Conduc-Tivity | U-Value |
|---|---|---|---|---|---|
| (Kg/m3) | (J/[KgK]) | (W/[mK]) | (W/m2K) | ||
| Roof | 0.45 mm corrugated aluzinc roof covering | 2700 | 900 | 210 | 4.39 |
| Pitch roof with wood framing with tongue | 560 | 390 | 0.17 | ||
| & groove wood ceiling panels for living-room & 6 mm plywood ceilings for other rooms | 560 | 390 | 0.17 | ||
| External wall | 20 mm cement & sand plastering | 1300 | 1000 | 0.50 | 2.86 |
| 150 mm concrete block | 1800 | 1050 | 1.50 | ||
| 20 mm cement & sand plastering | 1300 | 1000 | 0.50 | ||
| Internal wall | 20 mm cement & sand plastering | 1300 | 1000 | 0.50 | 3.16 |
| 100 mm concrete block | 1800 | 1050 | 1.50 | ||
| 20 mm cement & sand plastering | 1300 | 1000 | 0.50 | ||
| Ground floor | 10 mm ceramic floor tiles | 1922 | 920 | 0.84 | 3.03 |
| 30 mm cement & sand screeding | 1300 | 1000 | 0.50 | ||
| 150 mm mass concrete | 2300 | 880 | 1.70 | ||
| Windows | 6 mm glass louvres | 2500 | 700 | 1.00 | 5.32 |
| Wood framing | 560 | 390 | 0.17 | ||
| Doors | 45 mm hardwood paneled doors | 560 | 390 | 0.17 | 2.33 |
| Wood framing | 560 | 390 | 0.17 |
| Description | Detail |
|---|---|
| Year of building completion | 2015 |
| Net floor area (m2) | 93.0 |
| Total ventilated volume (m3) | 241.8 |
| Overall thermal envelope area (m2) | 353.2 |
| Exterior wall area (m2) | 114.0 |
| Windows area (m2) [South/ North] | 9.0/13.5 |
| Window /floor area (%) | 24.1 |
| Window /envelope area (%) | 6.4 |
| Envelope area per volume (m2/m3) | 1.5 |
| Average thermal transmittance (W/m2 K) | 2.351 |
| Indoor lighting | Compact florescent lamps |
| Description | Model Input Data and Assumptions |
|---|---|
| No. of zones in simulation model | 7 |
| Climate data | Hourly climate file for Greater Accra |
| Cooling set | 28 °C |
| Infiltration | 0.5 ACH |
| Average heat gains from lighting | 1.31 W/m2 |
| Average heat gains from appliances | 2.15 W/m2 |
| Occupancy density (no./m2) | 0.048 |
| Occupancy schedule | Variable |
| Ventilation/ air-conditioning system | Constant air volume |
| COP of air-conditioning system | 3.85 |
| Description | Detail |
|---|---|
| Net floor area (m2) | 128.1 |
| Total ventilated volume (m3) | 333.1 |
| Overall thermal envelope area (m2) | 436.8 |
| Exterior wall area (m2) | 135.9 |
| Windows area (m2) [South/ North/East/West] | 5.9/4.6/6.9/7.9 |
| Window/floor area (%) | 19.7 |
| Window/envelope area (%) | 5.8 |
| Envelope area per volume (m2/m3) | 1.0 |
| Average thermal transmittance (W/m2 K) | 2.272 |
| Month | Recent | 2030 Scenario | 2050 Scenario | ||||||
|---|---|---|---|---|---|---|---|---|---|
| Outdoor Air | Indoor Air | Opera-Tive | Outdoor Air | Indoor Air | Opera-Tive | Outdoor Air | Indoor Air | Opera-Tive | |
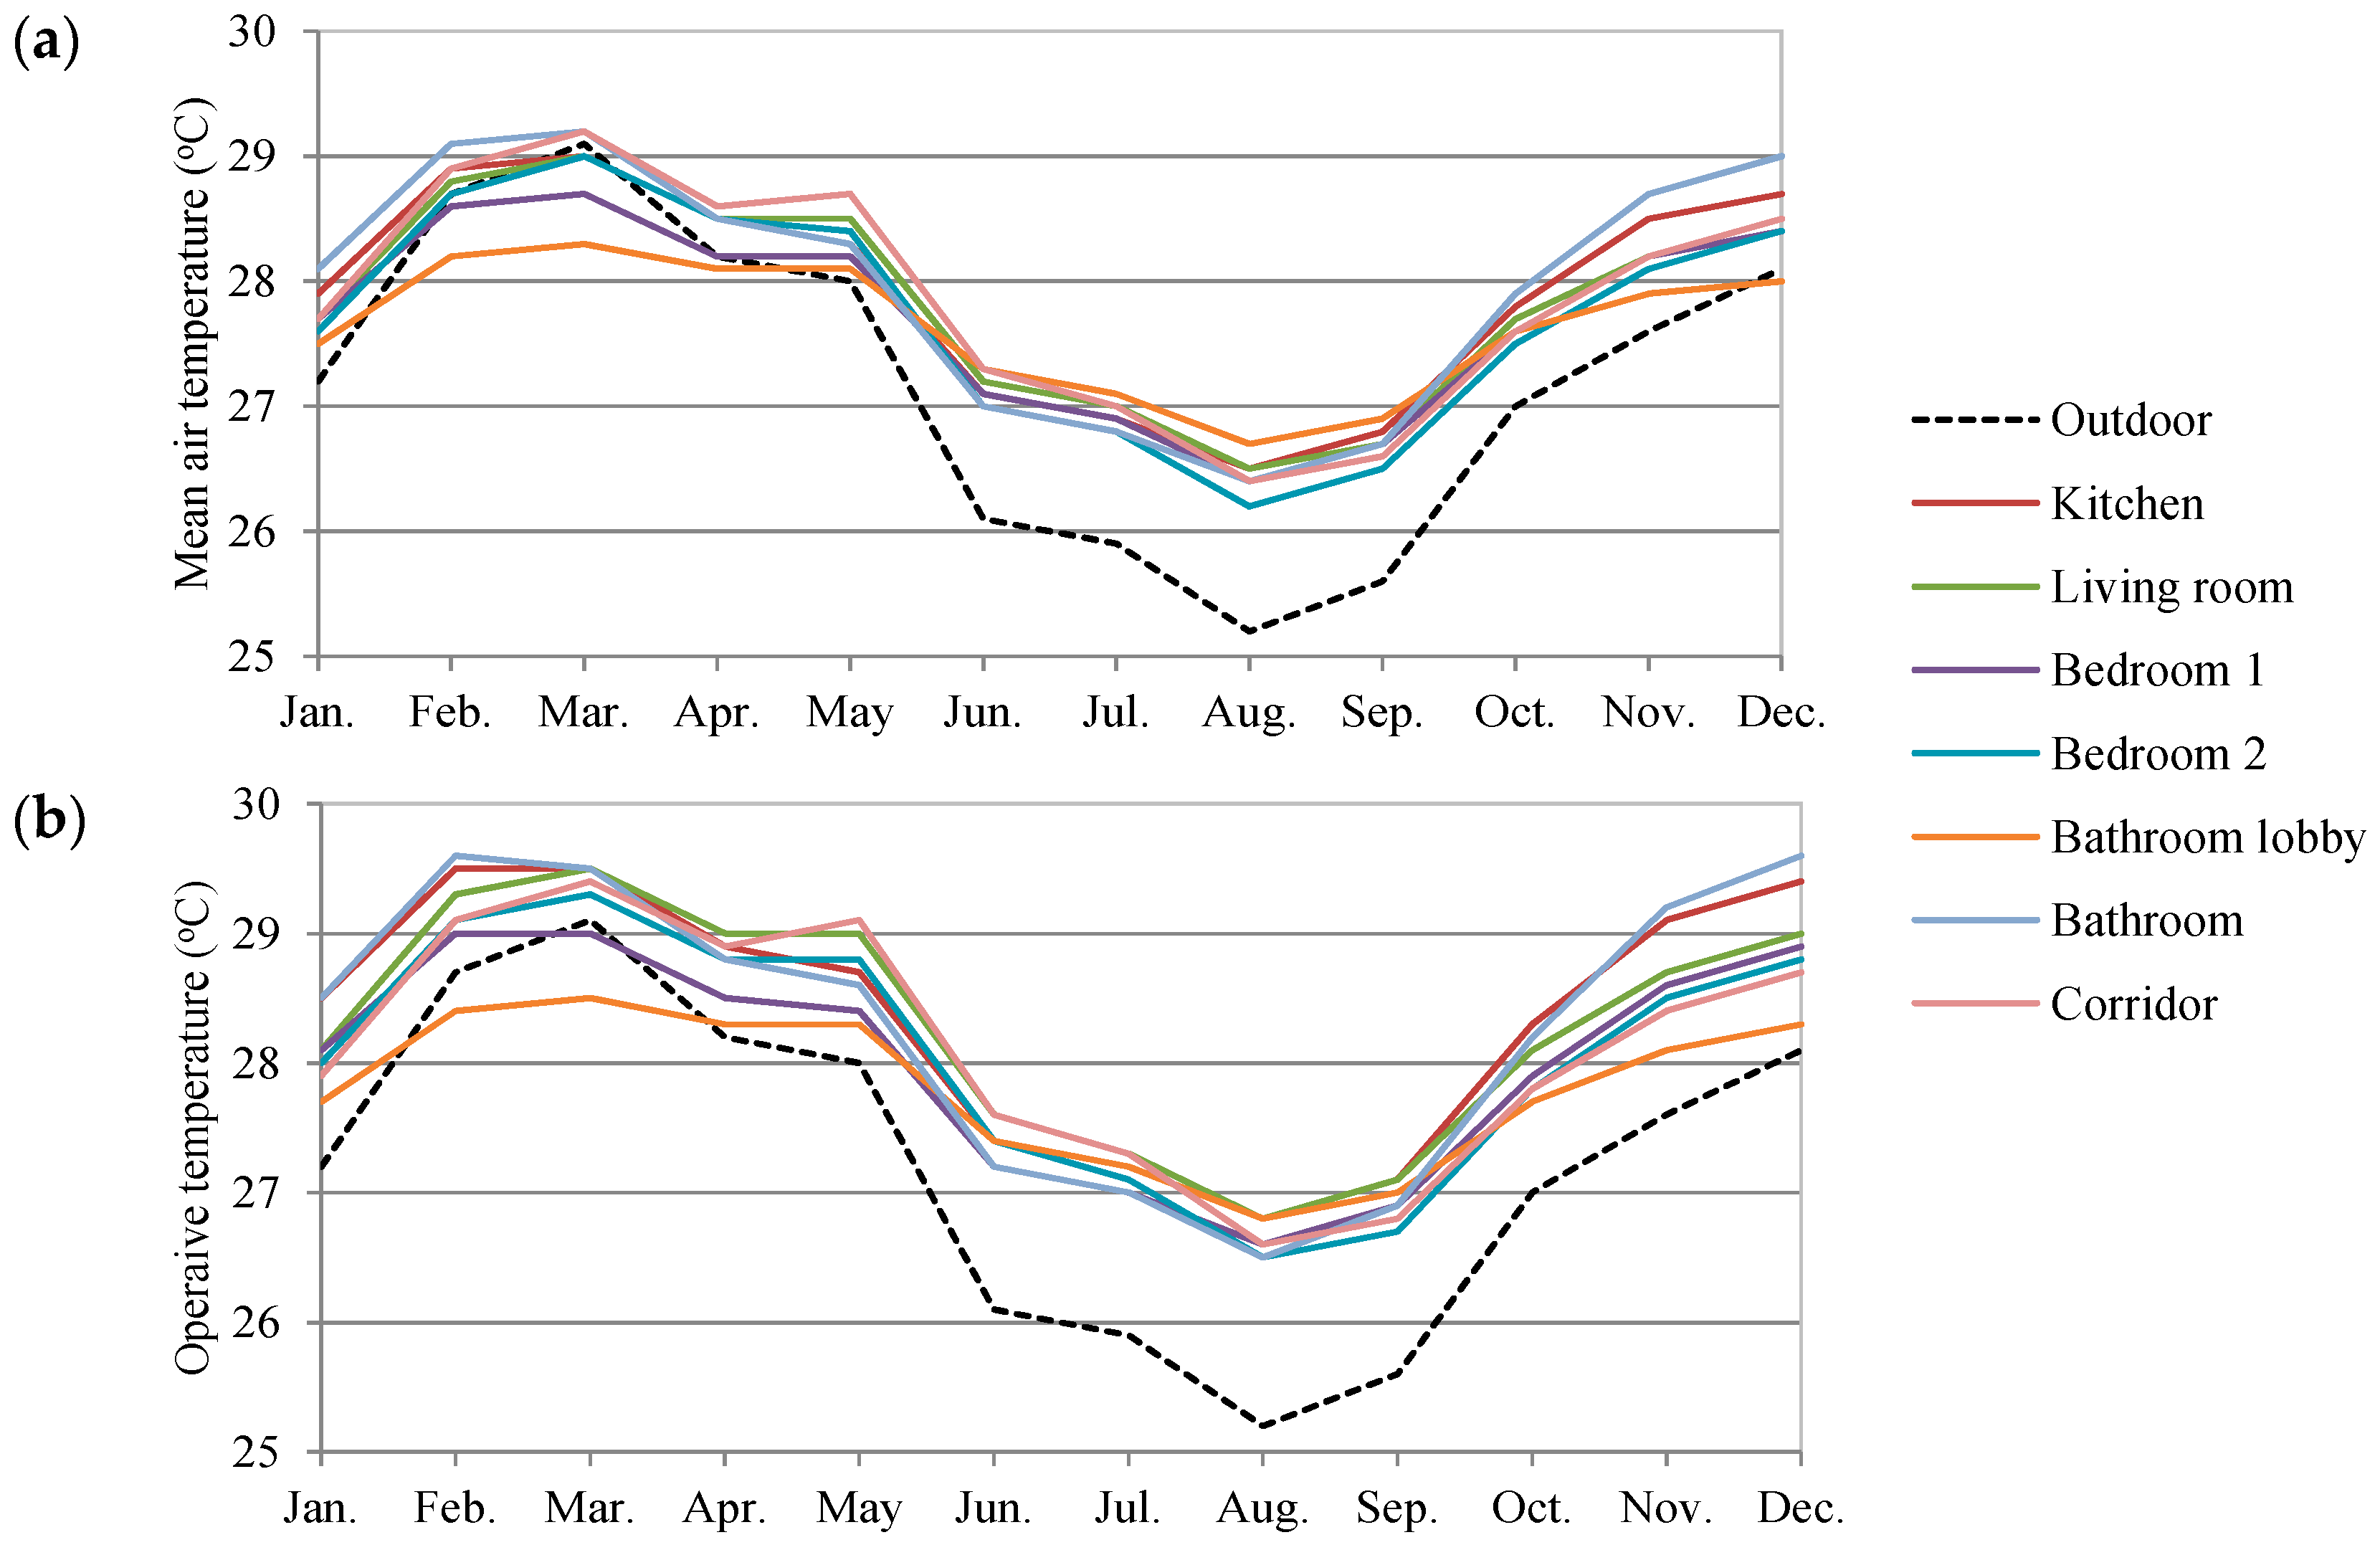
| Jan. | 27.2 | 27.7 | 28.1 | 28.7 | 28.7 | 29.1 | 29.3 | 29.1 | 29.5 |
| Feb. | 28.7 | 28.7 | 29.1 | 29.9 | 29.5 | 29.8 | 30.4 | 29.9 | 30.3 |
| Mar. | 29.1 | 28.9 | 29.2 | 30.0 | 29.5 | 29.9 | 30.5 | 29.9 | 30.3 |
| Apr. | 28.2 | 28.4 | 28.7 | 29.6 | 29.3 | 29.7 | 30.3 | 29.8 | 30.1 |
| May | 28.0 | 28.4 | 28.7 | 28.9 | 28.9 | 29.3 | 29.5 | 29.4 | 29.8 |
| Jun. | 26.1 | 27.1 | 27.4 | 27.4 | 27.9 | 28.2 | 28.0 | 28.3 | 28.6 |
| Jul. | 25.9 | 26.9 | 27.2 | 26.8 | 27.6 | 27.8 | 27.4 | 27.9 | 28.2 |
| Aug. | 25.2 | 26.4 | 26.7 | 26.1 | 27.1 | 27.3 | 26.7 | 27.5 | 27.7 |
| Sep. | 25.6 | 26.7 | 26.9 | 26.8 | 27.5 | 27.7 | 27.4 | 27.8 | 28.1 |
| Oct. | 27.0 | 27.7 | 28.0 | 27.8 | 28.2 | 28.5 | 28.4 | 28.5 | 28.9 |
| Nov. | 27.6 | 28.3 | 28.7 | 28.5 | 28.8 | 29.2 | 29.1 | 29.1 | 29.5 |
| Dec. | 28.1 | 28.5 | 29.0 | 28.9 | 28.9 | 29.3 | 29.5 | 29.3 | 29.7 |
| Mean | 27.2 | 27.8 | 28.1 | 28.3 | 28.5 | 28.8 | 28.9 | 28.9 | 29.2 |
| Comfort Reference | Recent | 2030 Scenario | 2050 Scenario |
|---|---|---|---|
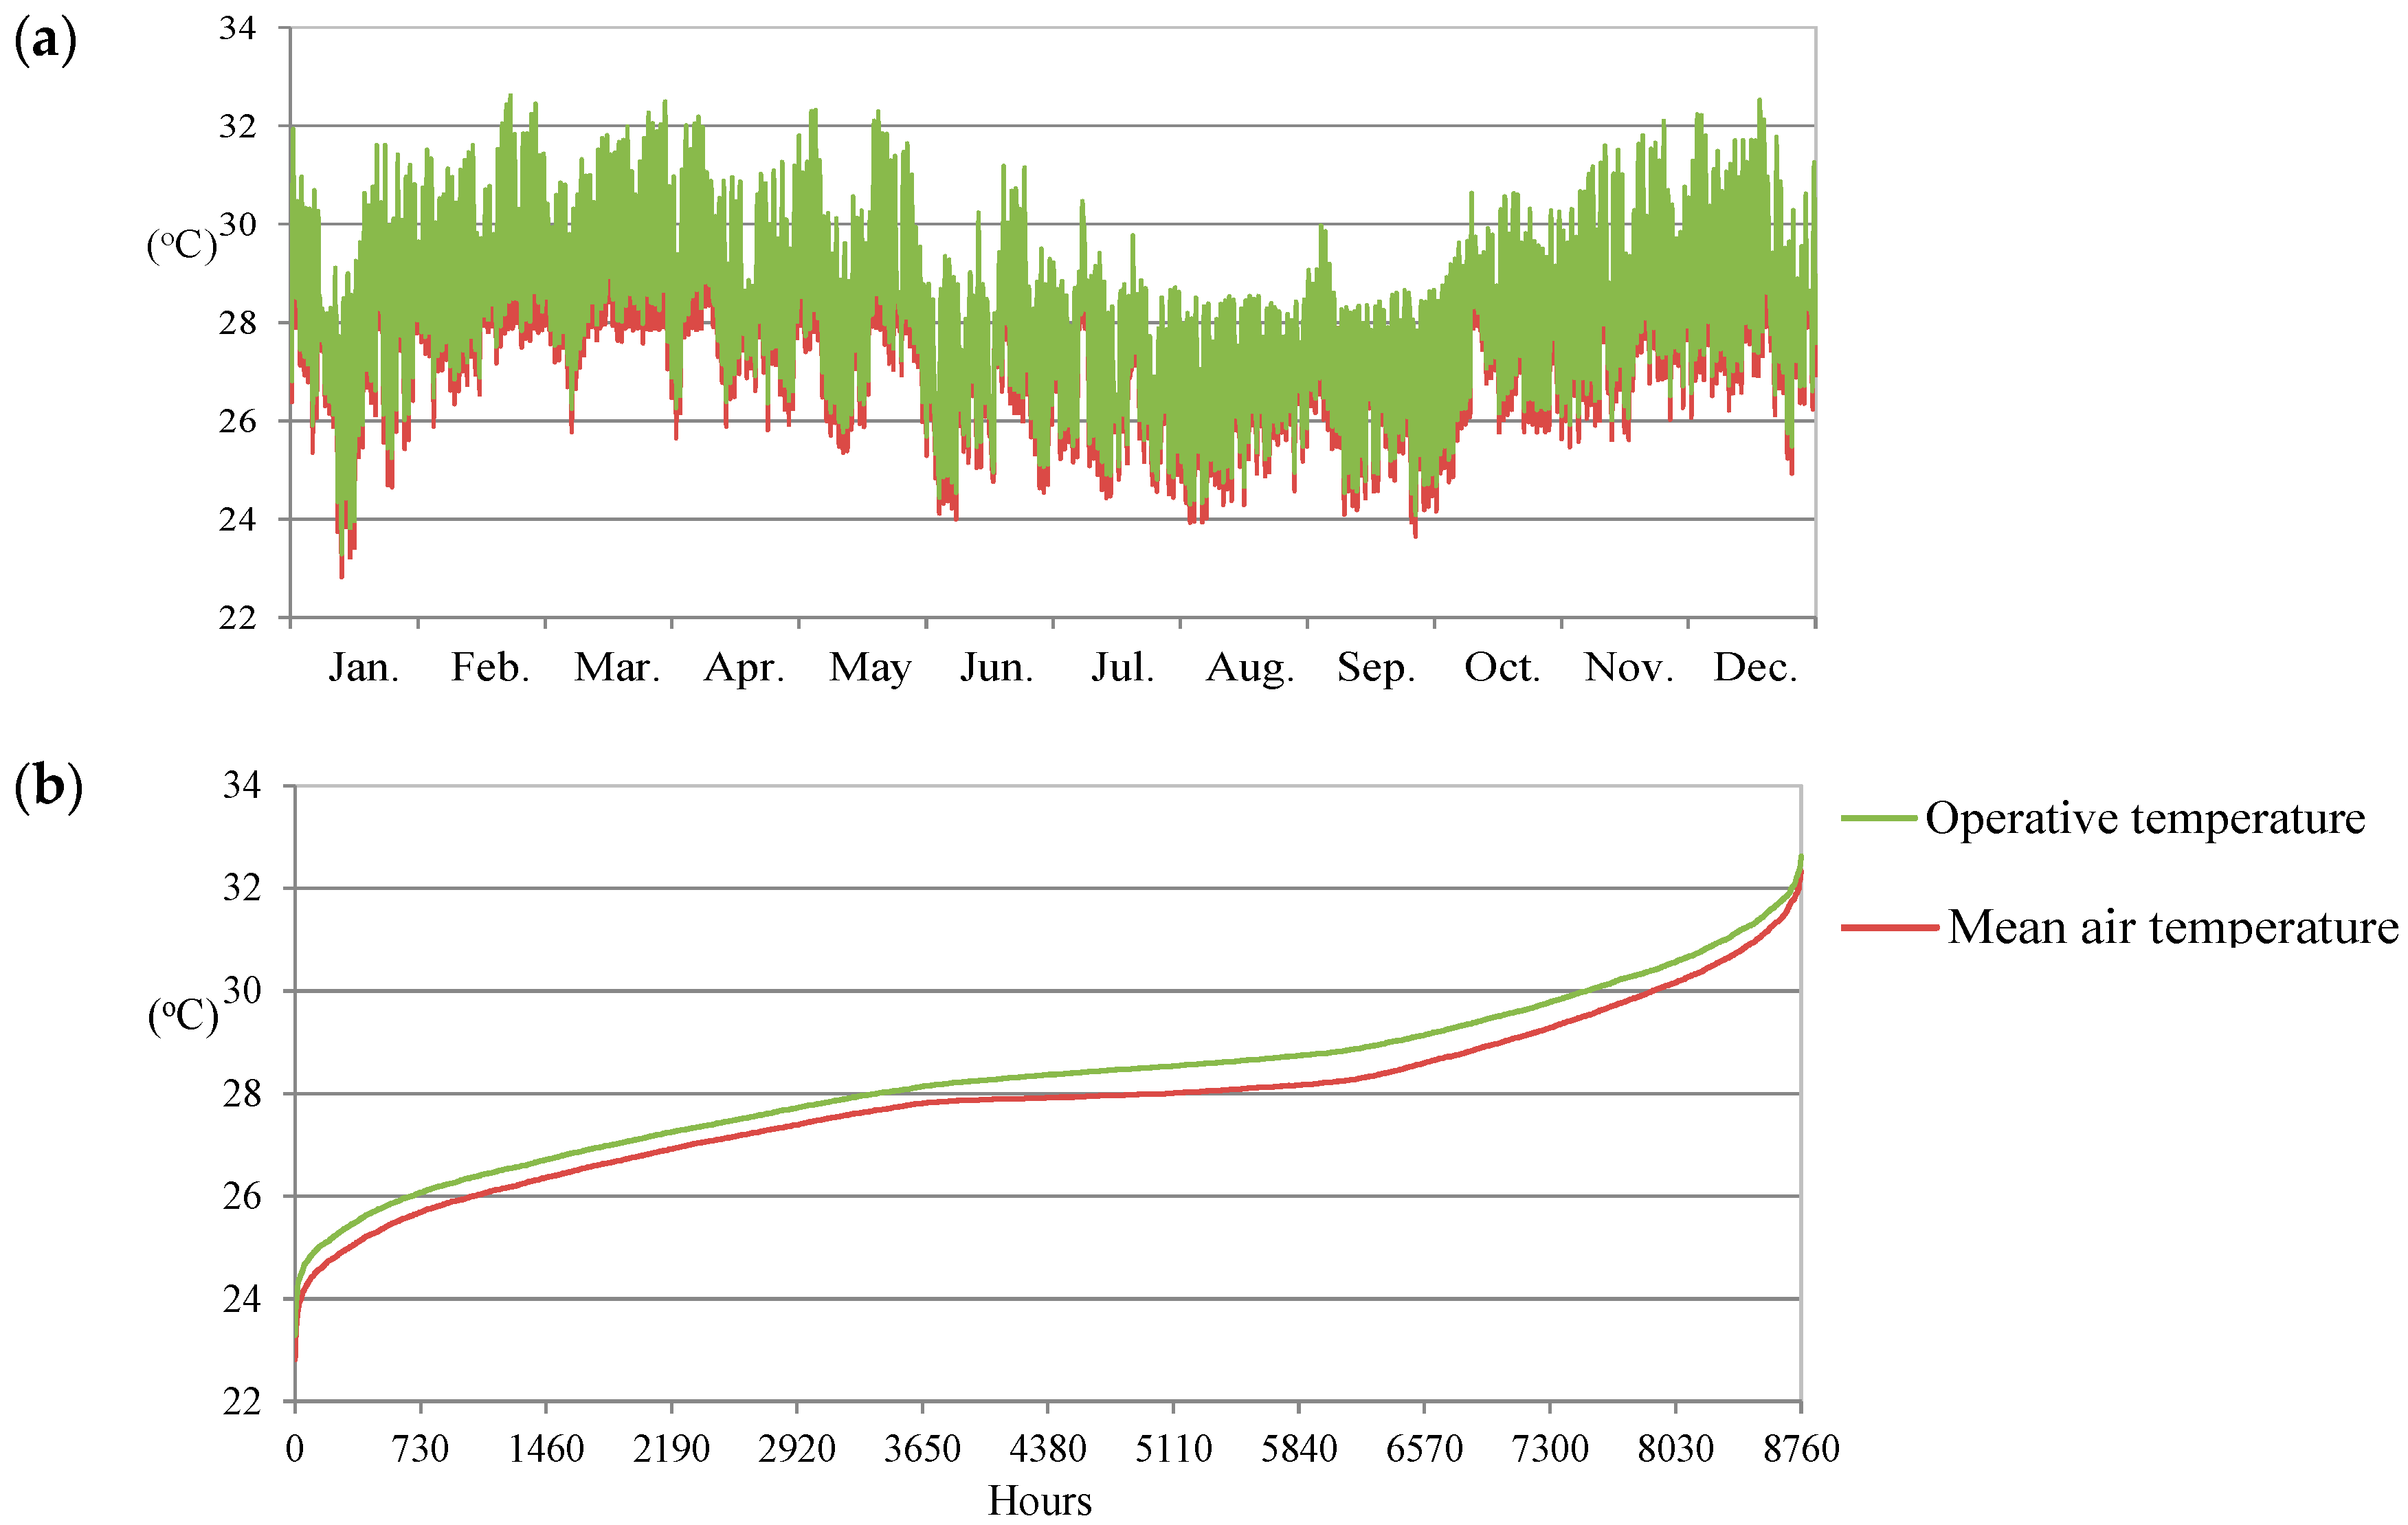
| Share of hours with operative temperature above 27 °C in average zone | 78% | 90% | 95% |
| Share of total occupant hours with thermal dissatisfaction | 37% | 46% | 52% |
| Strategy | Climate | Cooling Energy Use | Peak Cooling Load | ||
|---|---|---|---|---|---|
| kWh/m2 | Change from Reference (%) | W/m2 | Change from Reference (%) | ||
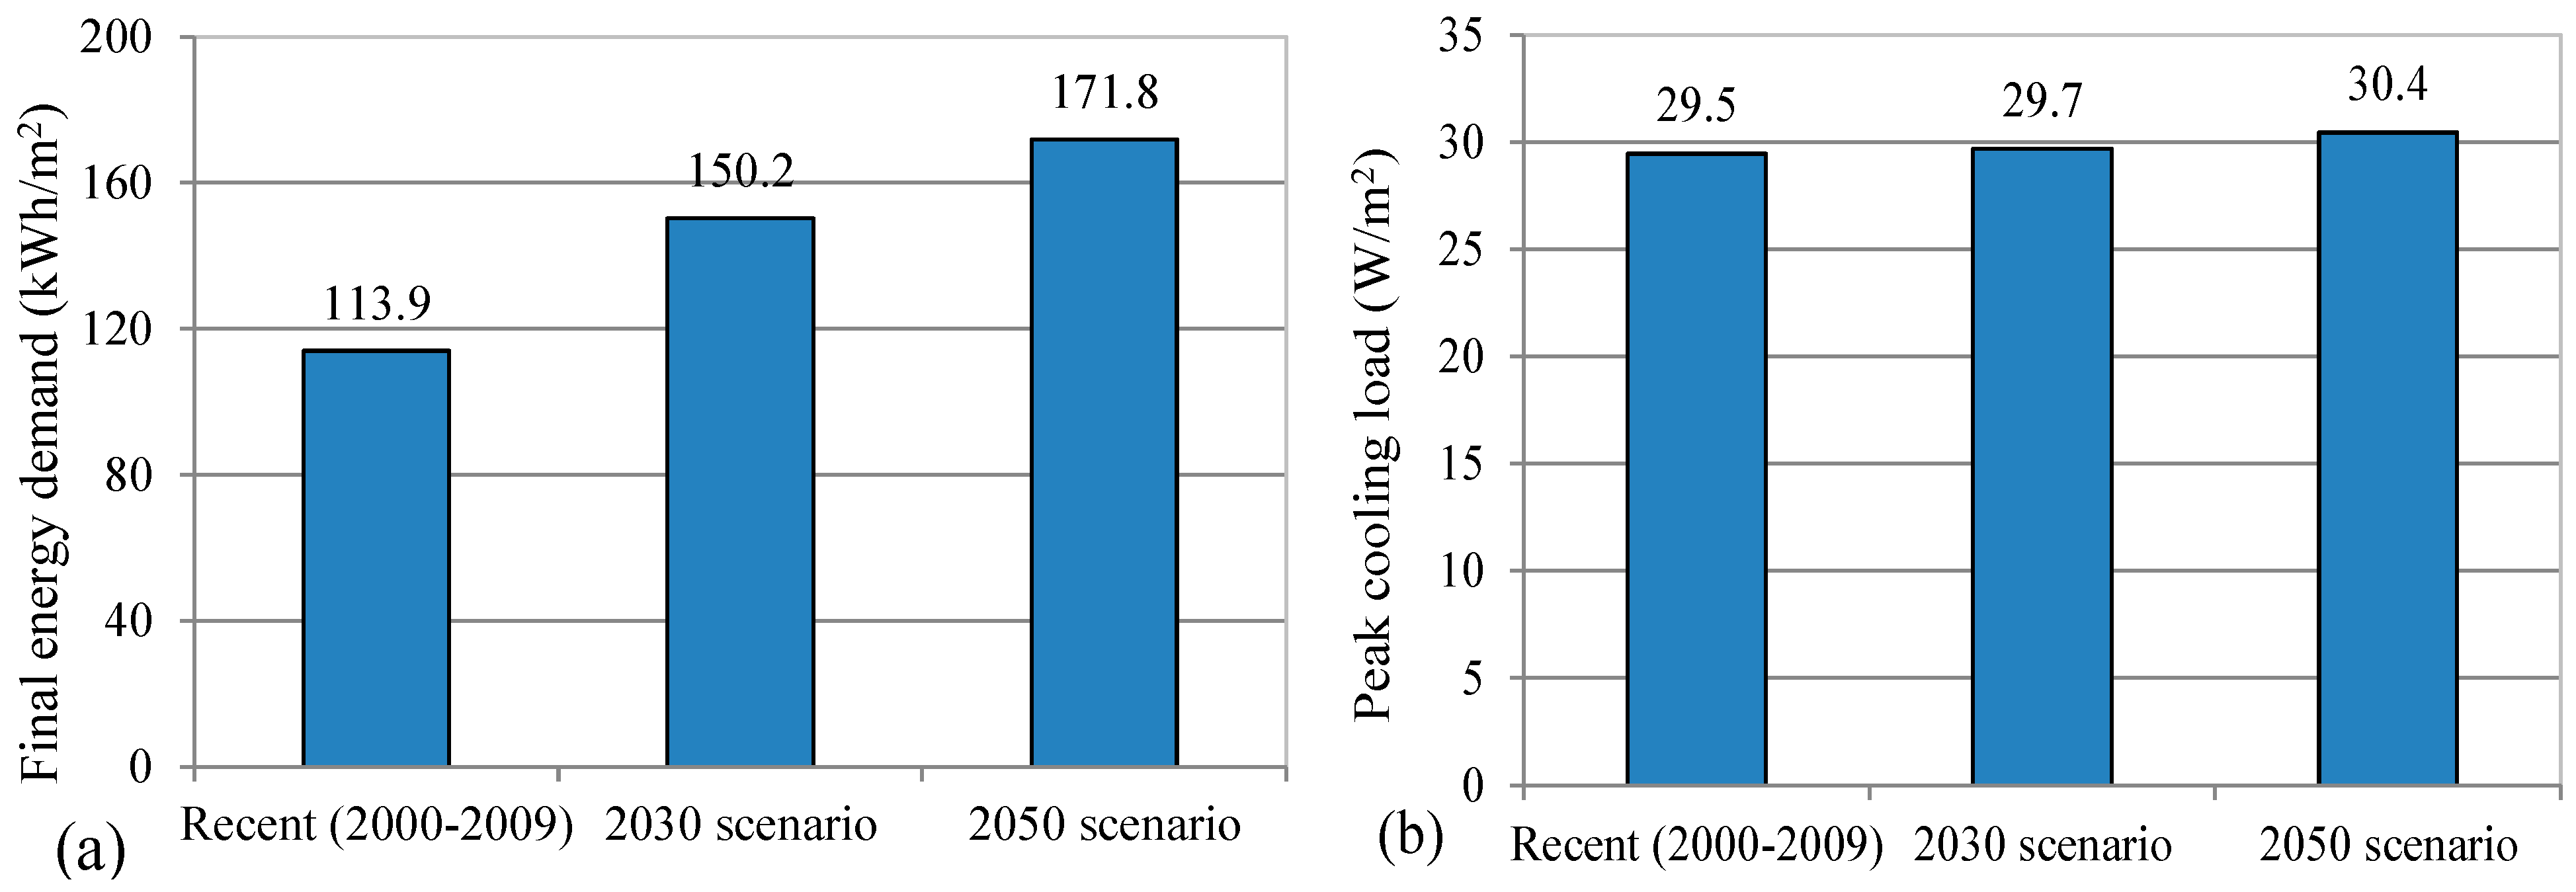
| Reference | Recent | 113.9 | - | 29.5 | - |
| 2030 scenario | 150.2 | - | 29.7 | - | |
| 2050 scenario | 171.8 | - | 30.4 | - | |
| South orientation | Recent | 112.5 | −1.2 | 29.5 | 0.0 |
| 2030 scenario | 149.1 | −0.7 | 29.7 | 0.0 | |
| 2050 scenario | 170.9 | −0.5 | 30.4 | 0.0 | |
| East orientation | Recent | 129.0 | 13.3 | 29.5 | 0.0 |
| 2030 scenario | 163.5 | 8.9 | 29.8 | 0.4 | |
| 2050 scenario | 183.5 | 6.8 | 30.4 | 0.0 | |
| West orientation | Recent | 127.9 | 12.3 | 29.5 | 0.0 |
| 2030 scenario | 162.2 | 8.0 | 29.8 | 0.4 | |
| 2050 scenario | 182.4 | 6.2 | 30.5 | 0.4 | |
| Shading | Recent | 107.0 | −6.1 | 29.5 | 0.0 |
| 2030 scenario | 143.8 | −4.3 | 29.7 | 0.0 | |
| 2050 scenario | 165.9 | −3.4 | 30.4 | 0.0 | |
| +20% window area (increase) | Recent | 115.9 | 1.8 | 29.6 | 0.4 |
| 2030 scenario | 152.5 | 1.5 | 29.8 | 0.4 | |
| 2050 scenario | 173.8 | 1.2 | 30.5 | 0.4 | |
| −20% window area (decrease) | Recent | 111.0 | −2.5 | 29.5 | 0.0 |
| 2030 scenario | 146.0 | −2.8 | 29.7 | 0.0 | |
| 2050 scenario | 168.5 | −1.9 | 30.4 | 0.0 | |
| 1.8 W/m2K window | Recent | 107.2 | −5.9 | 29.5 | 0.0 |
| 2030 scenario | 144.4 | −3.9 | 29.7 | 0.0 | |
| 2050 scenario | 166.7 | −3.0 | 30.4 | 0.0 | |
| 100 mm insulation | Recent | 100.4 | −11.9 | 29.5 | 0.0 |
| 2030 scenario | 137.1 | −8.7 | 29.7 | 0.0 | |
| 2050 scenario | 159.5 | −7.2 | 30.4 | 0.0 | |
| Strategy | Climate | Operative Temperature (°C) | Operative Temperature above 27 °C a (%) | Thermal Dissatisfaction b (%) | |||
|---|---|---|---|---|---|---|---|
| Value | Change from Reference | Value | Change from Reference | Value | Change from Reference | ||
| Reference | Recent | 28.1 | - | 78 | - | 37 | - |
| 2030 scenario | 28.8 | - | 90 | - | 46 | - | |
| 2050 scenario | 29.2 | - | 95 | - | 52 | - | |
| South orientation | Recent | 28.1 | −0.1 | 77 | −1 | 37 | 0 |
| 2030 scenario | 28.8 | 0.0 | 90 | 0 | 46 | 0 | |
| 2050 scenario | 29.2 | 0.0 | 95 | 0 | 52 | 0 | |
| East orientation | Recent | 28.5 | 0.3 | 83 | 5 | 42 | 5 |
| 2030 scenario | 29.2 | 0.3 | 92 | 2 | 51 | 5 | |
| 2050 scenario | 29.6 | 0.4 | 96 | 1 | 57 | 5 | |
| West orientation | Recent | 28.9 | 0.8 | 83 | 5 | 42 | 5 |
| 2030 scenario | 29.2 | 0.4 | 92 | 2 | 51 | 5 | |
| 2050 scenario | 29.6 | 0.4 | 96 | 1 | 57 | 5 | |
| Shading window | Recent | 27.9 | −0.2 | 75 | −3 | 35 | –2 |
| 2030 scenario | 28.6 | −0.2 | 89 | −1 | 44 | –2 | |
| 2050 scenario | 29.0 | −0.2 | 94 | −1 | 50 | –2 | |
| +20% window area (increase) | Recent | 27.8 | −0.3 | 76 | −2 | 38 | 1 |
| 2030 scenario | 28.9 | 0.1 | 88 | −2 | 48 | 2 | |
| 2050 scenario | 29.3 | 0.1 | 94 | -1 | 54 | 2 | |
| −20% window area (decrease) | Recent | 28.1 | 0.0 | 81 | 3 | 36 | −1 |
| 2030 scenario | 28.7 | −0.1 | 92 | 2 | 45 | −1 | |
| 2050 scenario | 29.1 | −0.1 | 96 | 1 | 51 | −1 | |
| 1.8 W/m2K window | Recent | 28.0 | −0.2 | 76 | −2 | 35 | −2 |
| 2030 scenario | 28.6 | −0.2 | 89 | −1 | 44 | −2 | |
| 2050 scenario | 29.0 | −0.2 | 95 | 0 | 50 | −2 | |
| 100 mm insulation | Recent | 27.9 | −0.3 | 74 | −4 | 34 | −3 |
| 2030 scenario | 28.5 | −0.3 | 88 | −2 | 43 | −3 | |
| 2050 scenario | 28.9 | −0.3 | 94 | −1 | 49 | −3 | |
| Climate | Final Energy Demand (kWh/m2) | Peak Load (W/m2) | Annual Total Energy & Carbon Reductions (Base Case—Improved) | |||
|---|---|---|---|---|---|---|
| Base Case | Improved | Base Case | Improved | Energy (kWh) | Carbon (kgCO2) | |
| Recent | 113.9 | 83.4 | 29.5 | 29.4 | 2836.5 | 1219.7 |
| 2030 scenario | 150.2 | 119.2 | 29.7 | 29.7 | 2883.0 | 1239.7 |
| 2050 scenario | 171.8 | 142.2 | 30.4 | 30.4 | 2752.8 | 1183.7 |
| Climate | Operative Temperature (°C) | Absolute Difference (°C) | Thermal Dissatisfaction a (%) | Absolute Difference (%) | ||
|---|---|---|---|---|---|---|
| Base Case | Improved | Base Case | Improved | |||
| Recent | 28.1 | 27.6 | 0.6 | 37.0 | 29.0 | 8.0 |
| 2030 scenario | 28.8 | 28.1 | 0.7 | 46.0 | 37.0 | 9.0 |
| 2050 scenario | 29.2 | 28.5 | 0.7 | 52.0 | 43.0 | 9.0 |
| Month | Recent | 2050 Climate | ||||||
|---|---|---|---|---|---|---|---|---|
| PMV | PPD | PMV | PPD | |||||
| Base Case | Improved | Base Case | Improved | Base Case | Improved | Base Case | Improved | |
| Jan. | 1.1 | 0.9 | 34.7 | 25.9 | 1.6 | 1.3 | 54.8 | 41.8 |
| Feb. | 1.5 | 1.3 | 49.9 | 38.4 | 1.9 | 1.5 | 68.4 | 53.9 |
| Mar. | 1.5 | 1.3 | 53.1 | 42.5 | 1.9 | 1.6 | 69.0 | 56.0 |
| Apr. | 1.4 | 1.3 | 46.2 | 38.3 | 1.9 | 1.6 | 68.0 | 56.3 |
| May | 1.4 | 1.2 | 45.0 | 35.9 | 1.8 | 1.5 | 61.0 | 48.7 |
| Jun. | 1.0 | 0.9 | 27.6 | 22.1 | 1.4 | 1.2 | 45.0 | 37.2 |
| Jul. | 0.9 | 0.8 | 23.9 | 19.0 | 1.2 | 1.1 | 36.5 | 31.8 |
| Aug. | 0.8 | 0.6 | 18.0 | 14.1 | 1.0 | 1.0 | 28.7 | 25.8 |
| Sep. | 0.8 | 0.7 | 21.8 | 17.9 | 1.2 | 1.1 | 35.6 | 31.5 |
| Oct. | 1.1 | 1.0 | 34.2 | 27.7 | 1.5 | 1.3 | 48.0 | 38.1 |
| Nov. | 1.3 | 1.1 | 44.0 | 32.7 | 1.7 | 1.4 | 58.0 | 44.6 |
| Dec. | 1.4 | 1.2 | 47.5 | 35.7 | 1.7 | 1.4 | 59.1 | 44.9 |
| Mean | 1.2 | 1.0 | 37.1 | 29.1 | 1.5 | 1.3 | 52.6 | 42.5 |
| Kumasi Climate | Final Energy Demand (kWh/m2) | Peak Load (W/m2) | Annual Total Energy & Carbon Reductions (Base Case—Improved) | |||
|---|---|---|---|---|---|---|
| Base Case | Improved | Base Case | Improved | Energy (kWh) | Carbon (kg CO2) | |
| Recent | 104.4 | 74.4 | 26.9 | 15.4 | 3843.0 | 1652.5 |
| 2030 scenario | 110.9 | 78.4 | 26.9 | 15.4 | 4163.3 | 1790.2 |
| 2050 scenario | 120.3 | 84.6 | 29.1 | 16.5 | 4573.2 | 1966.5 |
| Kumasi Climate | Operative Temperature (°C) | Absolute Difference (°C) | Thermal Dissatisfaction a (%) | Absolute Difference (%) | ||
|---|---|---|---|---|---|---|
| Base Case | Improved | Base Case | Improved | |||
| Recent | 28.6 | 28.3 | 0.3 | 32 | 29 | 3 |
| 2030 scenario | 28.7 | 28.3 | 0.4 | 33 | 29 | 4 |
| 2050 scenario | 28.8 | 28.3 | 0.5 | 34 | 29 | 5 |
| Month | Recent | 2050 Climate | ||||||
|---|---|---|---|---|---|---|---|---|
| PMV | PPD | PMV | PPD | |||||
| Base Case | Improved | Base Case | Improved | Base Case | Improved | Base Case | Improved | |
| Jan. | 1.1 | 1.1 | 31.9 | 28.4 | 1.2 | 1.1 | 32.5 | 28.5 |
| Feb. | 1.2 | 1.1 | 34.6 | 29.1 | 1.2 | 1.1 | 35.3 | 28.9 |
| Mar. | 1.2 | 1.1 | 35.2 | 29.3 | 1.2 | 1.1 | 36.9 | 29.4 |
| Apr. | 1.2 | 1.1 | 34.4 | 29.3 | 1.2 | 1.1 | 36.2 | 29.4 |
| May | 1.2 | 1.1 | 33.9 | 29.3 | 1.2 | 1.1 | 36.5 | 29.5 |
| Jun. | 1.1 | 1.1 | 31.2 | 29.0 | 1.2 | 1.1 | 33.8 | 29.2 |
| Jul. | 1.1 | 1.0 | 29.5 | 28.7 | 1.1 | 1.1 | 31.5 | 28.9 |
| Aug. | 1.0 | 1.0 | 27.3 | 28.1 | 1.1 | 1.0 | 29.6 | 28.6 |
| Sep. | 1.1 | 1.0 | 28.7 | 28.4 | 1.1 | 1.1 | 30.4 | 28.7 |
| Oct. | 1.1 | 1.1 | 31.6 | 28.9 | 1.2 | 1.1 | 33.2 | 28.9 |
| Nov. | 1.2 | 1.1 | 33.8 | 29.1 | 1.2 | 1.1 | 34.5 | 29.0 |
| Dec. | 1.2 | 1.1 | 33.2 | 29.0 | 1.2 | 1.1 | 33.1 | 28.9 |
| Mean | 1.2 | 1.1 | 32.1 | 28.9 | 1.2 | 1.1 | 33.6 | 29.0 |
© 2019 by the authors. Licensee MDPI, Basel, Switzerland. This article is an open access article distributed under the terms and conditions of the Creative Commons Attribution (CC BY) license (http://creativecommons.org/licenses/by/4.0/).
Share and Cite
Dodoo, A.; Ayarkwa, J. Effects of Climate Change for Thermal Comfort and Energy Performance of Residential Buildings in a Sub-Saharan African Climate. Buildings 2019, 9, 215. https://doi.org/10.3390/buildings9100215
Dodoo A, Ayarkwa J. Effects of Climate Change for Thermal Comfort and Energy Performance of Residential Buildings in a Sub-Saharan African Climate. Buildings. 2019; 9(10):215. https://doi.org/10.3390/buildings9100215
Chicago/Turabian StyleDodoo, Ambrose, and Joshua Ayarkwa. 2019. "Effects of Climate Change for Thermal Comfort and Energy Performance of Residential Buildings in a Sub-Saharan African Climate" Buildings 9, no. 10: 215. https://doi.org/10.3390/buildings9100215