Reflective Roofing Use on Commercial Buildings in the United States: An Energy Type and Cost Analysis

Abstract
:1. Introduction
2. Methods/Analysis Inputs
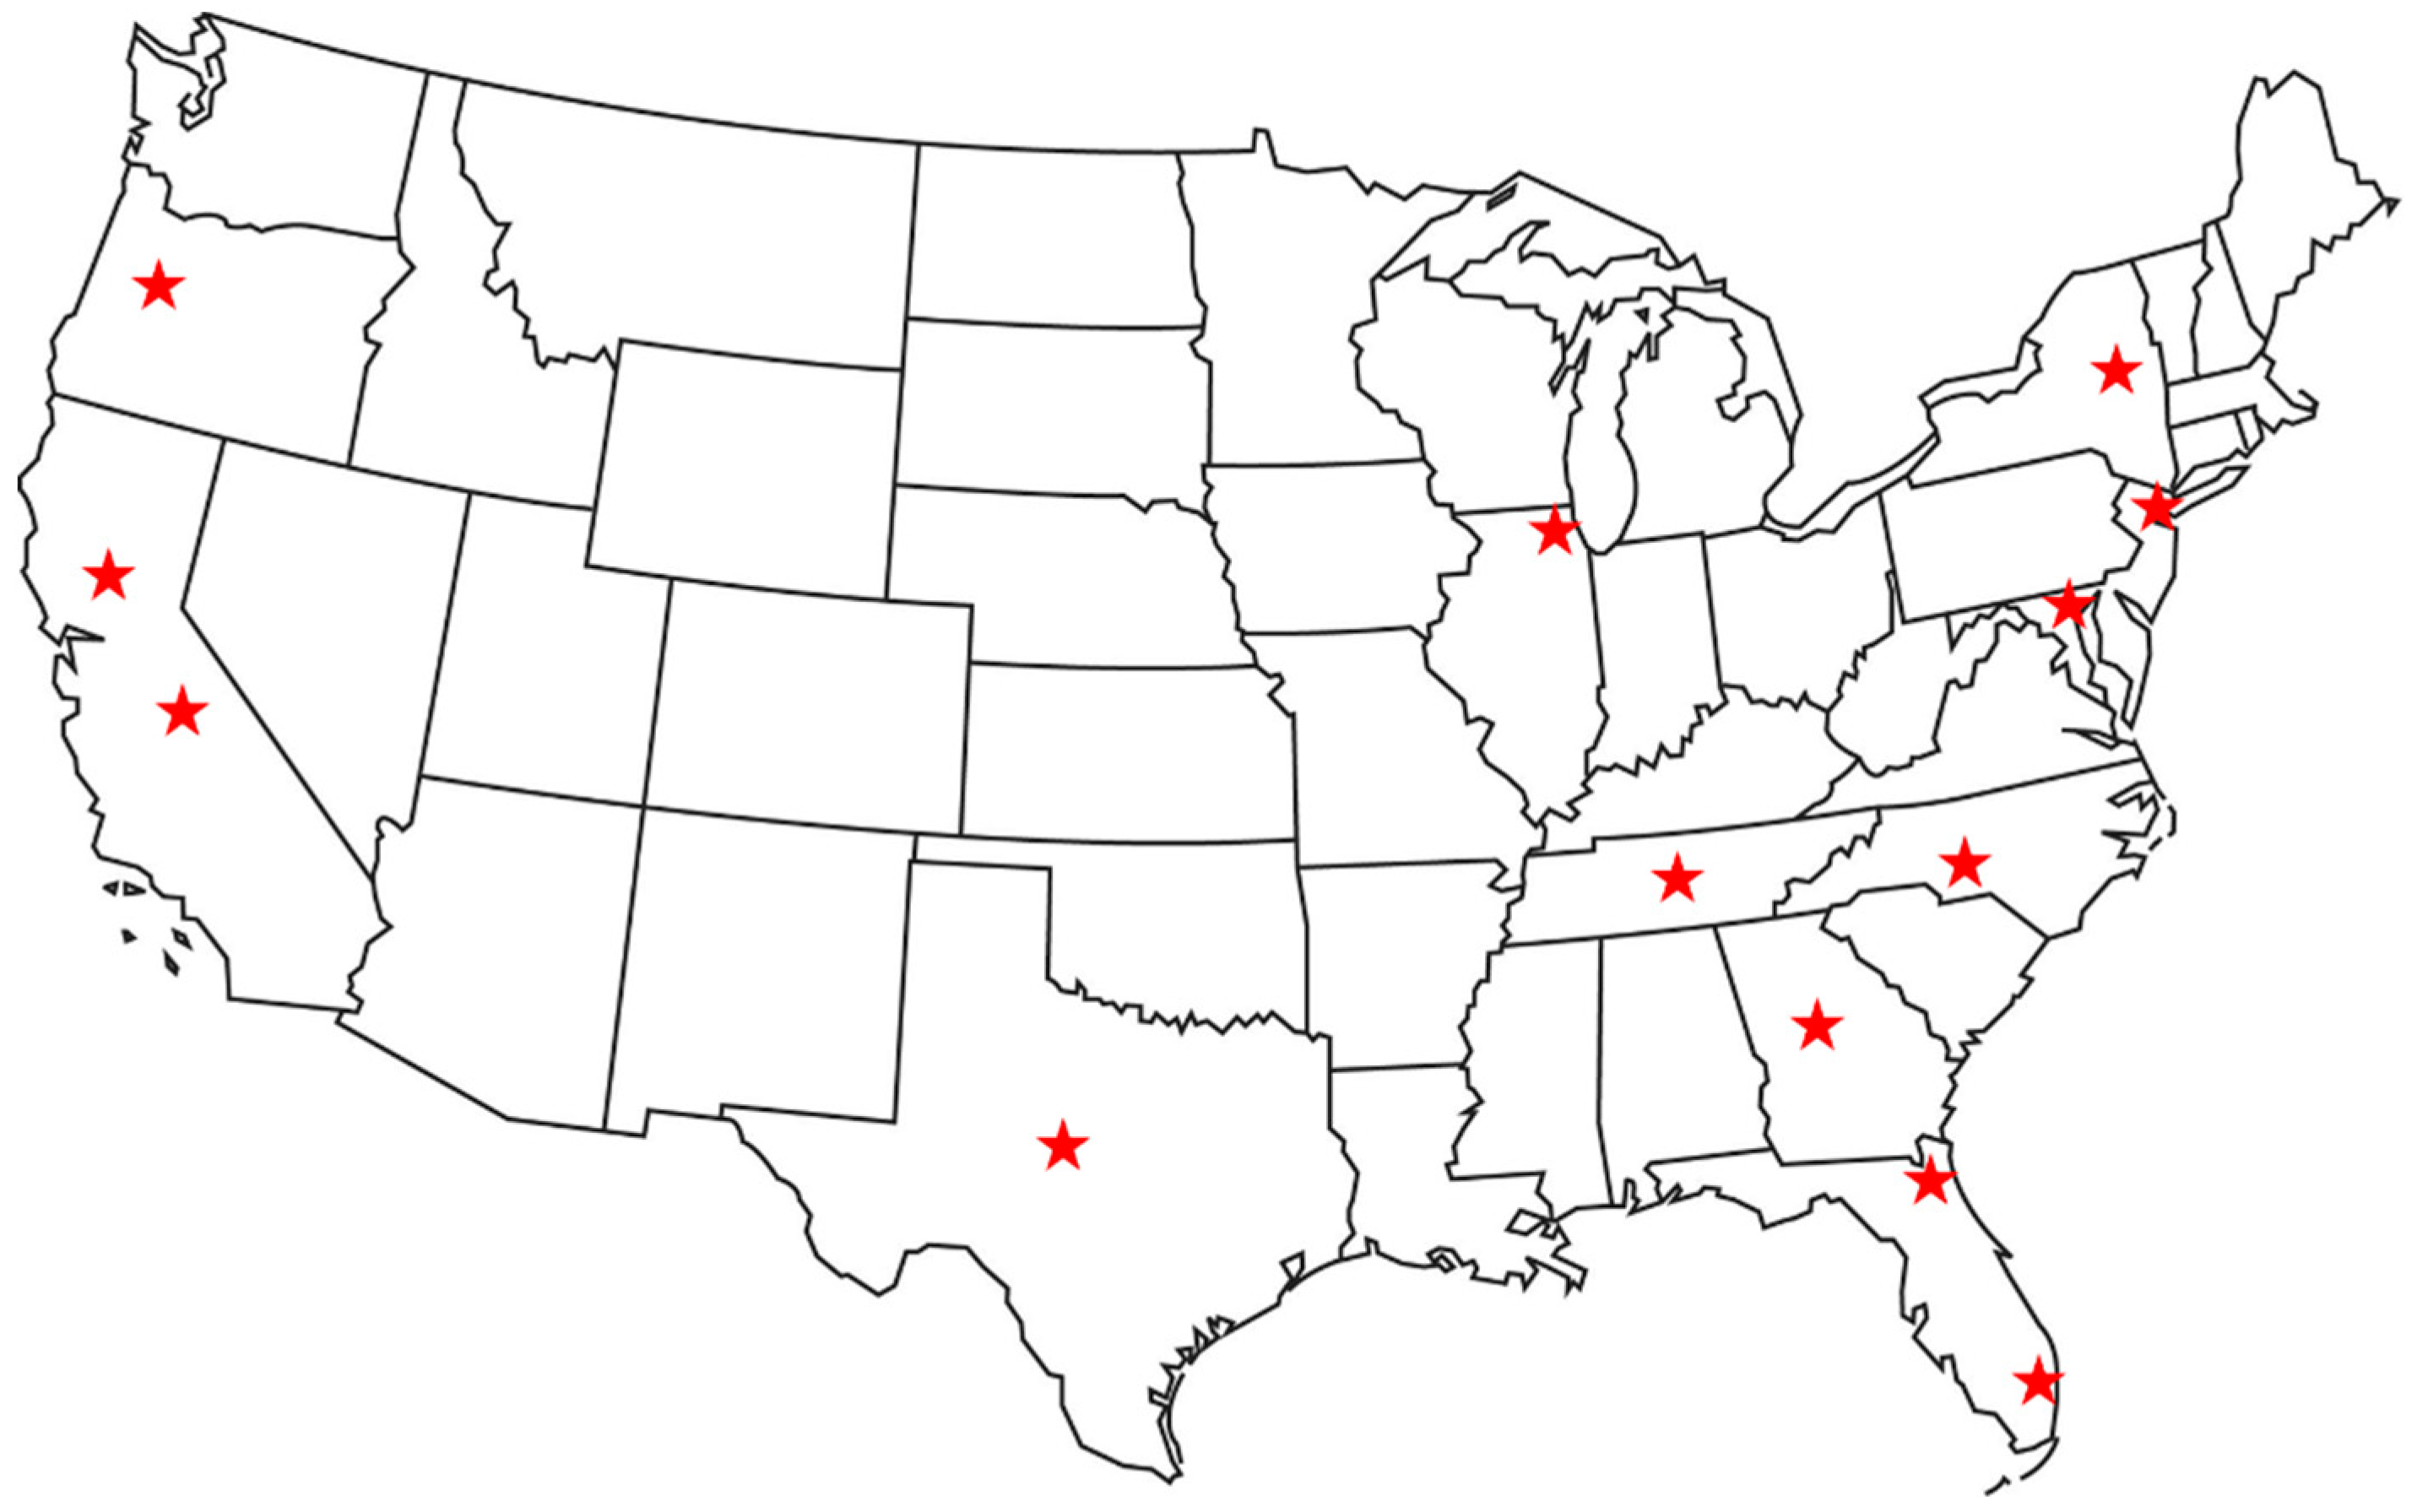
2.1. Locations
2.2. Energy Cost Modeling
2.3. Utility Costs
2.4. Roof System
2.5. Heating and Cooling System Efficiencies
3. Results
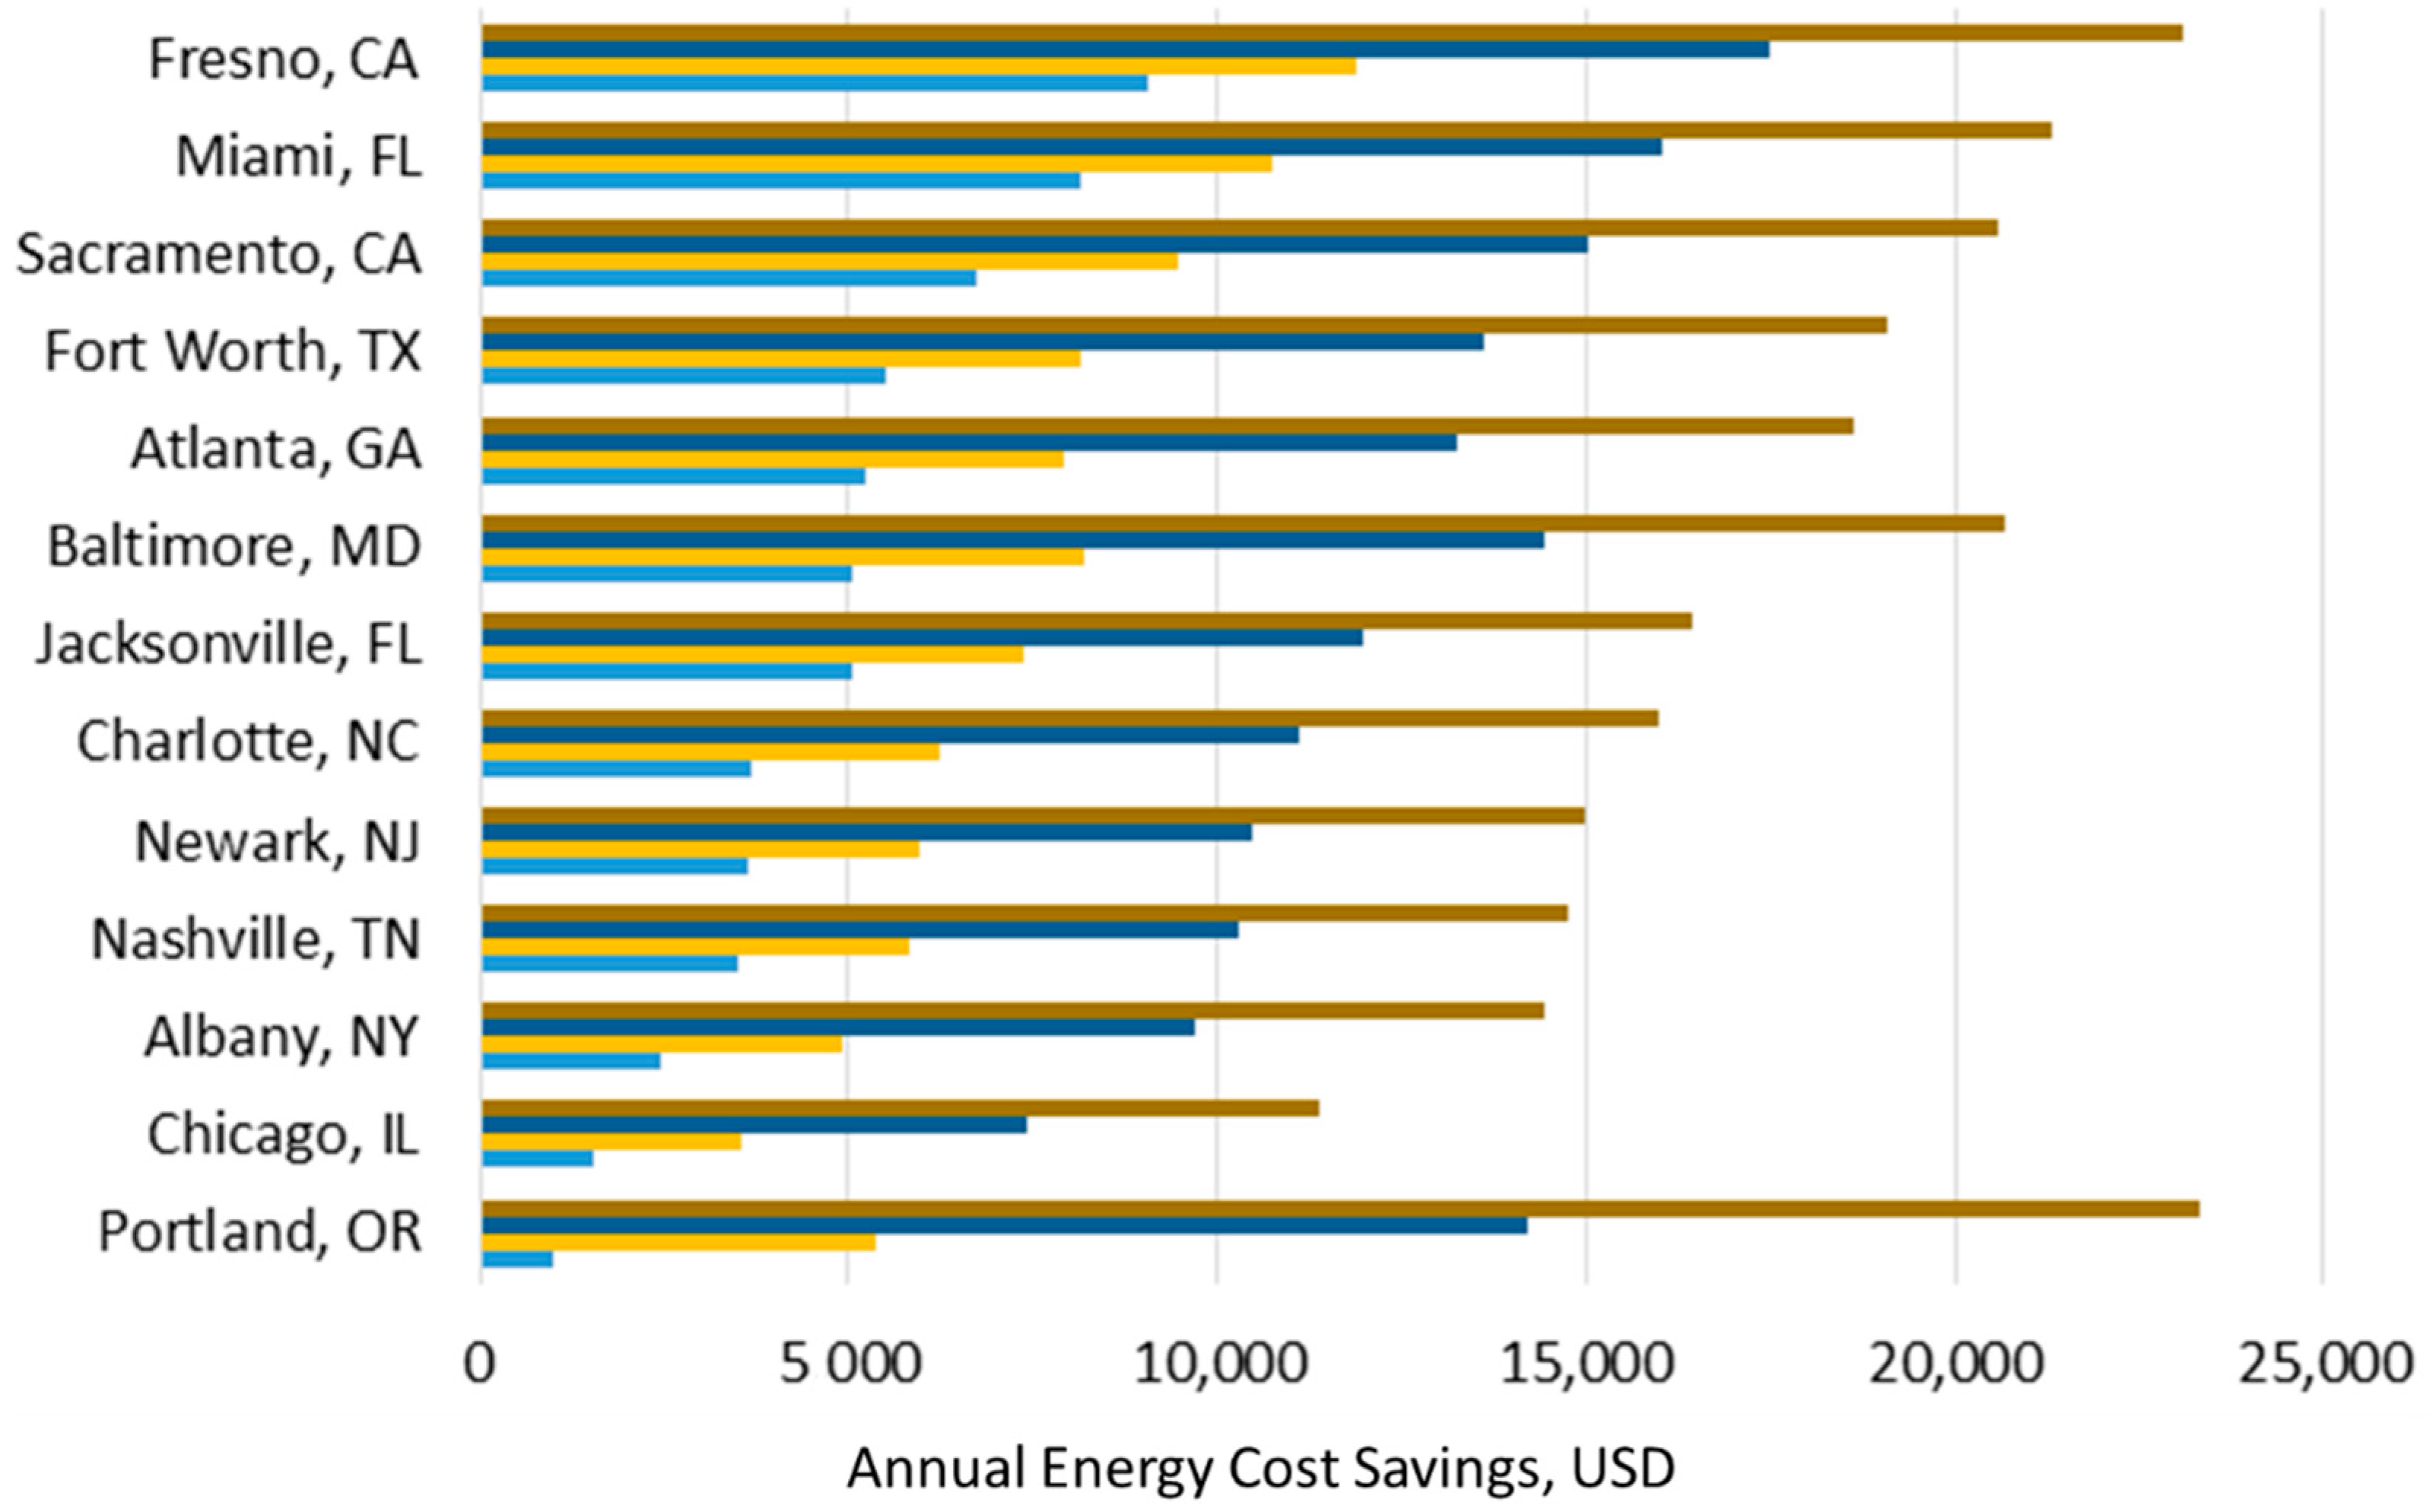
3.1. Gas Heat
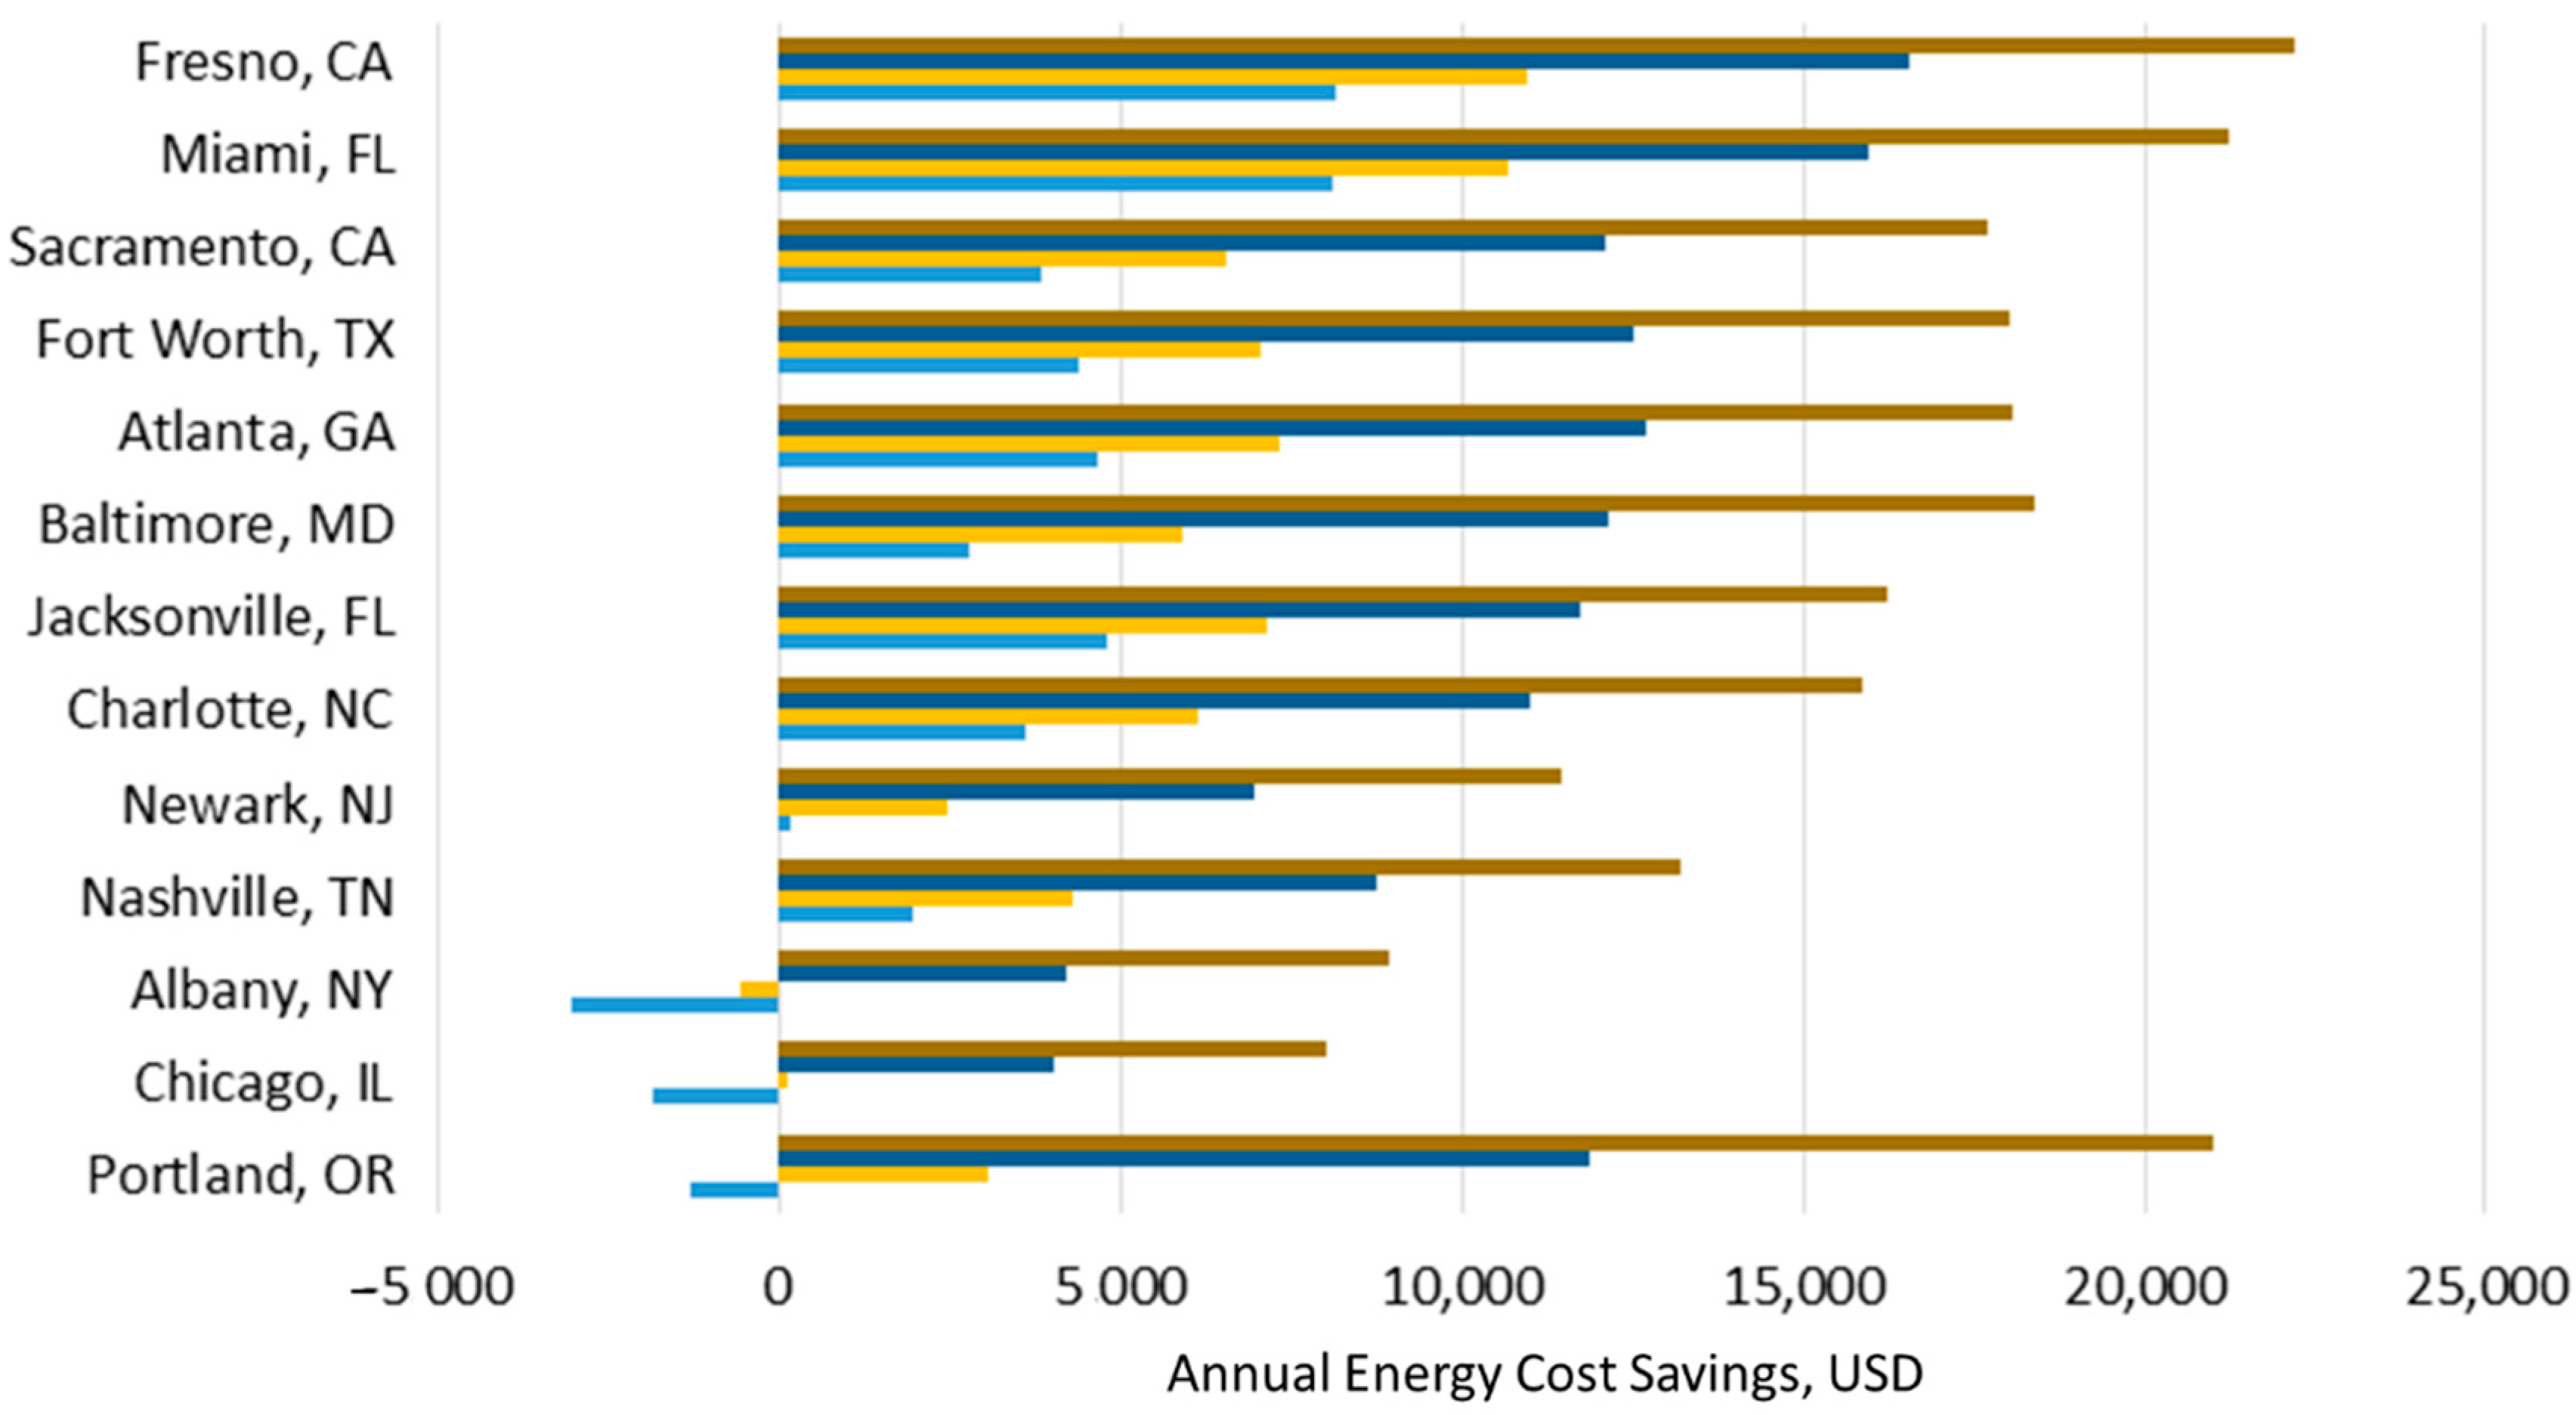
3.2. Electric Heat with High Reflectance Membrane
3.3. Electric Heat with Mid and Lower Reflectance Membranes
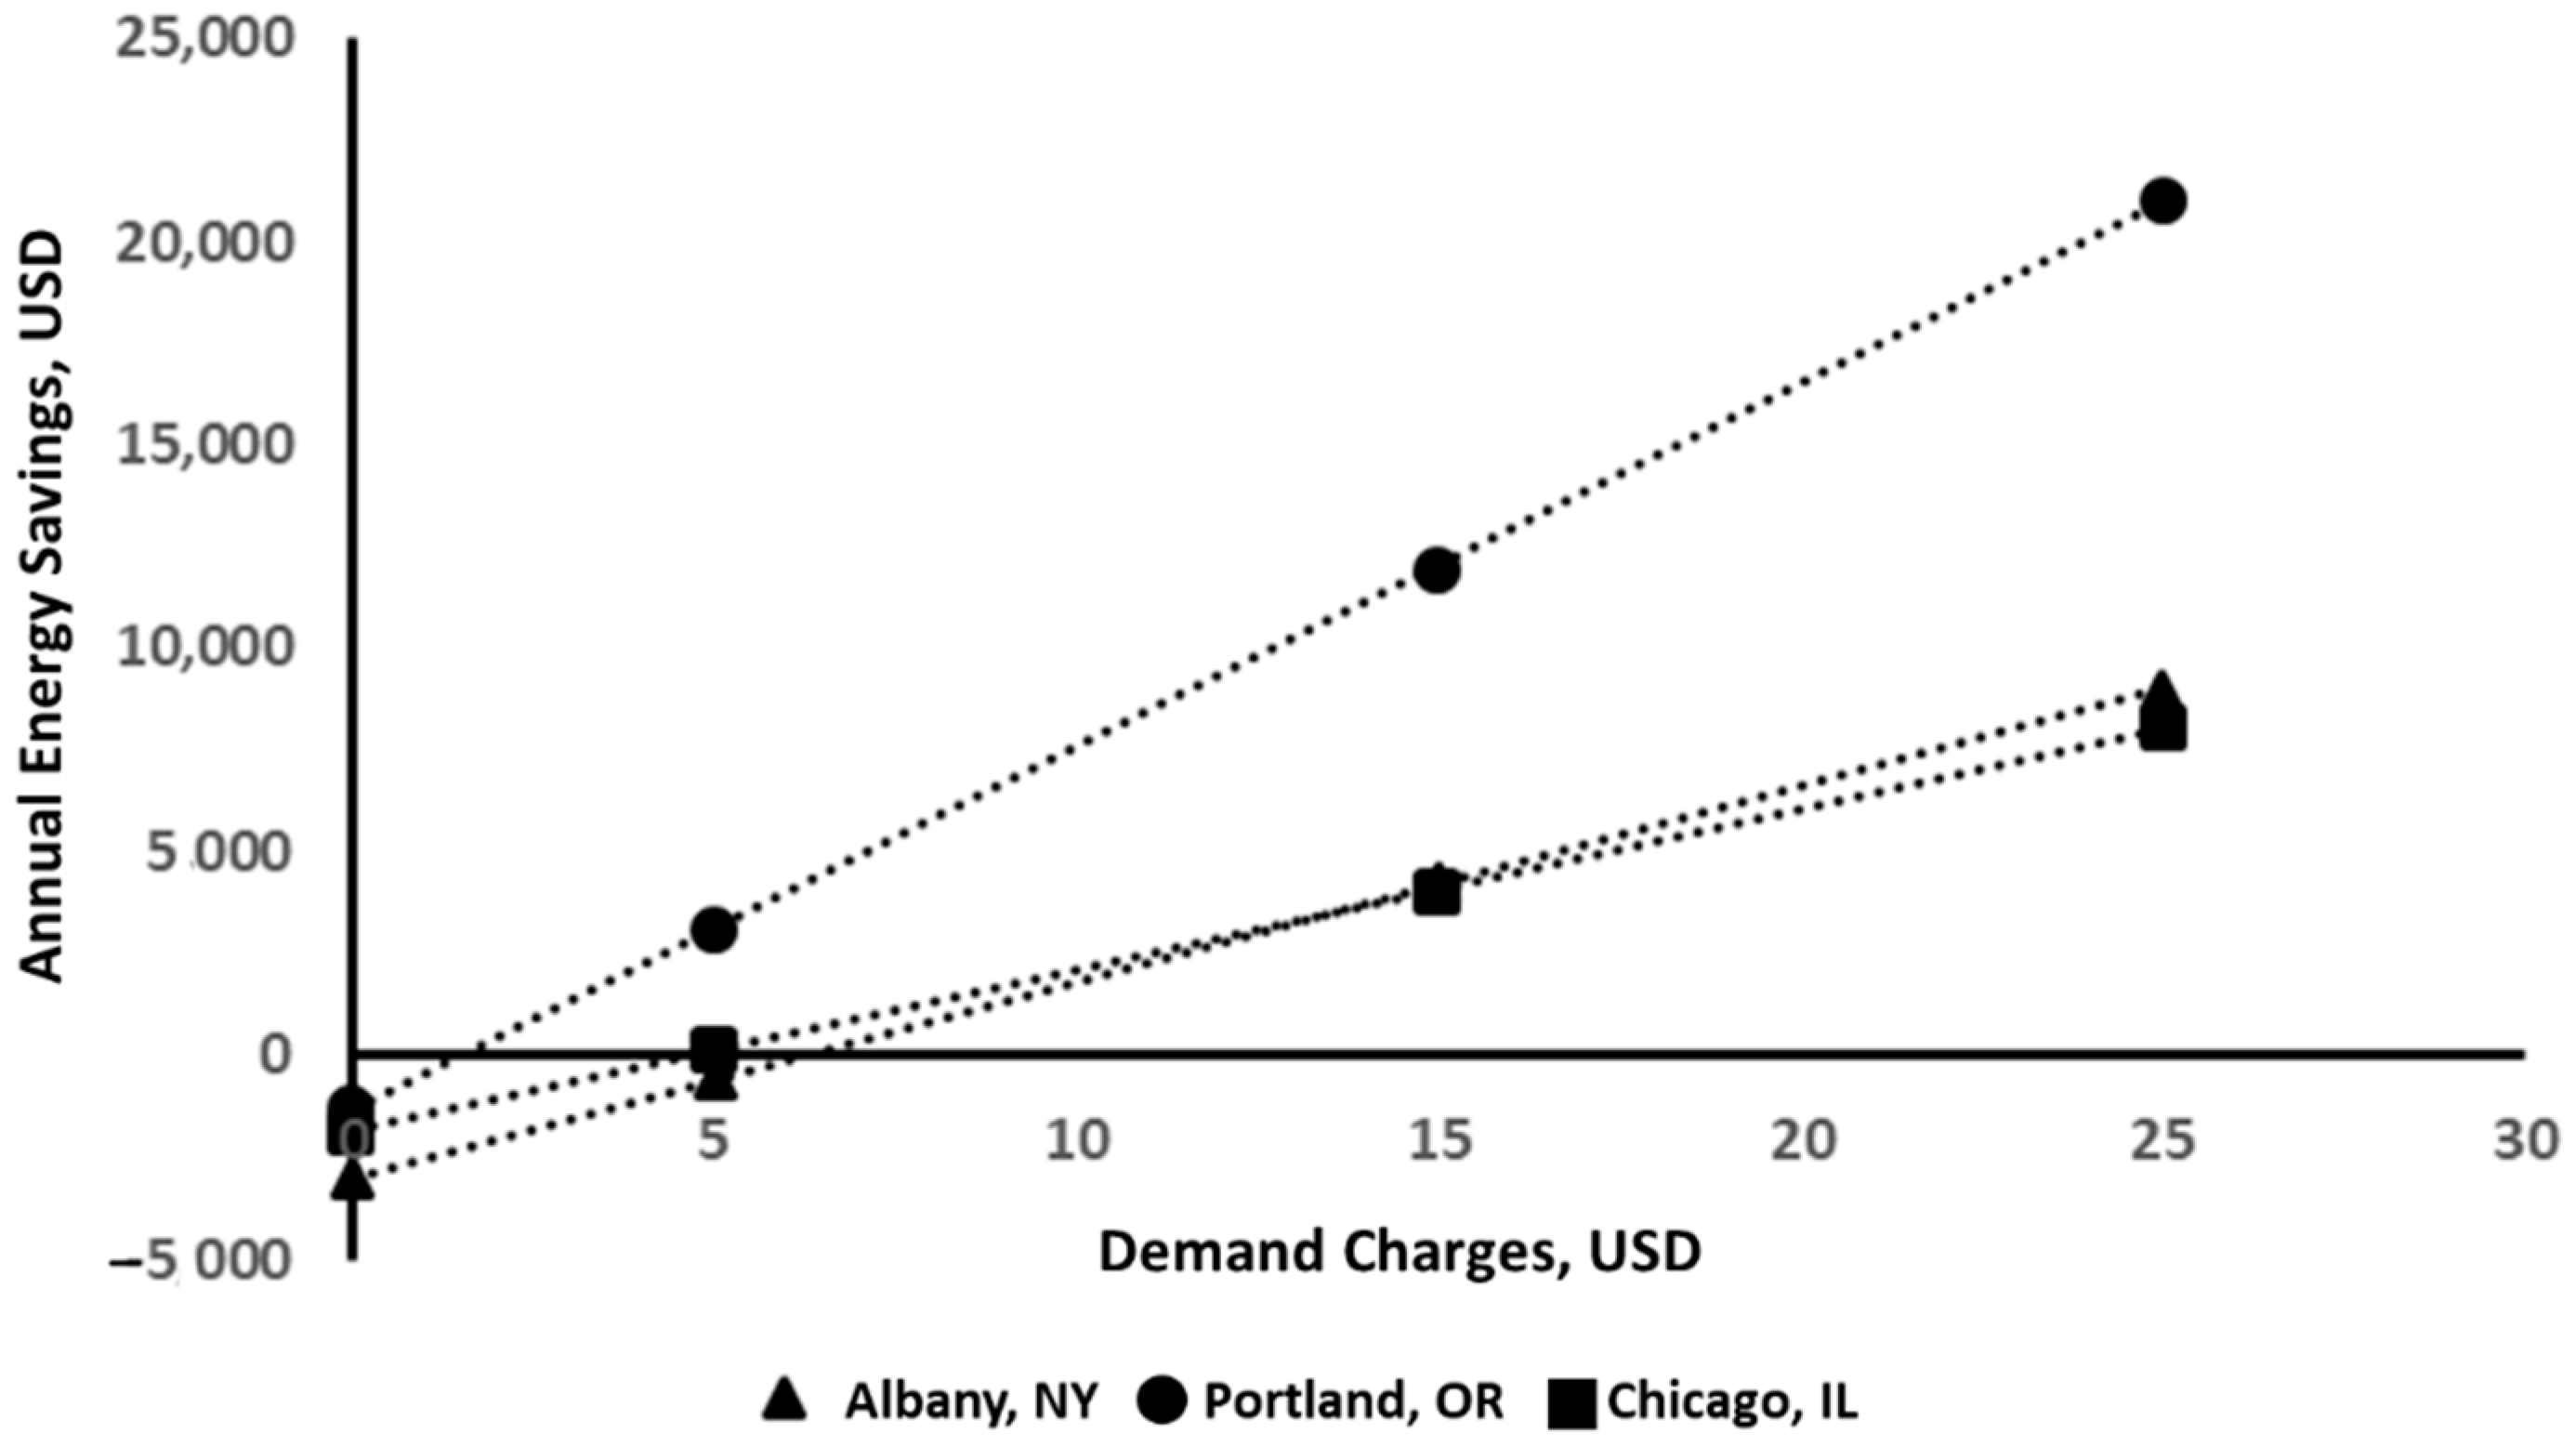
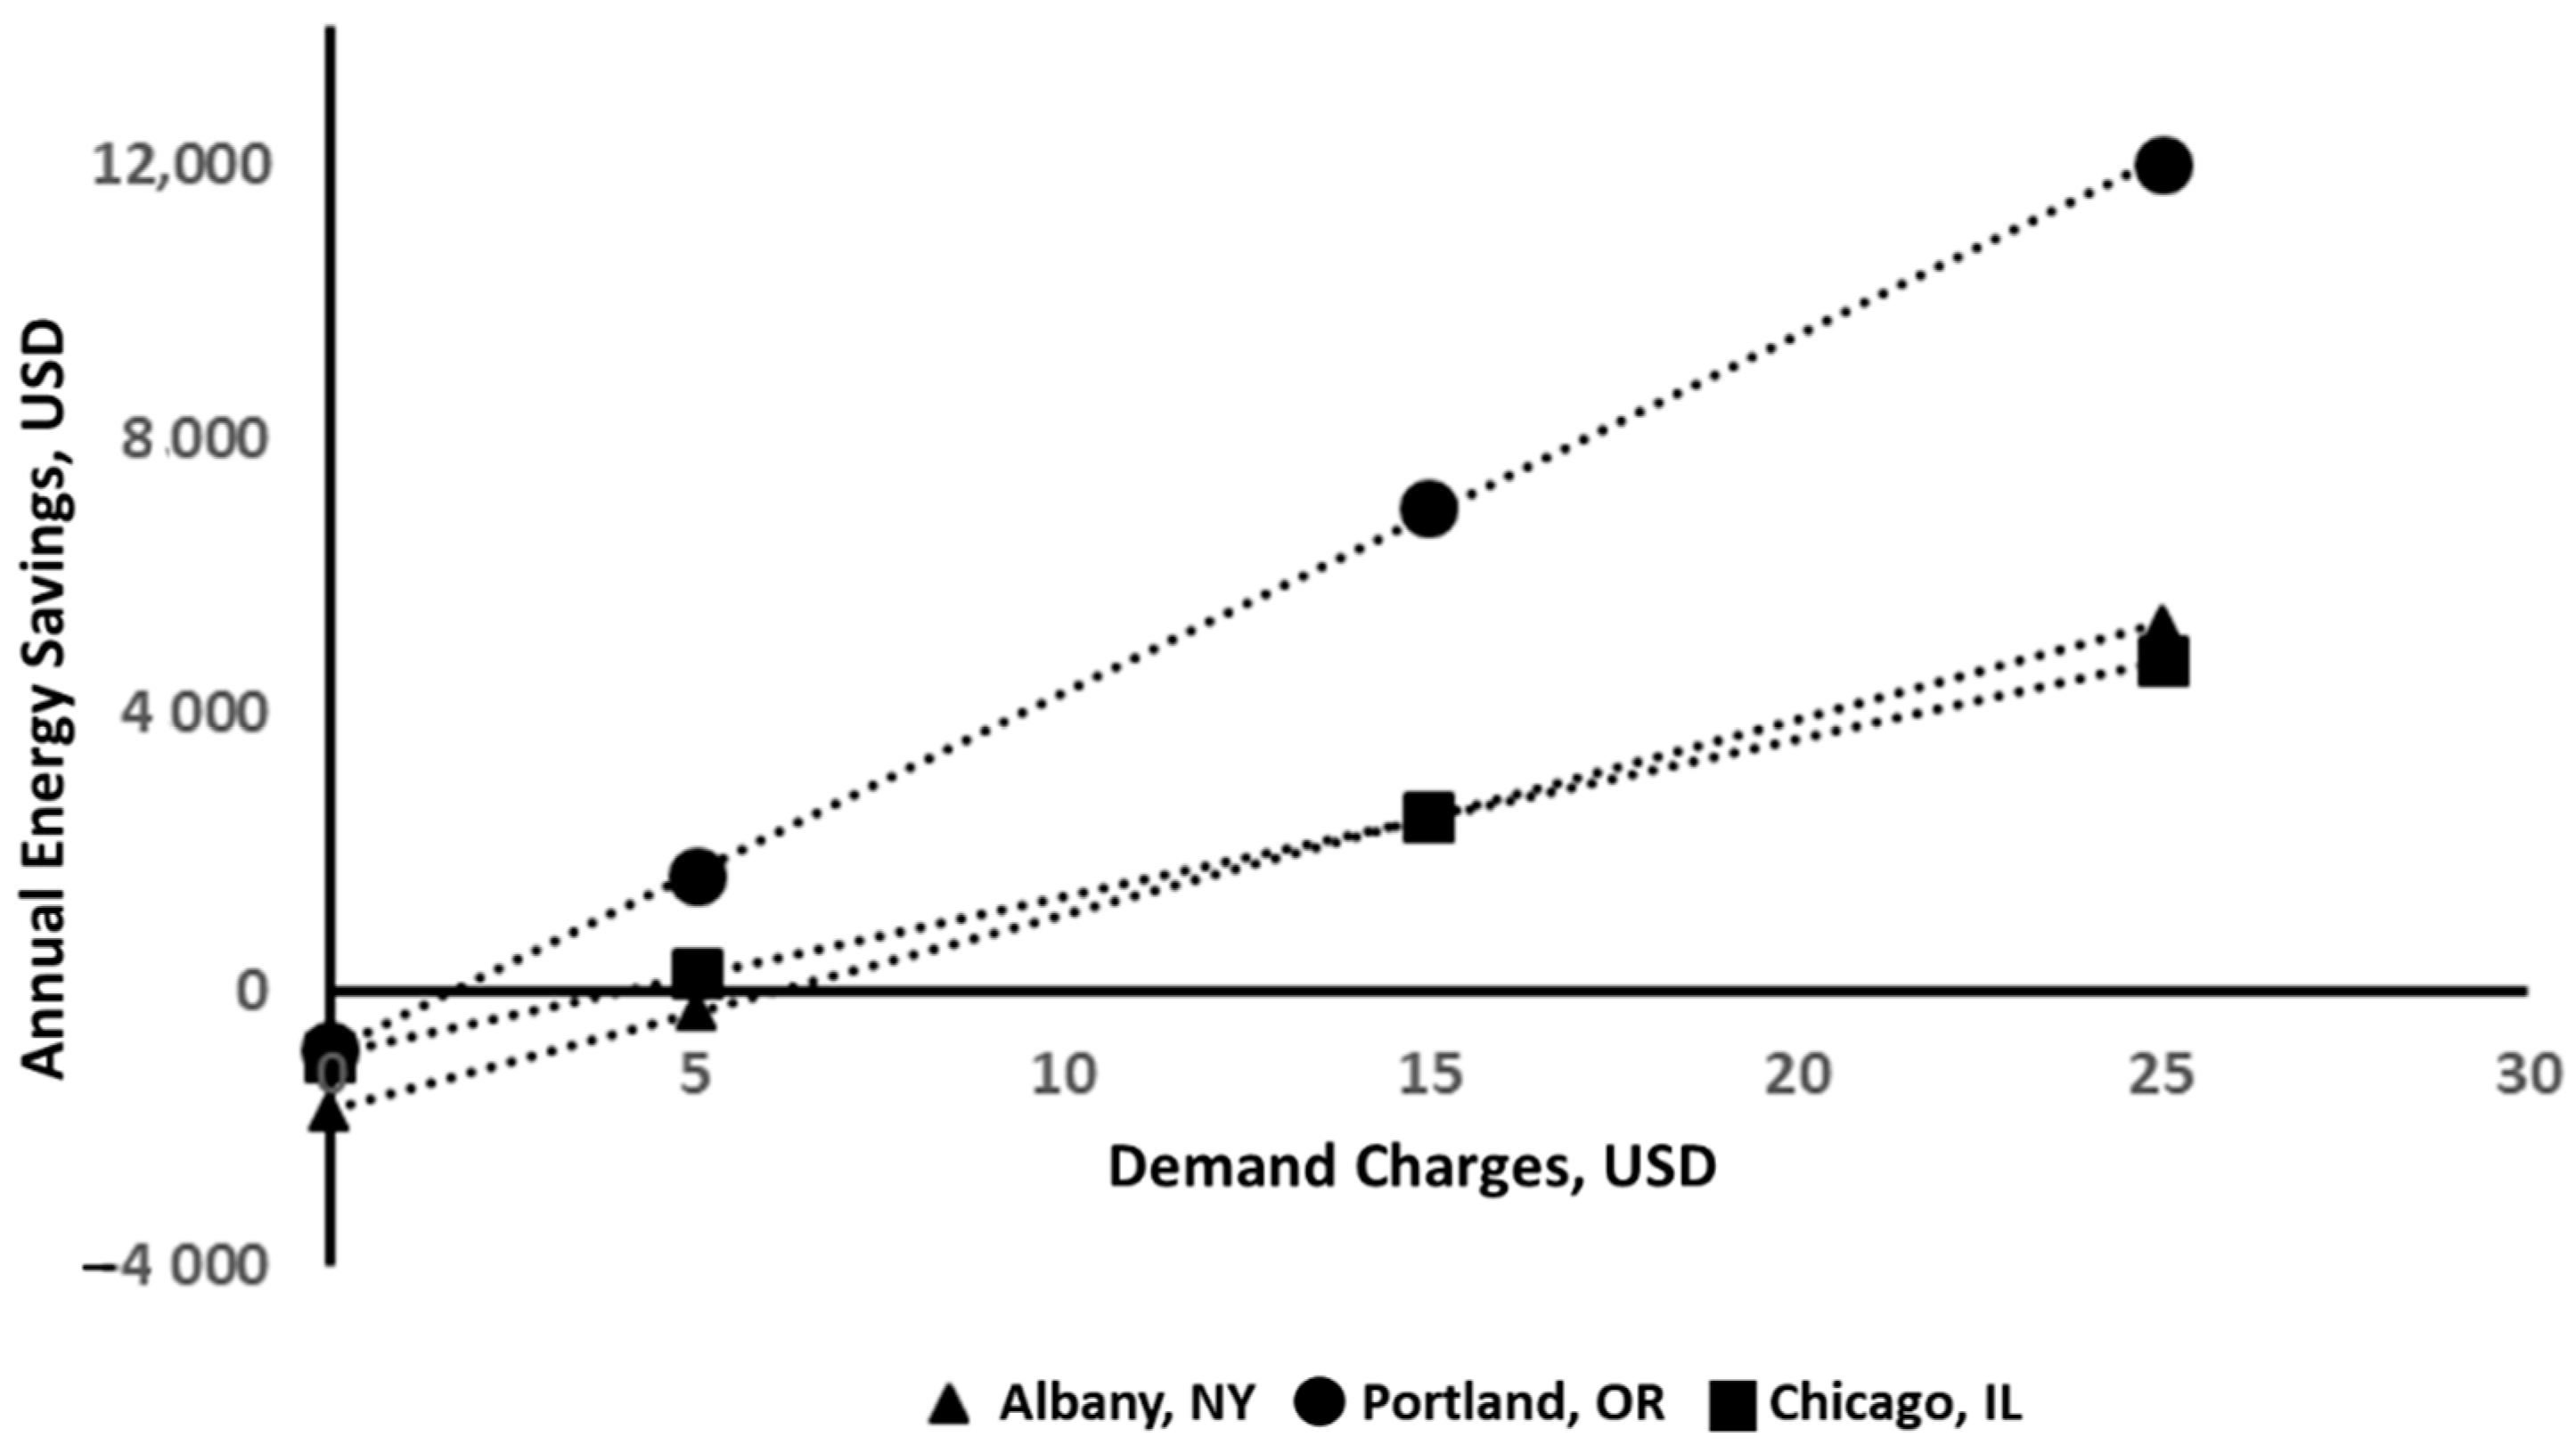
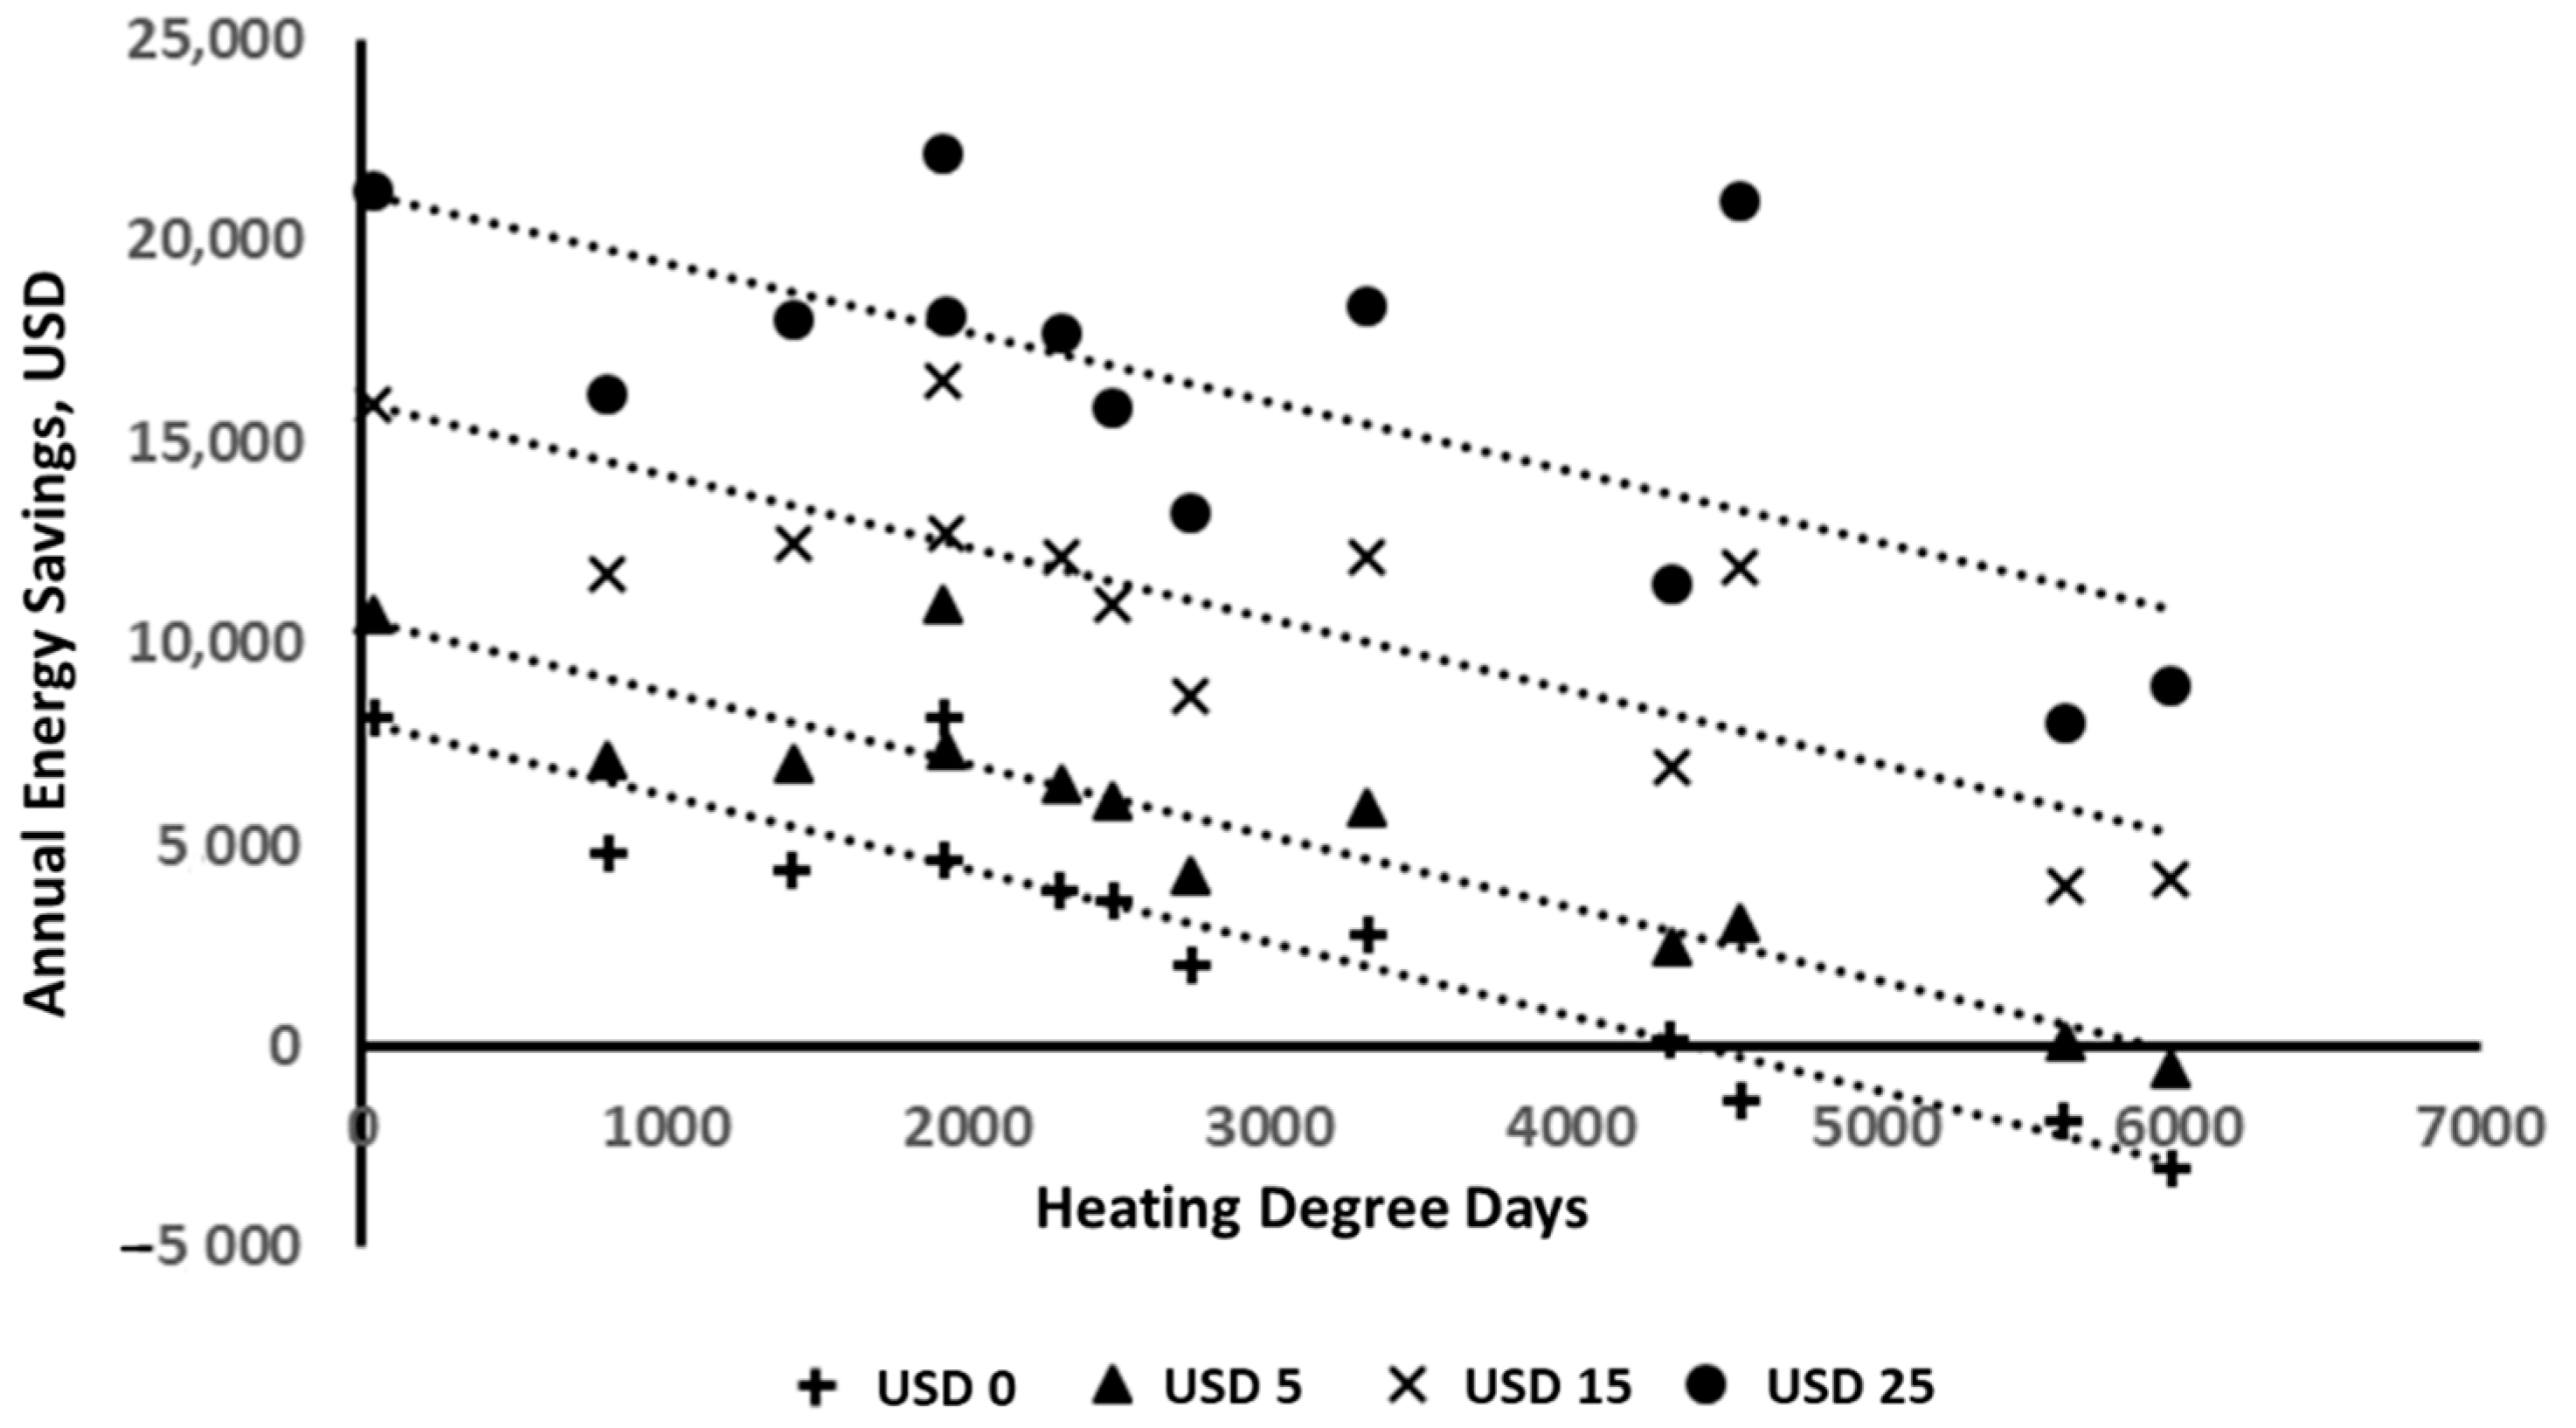
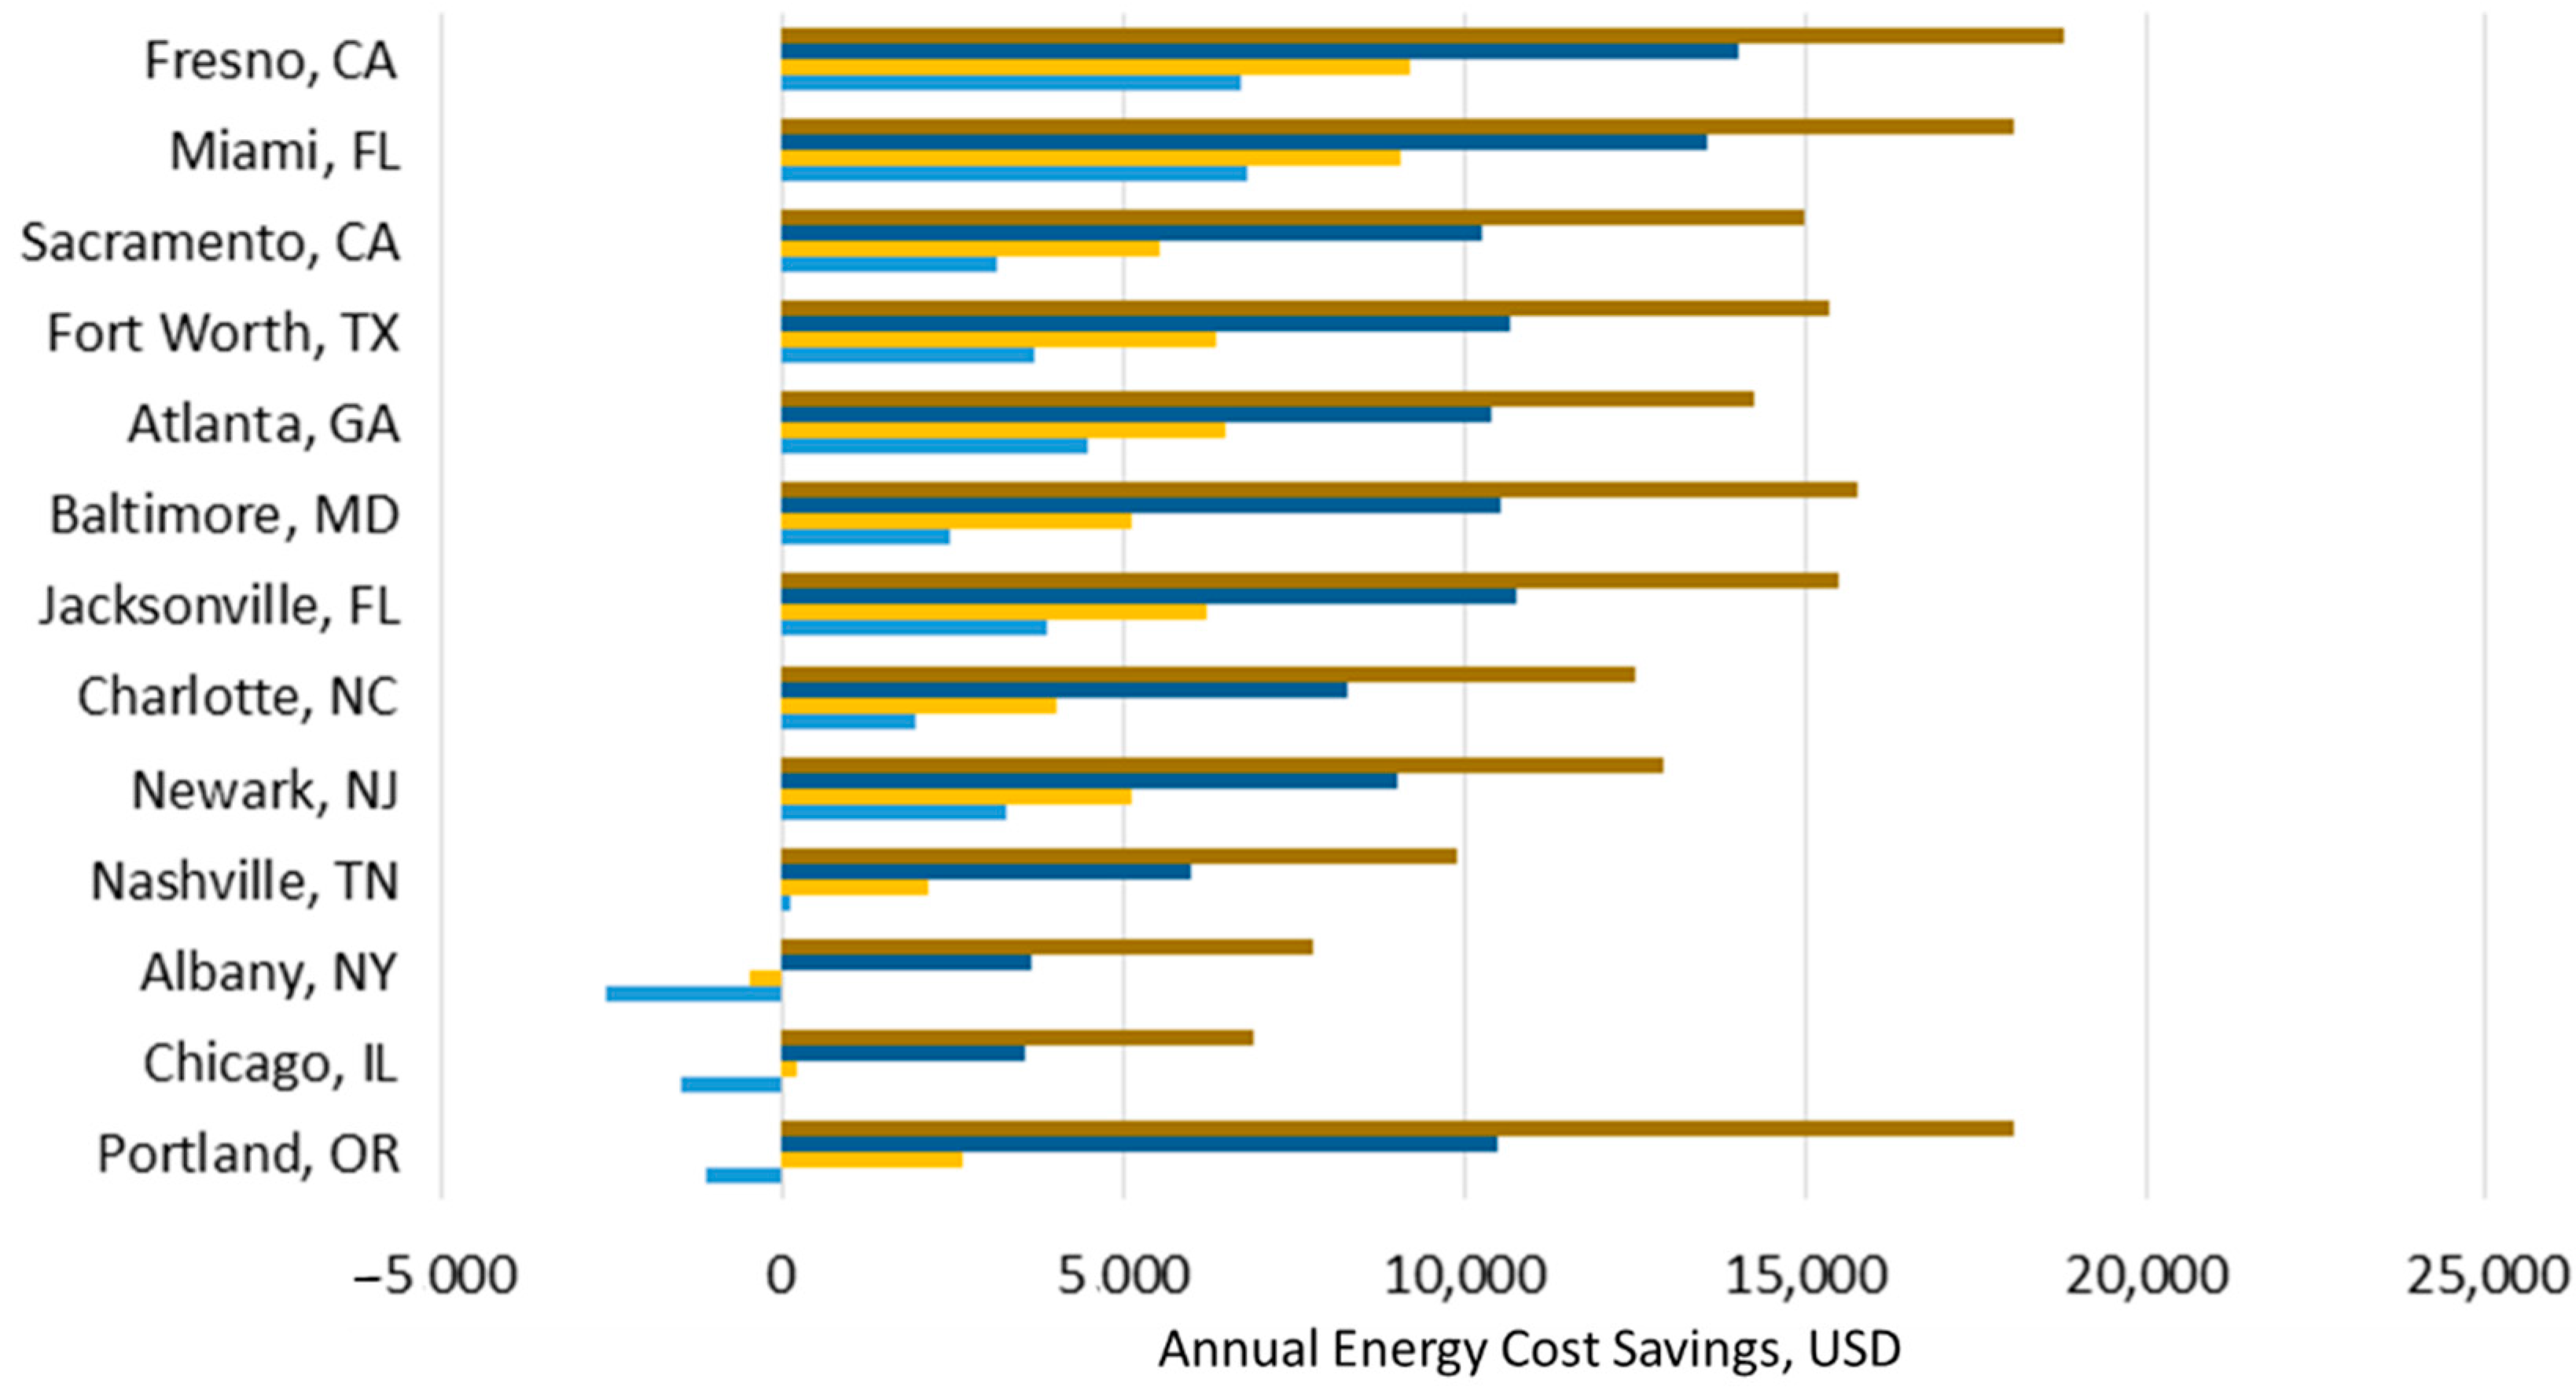
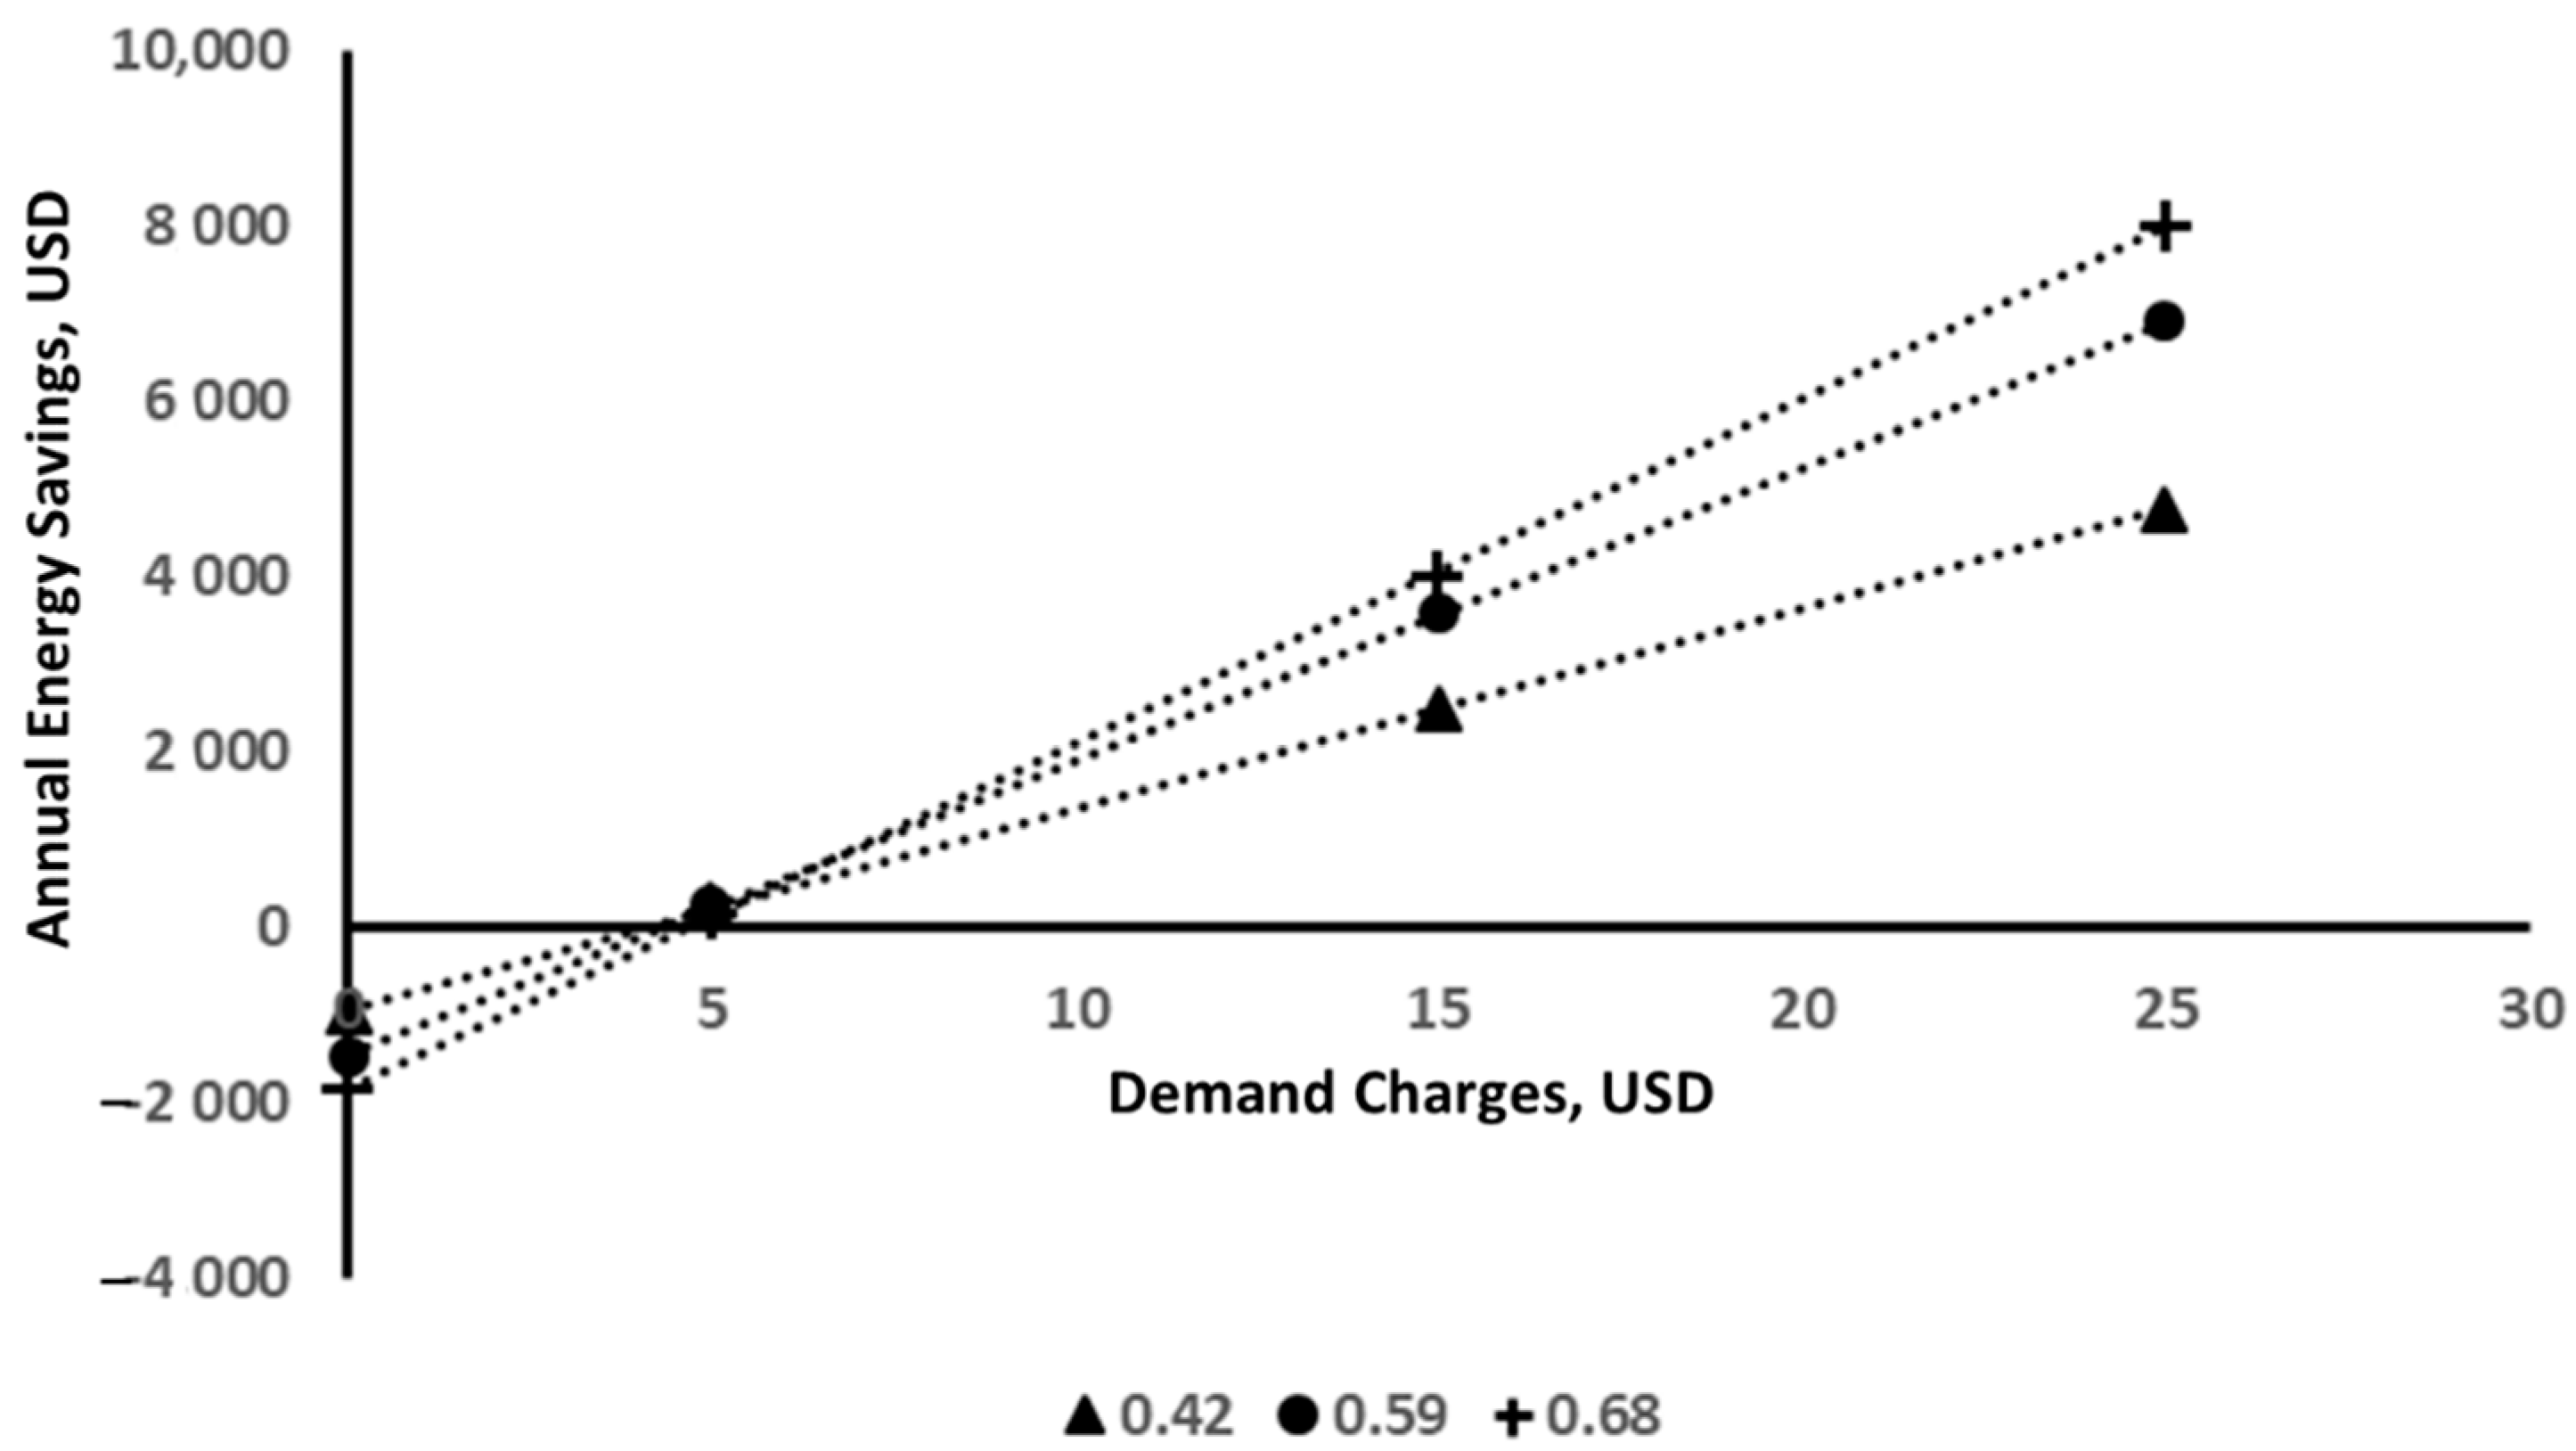
3.4. Effect of Demand Charges
4. Discussion
5. Conclusions
6. Recommendations for Future Studies
- This study utilized the ORNL CoolCalcPeak tool for energy modeling. This tool only examines the impact of heat flux through the roofing assembly. The work could be extended by using modeling tools that would enable a whole building to be examined. Thus the effects of, for example, insulated ceilings, building use, and occupancy could be evaluated.
- As solar panel installations on roofs become more common, they affect the heat flux through the roofing assembly. Such panels shade the roof and can be expected to reduce the impact of membrane reflectivity. It would be of value to evaluate the effect of their shading on building energy costs.
- While this study evaluated energy efficiency changes based on one year’s energy costs and effects, it would be worthwhile doing an entire life cycle analysis. This could take into account projections of future energy costs including the effects of renewable energy sources.
Funding
Conflicts of Interest
Appendix A

| City, State | ASHRAE Climate Zone | CoolCalcPeak HDD | CoolCalcPeak CDD | HDD 2017 | CCD 2017 | Electric Cost 2017 USD/kWh | Gas Cost 2017 | ||
|---|---|---|---|---|---|---|---|---|---|
| USD/1000 cu.ft. | USD/Therm | USD/100 cu.meter | |||||||
| Miami, FL | 1A | 141 | 4126.5 | 45 | 5287 | 0.1202 | 10.97 | 1.097 | 38.740 |
| Jacksonville, FL | 2A | 1436.5 | 2657 | 818 | 3065 | 0.1202 | 10.97 | 1.097 | 38.740 |
| Charlotte, NC | 3A | 3415.5 | 1513 | 2487 | 1905 | 0.1107 | 8.92 | 0.892 | 31.501 |
| Fort Worth, TX | 3A | 2304 | 2414.5 | 1427 | 3206 | 0.1115 | 7.71 | 0.771 | 27.228 |
| Fresno, CA | 3B | 2601.5 | 1883.5 | 1926 | 2489 | 0.1939 | 8.76 | 0.876 | 30.936 |
| Atlanta, GA | 3A | 3089.5 | 1611 | 1930 | 2163 | 0.1253 | 8.78 | 0.878 | 31.006 |
| Baltimore, MD | 4A | 4911.5 | 1133 | 3327 | 1885 | 0.1442 | 10.27 | 1.027 | 36.268 |
| Nashville, TN | 4A | 4031.5 | 1672 | 2745 | 1925 | 0.1093 | 8.74 | 0.874 | 30.865 |
| Newark, NJ | 4A | 5122.5 | 1061.5 | 4330 | 1316 | 0.1596 | 9.14 | 0.914 | 32.278 |
| Albany, NY | 5A | 7083 | 542.5 | 5983 | 714 | 0.1876 | 6.87 | 0.687 | 24.261 |
| Sacramento, CA | 3B | 2793.5 | 1144 | 2314 | 1546 | 0.1939 | 8.76 | 0.876 | 30.936 |
| Portland, OR | 4C | 4461 | 278.5 | 4559 | 700 | 0.1097 | 8.74 | 0.874 | 30.865 |
| Chicago, IL | 5A | 6449.5 | 748.5 | 5631 | 799 | 0.1295 | 7.78 | 0.778 | 27.475 |
| Demand Charge, USD | Annual Energy Savings with Gas Heat, USD | Annual Energy Savings with Electric Heat, USD | ||||||
|---|---|---|---|---|---|---|---|---|
| 0 | 5 | 15 | 25 | 0 | 5 | 15 | 25 | |
| Miami, FL | 8168 | 10,730 | 16,015 | 21,300 | 8128 | 10,690 | 15,975 | 21,261 |
| Jacksonville, FL | 5050 | 7358 | 11,972 | 12,456 | 4833 | 7140 | 11,755 | 16,225 |
| Charlotte, NC | 3703 | 6221 | 11,100 | 8334 | 3612 | 6130 | 11,009 | 15,888 |
| Fort Worth, TX | 5488 | 8144 | 13,621 | 16,931 | 4404 | 7060 | 12,537 | 18,015 |
| Fresno, CA | 9065 | 11,873 | 17,490 | 20,515 | 8140 | 10,948 | 16,564 | 22,181 |
| Atlanta, GA | 5214 | 7900 | 13,270 | 16,454 | 4668 | 7353 | 12,724 | 18,094 |
| Baltimore, MD | 5061 | 8180 | 14,419 | 9990 | 2775 | 5894 | 12,133 | 18,372 |
| Nashville, TN | 3519 | 5822 | 10,283 | 7,595 | 1987 | 4290 | 8751 | 13,212 |
| Newark, NJ | 3649 | 5973 | 10,467 | 3128 | 162 | 2487 | 6981 | 11,475 |
| Albany, NY | 2446 | 4913 | 9684 | 2630 | –3045 | –577 | 4194 | 8,965 |
| Sacramento, CA | 6746 | 9449 | 15,023 | 13,350 | 3847 | 6550 | 12,124 | 17,699 |
| Portland, OR | 991 | 5389 | 14,187 | 10,779 | –1309 | 3090 | 11,887 | 20,998 |
| Chicago, IL | 1529 | 3530 | 7400 | –820 | –1855 | 147 | 4017 | 8020 |
| Demand Charge, USD | Annual Energy Savings with Gas Heat, USD | Annual Energy Savings with Electric Heat, USD | ||||||
|---|---|---|---|---|---|---|---|---|
| 0 | 5 | 15 | 25 | 0 | 5 | 15 | 25 | |
| Miami, FL | 6887 | 9129 | 13,613 | 18,097 | 6847 | 9089 | 13,573 | 18,057 |
| Jacksonville, FL | 4401 | 6419 | 10,313 | 14,206 | 4481 | 6500 | 10,393 | 14,286 |
| Charlotte, NC | 3165 | 5211 | 9460 | 13,710 | 1982 | 4028 | 8277 | 12,526 |
| Fort Worth, TX | 4504 | 7159 | 11,475 | 16,122 | 3729 | 6385 | 10,700 | 15,348 |
| Fresno, CA | 7579 | 10,056 | 14,847 | 19,637 | 6746 | 9223 | 14,014 | 18,804 |
| Atlanta, GA | 4375 | 6725 | 11,256 | 15,956 | 3907 | 6256 | 10,788 | 15,487 |
| Baltimore, MD | 4398 | 7102 | 12,509 | 17,708 | 2451 | 5155 | 10,562 | 15,761 |
| Nashville, TN | 3028 | 4899 | 8785 | 12,671 | 3284 | 5155 | 9040 | 12,926 |
| Newark, NJ | 2980 | 4994 | 8868 | 12,743 | 127 | 2141 | 6016 | 9890 |
| Albany, NY | 2163 | 4302 | 8415 | 12,528 | –2588 | –449 | 3663 | 7776 |
| Sacramento, CA | 5667 | 8032 | 12,762 | 17,492 | 3182 | 5547 | 10,277 | 15,007 |
| Portland, OR | 804 | 4575 | 12,429 | 19,970 | –1112 | 2658 | 10,513 | 18,053 |
| Chicago, IL | 1238 | 2972 | 6308 | 9644 | –1491 | 244 | 3580 | 6915 |
| Demand Charge, USD | Annual Energy Savings with Gas Heat, USD | Annual Energy Savings with Electric Heat, USD | ||||||
|---|---|---|---|---|---|---|---|---|
| 0 | 5 | 15 | 25 | 0 | 5 | 15 | 25 | |
| Miami, FL | 4805 | 6406 | 9449 | 12,492 | 4765 | 6366 | 9409 | 12,452 |
| Jacksonville, FL | 2886 | 4183 | 6923 | 9519 | 2459 | 3756 | 6496 | 9092 |
| Charlotte, NC | 2245 | 3662 | 6495 | 9485 | 1426 | 2842 | 5675 | 8666 |
| Fort Worth, TX | 3087 | 4747 | 7901 | 11,054 | 2545 | 4205 | 7359 | 10,512 |
| Fresno, CA | 5193 | 6845 | 9984 | 13,287 | 4638 | 6290 | 9428 | 12,732 |
| Atlanta, GA | 3111 | 4621 | 7810 | 10,831 | 2798 | 4309 | 7498 | 10,519 |
| Baltimore, MD | 2904 | 4776 | 8311 | 12,055 | 1719 | 3590 | 7126 | 10,869 |
| Nashville, TN | 1962 | 3257 | 5848 | 8438 | 1196 | 2491 | 5082 | 7672 |
| Newark, NJ | 2212 | 3607 | 6241 | 8876 | 310 | 1705 | 4339 | 6974 |
| Albany, NY | 1387 | 2868 | 5665 | 8462 | –1780 | –300 | 2497 | 5294 |
| Sacramento, CA | 3912 | 5602 | 8811 | 12,021 | 2256 | 3945 | 7155 | 10,364 |
| Portland, OR | 432 | 2945 | 8286 | 13,313 | –846 | 1668 | 7009 | 12,036 |
| Chicago, IL | 898 | 2099 | 4367 | 6635 | –958 | 243 | 2512 | 4780 |
References and Note
- Lenton, T.M.; Vaughn, N.E. Radiative forcing potential of different climate geoengineering options. Atmos. Chem. Phys. 2009, 9, 5539–5561. [Google Scholar] [CrossRef]
- Levinson, R.; Akbari, H. Potential benefits of cool roofs on commercial buildings: Conserving energy, saving money, and reducing emission of greenhouse gases and air pollutants. Energy Effic. 2010, 3, 53–109. [Google Scholar] [CrossRef]
- Taylor, T.J.; Hartwig, C. Cool roof use in commercial buildings in the United States: An energy cost analysis. ASHRAE Trans. 2018, 124, 88–96. [Google Scholar]
- Gaffin, S.R.; Imhoff, M.; Rosenzweig, C.; Khanbilvardi, R.; Kong, A.Y.Y.; Grillo, D.; Freed, A.; Hillel, D.; Hartung, E. Bright is the new black multiyear performance of high-albedo roofs in an urban climate. Environ. Res. Lett. 2012, 7, 1–12. [Google Scholar] [CrossRef]
- Akbari, H. Cool Roofs save energy. ASHRAE Trans. 1998, 104, 783–791. [Google Scholar]
- Akbridge, J.M. High-albedo roof coatings—Impact on energy consumption. ASHRAE Trans. 1998, 104, 957–962. [Google Scholar]
- Costanzo, V.; Evola, G.; Marletta, L. Cool roofs for passive cooling: Performance in different climates and for different insulation levels in Italy. Adv. Build. Energy Res. 2013, 7, 155–169. [Google Scholar] [CrossRef]
- Hosseini, M.; Akbari, H. Effect of cool roofs on commercial buildings energy use in cold climates. Energy Build. 2015, 114, 143–155. [Google Scholar] [CrossRef]
- Ibrahim, S. Sustainable roof design: More than a black and white issue. In Proceedings of the Symposium O Building Envelope Technology, San Diego, CA, USA, 10–13 October 2009; pp. 113–120. [Google Scholar]
- Ibrahim, S. The un-cool consequences of cool roofing. Prof. Roof. 2013, 43, 36–39. [Google Scholar]
- Hosseini, M.; Akbari, H. Heating energy penalties of cool roofs: The effect of snow accumulation on roofs. Adv. Build. Energy Res. 2014, 8, 1–13. [Google Scholar] [CrossRef]
- Fenner, M.; DiPietro, M.; Graveline, S.P. Cool roofs in northern climates. Archit. Roof. Waterpoof. 2014, 3, 16–21. [Google Scholar]
- Matter, A. More than a simple black and white issue. Interface 2008, 25–30. [Google Scholar]
- US Department of Energy. Building Energy Data Book. 2011. Available online: https://openei.org/doe-opendata/dataset/buildings-energy-data-book (accessed on 5 June 2019).
- Hoff, J.L. Reducing Peak Electrical Demand. Available online: http://www.tegnos.org/files/Building_Envelope_Winter_2015.pdf (accessed on 27 September 2019).
- ORNL. Cool Roof Calculator with Peak Demand. Available online: http://web.ornl.gov/sci/buildings/tools/cool-roof/peak/ (accessed on 8 June 2019).
- Energy Cap Inc. Weather Data Depot. Available online: https://www.weatherdatadepot.com/ (accessed on 10 June 2019).
- Eisenbach Consulting. Available online: https://www.electricchoice.com/electricity-prices-by-state/ (accessed on 10 June 2019).
- US Energy Information Administration. Available online: https://www.eia.gov/dnav/ng/ng_pri_sum_dcu_nus_a.htm (accessed on 11 June 2019).
- NREL. Available online: https://www.nrel.gov/docs/fy17osti/68963.pdf (accessed on 11 June 2019).
- Cool Roof Rating Council. Available online: http://coolroofs.org/products/results (accessed on 12 June 2019).
- International Code Council. International Energy Conservation Code; International Code Council, Inc.: Falls Church, VA, USA, 2015. [Google Scholar]
- Burson, A.D. Determining the Feasibility of Using Abandoned Big Box Stores as Modular Construction Factories. 2017. All Theses. 2692. Available online: https://tigerprints.clemson.edu/all_theses/2692 (accessed on 6 September 2019).
- GAF internal data, 2018.
- Cool Roof Calculator Input. Available online: https://web.ornl.gov/sci/buildings/tools/cool-roof/input/ (accessed on 14 September 2019).
- Mellott, J.; New, J.; Sanyal, J. Preliminary analysis of energy consumption for cool roofing materials. Interface 2013, 31, 25–36. [Google Scholar]


| Color | Solar Reflectance | Emissivity | Designation |
|---|---|---|---|
| White | 0.68 | 0.83 | High Reflectance |
| Tan | 0.59 | 0.84 | Mid Reflectance |
| Gray | 0.42 | 0.86 | Lower Reflectance |
© 2019 by the author. Licensee MDPI, Basel, Switzerland. This article is an open access article distributed under the terms and conditions of the Creative Commons Attribution (CC BY) license (http://creativecommons.org/licenses/by/4.0/).
Share and Cite
Taylor, T.J. Reflective Roofing Use on Commercial Buildings in the United States: An Energy Type and Cost Analysis. Buildings 2019, 9, 212. https://doi.org/10.3390/buildings9100212
Taylor TJ. Reflective Roofing Use on Commercial Buildings in the United States: An Energy Type and Cost Analysis. Buildings. 2019; 9(10):212. https://doi.org/10.3390/buildings9100212
Chicago/Turabian StyleTaylor, Thomas J. 2019. "Reflective Roofing Use on Commercial Buildings in the United States: An Energy Type and Cost Analysis" Buildings 9, no. 10: 212. https://doi.org/10.3390/buildings9100212
APA StyleTaylor, T. J. (2019). Reflective Roofing Use on Commercial Buildings in the United States: An Energy Type and Cost Analysis. Buildings, 9(10), 212. https://doi.org/10.3390/buildings9100212