The Influence of Building Airtightness on Airflow in Stairwells


Abstract
:1. Introduction
1.1. Literature Review
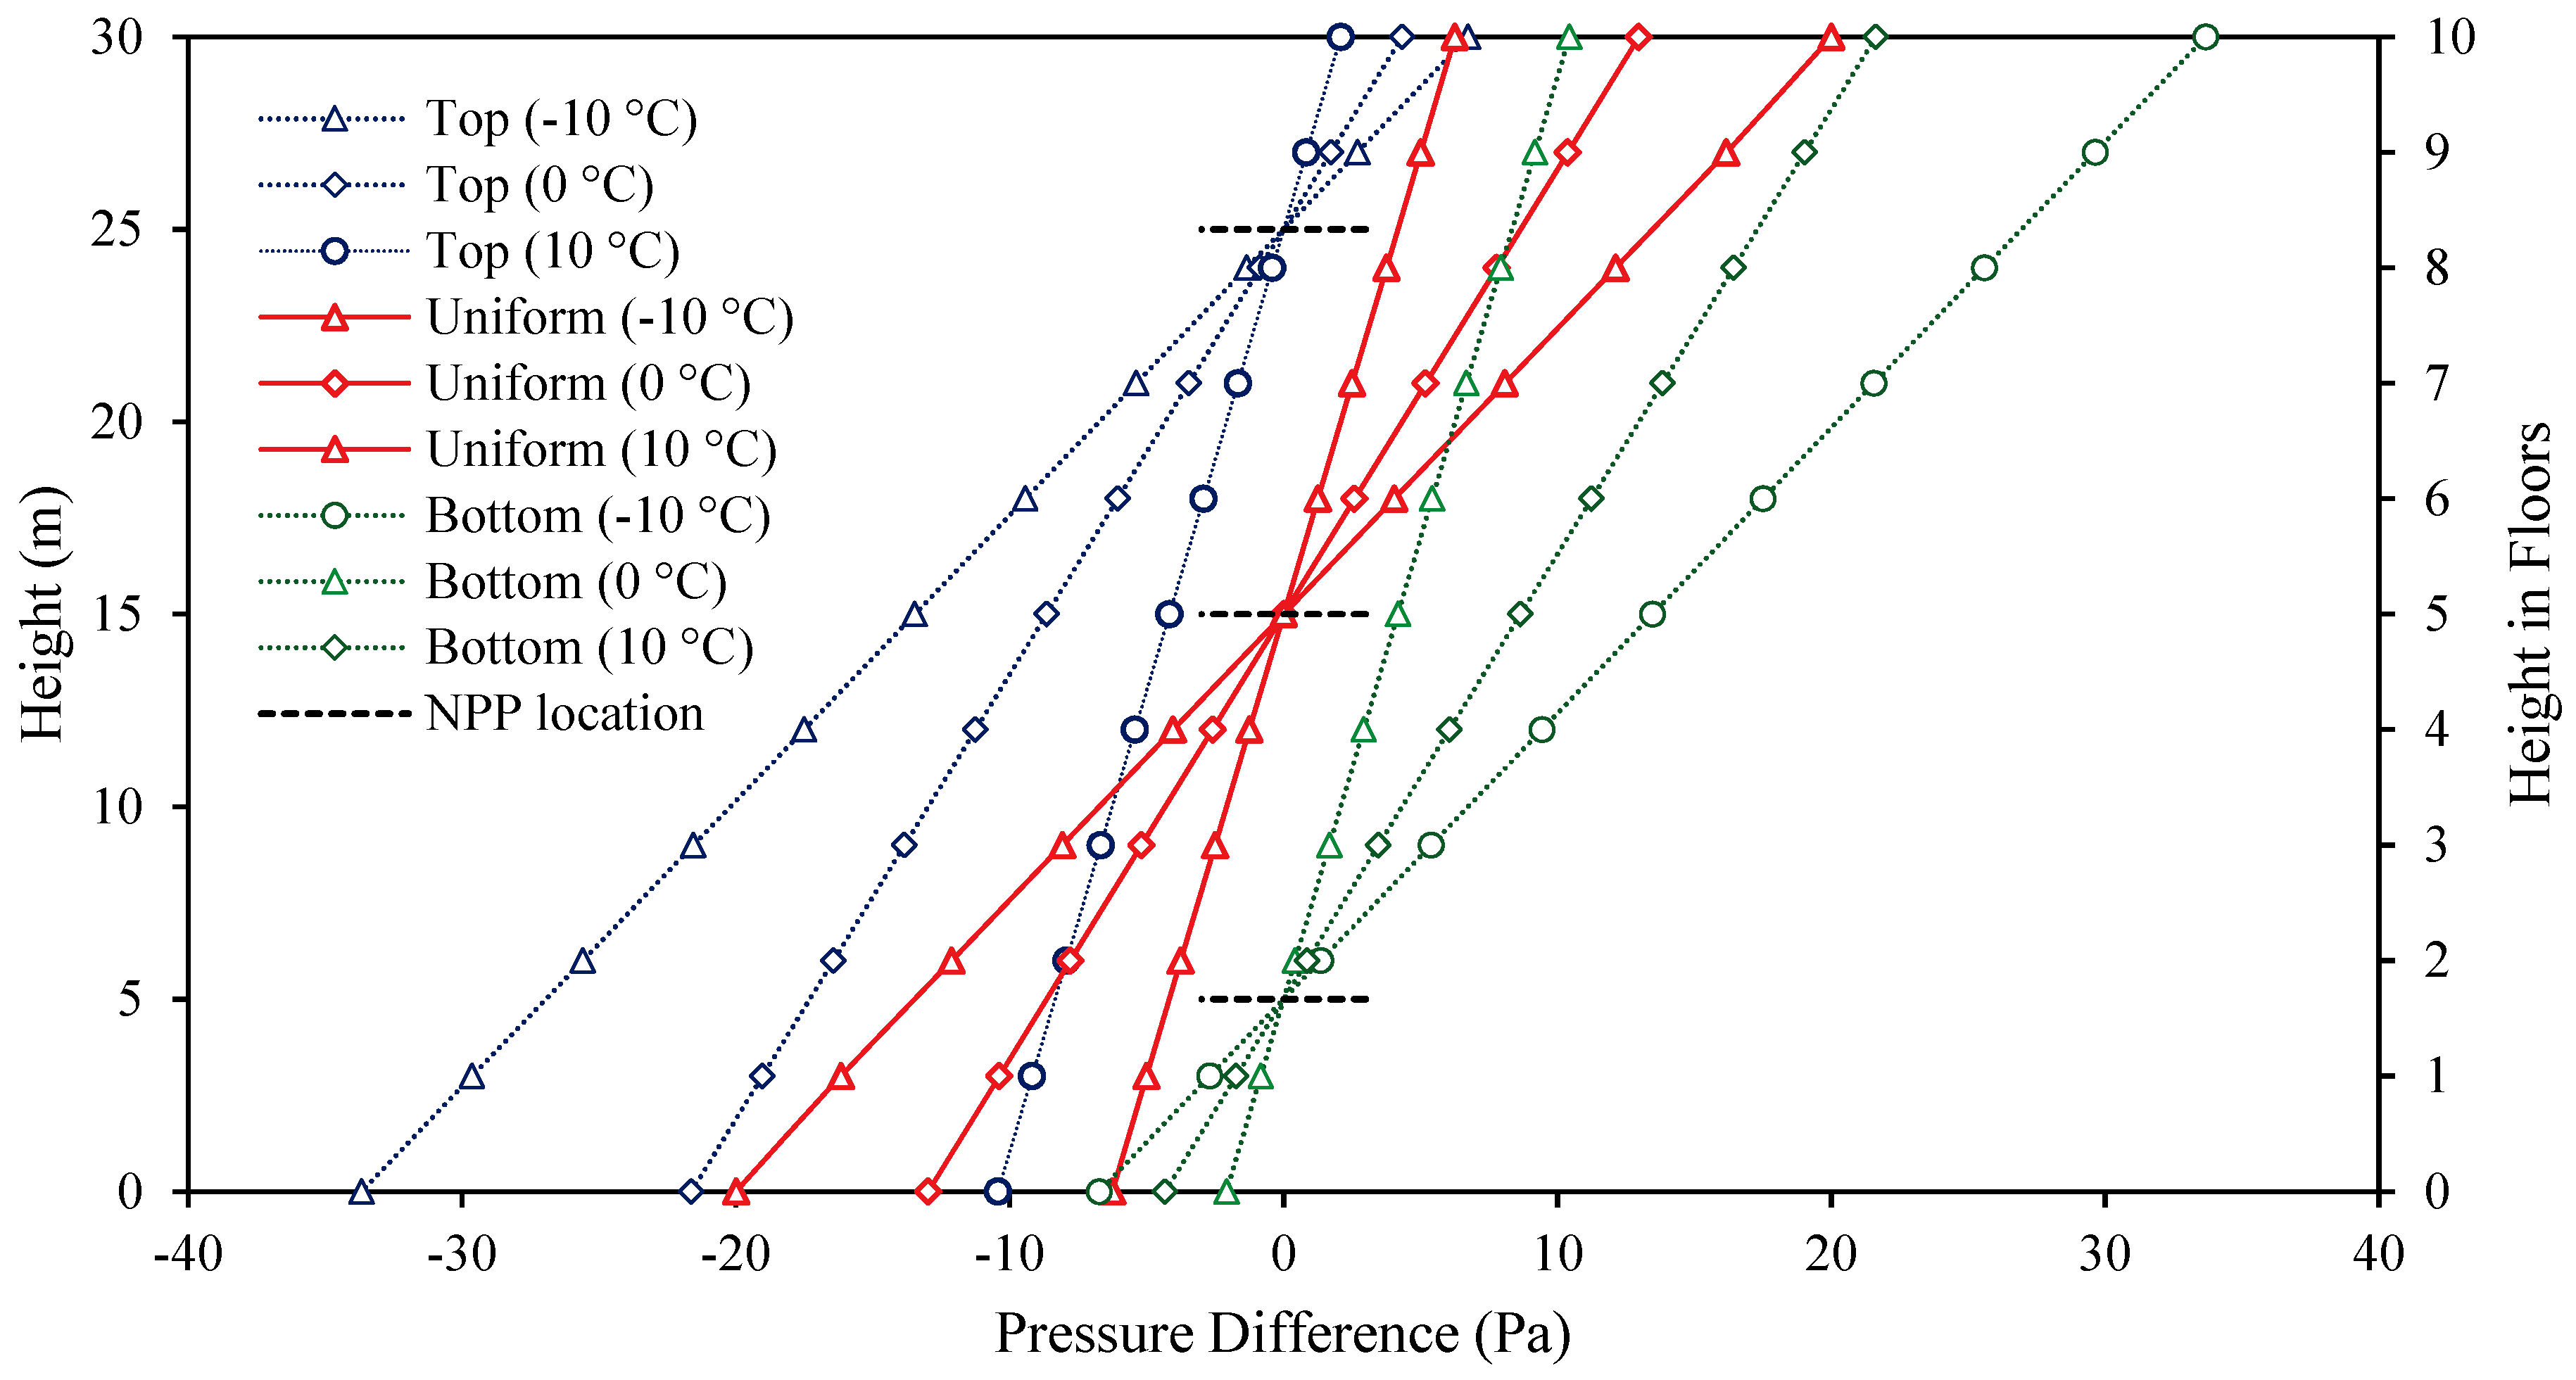
1.2. Stack Effect
- = pressure change due to stack effect, Pa;
- = outdoor air density, kg/m3;
- To = absolute temperature of outside air, K;
- Ti = absolute temperature of inside air, K;
- gravitational acceleration, 9.81 m/s2;
- = height of neutral pressure plane, m;
- = height above neutral pressure plane, m.
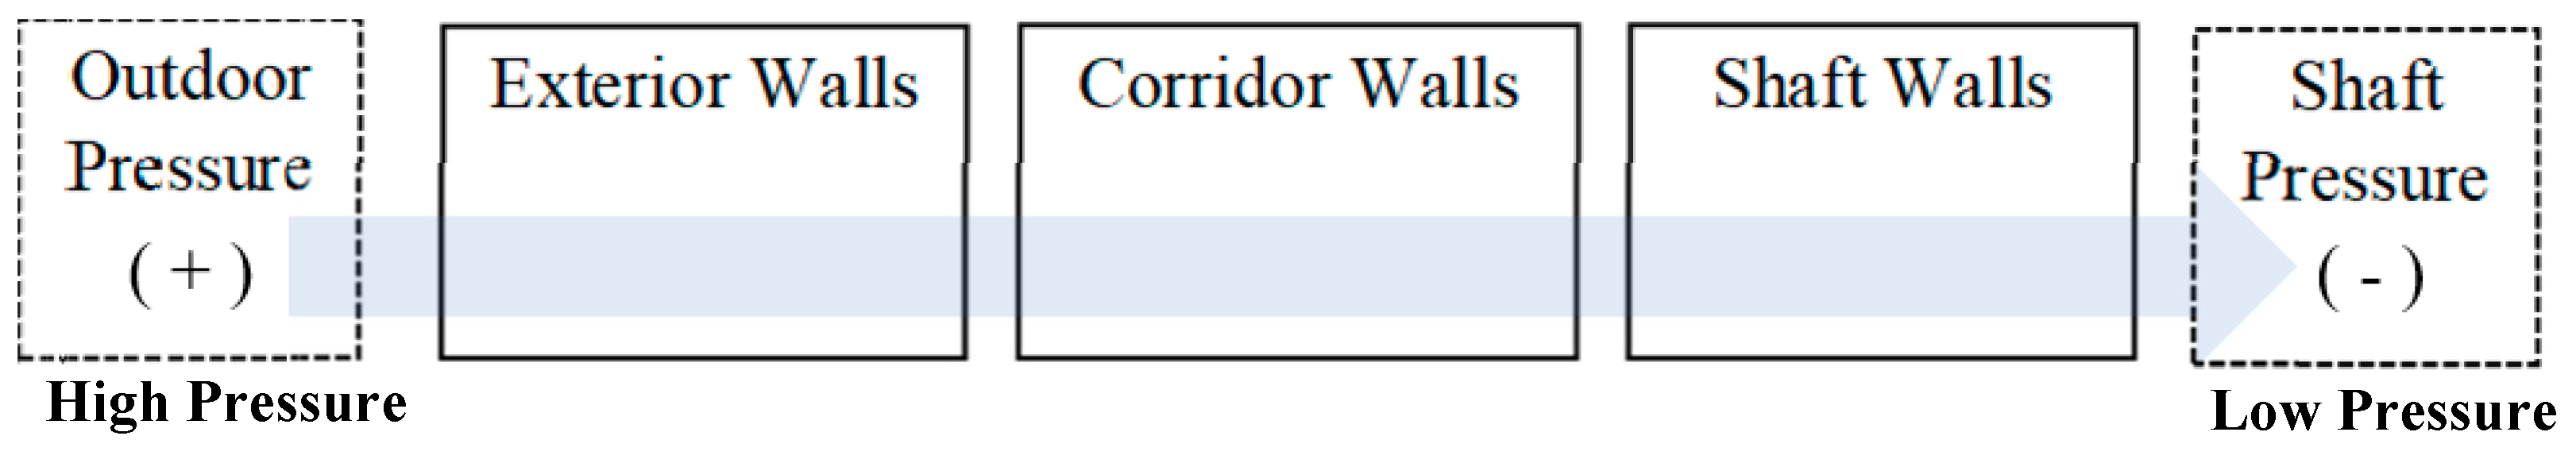
1.3. Airflow through Buildings
- = effective flow area, m2;
2. Materials and Methods
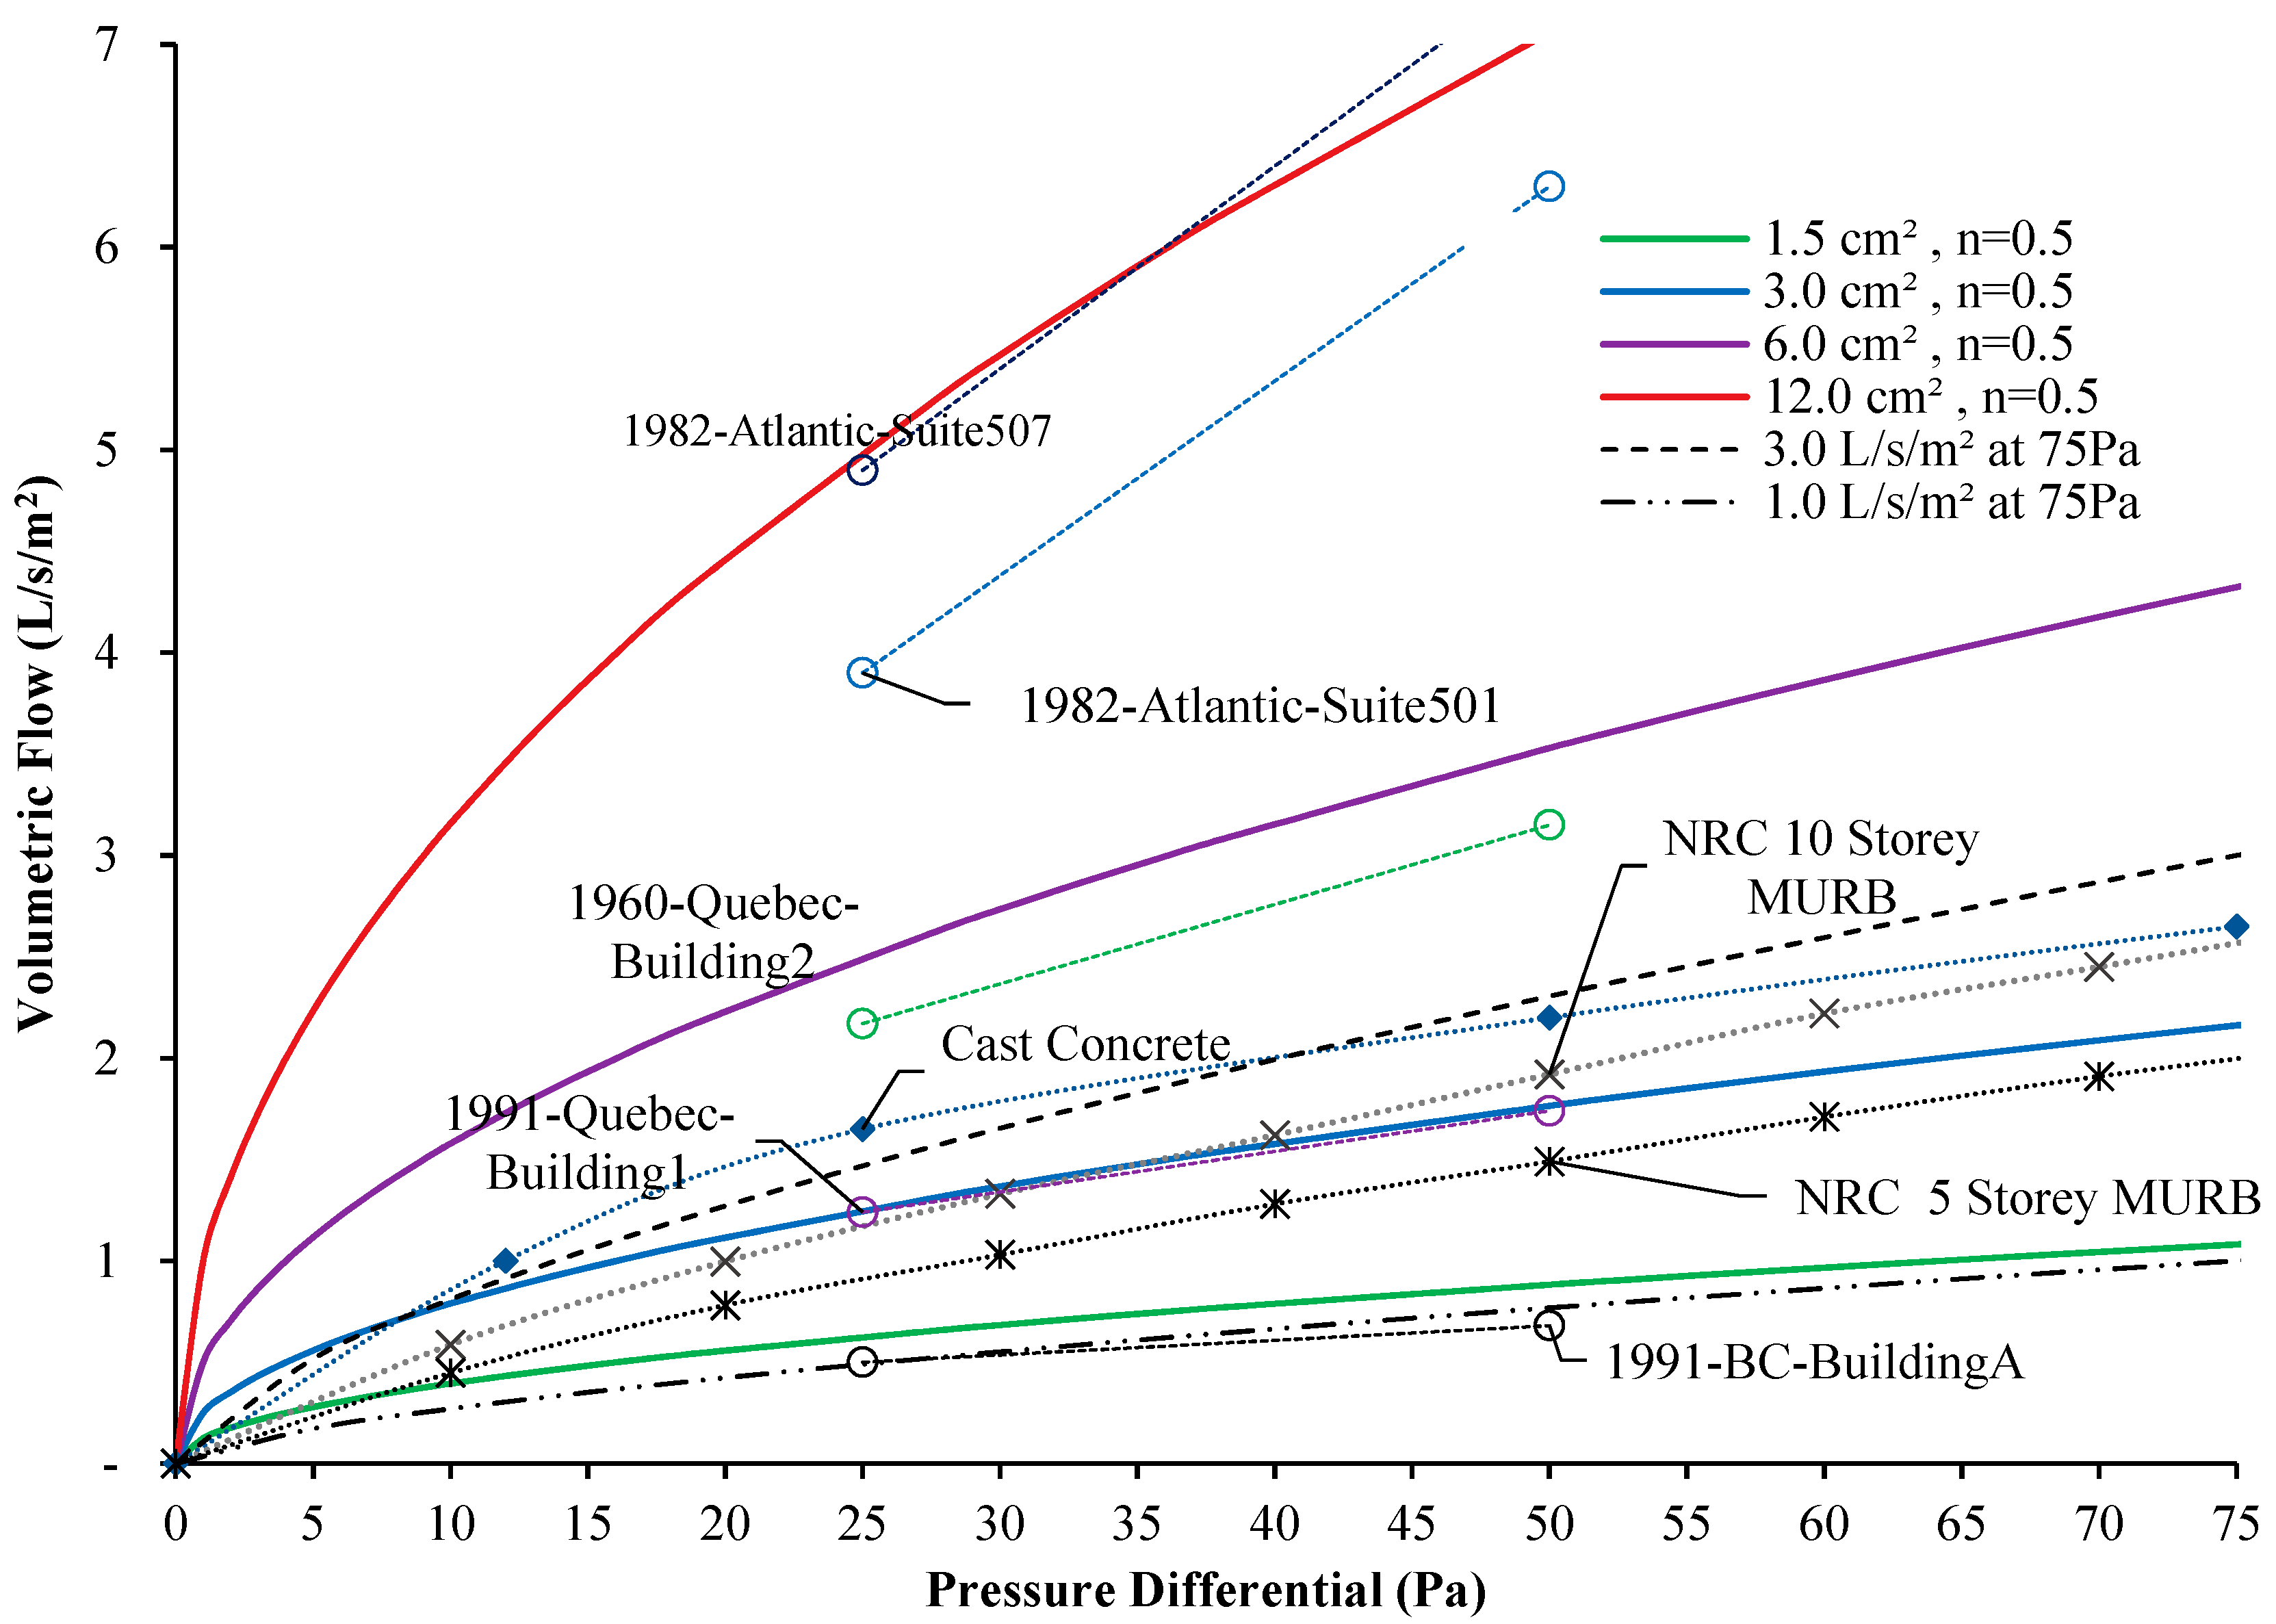
2.1. Airtightness of Stairwell
| Region 1, | NP < 250 |
| Region 2, | 250 < NP < 106 |
| Region 3, | NP > 106 |
- .
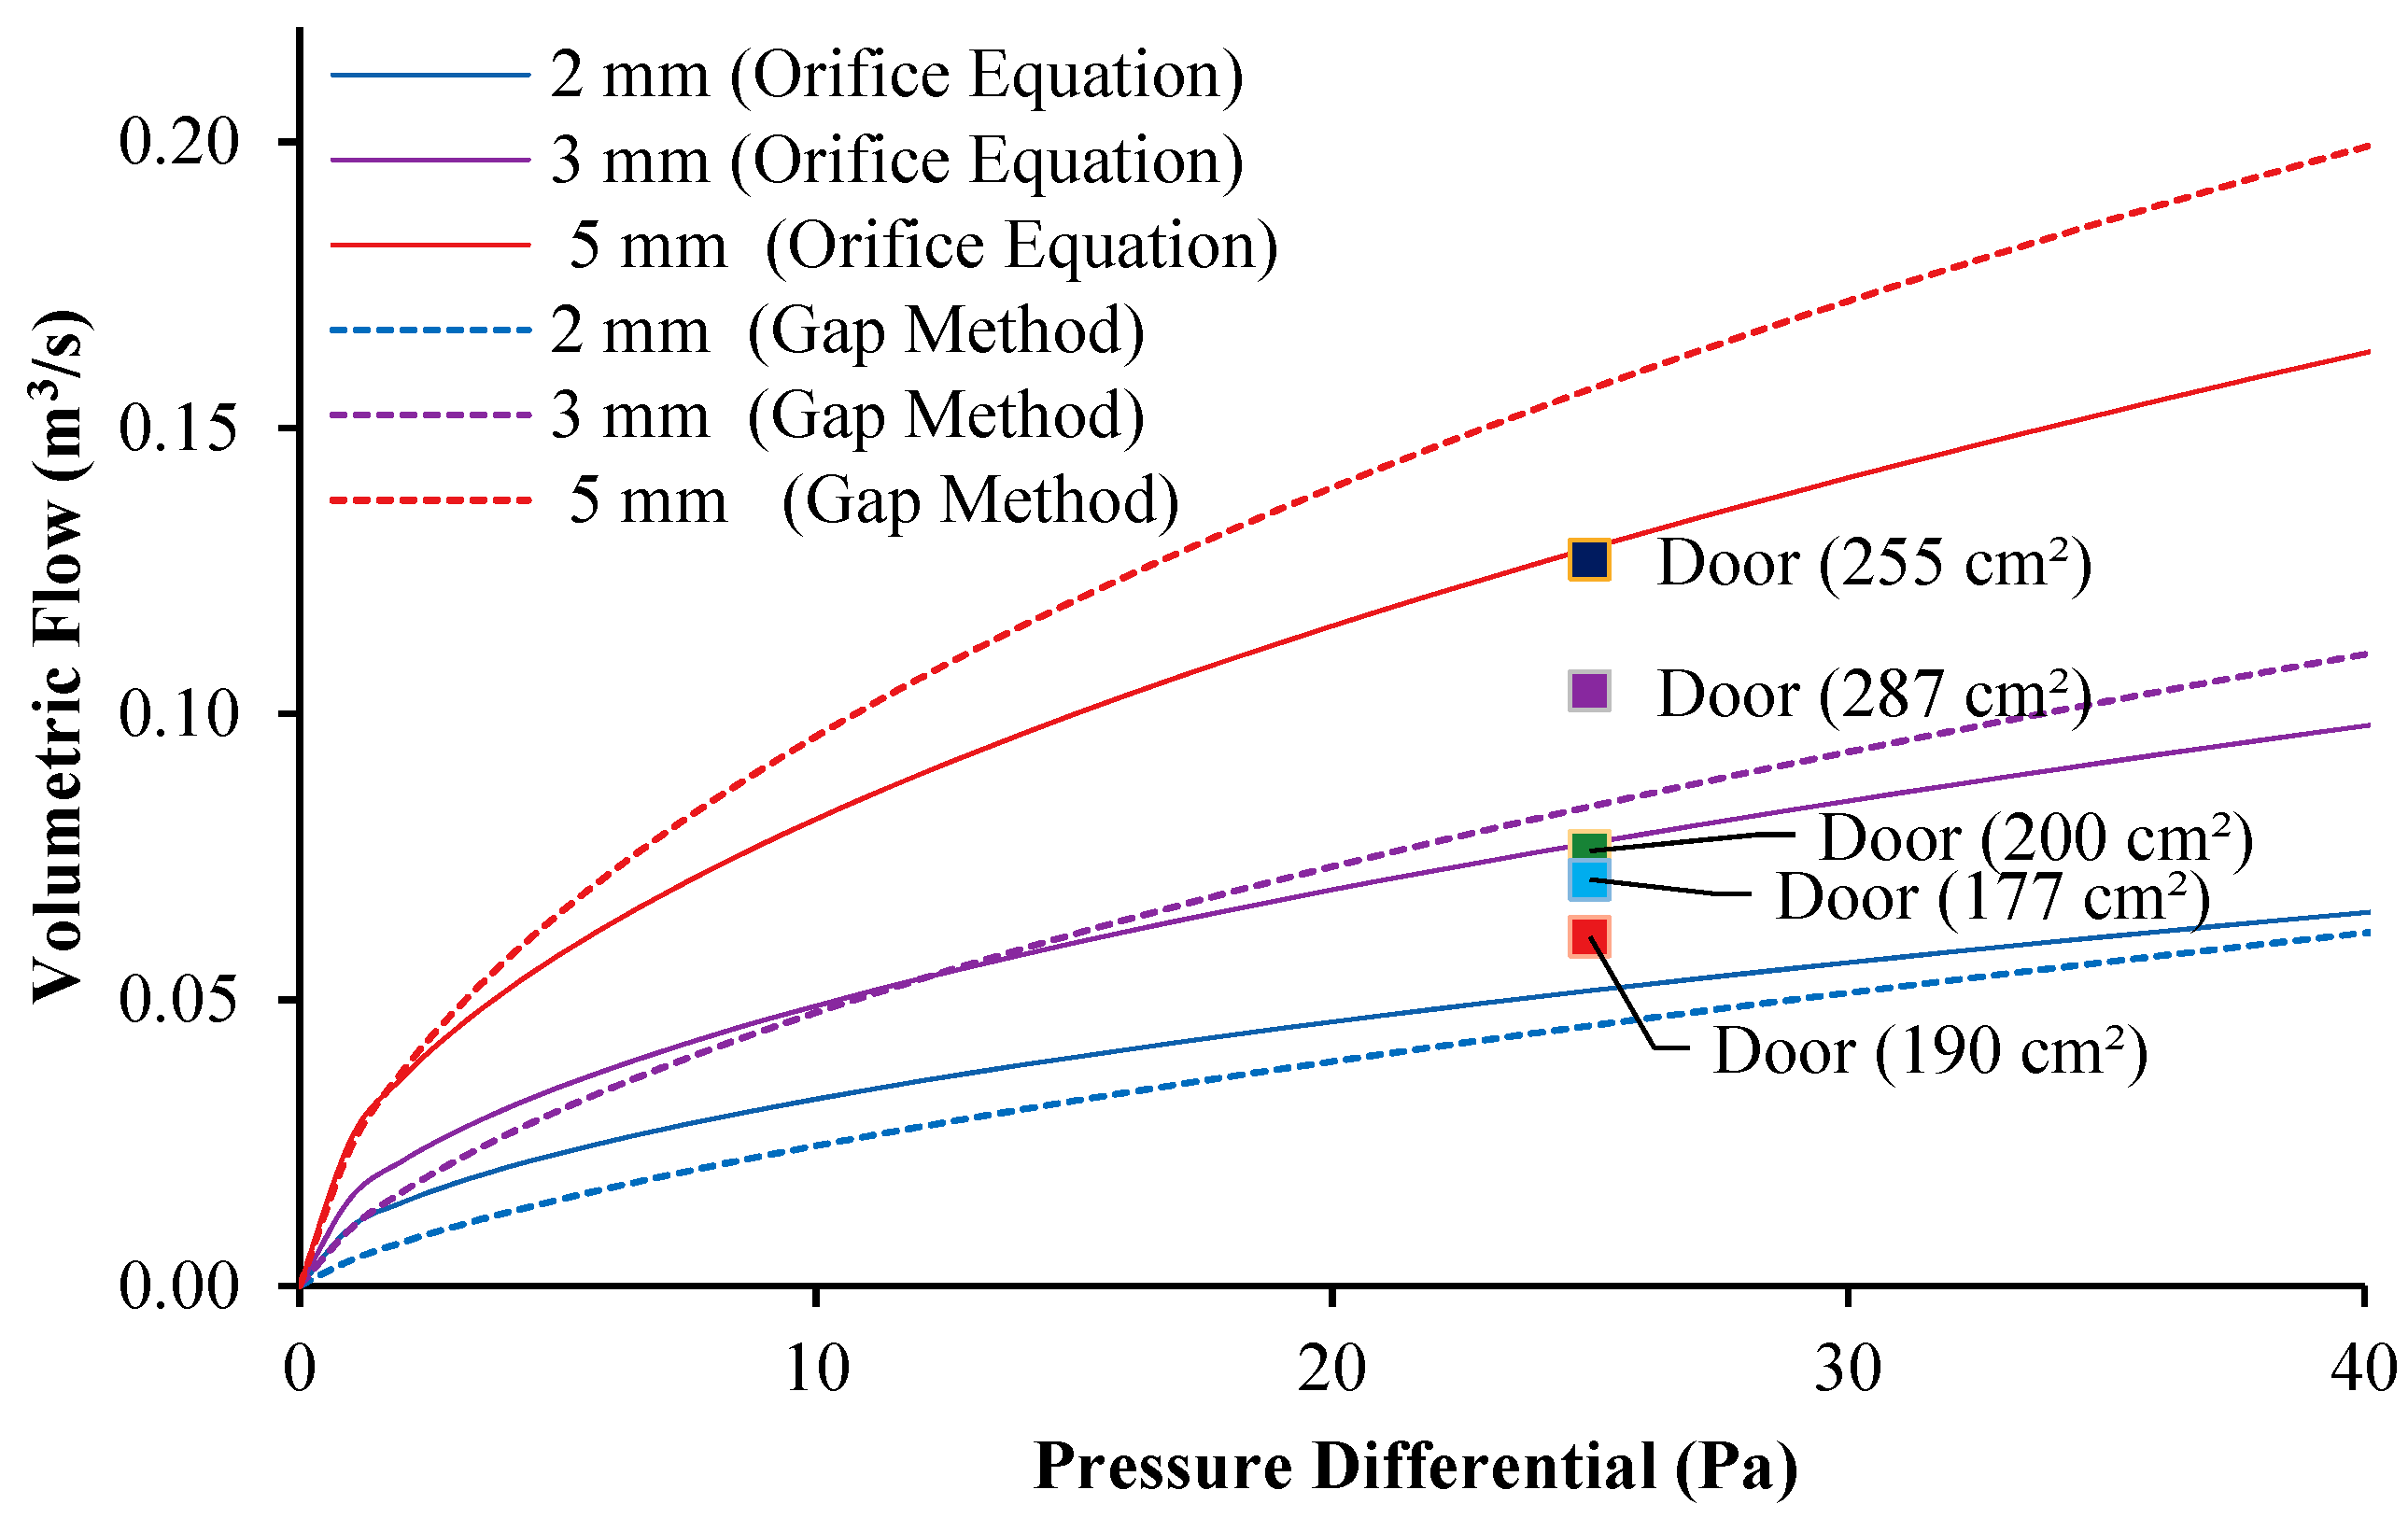
2.2. Airflow in Stairwells
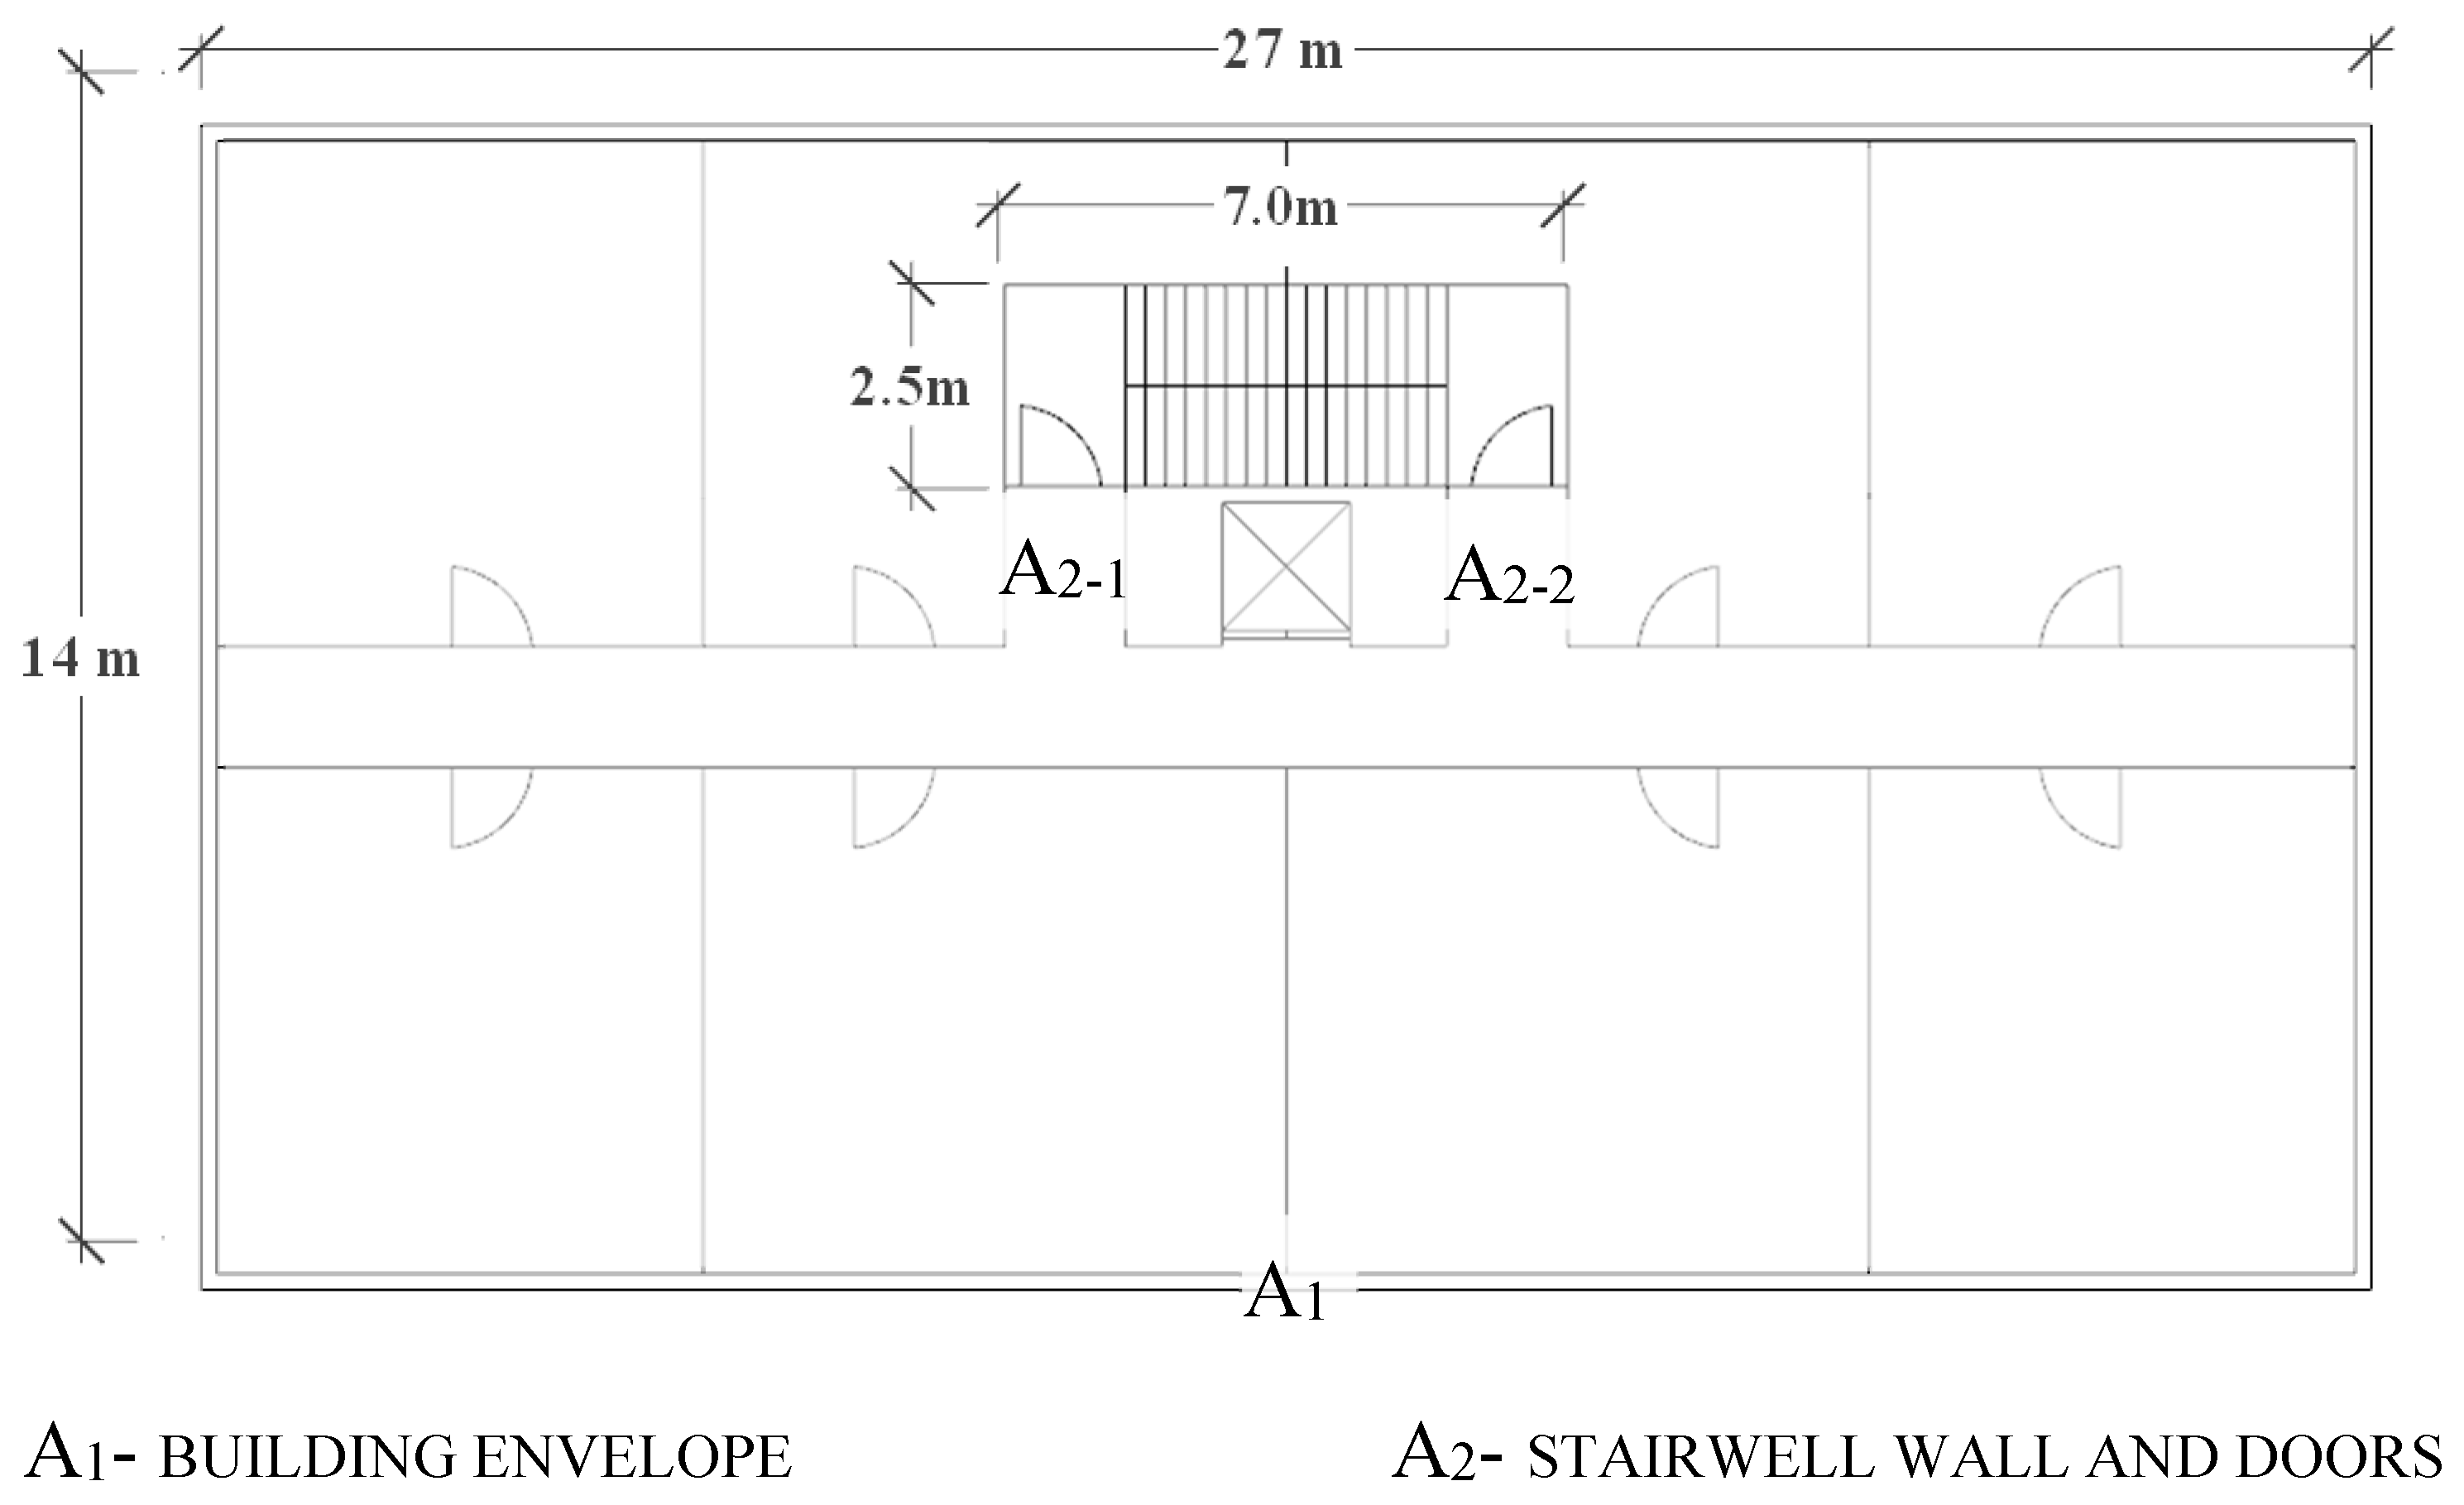
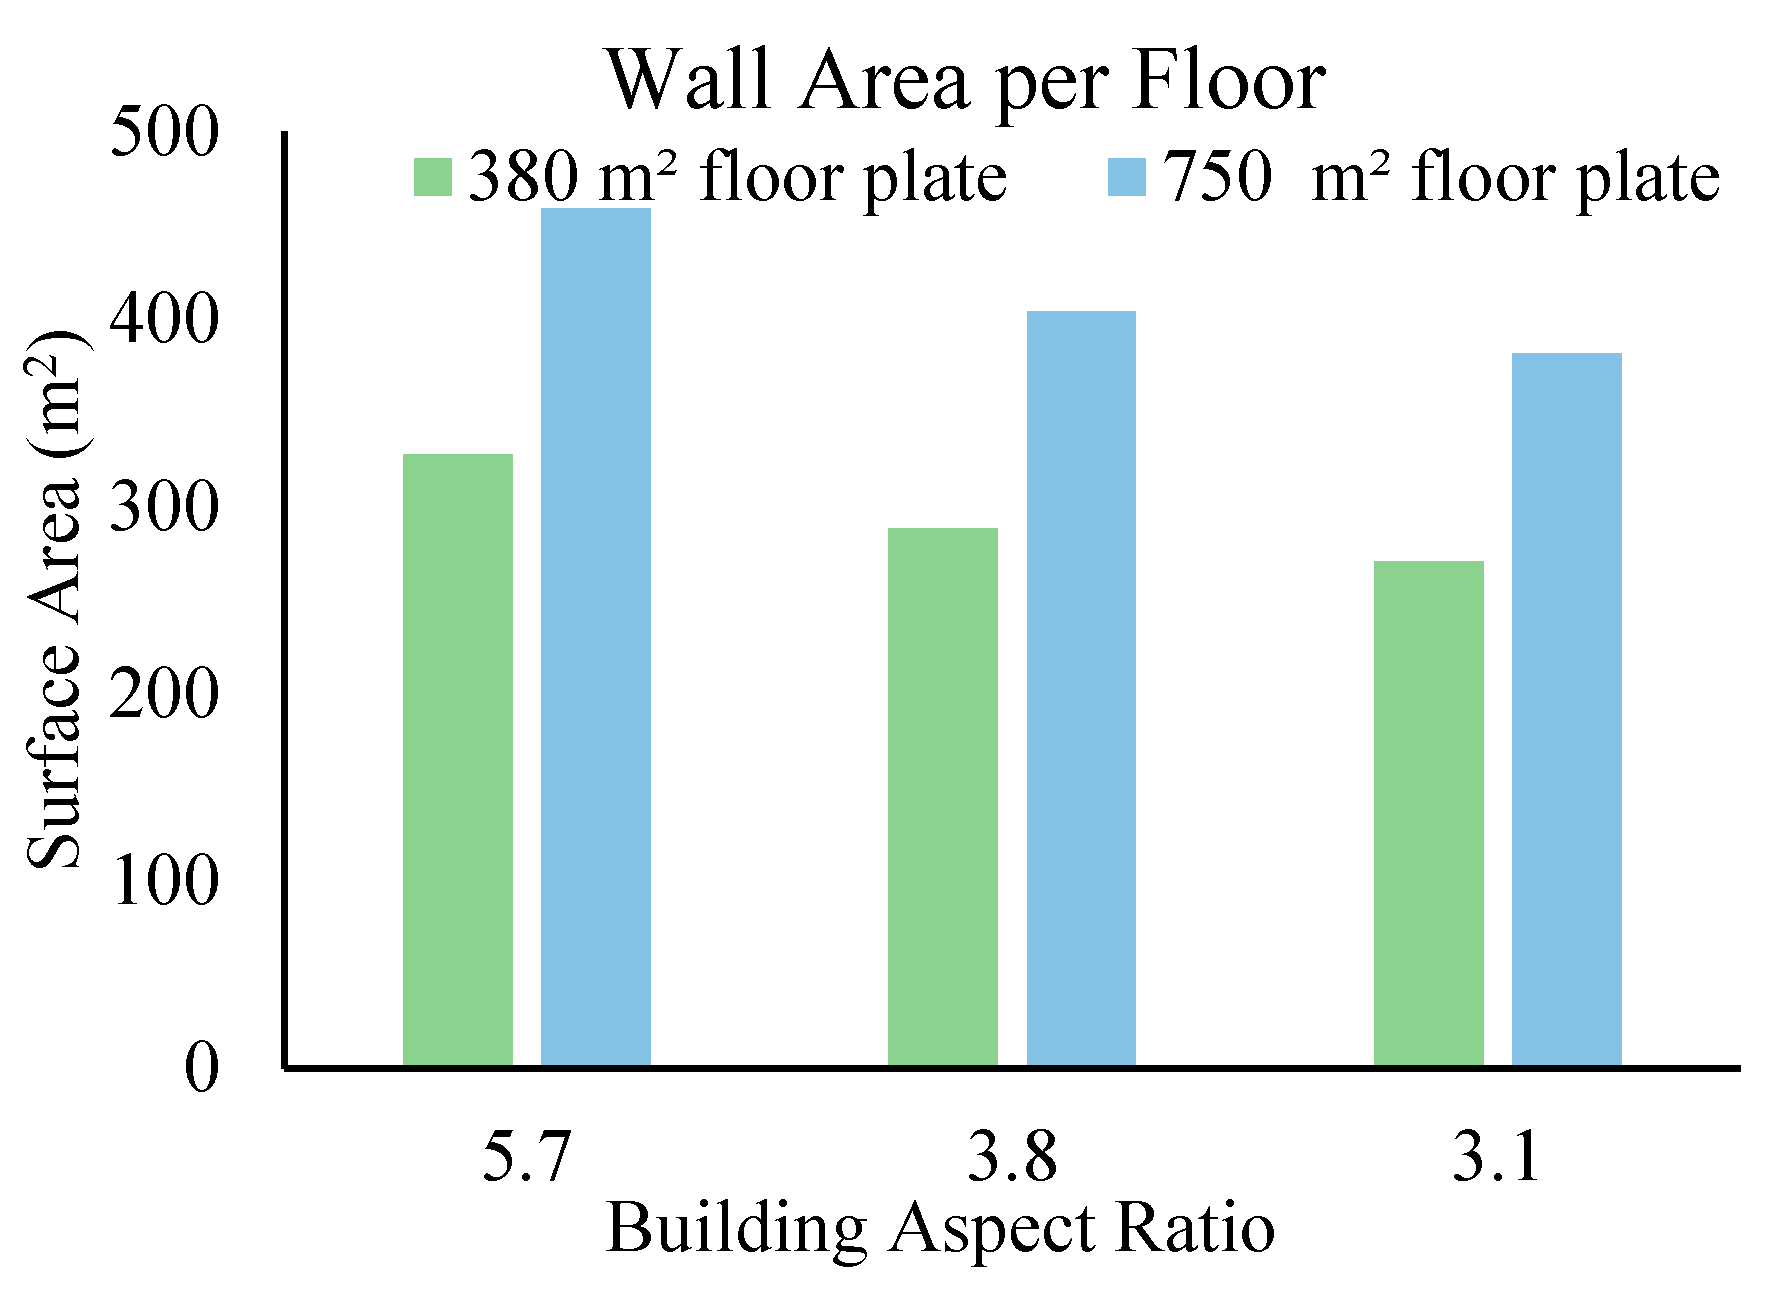
2.3. Building Idealization
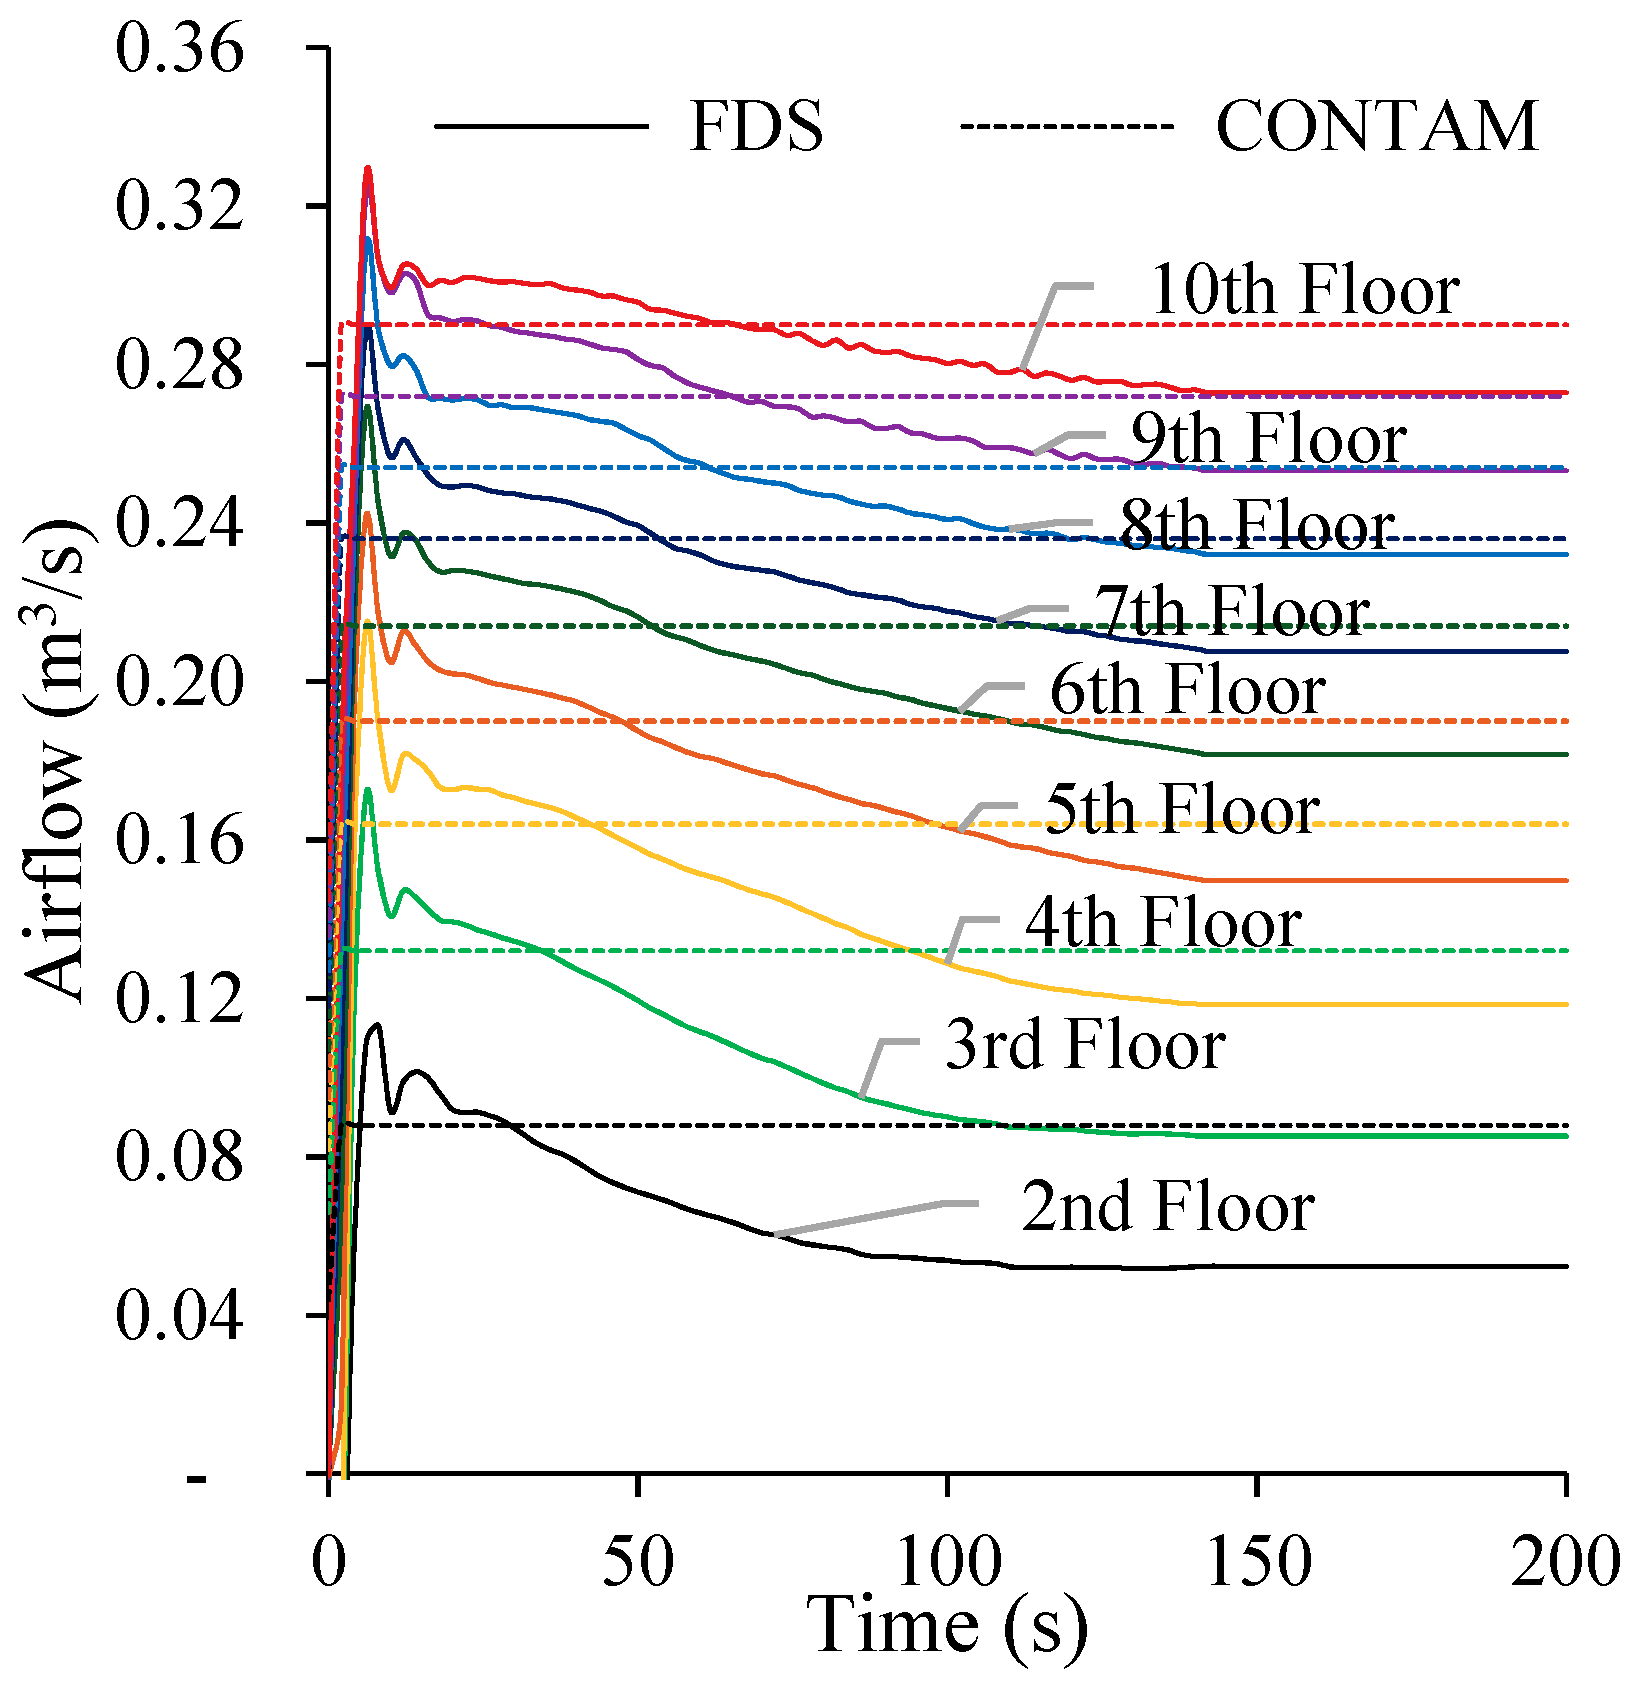
3. Simulation and Results
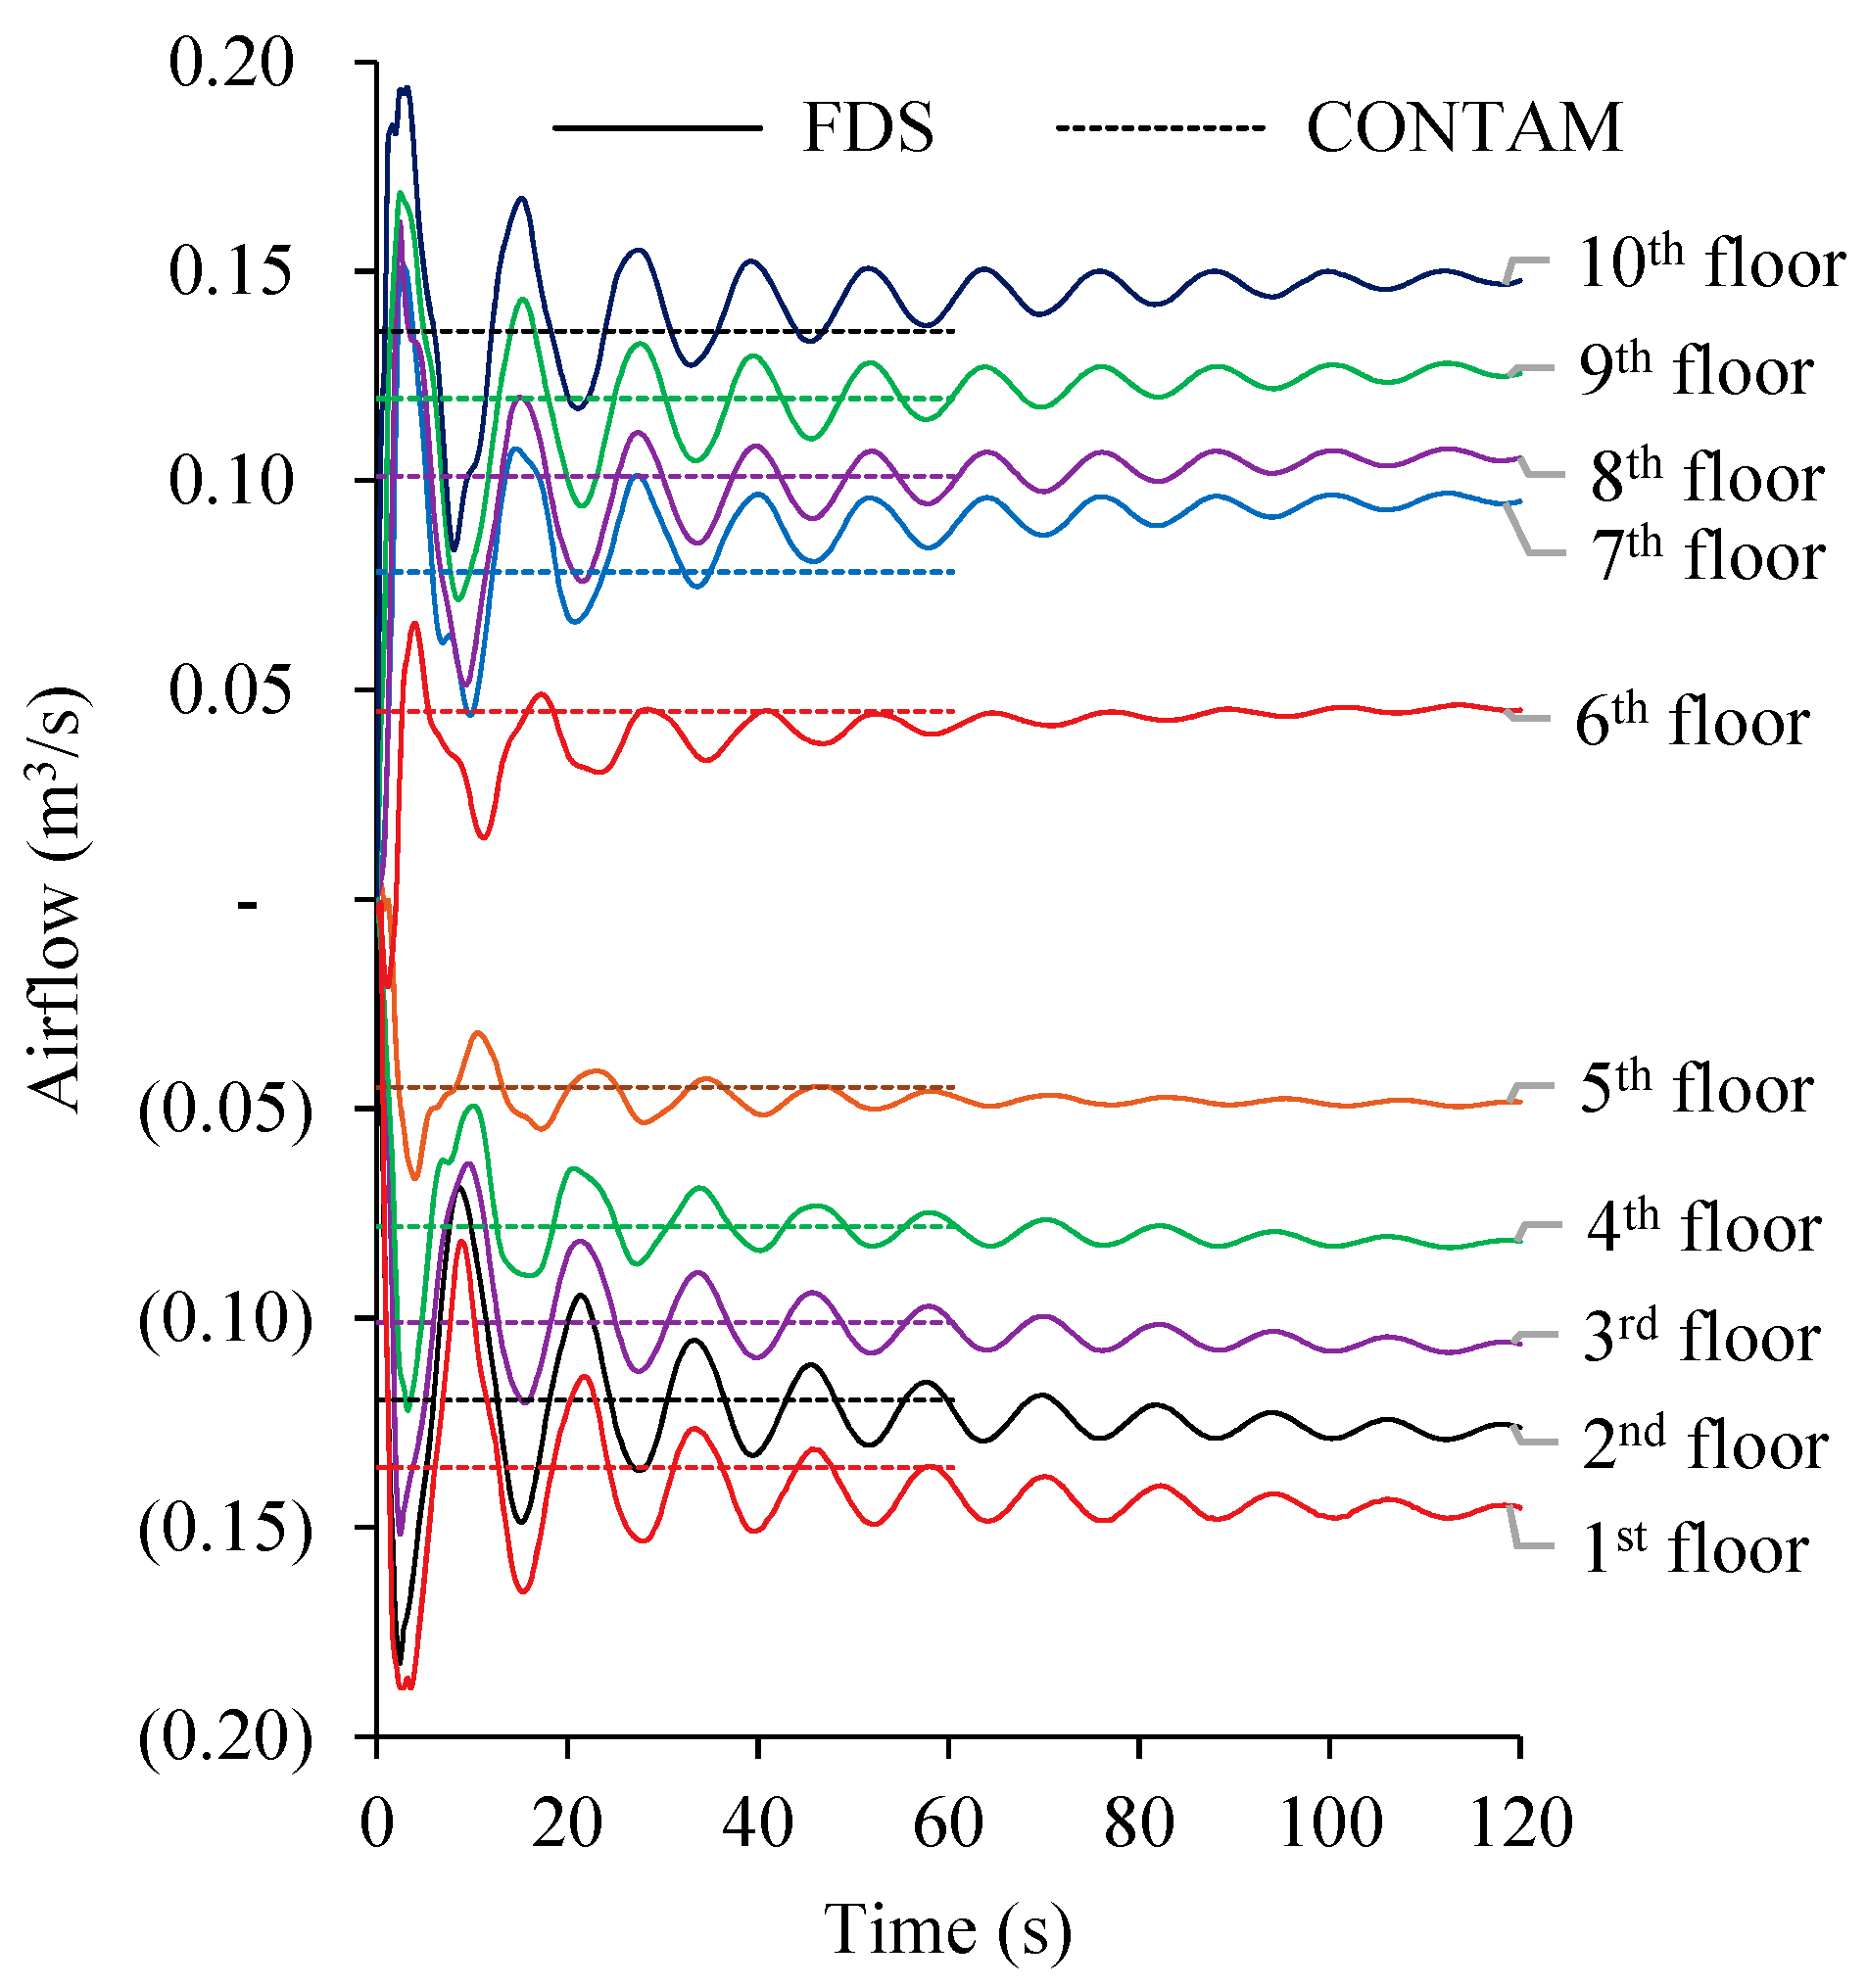
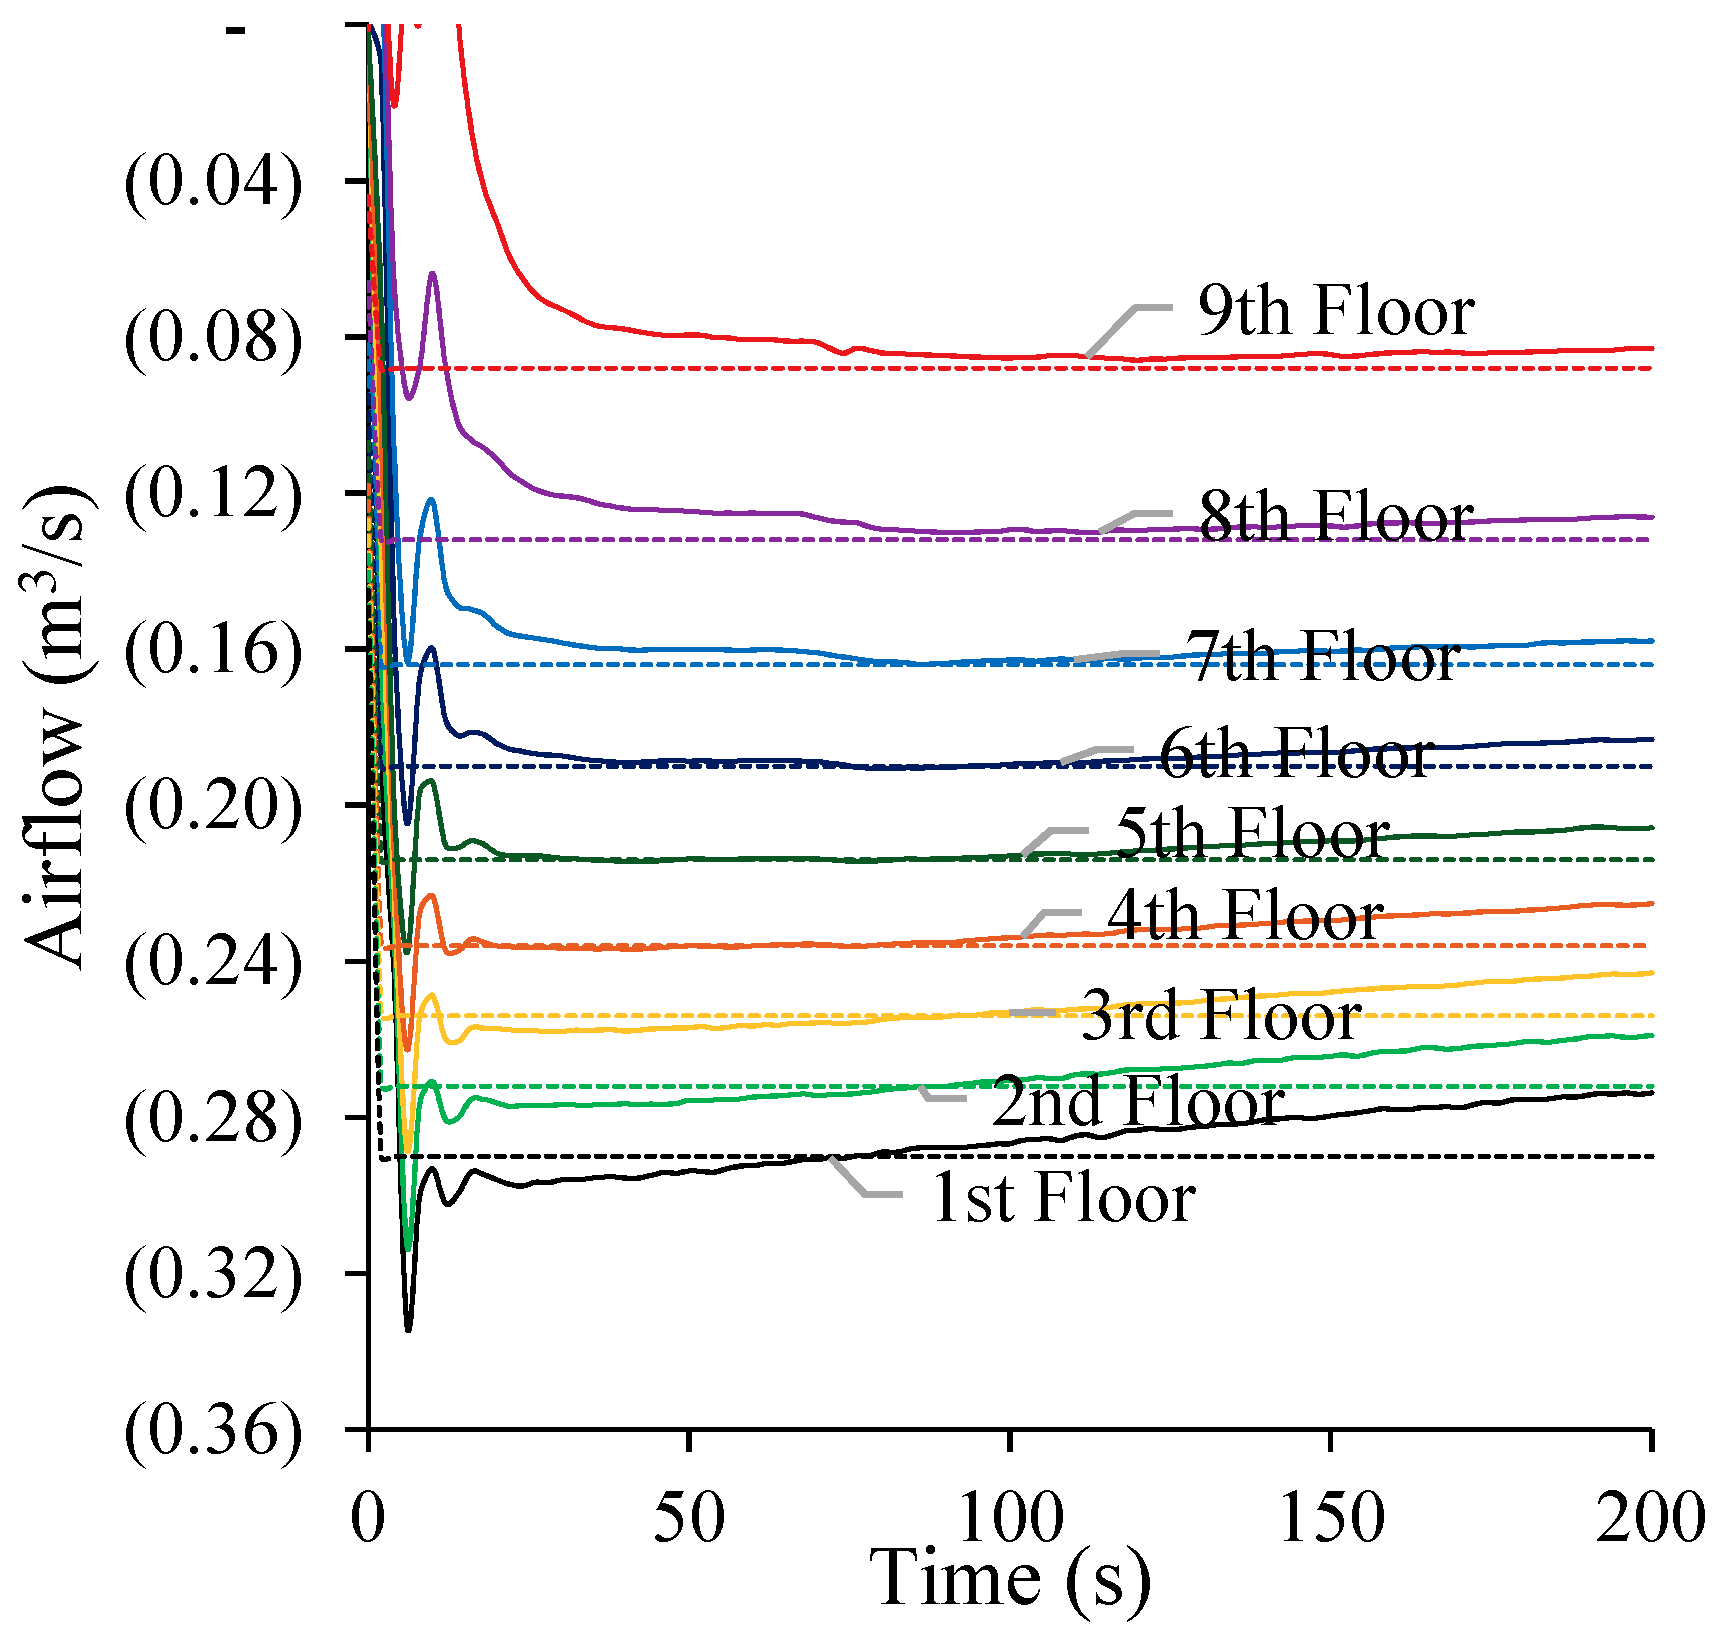
3.1. Simulation 1: Evenly Distributed Openings
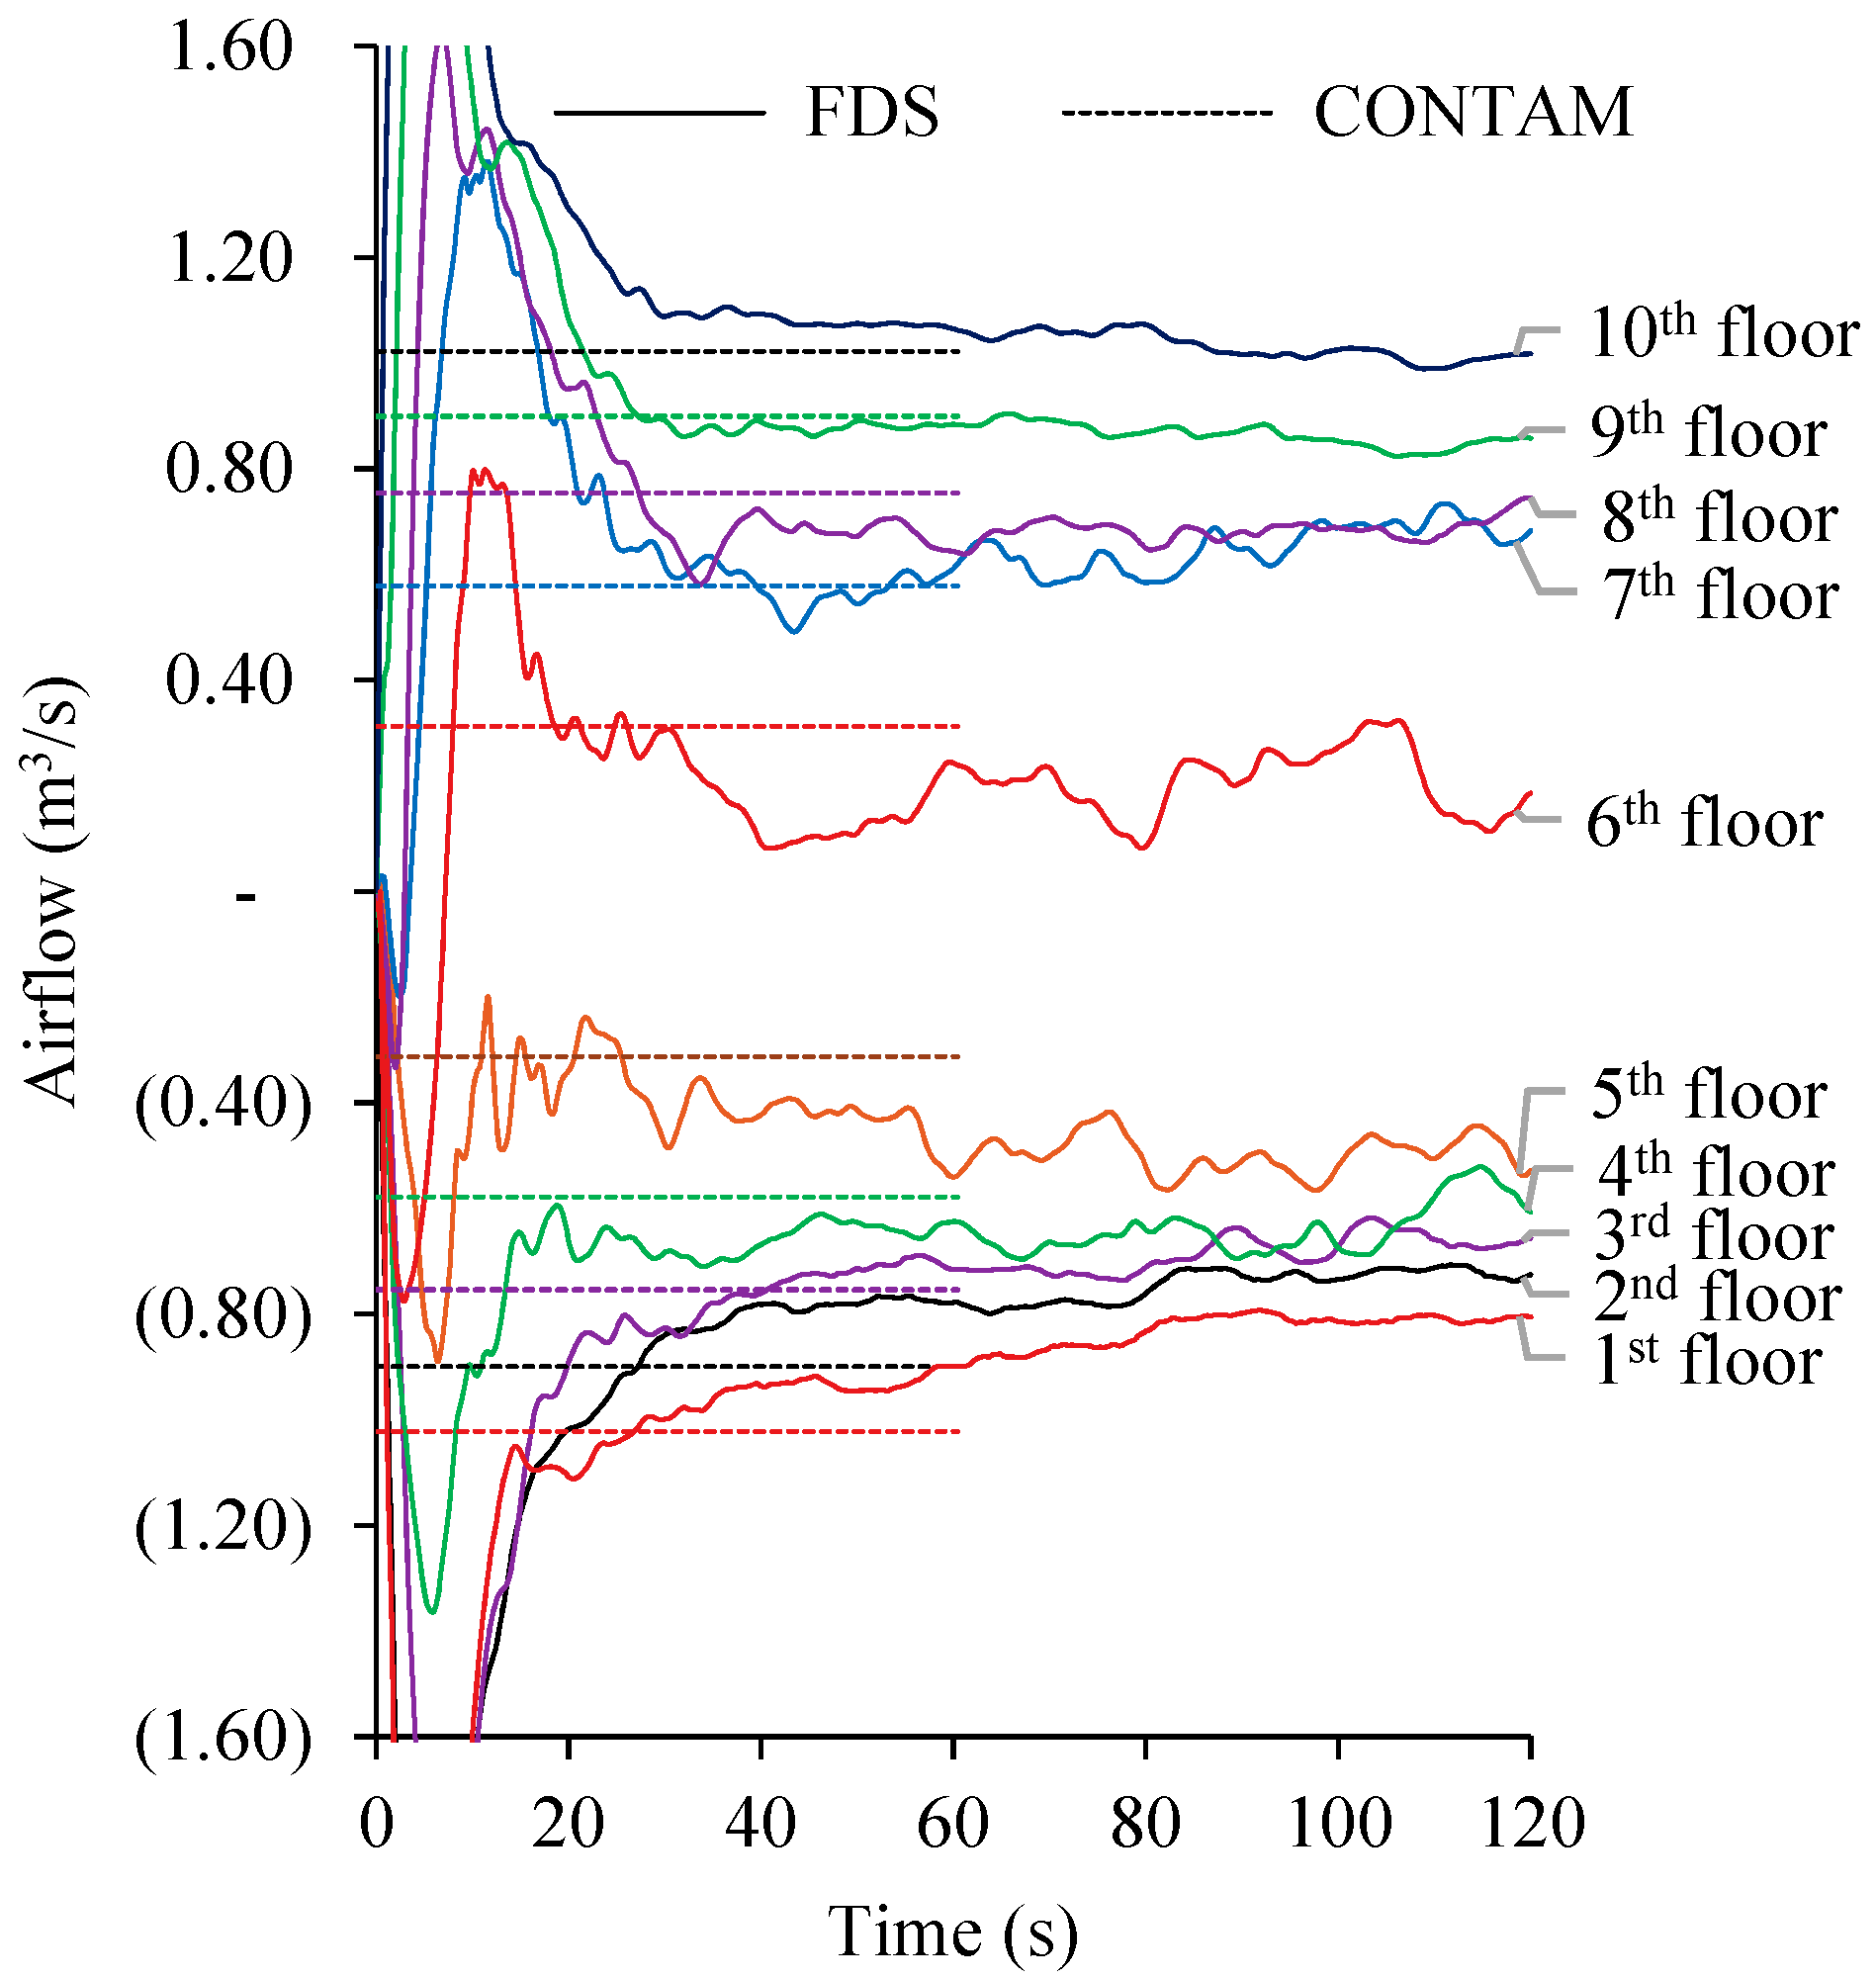
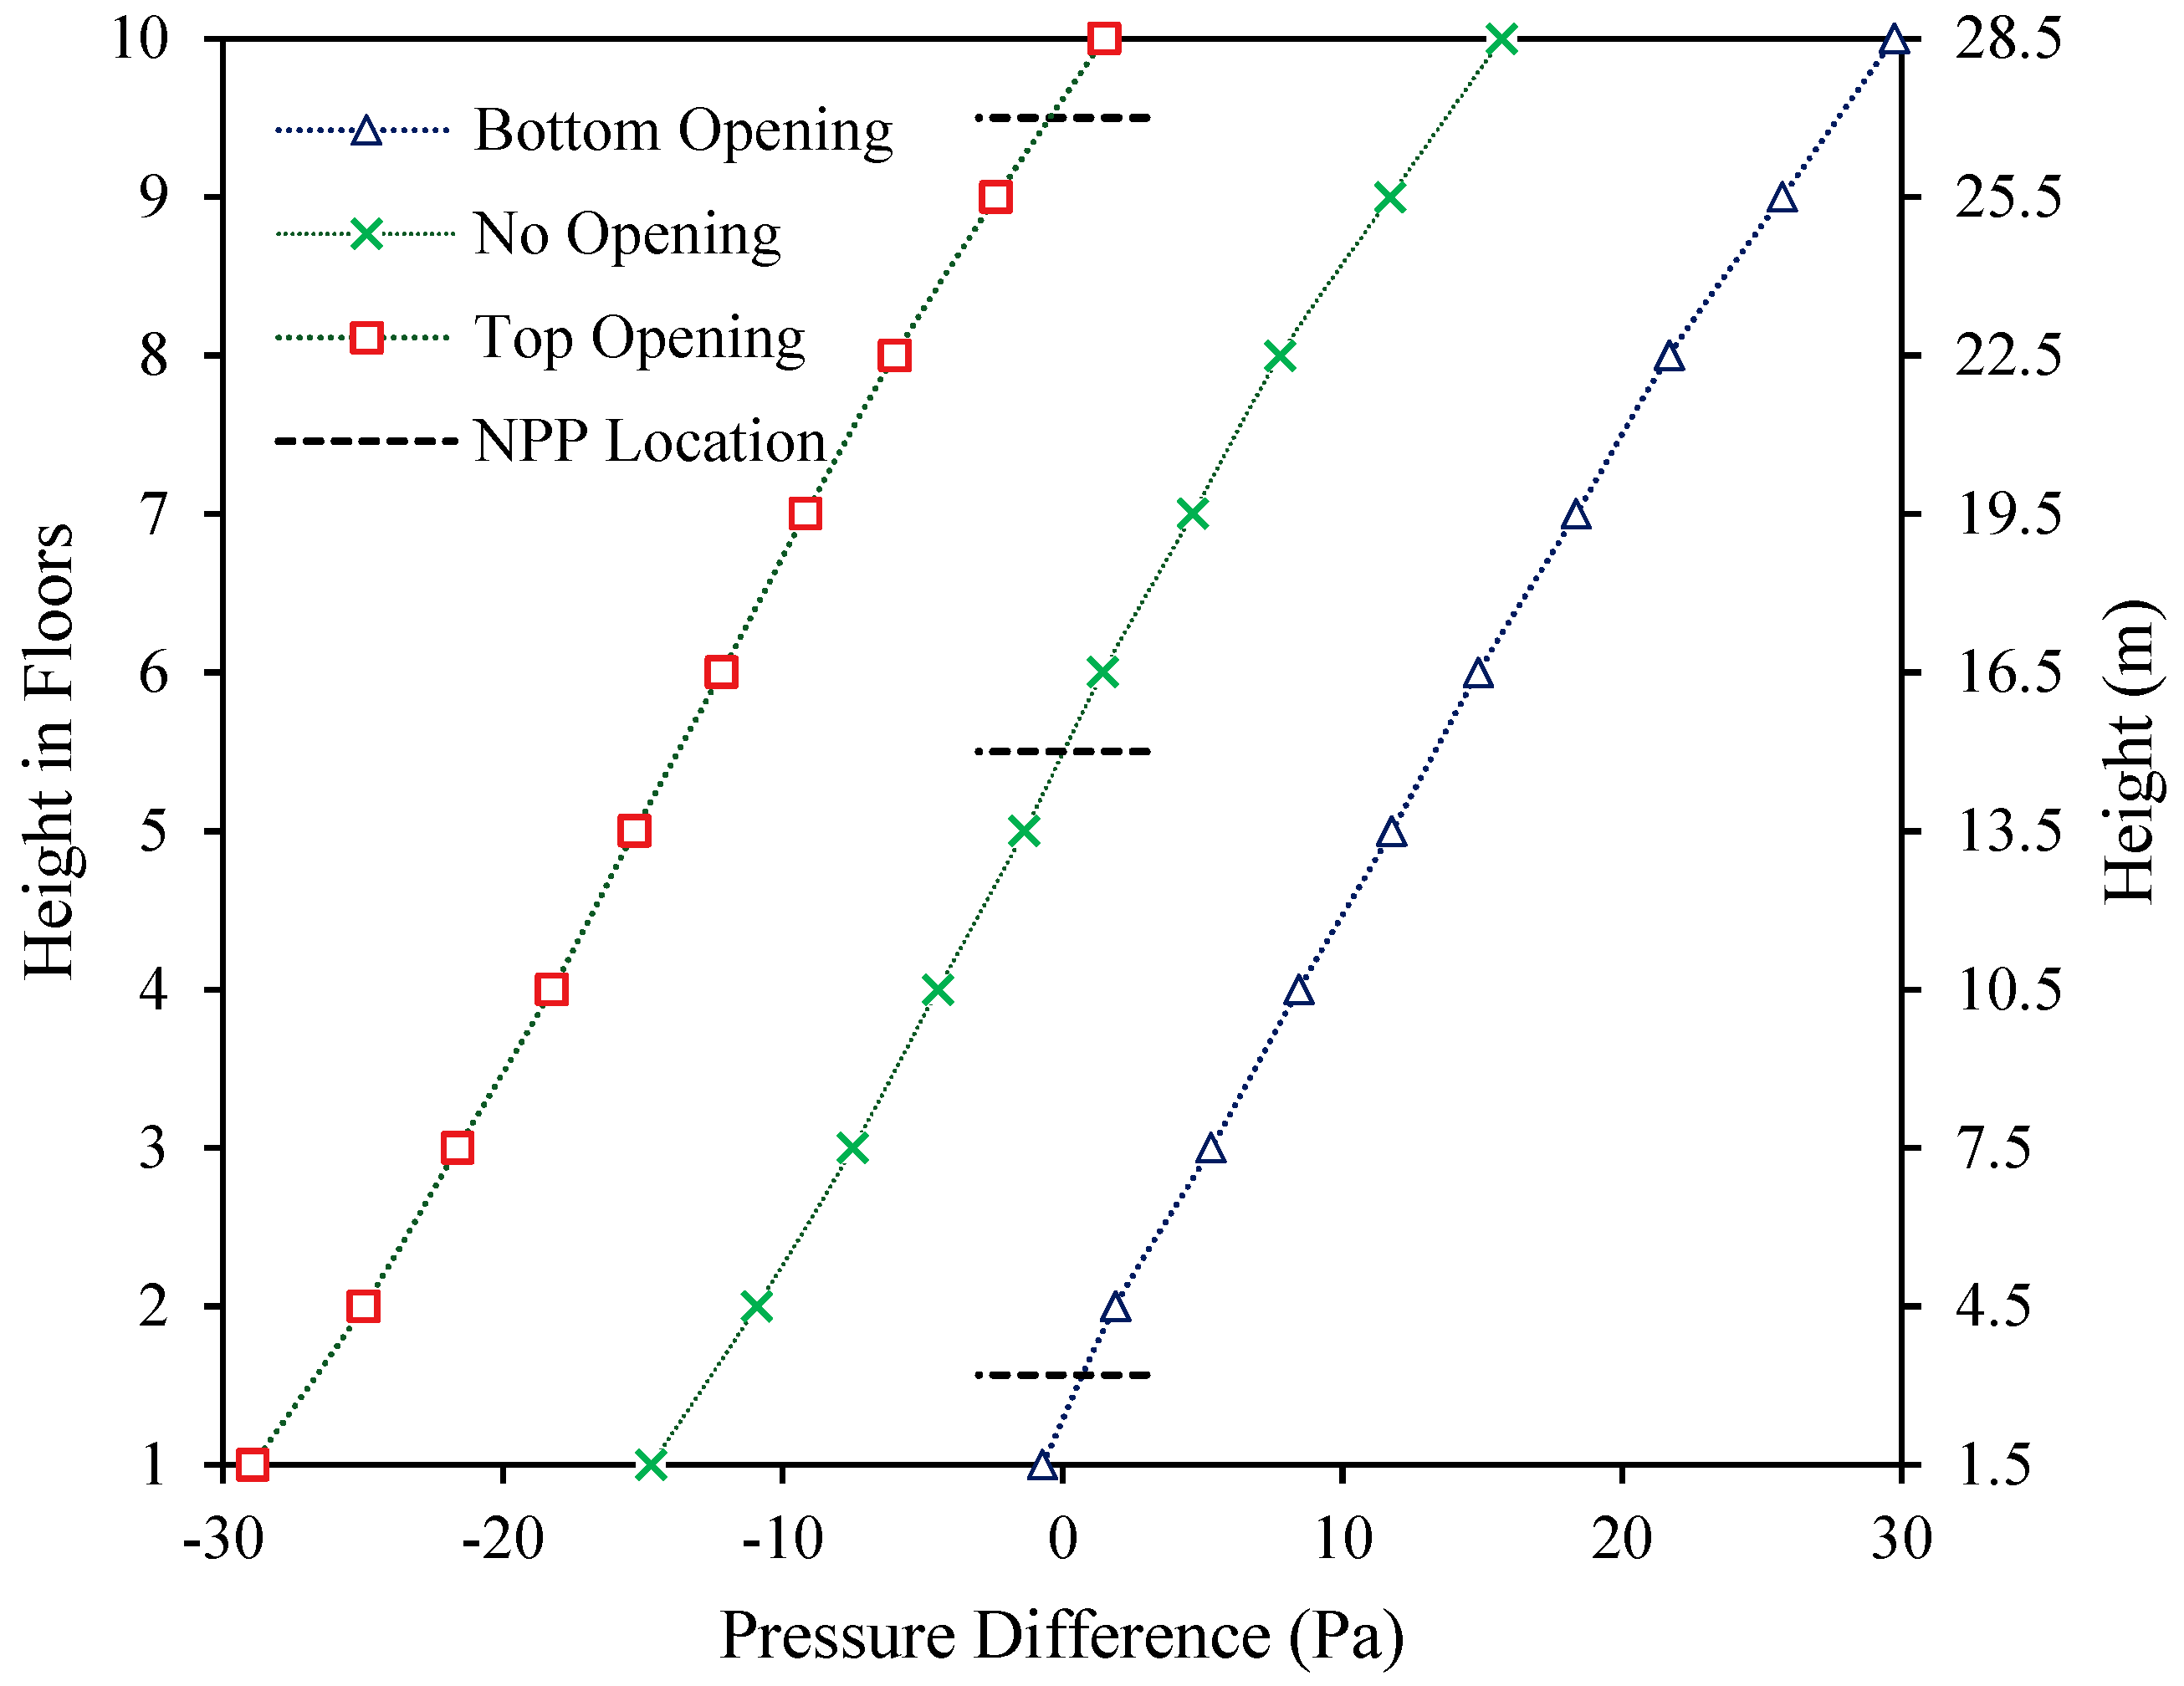
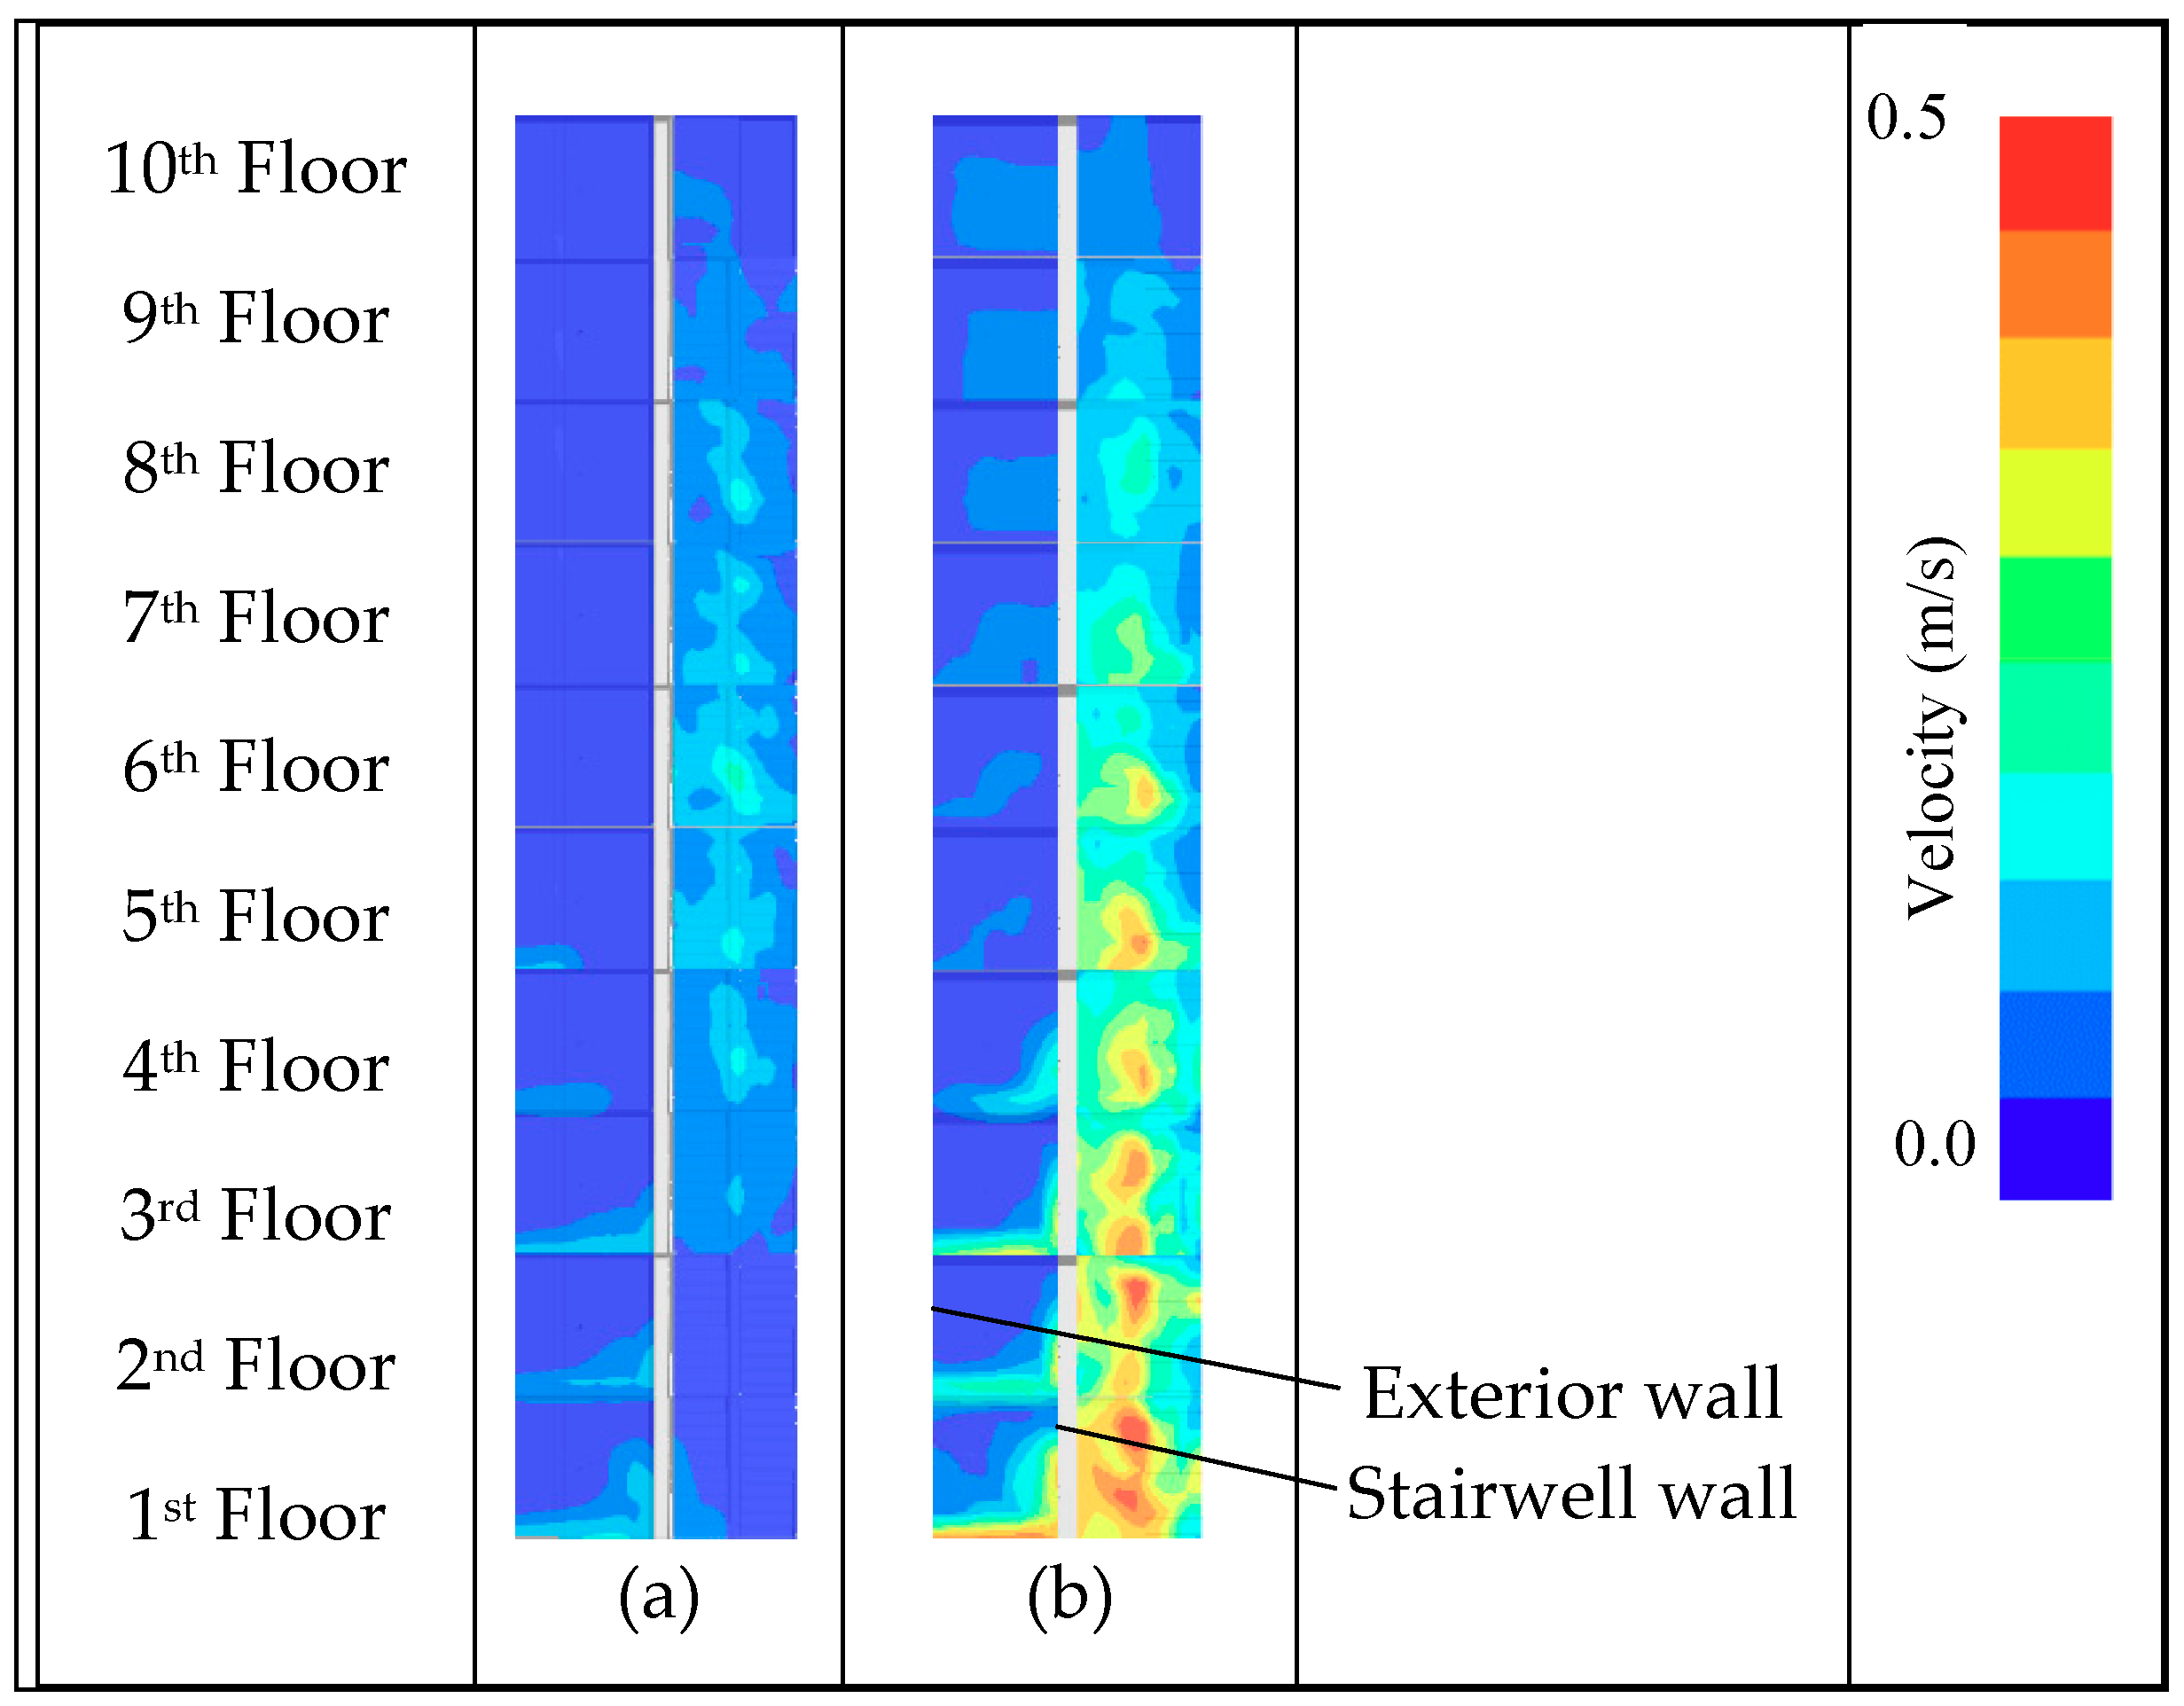
3.2. Simulation 2: Top and Bottom Openings in Building Envelope
- an orifice of 4 m2 in the building envelope A1 was specified at the 1st floor.
- open stairwell doors of 2 m2 for A2-1 and A2-2 were specified at the 1st floor.
- an orifice of 4 m2 in the building envelope A1 was specified at the 10th floor.
- open stairwell doors of 2 m2 for A2-1 and A2-2 were specified at the 10th floor.
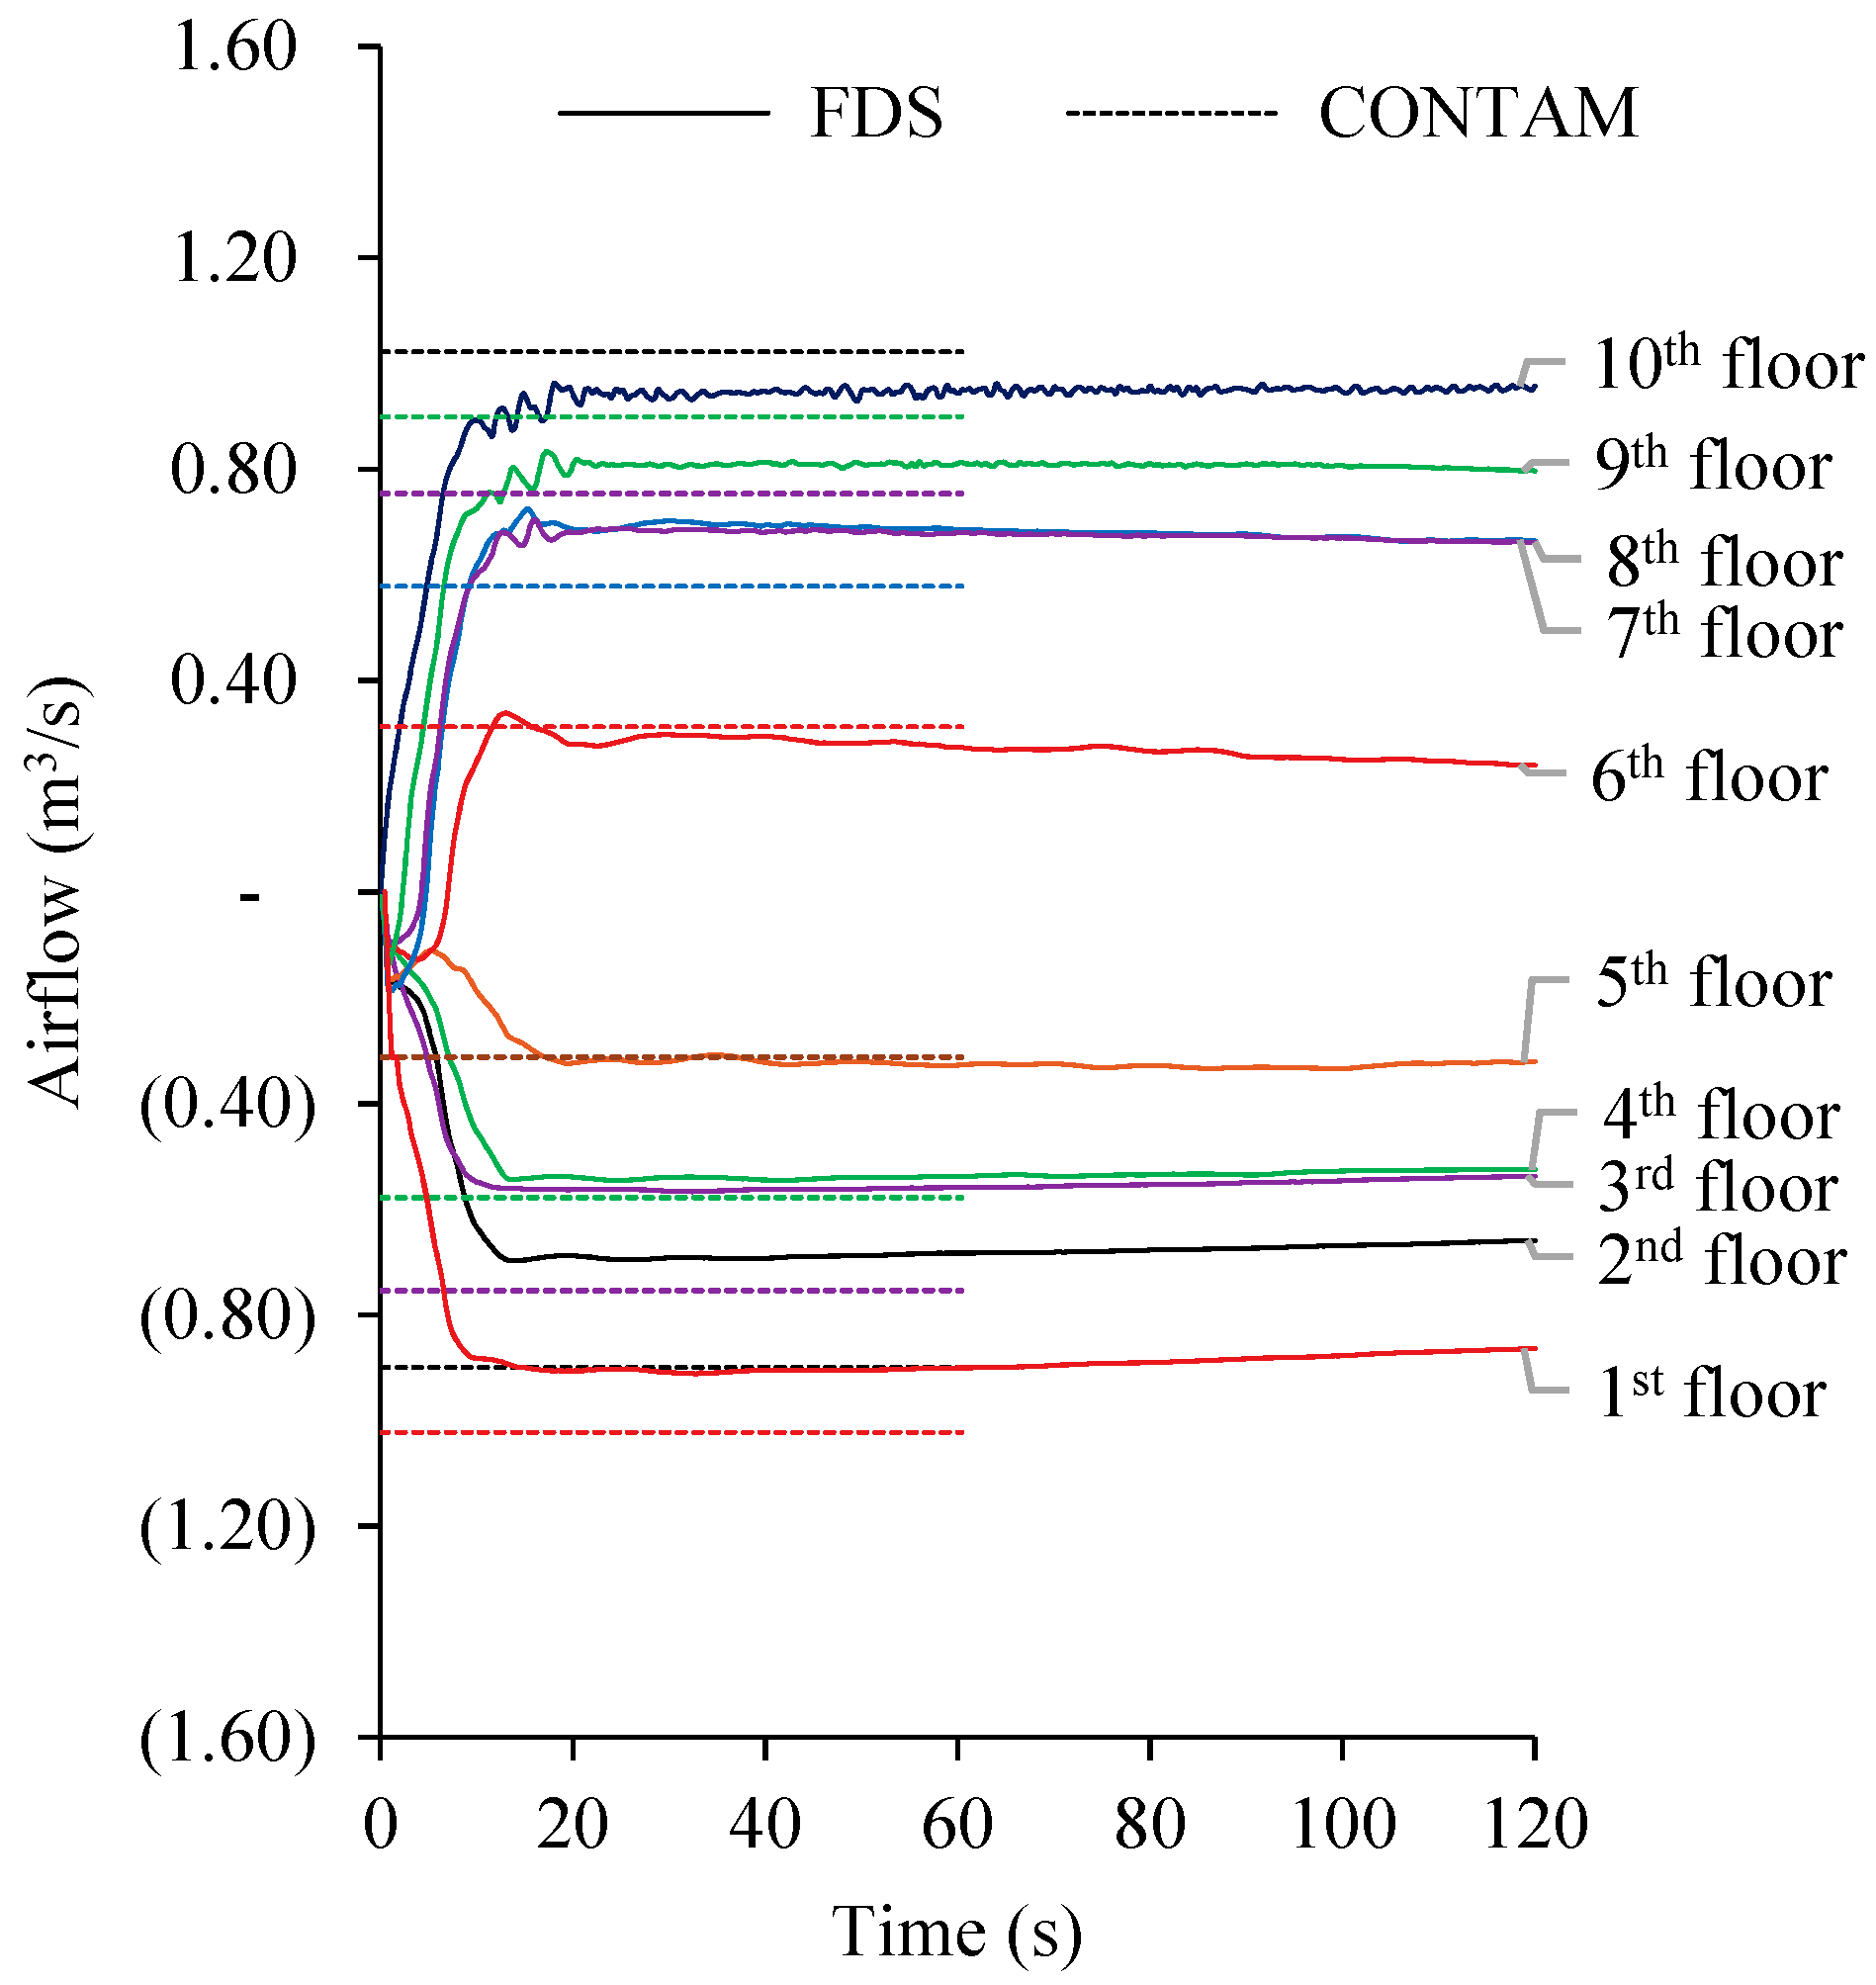
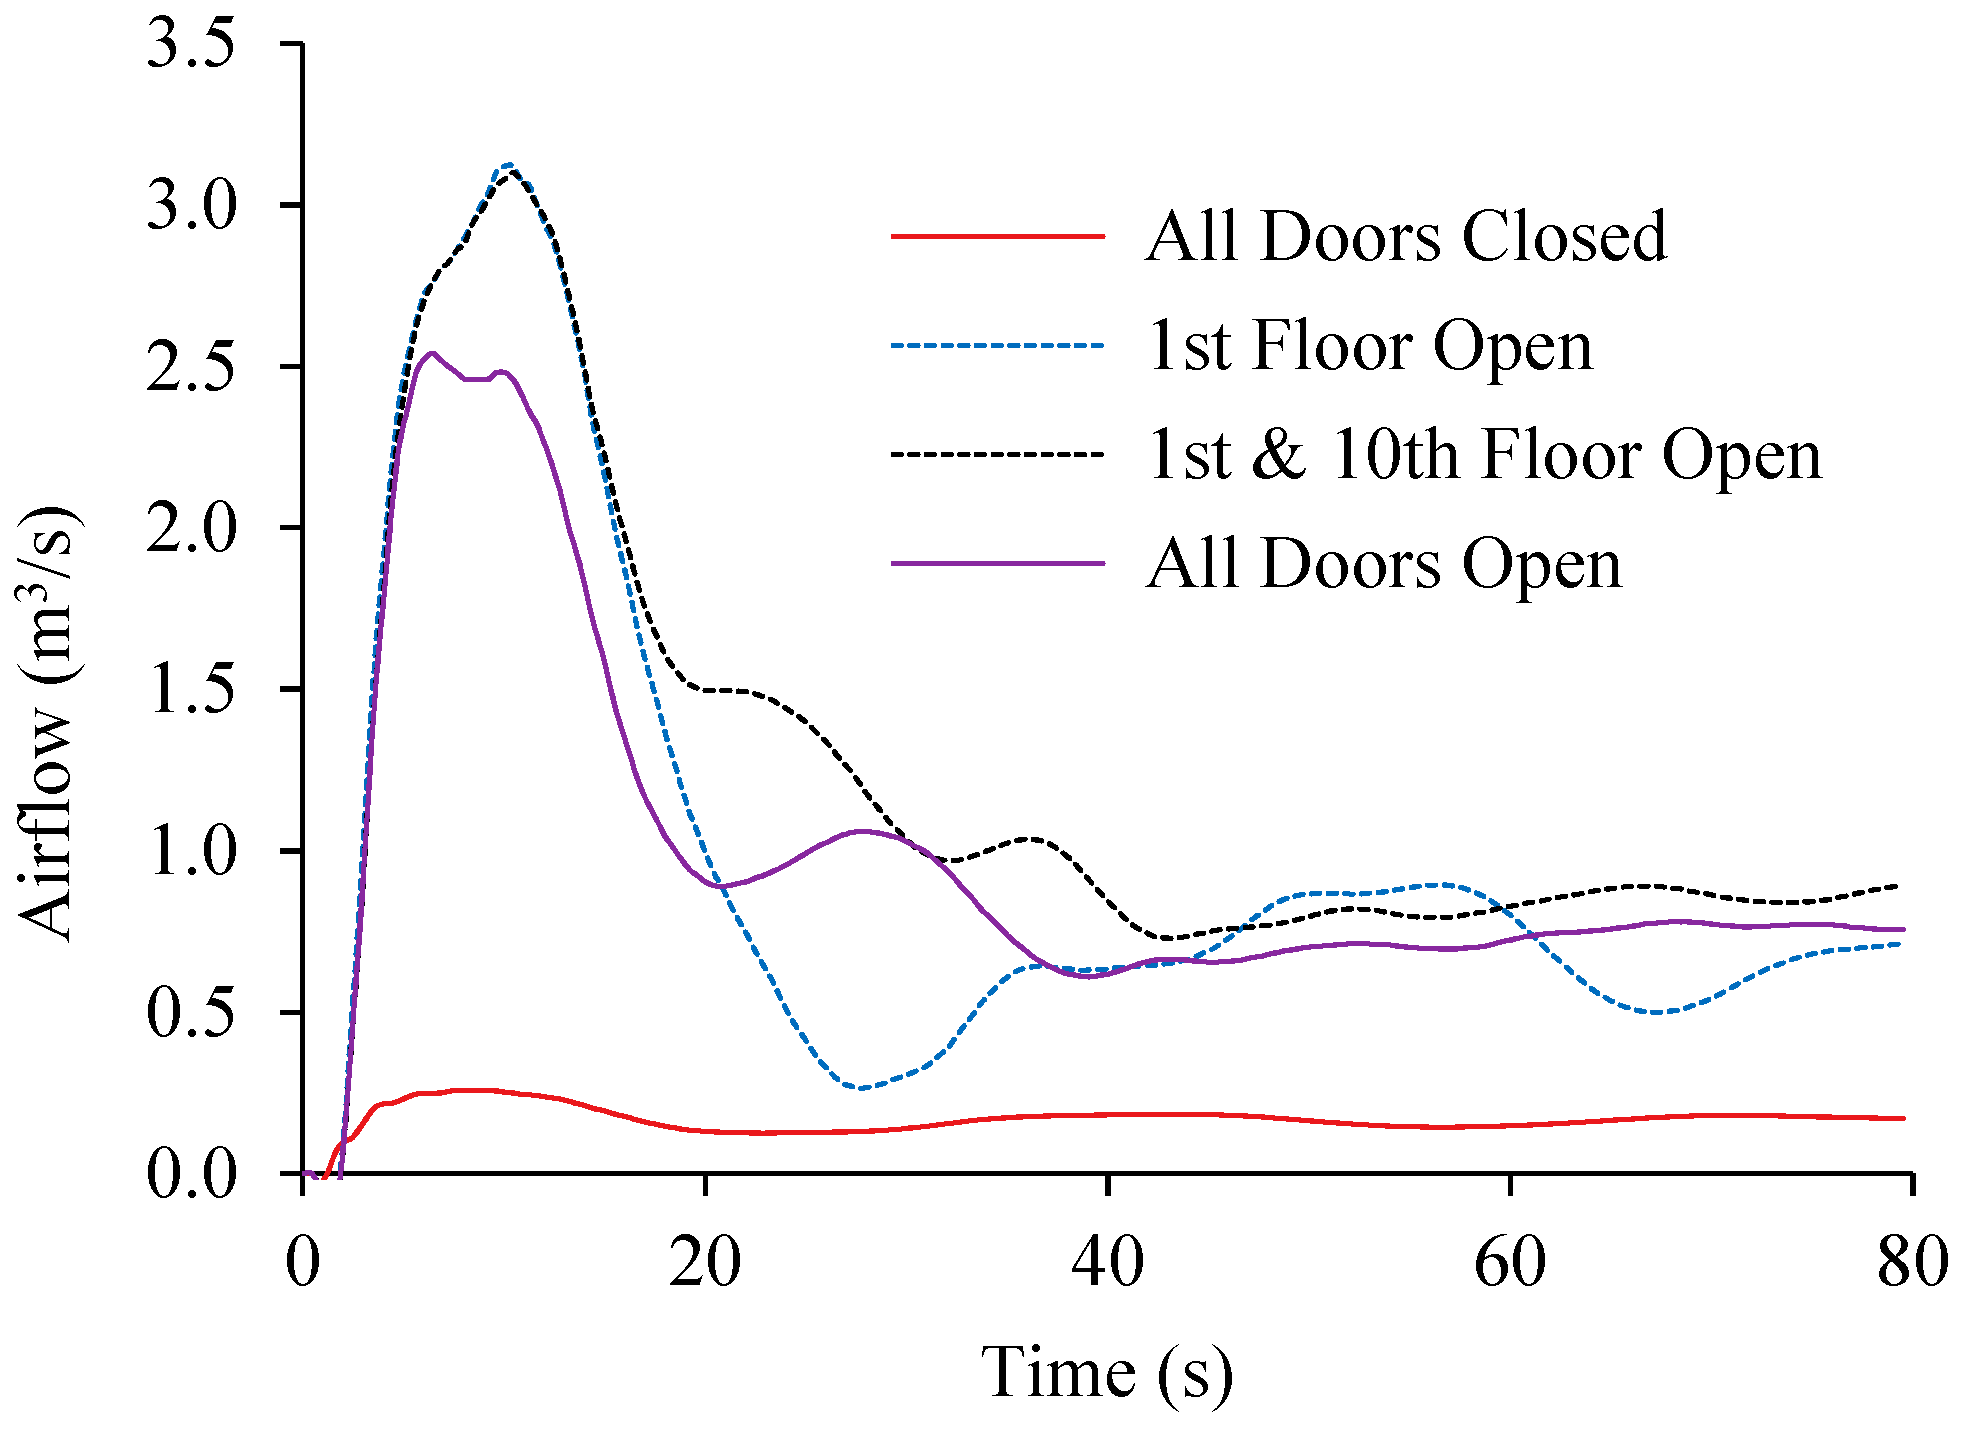
3.3. Simulation 3: Select Door Openings
- 1st floor;
- 1st and 10th floor;
- 1st, 3rd, 5th, 7th, and 9th floor.
4. Discussion
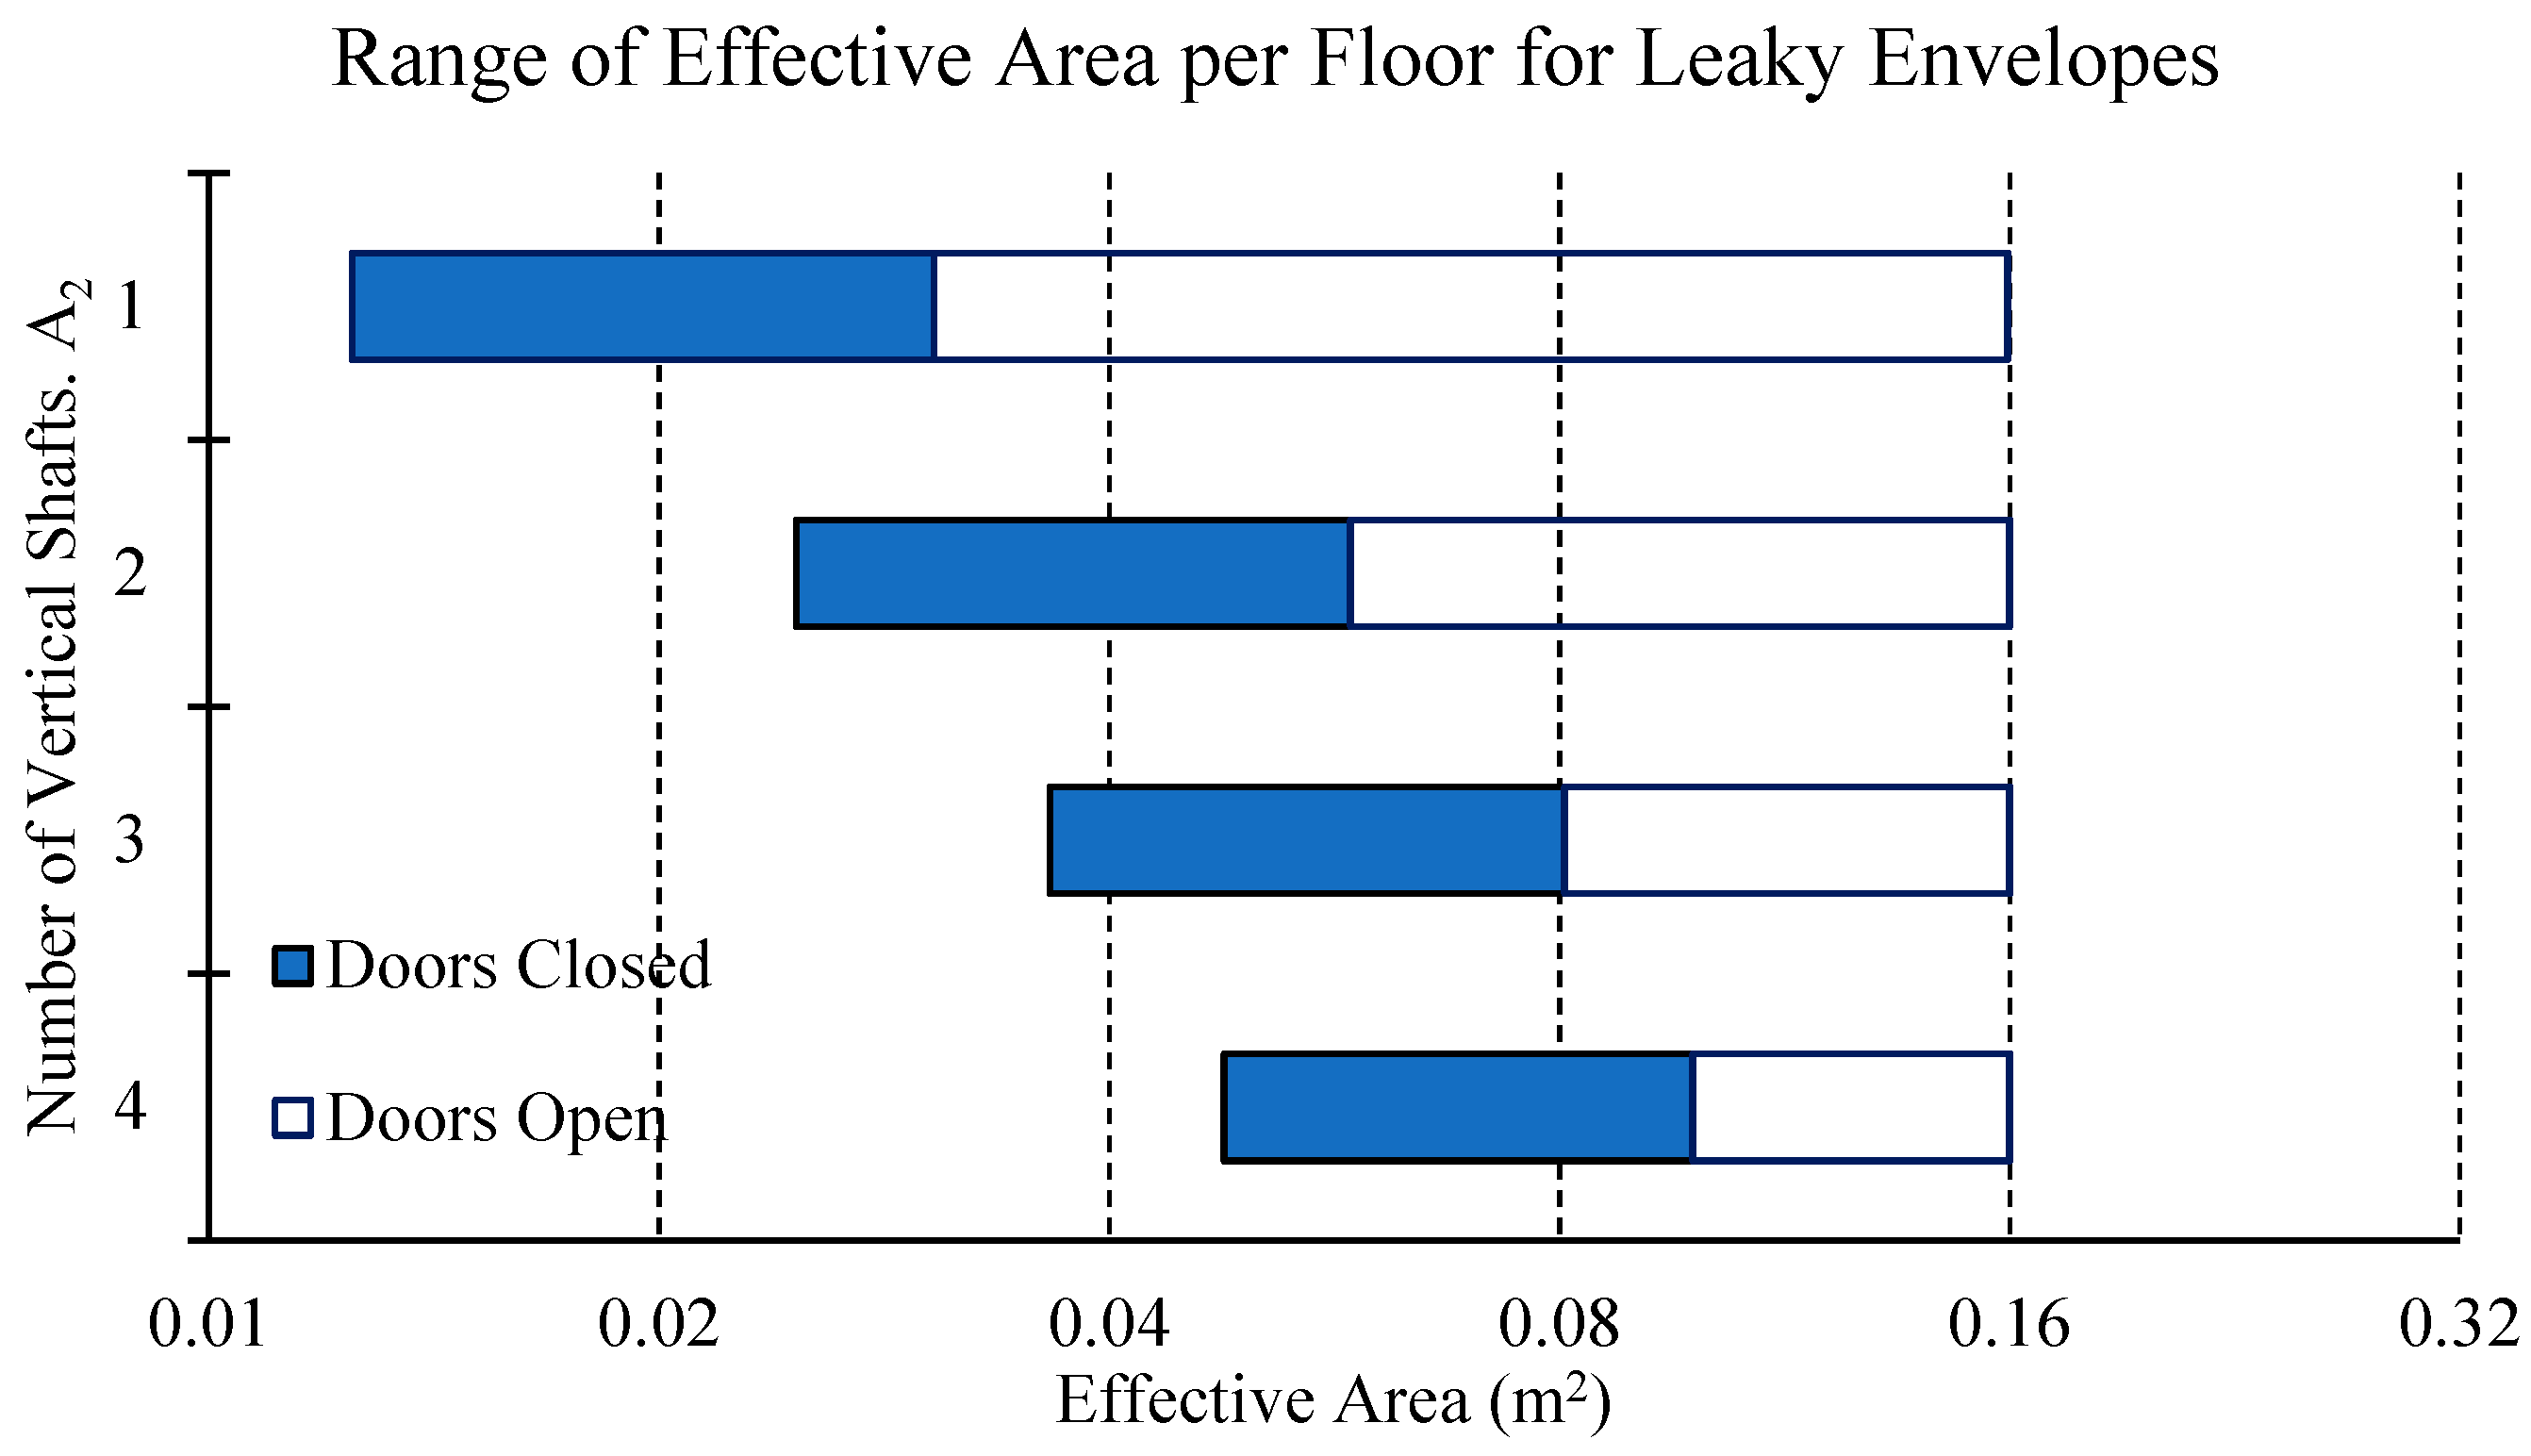
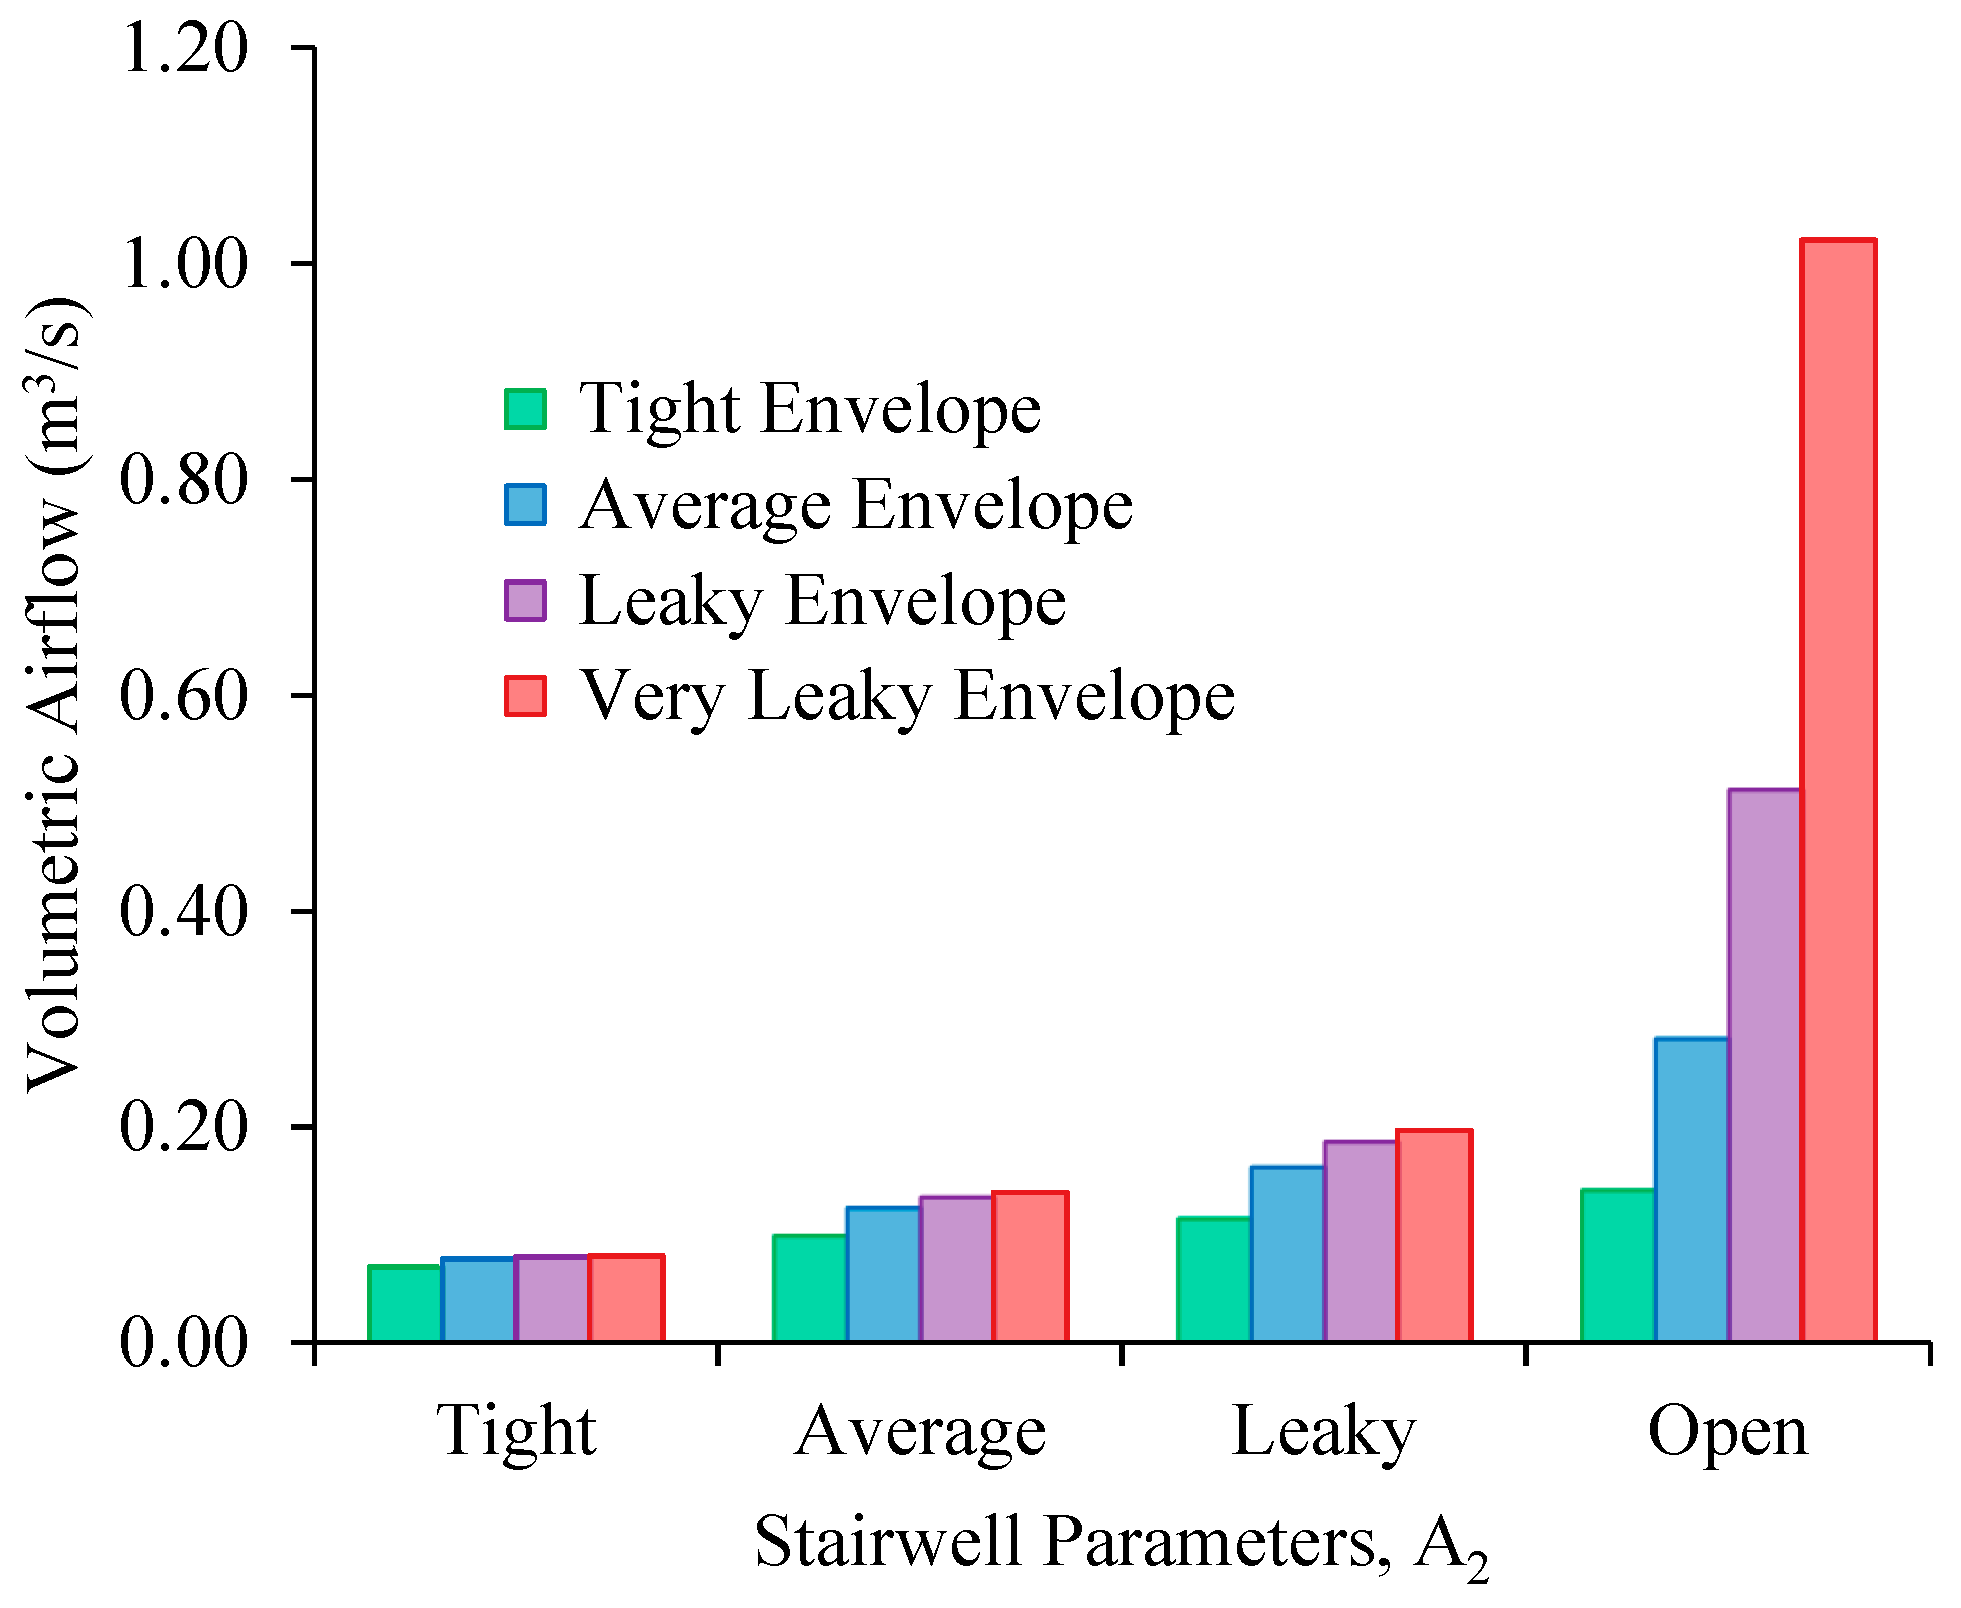
4.1. Envelope
4.2. IAQ and Spread of Contaminants
4.3. Energy and Thermal Comfort
4.4. Limitations
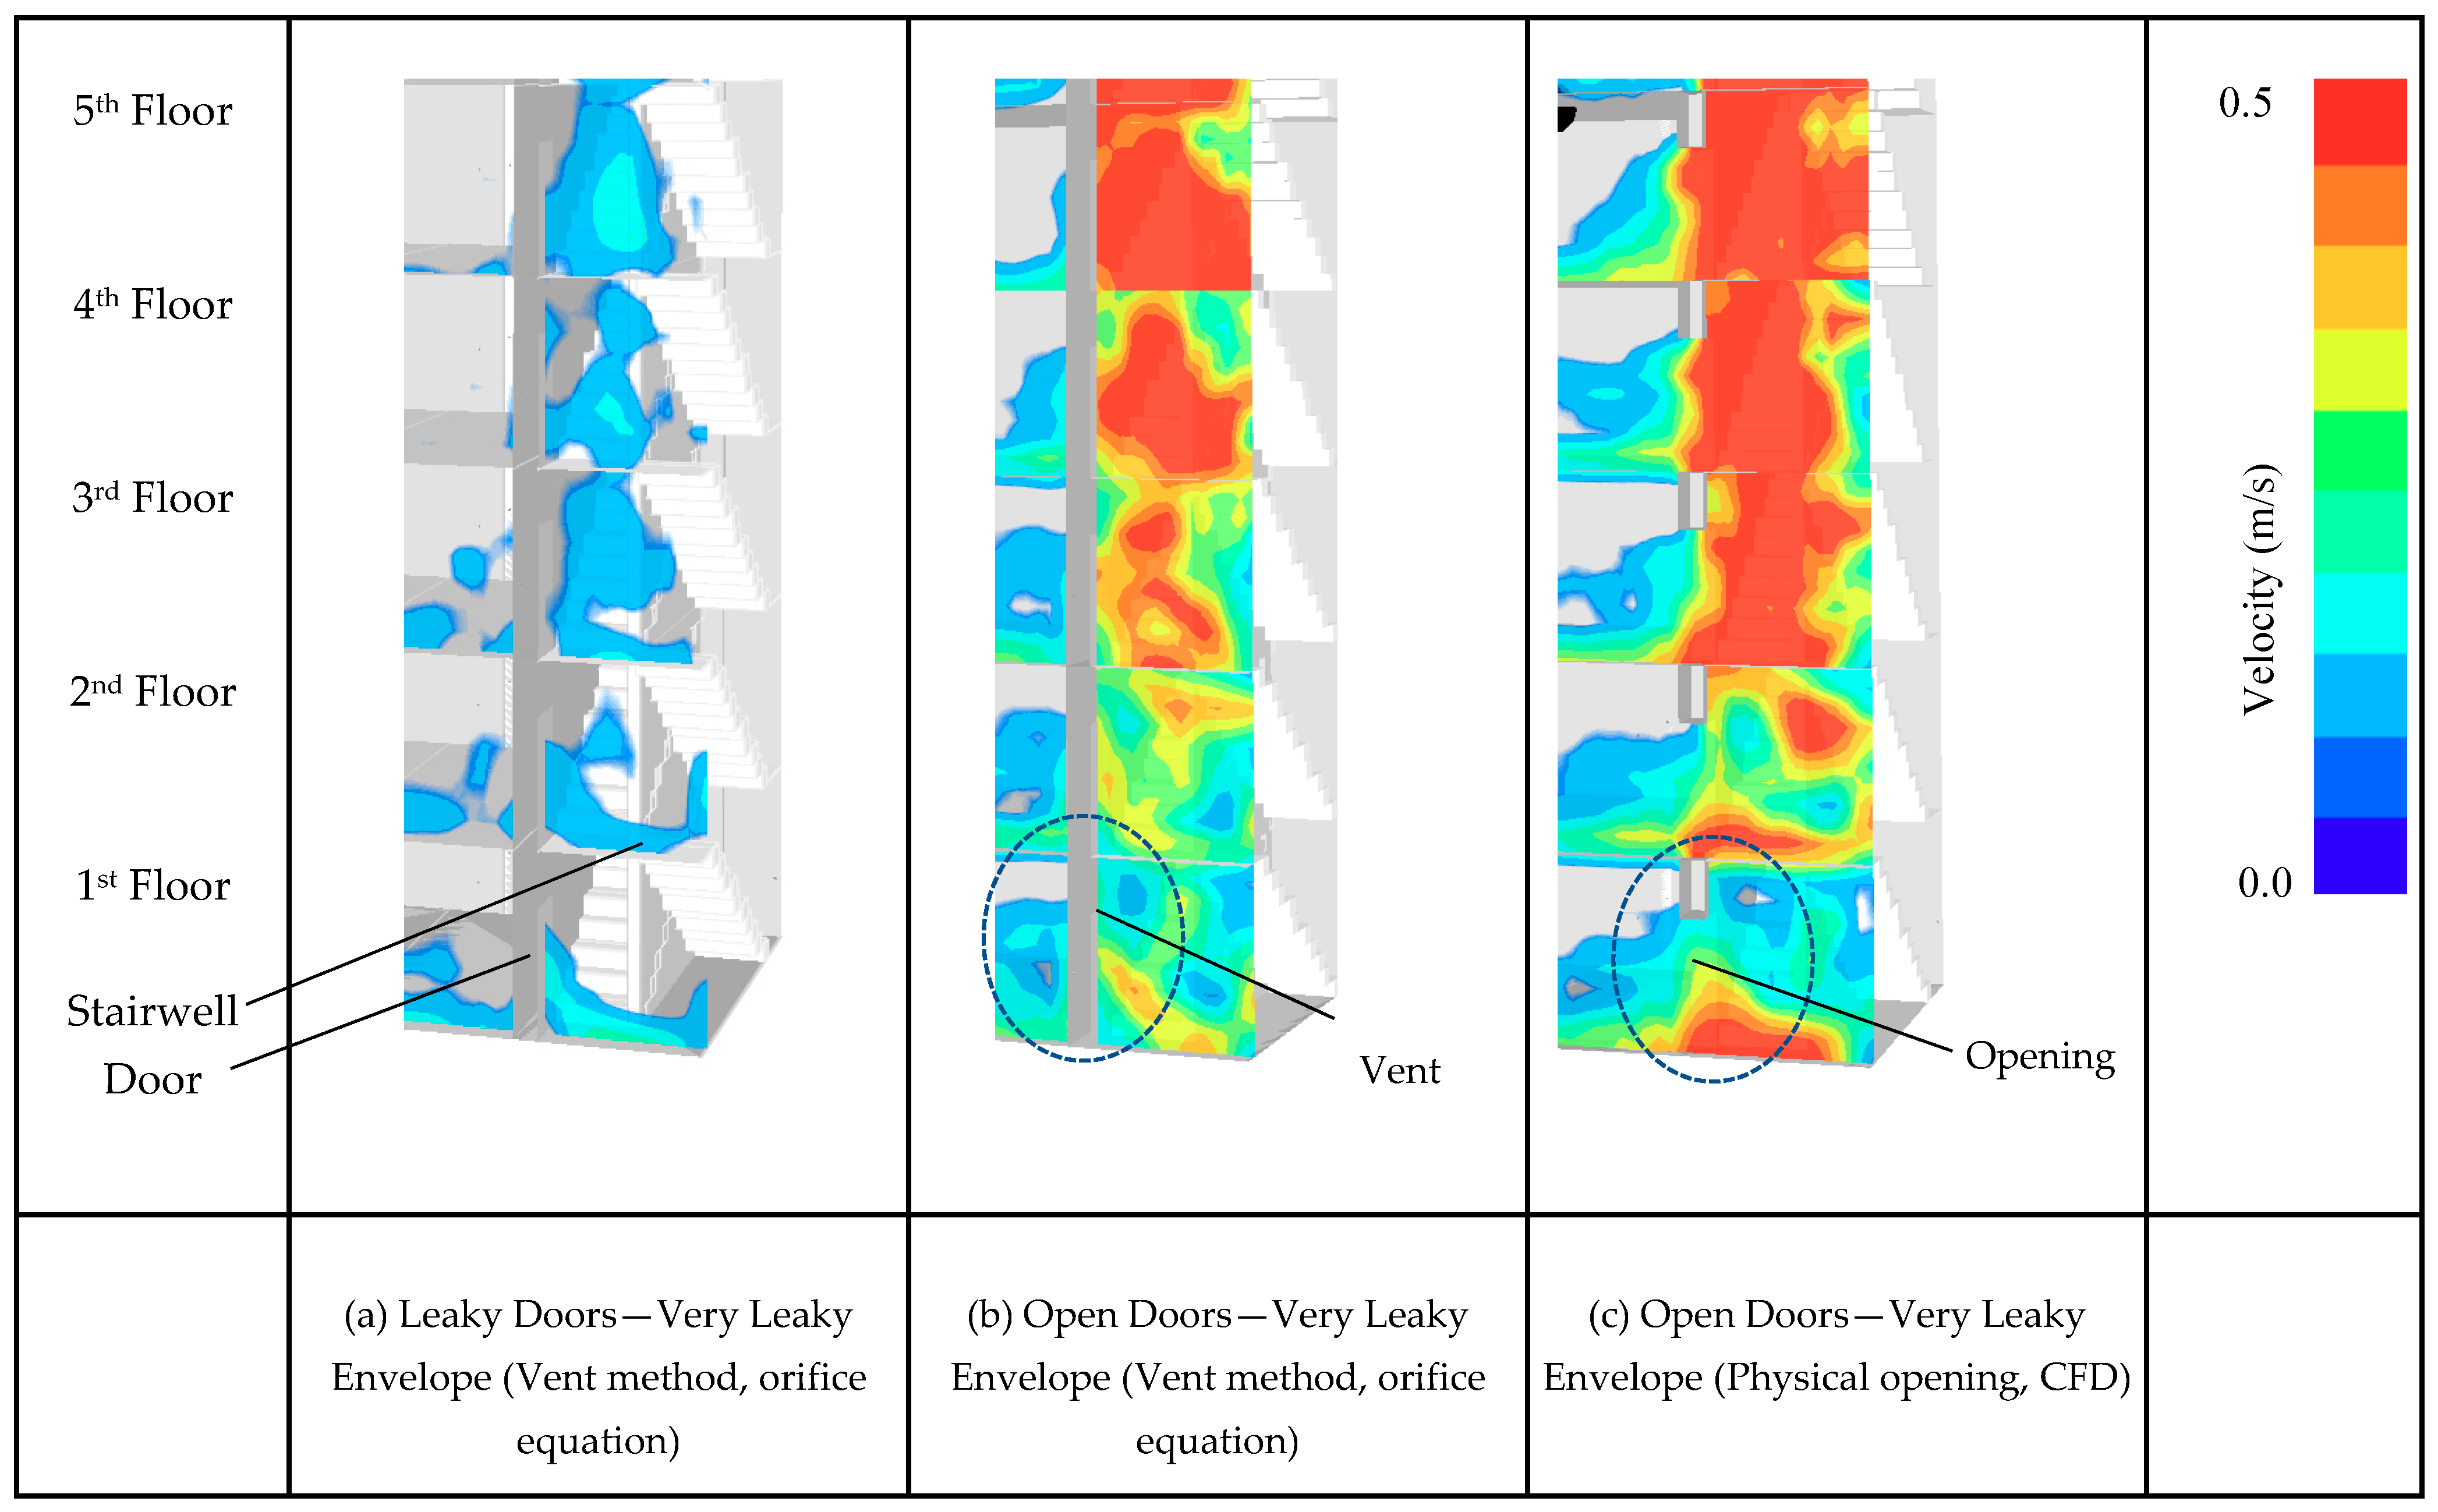
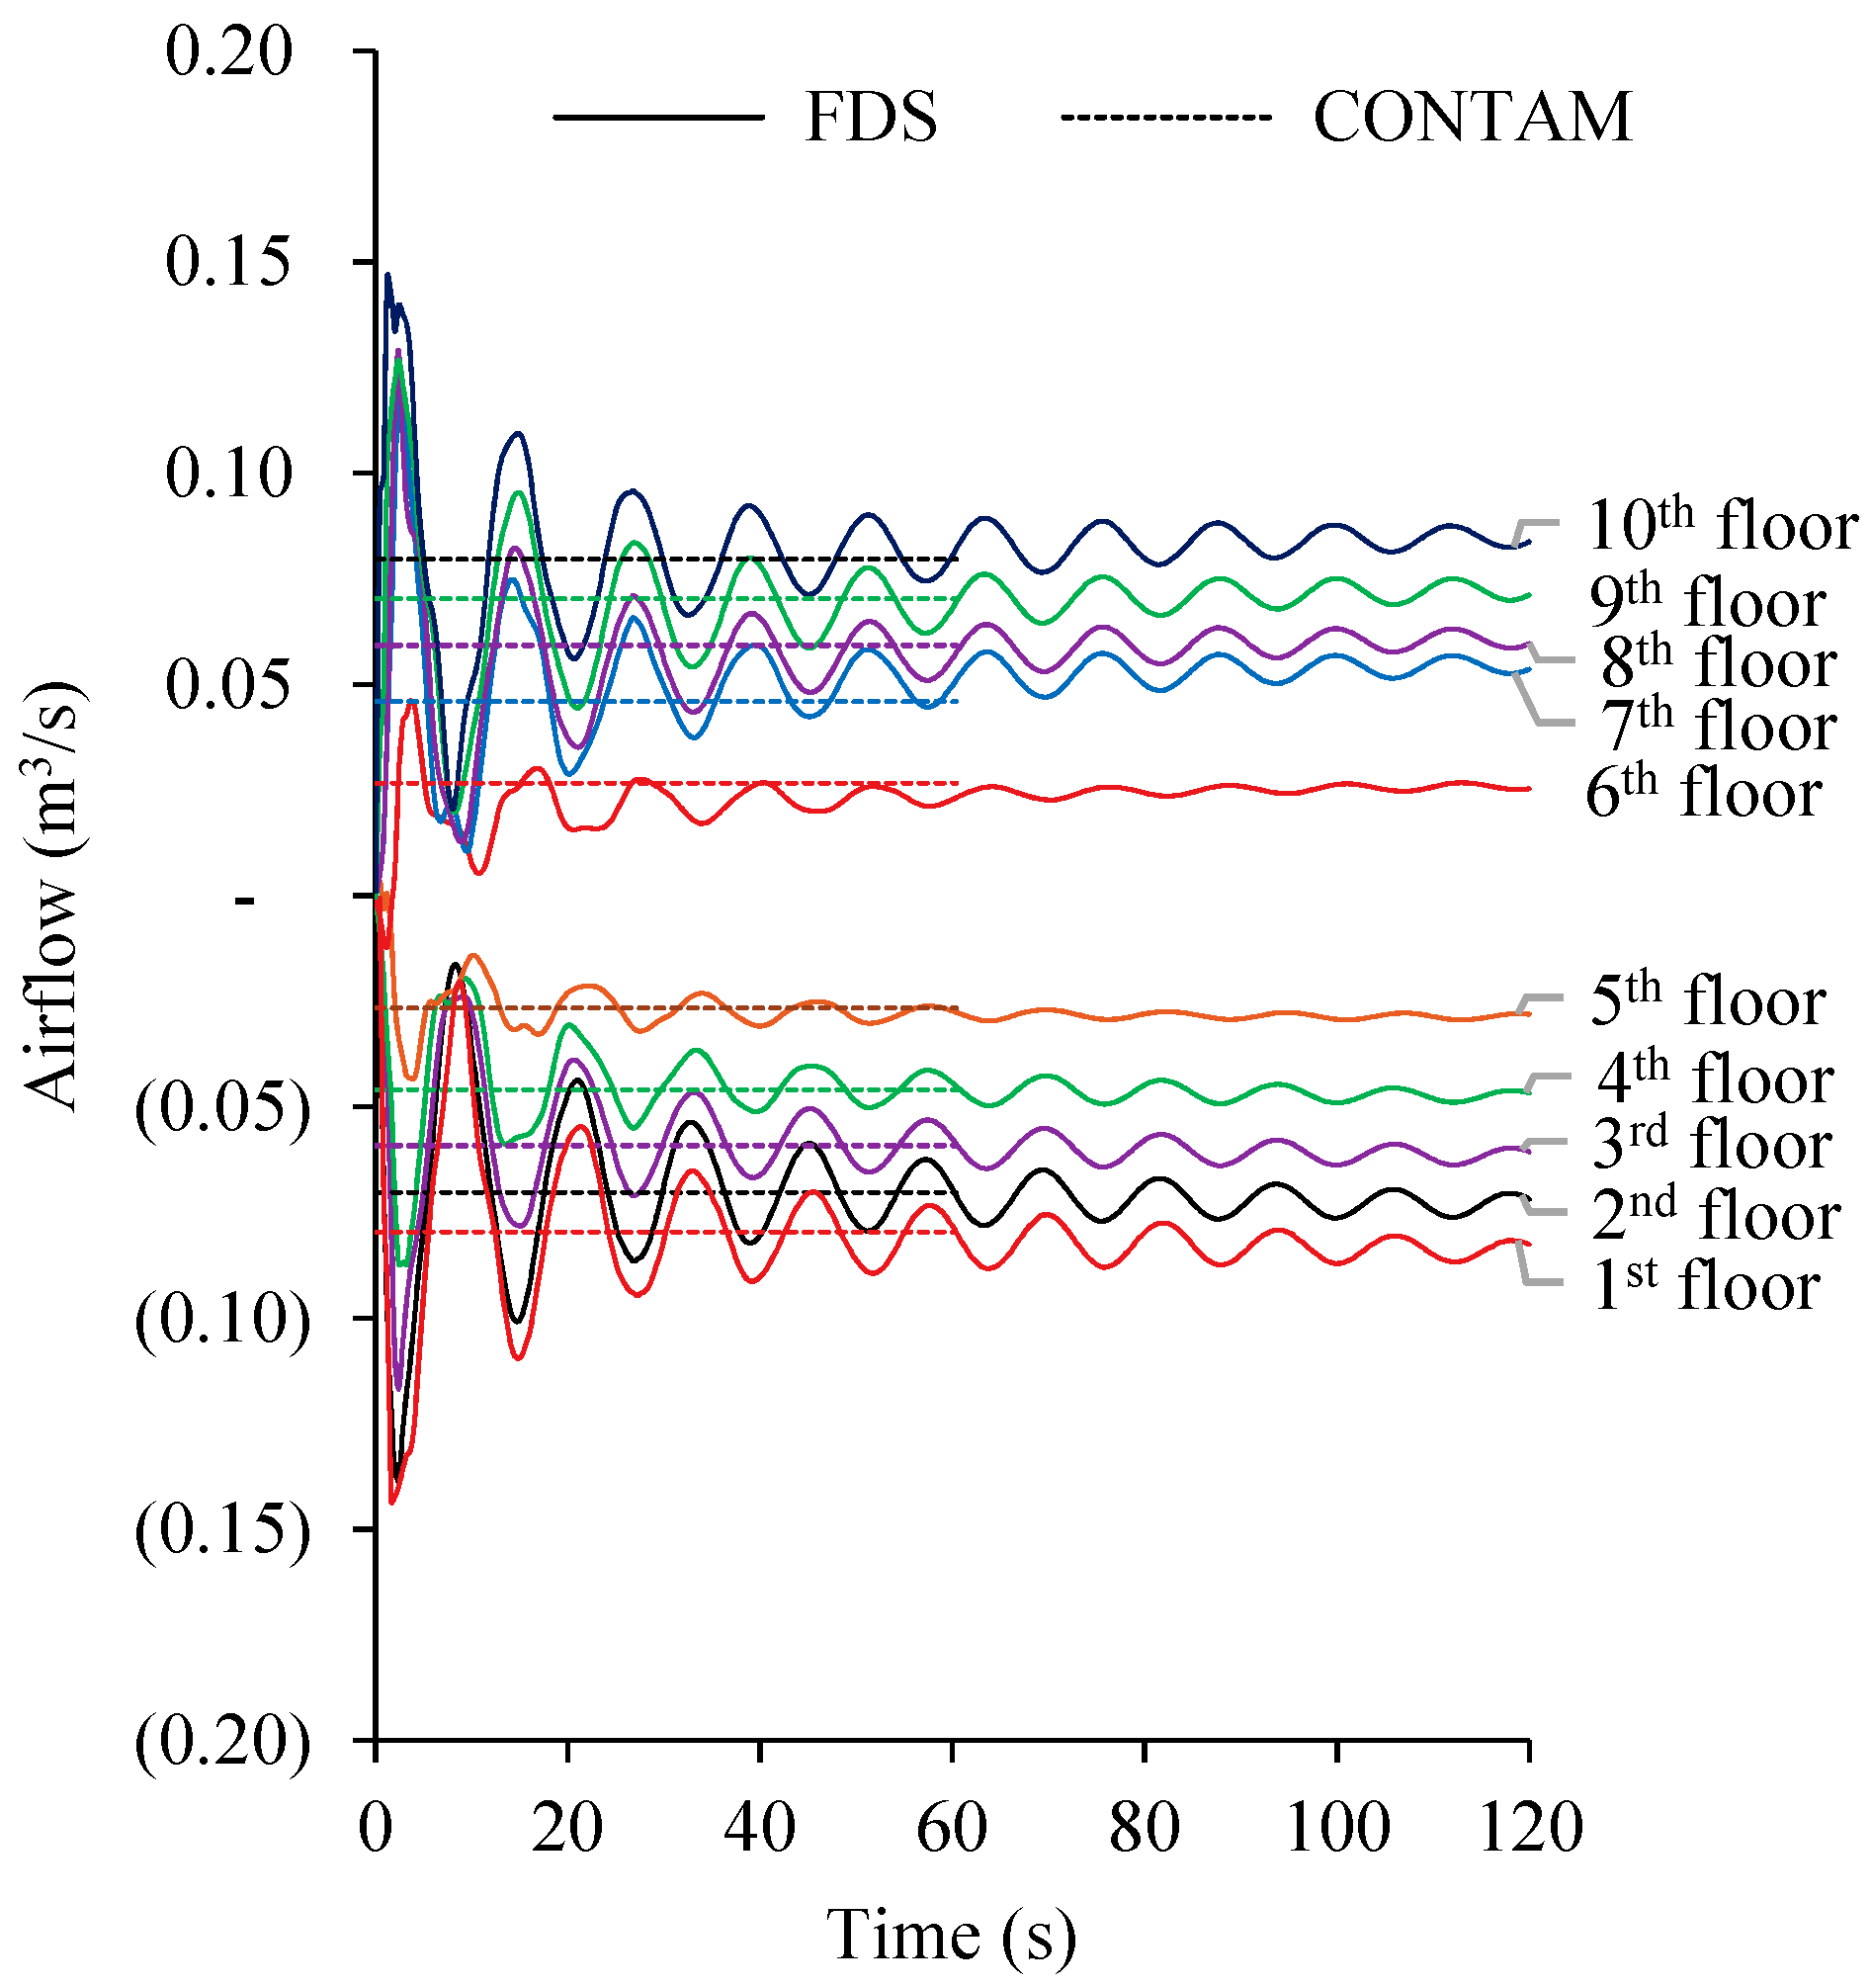
4.5. CFD Environment
5. Conclusions
Author Contributions
Funding
Conflicts of Interest
References
- Tamura, G.T. Computer Analysis of Smoke Movement in Tall Buildings; National Research Council: Ottawa, ON, Canada, 1969. [Google Scholar]
- Tamura, G.T.; Shaw, C.Y. Studies on exterior wall air tightness and air infiltration of tall buildings. ASHRAE Trans. 1976, 82, 122–134. [Google Scholar]
- Tamura, G.T.; Achakji, G.Y. Pressure drop characteristics of typical stairshafts in high-rise buildings. ASHRAE Trans. 1998, 94, 1223–1237. [Google Scholar]
- Gross, D.; Haberman, W.L. Analysis and Prediction of Air Leakage Through Door Assemblies. In Proceedings of the 2nd International Symposium on Fire Safety Science, Tokyo, Japan, 13–17 June 1988. [Google Scholar]
- Gulay, B.W.; Stewart, C.; Foley, G.J. Field Investigation Survey of Airtightness, Air Movement and Indoor Air Quality in High Rise Apartment Buildings Summary Report; Canada Mortgage and Housing Corporation: Winnipeg, MB, Canada, 1993. [Google Scholar]
- RDH Building Engineering Ltd. Air Leakage Control in Multi-Unit Residential Buildings; RDH Building Engineering Ltd.: Vancouver, BC, Canada, 2013. [Google Scholar]
- Lay, S. Pressurization systems do not work & present a risk. Case Stud. Fire Saf. 2014, 1, 13–17. [Google Scholar]
- Rickets, L. A Field Study of Airflow in a High-Rise Multi-Unit Residential Building; University of Waterloo: Waterloo, ON, Canada, 2014. [Google Scholar]
- Dols, W.S.; Polidoro, B.J. Contam User Guide and Program Documentation Version 3.2; NIST Technical Note 1887; National Institute for Standards and Technology: Gaithersburg, MD, USA, 2015. [Google Scholar]
- Walton, W.D.; Carpenter, D.J.; Wood, C.B. Zone Computer Fire Models for Enclosures. In SFPE Handbook of Fire Protection Engineering; Society of Fire Protection Engineers: Bethesda, MD, USA, 2016; pp. 1024–1033. [Google Scholar]
- McGrattan, K.; Stewart, D.M. Modeling Fires Using Computational. In SFPE Handbook of Fire Protection Engineering; Society of Fire Protection Engineers: Bethesda, MD, USA, 2016; pp. 1034–1065. [Google Scholar]
- McGrattan, K.; Hostikka, S.; McDermott, R.; Floyd, J.; Weinschenk, C.; Overholt, K. Fire Dynamics Simulator (Version 5) User’s Guide; NIST Special Publication: Gaithersburg, MD, USA, 2015; Volume 1019. [Google Scholar]
- Ricketts, L.; Finch, G.; Straube, J. Pressure Differences and Airtightness in Tall Buildings—Theory & Reality. In Proceedings of the Fourth NIBS Building Enclosure Science Technology Conference, Kansas City, MO, USA, 13–15 April 2015. [Google Scholar]
- Tanaka, T. Vent Flows. In The SFPE Handbook of Fire Protection Engineering, 5th ed.; National Fire Protection Association: Quincy, MA, USA, 2016; pp. 455–485. [Google Scholar]
- Klote, J.H.; JMilke, A. Principles of Smoke Management; American Society of Heating, Refrigerating and Air-Conditioning Engineers, Inc.: Atlanta, GA, USA, 2002. [Google Scholar]
- Klote, J.H. Considerations of Stack Effect in Building Fires; National Institute of Standards and Technology: Gaithersburg, MD, USA, 1989. [Google Scholar]
- Hutcheon, N.B.; Handegord, G.O. Building Science for a Cold Climate; Institute for Research in Construction: Ottawa, ON, Canada, 1995. [Google Scholar]
- Straube, J.F.; Burnett, E.F. Building Science for Building Enclosures; Building Science Press: Westford, MA, USA, 2005. [Google Scholar]
- Tamura, G.T.; Shaw, C.Y. Air leakage data for the design of elevator and stair shaft pressurization systems. ASHRAE Trans. 1976, 82, 179–190. [Google Scholar]
- RDH Building Engineering Ltd. Study of Part 3 Building Airtightness; RDH Building Engineering Ltd.: Vancouver, BC, Canada, 2015. [Google Scholar]
- Lstiburek, J.W. Toward an Understanding and Prediction of Air Flow in Buildings. Ph.D. Thesis, University of Toronto, Toronto, ON, Canada, 2000. [Google Scholar]
- Gross, D.; Haberman, W. Estimating Air Leakage Through Doors for Smoke Control. Fire Saf. J. 1991, 17, 171–177. [Google Scholar] [CrossRef]
- Tamura, G.T. Experimental Studies on Pressurized Escape Routes; National Research Council Canada: Ottawa, ON, Canada, 1974. [Google Scholar]
- ASHRAE. ASHRAE Handbook Fundamentals; American Society of Heating, Refrigerating, and Air Conditioning Engineers: Atlanta, GA, USA, 2017. [Google Scholar]
- Tamura, G.T. Review of the DBR/NRC studies on control of smoke from a fire in high buildings. ASHRAE Trans. 1983, 89, 341–361. [Google Scholar]
- Proskiw, G.; Phillips, B. An examination of air pressure and air movement patterns in multi-unit residential buildings. In Proceedings of the Building Enclosure Science and Technology (BEST) Conference, Minneapolis, MN, USA, 12 June 2008. [Google Scholar]
- ASHRAE. Tall Buildings. In 2015 ASHRAE Handbook—HVAC Applications; TC 9.12, Tall Buildings; ASHRAE: Atlanta, GA, USA, 2015. [Google Scholar]
- Housing, B.C. Energy Use in Mid to High-Rise Multi-Unit Residential Buildings; Homeowner Protection Office: Burnaby, BC, Canada, 2013. [Google Scholar]


| Wall Component | Tightness Description | Typical Leakage Area (Tamura and Shaw) | Value Selected for Simulation Equivalent Air Leakage Area |
|---|---|---|---|
| Envelope | Tight | 0.5 cm2/m2 | 1.5 cm2/m2 |
| Average | 1.7 cm2/m2 | 3.0 cm2/m2 | |
| Loose | 3.5 cm2/m2 | 6.0 cm2/m2 | |
| Very Loose | 12.0 cm2/m2 | 12.0 cm2/m2 |
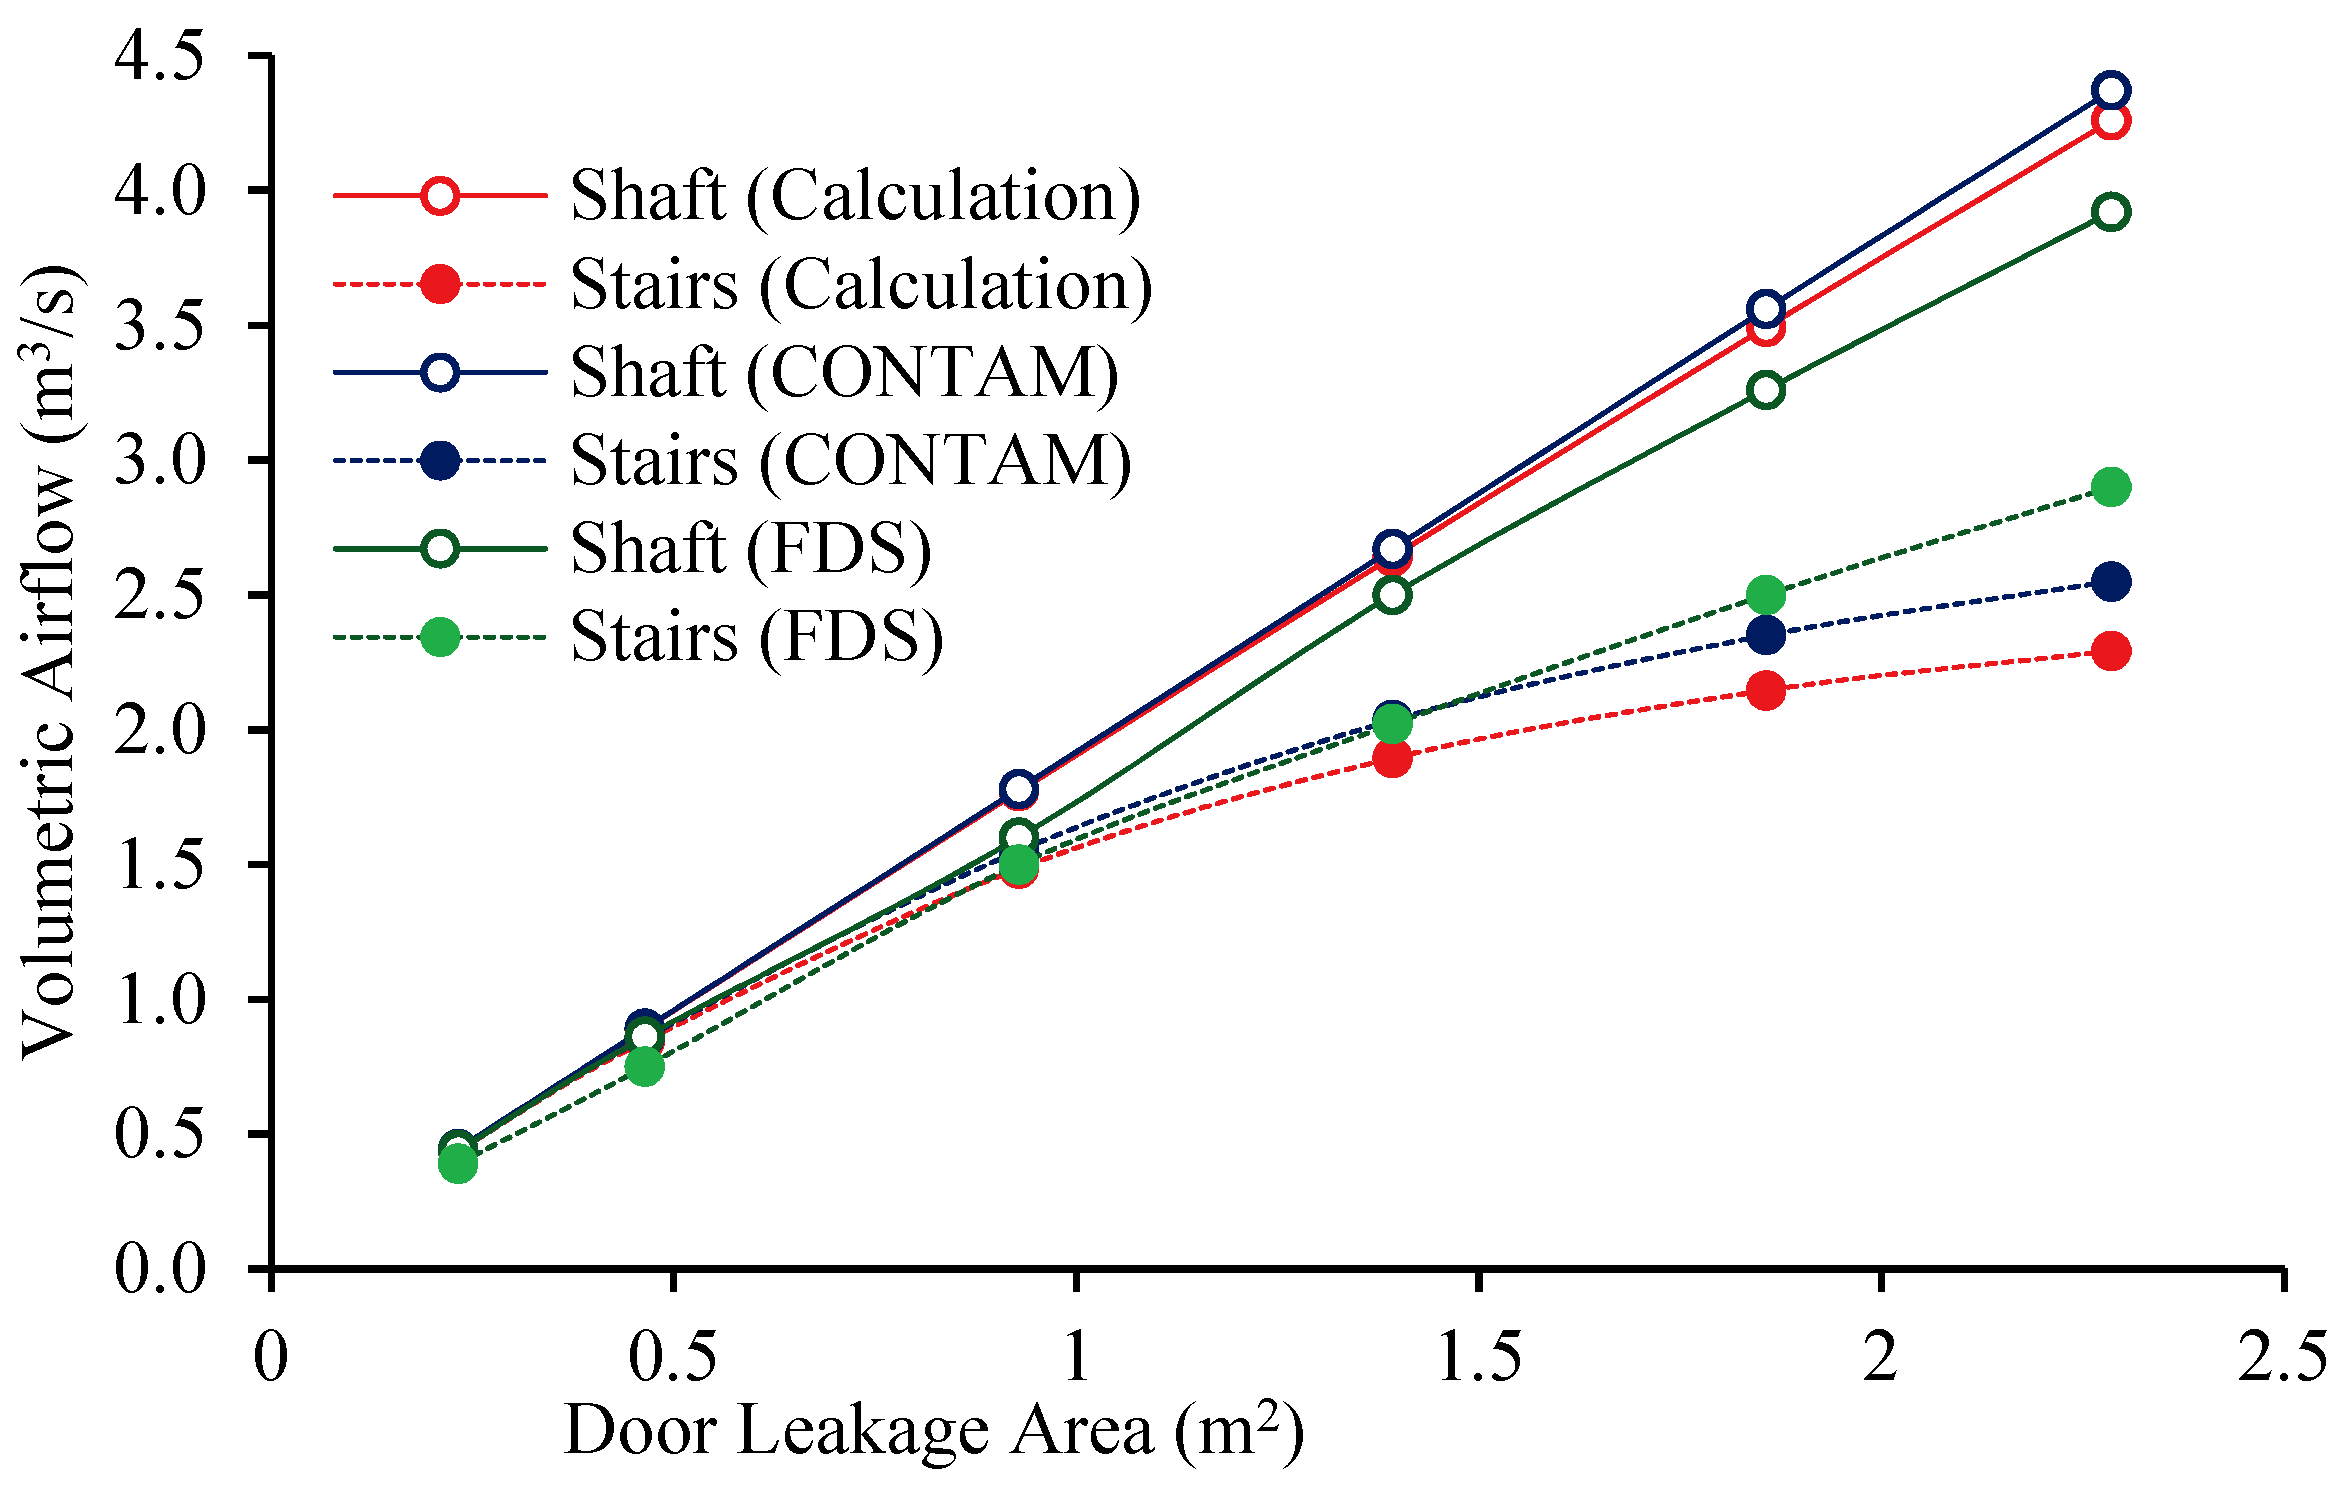
| Door Gap | Method | , Effective Area (m2) | , Volumetric Flow (m3/s) |
|---|---|---|---|
| 2 mm | Orifice Equation (FDS) | 0.0125 | 0.052 |
| Gap Method | 0.0125 | 0.045 | |
| 3 mm | Orifice Equation (FDS) | 0.0187 | 0.077 |
| Gap Method | 0.0187 | 0.084 | |
| 5 mm | Orifice Equation (FDS) | 0.0311 | 0.129 |
| Gap Method | 0.0311 | 0.157 | |
| Varies | Experiment | 0.0190 | 0.061 |
| Experiment | 0.0255 | 0.127 | |
| Experiment | 0.0200 | 0.076 | |
| Experiment | 0.0177 | 0.071 | |
| Experiment | 0.0287 | 0.104 |
| Flow Path ID | Flow Path Description | Normalized Leakage Area (cm2/m2) | Leakage Area per Floor (m2) | Discharge Coefficient (Cd) |
|---|---|---|---|---|
| Exterior walls (tight) | 1.5 | 0.040 | 0.65 | |
| Exterior walls (average) | 3.0 | 0.080 | 0.65 | |
| Exterior walls (leaky) | 6.0 | 0.160 | 0.65 | |
| Exterior walls (very leaky) | 12.0 | 0.320 | 0.65 | |
| Stairwell (tight door) | n/a | 0.0125 | 0.65 | |
| Stairwell (average door) | n/a | 0.0218 | 0.65 | |
| Stairwell (leaky door) | n/a | 0.0311 | 0.65 | |
| Stairwell (open door) | n/a | 2.0 | 0.35 |
| A2-1, A2-2 | A1 | Sum of | Relative Increase | ||||||||||||
|---|---|---|---|---|---|---|---|---|---|---|---|---|---|---|---|
| Stairwell Leakage | Envelope Leakage | Volumetric Flow into Stairwell A2-1 (m3/s) | Airflow | ||||||||||||
| Parameter (m2) | Parameter (m2) | 1 | 2 | 3 | 4 | 5 | 6 | 7 | 8 | 9 | 10 | (m3/s) | |||
| Tight | 0.0125 | Tight | 0.04 | 0.07 | 0.06 | 0.05 | 0.04 | 0.02 | −0.02 | −0.04 | −0.05 | −0.06 | −0.07 | 0.24 | - |
| Average | 0.08 | 0.08 | 0.07 | 0.06 | 0.04 | 0.03 | −0.03 | −0.04 | −0.06 | −0.07 | −0.08 | 0.27 | 12% | ||
| Leaky | 0.16 | 0.08 | 0.07 | 0.06 | 0.05 | 0.03 | −0.03 | −0.05 | −0.06 | −0.07 | −0.08 | 0.28 | 15% | ||
| Very Leaky | 0.32 | 0.08 | 0.07 | 0.06 | 0.05 | 0.03 | −0.03 | −0.05 | −0.06 | −0.07 | −0.08 | 0.28 | 16% | ||
| Average | 0.0218 | Tight | 0.04 | 0.10 | 0.09 | 0.07 | 0.06 | 0.03 | −0.03 | −0.06 | −0.07 | −0.09 | −0.10 | 0.35 | - |
| Average | 0.08 | 0.13 | 0.11 | 0.09 | 0.07 | 0.04 | −0.04 | −0.07 | −0.09 | −0.11 | −0.13 | 0.44 | 26% | ||
| Leaky | 0.16 | 0.14 | 0.12 | 0.10 | 0.08 | 0.04 | −0.04 | −0.08 | −0.10 | −0.12 | −0.14 | 0.48 | 36% | ||
| Very Leaky | 0.32 | 0.14 | 0.12 | 0.10 | 0.08 | 0.05 | −0.05 | −0.08 | −0.10 | −0.12 | −0.14 | 0.49 | 40% | ||
| Leaky | 0.0311 | Tight | 0.04 | 0.12 | 0.10 | 0.09 | 0.07 | 0.04 | −0.04 | −0.07 | −0.09 | −0.10 | −0.12 | 0.41 | - |
| Average | 0.08 | 0.16 | 0.14 | 0.12 | 0.09 | 0.05 | −0.05 | −0.09 | −0.12 | −0.14 | −0.16 | 0.29 | 41% | ||
| Leaky | 0.16 | 0.19 | 0.16 | 0.14 | 0.11 | 0.06 | −0.06 | −0.11 | −0.14 | −0.16 | −0.19 | 0.66 | 61% | ||
| Very Leaky | 0.32 | 0.20 | 0.17 | 0.15 | 0.11 | 0.07 | −0.07 | −0.11 | −0.15 | −0.17 | −0.20 | 0.70 | 70% | ||
| Open Door | 2.0 | Tight | 0.04 | 0.14 | 0.12 | 0.10 | 0.08 | 0.04 | −0.04 | −0.08 | −0.10 | −0.12 | −0.14 | 0.50 | - |
| Average | 0.08 | 0.28 | 0.25 | 0.21 | 0.16 | 0.09 | −0.09 | −0.16 | −0.21 | −0.25 | −0.28 | 0.99 | 99% | ||
| Leaky | 0.16 | 0.51 | 0.51 | 0.38 | 0.29 | 0.16 | −0.16 | −0.29 | −0.38 | −0.51 | −0.51 | 1.85 | 261% | ||
| Very Leaky | 0.32 | 1.02 | 0.90 | 0.75 | 0.58 | 0.31 | −0.31 | −0.58 | −0.75 | −0.90 | −1.02 | 3.57 | 620% | ||
| A2-1, A2-2 | A1 | Sum of | Relative Increase | ||||||||||||
|---|---|---|---|---|---|---|---|---|---|---|---|---|---|---|---|
| Stairwell Leakage | Envelope Leakage | Volumetric Flow into Stairwell A2 (m3/s) | Airflow | ||||||||||||
| Parameter (m2) | Parameter (m2) | 1 | 2 | 3 | 4 | 5 | 6 | 7 | 8 | 9 | 10 | (m3/s) | |||
| Leaky | 0.0311 | Very Leaky | 0.32 | 0.20 | 0.17 | 0.15 | 0.11 | 0.07 | −0.07 | −0.11 | −0.15 | −0.17 | −0.20 | 0.70 | - |
| Condition: Open Bottom | 1.82 | −0.09 | −0.13 | −0.16 | −0.19 | −0.21 | −0.24 | −0.25 | −0.27 | −0.29 | 1.82 | 161% | |||
| Condition: Open Top | −0.29 | −0.27 | −0.25 | −0.24 | −0.21 | −0.19 | −0.16 | −0.13 | −0.09 | 1.82 | 1.82 | 161% | |||
| A2-1, A2-2 | A1 | Sum of Airflow | Relative Increase | ||||||||||||
|---|---|---|---|---|---|---|---|---|---|---|---|---|---|---|---|
| Stairwell Leakage | Envelope Leakage | Volumetric Flow into Stairwell A2 (m3/s) | |||||||||||||
| Parameter (m2) | Parameter (m2) | 1 | 2 | 3 | 4 | 5 | 6 | 7 | 8 | 9 | 10 | (m3/s) | |||
| Leaky | 0.0311 | Very Leaky | 0.32 | 0.20 | 0.17 | 0.15 | 0.11 | 0.07 | −0.07 | −0.11 | −0.15 | −0.17 | −0.20 | 0.70 | - |
| Condition: Open 1st floor stair doors | 0.83 | 0.13 | 0.09 | 0.03 | −0.10 | −0.13 | −0.16 | −0.19 | −0.21 | −0.23 | 1.07 | 54% | |||
| Condition: Open 1st & 10th floor stair doors | 1.02 | 0.17 | 0.14 | 0.11 | 0.06 | −0.07 | −0.12 | −0.15 | −0.18 | −1.00 | 1.51 | 116% | |||
| Condition: Open 1,3,5,7,9 floor stair doors | 0.98 | 0.16 | 0.70 | 0.09 | 0.10 | −0.09 | −0.07 | −0.16 | −0.93 | −0.21 | 2.03 | 192% | |||
| Open | 2.00 | Very Leaky | 0.32 | 1.02 | 0.90 | 0.75 | 0.58 | 0.31 | −0.62 | −1.16 | −1.51 | −1.80 | −2.04 | 3.57 | 412% |
© 2019 by the authors. Licensee MDPI, Basel, Switzerland. This article is an open access article distributed under the terms and conditions of the Creative Commons Attribution (CC BY) license (http://creativecommons.org/licenses/by/4.0/).
Share and Cite
Mckeen, P.; Liao, Z. The Influence of Building Airtightness on Airflow in Stairwells. Buildings 2019, 9, 208. https://doi.org/10.3390/buildings9100208
Mckeen P, Liao Z. The Influence of Building Airtightness on Airflow in Stairwells. Buildings. 2019; 9(10):208. https://doi.org/10.3390/buildings9100208
Chicago/Turabian StyleMckeen, Philip, and Zaiyi Liao. 2019. "The Influence of Building Airtightness on Airflow in Stairwells" Buildings 9, no. 10: 208. https://doi.org/10.3390/buildings9100208
APA StyleMckeen, P., & Liao, Z. (2019). The Influence of Building Airtightness on Airflow in Stairwells. Buildings, 9(10), 208. https://doi.org/10.3390/buildings9100208