Article

Life-Cycle Asset Management in Residential Developments Building on Transport System Critical Attributes via a Data-Mining Algorithm

1
School of Civil and Mechanical Engineering, Curtin University, Perth, WA 6845, Australia
2
Department of Civil and Environmental Engineering, United Arab Emirates University, Al Ain 17666, UAE
*
Author to whom correspondence should be addressed.
Buildings 2019, 9(1), 1; https://doi.org/10.3390/buildings9010001
Submission received: 27 November 2018 / Revised: 13 December 2018 / Accepted: 18 December 2018 / Published: 20 December 2018
(This article belongs to the Special Issue Environmental Impact Assessment of Buildings)

Abstract

:
Public transport can discourage individual car usage as a life-cycle asset management strategy towards carbon neutrality. An effective public transport system contributes greatly to the wider goal of a sustainable built environment, provided the critical transit system attributes are measured and addressed to (continue to) improve commuter uptake of public systems by residents living and working in local communities. Travel data from intra-city travellers can advise discrete policy recommendations based on a residential area or development’s public transport demand. Commuter segments related to travelling frequency, satisfaction from service level, and its value for money are evaluated to extract econometric models/association rules. A data mining algorithm with minimum confidence, support, interest, syntactic constraints and meaningfulness measure as inputs is designed to exploit a large set of 31 variables collected for 1,520 respondents, generating 72 models. This methodology presents an alternative to multivariate analyses to find correlations in bigger databases of categorical variables. Results here augment literature by highlighting traveller perceptions related to frequency of buses, journey time, and capacity, as a net positive effect of frequent buses operating on rapid transit routes. Policymakers can address public transport uptake through service frequency variation during peak-hours with resultant reduced car dependence apt to reduce induced life-cycle environmental burdens of buildings by altering residents’ mode choices, and a potential design change of buildings towards a public transit-based, compact, and shared space urban built environment.

1. Introduction

Municipal residential areas and new developments are often marked by economic growth and high population density, where respective higher environmental emissions affect the air quality [1,2]. Indeed, the high private automobile traffic in the established residential areas affects the structural integrity of buildings in such developments [3] with knock-on negative impact on the residents [4]. Similarly, sustainable development and the creation and maintenance of a built environment necessarily requires measures of construction material transportation [5,6]. For example, studies have shown that for a building element such as roofing, a sizable proportion of a built asset’s life-cycle assessment (LCA) relates explicitly to transportation which has been measured to contribute 10% to a residency’s new-build/building-renovation’s overall carbon footprint within a LCA system boundary covering the entire life-cycle of building-product usage [7,8]. Built environment development whole-costs are similarly affected by community transportation links; locations affect life-cycle costs with congestion apt to delay resources deliveries and often result in vehicle damage across respective congested transportation routes [9].
Regional constraints notwithstanding, mass-transit system plans are generally developed by municipal and transportation agencies to reduce ever-increasing traffic congestion on road networks by affecting mode choices of building residents [10]. These plans are simultaneously targeted as being environmentally conservative for the existing municipal residential areas or any upcoming residential developments in the region. The implication of adequate public transport accessibility and reduced reliance on private automobile usage towards sustainable residential areas; e.g., compact neighbourhoods, walking habits of residents, urbanisation and shared-space designs, construction of shops and other facilities in buildings and neighbourhoods is abundant in the literature [11,12]. Jabareen [13] further include sustainable transport as one of the key design concepts of sustainable building and urban design plans. Other researchers, such as Zimring, Joseph [14] and Cervero [15] propose that sustainable residential built environments, transport systems and urban forms should be designed so as to promote sustainable modes of transport, e.g., public transport, and devise policies to discourage individual car usage, among building residents.
On the other hand, transportation researchers such as de Luca [16] and Leyden, Slevin [17] argue that planning and provision of any (public) transport system is largely “flawed” as alternatives and policies are prioritised subjectively by decision-makers alone, with very little public engagement from local building occupants or consultation at the initial stages. Often public feedback generated is neglected or only marginally used to improve the existing system, which is argued by above literature to significantly increase the risk of implementing a public transport service and an overall transportation system incoherent with public expectations. This may lead to higher private automobile dependence among the building residents of any municipal area, causing heavy traffic congestions on road networks adjacent to these residential buildings [18]. In addition to disrupting the supply-chain by delaying construction material transport for new buildings or haulage of disposal material from demolished buildings in the area, traffic congestions can result in increased cost and environmental burdens depending upon the traffic load and transport system typology. For example, in case of high traffic volume roads, around 95% emissions are traffic-related [19], while Stephan, Crawford [20] showed that the residents’ daily commute energy load for Belgian passive (i.e., energy-efficient) houses was approximately 27% of the entire life-cycle energy burdens of these passive houses. Stephan, Crawford [20] also proposed that the transport energy of these residents may be reduced by approximately 31%, provided a shift in mode use occurs from private vehicle transport in favour of public transport, corresponding to a reduction of 8.4% in the houses’ life-cycle energy consumption. Since environmental impact assessment rating tools for buildings, such as the United States Green Building’s Leadership in Energy and Environmental Design (LEED) system, also include the residents’ daily commute energy and environmental load as an integral part of the total life-cycle burden of the buildings due to the building-induced impacts (more in Section 2.2), therefore, in order to reduce the overall life-cycle impact of buildings, the mode choice redistribution in favour of public transport should be researched [10,18].
In mode use redistribution or diversion research, Diana [21] and De Vos, Mokhtarian [22] suggest that traveller expectations influence commuter satisfaction, which ultimately influences the variation in their ridership preference over time (public vs. private transit), hereby referred to as modal variability. Establishing the satisfaction of an individual traveller may be difficult, aligning satisfaction with travel patterns of daily commuters is important for municipal policymakers aiming to influence mode choice and travel survey datasets are used for this purpose by building [23] and transport [24] researchers alike. However, the presence of large quantities of variables in the travel dataset complicates the pattern discovery process of deducing the potential for commuter mode choice diversion in favour of public transport [25] and optimising the consumer mode choice – satisfaction dynamics. Golob and Hensher [26] and Diana and Pronello [27] maintain that although the patterns in large categorical variable sets may be discovered to some extent through multiple correspondence analysis, scatter plots and cross-tabulation techniques, such methods are fairly limited when many variables are to be jointly considered. Limitations of frameworks only applying these statistical analyses to study travel survey datasets can thus be avoided by data mining [28,29] through its potential to handle a large number of interrelated variables [30].
This study is part of a larger project that aims to deliver a multi-criteria decision-making framework towards the objective of sustainable cities and future green buildings served by a connected and sustainable road transportation system that meets commute demands of building residents. The proposed framework consists of: social aspect of government and user stakeholders’ demands [31], life-cycle cost and environmental in/outflows [32]. In Hasan, Whyte [33], a multipartite model was developed by the authors to establish commuter satisfaction from the level of service (measured on network coverage and frequency) as the antecedent of building residents’ mode choice. Moreover, market segmentation based on mode choice, satisfaction from service level and service perception as value for commuter money was also performed in Hasan, Whyte [33] to analyse the function of underlying exogenous factors in the sample residential area. The explicit objectives of the research presented in this paper are described below:
  • Examine the travel patterns in a representative intra-city (Abu Dhabi) dataset for existing residential areas or upcoming residential developments.
  • Present a systematic way of assessing critical factors eliciting mode choice in commuter market segments towards optimising the social, i.e., stakeholder demands, aspect of the overall LCA of transportation systems and in the process, reduce the user-transport life-cycle energy and environmental load of residential buildings.
  • Determine bus service desiderata for policymakers to develop an ameliorated bus service in future, which may divert more building residents to the improved bus service. This can potentially reduce the life-cycle costs and environmental (greenhouse gas emissions, smog, resource and energy use) burdens besides tacking the social parameters (stakeholders’ perspectives) towards optimising overall life-cycle burdens of residential buildings as well improving future building designs, i.e., lesser parking area requirements, more shared walkable spaces, better accessibility etc.
In order to meet the study objectives, a custom travel data processing algorithm unifying association rules mining, and statistical analysis techniques is developed to identify two classes of variable combinations; statistically-significant and validated association-only. The two different groups aim to provide policymakers with the maximum information about the commute habits of local building residents in the city. Whilst statistical analysis is informative and interesting, it may fail to uncover the underlying modal variability patterns and commuter behaviour which may be visualised through association rules [34,35,36]. For this purpose, validation of the filtered-out association rules against an internal validation set was conducted to further generate a set of association rules [37,38] followed by data reduction (similar to [36] and [39]) to remove redundant association rules.

2. Theoretical Background

2.1. Multiscale Effect of Road Network Transport System on Residential Buildings

Researchers not only propose sustainable waste disposal from building constructions sites but also advocate use of recycled construction and demolition waste for new residential developments to reduce the overall environmental impact. The presence of an adequate transportation system at regional scale is critical for facilitating the disposal and reuse, for example, Building Research Establishment (BRE) assigns a weighted contribution of 8% to building construction material transportation in the overall life-cycle of buildings [40,41]. Other national and international guidelines on LCA of built assets that are used for environmental impact assessment of buildings such as EN 15978 [42], CEN/TC350 [43] and ISO/TS 12720 [44] also recommend estimating the material transport in both construction and disposal stages for accurate calculations. At the same time, a number of government regulations, subsidies and incentives exist for promoting recycled material usage in residential buildings and housing development sectors. Decree 205/2010 in Italy mandates at least 15% recycled material use in building construction [45] while Environmental Product Declaration on construction is now practiced in many European countries [19]. The United Kingdom Aggregates Levy for extracting quarry materials of £2 per tonne [46] has boosted recycled aggregates usage in building constructions by approximately 25% [47]. However, material supply-chain and costs due to far-off recycling sites, for e.g., accounting for ~70% costs for a 350 tonne/h facility in a Portugal-based study [48] and increased travel time of material transporting trucks due to on-route traffic congestion often discourage building contractors from recycled material usage. Similarly, any excessive time spent on road networks due to congestion may reverse some of the positive environmental benefits from using recycled materials due to fuel consumption. For example, using a standard 15-tonne lorry to move 1 tonne of aggregate material over 1km requires 0.014 kg of diesel, depending upon the local traffic conditions [40]. Thus, the question of traffic congestion mitigation should also be tackled by the policymakers aiming to promote recycled material usage in buildings (see Section 2.2).
Besides reducing traffic congestion on road networks and relieving residents’ transport energy of buildings [18], public transit services also affect property prices of buildings and development projects depending upon the relative proximity to mass-transit services. Mulley, Ma [49] studied residential property market in Brisbane, Australia and found that bus rapid transit (BRT) affected housing prices at the rate of 0.14% per 100m closer to the transit service routes while train service inferred a negative effect of 0.15% reduction per 100m closer to the train service line. These effects were also strongly dependent upon urban form and spatial distributional densities of buildings. Their study also highlighted the importance of studying local mode use travel patterns, commuter perceptions and the key position of underlying service attributes of service frequency, on-board crowding and the journey time in determining the relative impact of BRT service on the residential property development sector.

2.2. Interrelated Urban Form, Transport System and Buildings LCA: Public Transport Accessibility and Residents’ Mode Choices

The interrelation between urban form, transportation systems (private and public transit modes), and the overall life-cycle impacts of buildings is a complex issue which has been explored by many researchers focusing on the synergy between developing low-energy buildings and sustainable transport [10,50,51,52]. The lower density urban form undoubtedly puts extra load on private vehicle transport as the preferred mode choice of municipal residents, for example, accounting for ~70% in European passenger transport with predominantly semi-detached houses, whereas limited parking in buildings may promote public transit usage based upon proximity to service line and accessibility [51]. One of the earliest studies of the 21st century by Steemers [51] on developing a less polluted urban built environment noted the link between the overall building energy and transport mode choice of building residents. Similarly, the “Le Plan Bâtiment Durable” (French: “The Sustainable Building Plan”) launched by the Government of France in 2009 aimed at reducing the existing buildings’ energy consumption by 38%, also enlists the mode choice of building residents and developing strategies for promoting public transportation usage among the criteria for assessing the overall performance of buildings. Furthermore, other European Union states also highlighted the importance of understanding the interrelation between urban design, transportation system, building design, residents’ mode choice pattern, “public transport connected buildings”, compacted shared spaces and accessibility as environmental hotspots for future sustainable building designs [10]. Similar points on compact and shared urban form were also highlighted by Norman, MacLean [53] in their economic input-output LCA on buildings and by Cuéllar-Franca and Azapagic [54] who showed terraced house to carry 309 t CO2 eq. compared to the 455 t CO2 eq. of a semi-detached house in the UK.
Stephan, Crawford [20] observed that the majority of so-called low-energy passive houses in Belgium are designed as suburban detached single-family dwellings compared to the public transport-connected city buildings. They further commented that any energy savings by these low-energy houses are offset by increased mode use of private vehicles compared to public transport. Earlier research by the same authors [55,56] on life-cycle energy requirements of low-energy houses has shown that over the life-cycle (50–100 years) of these low-energy residential buildings, residents’ transport and embodied energy are >50% of the overall life-cycle energy load. They proposed that in order to reduce the overall energy demands of residential buildings, the transport mode choices of building residents must be tackled towards public transport uptake in addition to using recycled building components and sustainable energy measures as the mode use alone represented 27% of the built assets’ life-cycle energy [20].
Two studies on buildings and environmental analysis (i.e., greenhouse gas emissions and energy use) of buildings were conducted by Anderson, et al. [23,57]. They proposed transportation systems and residents’ mobility patterns (i.e., mode choice distribution) as key parameters for interlinking residential buildings and the urban environment. They emphasised the strong tie between transportation and buildings and argued that the induced environmental impacts in terms of transport habits due to the design, locality and interaction of buildings with the urban form need to be captured. They used streamlined LCA to capture this effect on urban Munich residents in Germany using detailed mode use and travel behaviour surveys [23]. They found that the overall life-cycle impact of buildings and the induced transportation environmental impact due to mobility pattern of residents is dependent upon the daily commute distance, mode choice and the location of the buildings. For example, in their study the lowest impacts were found for Munich central business district (CBD) residents due to buildings typology and short commute distance of residents, where the largest share was claimed by overall transportation impacts of CBD residents as 1160 kg CO2e/capita/annum while CBD residential building emissions were 1088 kg CO2e/capita/annum. Both studies [23,57] concluded that although the design and material usage in buildings needs to be upgraded to be more sustainable, the real criticality still lies with improving the mode use behaviour of building residents. Similar findings were noticed by Dodd, Donatello [10] in their review on LCA of European buildings with the residents’ transport energy demands claiming between a 19% share to even completely overwhelming the life-cycle energy load of some buildings.
The critical role of mobility and the mode choice of building residents induced by the interrelation between urban form, locality, transport service provision and the building design was also acknowledged by the LEED system weighting methodology by assigning a total of ~ 15% credit weightage to transport in terms of reduced parking, bicycling and better quality public transit accessibility near buildings. Promoting sustainable mode choice among residents, proximity or connection to public transport services and bicycling and shared vehicle facilities were also included in the property/real-estate based Investment Property Databank of the triple alliance between Sustainable Building, Bureau Veritas and Barclays (~ 16% weightage); the Invesco, Allianz, AXA and AEW founded Green Rating Alliance; and, the Global Real Estate Sustainability Benchmark [10]. The extensive focus on the mobility pattern of building residents in municipal residential zones/areas proposed by these works also recommended understanding the underlying factors behind mode choice to postulate policies towards uptake of more sustainable public transport usage.

2.3. Factors Affecting Travel Perception and Mode Choice

Researchers studying factors affecting mode choice behaviour, such as Dell’Olio, Ibeas [58] and de Oña, de Oña [59] proposed that generally any bias possessed by commuters, as for or against a particular travel mode (referred to as travel bias, henceforth) depending upon their unique characteristics, influences their perception of the quality attributes offered by a particular mode and may translate to a subsequent mode choice. The factors behind mode choices and variation of travel behaviour were also focused in a study conducted by Schmid, Schmutz [60]. They performed a hypothetical study of a low carbon post-private car world and found public transport to be the most popular mode amongst survey respondents, followed by bikes and car-sharing. Stradling [61] found that the modal variability of residents in a case-study Scottish housing area is temporally constrained, with 20% of private automobile users actually acting as multimodal, i.e., using several transport modes, when the analysis period is stretched over a week. Building upon this, the present study gathered commuter behavioural responses and travel pattern data over a month to investigate the sensitivity of modal shifts in long-term mobility patterns.
Built environment around the public transit service, accessibility near commuter accommodations and offices may also influence their mode choice. An empirical study on the association between travel behaviour of urban residents in New York City and the density of the urban neighbourhoods was conducted by Chen, Gong [62]. They noted that the density and built environment affected mode choice of the survey respondents. They also proposed that government authority planners may attract more users towards public transit modes by providing better accessibility near workplaces. Similarly, Cervero [15] proposed that residential developments with lesser shared-spaces for cyclists and pedestrians may affect the mode choice, particularly an inclination towards individual car usage, more so as the building designs may also carry abundant nearby parking facilities instead of using the space for mixed-use walkable areas.
Friman and Fellesson [63] and Diana [21] found modal variability and level of commuter satisfaction from public transport as highly dependent upon the local built environment and regional characteristics of the study area. They noted that the travellers near the city centres tended to sway towards higher public transport usage compared to their urban/suburban counterparts, making the results highly sensitive to the zonal distribution (urban vs suburban) as well as number of zones covered in the study area. The current study addresses this issue by surveying commuters on the intra-city travel routes across all zones of a metropolitan city (Abu Dhabi) to capture the maximum variability of responses. The City of Abu Dhabi has witnessed an increase in population accompanied by extensive residential developments and an increasing commuter dependence on private vehicles [64], resulting in traffic congestion and as such, is a suitable case study area for the purpose of this research. Furthermore, the excessive private vehicle ridership is responsible for high greenhouse gas emissions, for example in United Arab Emirates alone, it annually exceeds 11735.6 Gg CO2 equivalent [65] from road transport. The local government agencies in UAE have aimed to reduce its environmental load [66]. The research presented in this paper and its accompanying works [19,32] may aid in reducing the environmental burden from road and building residents’ daily transit dimensions towards an overall sustainable future city development.

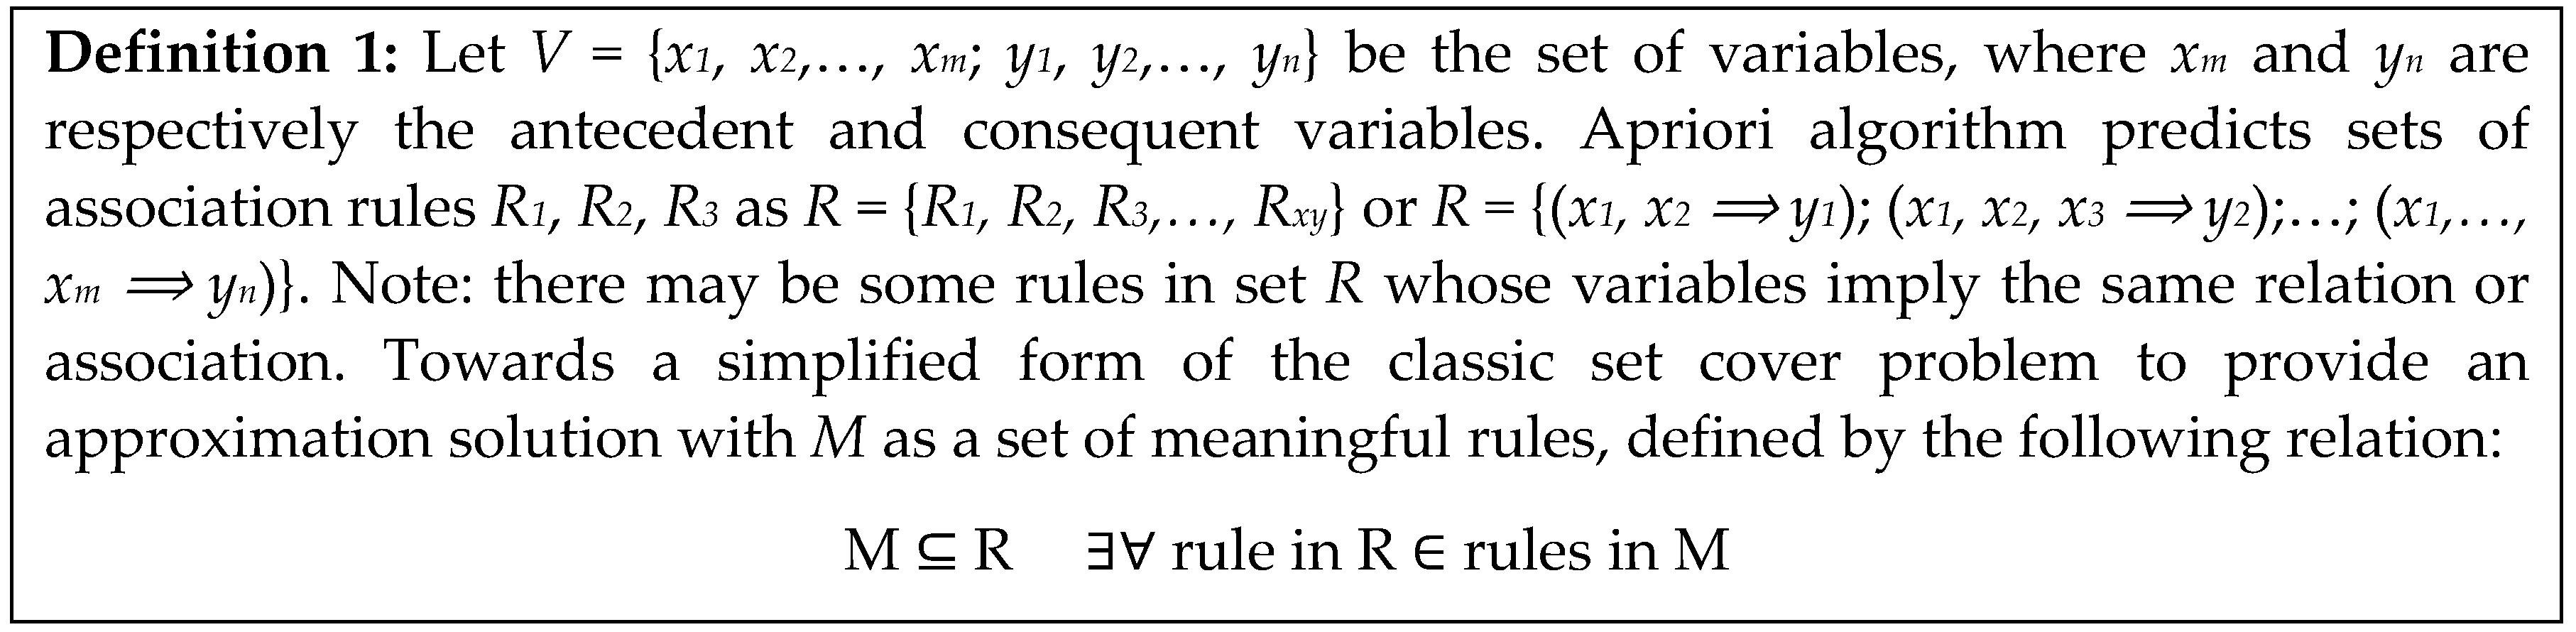
2.4. Data Mining for Analysing Travel Datasets

Provided the competitive benefit of outlining commuter expectations, perceptions and rankings of existing service level to create pro-public transport policies, a large database of underlying variables (e.g., journey time, ride quality, transit fare, accessibility, nodes, socio-demographics of commuters etc.) are generally collected from representative population samples. A recent study by Liu, Xu [67] on improving the public mass-transit service quality in China acknowledges that an efficient data mining framework is capable of extracting useful information from transit data and representing it into clear and succinct policy-related recommendations. Liu, Xu [67] developed a data mining algorithm with data cleaning and filtration options. However, their proposed algorithm focused only on the time parameters and the pre-journey (accessibility, location, train/bus-station) and on-board (crowding, seating arrangements, fare and ride quality) parameters were not involved in the algorithm design.
Similarly, a Weka classifying algorithm-based data mining study on the occurrence of faults on tram lines, local atmospheric conditions and safety was performed by Gürbüz and Turna [36]. The study noted the ability of data mining algorithms to filter through large mobility datasets and association rules to visualise the interrelation between various variables in the collected dataset. Building upon these studies, the work presented in this current paper contends that many of the variables collected through travel surveys or response diaries are interdependent or associated to varying degrees. Studying them in isolation may be inadequate if environmental impact analysts aim to study the complex relationship of categorical and nonmetric variables to recommend apposite policies to promote public transport, specifically as emission-controlling measure for residential buildings, in addition to the Intergovernmental Panel on Climate Change (IPCC) [68] recommendations of using recycled materials as green construction practices [69,70,71]. Current literature has no such framework that can help policymakers to segregate the most desired transit service attributes from the several underlying variables affecting commuter psychometrics, thereby quantifying the stakeholder demands as part of the social aspect of LCA on any transportation system. This aspect is of particular importance for deducing marketing tactics aimed at attracting users that have somewhat of a neutral perception of either travel mode (bus or car) as well as retainment of the loyal public transport users.
Inspired by Ponte, Melo [72], who used the Gini coefficient primarily used in economics, for measuring the public bus-transit travel time heterogeneity in municipal areas and Diana [35] who used association rules for studying travel pattern, this study explores the applicability of data mining techniques used in economics and marketing research. Apriori association rules data mining is used here for achieving the objective of identifying the motivations behind commuter mode choices. Introduced by Agrawal, Imieliński [73] and Agrawal and Srikant [74] for mining frequent item-sets in transaction data without using any underlying relative and distributional assumptions, it has now developed into a robust market analysis technique. Association rules identify the frequency of different variables appearing together in an observation (data) set. An association analysis reads every single row of variables on the travel datasets to produce association rules, which are of the implication form given in Equation (1).
x i , x j , , x n y
where the left-hand side is the antecedent (a set of predictor variables) and the right-hand side is the consequent (and represents the response variable). Periodically used for frequent pattern mining in fields besides management sciences, e.g., health [75] and weather forecasting [76], its application in transportation research is relatively new. Nonetheless, researchers [35,77] have explored the efficacy of associations rules for handing large and complex travel and mobility datasets. A primary advantage of using Apriori over traditional multivariate statistical analyses is its ability to rapidly find an association between large sets of metric and non-metric variables. Once an association is established between the dataset variables, traffic flow patterns and the individual public transport service attributes behind commuters’ observable modal variability can be extrapolated for policy recommendations in favour of low carbon and energy conserving transit among the local building residents and travellers.
Conversely, one of the main drawbacks of the Apriori algorithm is its tendency to produce a large number of association rules, rendering the technique to be an ineffective process if no other controls are provided. Pruning the rules is the next step [78] to filter out meaningless and inutile rules that may be misleading for policymakers. Association rules are constrained by the number of times a certain rule is supported by the dataset and the strength of rule (i.e., confidence) which is the fraction of dataset rows that contain both consequent and antecedent of the rule. However, confidence is an asymmetric measure which may provide erroneous results if the consequent has a large probability [79]. Moreover, if the antecedent and consequent variables are independent of each other, the generated rules may be unsuitable, irrespective of high confidence [80], for establishing inference relations for policy development. Wu, Zhang [81] have introduced an additional measure called “interestingness” to discard unsuitable association rules (Equation (2)).
I n t e r e s t ( X , Y ) = | S u p p o r t ( X   Y ) S u p p o r t ( X ) S u p p o r t ( Y ) |

3. Materials and Method

3.1. Survey Design and Analysis

A questionnaire was designed to gather data on the factors that affect user perception of existing bus network and modal variability among the local building residents and travellers [33]. A total of 11 questions were developed for the survey, aimed at capturing commuter responses on the different variables according to Likert-type scales, dichotomous and multiple-choice options. Previous researchers [21,82] have noted the adequacy of weekly mode choice data in modelling the mode use of surveyed commuters, the sensitivity of commuter responses to the local built environment and zonal distributions as well as the importance of zonal characteristics in defining the observed transport pattern of building residents and the calculated transport parameter in buildings’ overall environmental impacts [23,83]. This study targets the commuters in all zonal distributions (urban and suburban) of Abu Dhabi city. The survey questionnaire used for this study and the different zonal distributions are shown in Table A1 and Figure A1, respectively. The eight arterial and medium to high traffic routes serving the daily commute demands of the residents of various types of buildings in the city were selected for data collection (Table 1) to capture an optimally representative data of the city’s usual commuters and weekly data over six weeks was collected to improve the number of observations.
The completed questionnaires collected by Department of Transport survey teams [84] were then analysed. Logic checking of data consistency was performed by the authors to address data sparseness, outliers and missing data based upon the guidelines by Osborne [85]. This resulted in a useful sample of 1520 completed questionnaires (inclusive of weekdays and weekends surveys) which identified (detailed under separate cover as Hasan, Whyte [33]) ten commuter segments, namely:
  • Modal variability: distribution of generated trips for each mode (i.e., bus and car travel). Five segments as pro-sustainability (PS) passengers (i.e., regular bus travellers and non-users of cars), occasional multimodal (OMD) travellers, frequent car/taxi travellers (FrCT) and environmentally insensitive (EI) commuters (i.e., non-users of public bus service) item.
  • Perception of bus service as value for money (VfM): trade-off between quality of ride and level of fare. Three segments of good value for money, borderline value for money and bad value for money.
  • Commuter satisfaction from level of service (LoS): ranked based on perception of the current level of network coverage and frequency of buses. Three segments of good level of service, borderline level of service and bad level of service.
The statistical distribution of the collected commuter responses is shown in Table A2. The study objective is finding service desiderata critical for policymakers to deter private automobile use and increase uptake of bus usage among local building residents and travellers to promote environmental conservation by developing an improved public transit service. A data mining algorithm is thus proposed below which is used to analyse the above case study commuter segments to generate variable associations for explaining the daily commute behaviour of the local building residents and travellers.

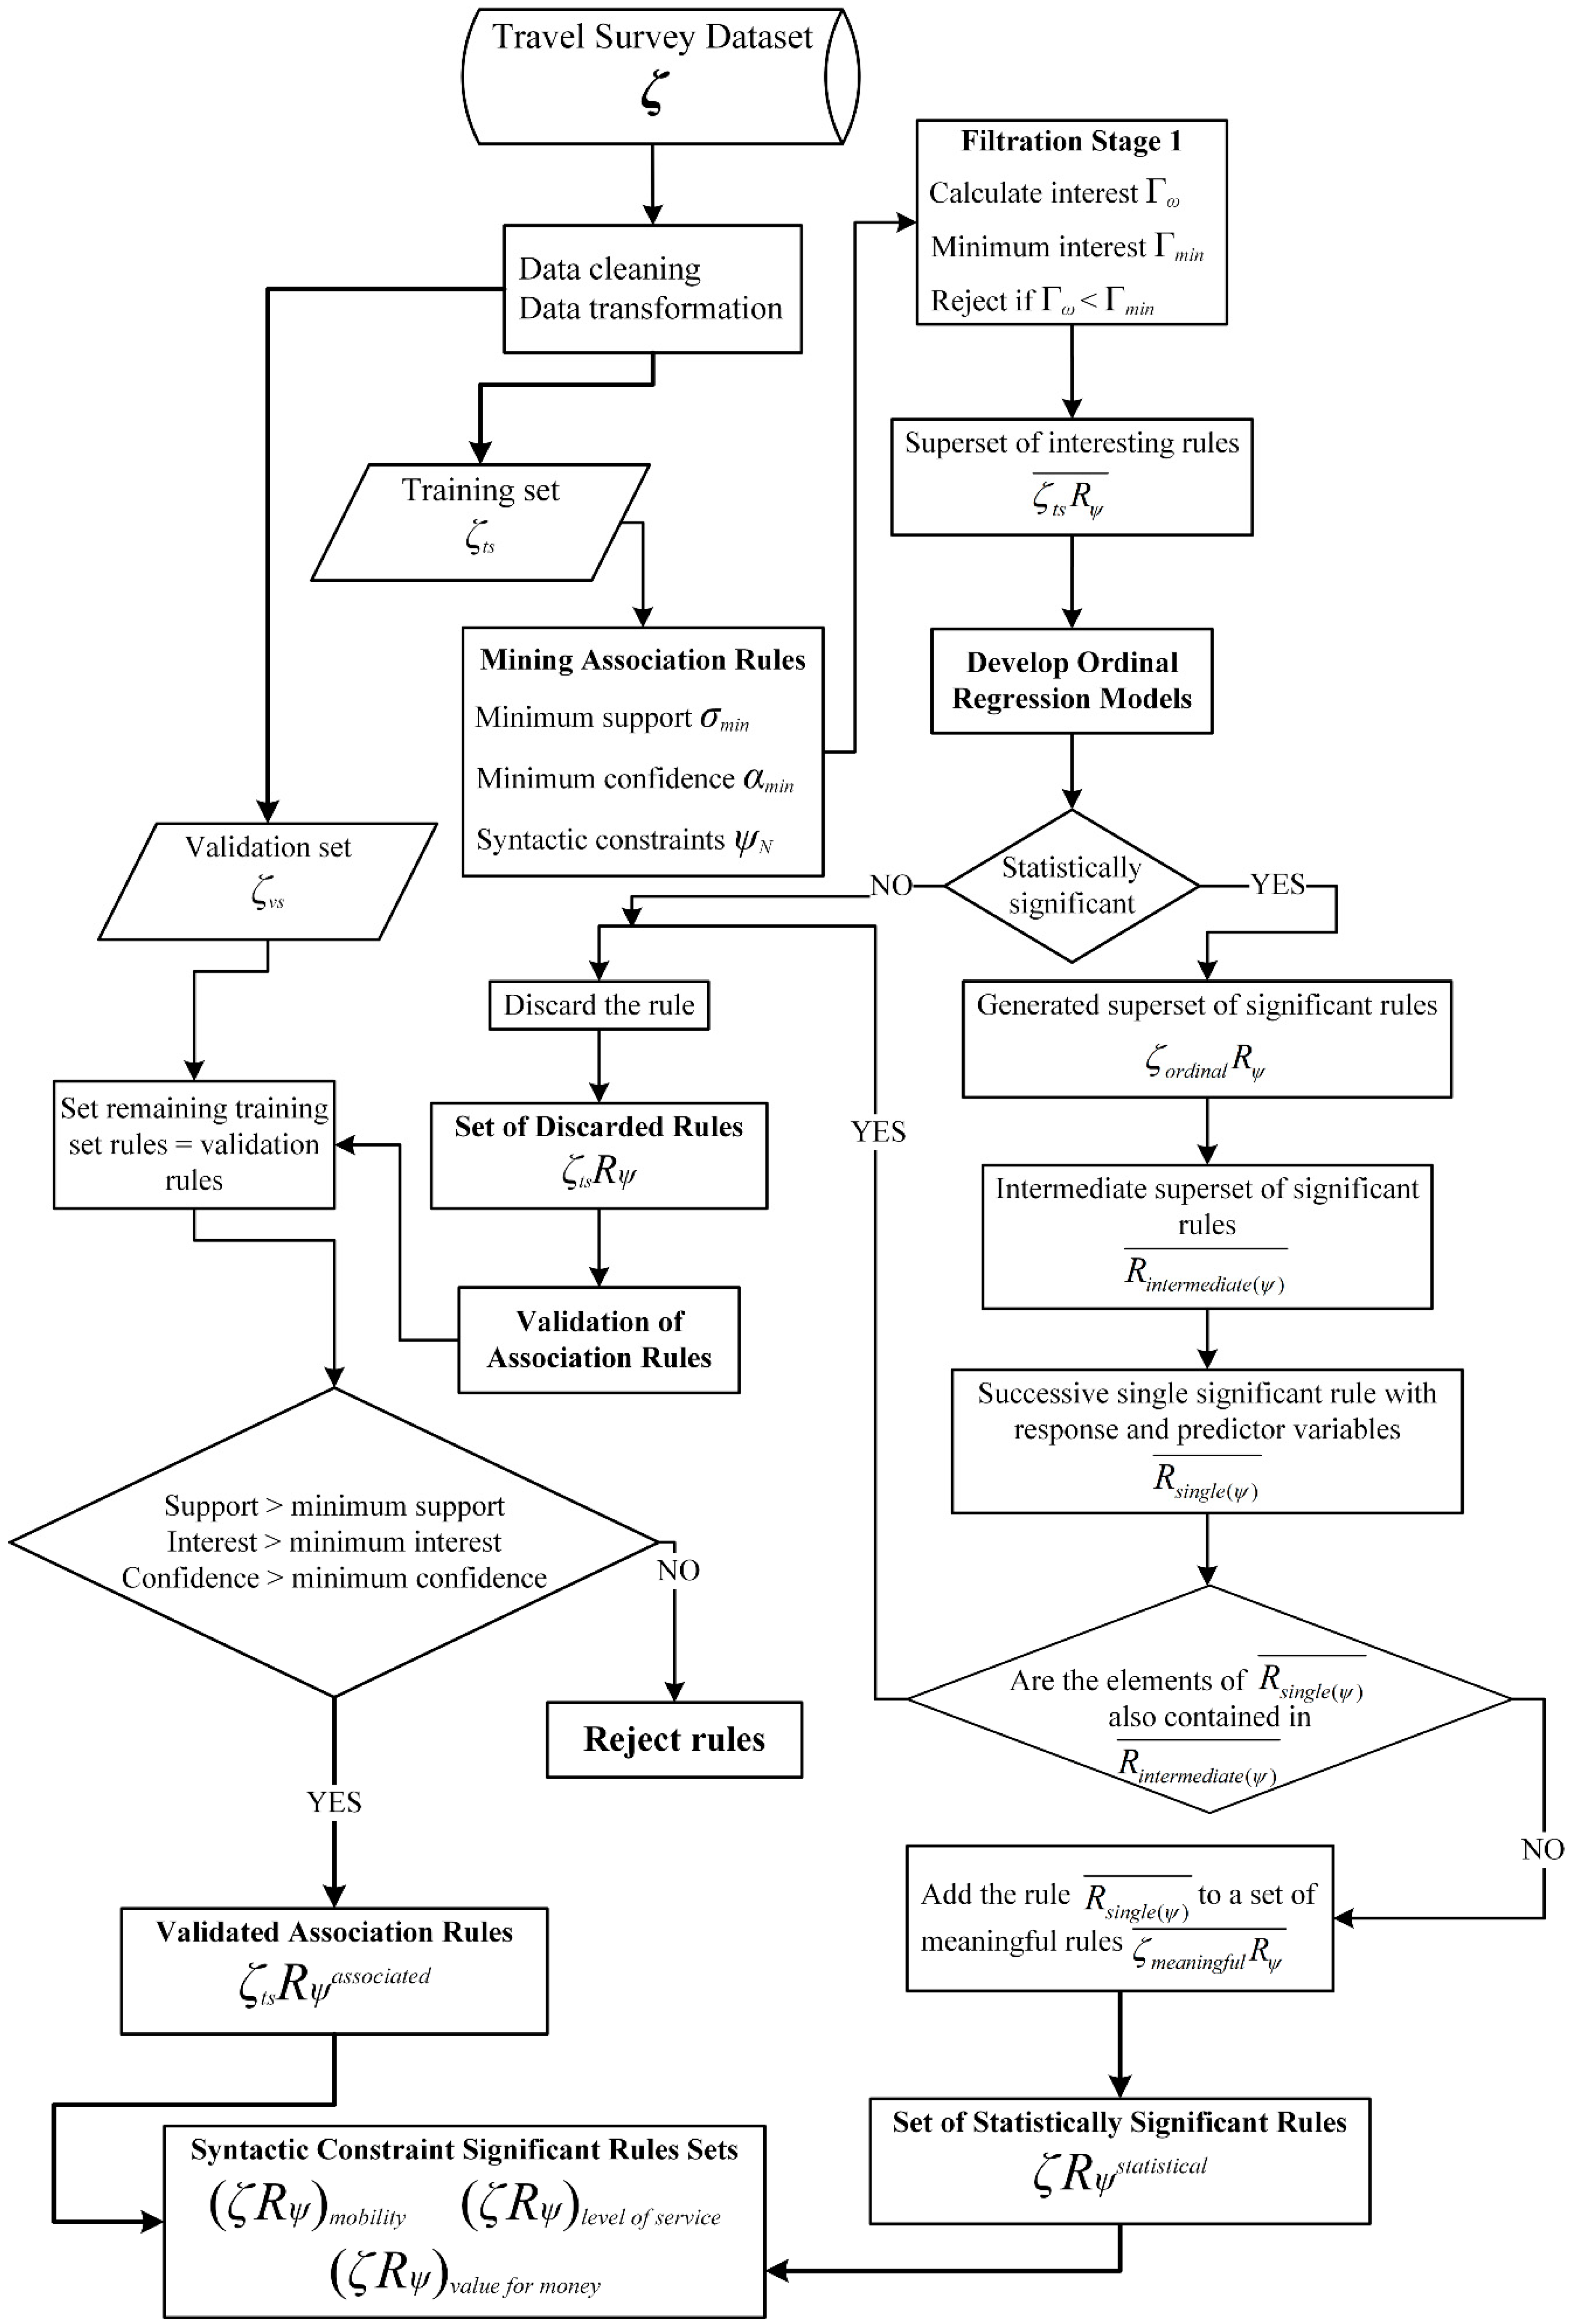
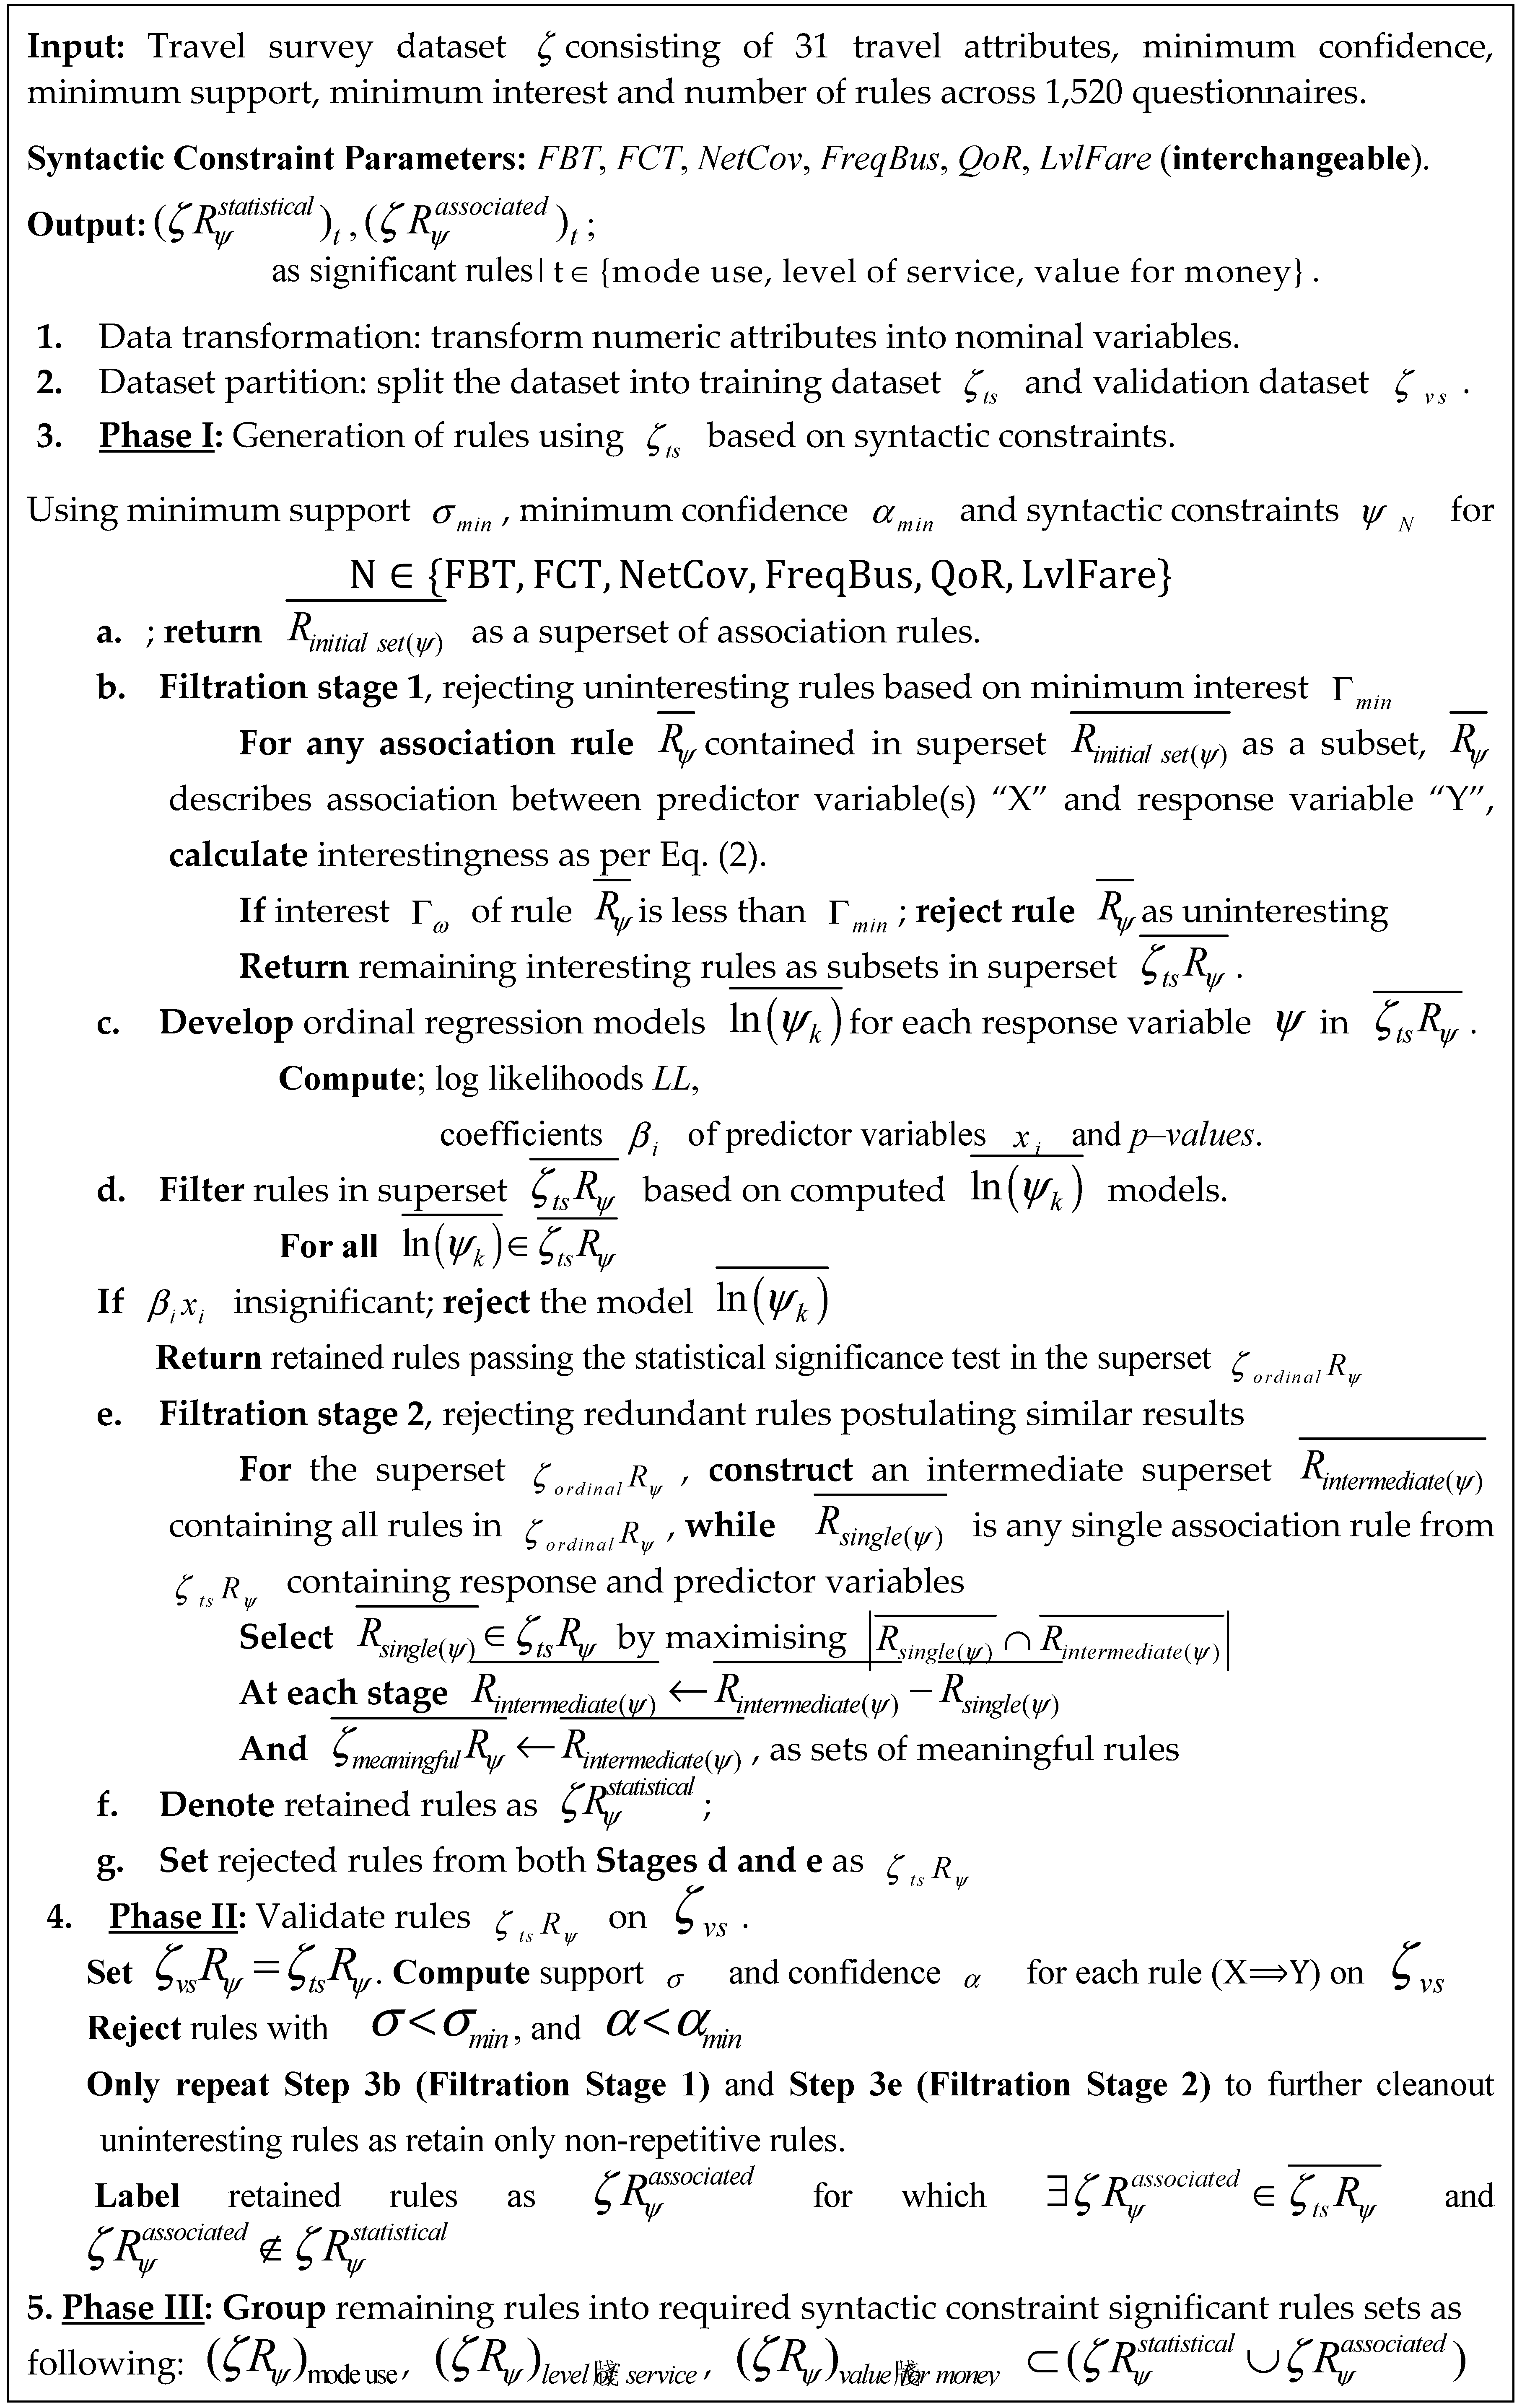
3.2. Conceptual Framework—Overall Proposed Modelling Approach

Current research suggests a market-based analysis that unifies “statistical measurement” and “associate data mining”. The combination has been used to some extent in marketing literature (e.g., Shaharanee, Hadzic [38]) for filtering out redundant rules. Work here contributes by building a multi-tier modelling approach for travel survey dataset that filters “interesting rules” to split them in two distinct categories: associated rules; and, statistically-significant models. Initially, the generated rules are filtered using an “interestingness measure” from Eq. (2). The filtered rules are then used to build ordinal regression models, followed by (only) selecting meaningful rules at the filtration stage 2. “Meaningful rules” are defined as those that provide association between the variables that have not been already construed by the other rules passing the minimum thresholds, thereby rejecting the repetitive or redundant sets of rules. The problem is further explained in Figure 1.
This twofold technique proposed in this study filters out redundant rules and provides final sets of statistically-significant rules. The rejected rules are then analysed in the second phase by a validation technique using a validation set. It is argued here that this technique will remove any misleading rules while still retaining a significant number of rules for policymaking without compromising the analysis accuracy. The proposed conceptual framework is presented in Figure 2. It should be noted that there are several off-the-shelf packages available for performing the Apriori association mining [35]. However, as this paper proposes a unified framework, a tailored java script was used for data mining due to its compatibility with SPSS 23.0 regression functions, which can then be used to perform ordinal regression on the observed rules.
Initial travel dataset “ζ” was cleaned to ensure a high quality of dataset be fed into the analysis algorithm. Data cleaning is an important step in the knowledge discovery process from analysis of predictor and response variables as it removes missing or anomalous values [85]. Numerical values of household car-ownership and time to reach bus stations were also transformed into nominal variables using equally distributed classes to maintain uniformity in the data variable classes and ease the analysis procedure. The resulting dataset was then randomly split into a training dataset (ζts, containing ≈ 70% data) and, a validation dataset (ζvs). The training dataset was then used for generating an initial set of association rules: frequency of bus travel (FBT); frequency of car/taxi travel (FCT); satisfaction with network coverage (NetCov); quality of ride (QoR); level of fare (LvlFare); and, frequency of buses (FreqBus) which were used interchangeably as response variables based upon the desired output.
In order for the algorithm to generate association rules, there should be at least one tuple in the dataset for each observation. Given our target of finding transit policy-related hotspots to promote sustainable transport usage among local building residents and travellers covered within the travel dataset, syntactic constraints were put towards the consequent-side based upon the market segments. This constrained analysis is interesting for policymakers [35] as it may help to define service attributes that may be improved upon in future services that meet the public needs regarding the local bus service. According to the principles of Apriori data mining, only one response variable can be set as a consequent. Therefore, response variables were interchangeably used as a consequent for obtaining the association rules for the respective category and obtain sets of rules specific to each segment, e.g., frequent car travellers, occasional multimode travellers and commuters ranking bus service as good value for money, and so on.
Past literature has suggested that higher support and confidence relate to a better category of rules but that lower values of support and confidence are still recommended. Therefore, to capture the most “interesting” rules, minimum support and confidence were respectively set here at 0.1 and 65% [34,35]. After appropriate data transformation and setting syntactic, support and confidence constraints, a number of frequent item rules were obtained for each category. The “interestingness measure” was used in the first filtration stage by setting a minimum interest value “Γmin”. The association rules mining through Apriori algorithm permits the analysts to set the minimum threshold for selecting useful models from a large set of created rules. Large numbers of association rules are initially generated which are then pruned by the analysts to reject falsely produced rules from the rule set that fail to qualify the established minimum threshold.
Evaluating the minimum threshold in the analysis may be guided through past experience or research literature. Therefore, in the present analysis, a minimum interest value of 0.05 was selected [16,86] with any future application of the proposed algorithm able to use a higher or lower value depending upon the study objectives. The retained rules were then used for ordinal regression analysis. The ordinal regression analysis calculated log likelihood and p-values for the models (the models were based on the association rules). Models which showed considerable change in log likelihood compared to null model and p–values < 0.05 were retained. The repetitive rules were then rejected using the theory defined in Figure 1 and the retained rules were used to represent the statistically-significant rules. The remaining rules were then used in phase II of the analysis to validate against the validation set while controlling for the minimum support, interest, confidence and non-repetitive criteria as discussed earlier. The algorithm proposed in this study is illustrated in Figure 3.

4. Results

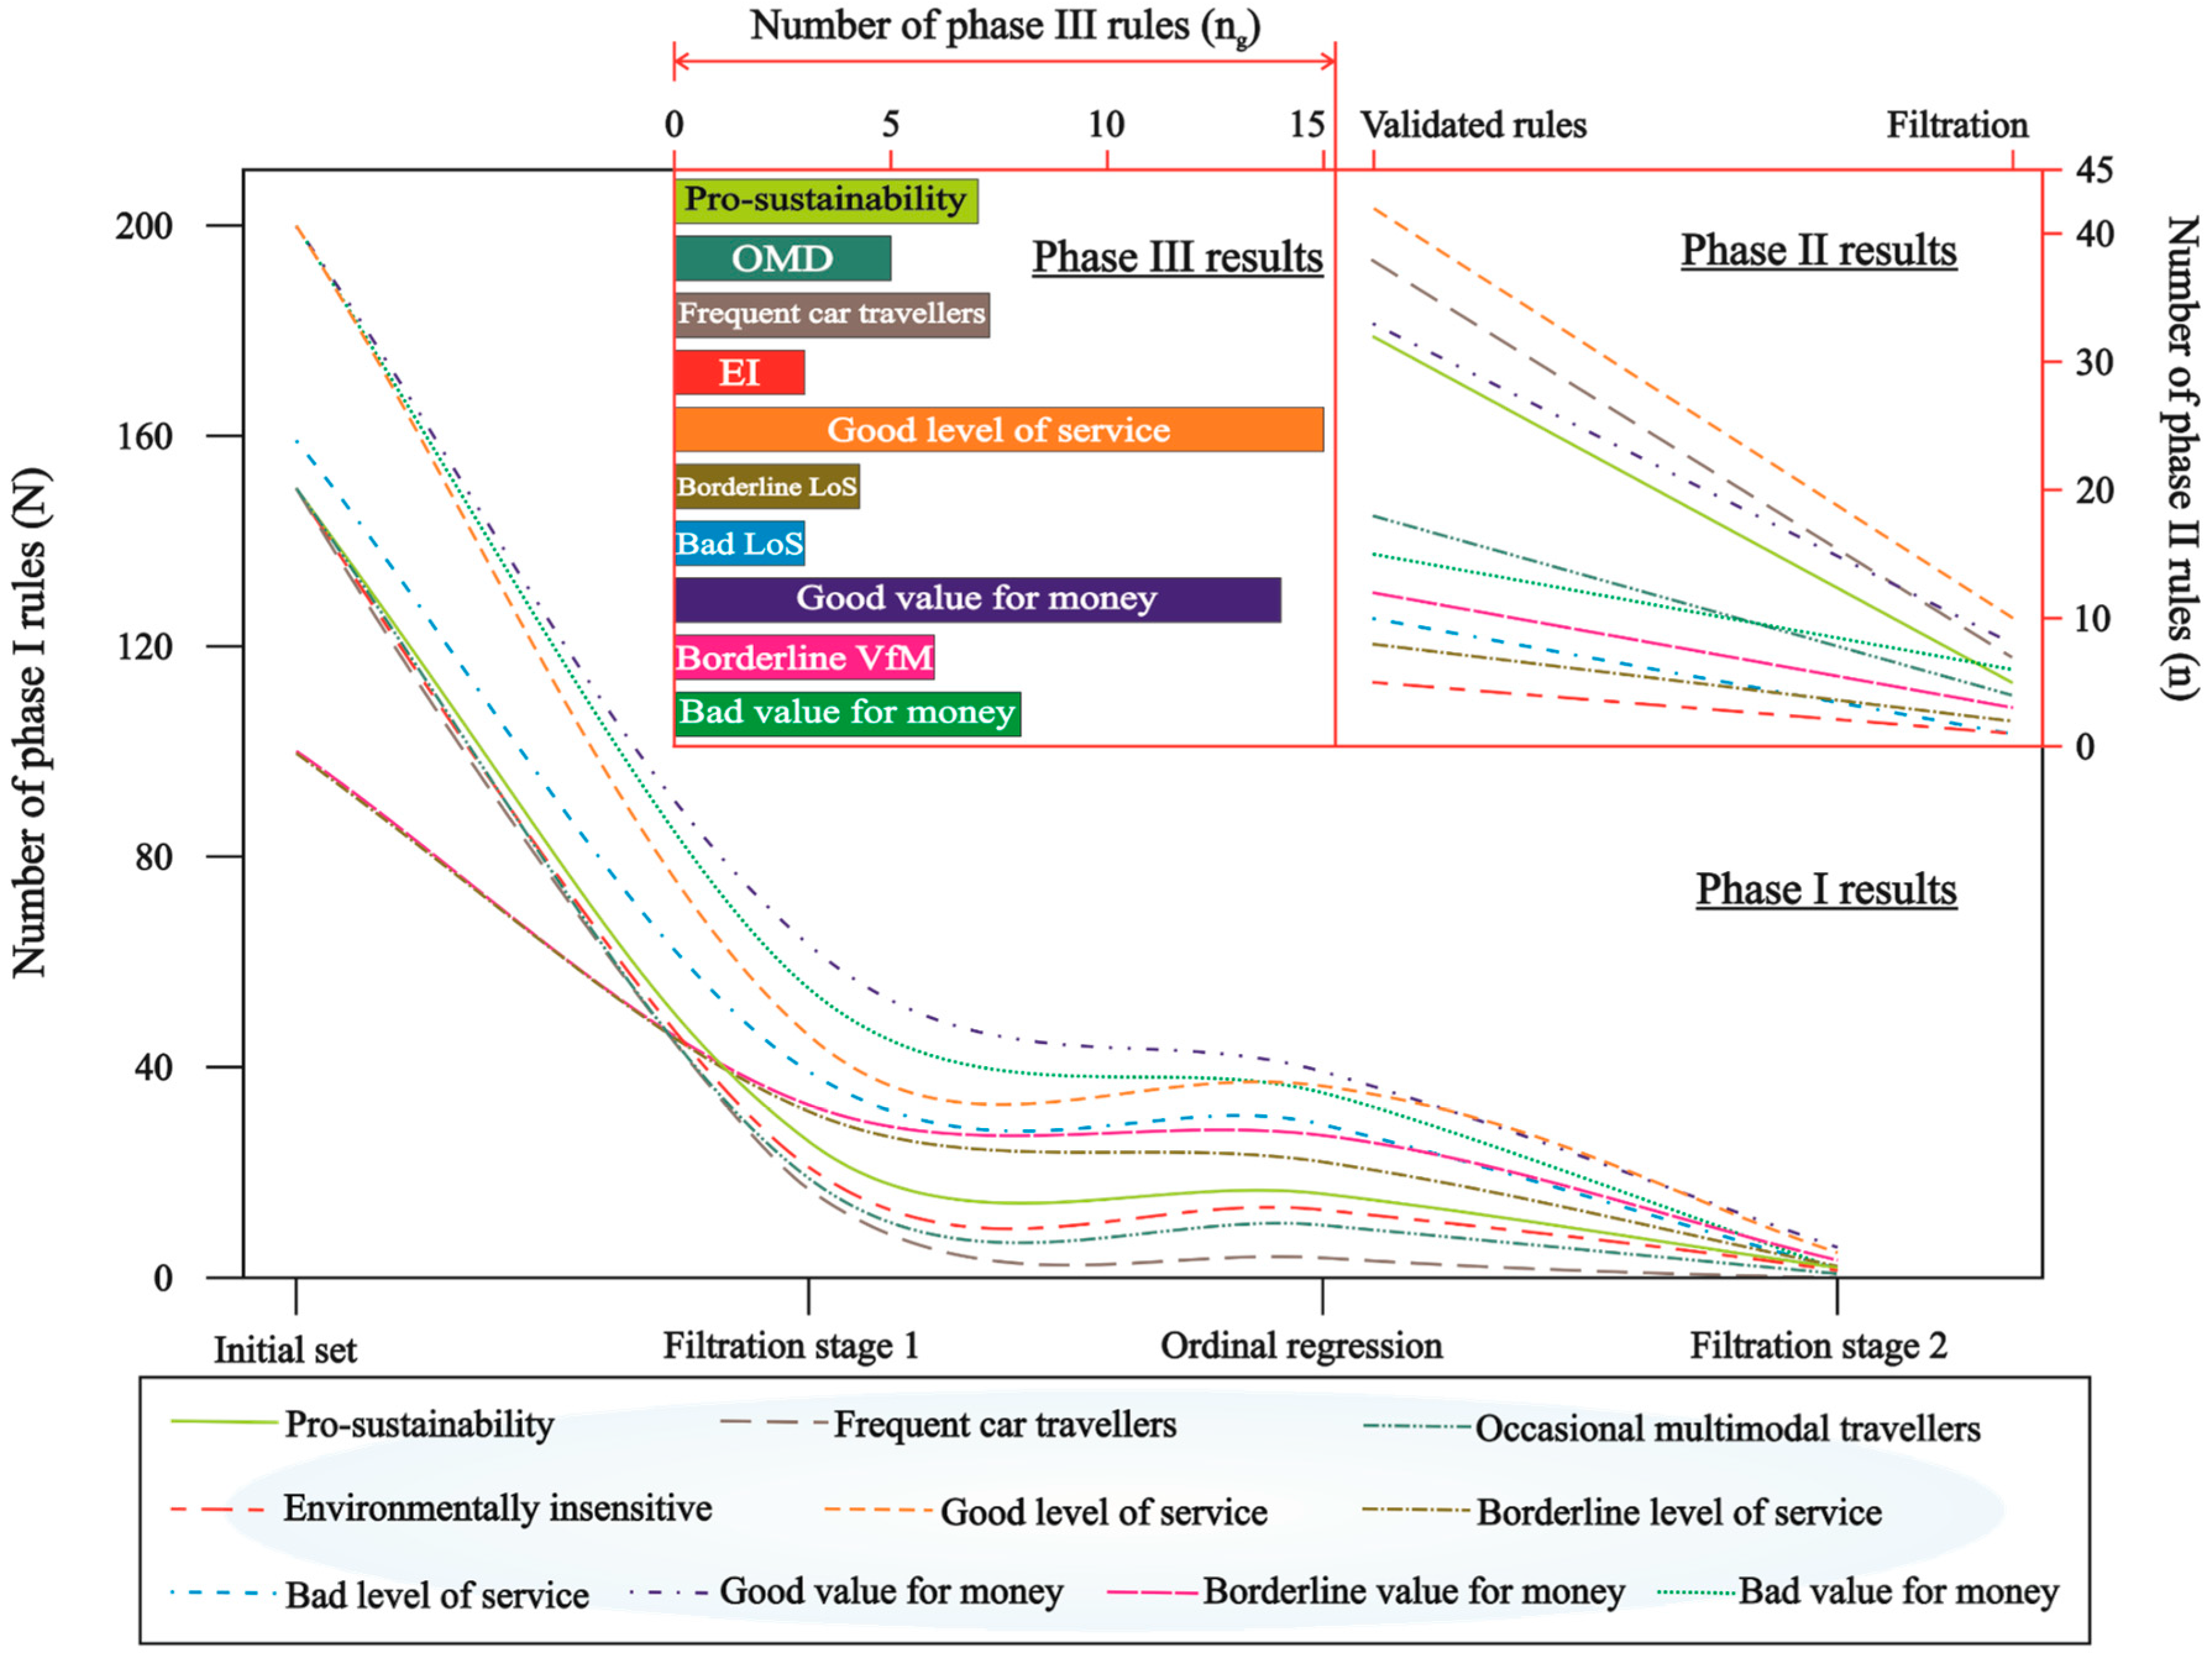
4.1. Performance of the Proposed Algorithm

The initial application of the proposed algorithm produced a large set (~1559) of association rules between the collected variables in the travel dataset that passed the minimum support (σmin = 0.1) and minimum confidence (αmin = 65%) thresholds set in Step 3a of the algorithm proposed in this study (Figure 3). Filtration stage 1 (Step 3b) was then applied to remove uninteresting rules based on Eq. (2) with the minimum interest threshold (Γmin = 0.05). This way only 351 or 22.5% of the association rules were retained in the so-called intermediate superset as interesting rules. These 22.5% remaining association rules were then subjected to the algorithm stages in Step 3c and Step 3d and ordinal regression models were developed for each rule. All the association rules with insignificant p-values for coefficients were filtered out as a separate superset. Approximately 231 or ~65.8% of the remaining association rules passed the ordinal regression performance tests and were collected in a superset of ordinal rules. Although all of these 231 association rules may be useful for developing some pro-public transit policies for local building occupants and travellers, the large number of rules may be impractical for policy analysis and may also have some redundant or reoccurring relations as also suggested in the literature (see Gürbüz and Turna [36]). The algorithm steps of feature selection and Filtration Stage 2 were thus used for data-reduction to filter out redundant rules using the superset of the 231 ordinal regression rules, as explained below.
First, an intermediate superset was created as an exact copy of ordinal rules superset and using variable selection, any smaller association rule subset (e.g., {FBT 5 or more times a week, Weekday ⟹ Very satisfied with level of fare}) implying an association or interrelation already present in a larger subset association rule (e.g., {FBT 5 or more times a week, Employed full-time, Weekday ⟹ Very satisfied with level of fare}) already present in the intermediate superset was removed. The steps were automatically repeated for all the remaining association rules subsets as rules describing an existing or reoccurring association were redundant since they were already contained in the larger subset in the intermediate superset. This way only 25 or ~11% of the 231 ordinal regression rules were retained in the so-called intermediate superset as statistically-significant rules in Step 3f, while the filtered-out rules (total of 326 rules) from both Step 3d and Step 3e were collected in a separate superset. Using the validation travel dataset, 213 rules or approximately 65% of these discarded rules were found to be validated in Phase II, where again filtration approach based on interestingness measure (Step 3b) and meaningfulness (Step 3e) resulted in retainment of 22% or 47 rules in the superset of association-only rules. Finally, both supersets were grouped to give three association rules sets for (1) mode use, (2) level of service, and (3) value for money. Figure 4 presents the results of applying various filtration techniques in the developed algorithm where Phase III results present the grouping of phase I and II association rules. The overall the algorithm application managed to filter out a total of 95% (~1487 rules) of initially obtained association rules (total rules: ~1559) as redundant or insignificant to the total travel dataset, generating a total of ~5% or 72 rules for policymaking purposes.
The following sections present results of the proposed data mining algorithm on the selected case-study of intra-city commuters in Abu Dhabi. The results from each phase are presented separately to elucidate the respective findings. An importance index is also introduced to summarise the policy-relevant findings highlighted by public consultation regarding existing services. Policy recommendations are also given on how the transit service can be improved to promote an environmentally, resource and energy conservative transportation system by improved public (bus) transport ridership among the local residents and travellers, specifically the predominant (~55%) apartment building residents.

4.2. Phase I Results—Public Responses From Statistically-Significant Rules

The input and output variables were primarily categorical in nature with upper and lower bounds of each attribute explained in the previous sections. Ordinal regression showed that a majority of the commuters reported bus travel to be easy and that 36% were willing to pay more for seat. Full-time workers were more flexible towards bus use than the younger respondents. Furthermore, as the collected data was skewed towards male commuters, some of the association rules were found to be affected by the gender of the respondents. On the other hand, only a few of the quality attributes of the bus service were found to be statistically-significant. In addition, the statistically-significant models also failed to produce inference between the purpose of the commuters’ journey and their mode choice, thereby requiring further analysis in phase II. The ordinal regression performance results of the meaningful association rules, retained after the second filtration stage, are presented in Table 2. Interestingly, the residential building typology (e.g., apartment building, villa-style house, etc.) had no statistically-significant influence on the mode choices of the residents, requiring further investigation to understand the association between these two factors as proposed by literature (e.g., [23,57]).

4.2.1. Affordability and Constrained Users

In the first block of mode use results, the odds of a full-time employed commuter to choose public transport was 6-7 times that of their unemployed counterparts (PS rule 1: χ2 = 72.68, p < 0.001) confirming market segmentation observations made previously by this project and identified under separate cover [33]. The commuters admitting affordability of private automobiles were 1.3 (p < 0.05, χ2 = 140.07: OMD rule 1) times more likely to be multimodal and 0.85 (p < 0.05, χ2 = 39.96: EI rule 1) as likely to be first time travelling by bus compared to others. While as expected, the commuters with zero household car-ownership were 1.86 times (p < 0.05, χ2 = 67.18: PS rule 2) as likely to use a bus service more than twice a week. Further exploring the affordability of the bus service exhibited that the commuters with a “very satisfied” perception of level of fare, also had 6.72 times likelihood of travelling 5 or more times/week by bus transport (Good VfM rule 2). The commuter satisfaction of public transport service level exhibited a slight decline relative to passenger travel time to the nearest bus-stop (see rule 2 of borderline level of service and rule 1 of bad value for money). Similarly, modal variability was affected when analysed against the same attribute as both rule 2 of pro-sustainability and rule 2 of environmentally insensitive market segments. Moreover, the commuters reporting buses to be crowded, were also twice as likely to belong to the environmentally insensitive group, indicating its significance in defining this market segment.

4.2.2. Crowded Buses

Rules pertaining to crowded buses were found in both less frequent bus users (EI rule 2) and bad service level (Bad LoS rule 1) groups. The results are consistent with the previous findings by Batarce, Muñoz [24] where the disutility of public transportation in Chilean commuters was observed to be correlated with in-vehicle crowding. Comparison results of value for money groups further suggested a number of priority areas in this regard. The commuter market segment willing to pay more for a seat in the bus, were also 1.16 times more likely to hold a neutral perception of the level of fare (Borderline VfM rule 3: p < 0.05, χ2 = 62.22) and 0.71 times more likely to be very dissatisfied (p < 0.01, χ2 = 632.49: Bad VfM rule 2). This implies that merely increasing the number of seats may at first persuade borderline users, but may not affect dissatisfied travellers to the same extent. Interestingly, travellers labelling buses as crowded were 1.62 times as likely to be “dissatisfied” by the frequency of buses (Bad LoS rule 2). Even though a direct relationship between the variables may have been unperceived, a deeper correlation may be present as less frequent buses on the travel routes serving the commute demands of these local building residents may impose a higher load on the existing buses. This finding indicates the presence of a potential market (of borderline and dissatisfied commuters) for policymakers by improving the public transit service based upon the public need of frequent service. The improved public transit ridership due to a corresponding reduction in private vehicle usage may then reduce the overall life-cycle environmental and energy load of the residential buildings in these studied Abu Dhabi City zones due to lesser contribution from the daily transport energy demands of their residents.
Proposing investment in size or number of units of supply (buses) to meet the local building occupants’ daily commute needs can then be countered by slightly higher fares and it may optimise the financial elasticity of the publicly-owned transport agencies. A follow-up life-cycle study on the cost of running an improved public bus transport service, i.e., more frequent (shorter headways) shall also be conducted. It is reiterated by the observance of travellers “satisfied” with journey time, as 13.22 times likely to be also satisfied with the network coverage (Good LoS rule 5: p < 0.001, χ2 = 214.14). It should also be noted that the two indicators of level of service, namely network coverage and frequency of buses were found to be highly correlated as the travellers who were “very satisfied” with the coverage were 2.88 times more likely to have the same perception of the frequency (Good LoS rule 2: p < 0.05, χ2 = 352.27). Commuters were also around 7 times more likely (Borderline LoS rule 1: p < 0.001, χ2 = 348.09) to hold a neutral perception of network coverage, causing a neutral opinion of the bus frequency, and 10.45 times more likely to be dissatisfied with both; thereby exhibiting a strong correlation between the two attributes.

4.2.3. Dynamics of Bus Fare, Quality and Frequency

Exploring the reciprocity between fare and quality added to this recommendation of a more frequent bus service supported by higher fares. The commuters unequivocally associated “levels of fare” with “quality of ride” (rule 3 of good VfM; OR =2.86, p < 0.001, χ2 = 97.02), so the transit by bus was regarded as a value worthy of riders’ money. Statistically, quality of ride was also found to be constrained by the frequency of buses as commuters satisfied with frequency of buses were 9.65 times more likely to be also satisfied by the quality of ride (rule 1 of good VfM; p < 0.001, χ2 = 164.79) and similar trends of interdependency were observed for the neutral perception of these three variables. This current study implies that unlike findings of previous studies (see Bachman and Katzev [87], Savage [88]), and fortifying the observations by Tirachini [89] and Tirachini, Hensher [90], decreasing levels of fare may not be solely responsible for influencing the perceptions of commuters regarding existing public transport services.
A slight increase in fares may be justified by more frequent buses or a higher ride quality; even though more frequent bus travellers exhibited an unwillingness to pay more for seats, a sizeable increase in frequent bus commuters may be achieved by optimising the “fare-frequency-quality” dynamic due to modal diversion, i.e., occasional multimode (both bus and car) users and frequent car travellers shifting towards higher (public) bus service ridership. Transportation economists and strategists traditionally propose a balance between frequency of buses, journey time and the level of fare [88], but fall somewhat short of indicating how the balance affects commuter behaviour and perception. As the fares were recently increased by the Department of Transport—Abu Dhabi, the observations of the current study may be of significance to the policymakers to understand the straightforward implications of such decisions in the studied traveller market. A benefit of the proposed algorithm is that the endogenous variables determining the perception of these variables among the commuter market segments are analytically filtered across a broad range of travel attributes.

4.3. Phase II Results—Policy Insights from Validated Association Rules

Mode choice dependency trends and bus ridership characteristics were further studied by analysing the association rules filtered out from phase I. Table 3 presents the validated association rules, grouped analogous to market segmentation analysis [33]. Some interesting econometric models about the journey purpose and backgrounds of the commuters were found; contrary to past research, this study found that statistical analyses alone may be deficient for capturing detailed characteristics of the traveller market. Inner correspondence of association rules was also partially detected by rule 1 of PS where first time car travellers at the time of the survey were found to be more frequent bus users.

4.3.1. Targeting Work Commutes and Full-Time Workers

Studies on building residents working full-time have found that a majority of them use private automobiles for work commutes [18,23,91], yet research targeting work-related commutes to encourage public transport use among these building residents is usually neglected. Policymakers may need to further investigate the quality improvements for attracting these consumers as this study found full-time workers commuting to/from work as predominant in both occasional multimodal (OMD rule 3) and frequent car travellers (FrCT rule 1). These findings are also consistent with the previous findings by Horner and Mefford [92] where the potential of public transit for work-related commutes was recognised. Furthermore, the need to live close to place of work and/or friends and family was one of the primary elicited reasons across all segments (e.g., PS rule 4, Good LOS rule 7, Borderline LOS rule1 and Good VfM rule 5).

4.3.2. Impact of Residential Building Typology, Locality and Nodal (Bus-Stop) Characteristics

The type of residential building, local urban form and location of the buildings were found to affect the daily mode choice of the residents [23,93,94]. However, no association was found between origin-destination areas and mode choice for the commuter segments surveyed here. Yet some influence of the commuters’ residence building type (e.g., apartment, villa house, labour camps etc.) were observed (rule 3 of PS). These observations may indicate the generalisability of the conclusions drawn from the results of the current study, specifically the dominant (> 80%, as per Abu Dhabi Government [95]) expatriate population of Abu Dhabi also being the dominant group among the survey respondents as apartment building dwellers [96]. The residual effect of commuter satisfaction with the node, i.e., bus-station waiting area, on the overall quality of ride was also exposed by the results; namely that the commuters who were dissatisfied with the waiting area were also likely to be dissatisfied with the quality of ride (rule 2 of bad VfM). This represents a probable tendency of commuters to carry forward a negative perception that was developed before embarking on the public transit journey.

4.3.3. Budgetary Constraints, Bus Service Frequency and Network Coverage

This work found that the environmentally insensitive commuters, i.e., those who primarily use private automobiles for daily travel (rule 1 of EI), were largely satisfied with the public transport fare level. It can be inferred that the budgetary constraints and pricing of the service may be of little or no concern to such users (high social or financial background, employment status etc.) and there can be several underlying reasons that may motivate their mode choice shift to public buses, if at all. Frequent car travellers indicated a willingness to pay further after observing a need for seat as a major concern (rule 5 of FrCT) and attributed no delays due to traffic congestion during their daily commute. Phase II results also showed that some commuters may have been compelled to use public transport due to necessity, rules 1 and 4 of PS (no driving license or car-ownership). Investigation of the rules on neutral and dissatisfied consumers of both LoS and VfM also revealed that financially (or otherwise) obliged travellers might have settled for public transport against a more idealised mode.
Consumer satisfaction from the level of fare was also found to be dependent upon the quality of ride, thereby confirming initial perceptions that commuters perceive fare as a function of ride quality, as presented in rule 2 of VfM. This is also largely consistent with the findings of Hensher, Stopher [97] and fare resilience addressed in the literature review by Redman, Friman [98] where fare was largely associated with service quality. It is likely that the solution to motivating transit mode choice shift from private vehicles and/or improving the service perception may not be a reduction in fares but delivering consumer-expected quality for the charged price. One interesting finding of phase I and II was the tendency of a majority of commuters to purchase cash tickets instead of monthly passes regardless of the transit service perception. Marketing policies for monthly fare collection may prove to be significant in this regard. Additionally, follow up analysis attributed to rules 1 and 2 (good LoS) and rules 1, 4, 5, 6 and 7 (good VfM) exemplifies that contrary to past research (see Redman, Friman [98]), economic restraints only partly diminish the commuters’ positive cognitive assessment of the public transport. Moreover, perception of the service quality attributes, such as journey time was also found to influence the satisfaction from level of bus service and should also be carefully considered by the policymakers.

4.3.4. Journey Time and Ride Quality

Rule 3 of bad VfM suggests that the commuters mentioning a neutral opinion of the journey time were very dissatisfied about the quality of the ride. It implies the role of long commute time in developing stress among travellers, as past studies [99] also found commuter sensitivity to journey time. Longer journey time is also significant due to: high vehicle operating costs to local building residents [100,101]; higher fuel consumption [102,103] and high environmental burden to the buildings’ overall embodied life-cycle [10]. The local government policymakers should, therefore, be mindful of the journey time detriments caused by any variations in the service route or frequency. In addition to confirming previously noticed significance of journey time on commuter satisfaction [97] and mode choice [104], phase II of the proposed algorithm was also able to pinpoint the contingent service level factors (namely frequency of buses and crowded buses). Policymakers can then predict the relative influence of changing any of the antecedent variables on commuter satisfaction from remaining variables and the subsequent mode choice. Another implication was the relative nature of quality of ride and level of service attributes of network coverage (Rule 4 of good LoS), also noticed in ordinal regression performance.

4.4. Public-Accorded Desiderata for Value-Added Bus Service for Local Building Residents

Public demand-based policy implications for the bus service to improve bus ridership among local building residents and travellers towards reduction in the residents’ transport energy and environmental component of the local residential buildings are distributed across the generated “meaningful rules”. In order to encapsulate the findings of the algorithm proposed in this study on the case study dataset, this work also sought to solve an importance index (Iin) to estimate the policy recommendations consistent with the public demands. For a response variable ψ in the phase III results, with categorical values ranging from 1 to N, the importance index can be calculated for a predictor variable xi as shown in Equation (3). It should be worth noting, as the predictor variables are also nominal in nature, only one value η is used at a time to determine the index (Ix) for the specific predictor variable. The results of applying Equations (3) and (4) on the grouped association rules of phase III are illustrated in Figure 5 and have been summarised to some degree to eliminate similar findings from any particular commuter market segment. For example, the variable category Weekday was kept for only frequency of car travel despite its occurrence in the results for frequency of bus travel models:
I x η = [ ψ = 1 N ( x i ) ψ ] η
I i n = I x η m a x ( I x η ) × 100        I x p h a s e I I I   r u l e s
Findings here suggest that full-time workers in the 25–34 age group formed the major portion of the target market, and frequently commuted on the case study routes during weekdays. These study observations were distinct from some of the past studies that analysed only segregated student and young traveller markets [105], whereas a majority of the young users studied in this paper travelled by private automobiles. Further findings are detailed in the text below.

4.4.1. Residential Apartment Building Designs May Need to Be Upgraded

Residential apartments scored higher than any other dwelling types in the existing residential zones of the surveyed Abu Dhabi city (Iin = 16.6%) as majority of the commuters responded as living in such buildings. This may reflect a pattern of denser land-use with an abundance of multi-storeyed buildings either on streets traversing or facing main arterial roads serviced by adequate public bus transport routes, especially since most commuters travelled short distance to reach the bus-stop (further details in Section 4.4.2), similar to the observations made by Thøgersen [106] and Hrelja [107]. Improving public transport service in these residential areas may impact the parking requirements in the residential apartment buildings [108]. Further work on building design implications may be developed from this study for upcoming residential development projects with adequate by provided local or building-connected public transport, as fewer parking floors may be needed in such buildings in the studied Abu Dhabi City area.

4.4.2. Existing Nodal (Bus-Stop) Distribution is Adequate

The survey respondents generally stated travelling a short distance to reach the nodes (bus-stop) from their residential and office buildings across the studied travel routes and thus the time to reach bus-station from these buildings only had nominal effect on the modal variability of their occupants. For example, Iin = 45.57% for the frequency of bus travel and Iin = 28.57% for satisfaction from network coverage and ride quality. This study, therefore proposes that establishing more bus-stations or further updating the connection between these buildings and a public transit service to serve the local building residents on the studied Abu Dhabi City routes may not necessarily encourage them to shift towards bus transport. This is a policy-sensitive observation and different from some of the past studies (e.g., Chien and Qin [109]). However, as Heinen and Chatterjee [110] found in their review on the status of research in transportation literature, few of the studies extensively explored modal variability over long-term and a majority only utilised a limited set of categorical variables to study university students or employees living in near-work communities, which may have also restricted their findings in terms of application to real-world situations.

4.4.3. Optimise Journey Time to Impact Commuter Satisfaction

Intrinsically, importance indices from this study for network coverage and quality of ride show that the commuters assume upper and lower bounds of journey time regardless of mode choice, in line with past works [111]. Any deviation in either direction causes a positive/negative ripple in commuter predilection of the service depending upon the journey time, confirming findings from previous research (see Hensher, Stopher [97]). In general, the commuters satisfied with the journey time on public bus transit were also satisfied from its network coverage (Iin = 28.57%) and ride quality (Iin = 42.86%). This supports the findings of previous studies [89,112] where the travellers were found to associate public transport as a slow and inflexible travel mode and the importance of journey time in promoting modal diversion among local residents towards a more sustainable mode (e.g. buses) was identified. On the other hand, unlike some of the past works [113,114], results gathered by this work found that the commuters admitting affordability of private automobiles were more likely to be multimodal in their transit behavior.

4.4.4. Bus Service Frequency, Crowded Buses and Level of Fare

Results here argue that the public ranking of the ride quality was influenced more by the frequency of bus service (Iin = 28.57%) and less by the level of fare. The commuters interviewed were also found to be mainly concerned with the low capacity (crowded) buses, as both frequent bus and car travellers labelled the existing buses to be crowded. Other similar interesting correlations were also found, as the commuters who commented on over-crowded buses were also dissatisfied with the frequency of buses (Iin = 14.29%) and level of fare. It builds upon the deductions from the econometric ordinal models that even though the commuters satisfied with the fare level travelled the most by buses (OR = 6.72); neutral (OR = 1.16) and dissatisfied respondents were more willing to pay extra for seats. Validated association rules further explained these observations by indicating that the level of fare was of little to no concern to non-users of bus services (i.e., the environmentally insensitive commuter segment), unlike past works [114,115]. Commuters ranking level of fare as satisfactory also indicated willingness to pay more for a seat (Iin = 28.57%).
Frequent car travellers were also willing to pay more for the bus service if they get a seat (Iin = 14.29%) and face no delays due to traffic congestion (Iin = 14.29%). In addition, the level of fare was mostly perceived by surveyed commuters in terms of ride quality and it is argued here that strong correlations exist between the two variables. These findings support a change in the current perspective of policymakers where agencies generally advocate a reduction in fare level [116] to encourage local building residents in the cities to choose public buses instead of private automobiles for the daily commute. This study proposes that instead of implementing a blanket reduction in the fare level, policymakers may be able to achieve better results in terms of user predilection towards bus service and modal use by increasing the frequency of buses, economically supported by a commensurate reasonable increase in the current level of fare. Furthermore, as journey time was of significant concern to the commuting public, travel should also be optimised by route improvements such as establishing a bus rapid transit (BRT) service to facilitate the daily commutes of the current and potential service users in Abu Dhabi. The cost and environmental implication of any improved transit system alternatives for future modifications based on public demand and the resulting journey time savings can then be compared through a detailed LCA study.

5. Discussion

There is a lack of research in the behavioural econometric analysis of the social aspect of commuter decision-making regarding transport mode choice, factors and attributes affecting these decisions such as biases, service quality, and frequency etc., which, according to IPCC (Intergovernmental Panel on Climate Change) [68], considerably hinders the selection of a suitable climate-conserving transport alternative for a sustainable municipal built environment. Apart from influencing daily commute pattern of local building residents in cities, inadequate transportation systems also impact the construction of sustainable buildings due to their direct impact on the material supply-chain and disposal options due to time delays caused by congestions on local road (Section 2.1). Therefore, by extension transportation systems are also argued to hinder sustainability performance of residential buildings. Stakeholders then seek to limit multiple-handling and transportation of feed-stock from building construction and demolition activities, as well as properly factor the impact of haulage and disposal distances and traffic congestion on the material choice of building developers. Furthermore, as explained in Section 2.1, the provision of an effective transportation system with less congestion and a better public transportation system may also influence the residency choices, sale and property development aspects of buildings.
In order to address these issues, the study presented here analyses a survey questionnaire of 1,520 responses gathered to capture the commuter perceptions on mode choice and predilection of an existing intra-city setting bus service towards improving the overall transportation system. Passenger responses can be used to influence their mode choice and reduce overall traffic congestion of the transport system after implementing the prospective changes in the transport service, based upon the public demand. Literature review covered in Section 2.1 explained that this reduction in traffic congestion via more uptake of public-transport contributes to an efficient distribution of building materials. While Section 2.2 explained that the reduction of embodied operational and life-cycle energy and environmental load of residential buildings is significantly influenced by the daily commute mode choices of its residents and may be reduced by relying on public transport instead of private vehicle transport.
To identify the motivations behind the public and private transport as preferred mode of building residents, this study proposed a data-mining algorithm unifying a modified version of the Apriori algorithm and ordinal regression to highlight policymaking proposals pertinent to the studied Abu Dhabi and Middle Eastern residents. Training portion of the travel dataset was subjected to the modified Apriori algorithm in order to generate the initial set of association rules that were partitioned according to the individual market segment candidates in the consequent of the rules. After initial interestingness-based filtration of rules, the results were exported to SPSS for externally executing ordinal regression analyses. Ordinal regression performance results of the obtained association rules, after passing a meaningfulness measure, were used to analyse the market segments. Throughout the ordinal regression experiments, a majority of the respondents stated travelling a short distance to reach the bus-stop from their residential and/or office buildings, and time to bus-station had nominal effect on the modal variability of commuters. This may indicate that the current connection between these buildings and the supplied public transit service is adequate.
Mode use pattern was found to be only partly related to the socio-demographic characteristics of the surveyed local Abu Dhabi City building residents. The gender of these respondents had no statistically-significant influence on modal variability but was found to influence their perception of the service as the males generally had a more positive outlook. As such, a majority of similar variables (e.g., building typology, location, age etc.) failed to pass the ordinal regression tests and the next stage (validation of association rules) was used to capture the influence of these variables. Towards travel constraints limiting mode choice of commuters, this study found that a significant share of frequent bus travellers may have been compelled to uptake of public transport due to socio-demographics (lack of access to cars and lack of driving license). Nonetheless, the economic restraints only partly prejudiced their negative perception of the bus service and a majority of the so-called “compelled” travellers viewed public buses as good value for money and deemed the current service level to be satisfactory.
It is noted here that occasionally multimodal and frequent car travellers exhibit a substantial willingness to travel by public buses provided the capacity is increased or the buses become less crowded, even at the cost of higher fare. The results show that commuter satisfaction from the quality of ride and level of fare were highly interrelated. Frequency of the public bus service, as a measure of the passenger satisfaction from the level of service, is found to influence the mode choices of local building occupants. Given the competitive nature of private automobiles and the tendency of commuters in the studied dataset to use public transport for work-related commute dissimilar to past findings, policymakers may need to optimise quality-frequency-fare dynamics especially targeting peak work hours to reduce residents’ transport-related environmental load of local buildings. One of the common strategies that is often implemented in many countries around the world for this purpose is investing in mass-transit systems. Technical and regulatory aspects of implementing the mass-transit system may include smoother traffic flow due to lesser private vehicles on the road network, reduction in cost and environmental burdens, fewer energy and fuel requirements on the power and fuel supply grids in the municipal regions, reduced overall operational and user-transport energy of residential buildings and availability of more recycled material haulage options (from far-off locations) in some areas for building construction projects. The mode use changes as a result of any improved public transit service may also affect the urban form and building designs: accessibility and shared spaces, lesser parking needs routine maintenance due to lower traffic and noise vibration damages.

6. Conclusions

The life-cycle energy and environmental load inventory of residential buildings includes the impact of material usage choices due to haulage requirements from virgin material suppliers vs. recycling plants, traffic congestion impact on per tonne kilometre (tkm) energy load during the actual material transport, disposal feedback loops and the embodied building residents’ daily transportation requirements. Public transport services are generally proposed for alleviating excessive private commuter traffic load on road networks and reduce the overall transport system energy and environmental burdens in the local municipal regions. Yet, the interrelations of mode choice to underlying social (i.e., stakeholder-related) attributes of journey time, location of residential and office buildings comparative to the public transit service node (bus-stop), on-board crowding and ride quality are somewhat unexplored.
To that end, the methodology proposed in this study aids the policymakers in finding the critical attributes for improving performance of any built asset by engaging the stakeholders in the life-cycle asset management process through a social component. The findings of the current study demonstrate its application to a real-world case study of Abu Dhabi City building residents and travellers. Based on results, it recommends that a bus rapid transit (BRT) service, more frequent at peak office hours, may entice significant car users towards the public bus transport service. Whilst the overall whole-cost and explicit environmental impact of meeting public demands by constructing and managing a proposed practicable BRT system can be explored through subsequent detailed LCA, the work presented here does find that addressing public transportation systems preferences can contribute to congestion reduction and impact positively to sustainable development.
The proposed framework used data-mining to filter through the large set of public response survey data for a transport pattern behavioural case study among local building occupants. However, future works may apply the same procedure for data-mining the stakeholder perspectives of other aspects in the residential building development: need for a recreational building facility, upgrading/modifying an existing building, façade renovations, and interior works for buildings, etc.

Author Contributions

Conceptualization, methodology, formal analysis, validation and writing—original draft, U.H.; Supervision, writing—review and editing, and validation, A.W.; Resources and data curation, H.A.J.

Funding

This research project is supported by an Australian Government Research Training Program (RTP) scholarship.

Acknowledgments

The authors thank the Integrated Planning Department at the Department of Transportation (DoT) Abu Dhabi for their support of data collection and assistance.

Conflicts of Interest

The authors declare no conflict of interest.

Appendix A

The appendix that contains details and data supplemental to the main text is provided below.
Table A1. Questionnaire sample (English version) used for this study .
No.QuestionsResponses (please circle as appropriate)
MUModal variability (mode use) variables
MU1How often do you travel by bus?1. First time2. Less often3. 1–3 times/month4. Once a week5. 2–4 times/week6. Over 5 times/week7. Never
MU2How often do you travel by private car or taxi?1. First time2. Less often3. 1–3 times/month4. Once a week5. 2–4 times/week6. Over 5 times/week7. Never
LoSLevel of service variables
LoS1How satisfied are you with current frequency of buses on this route?1. Very dissatisfied2. Dissatisfied3. Neutral4. Satisfied5. Very satisfied
LoS2How satisfied are you with current level of network coverage on this route?1. Very dissatisfied2. Dissatisfied3. Neutral4. Satisfied5. Very satisfied
VfMValue for money variables
VfM1How satisfied are you with current quality of ride on buses on this route?1. Very dissatisfied2. Dissatisfied3. Neutral4. Satisfied5. Very satisfied
VfM2How satisfied are you with current level of fare of buses on this route?1. Very dissatisfied2. Dissatisfied3. Neutral4. Satisfied5. Very satisfied
STTravel Bias (Structural-type Constraints Questions)
ST1Your accommodation type?1. Villa2. Apartment3. Hotel4. Labour camp5. Other
ST2What is your employment status?1. Retired/Other2. Visitor3. Student4. Unemployed5. Work part-time6. Work full-time
ST3What is your annual rent? (AED)1. Under 10,0002. 10,000–20,0003. 20,001–40,0004. 40,001–60,0005. 60,001–100,0006. Over 100,000
SPTravel Bias (Spatial-type Constraints Questions)
SP1Where do you live?1. Al-Bateen2. Downtown3. CBD4. Al-Mina5. Al-Wahdah6. Shakhbout St to city edge7. Out of city
SP2Where did you start this journey?1. Al-Bateen2. Downtown3. CBD4. Al-Mina5. Al-Wahdah6. Shakhbout St to city edge7. Out of city
SP3Where are you travelling to?1. Al-Bateen2. Downtown3. CBD4. Al-Mina5. Al-Wahdah6. Shakhbout St to city edge7. Out of city
SP4Purpose of your journey today?1. Work2. Study3. Business4. Personal reason5. Shopping6. Leisure
SP5Type of ticket you purchased today?
SDTravel Bias (Socio-demographic Constraints Questions)
SD1Age (years)1. Under 162. 16 – 243. 25 – 344. 35 – 445. 45 – 646. Over 65
SD2Number of cars in household1. No cars2. 1 to 2 cars3. 3 to 5 cars4. Over 5 cars
SD3Do you hold a UAE driving license?1. Yes2. No
SD4Ethnicity/Nationality1. UAE2. Caucasian3. Middle Eastern4. African5. South Asian6. Southeast Asia7. Other
SD5Gender1. Male2. Female
SD6Your gross monthly income in AED1. Under 10,0002. 1,000–3,0003. 3,001–5,0004. 5,001–10,0005. 10,001–20,000
SQPerceived Service Quality Questions
SQ1I am satisfied with journey time1. Strongly disagree2. Disagree3. Neutral4. Agree5. Strongly agree
SQ2The buses are too crowded1. Strongly disagree2. Disagree3. Neutral4. Agree5. Strongly agree
SQ3Bus travel is the easiest way for me1. Strongly disagree2. Disagree3. Neutral4. Agree5. Strongly agree
SQ4I am satisfied with the bus-stops1. Strongly disagree2. Disagree3. Neutral4. Agree5. Strongly agree
SQ5Travel by car or taxi is expensive1. Strongly disagree2. Disagree3. Neutral4. Agree5. Strongly agree
SQ6Traffic congestion delays my journey1. Strongly disagree2. Disagree3. Neutral4. Agree5. Strongly agree
SQ7I chose to live further from work (i.e. near family and friends) and longer commute time is insignificant to me1. Strongly disagree2. Disagree3. Neutral4. Agree5. Strongly agree
SQ8I chose to live closer to work as shorter commute time is significant to me1. Strongly disagree2. Disagree3. Neutral4. Agree5. Strongly agree
SQ9Willing to pay more for bus travel if I always had a seat1. Strongly disagree2. Disagree3. Neutral4. Agree5. Strongly agree
SQ10I am satisfied with the existing distribution of bus-stops on the current travel route (Today it took me longer/many minutes to get to bus-stop)1. Strongly disagree2. Disagree3. Neutral4. Agree5. Strongly agree
Both English and Arabic versions were used along with multilingual teams to capture data across all demographics.
Figure A1. Zonal distribution of the Abu Dhabi City (based on AECOM (2015) [84].
Buildings 09 00001 g0a1
Table A2. Statistical descriptive distribution of the collected variables.
VariablesN (Valid)MeanStandard DeviationVariance
Frequency of bus travel15175.201.1491.321
Frequency of car travel13052.941.4142.000
Satisfaction with frequency of buses15123.700.8990.809
Satisfaction with network coverage14943.740.8900.793
Satisfaction with quality of ride15013.980.9760.953
Satisfaction with level of fare15053.371.3511.824
Your accommodation type?15092.521.3901.933
What is your employment status?15055.551.1031.216
What is your annual rent? (AED)13842.091.2521.566
Where do you live?15193.761.8143.291
Where did you start this journey?15183.351.8453.405
Where are you travelling to?15153.381.8233.323
Purpose of your journey today?15143.252.1304.539
Type of ticket you purchased today? 15161.320.7320.536
Age (years)15073.210.9230.851
Number of cars in household14400.170.3920.153
Do you hold a UAE driving license?15031.790.4110.169
Ethnicity/Nationality15075.021.0701.145
Gender15091.130.3330.111
Your gross monthly income in AED13852.471.0481.099
I am satisfied with journey time15083.950.8260.682
The buses are too crowded15190.600.4890.240
Bus travel is the easiest way for me15190.660.4750.226
I am satisfied with the bus-stops14963.381.1251.265
Travel by car or taxi is expensive15190.450.4970.247
Traffic congestion delays my journey15190.350.4780.228
I chose to live further from work15190.660.4720.223
I chose to live closer to work13194.702.707.301
Willing to pay more for bus seat 15190.360.4790.229
Satisfied with existing bus-stop distribution15192.100.6760.457

References

  1. Borrego, C.; Tchepel, O.; Barros, N.; Miranda, A.I. Impact of road traffic emissions on air quality of the Lisbon region. Atmos. Environ. 2000, 34, 4683–4690. [Google Scholar] [CrossRef]
  2. Gray, D.; Laing, R.; Docherty, I. Delivering lower carbon urban transport choices: European ambition meets the reality of institutional (mis)alignment. Environ. Plan. A Econ. Space 2016, 49, 226–242. [Google Scholar] [CrossRef] [Green Version]
  3. Crispino, M.; D’Apuzzo, M. Measurement and prediction of traffic-induced vibrations in a heritage building. J. Sound Vib. 2001, 246, 319–335. [Google Scholar] [CrossRef]
  4. Rychtáriková, M.; Jedovnický, M.; Vargová, A.; Glorieux, C. Synthesis of a Virtual Urban Soundscape. Buildings 2014, 4, 139–154. [Google Scholar] [CrossRef] [Green Version]
  5. Hasan, U.; Chegenizadeh, A.; Budihardjo, M.; Nikraz, H. A review of the stabilisation techniques on expansive soils. Aust. J. Basic Appl. Sci. 2015, 9, 541–548. [Google Scholar]
  6. Hasan, U. Experimental Study on bentonite Stabilisation Using Construction Waste and Slag. Ph.D. Thesis, Curtin University, Perth, Australia, 2015. [Google Scholar]
  7. Le, A.B.D.; Whyte, A.; Biswas, W.K. Carbon footprint and embodied energy assessment of roof-covering materials. Clean Technol. Environ. Policy 2018. [Google Scholar] [CrossRef]
  8. Mawed, M.; Al-Hajj, A.; Alshemery, A.A. The impacts of sustainable practices on UAE mosques’ life cycle cost. In Proceedings of the Smart, Sustainable and Healthy Cities: 1st International Conference of the CIB Middle East and North Africa Research Network, Abu Dhabi, UAE, 14–16 December 2014; pp. 307–324. [Google Scholar]
  9. Alqahtani, A.; Whyte, A. Evaluation of non-cost factors affecting the life cycle cost: An exploratory study. J. Eng. Des. Technol. 2016, 14, 818–834. [Google Scholar] [CrossRef]
  10. Dodd, N.; Donatello, S.; Garbarino, E.; Gama-Caldas, M. Identifying Macro-Objectives for the Life Cycle Environmental Performance and resource Efficiency of EU Buildings; JRC EU Commission: Luxembourg, 2015; p. 117. [Google Scholar]
  11. Badland, H.; Schofield, G. Transport, urban design, and physical activity: An evidence-based update. Transp. Res. Part D Transp. Environ. 2005, 10, 177–196. [Google Scholar] [CrossRef]
  12. Yigitcanlar, T.; Kamruzzaman, M.; Teriman, S. Neighborhood Sustainability Assessment: Evaluating Residential Development Sustainability in a Developing Country Context. Sustainability 2015, 7, 2570–2602. [Google Scholar] [CrossRef] [Green Version]
  13. Jabareen, Y.R. Sustainable Urban Forms: Their Typologies, Models, and Concepts. J. Plan. Educ. Res. 2006, 26, 38–52. [Google Scholar] [CrossRef]
  14. Zimring, C.; Joseph, A.; Nicoll, G.L.; Tsepas, S. Influences of building design and site design on physical activity: Research and intervention opportunities. Am. J. Prev. Med. 2005, 28, 186–193. [Google Scholar] [CrossRef] [PubMed]
  15. Cervero, R. Public transport and sustainable urbanism: Global lessons. In Transit Oriented Development; Routledge: London, UK, 2009; pp. 23–35. [Google Scholar]
  16. De Luca, S. Public engagement in strategic transportation planning: An analytic hierarchy process based approach. Transp. Policy 2014, 33, 110–124. [Google Scholar] [CrossRef]
  17. Leyden, K.M.; Slevin, A.; Grey, T.; Hynes, M.; Frisbaek, F.; Silke, R. Public and Stakeholder Engagement and the Built Environment: A Review. Curr. Environ. Health Rep. 2017, 4, 267–277. [Google Scholar] [CrossRef] [PubMed]
  18. Stephan, A.; Stephan, L. Life cycle energy and cost analysis of embodied, operational and user-transport energy reduction measures for residential buildings. Appl. Energy 2016, 161, 445–464. [Google Scholar] [CrossRef]
  19. Hasan, U.; Whyte, A.; Al Jassmi, H. Critical review and methodological issues in integrated life-cycle analysis on road networks. J. Clean. Prod. 2019, 206, 541–558. [Google Scholar] [CrossRef]
  20. Stephan, A.; Crawford, R.H.; de Myttenaere, K. A comprehensive assessment of the life cycle energy demand of passive houses. Appl. Energy 2013, 112, 23–34. [Google Scholar] [CrossRef] [Green Version]
  21. Diana, M. Measuring the satisfaction of multimodal travelers for local transit services in different urban contexts. Transp. Res. Part A Policy Pract. 2012, 46, 1–11. [Google Scholar] [CrossRef] [Green Version]
  22. De Vos, J.; Mokhtarian, P.L.; Schwanen, T.; Van Acker, V.; Witlox, F. Travel mode choice and travel satisfaction: Bridging the gap between decision utility and experienced utility. Transportation 2016, 43, 771–796. [Google Scholar] [CrossRef]
  23. Anderson, J.E.; Wulfhorst, G.; Lang, W. Expanding the use of life-cycle assessment to capture induced impacts in the built environment. Build. Environ. 2015, 94, 403–416. [Google Scholar] [CrossRef] [Green Version]
  24. Batarce, M.; Muñoz, J.C.; de Dios Ortúzar, J.; Raveau, S.; Mojica, C.; Ríos, R.A. Use of Mixed Stated and Revealed Preference Data for Crowding Valuation on Public Transport in Santiago, Chile. Transp. Res. Rec. J. Transp. Res. Board 2015, 2535, 73–78. [Google Scholar] [CrossRef]
  25. Stathopoulos, A.; Cirillo, C.; Cherchi, E.; Ben-Elia, E.; Li, Y.-T.; Schmöcker, J.-D. Innovation adoption modeling in transportation: New models and data. J. Choice Model. 2017, 25, 61–68. [Google Scholar] [CrossRef]
  26. Golob, T.F.; Hensher, D.A. The trip chaining activity of Sydney residents: A cross-section assessment by age group with a focus on seniors. J. Transp. Geogr. 2007, 15, 298–312. [Google Scholar] [CrossRef]
  27. Diana, M.; Pronello, C. Traveler segmentation strategy with nominal variables through correspondence analysis. Transp. Policy 2010, 17, 183–190. [Google Scholar] [CrossRef]
  28. Tan, P.-N.; Steinbach, M.; Kumar, V. Introduction to Data Mining, 1st ed.; Addison-Wesley Longman Publishing Co., Inc.: Boston, MA, USA, 2005. [Google Scholar]
  29. Elder, J. Handbook of Statistical Analysis and Data Mining Applications, 1st ed.; Nisbet, R., Miner, G., Eds.; Academic Press: Boston, MA, USA, 2009; p. 864. [Google Scholar]
  30. Al-Hussaeni, K.; Fung, B.C.M.; Iqbal, F.; Dagher, G.G.; Park, E.G. SafePath: Differentially-private publishing of passenger trajectories in transportation systems. Comput. Netw. 2018, 143, 126–139. [Google Scholar] [CrossRef]
  31. Laing, R.; Tait, E.; Gray, D. Public engagement and participation in sustainable transport issues. In Proceedings of the Construction, Building and Real Estate Research Conference of the Royal Institution of Chartered Surveyors, Las Vegas, NV, USA, 11–13 September 2012. [Google Scholar]
  32. Hasan, U.; Whyte, A.; Al Jassmi, H. Framework for Delivering an AV-based Mass Mobility Solution: Integrating Government-Consumer Actors and Life-cycle Analysis of Transportation Systems. In Proceedings of the 46th European Transport Conference, Dublin, Ireland, 10–12 October 2018; p. 18. [Google Scholar]
  33. Hasan, U.; Whyte, A.; Al Jassmi, H. Public-Transport System Management: Improving Service Satisfaction and Sustainable Uptake. 2018. submitted. [Google Scholar]
  34. Chu, K.; Chapleau, R. Augmenting transit trip characterization and travel behavior comprehension. Transp. Res. Rec. J. Transp. Res. Board 2010, 2183, 29–40. [Google Scholar] [CrossRef]
  35. Diana, M. Studying patterns of use of transport modes through data mining: Application to us national household travel survey data set. Transp. Res. Rec. J. Transp. Res. Board 2012, 2308, 1–9. [Google Scholar] [CrossRef]
  36. Gürbüz, F.; Turna, F. Rule extraction for tram faults via data mining for safe transportation. Transp. Res. Part A Policy Pract. 2018, 116, 568–579. [Google Scholar] [CrossRef]
  37. Ordonez, C. Association rule discovery with the train and test approach for heart disease prediction. IEEE Trans. Inf. Technol. Biomed. 2006, 10, 334–343. [Google Scholar] [CrossRef]
  38. Shaharanee, I.N.M.; Hadzic, F.; Dillon, T.S. Interestingness measures for association rules based on statistical validity. Knowl. Based Syst. 2011, 24, 386–392. [Google Scholar] [CrossRef]
  39. Lazcorreta, E.; Botella, F.; Fernández-Caballero, A. Towards personalized recommendation by two-step modified Apriori data mining algorithm. Expert Syst. Appl. 2008, 35, 1422–1429. [Google Scholar] [CrossRef]
  40. Whyte, A.; Laing, R. Deconstruction and reuse of building material, with specific reference to historic structures. In Proceedings of the 1st Australasia and South East Asia Conference in Structural Engineering and Construction (ASEA-SEC-1), Perth, Australia, 28 November–2 December 2012; pp. 171–176. [Google Scholar]
  41. Whyte, A. Life-Cycle Assessment of Built-Asset Waste Materials: Sustainable Disposal Options; Lambert Aademic Publishing: Saarbrucken, Germany, 2012. [Google Scholar]
  42. NSAI. EN 15978:2011: Sustainability of Construction Works—Assessment of Environmental Performance of Buildings—Calculation Method; British Standard Institute: London, UK, 2011. [Google Scholar]
  43. AFNOR Normalisation. CEN/TC 350 Sustainability of Construction Works. Available online: http://portailgroupe.afnor.fr/public_espacenormalisation/CENTC350/index.html (accessed on 10 December 2018).
  44. International Standards Organisation (ISO). ISO/TS 12720: Sustainability in Buildings and Civil Engineering Works—Guidelines on the Application of the General Principles in ISO 15392; ISO: Geneva, Switzerland, 2014. [Google Scholar]
  45. Giorgi, S.; Lavagna, M.; Campioli, A. Guidelines for Effective and Sustainable Recycling of Construction and Demolition Waste. In Designing Sustainable Technologies, Products and Policies: From Science to Innovation; Benetto, E., Gericke, K., Guiton, M., Eds.; Springer International Publishing: Cham, Switzerland, 2018; pp. 211–221. [Google Scholar]
  46. HM Government. Environmental Taxes, Reliefs and Schemes for Businesses. Available online: https://www.gov.uk/green-taxes-and-reliefs/aggregates-levy (accessed on 12 December 2018).
  47. Bleischwitz, R. Towards a resource policy—Unleashing productivity dynamics and balancing international distortions. Miner. Econ. 2012, 24, 135–144. [Google Scholar] [CrossRef]
  48. Coelho, A.; de Brito, J. Economic viability analysis of a construction and demolition waste recycling plant in Portugal—Part I: Location, materials, technology and economic analysis. J. Clean. Prod. 2013, 39, 338–352. [Google Scholar] [CrossRef]
  49. Mulley, C.; Ma, L.; Clifton, G.; Yen, B.; Burke, M. Residential property value impacts of proximity to transport infrastructure: An investigation of bus rapid transit and heavy rail networks in Brisbane, Australia. J. Transp. Geogr. 2016, 54, 41–52. [Google Scholar] [CrossRef]
  50. Strømann-Andersen, J.; Sattrup, P.A. The urban canyon and building energy use: Urban density versus daylight and passive solar gains. Energy Build. 2011, 43, 2011–2020. [Google Scholar] [CrossRef]
  51. Steemers, K. Energy and the city: Density, buildings and transport. Energy Build. 2003, 35, 3–14. [Google Scholar] [CrossRef]
  52. Tronchin, L.; Manfren, M.; Nastasi, B. Energy efficiency, demand side management and energy storage technologies—A critical analysis of possible paths of integration in the built environment. Renew. Sustain. Energy Rev. 2018, 95, 341–353. [Google Scholar] [CrossRef]
  53. Norman, J.; MacLean, H.L.; Kennedy, C.A. Comparing High and Low Residential Density: Life-Cycle Analysis of Energy Use and Greenhouse Gas Emissions. J. Urban Plan. Dev. 2006, 132, 10–21. [Google Scholar] [CrossRef]
  54. Cuéllar-Franca, R.M.; Azapagic, A. Environmental impacts of the UK residential sector: Life cycle assessment of houses. Build. Environ. 2012, 54, 86–99. [Google Scholar] [CrossRef]
  55. Stephan, A.; Crawford, R.H.; de Myttenaere, K. Towards a comprehensive life cycle energy analysis framework for residential buildings. Energy Build. 2012, 55, 592–600. [Google Scholar] [CrossRef] [Green Version]
  56. Stephan, A.; Crawford, R.H.; de Myttenaere, K. Towards a more holistic approach to reducing the energy demand of dwellings. Procedia Eng. 2011, 21, 1033–1041. [Google Scholar] [CrossRef]
  57. Anderson, J.E.; Wulfhorst, G.; Lang, W. Energy analysis of the built environment—A review and outlook. Renew. Sustain. Energy Rev. 2015, 44, 149–158. [Google Scholar] [CrossRef]
  58. Dell’Olio, L.; Ibeas, A.; Cecín, P. Modelling user perception of bus transit quality. Transp. Policy 2010, 17, 388–397. [Google Scholar] [CrossRef]
  59. De Oña, J.; de Oña, R.; Calvo, F.J. A classification tree approach to identify key factors of transit service quality. Expert Syst. Appl. 2012, 39, 11164–11171. [Google Scholar] [CrossRef] [Green Version]
  60. Schmid, B.; Schmutz, S.; Axhausen, K.W. Explaining mode choice, taste heterogeneity, and cost sensitivity in a post-car world. In Proceedings of the 95th Annual Meeting of the Transportation Research Board, Washington, DC, USA, 10–14 January 2016. [Google Scholar]
  61. Stradling, S. Determinants of Car Dependence. In Threats from Car Traffic to the Quality of Urban Life; Garling, T., Steg, L., Eds.; Emerald Group Publishing Limited: New York, NY, USA, 2007; pp. 187–204. [Google Scholar]
  62. Chen, C.; Gong, H.; Paaswell, R. Role of the built environment on mode choice decisions: Additional evidence on the impact of density. Transportation 2008, 35, 285–299. [Google Scholar] [CrossRef]
  63. Friman, M.; Fellesson, M. Service supply and customer satisfaction in public transportation: The quality paradox. J. Public Transp. 2009, 12, 57–69. [Google Scholar] [CrossRef]
  64. Menichetti, D.; Vuren, T.V. Modelling a low-carbon city. Proc. Inst. Civ. Eng. Transp. 2011, 164, 141–151. [Google Scholar] [CrossRef]
  65. Environment Agency (Abu Dhabi). Greenhouse Gas Inventory for Abu Dhabi Emirate—Inventory Results Executive Summary; Environment Agency (Abu Dhabi): Abu Dhabi, UAE, 2012; p. 25.
  66. Al Tayer, S.M. UAE is committed to reducing carbon footprint. In Khaleej Times; Galadari Printing and Publishing LLC: Dubai, UAE, 2018. [Google Scholar]
  67. Liu, F.; Xu, R.; Fan, W.; Jiang, Z. Data analytics approach for train timetable performance measures using automatic train supervision data. IET Intell. Transp. Syst. 2018, 12, 568–577. [Google Scholar] [CrossRef]
  68. IPCC. Climate Change 2007: The Physical Science Basis. Contribution of Working Group I, II and III to the Fourth Assessment Report of the IPCC; Pachauri, R.K., Reisinger, A., Core Writing Team, Eds.; Intergovernmental Panel on Climate Change: Geneva, Switzerland, 2008; p. 104. [Google Scholar]
  69. Hasan, U.; Chegenizadeh, A.; Budihardjo, M.A.; Nikraz, H. Experimental Evaluation of Construction Waste and Ground Granulated Blast Furnace Slag as Alternative Soil Stabilisers. Geotech. Geol. Eng. 2016, 34, 1707–1722. [Google Scholar] [CrossRef]
  70. Hasan, U.; Chegenizadeh, A.; Budihardjo, M.A.; Nikraz, H. Shear Strength Evaluation Of Bentonite Stabilised With Recycled Materials. J. GeoEng. 2016, 11, 59–73. [Google Scholar]
  71. Hasan, U.; Chegenizadeh, A.; Nikraz, H. Nanotechnology Future and Present in Construction Industry: Applications in Geotechnical Engineering. In Advanced Research on Nanotechnology for Civil Engineering Applications; IGI Global: Hershey, PA, USA, 2016; pp. 141–179. [Google Scholar]
  72. Ponte, C.; Melo, H.P.M.; Caminha, C.; Andrade, J.S., Jr.; Furtado, V. Traveling heterogeneity in public transportation. EPJ Data Sci. 2018, 7, 42. [Google Scholar] [CrossRef]
  73. Agrawal, R.; Imieliński, T.; Swami, A. Mining association rules between sets of items in large databases. In Proceedings of the ACM SIGMOD International Conference on Management of Data, Washington, DC, USA, 25–28 March 1993; pp. 207–216. [Google Scholar]
  74. Agrawal, R.; Srikant, R. Fast algorithms for mining association rules. In Proceedings of the 20th Very Large Data Bases (VLDB) Conference, Santiago de Chile, Chile, 12–15 September 1994; Bocca, J.B., Jarke, M., Zaniolo, C., Eds.; Morgan Kaufmann Publishers Inc.: San Francisco, CA, USA, 1994; pp. 487–499. [Google Scholar]
  75. Nahar, J.; Imam, T.; Tickle, K.S.; Chen, Y.-P.P. Association rule mining to detect factors which contribute to heart disease in males and females. Expert Syst. Appl. 2013, 40, 1086–1093. [Google Scholar] [CrossRef]
  76. Hu, L.; Zhuo, G.; Qiu, Y. Application of Apriori Algorithm to the Data Mining of the Wildfire. In Proceedings of the 2009 Sixth International Conference on Fuzzy Systems and Knowledge Discovery, Tianjin, China, 14–16 August 2009; pp. 426–429. [Google Scholar]
  77. Pande, A.; Abdel-Aty, M. Discovering indirect associations in crash data through probe attributes. Transp. Res. Rec. J. Transp. Res. Board 2008, 2083, 170–179. [Google Scholar] [CrossRef]
  78. Tan, P.-N.; Kumar, V.; Srivastava, J. Selecting the right objective measure for association analysis. Inf. Syst. 2004, 29, 293–313. [Google Scholar] [CrossRef] [Green Version]
  79. Nosratabadi, H.E.; Pourdarab, S.; Nadali, A.; Khalilinezhad, M. Evaluating discovered rules from association rules mining based on interestingness measures using fuzzy expert system. In Proceedings of the Fourth International Conference on the Applications of Digital Information and Web Technologies (ICADIWT 2011), Stevens Point, WI, USA, 4–6 August 2011; pp. 112–117. [Google Scholar]
  80. Ma, W.-M.; Wang, K.; Liu, Z.-P. Mining potentially more interesting association rules with fuzzy interest measure. Soft Comput. 2011, 15, 1173–1182. [Google Scholar] [CrossRef]
  81. Wu, X.; Zhang, C.; Zhang, S. Efficient mining of both positive and negative association rules. ACM Trans. Inf. Syst. 2004, 22, 381–405. [Google Scholar] [CrossRef] [Green Version]
  82. Cherchi, E.; Cirillo, C.; de Dios Ortúzar, J. Modelling correlation patterns in mode choice models estimated on multiday travel data. Transp. Res. Part A Policy Pract. 2017, 96, 146–153. [Google Scholar] [CrossRef]
  83. Arbabi, H.; Mayfield, M. Urban and Rural—Population and Energy Consumption Dynamics in Local Authorities within England and Wales. Buildings 2016, 6, 34. [Google Scholar] [CrossRef]
  84. AECOM. Working Paper No. 1: Task 3 Review and Recommendations on the Proposed Travel Surveys; Abu Dhabi Department of Transport: Abu Dhabi, UAE, 2015; p. 94.
  85. Osborne, J.W. Conceptual and Practical Introduction to Testing Assumptions and Cleaning Data for Logistic Regression. In Best Practices in Logistic Regression; SAGE Publications: Thousand Oaks, CA, USA, 2014; p. 488. [Google Scholar]
  86. Shaheen, M.; Shahbaz, M. An Algorithm of Association Rule Mining for Microbial Energy Prospection. Sci. Rep. 2017, 7, 46108. [Google Scholar] [CrossRef]
  87. Bachman, W.; Katzev, R. The effects of non-contingent free bus tickets and personal commitment on urban bus ridership. Transp. Res. Part A Gen. 1982, 16, 103–108. [Google Scholar] [CrossRef]
  88. Savage, I. The dynamics of fare and frequency choice in urban transit. Transp. Res. Part A Policy Pract. 2010, 44, 815–829. [Google Scholar] [CrossRef]
  89. Tirachini, A. Estimation of travel time and the benefits of upgrading the fare payment technology in urban bus services. Transp. Res. Part C Emerg. Technol. 2013, 30, 239–256. [Google Scholar] [CrossRef]
  90. Tirachini, A.; Hensher, D.A.; Rose, J.M. Multimodal pricing and optimal design of urban public transport: The interplay between traffic congestion and bus crowding. Transp. Res. Part B Methodol. 2014, 61, 33–54. [Google Scholar] [CrossRef] [Green Version]
  91. Wang, T.; Chen, C. Attitudes, mode switching behavior, and the built environment: A longitudinal study in the Puget Sound Region. Transp. Res. Part A Policy Pract. 2012, 46, 1594–1607. [Google Scholar] [CrossRef]
  92. Horner, M.W.; Mefford, J.N. Examining the Spatial and Social Variation in Employment Accessibility: A Case Study of Bus Transit in Austin, Texas. In Access to Destinations; Emerald Group Publishing Limited: New York, NY, USA, 2005; pp. 193–214. [Google Scholar]
  93. Currie, G.; De Gruyter, C. Exploring links between the sustainability performance of urban public transport and land use in international cities. J. Transp. Land Use 2018, 11, 325–342. [Google Scholar] [CrossRef]
  94. Kennedy, C.; Miller, E.; Shalaby, A.; Maclean, H.; Coleman, J. The Four Pillars of Sustainable Urban Transportation. Transp. Rev. 2005, 25, 393–414. [Google Scholar] [CrossRef]
  95. Abu Dhabi Government. Abu Dhabi Emirate: Facts and Figures. Available online: https://www.abudhabi.ae/portal/public/en/abu-dhabi-emirate/abu-dhabi-emirate-facts-and-figures;jsessionid=zKnROF_msRJQoP3Lu22DJzCLFXxFVXf5ED6y_2KpOCR0wIG8-4k7!496354345!-733067616!1541108424678 (accessed on 2 November 2018).
  96. Flint, S. Living in: Abu Dhabi. Available online: http://www.bbc.com/travel/story/20131203-living-in-abu-dhabi (accessed on 2 November 2018).
  97. Hensher, D.A.; Stopher, P.; Bullock, P. Service quality––Developing a service quality index in the provision of commercial bus contracts. Transp. Res. Part A Policy Pract. 2003, 37, 499–517. [Google Scholar] [CrossRef]
  98. Redman, L.; Friman, M.; Gärling, T.; Hartig, T. Quality attributes of public transport that attract car users: A research review. Transp. Policy 2013, 25, 119–127. [Google Scholar] [CrossRef]
  99. Sottile, E.; Cherchi, E.; Meloni, I. Measuring Soft Measures Within a Stated Preference Survey: The Effect of Pollution and Traffic Stress on Mode Choice. Transp. Res. Procedia 2015, 11, 434–451. [Google Scholar] [CrossRef] [Green Version]
  100. Santos, G.; Bhakar, J. The impact of the London congestion charging scheme on the generalised cost of car commuters to the city of London from a value of travel time savings perspective. Transp. Policy 2006, 13, 22–33. [Google Scholar] [CrossRef] [Green Version]
  101. Trigaux, D.; Wijnants, L.; De Troyer, F.; Allacker, K. Life cycle assessment and life cycle costing of road infrastructure in residential neighbourhoods. Int. J. Life Cycle Assess. 2017, 22, 938–951. [Google Scholar] [CrossRef]
  102. Kuo, Y. Using simulated annealing to minimize fuel consumption for the time-dependent vehicle routing problem. Comput. Ind. Eng. 2010, 59, 157–165. [Google Scholar] [CrossRef]
  103. Biswas, W.K.; Thompson, B.C.; Islam, M.N. Environmental life cycle feasibility assessment of hydrogen as an automotive fuel in Western Australia. Int. J. Hydrogen Energy 2013, 38, 246–254. [Google Scholar] [CrossRef]
  104. Nguyen-Phuoc, D.Q.; Currie, G.; De Gruyter, C.; Young, W. How do public transport users adjust their travel behaviour if public transport ceases? A qualitative study. Transp. Res. Part F Traffic Psychol. Behav. 2018, 54, 1–14. [Google Scholar] [CrossRef]
  105. Nobis, C. Multimodality: Facets and Causes of Sustainable Mobility Behavior. Transp. Res. Rec. J. Transp. Res. Board 2007, 2010, 35–44. [Google Scholar] [CrossRef]
  106. Thøgersen, J. Promoting public transport as a subscription service: Effects of a free month travel card. Transp. Policy 2009, 16, 335–343. [Google Scholar] [CrossRef]
  107. Hrelja, R. Integrating transport and land-use planning? How steering cultures in local authorities affect implementation of integrated public transport and land-use planning. Transp. Res. Part A Policy Pract. 2015, 74, 1–13. [Google Scholar] [CrossRef] [Green Version]
  108. Rowe, D.H.; Christine Bae, C.H.; Shen, Q. Evaluating the Impact of Transit Service on Parking Demand and Requirements. Transp. Res. Rec. 2011, 2245, 56–62. [Google Scholar] [CrossRef]
  109. Chien, S.I.; Qin, Z. Optimization of bus stop locations for improving transit accessibility. Transp. Plan. Technol. 2004, 27, 211–227. [Google Scholar] [CrossRef]
  110. Heinen, E.; Chatterjee, K. The same mode again? An exploration of mode choice variability in Great Britain using the National Travel Survey. Transp. Res. Part A Policy Pract. 2015, 78, 266–282. [Google Scholar] [CrossRef]
  111. Milakis, D.; Cervero, R.; Van Wee, B. Stay local or go regional? Urban form effects on vehicle use at different spatial scales: A theoretical concept and its application to the San Francisco Bay Area. J. Transp. Land Use 2015, 8, 59–86. [Google Scholar] [CrossRef]
  112. Yao, B.; Hu, P.; Lu, X.; Gao, J.; Zhang, M. Transit network design based on travel time reliability. Transp. Res. Part C Emerg. Technol. 2014, 43, 233–248. [Google Scholar] [CrossRef]
  113. Kingham, S.; Dickinson, J.; Copsey, S. Travelling to work: Will people move out of their cars. Transp. Policy 2001, 8, 151–160. [Google Scholar] [CrossRef]
  114. Eriksson, L.; Friman, M.; Gärling, T. Stated reasons for reducing work-commute by car. Transp. Res. Part F Traffic Psychol. Behav. 2008, 11, 427–433. [Google Scholar] [CrossRef]
  115. Thøgersen, J.; Møller, B. Breaking car use habits: The effectiveness of a free one-month travelcard. Transportation 2008, 35, 329–345. [Google Scholar] [CrossRef]
  116. Trépanier, M.; Habib, K.M.N.; Morency, C. Are transit users loyal? Revelations from a hazard model based on smart card data. Can. J. Civ. Eng. 2012, 39, 610–618. [Google Scholar] [CrossRef]
Figure 1. Definition of “meaningfulness measure” to filter repetitive set of rules.
Buildings 09 00001 g001
Figure 2. Conceptual framework of the proposed algorithm to mine a travel dataset.
Buildings 09 00001 g002
Figure 3. Proposed data mining algorithm for a travel dataset analysis of 1,520 questionnaires.
Buildings 09 00001 g003
Figure 4. Filtration results of different phases in a collected travel dataset based on the developed algorithm.
Buildings 09 00001 g004
Figure 5. Importance index values for the phase III association rules of satisfaction and frequency criteria.
Buildings 09 00001 g005
Table 1. Bus routes selected for the purpose of study.
Outer-Urban or Suburban RoutesRoute Number
Al Mina Souq ↔ Khalifa Park056
Petroleum Institute ↔ Tourist Club Municipality054
Abu Dhabi Courts ↔ Al Marina034
Downtown City and Urban RoutesRoute Number
Al Mina Fish Harbour ↔ Al Marina Mall011
Al Mina Souq ↔ Al Marina Mall009
Al Mina Road Tourist Club ↔ Al Marina008
Tourist Club Municipality ↔ Al Marina007
Al Mina ISC and Tourist Club ↔ Ras Al Akhdhar006
Table 2. Predictors of modal variability and service perception from association rules passing ordinal regression performance test.
RulesPredictor VariablesOdds RatioResponse Variable CategoryModel χ2 ***– 2LL Group
1Employed full-time
Willingness to pay more for seat
6.71***
0.47***
Bus travel > 2 times a week72.6872.68PS
25–15 min to bus stop
No cars
2.22**
1.86*
Bus travel > 2 times a week67.1867.18PS
1Car/taxi is inexpensive
Weekday
1.30*
0.27***
Once a week by car140.071.54OMD
1Living near friends & family is important
Car/taxi is inexpensive
0.47***
0.85*
First time by bus39.9646.46EI
2Buses are crowded
5–15 min to bus stop
2.04***
2.21**
First time by bus57.4141.62EI
1Male
Bus travel is easy
14.1***
1.27*
Very satisfied with frequency of bus42.4857.41Good LoS
2Very satisfied with network coverage
Very Satisfied with quality of ride
2.88*
2.67**
Very satisfied with frequency of bus352.27167.16Good LoS
3Very satisfied with frequency of buses7.49***Very satisfied with network coverage354.67140.07Good LoS
4Male
Employed full-time
Bus travel is easy
6.06**
5.61**
1.30*
Satisfied with network coverage39.23139.62Good LoS
5Satisfied with journey time13.22***Satisfied with network coverage214.1442.48Good LoS
1Neutral on network coverage7.08***Neutral on frequency of buses348.09140.74Borderline LoS
2Willingness to pay more for seat
5–15 min to bus stop
1.87***
0.56*
Neutral on network coverage47.70352.27Borderline LoS
1Car/taxi is inexpensive
Buses are crowded
0.53***
1.62***
Dissatisfied with frequency of bus38.145155.53Bad LoS
2Dissatisfied with frequency of buses10.45***Dissatisfied with network coverage354.67385.31Bad LoS
1Satisfied with frequency of buses9.65***Satisfied with quality of ride164.7938.15Good VfM
2FBT 5 or more times a week
Employed full-time
Weekday
6.72***
3.66***
3.69***
Very satisfied with level of fare671.05214.14Good VfM
3Very Satisfied with quality of ride2.86***Very satisfied with level of fare97.0247.71Good VfM
4Employed full-time
Car/taxi is inexpensive
3.48***
1.24*
Very satisfied with level of fare54.11354.67Good VfM
5Satisfied with journey time
Employed full-time
3.68**
6.36***
Satisfied with level of fare66.0926.66Good VfM
1Neutral on network coverage3.89***Neutral on quality of ride210.79354.67Borderline VfM
2Neutral on frequency of buses8.48***Neutral on quality of ride164.7939.23Borderline VfM
3Employed full-time
Willingness to pay more for seat
4.95**
1.16*
Neutral on level of fare62.227.68Borderline VfM
1Dissatisfied with bus-station
5–15 min to bus stop
14.3***
2.68***
Dissatisfied with quality of ride288.1621.18Bad VfM
2Willingness to pay more for seat
Delayed by traffic congestion
Weekend
0.71**
0.75*
0.04***
Very dissatisfied with level of fare632.49164.80Bad VfM
PS = pro-sustainability, OMD = occasional multimodal travellers, FrCT = frequent car travellers, EI = environmentally insensitive, LoS = level of service, VfM = value for money. * p < 0.05 , * * 0.001 p < 0.01 , * * * p < 0.001 . † difference in -2 log likelihood of final model and null model.
Table 3. Validated association rules for interdependency of studied transit-related variables ††.
RulesAntecedent ConsequentGroupSupportConfidenceInterest
1>5 times/week by bus, Weekday, No carsFirst time by carPS0.5260.8370.493
2Work-related commute, Employed full-time>5 times/week by busPS0.3890.7020.215
3Residential apartment, 5–15 minto bus stop>5 times/week by busPS0.3800.7050.115
4No driving license, Living near friends & family is important2–4 times/week by busPS0.2060.7240.076
1Cash ticket, No driving license, Pay seat, Buses are crowded1–3 times/month by busOMD0.3190.6810.295
2Male, No driving license, No delays by traffic congestion1–3 times/month by busOMD0.2910.6620.264
3Work commute, Employed full-time, Weekday1–3 times/month by carOMD0.1980.8500.160
4Male, Employed full-time, 5–15 minto bus stop, WeekdayLess often by carOMD0.2390.6330.113
1Employed full-time, Buses are crowded, WeekdayOnce a week by carFrCT0.4410.8570.422
225–34 years old, Weekday, Employed full-timeOnce a week by carFrCT0.3100.7250.291
3Work commute, Employed full-time, Pay for seatOnce a week by carFrCT0.2960.7910.282
4No delays by traffic congestion, WeekdayOnce a week by carFrCT0.2350.8840.213
5Male, Willing to pay more for seatLess often by busFrCT0.2510.8260.201
1Cash ticket, Satisfied with level of fare, 5–15 minto bus stop>5 times/week by carEI0.2210.8300.214
1Very satisfied with journey time, Employed full-timeVery satisfied with frequency of busesGood LoS0.4670.7560.406
2Very satisfied with network coverage, No carsVery satisfied with frequency of busesGood LoS0.4320.8350.376
3Very satisfied with journey time, MaleVery satisfied with network coverageGood LoS0.4170.8830.357
4Very satisfied with quality of ride, MaleVery satisfied with network coverageGood LoS0.3940.8540.329
5Satisfied with quality of ride, MaleSatisfied with frequency of busesGood LoS0.4110.8290.217
6Male, 5–15 minto bus stopVery satisfied with network coverageGood LoS0.3420.7520.185
7Living near friends & family important, Bus travel is easySatisfied with network coverageGood LoS0.3520.7730.158
8Male, Cash ticket, No delays by traffic congestionVery satisfied with network coverageGood LoS0.2470.7300.111
9Rent under 10,000 AED per annumVery satisfied with frequency of busesGood LoS0.2060.6280.094
1Employed full-time, Living near work important, No carsNeutral on frequency of busesBorderline LoS0.3620.6600.260
2No driving license, Employed full-time, No carsNeutral on frequency of busesBorderline LoS0.2580.6070.148
1Work commute, Male, Living near work important, WeekdayVery dissatisfied with frequency of busesBad LoS0.1690.7150.164
1>5 times/week by bus, Cash ticket, Employed full-timeSatisfied with level of fareGood VfM0.5180.9370.354
2Very satisfied with quality of rideVery satisfied with level of fareGood VfM0.4000.7700.335
3Cash ticket, Employed full-time, WeekdayVery satisfied with level of fareGood VfM0.2490.7990.165
4Satisfied with journey time, MaleSatisfied with quality of rideGood VfM0.3510.8810.163
5Living near friends & family is important, No carsSatisfied with quality of rideGood VfM0.3690.8260.105
6Bus travel is easy, No carsVery satisfied with quality of rideGood VfM0.2700.8320.103
7South Asian, Weekend, Cash ticketSatisfied with level of fareGood VfM0.3070.8190.091
1No driving license, 5–15 minto bus stop, No carsNeutral on quality of rideBorderline VfM0.2680.7360.188
2Buses are crowded, Cash ticketNeutral on level of fareBorderline VfM0.2780.7420.159
1Cash ticket, Employed full-time, WeekendDissatisfied with level of fareBad VfM0.4270.8770.403
2Cash ticket, Dissatisfied with bus-stationDissatisfied with quality of rideBad VfM0.2660.9220.262
3Cash ticket, Neutral on journey time, WeekendVery dissatisfied with quality of rideBad VfM0.1880.7390.186
†† The reported confidence, support and lift are based upon the original observations in the training dataset. Some values are rounded-off.

