Article

Experimental Investigation on Engineering Properties of Concrete Incorporating Reclaimed Asphalt Pavement and Rice Husk Ash

by
Mulusew Aderaw Getahun
1,2,*,
Stanley Muse Shitote
3 and
Zachary C. Abiero Gariy
4
1
Civil Engineering Department, Pan African University Institute for Basic Sciences, Technology and Innovation (PAUSTI), 62000 00200 Nairobi, Kenya
2
Ethiopian Roads Authority, Addis Ababa 1770, Ethiopia
3
Civil Engineering Department, Rongo University, Rongo 103-40404, Kenya
4
Civil Engineering Department, Jomo Kenyatta University of Agriculture and Technology (JKUAT), Nairobi 5505, 00100, Kenya
*
Author to whom correspondence should be addressed.
Buildings 2018, 8(9), 115; https://doi.org/10.3390/buildings8090115
Submission received: 11 June 2018 / Revised: 5 July 2018 / Accepted: 9 July 2018 / Published: 23 August 2018

Abstract

:
Waste generation from agricultural and construction industries is growing at an upsetting rate that causes a heavy burden on landfill facilities. On the other hand, the construction industry is exhausting natural resources thereby posing environmental problems. This study investigates the potential use of agro-industrial waste such as rice husk ash (RHA) and construction waste like reclaimed asphalt pavement (RAP) as promising construction materials. The durability and physical and mechanical properties of concrete were assessed by partially replacing cement and virgin aggregates with RHA and RAP, up to 20% and 50%, respectively. A total of 22 mixes were studied, twelve of which were devoted to studying the collective effects of RHA and RAP on the engineering properties of concrete. Based on experimental results, RHA and RAP decreased slump, compacting factor, density, water absorption and sorptivity. RHA increased compressive and tensile splitting strength, whereas RAP decreased compressive and tensile splitting strength. Comparable strength and favorable sorptivity values were obtained when 15% RHA was combined with up to 20% RAP in the concrete mix. Thus, utilizing RHA and RAP as concrete ingredients can contribute to solid waste management, engineering and economic benefits.

1. Introduction

The construction industry consumes about 40% of the global energy; is the largest global consumer of raw materials; and is responsible for 25–40% of the world’s total CO2 emissions and 28% of solid waste in the form of construction debris [1]. Over 10 billion tons of Portland cement concrete (PCC) is produced annually worldwide due to its versatility, durability and sustainability [2,3]. However, its production consumes a substantial amount of energy and raw materials. The cement production alone is both energy and resource intensive. It was attested that every ton of cement production consumes about 4 GJ of energy and 1.7 tons of raw materials and releases approximately 0.73–0.99 ton of CO2 [2,4,5,6,7]. Moreover, PCC production consumes more than 8 billion tons of aggregates each year [6]. Consequently, an increasing demand for concrete will continue reducing natural stone deposits significantly thereby poses a threat on the environment [7,8,9].
Concurrently, a substantial quantity of construction and agro-industrial solid wastes disposal is posing a huge threat to the environment [10,11,12]. For example, road maintenance and rehabilitation activities have been generating a large amount of valuable asphalt pavement materials that are either discarded along the generation point or hauled off to the disposal site [13,14,15].
Similarly, according to the FAO 2017 [16] report, the global paddy production in 2017 was forecasted to amount to 756.7 million tons. Assuming annual rice production remains the same, 254.5 million tons of rice husks is available for disposal every year worldwide. Thus, agro-industrial solid waste disposal is another serious concern unless we find a preferred alternative use.
In order to curb these concerns, the cement and concrete industry could be an ideal home for construction and industrial wastes. Recently, waste materials such as crushed concrete, asphalt pavement and crushed glasses are some of the recycled materials which have been used as a coarse and/or fine aggregate in concrete production [17,18]. In addition, numerous researches devoted to find alternatives for cement replacement [19,20,21,22,23]. Thus, utilizing RAP and rice RHA as aggregate and cement partial replacements, respectively, is in harmony with this approach.
The concern on how to use RAP has gained a remarkable curiosity in the United States due to the increasing demand for sustainable construction materials use [24]. But, in underdeveloped and developing countries where recycling materials is not a culture, a tremendous amount of RAP and RHA materials are usually discarded in landfills [13].
Previous studies [25,26,27,28] revealed and consistently reported that utilizing RAP in PCC caused reductions in compressive, flexural, and tensile splitting strength compared to PCC containing virgin aggregates. The findings from past studies showed that the decrease in strength of PCC containing RAP was largely instigated by the effects of porosity in the interfacial transition zone (ITZ) and preferential asphalt cohesion failure [29,30,31] However, previous studies [27,28,29,30] exhibited that concrete containing RAP had better ductility, toughness and fracture properties compared to normal concrete. Huang et al. [26] reported that RAP could initiate crack propagation and lead to the formation of a prolonged crack pattern allied to the higher dissipation of energy. Hence, there is a need to improve the strength of concrete containing RAP in order to maximize the utilization of RAP materials in construction applications.
RHA was found to enhance the concrete properties by filler and pozzolanic effects [12,32]. The enhancement in strength is believed to be an advantage from the high silica content of RHA, which, in itself, possesses little cementitious value, but when calcium hydroxide reacts with RHA in the presence of water, a cementitious complex is formed [33]. The hydration of tricalcium silicate (C3S) gives 61% calcium-silicate-hydrate (C-S-H) and 39% calcium hydroxide; the hydration of dicalcium silicate (C2S) results in 82% C-S-H and 18% calcium hydroxide, where up to 15% of the weight of Portland cement is hydrated lime [34]. Calcium hydroxide has no contribution to concrete strength, but rather has detrimental effects on the durability of concrete. Thus, RHA can provide an opportunity to alter the free lime (Calcium hydroxide) to a C-S-H gel that makes the concrete strong [35].
Therefore, the main objective of this study was to investigate the collective effects of RHA and RAP on the physical and mechanical properties of concrete. The engineering properties of RHA-inclusive concrete were assessed in the first phase. Then, the effects of RAP on wet and hardened concrete properties were investigated. Finally, the combined effects of RHA and RAP on engineering properties of concrete were assessed. Thus, utilizing RAP in combination with RHA for concrete production can contribute to engineering benefits, economic savings, solid waste management and environmental protection.

2. Material and Methods

2.1. Materials

Materials used for this study were fine reclaimed asphalt pavement (FRAP), course reclaimed asphalt pavement (CRAP), fine virgin aggregate (FVA), course virgin aggregate (CVA), ordinary Portland cement (OPC) type I, rice husk ash (RHA), water, Sika ViscoCrete 3088 superplasticizer (SVCSP) and Sikament NNG superplasticizer (SNNGSP). Figure 1 depicts aggregates (CRAP, CVA, FRAP, and FVA) and cementitious materials (cement and RHA). All materials were obtained from different parts of Kenya. FVA (river sand) and VCA were purchased from Masinga and Molongo districts of Kenya respectively. The RAP was obtained from an old distressed flexible pavement, Ruaka-Banana-Limuru Road (D407), sampled at the section near Tigoni, Kiambu County of Kenya. The road was constructed about 21 years ago without major rehabilitation. RHA was collected from the dump site of Mwea Rice Milling Factory. Cement and superplasticizers were bought from Bamburi Cement and Sika Kenya Limited respectively. Tap water was used for mixing.

2.2. Methods

The methods adopted and followed for this study are discussed in the subsequent section. The most important test methods are summarized in Table 1.

2.2.1. Test Methods for Material Characterization

Aggregate sampling was carried out in accordance with BS EN 932-1 (1997) [36] requirements to get representative samples for the batch. Grading of the aggregates was determined in line with BS EN 933-1 (2012) [37] procedures using test sieves of the sizes complying with BS ISO 3310-2 (2013) [38]. The RAP material was obtained through ripping and milling of old existing pavement, and then crushed manually and finally sieved using 5 mm sieve in order to separate into FRAP (grain size less than 5 mm) and CRAP (grain size greater than 5 mm). RHA was sieved using 0.10 mm sieve. The specific gravity and water absorption of coarse and fine aggregates were determined as per BS EN 1097-6 (2013) [39]. Bulk density and voids in aggregates were determined in line with the procedures defined in ASTM (2003) [40]. Aggregate crushing and impact tests were performed according to the procedures specified in IS 2386: Part IV (2002) [41].

2.2.2. Mix Design and Mixing Procedures

The mix design for 25 MPa Portland cement concrete (PCC) was done in accordance with BS EN 206 (2014) [42] and BS EN 8500-2 (2012) [43]. A total of 22 mixtures were prepared. Table 2 portrays the particulars of studied mixture proportions. In all the mixtures, 254 kg/m3 of water and water to cementitious material ratio of 0.65 were kept constant. The first phase of the study was replacing cement by 5, 10, 15 and 20% RHA (by weight of cement) to assess the effect of RHA on wet and hardened properties of concrete. In the second phase, FVA and CVA were replaced by 10, 20, 30, 40, and 50% FRAP and CRAP (by weights of FVA and CVA) respectively to ascertain the influence of RAP on the properties of concrete. The third phase was to ascertain the collective effects of RHA and RAP on engineering properties of concrete. SNNGSP was used at 0.5, 0.85, 2, and 2.75% (by weight of cementitious material) for 5, 10, 15, and 20% RHA content respectively. SVCSP (more powerful than SNNGSP) was used at 0.5, 0.7, 0.9, and 1.1% (by weight of cementitious material) for RHA and RAP combined mixtures. Manual mixing was performed as per BS EN 1881-125 (2013) [44] with a control mechanism to prevent the loss of cementitious materials and water quantified during mixture proportioning. The chemical analysis of cement and RHA were conducted as per BS EN 196-2 (2013) [45] test method. The specific gravities of cement and RHA were done in accordance with ASTM C188 (2016) [46].

2.2.3. Test Methods for Fresh Concrete Properties

Fresh concrete properties were assessed by conducting slump, compacting factor, and fresh density tests. Three replicate specimens were prepared for each test. Sampling for testing was done in accordance with procedures stipulated in BS EN 12350-1 (2009) [47]. Slump, compacting factor and fresh density was determined in accordance the procedures specified in BS EN 12350-2 (2009) [48], BS 1881-103 (1993) [49], and BS EN 12350-6 (2009) [50] respectively.

2.2.4. Test Methods for Hardened Concrete Properties

Cubes of dimensions 100 mm × 100 mm × 100 mm and cylinders with a diameter of 100 mm and 200 mm long conforming to BS EN 12390-1 (2012) [51] requirements were used to make concrete specimens for compressive and tensile splitting strength test respectively. A total of 132 cube and 66 cylinder specimens were made and cured in accordance with the methods specified in BS EN 12390-2 (2009) [52] for 7 and 28 days compressive and 28 days tensile splitting strength test respectively. Three replicate specimens were prepared for each test. Compressive and tensile splitting strength of concrete were determined according to BS EN 12390-3 (2009) [53] and BS EN 12390-6 (2009) [54] test method respectively. Specimens were loaded to failure in automatic computerized testing machine conforming to BS EN 12390-4 (2000) [55].
Density, water absorption and void spaces in concrete were determined consistent with ASTM C642 (2013) [56]. Three replicate specimens were prepared for each test. A total of 66 cubes of dimensions 100 mm × 100 mm × 100 mm were made and cured for 28 days. The samples were dried in an oven for 72 h at a temperature of 105 °C until the change in mass was less than 0.5%. Then, the samples were put in the water at an average temperature of 21.5 °C for about 72 h until the increase in saturated surface dried mass was less than 0.5%. Finally, the specimens were placed in a receptacle, covered with tap water, and boiled for 5 h and then cooled by natural loss of heat for 15 h to a final average temperature of 22.5 °C.
Sorptivity by the concrete specimens was determined in accordance with ASTM C1585 (2013) [57] test methods. Three replicate specimens were prepared for each test. A total of 66 cubes of dimensions 100 mm × 100 mm × 100 mm were made and cured for 28 days for the sorptivity test. The specimens were dried in an oven at 110 °C temperature for 24 h and then remained in an oven at a temperature of 50 °C for 3 days. After 3 days, each specimen was placed inside a container and stored at an average temperature of 22 °C for 15 days before the start of the absorption procedure. The specimens were removed from the storage container and the 5 faces of the specimens were sealed properly to deter entrance of moisture while the opposite face left open and exposed to water. The initial weight of the specimens was recorded after sealing and submerged in water about 3.5 mm above the bottom face. The weight gain was determined for each test specimens at interval of time 5, 10, 30 min, 1, 2, 3, 4, 5, and 6 h.

3. Results and Discussion

3.1. Material Characterization

Virgin aggregates (VA) and RAP materials were characterized in terms of gradation, fineness modulus, water absorption, specific gravity, bulk density, void content, ACV, and AIV.

Physical and Mechanical Properties of Materials

The specific gravity, water absorption, bulk density, aggregate crushing value (ACV), aggregate impact value (AIV) of aggregates, among others, are tabulated in Table 3.
Gradation results of coarse and fine aggregates are depicted in Figure 2 and Figure 3 respectively. As can be seen from the figures, the grading of CVA and FVA met the grading requirements of BS 882 (1992) [58].
The grading of CRAP was slightly outside the limits and while that of FRAP was within the limits specified in BS 882. It is apparent from the figure that CRAP was finer than CVA whereas, FRAP was coarser than FVA. Similar findings were reported by previous study [28]. The fineness of CRAP and coarseness of FRA might be attributed to the fragmentation of CRAP materials during crushing and agglomeration of particles respectively and their sources as well. All coarse aggregates used in this study had 19.1 mm nominal maximum aggregate sizes. The fine aggregates particle sizes were between 0.15 and 5 mm. FVA and FRAP had fineness modulus of 2.65 and 3.61 respectively.
RAP materials had lower specific gravity than that of virgin aggregates. This is consistent with the findings by [25]. The lower specific gravity of RAP may be attributed to the substantial amounts of low-density asphalt-mortar coatings on the RAP surfaces and its source as well. The water absorption of RAP was found to be lower than that of VA. The reason might be attributed to the asphalt coating around both coarse and fine RAP that could hinder the maximum possible amount of water which could have been absorbed by the aggregates. RAP materials had lower loose and rodded bulk density than that of virgin aggregates. RAP materials also showed higher void space than that of virgin aggregates which may demand a higher amount of cement paste to fill the total surface area in order to produce quality concrete [35].
The ACV test done on the CRAP exhibited the abnormal result. The test specimen compressed into a single solid mass under loading. This might be due to the presence of asphalt film around RAP might bind the crushed aggregates into a single solid dense mass. The ACV and AIV values of CVA and CRAP were below the maximum limit stipulated in IS 383 (2002) [59]. CRAP had lower ACV and AIV value than that of CVA.
The specific gravity of RHA was less than that of OPC by 35%. The bulk density of RHA was also about 33% of that of OPC. The lower the specific gravity and bulk density of RHA may result in a reduction of concrete density. The maximum particle size of OPC and RHA were 90 and 100 µm respectively. Table 4 depicts the chemical composition of OPC, RHA, FRAP, and FVA.
The sum of the silicon dioxide (SiO2), aluminium oxide (Al2O3) and iron oxide (Fe2O3) contents of RHA was 94.8%; as a result, RHA fulfilled the 70% minimum requirement of BS EN 450-1 (2012) [60] to be used as a good pozzolana. The free calcium oxide (CaO) content was less than the upper bound (1.5%) specified in BS EN 450-1 (2012). This indicates the ability of the RHA to convert the free lime (Calcium hydroxide) to a C-S-H gel [60] that makes the concrete strong. The loss on ignition (LOI) of RHA was greater than that of cement but satisfied the limits specified in BS EN 450-1 (2012) [60]. LOI denotes the amount of unburnt carbon residue in the RHA that is responsible for an increase in water demand [32] which may have an influence on the properties of fresh concrete i.e., could result in low workability. The physical and chemical properties of superplasticizers used in the study are presented in Table 5.

3.2. Fresh and Hardened Properties of Concrete

3.2.1. Fresh Properties of Concrete

Table 6, Table 7 and Table 8 show slump, compaction factor (CF) and density of fresh concrete.
• Slump
From trial mixes, it was observed that RHA caused a dramatic decrease in slump as compared to the control mix. When Sikament NNG SP was added, the slump increased by 23.33% from 60 to 74 mm at 5% RHA and 0.5% SP content. Surprisingly, it was also discovered that as the content of RHA increased, the slump decreased considerably despite increasing the dosages of SP. The slump decreased by 20, 33.33, and 75% from 60 mm to 48, 40, and 15 mm at 10, 15, and 20% RHA content with the addition of 0.85, 2, and 2.75% SP respectively. The high demand for water and the resulted lower slump might be attributed to the large specific surface area and high unburnt carbon content of RHA.
Like that of RHA, the partial replacement of virgin aggregate by RAP resulted in a substantial decrease of slump as compared to the control mix. The slump decreased by 33, 47, 62, 67, and 78% from 60 mm to 40, 32, 23, 20, and 13 mm at 10, 20, 30, 40, and 50% RAP content respectively. The reduction in slump might be attributed to absorption of the mixing water by the fine dust layers around the RAP periphery and water might also be controlled by RAP particle and was not able to move freely and thus, play no role to workability.
The inclusion of both RHA and RAP in the mix found to decrease the slump significantly as expected. However, there was a slight (3%) improvement in the slump when 0.5% Sika ViscoCrete 3088 SP was added to the concrete mix containing (5RHA + 10RAP) % as shown in Table 8. The slump decreased steadily as the RHA and RAP content increased regardless of increasing the SP dosages. This may be attributed to the combined effects of RHA and RAP as already discussed.
• Compaction Factor (CF)
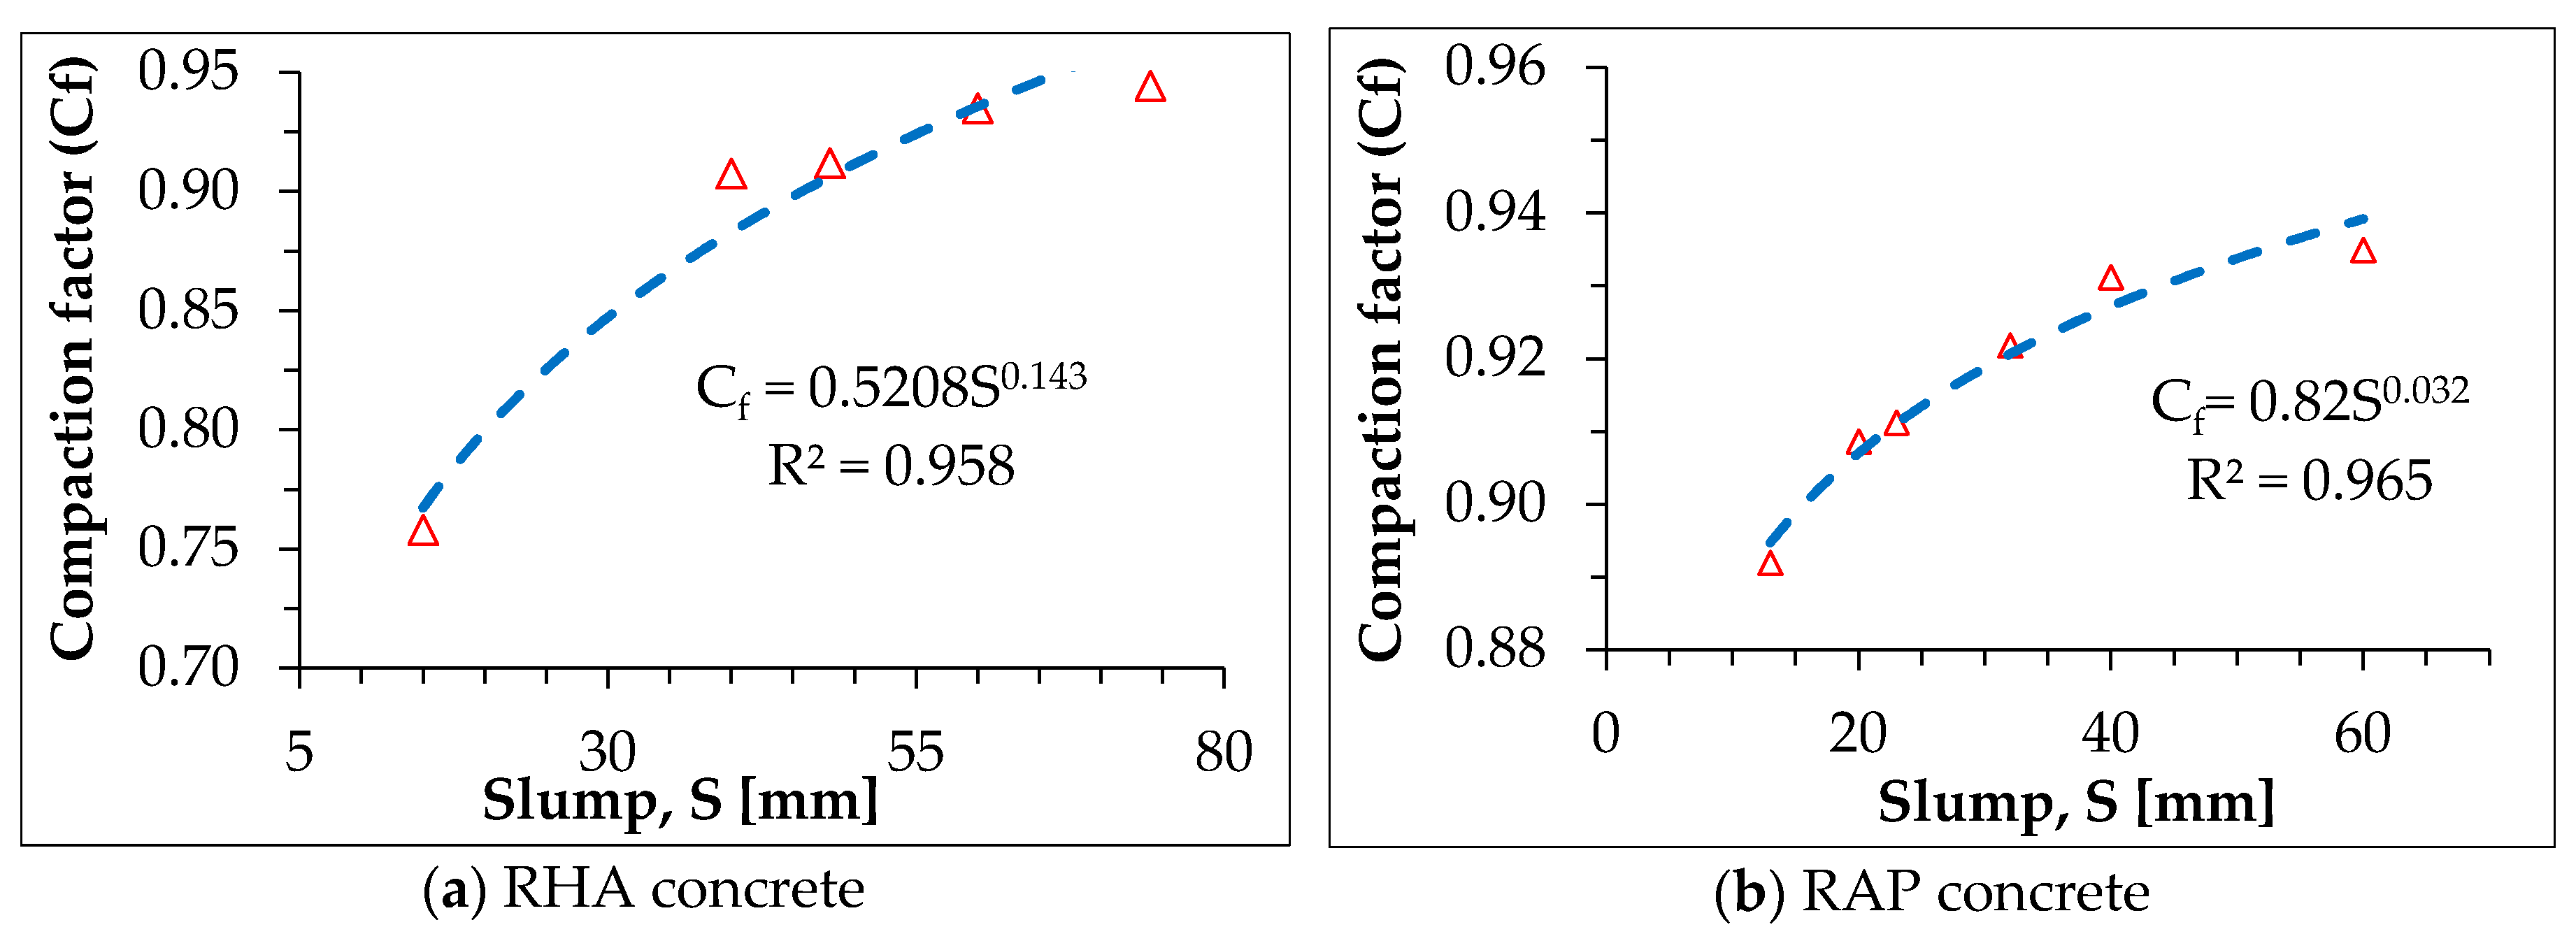
The CF values of the concrete ranged from 0.758 to 0.953 as shown in Table 6, Table 7 and Table 8; these values are within the ranges specified in BS 1881-103 [49]. The CF of RHA-inclusive concrete increased by 1% at 5% RHA content, whereas CF decreased by 19% as the RHA content increased to 20%. Figure 4a and Equation (1) (obtained by regression) show the relationship between slump and compaction factor. R2 and standard error of estimate (SEE) of the model were 0.958 and 0.012 respectively.
Similarly, the CF values of RAP-inclusive concrete decreased by 5% from 0.935 to 0.892 at 50% RAP content relative to the control mix. Figure 4b and Equation (2) (obtained by regression) illustrate the relationship between slump and compaction factor. R2 and SEE of the model were 0.965 and 0.002 respectively.
C f = 0.52 × S 0.143
where: Cf is compacting factor; and S is the slump in mm for fresh RHA concrete
C f = 0.82 × S 0.032
where: Cf is the compacting factor; and S is the slump in mm for fresh RAP concrete
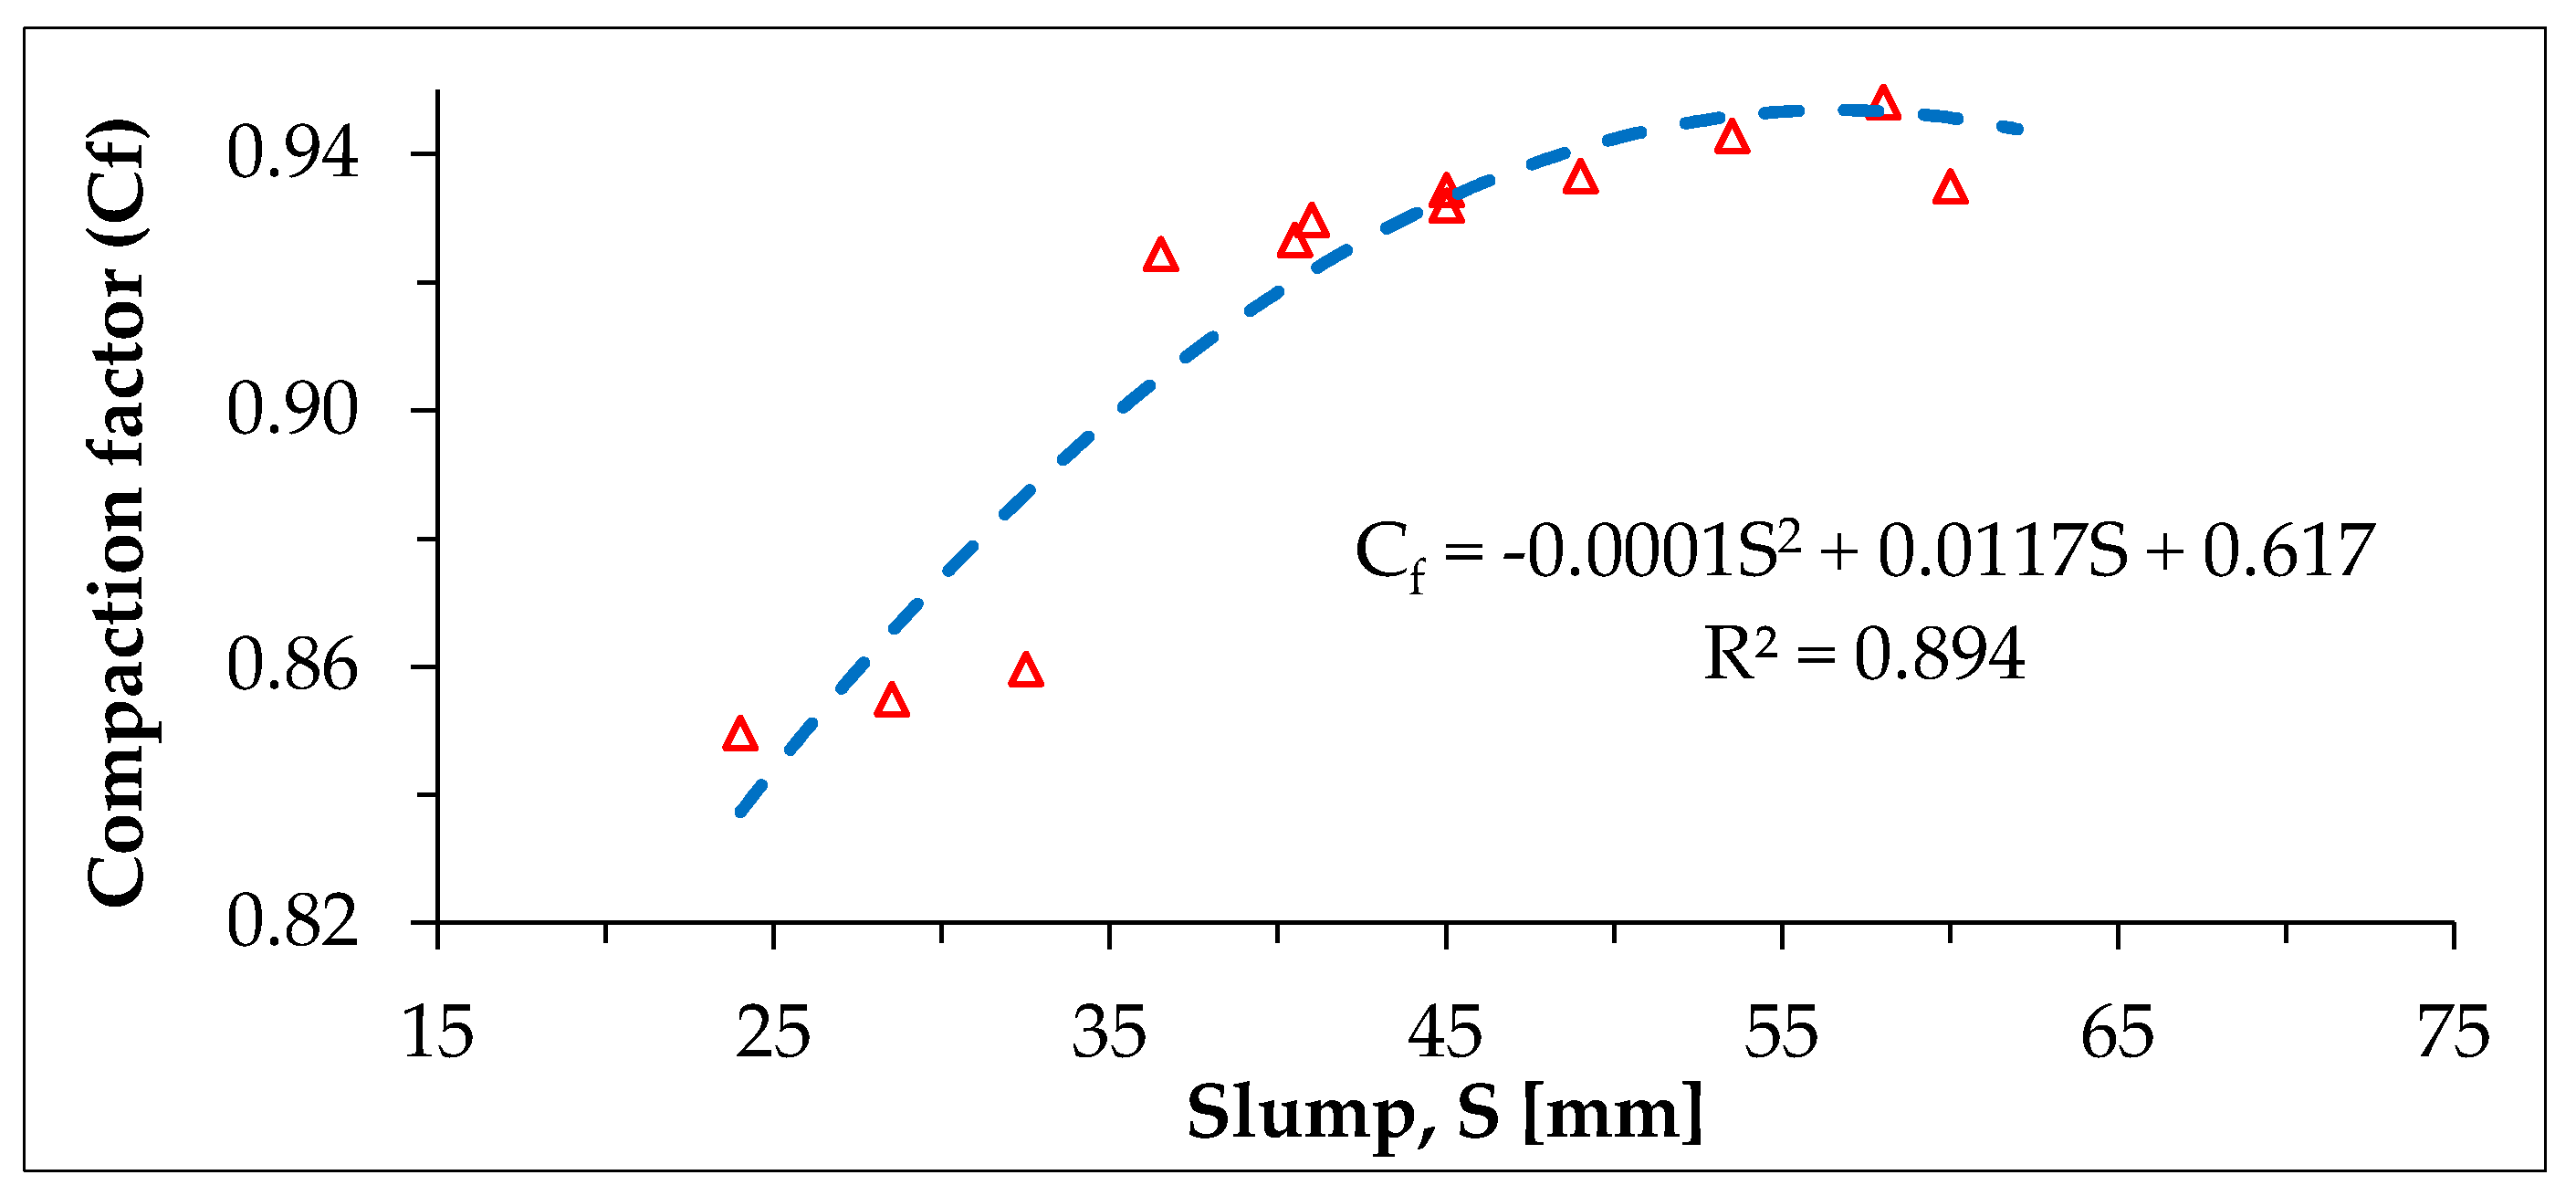
A slight increase was observed in CF values at 5% RHA + (10–30)% RAP content, whereas CF decreased marginally for the remaining mixes. Figure 5 (obtained by regression) depicts the relationship between slump and compaction factor for RHA- and RAP-inclusive concrete. R2 and SEE of the model were 0.894 and 0.013 respectively.
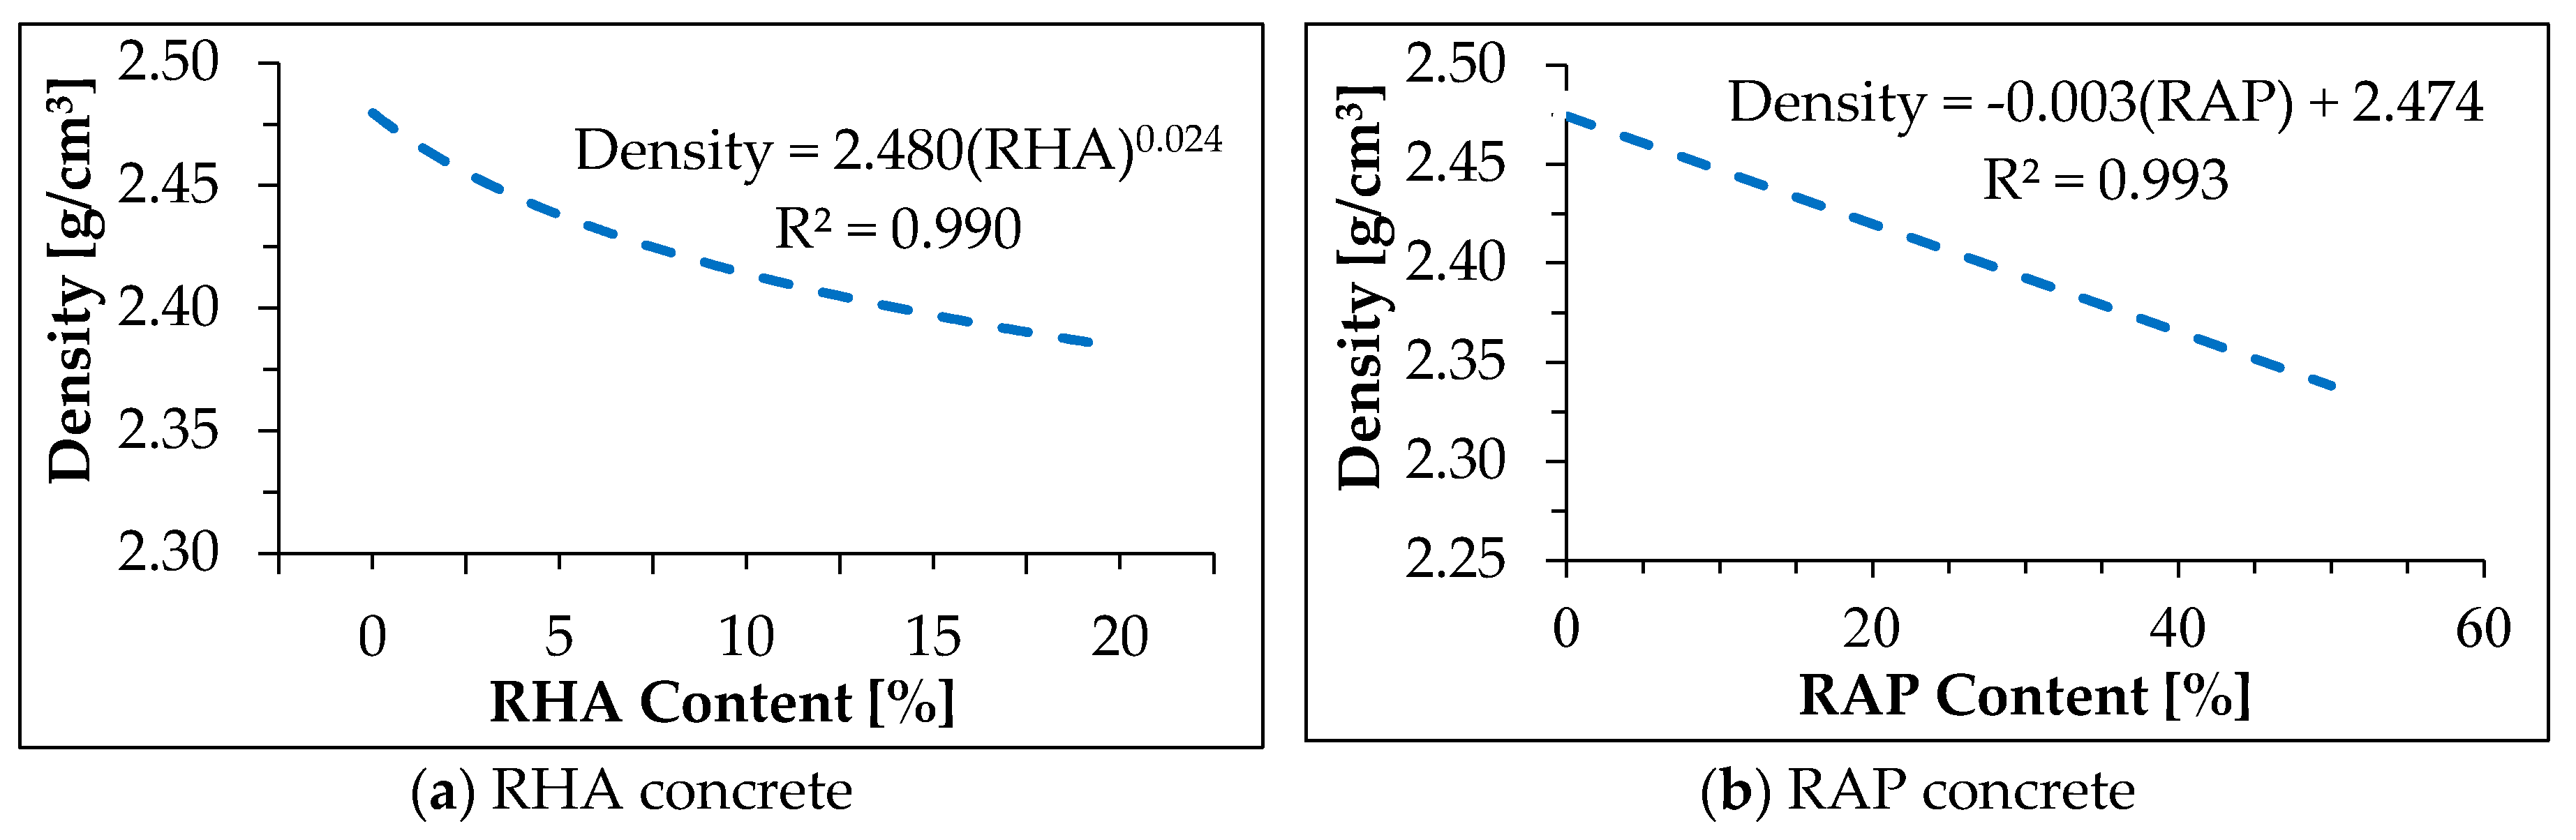
• Fresh Density
The fresh density of RHA-inclusive PCC decreased by 3.8% from 2480 to 2386 kg/m3 as the RHA content in the mix increased from 0 to 20%. The reduction in fresh density might be due to the fact that the particle density of RHA (2.03) was lower than that of cement particle density (3.12). The relationship between fresh density and RHA content (obtained by regression) is depicted in Figure 6a. R2 and SEE of the model were 0.990 and 0.008 respectively.
The mix containing RAP exhibited relatively lower fresh density compared to the mix containing virgin aggregates. The fresh density of RAP-inclusive mix decreased by 5.7% from 2480 to 2339 kg/m3 as the RAP content in the mix increased from 0 to 50%. The reduction in density might be attributed to the fact that specific gravities of both FRAP and CRAP were lower than those of both FVA and CVA respectively. Figure 6b (obtained by regression) gives the relationship between fresh density and RAP Content. R2 and SEE of the model were 0.993 and 0.005 respectively.
The fresh density for mixes containing both RHA and RAP is graphically depicted in Figure 7. It was observed that the mixes containing both RHA and RAP had lower fresh density compared to the control mix. The mix incorporating 20% RHA + 30% RAP showed 3.6% reduction in fresh density relative to that of the control mix. The reduction in fresh density might be attributed to the collective effects pertaining to RHA and RAP as has been explained.

3.2.2. Hardened Properties of Concrete

Table 9 shows the compressive strength (CS), tensile splitting strength (TSS), bulk dry density, water absorption (w), permeable void spaces (v), and sorptivity (k) of the concrete.
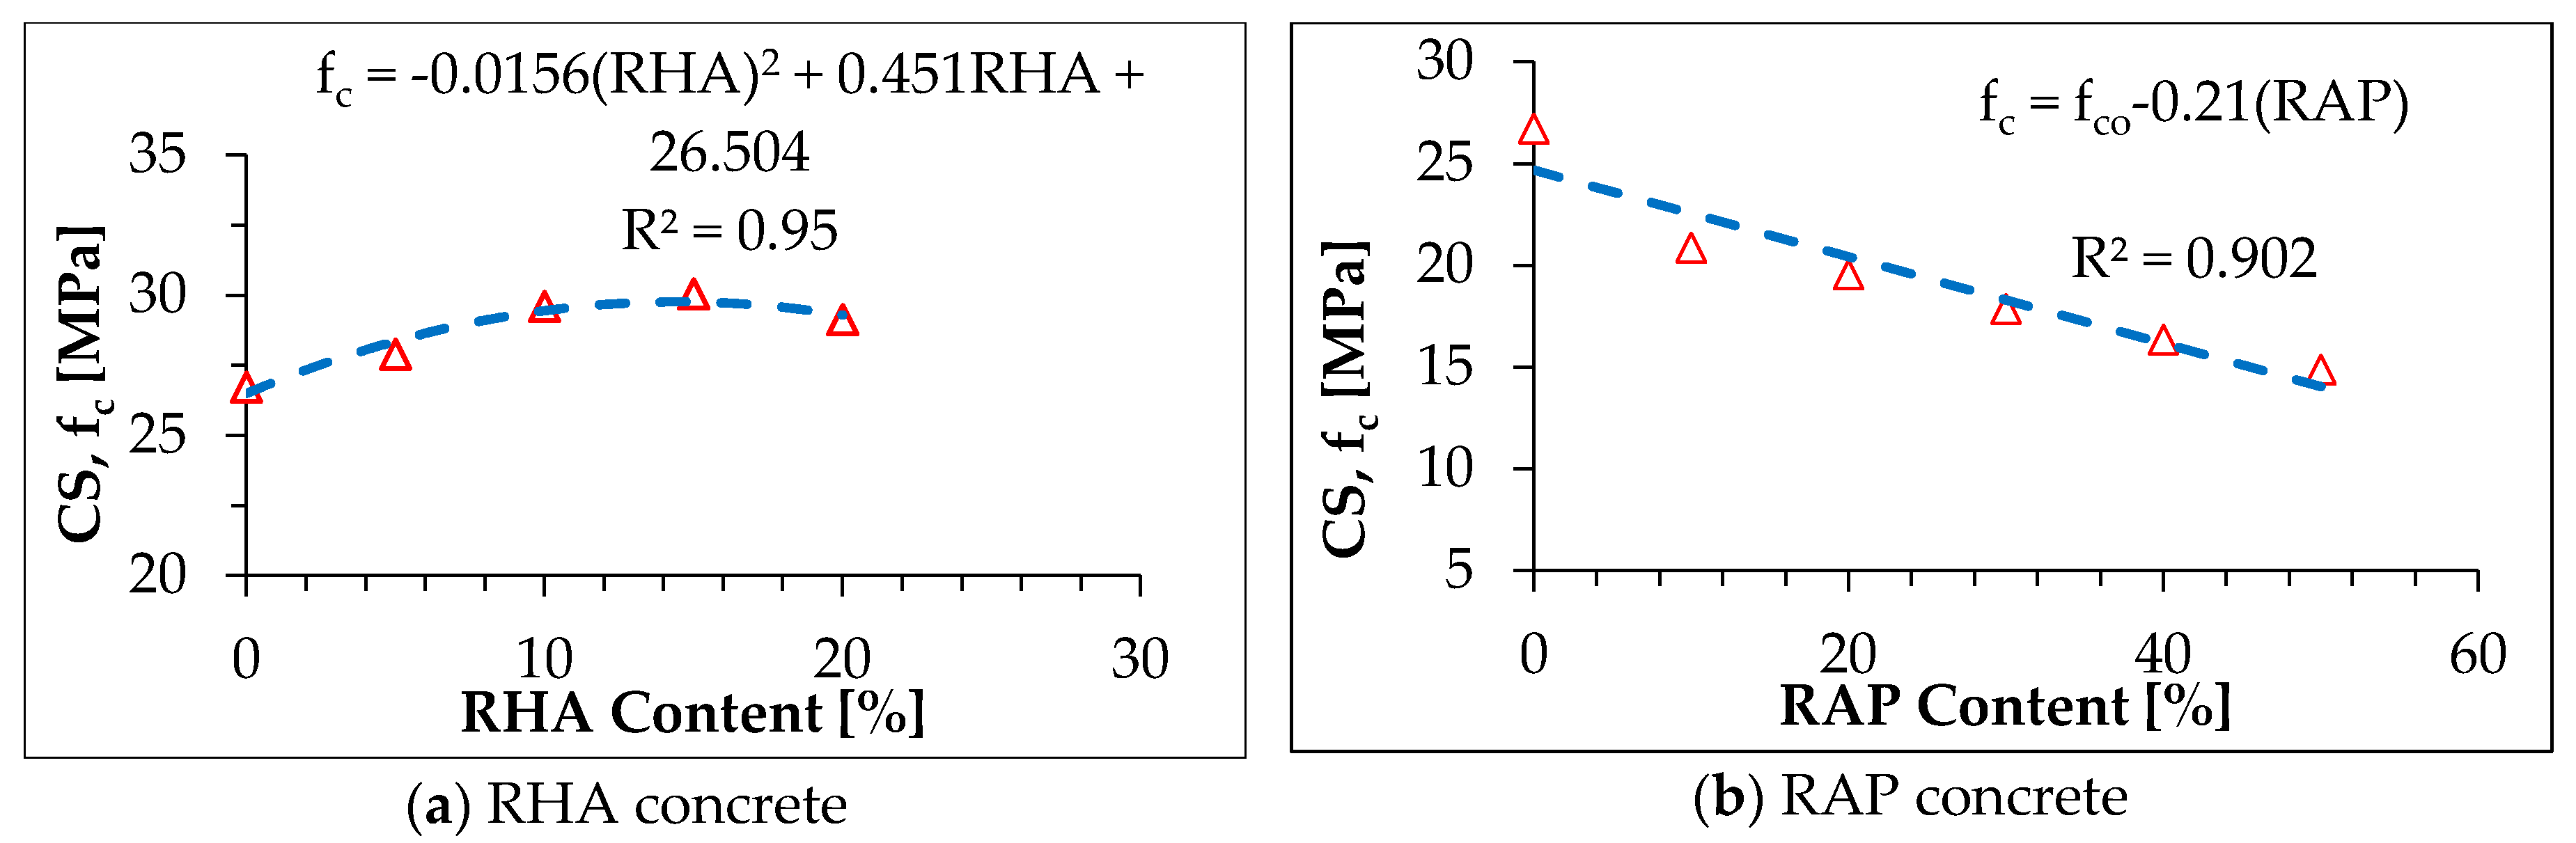
• Compressive Strength (CS)
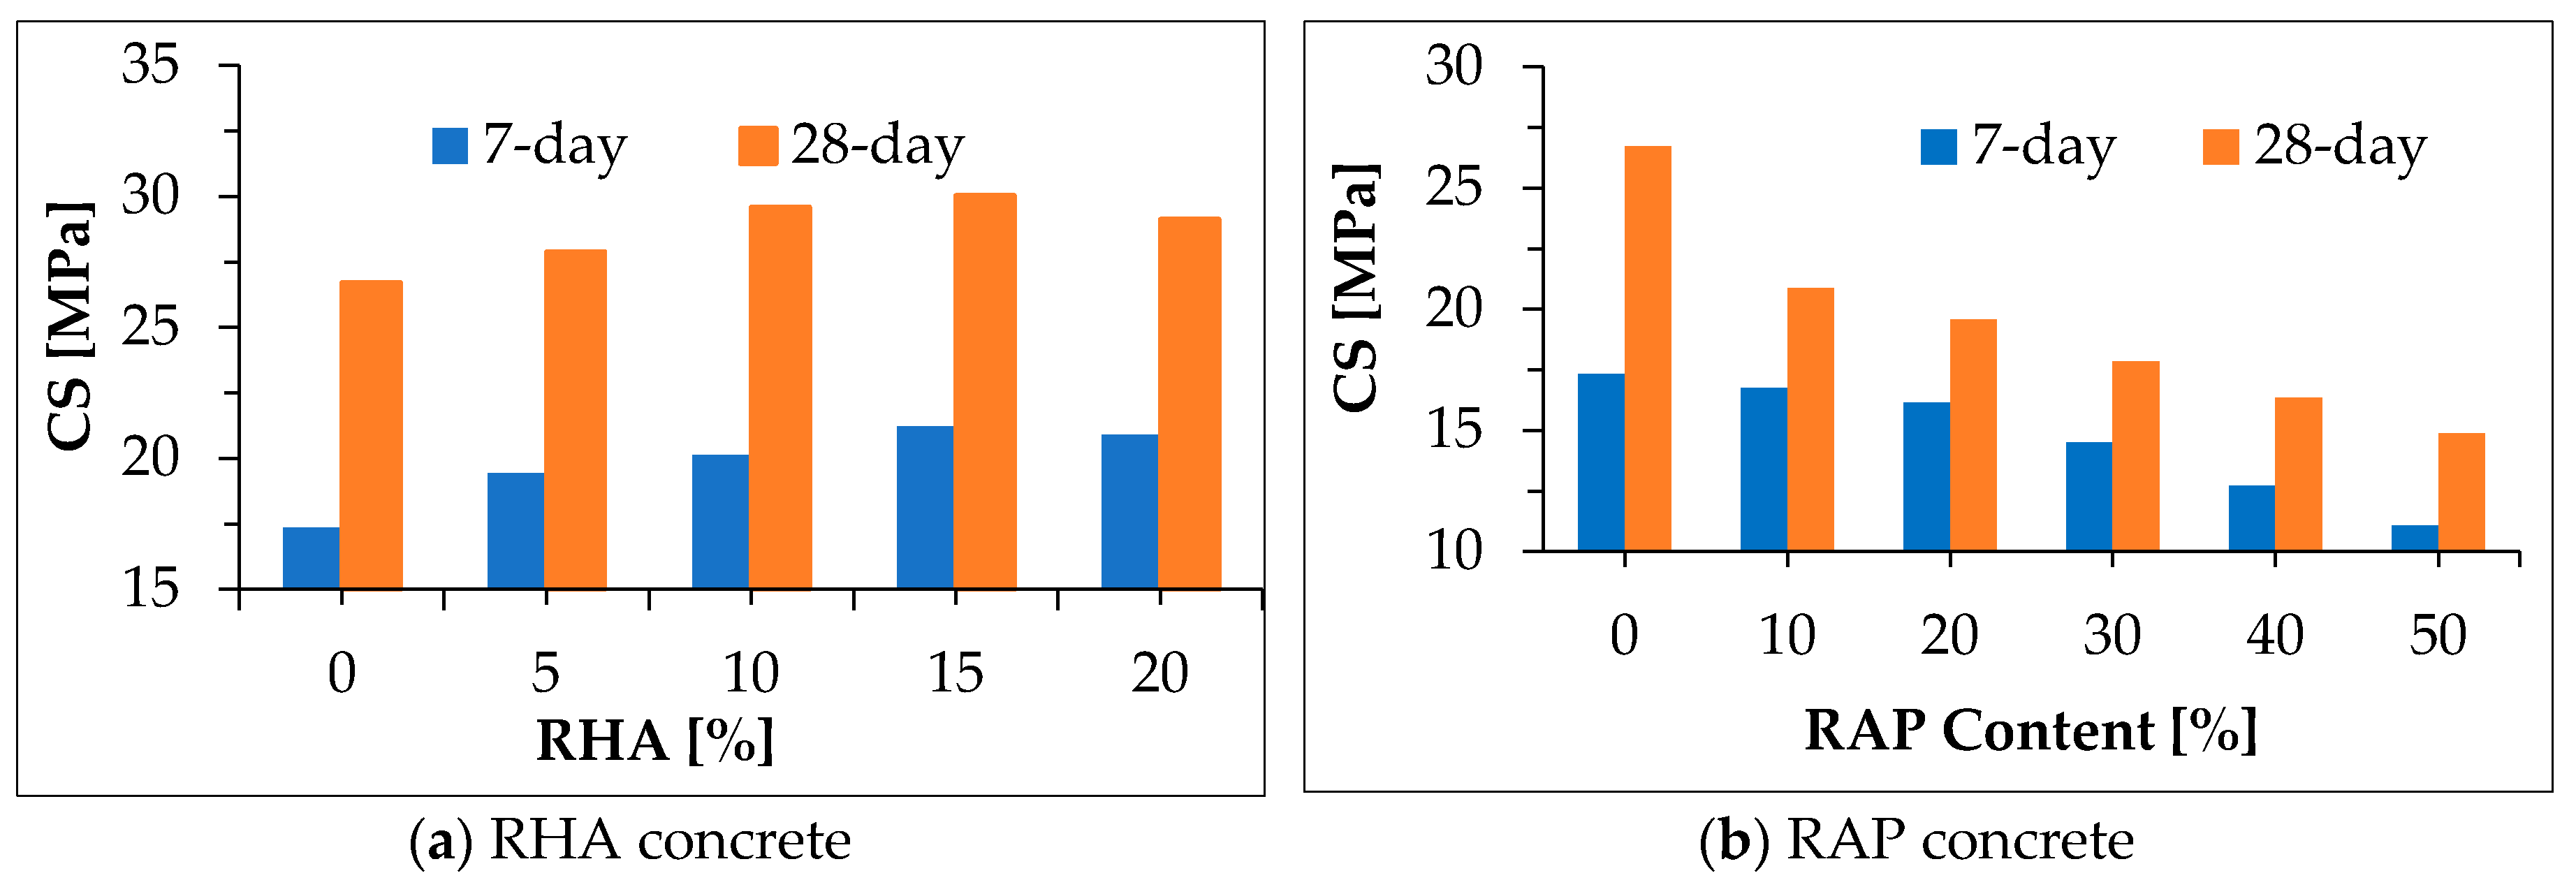
CS test results of PCC mixtures containing RHA are depicted in Figure 8a. RHA enhanced the 7-days CS by 12.0, 16.1, 22.4, and 20.5% at 5, 10, 15, and 20% RHA content respectively relative to the control mix. Similarly, the 28-days CS was also enhanced by 4.4, 10.8, 12.5, and 9.0%. In this study, the highest 7 and 28-days CS gain was observed at 15% RHA content.
The 7 and 28 days CS test results of RAP inclusive concrete are depicted in Figure 8b. A dramatic reduction in CS was observed with an increment of RAP content in the concrete mixtures. The 7 and 28-days CS decreased by 36.1 and 44.3%, relative to the control mix, respectively, at 50% RAP content. This is consistent with the results found in previous studies [23,28,29]. The reduction in CS might be attributed to the collective effect of higher porosity and asphalt cohesion failure, which occurs instead of the adhesive failure of the cement-asphalt interface or cohesive failure of the ITZ [26,27].
The relationship between RHA content and the 28-days CS given in Figure 9a (obtained by regression). The regression model had R2 and SEE values of 0.950 and 0.444 respectively. The CS decreased linearly with RAP content as shown in Figure 9b. A similar trend was found by previous study [61]. From the regression analysis, linear form relationship, Equation (3) was found. R2 and SEE values of the model were 0.902 and 1.476 respectively.
f c = f c o 0.21 × R A P
where: f c is the 28-days CS of the RAP-inclusive concrete in MPa; f c o is the 28-days CS of the mix with no RAP content in MPa; and RAP is the reclaimed asphalt pavement content in %.
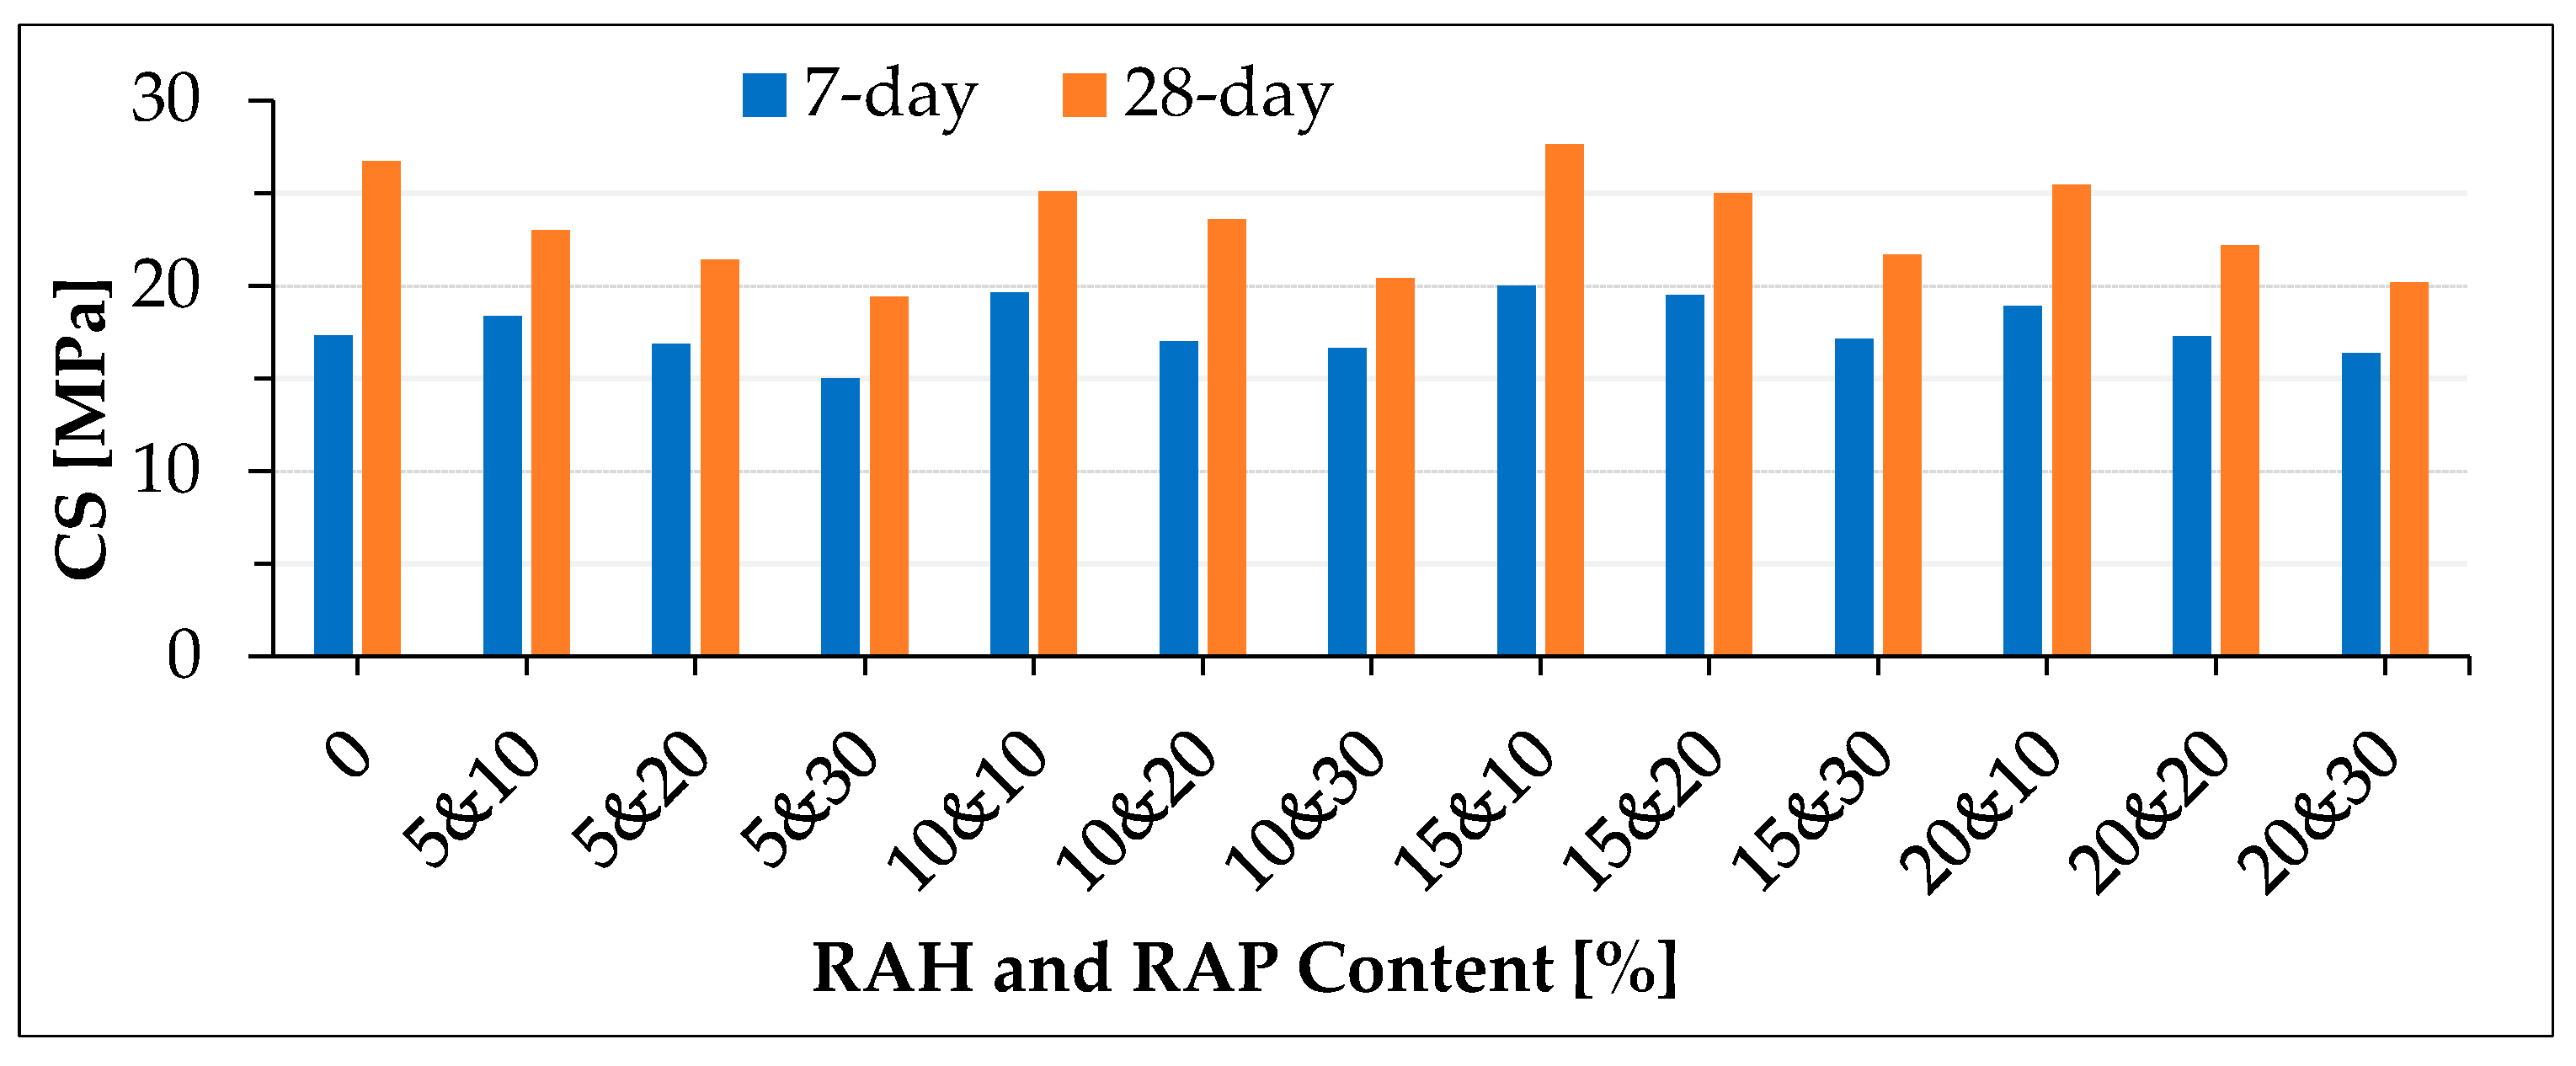
Figure 10 portrays the compressive strength of both RHA- and RAP-inclusive concrete at 7 and 28-days. The partial replacement of cement by RHA improved the CS of RAP-inclusive concrete moderately. This might be credited to the development of additional C-S-H gel due to the high reactive silica content of RHA and/or filler effect. Mixtures incorporating (10RHA + 10RAP)%, (15RHA + 10RAP)%, (15RHA + 20RAP)% and (20RHA + 10RAP)% showed comparable strength. The maximum strength (27.62 MPa) obtained at 15% RHA and 10% RAP combination. Thus, it is evident that treatment of RAP by RHA possibly will be an effective way to enhance the mechanical properties of RAP incorporating concrete.
• Tensile Splitting Strength (TSS)
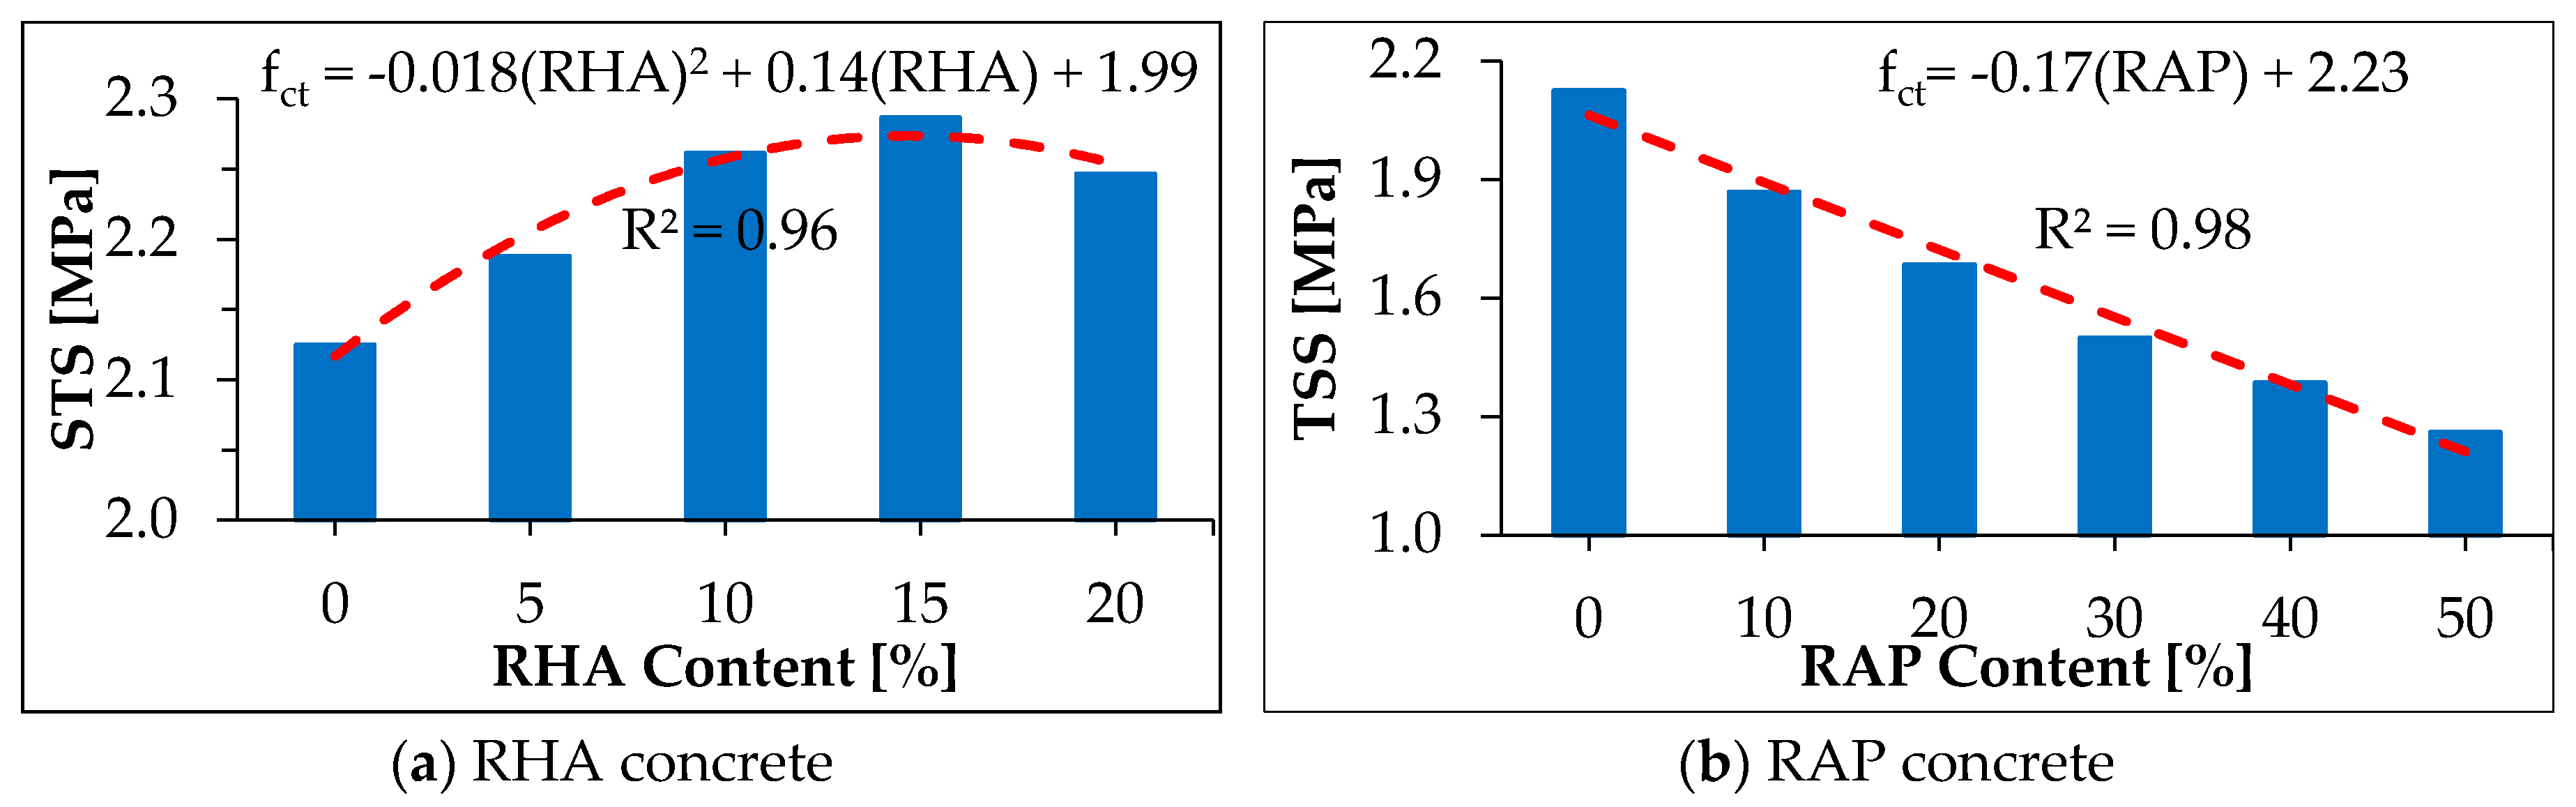
The 28-days TSS of the mixtures containing RHA is represented in Figure 11a. There was a gradual increment in TSS with increasing the RHA content up to 15%. The TSS peaked at 15% RHA and then decreased beyond 15% RHA. However, still 20% RHA inclusive concrete showed better strength than the control mix. The increment in strength was 2.8, 6.1, 7.5, and 5.6% at 5, 10, 15, and 20% RHA content respectively, relative to the control mix. TSS increased in a second-order polynomial with RHA content as depicted in Figure 11a (R2 = 0.96 and SEE = 0.018). The trend for TSS was similar to that of CS. The increment in TSS might be ascribed to the development extra of C-S-H gel due to the active silica content of RHA.
TSS decreased linearly with increasing the RAP content as can be seen in Figure 11b (R2 = 0.98 and SEE = 0.052). TSS decreased by 12.2, 20.7, 29.6, 34.7, and 40.8% for 10, 20, 30, 40, and 50% RAP respectively. The decrement pattern for TSS was similar to that of the CS. However, the rate of strength reduction in the TSS mixtures was lower compared to the CS’s. This is consistent with previous study [26].
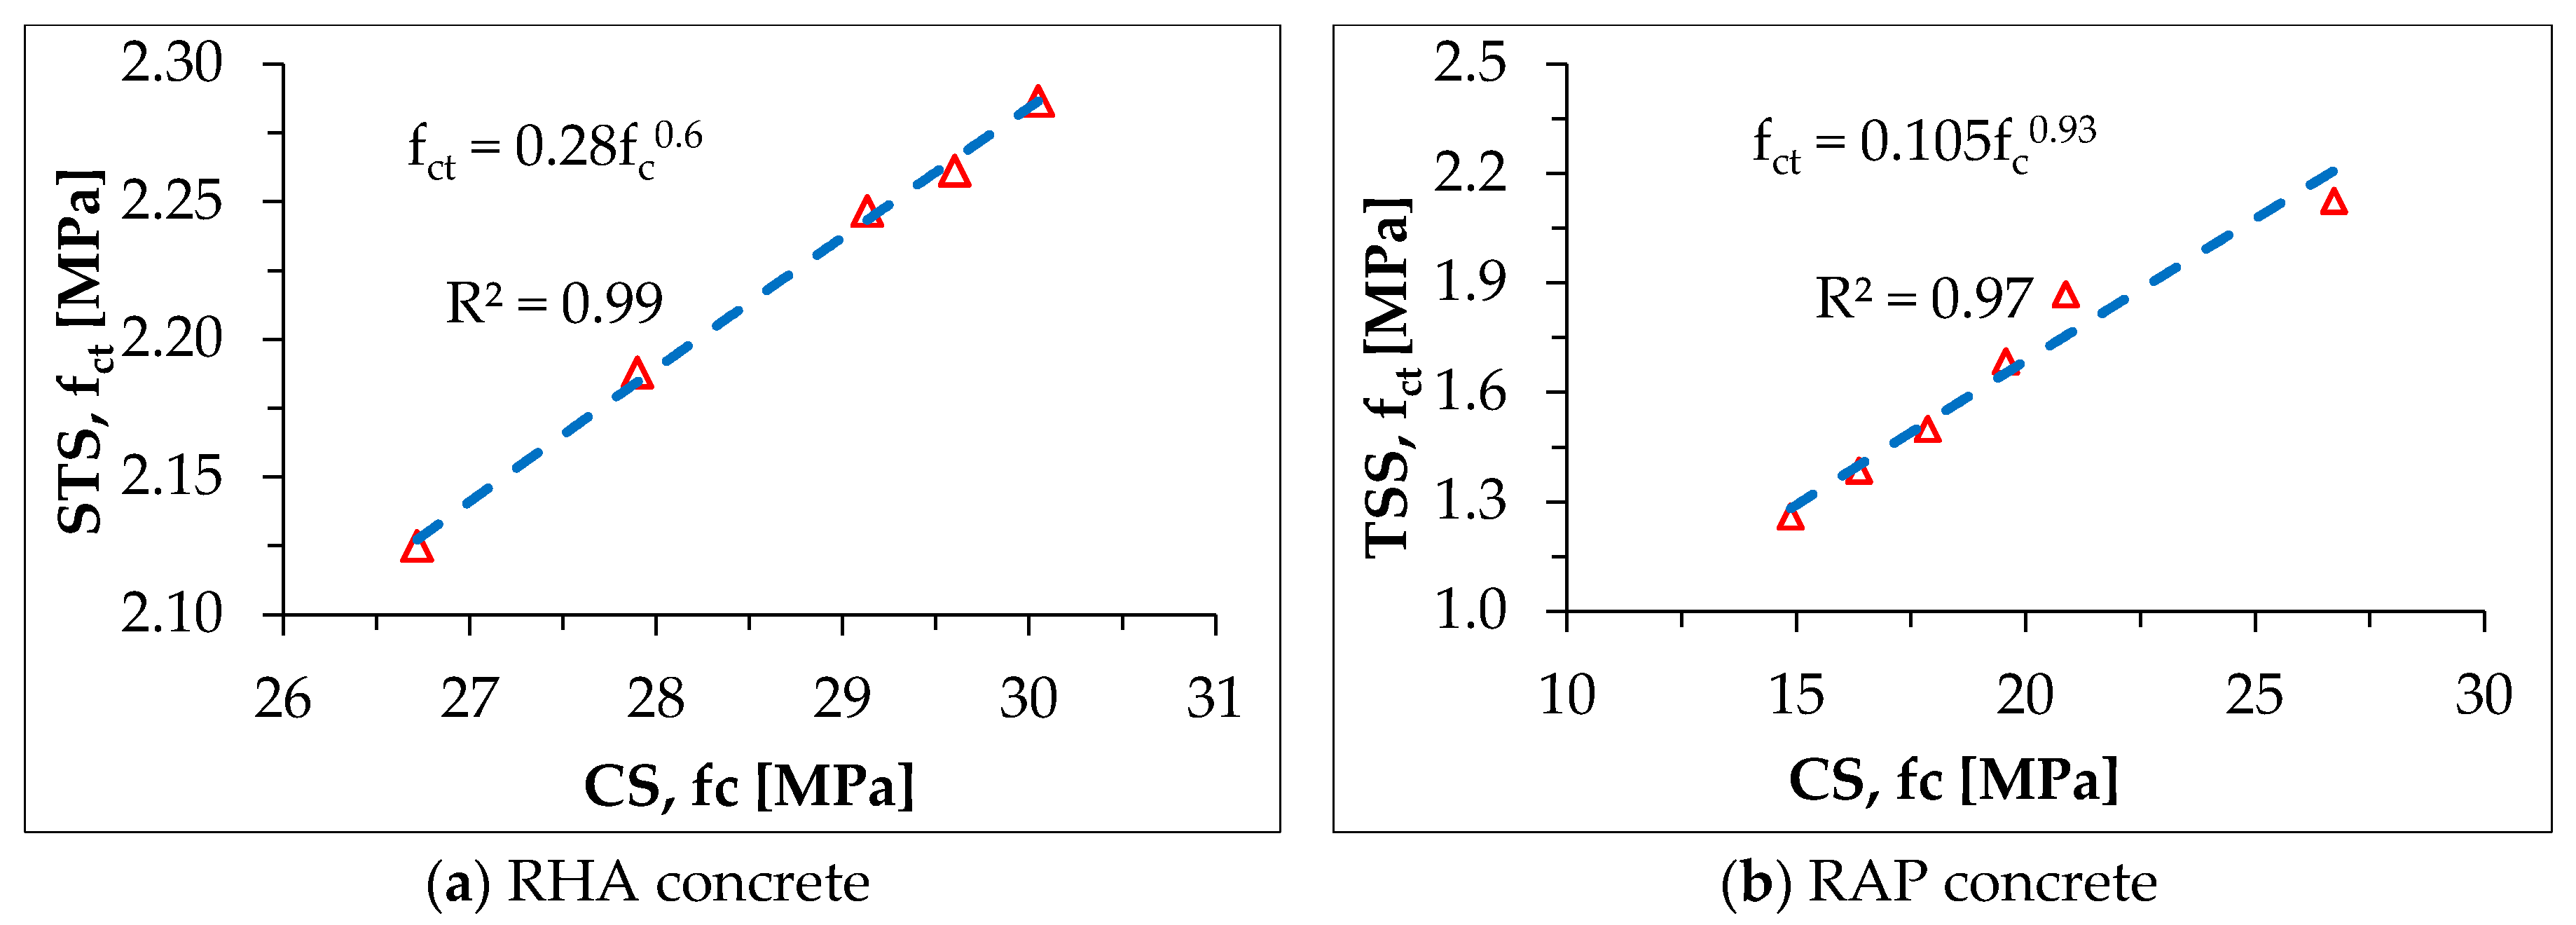
From regression analysis, a power form relationship was found between the 28 days TSS and CS of RHA inclusive concrete as shown in Equation (4) and Figure 12a (R2 =0.99 and SEE= 0.004).
f c t = 0.28 × f c 0.6
where: f c and fct are the 28-days CS and TSS of the RHA inclusive concrete respectively, in MPa.
The exponential form relationship was found between the 28 days TSS and CS of RAP inclusive concrete as presented in Figure 12b (R2 = 0.97 and SEE = 0.0526). Equations (5) and (6) were obtained by regression.
f c t = 0.17 × R A P + 2.23
f c t = 0.105 × f c 0.93
where: f c and f c t are the 28-days CS and TSS of the RAP inclusive concrete respectively, in MPa.
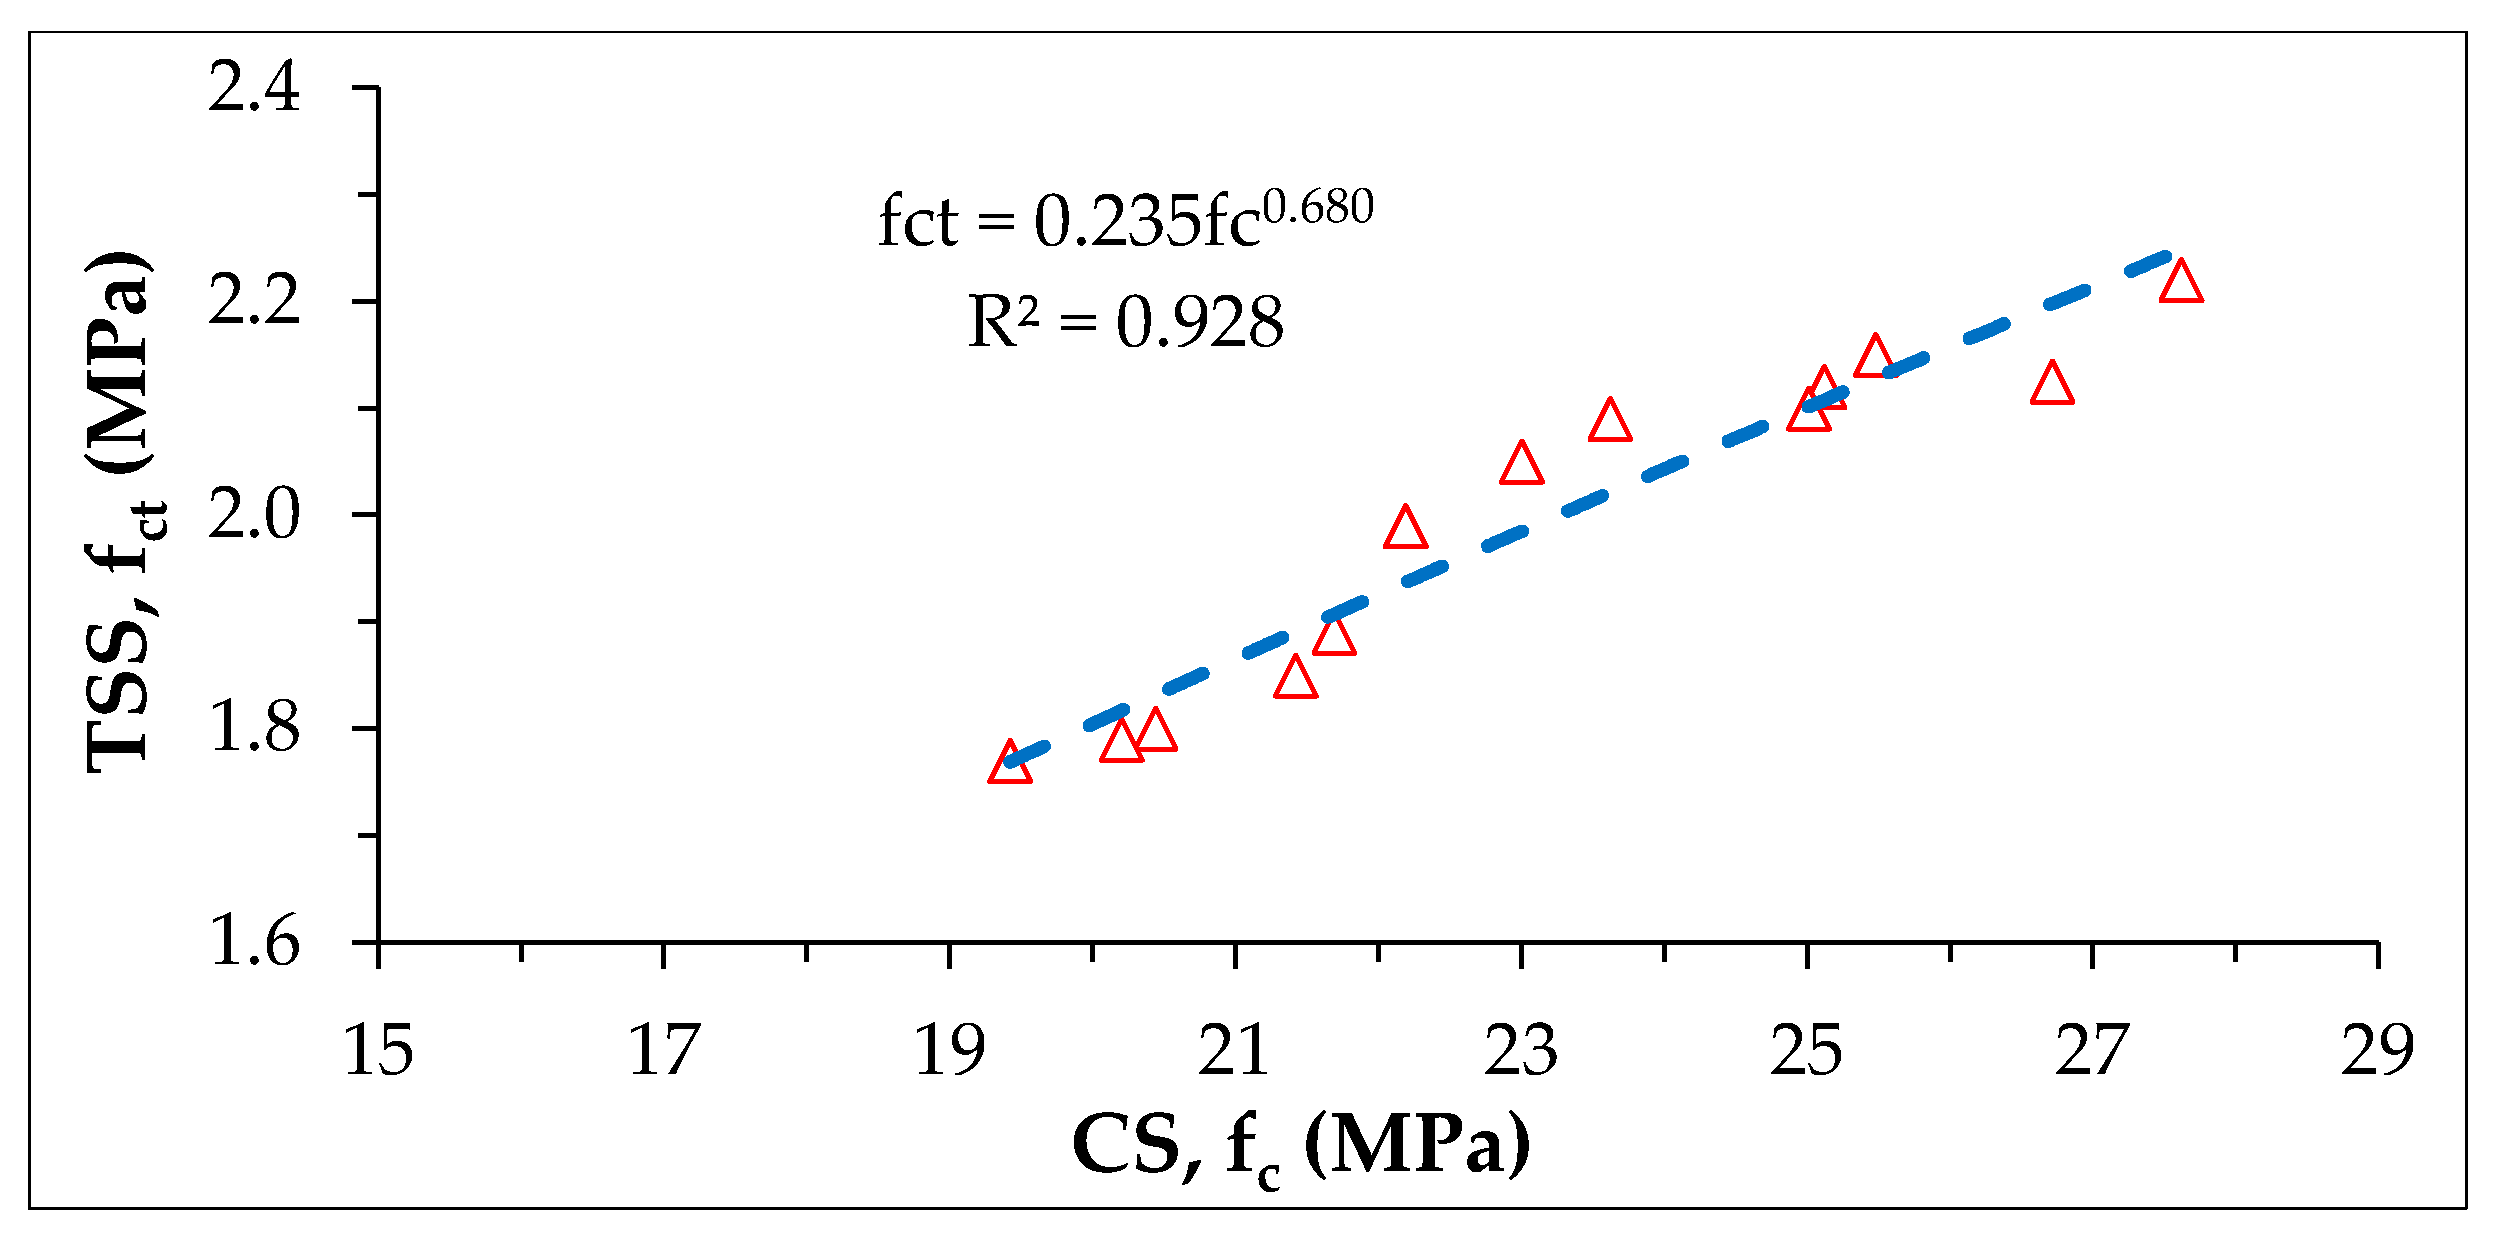
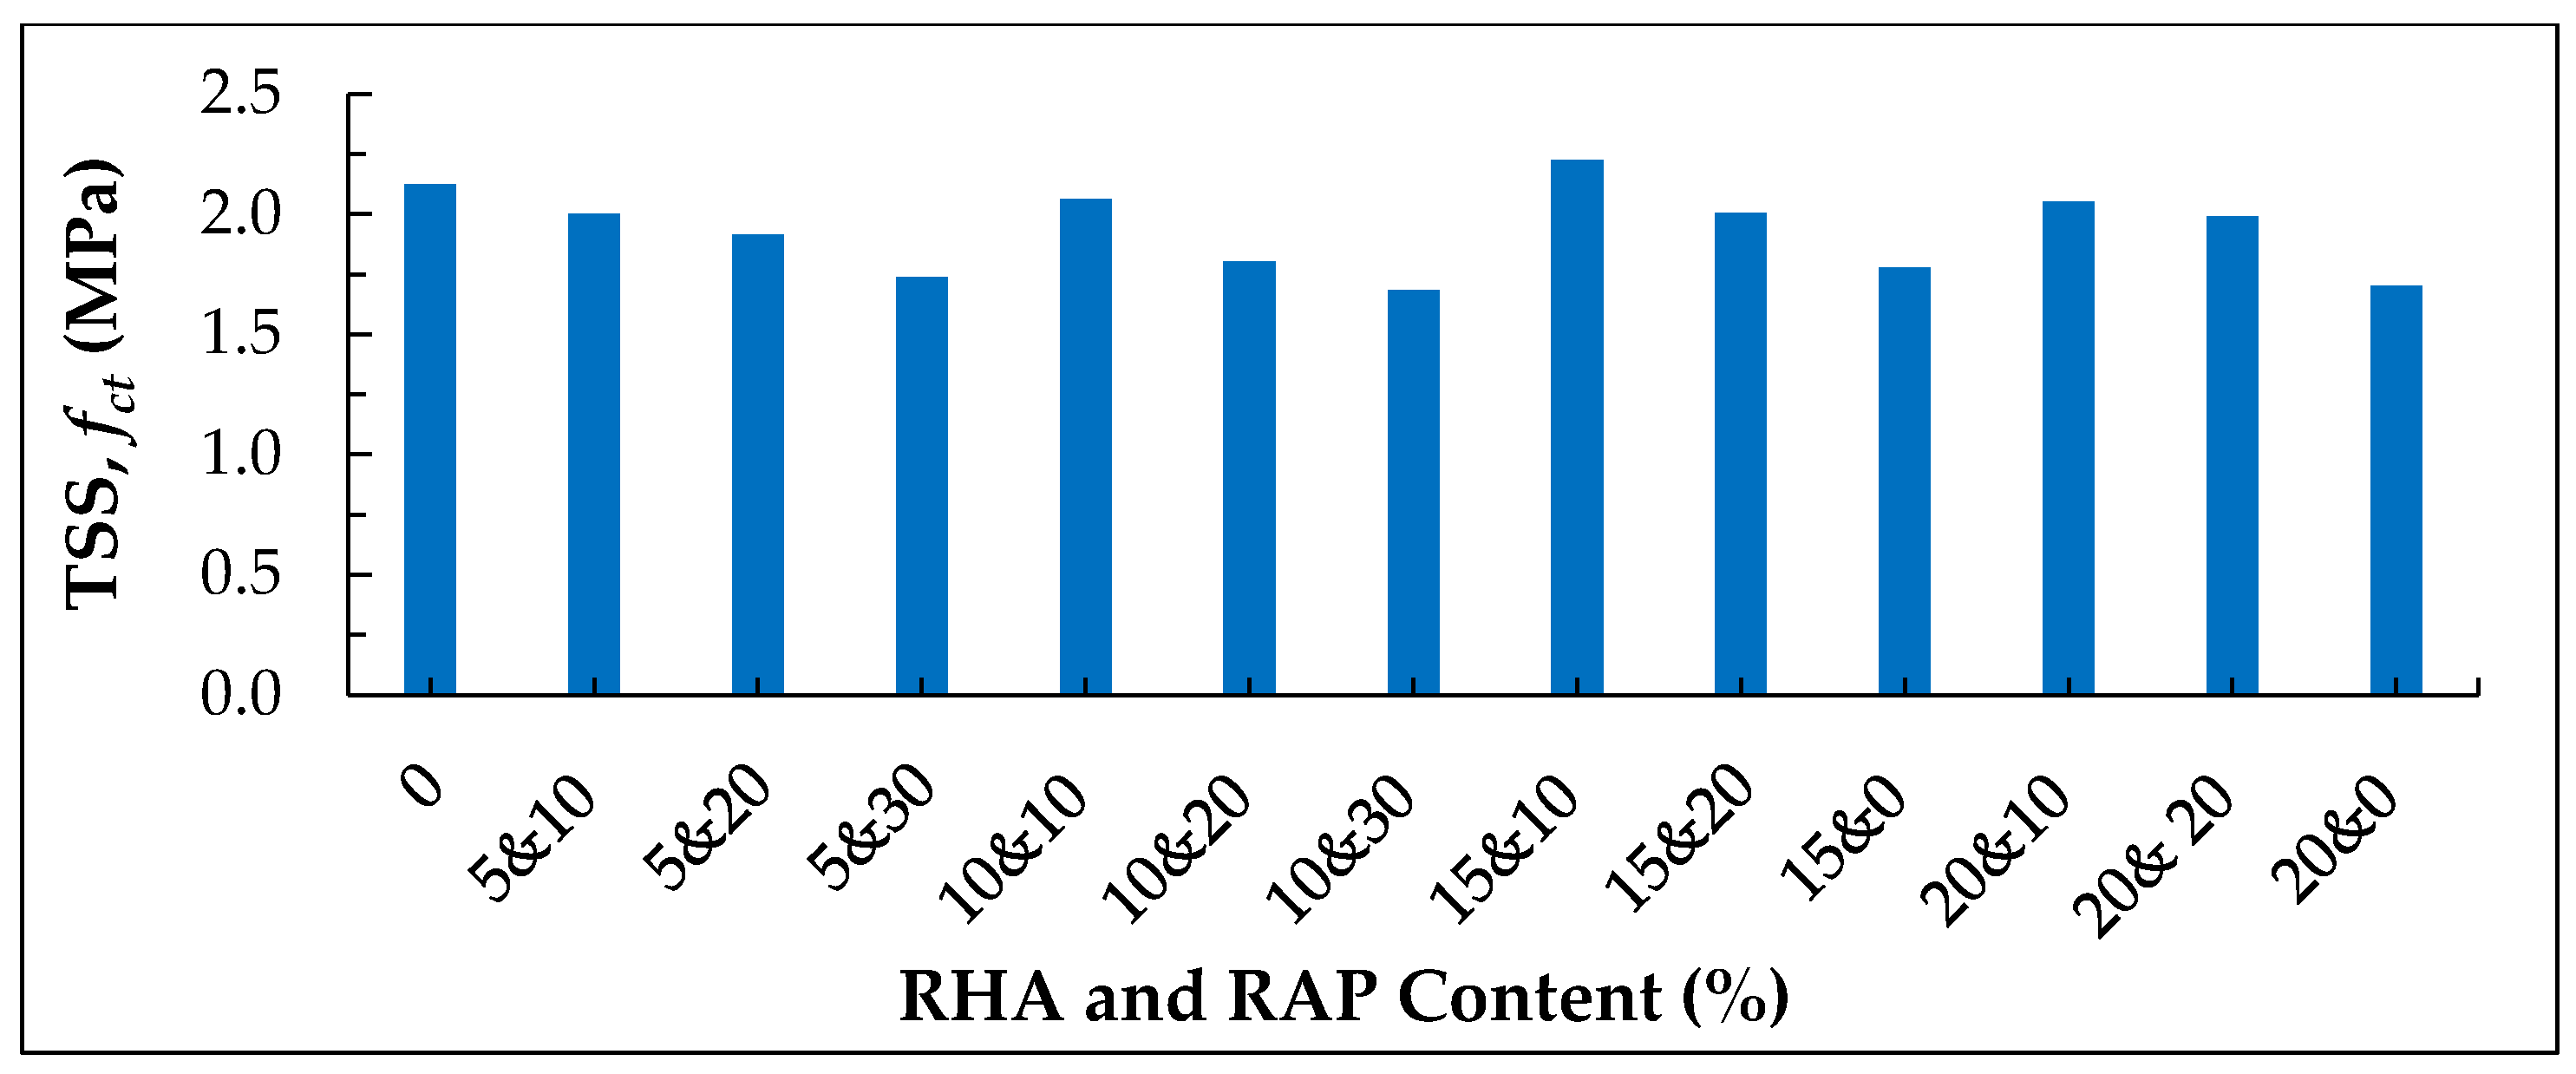
The experimental results of TSS of both RHA and RAP inclusive PCC and its relationship with CS are depicted in Figure 13 and Figure 14 respectively. TSS was improved by 4.7% at 15% RHA and 10% RAP content compared to the control specimen’s result which was similar to the CS results. TSS and CS were positively correlated (R2 = 0.928 and SEE = 0.065) with a power function as shown in Equation (7).
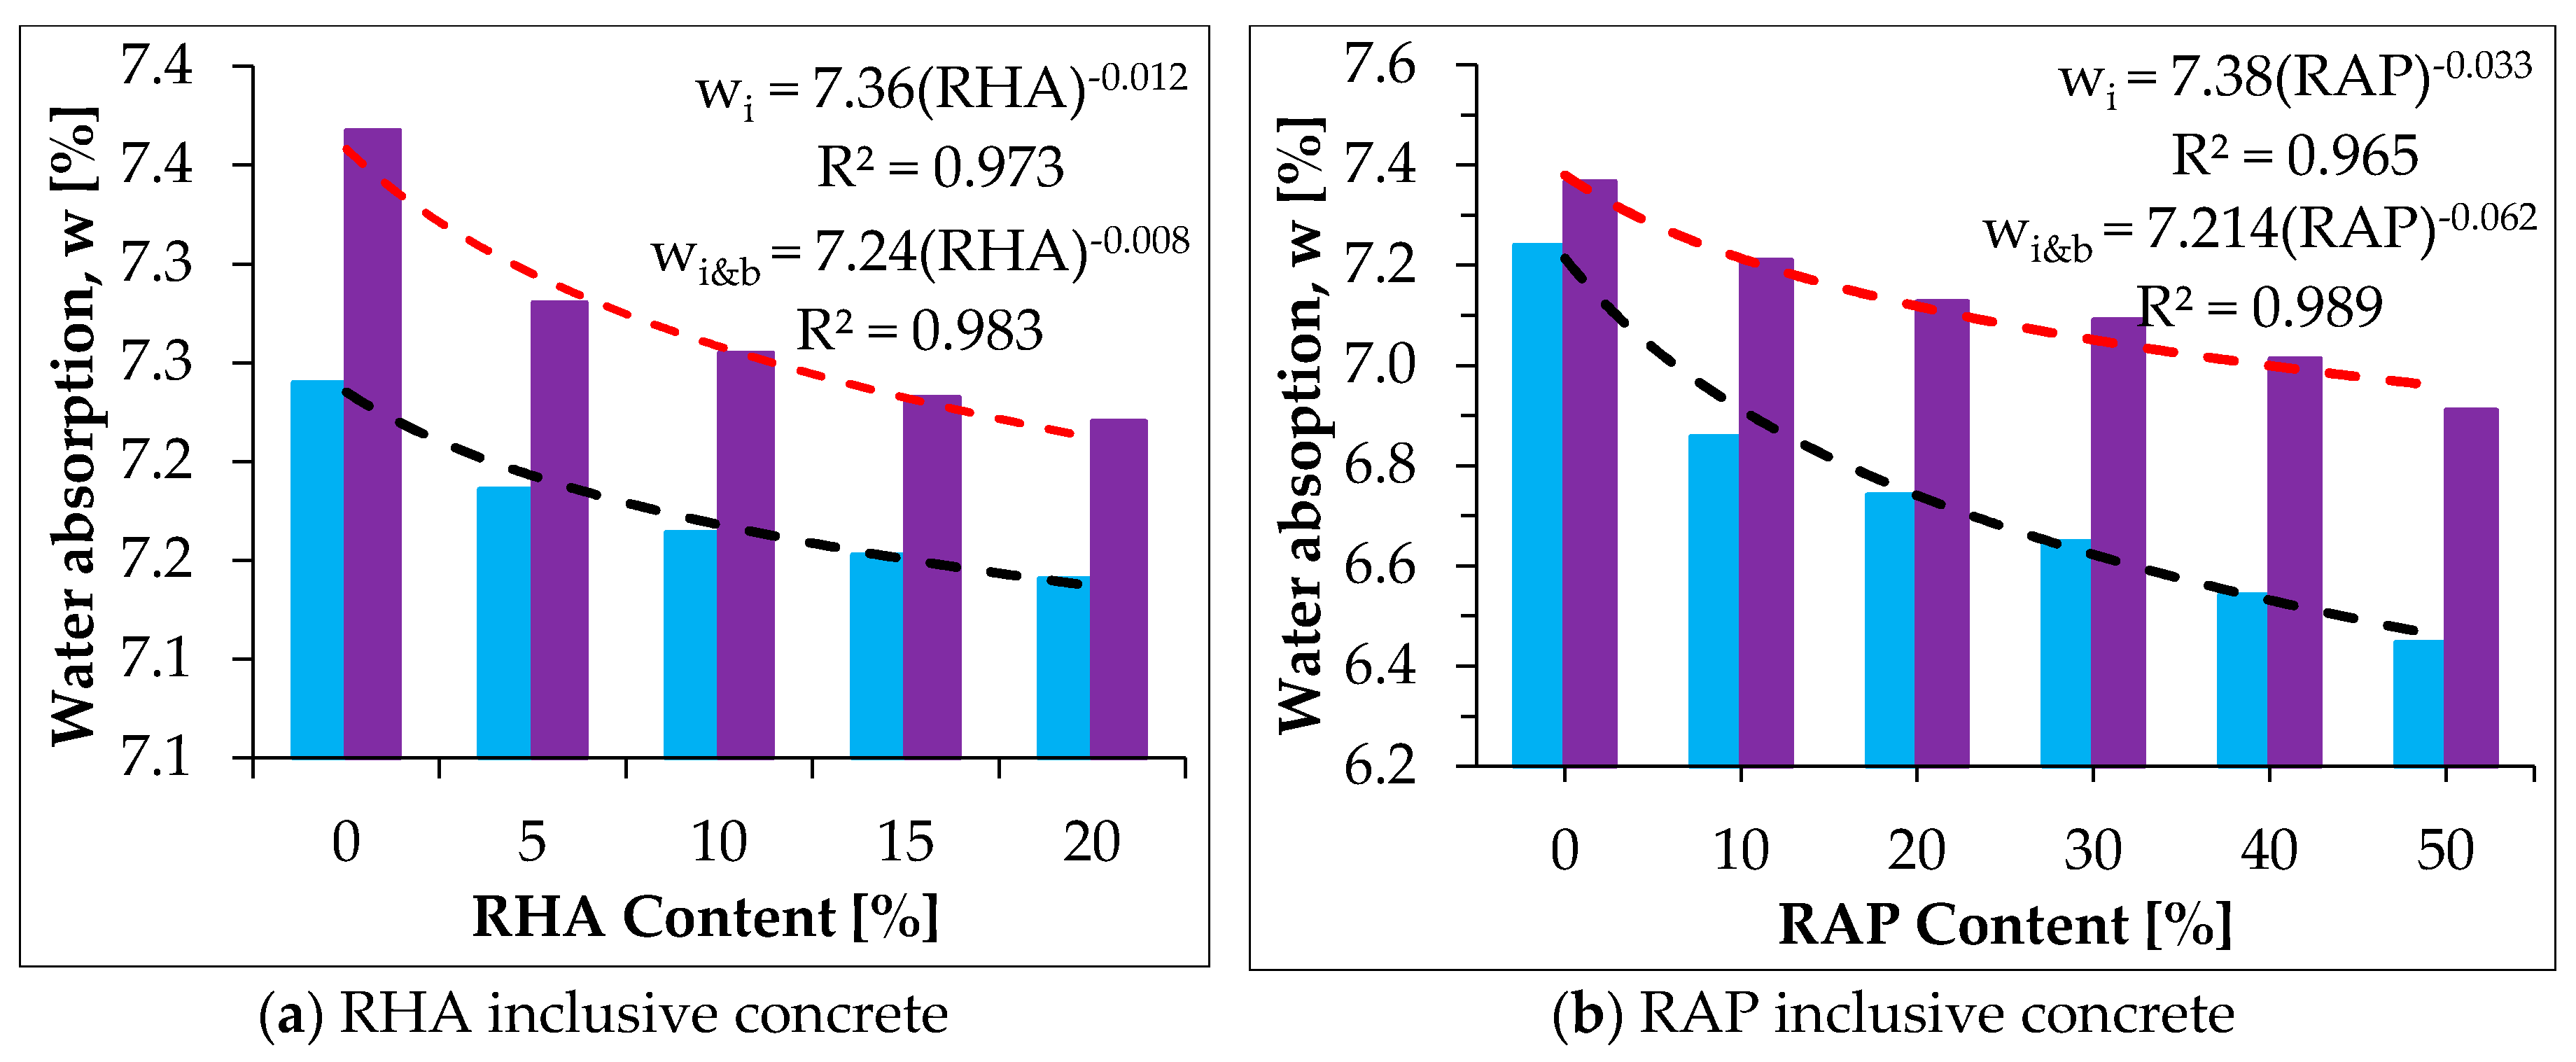
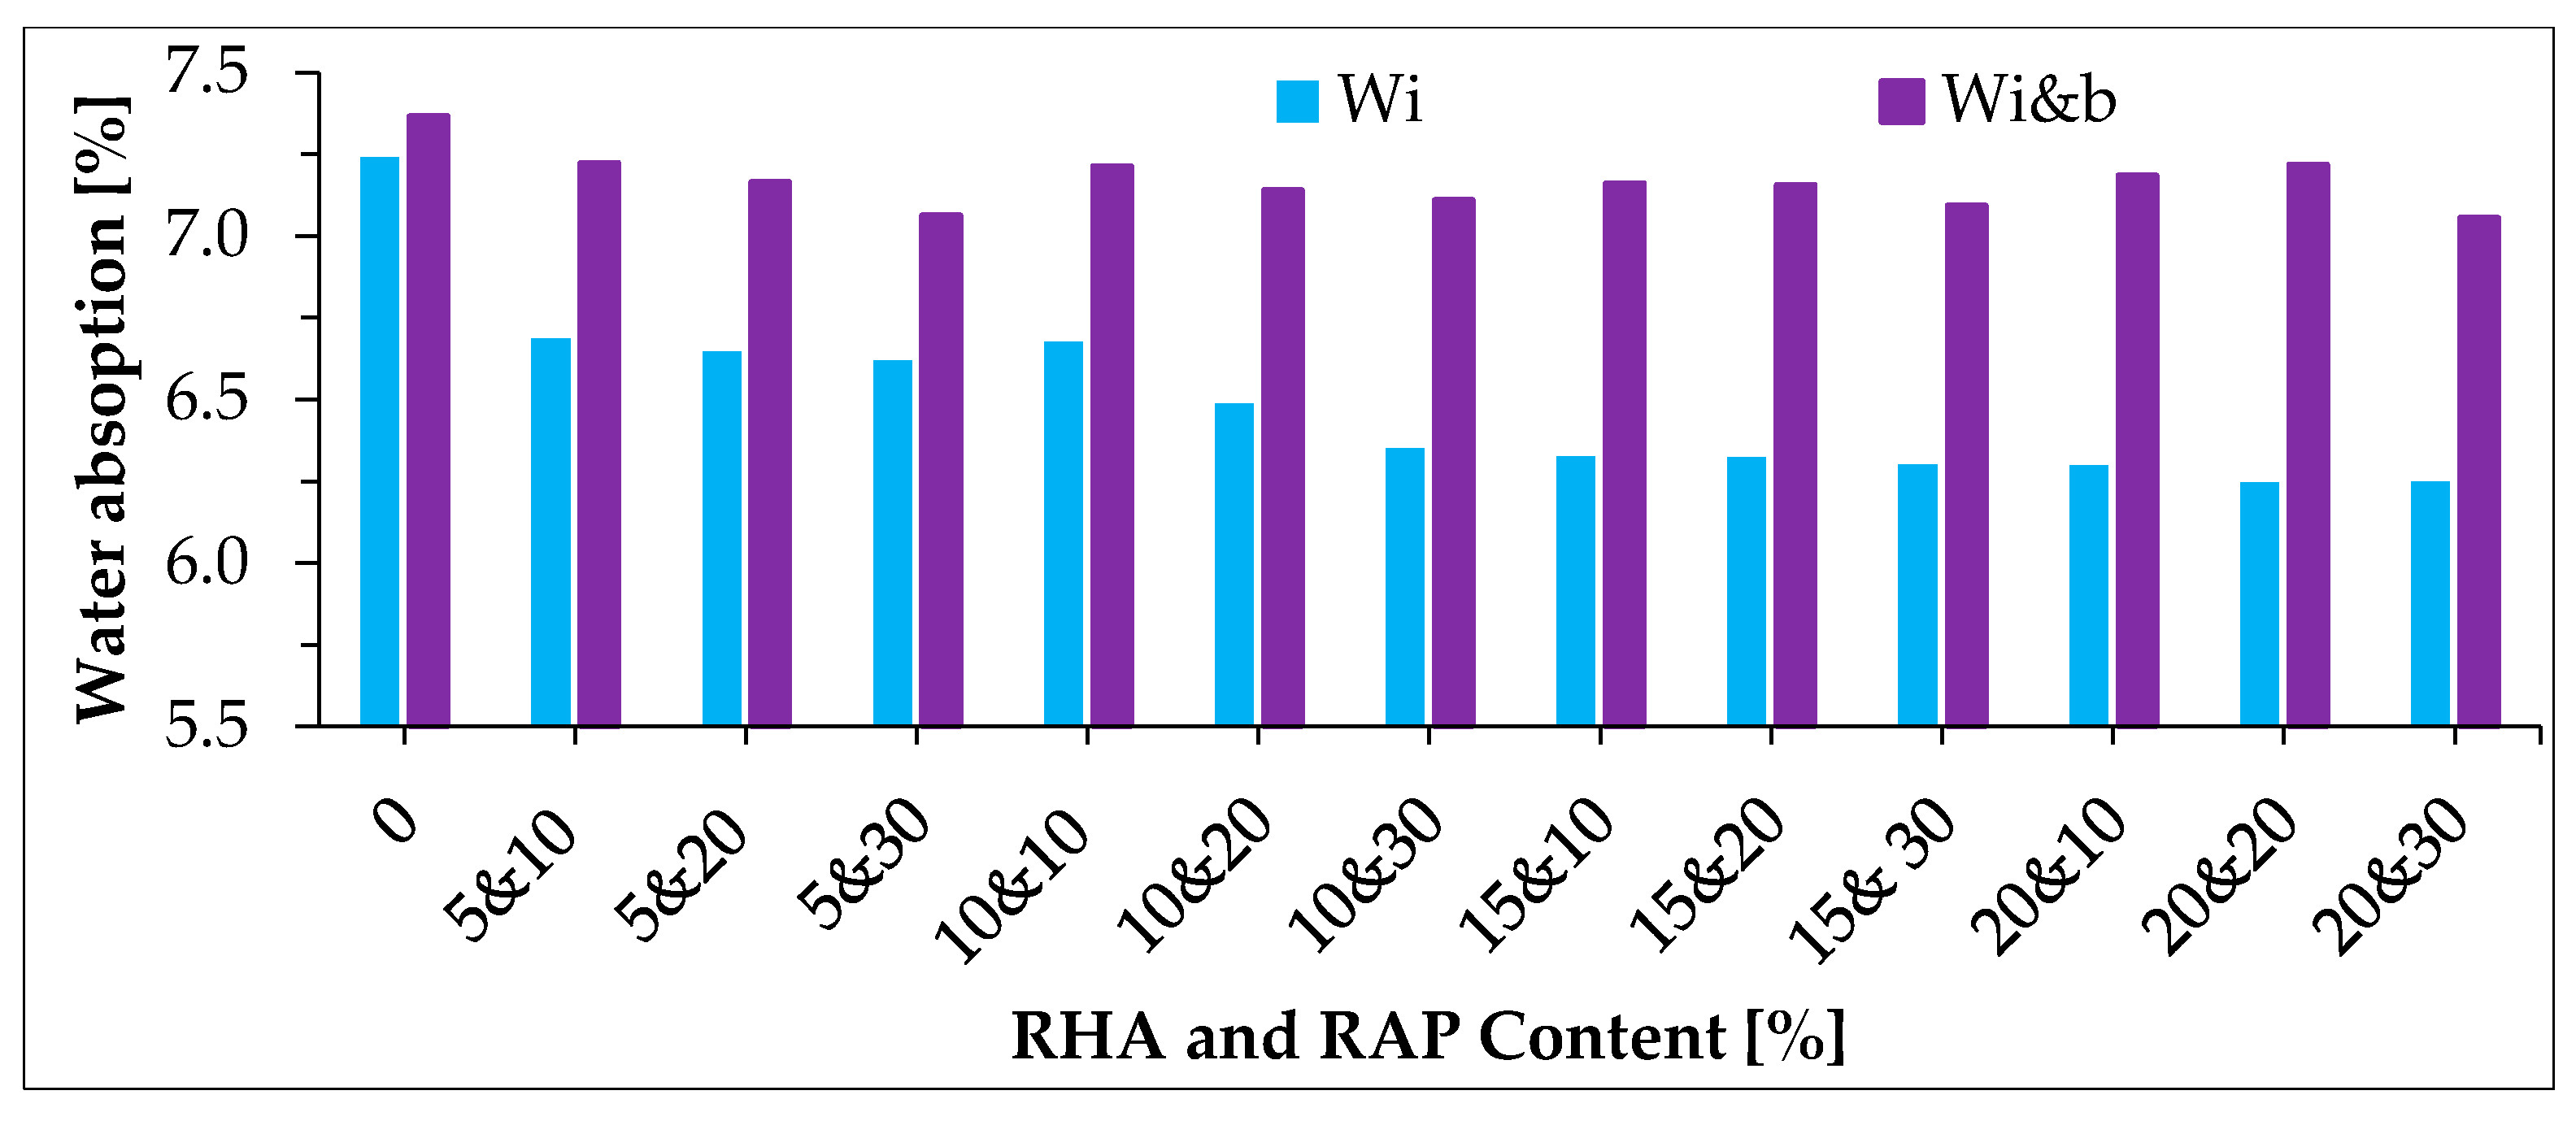
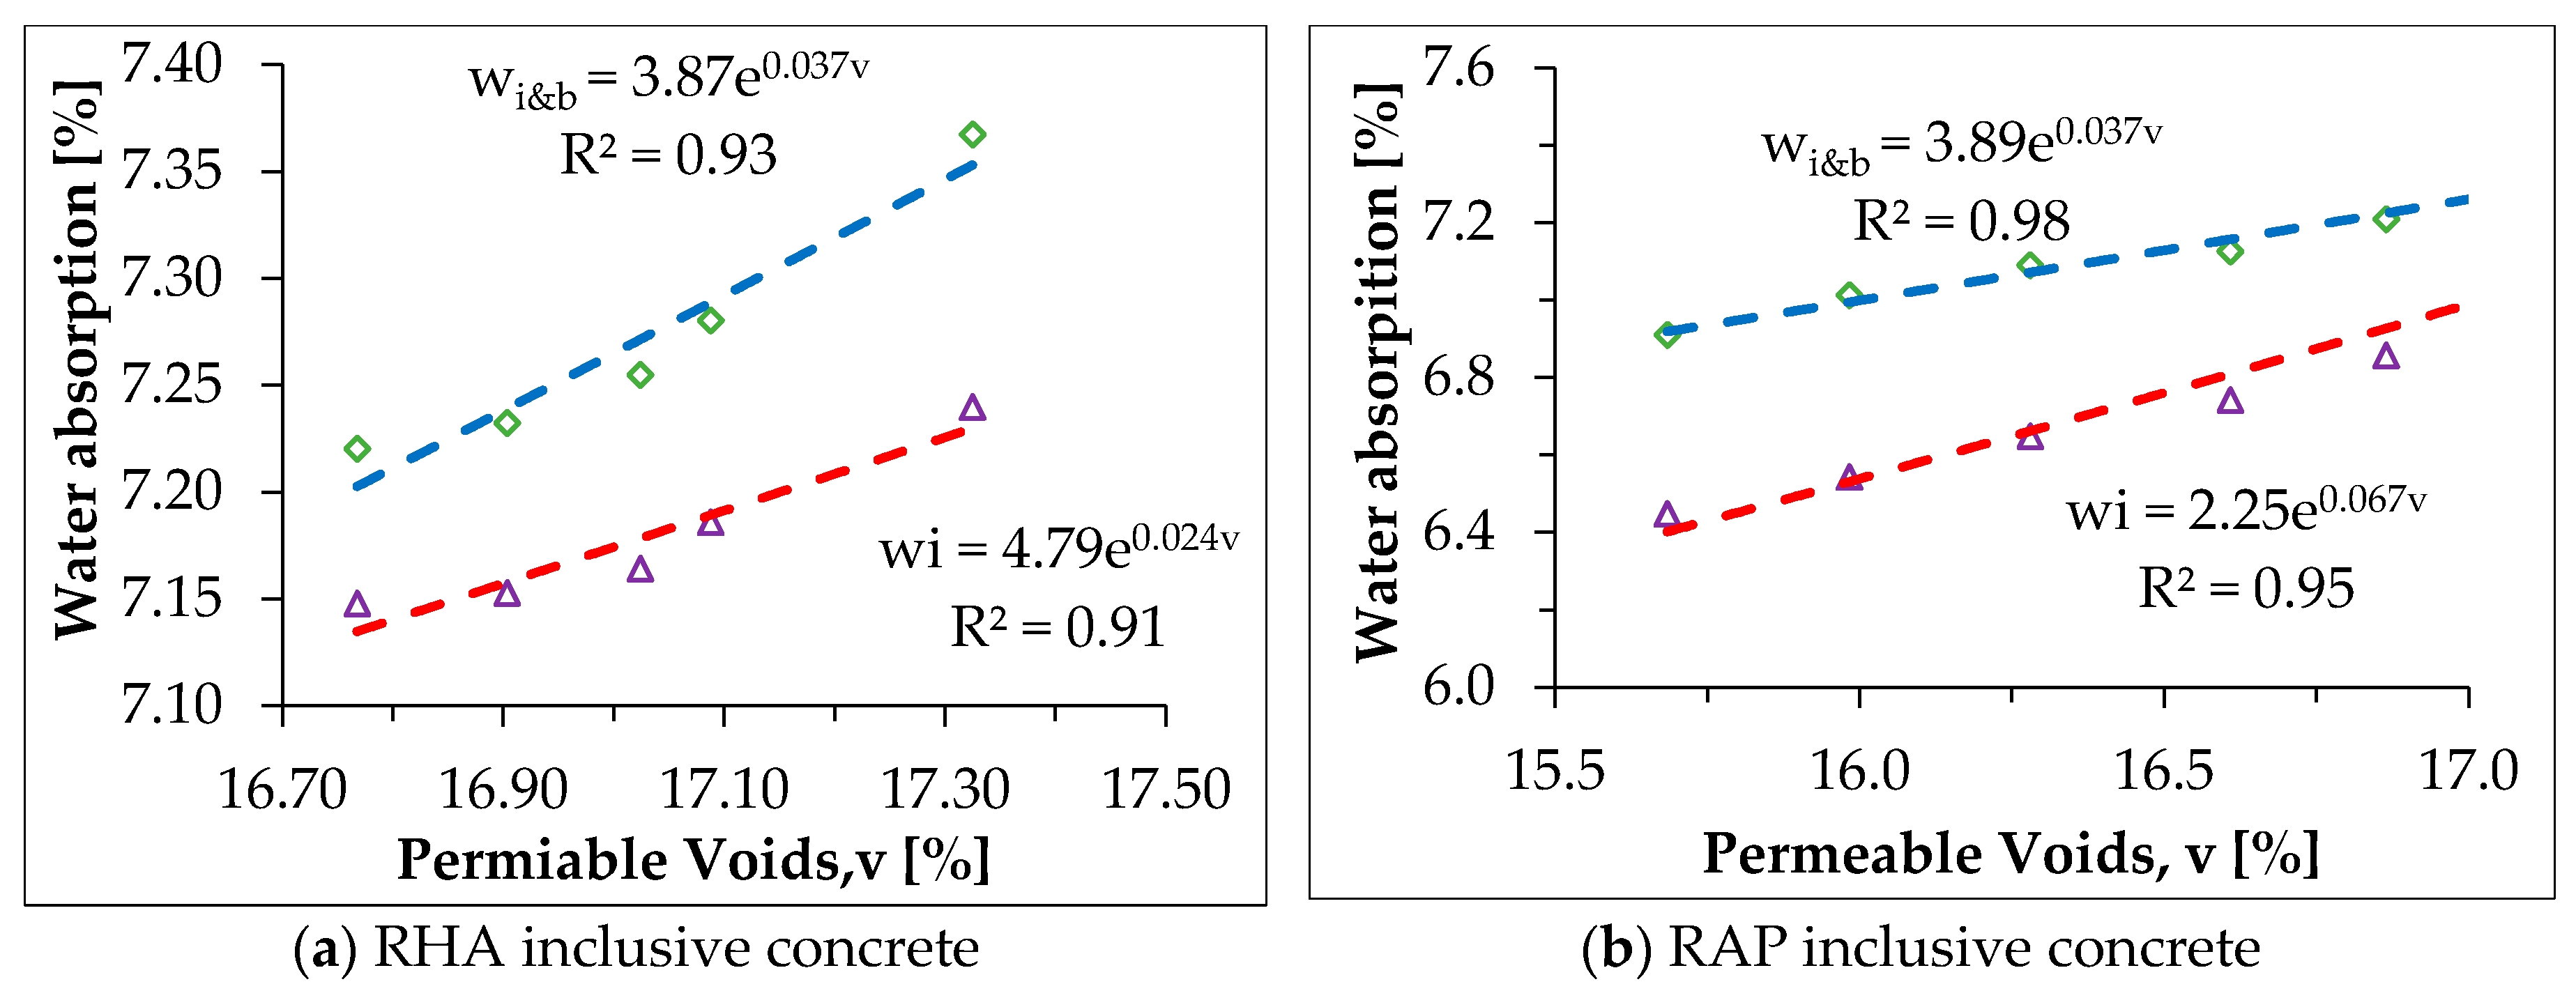
f c t = 0.235 × f c 0.68
• Water Absorption
The water absorption after immersion (wi) and after immersion and boiling (wi&b) decreased with increasing RHA content as shown in Figure 15a. The minimum relative percentage of reduction in water absorptions were 0.7 and 1.2% for wi and wi&b respectively at 5% RHA content, whereas the maximum relative percentage of reduction in water absorption were 1.3, and 2.0% for wi, and wi&b respectively at 20% RHA content. This reduction could be due to the fact that the finer HHA particles might have filled the pore spaces of the concrete. The water absorption is correlated to RHA content in a power function as shown in Equations (8) and (9). The wi&b values are slightly higher than those of wi.
The water absorption of RAP inclusive concrete decreased with increasing RAP content, as can be seen from Figure 15b. The minimum wi and wi&b were 6.4, and 6.9%, with relative percentage reduction of 10.94 and 6.20% respectively at 50% RAP content. The reductions in water absorption might be due to the lower water absorption of RAP aggregates compared to that of virgin aggregate. The other possible reason might be due to the melted asphalt and dust layer engulfed around the aggregate could fill void spaces in the concrete [62]. The water absorption is related to RAP content in a power function as shown in Equations (10) and (11). The wi&b values were somewhat higher than those of wi.
w i = 7.36 × RHA 0.012
w i & b = 7.24 × RHA 0.008
w i = 7.38 × RAP 0.033
w i & b = 7.214 × RAP 0.062
where: w i is the water absorption after immersion in %; wi&b is the water absorption after immersion and boiling; RHA and is the rice husk ash content in %; and RAP is reclaimed asphalt pavement content in %.
The water absorption of RHA and RAP inclusive concrete at 28 days are depicted in Figure 16. Both w i and wi&b decreased as RHA and RAP content increased. The relative percentage reduction of wi&b (13.7%) was lower than both that of RHA inclusive concrete (1.30%) and RAP inclusive concrete (10.94%). The least wi, and wi&b found were 6.25, and 7.06% respectively at 20% RHA and 30% RAP combination. The maximum relative percentage of reduction in absorption were 13.7 and 4.2% for the respective least absorptions. The reduction of water absorption might be due to the collective effect of RHA and RAP discussed above.
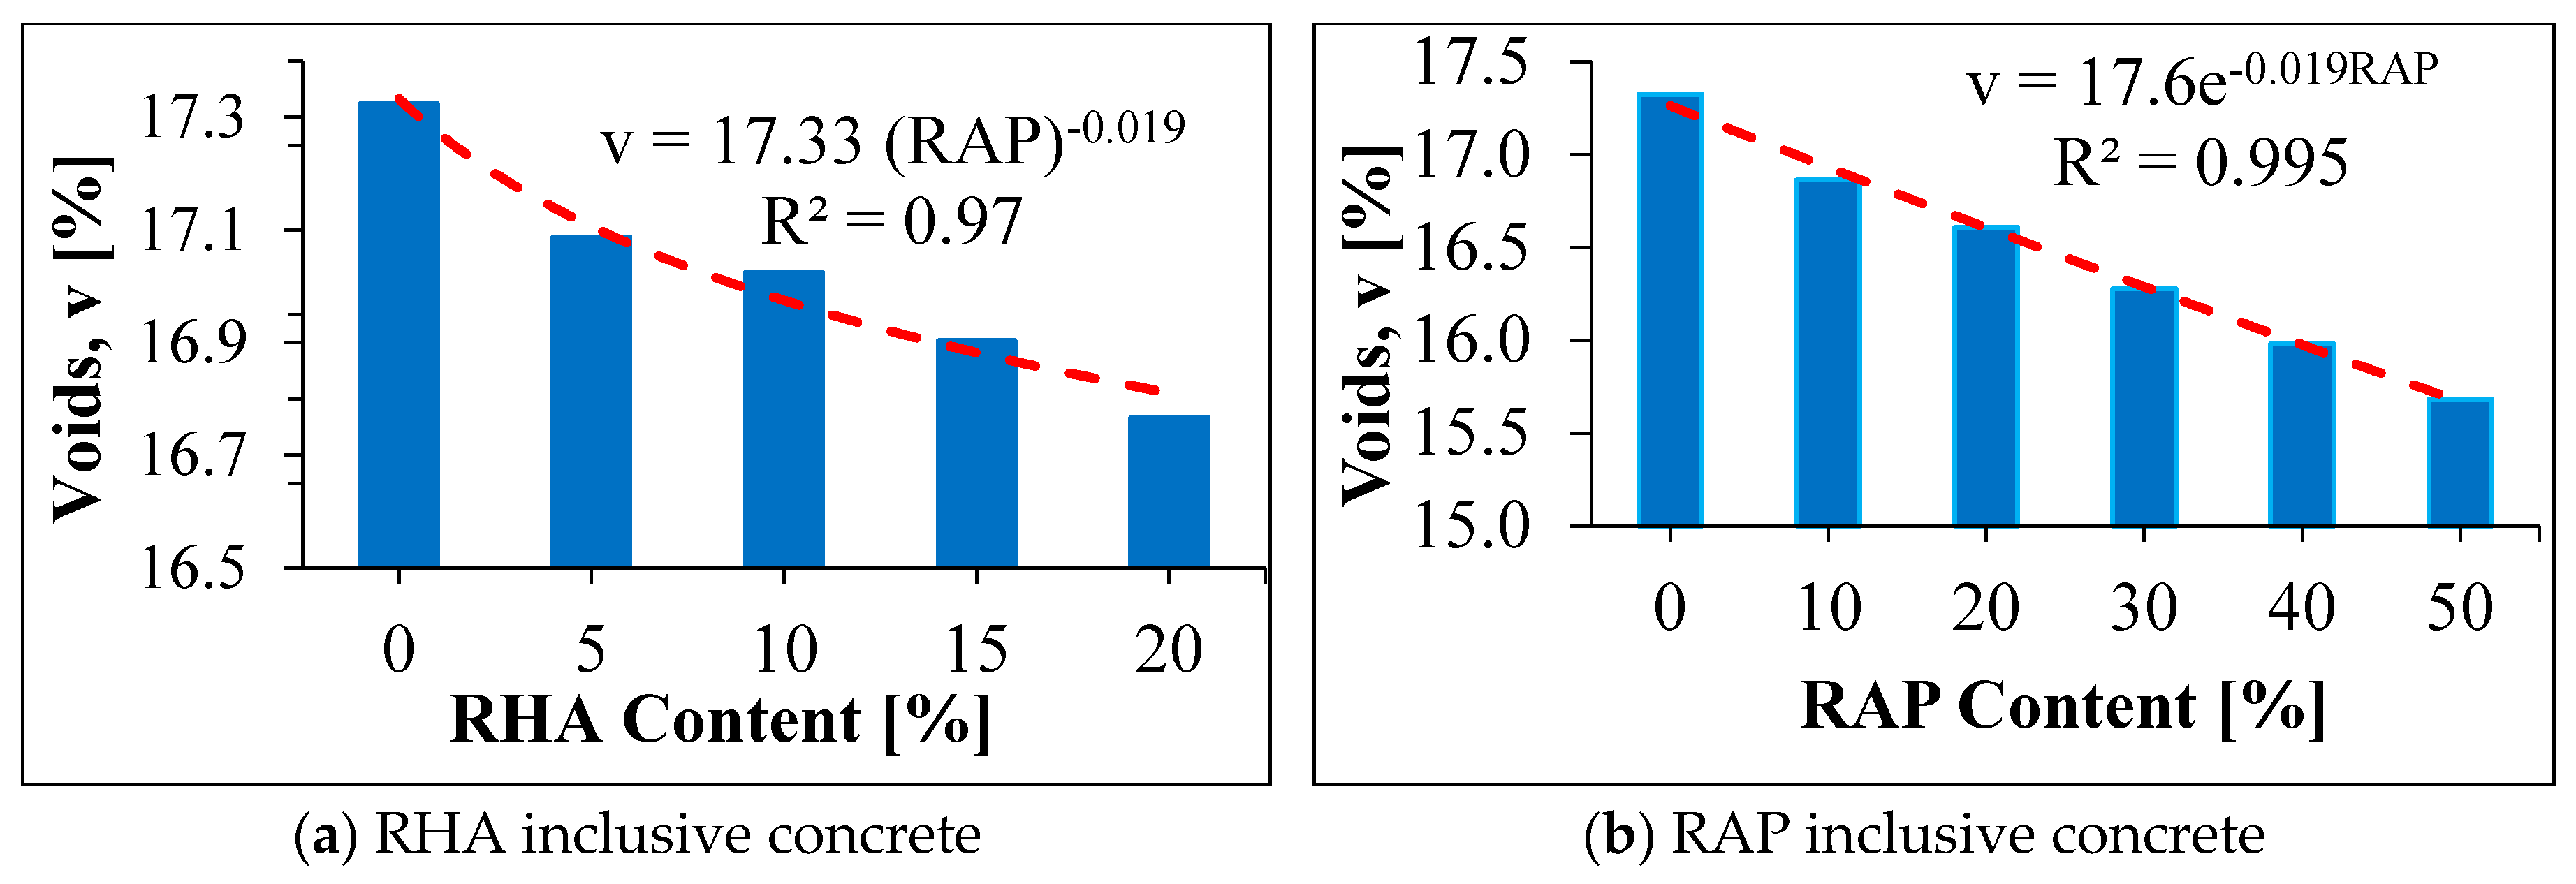
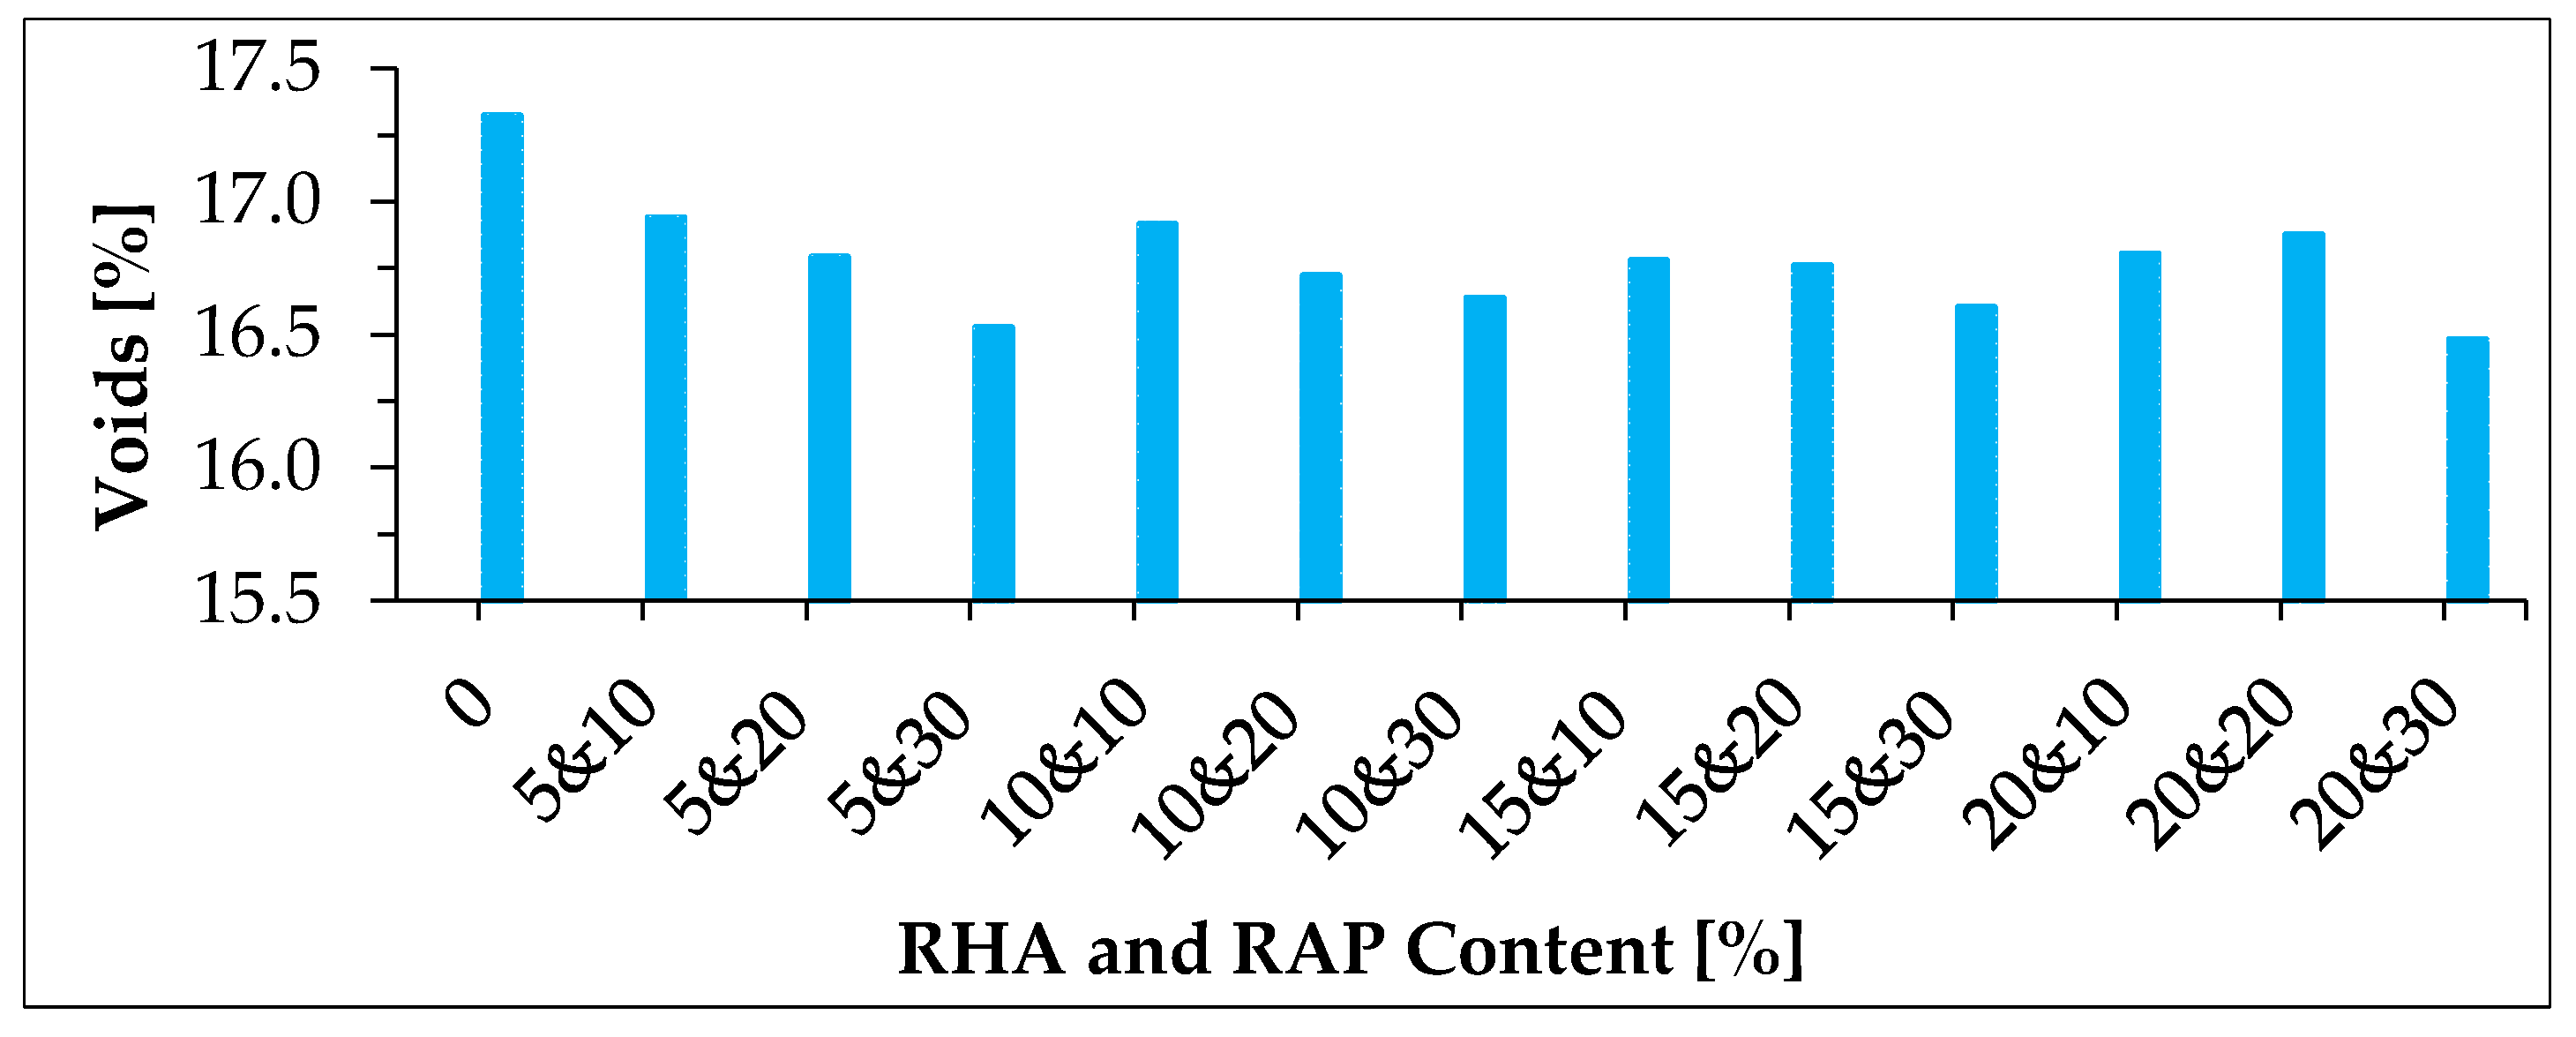
• Volume of Permeable Void Spaces in Hardened Concrete
The volume of permeable void spaces in hardened RHA inclusive concrete decreased slightly with increment of RHA. The voids decreased by 3.22% from 17.32 to 16.77% as the RHA content increased from 0 to 20%. The reduction in void space might be attributed to the finer siliceous particles which could fill a portion of void spaces that exist in the concrete matrix. As can be seen from Figure 17a and Equation (12), a power function was found as a good fit (R2 = 0.970 and SEE = 0.026) to correlate RHA content with the voids.
Figure 17b depicts the volume of permeable void spaces in RAP inclusive concrete. It is clear from the figure that voids decreased exponentially with an increment of RAP content. The voids decreased by 9.47% from 17.32 to 15.68% as the RAP content increased from 0 to 50%. The reduction in void space could be due to the lower water absorption of RAP aggregates compared to that of virgin aggregates and oozed out asphalt film which could fill a portion of voids spaces in concrete. As can be seen from Equation (13), an exponential function was obtained from regression analysis to correlate RAP content with the voids (R2 = 0.995 and SEE = 0.024).
v = 17.33 × RHA 0.019
v = 17.36 × e 0.019 × RAP
where: v is the volume of permeable void spaces in %; and RHA is the rice husk ash content in %; and RAP is the reclaimed asphalt pavement content in %.
A relationship between voids and water absorption for RHA concrete was determined as shown in Figure 18a and Equations (14) and (15). According to the correlation found, water absorption decreased exponentially as the void in concrete decreased. Water absorption by RAP concrete decreased exponentially with voids in concrete as shown in Figure 18b, and Equations (16) and (17).
w i = 4.79 × e 0.024 × v
w i & b = 3.87 × e 0.027 × v
w i = 2.25 × e 0.067 × v
w i & b = 3.89 × e 0.037 × v
where: w i is absorption after immersion in %; wi&b is absorption after immersion and boiling; and v is the volume of permeable void spaces in %.
The volume of permeable void spaces in both RHA and RAP inclusive PCC is portrayed in Figure 19. As expected, the relative percentage of reduction of voids (4.86%) in both RHA and RAP inclusive PCC is higher than that of RHA inclusive PCC (3.22%) but lower than that of RAP inclusive PCC (9.47) by 1.64 and 4.61% respectively.
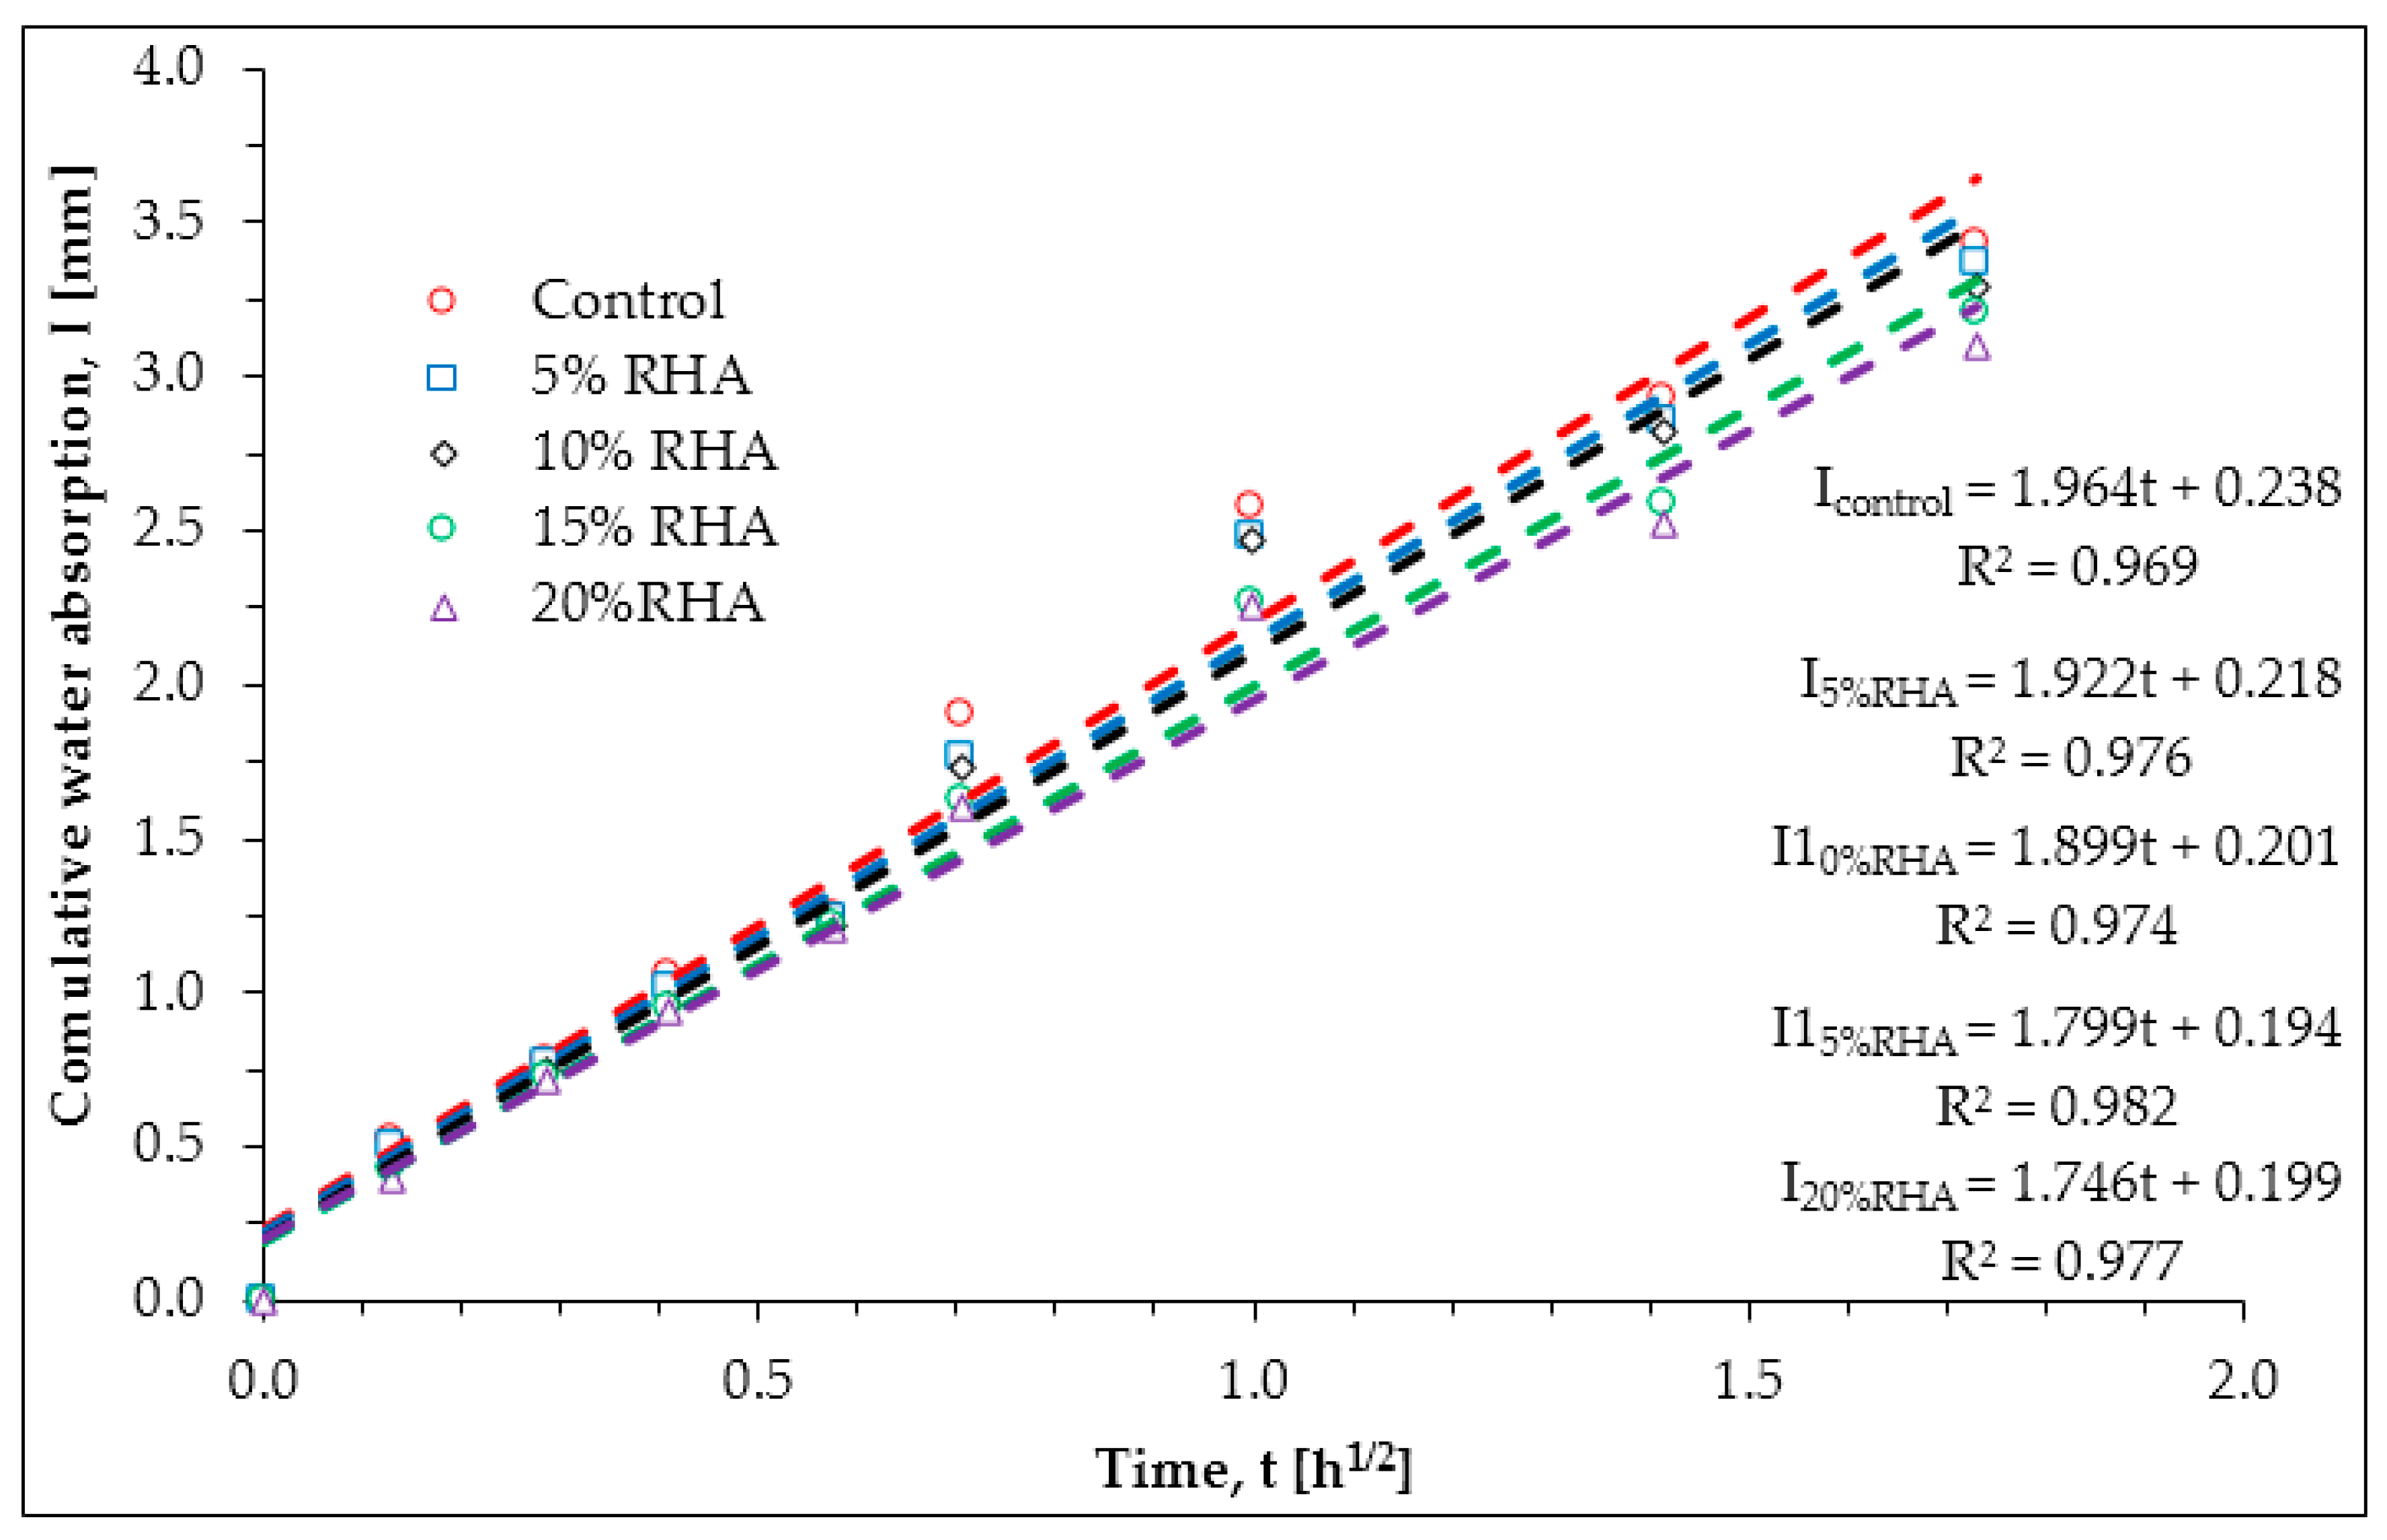
• Sorptivity
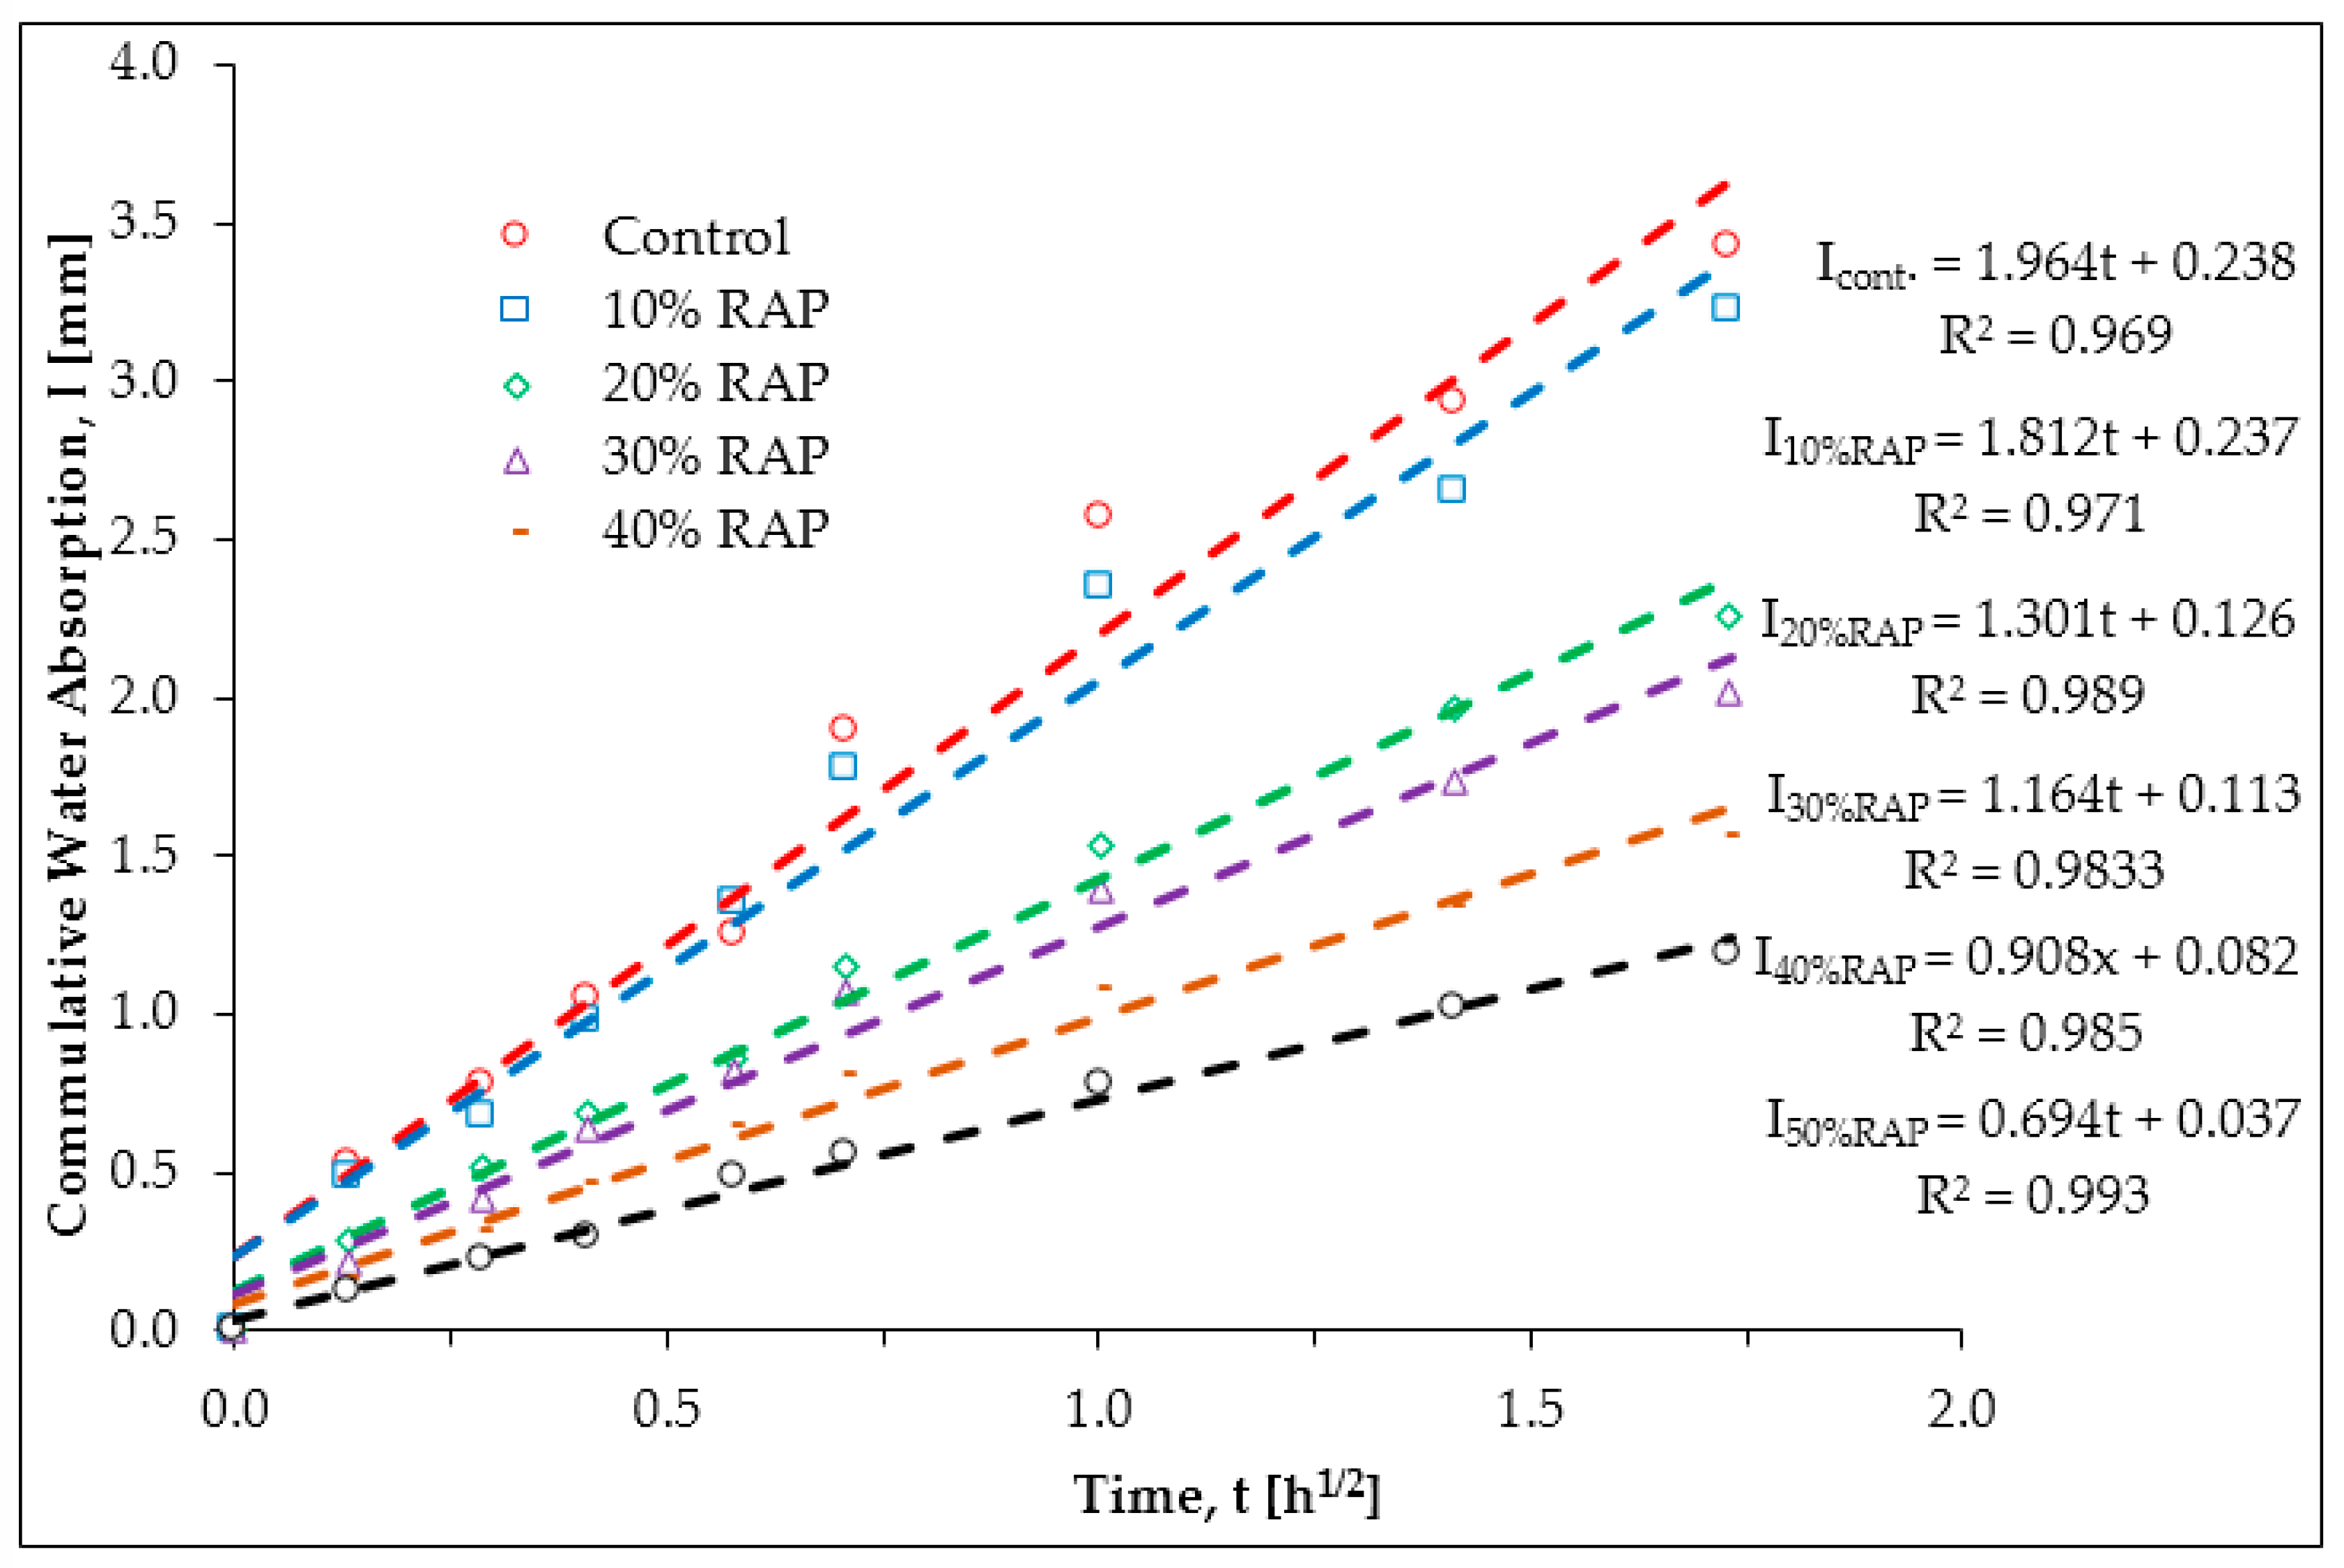
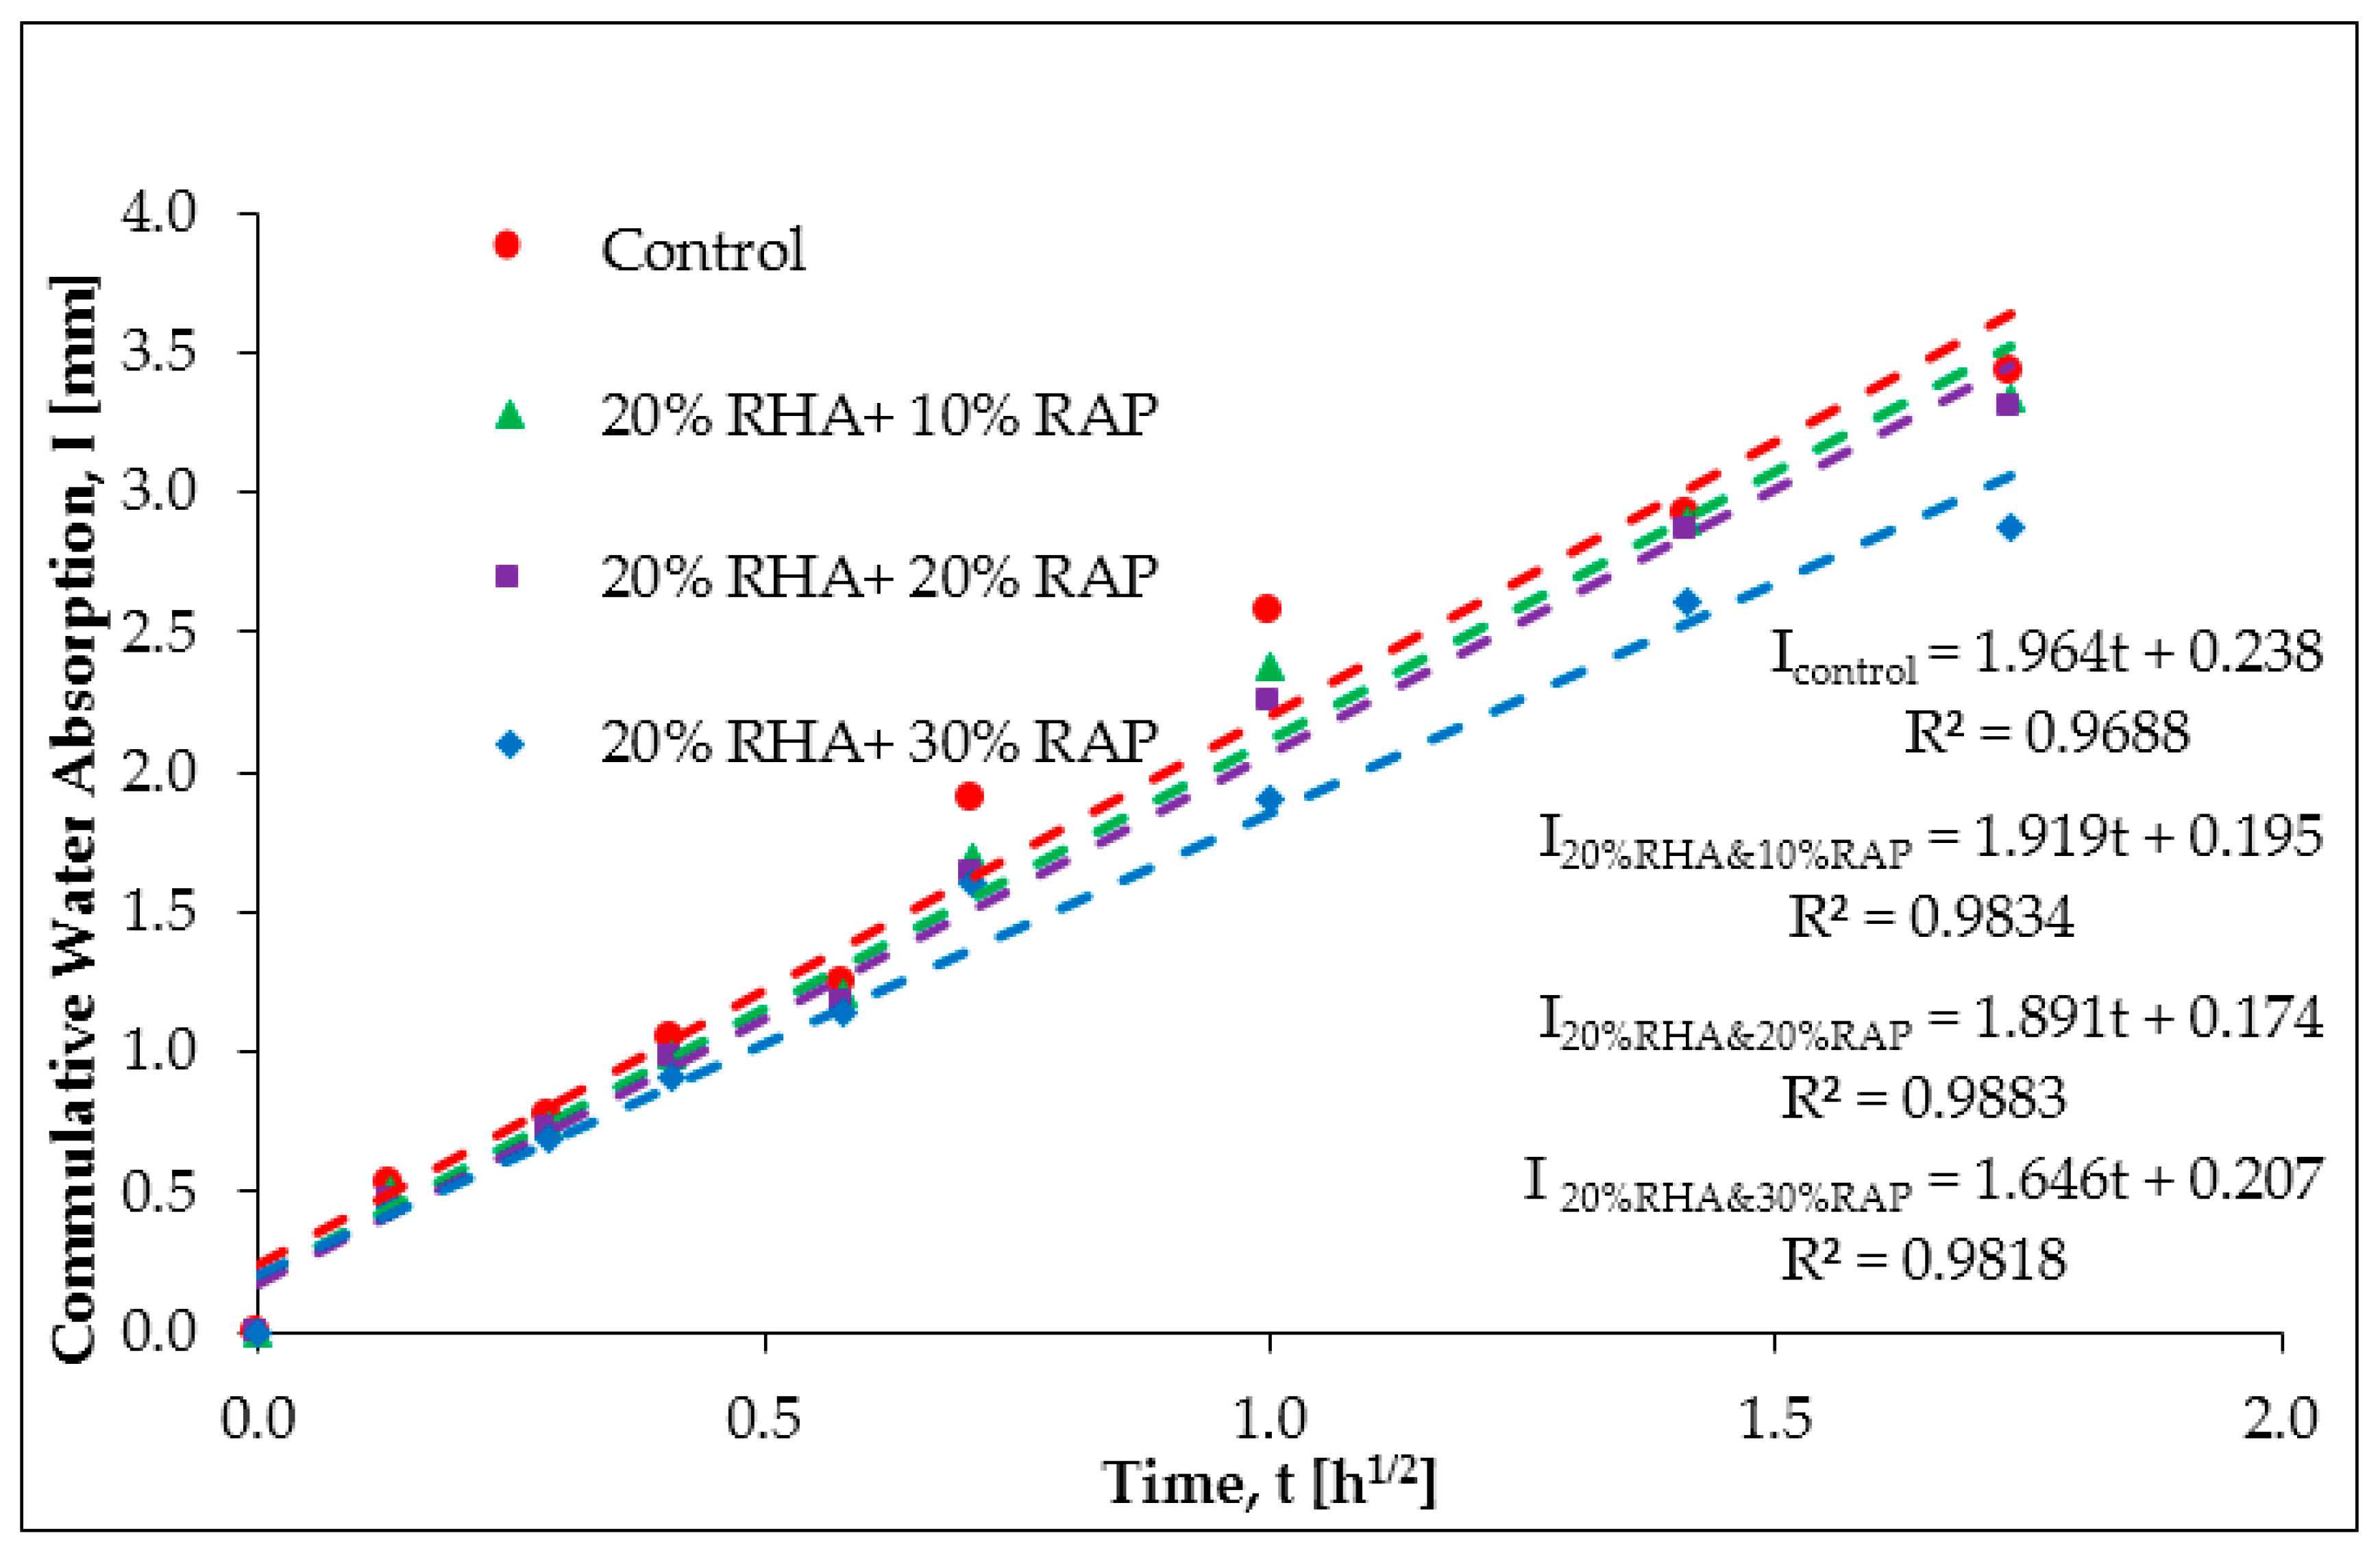
The sorptivity by RHA concrete, shown in Table 10, was obtained from the slope of the line that is the best fit to the cumulative amount of water absorption (I) plotted against the square root of time (t1/2), depicted in Figure A1 and Figure A2 shows the cumulative amount of water absorption from which the sorptivity of RAP inclusive concrete was determined and tabulated in Table 11.
The effect of RHA content on the sorptivity of concrete is depicted in Figure 20a. As can be seen from Equation (18), the sorptivity decreased linearly as the RHA content increased. The sorptivity decreased by 11.1% from 1.964 to 1.746 mm/h1/2 when RHA content increased from 0 to 20%. The reduction in sorptivity might be due to the fact that finer RHA particles filled up air voids exist in the concrete matrix, as a result of which the rate of ingress of water was inhibited. The influence of RAP content on the sorptivity of concrete is also portrayed in Figure 20b. Sorptivity decreased significantly as the content of RAP increased. A linear relationship was found between RAP content and sorptivity, and Equation (19) represents the same. Similar findings were reported in the previous studies [13,27]. The main reason being given for the reduction in sorptivity was the melted asphalt layer surrounding the RAP aggregates. In addition, the authors of this paper believed that the reduction in sorptivity might also be ascribed to the lower water absorption by the RAP aggregates compared to that of the virgin aggregates.
k = k o 0.0112 × RHA
where: k and ko are the sorptivity by RHA inclusive concrete and concrete without RHA respectively in mm/h1/2; and RHA is the rice husk ash content in %.
k = k o 0.0236 × RAP
where: k and ko are the sorptivity by RAP inclusive concrete and concrete without RAP, respectively, in mm/h1/2; and RAP is the reclaimed asphalt pavement content, in %.
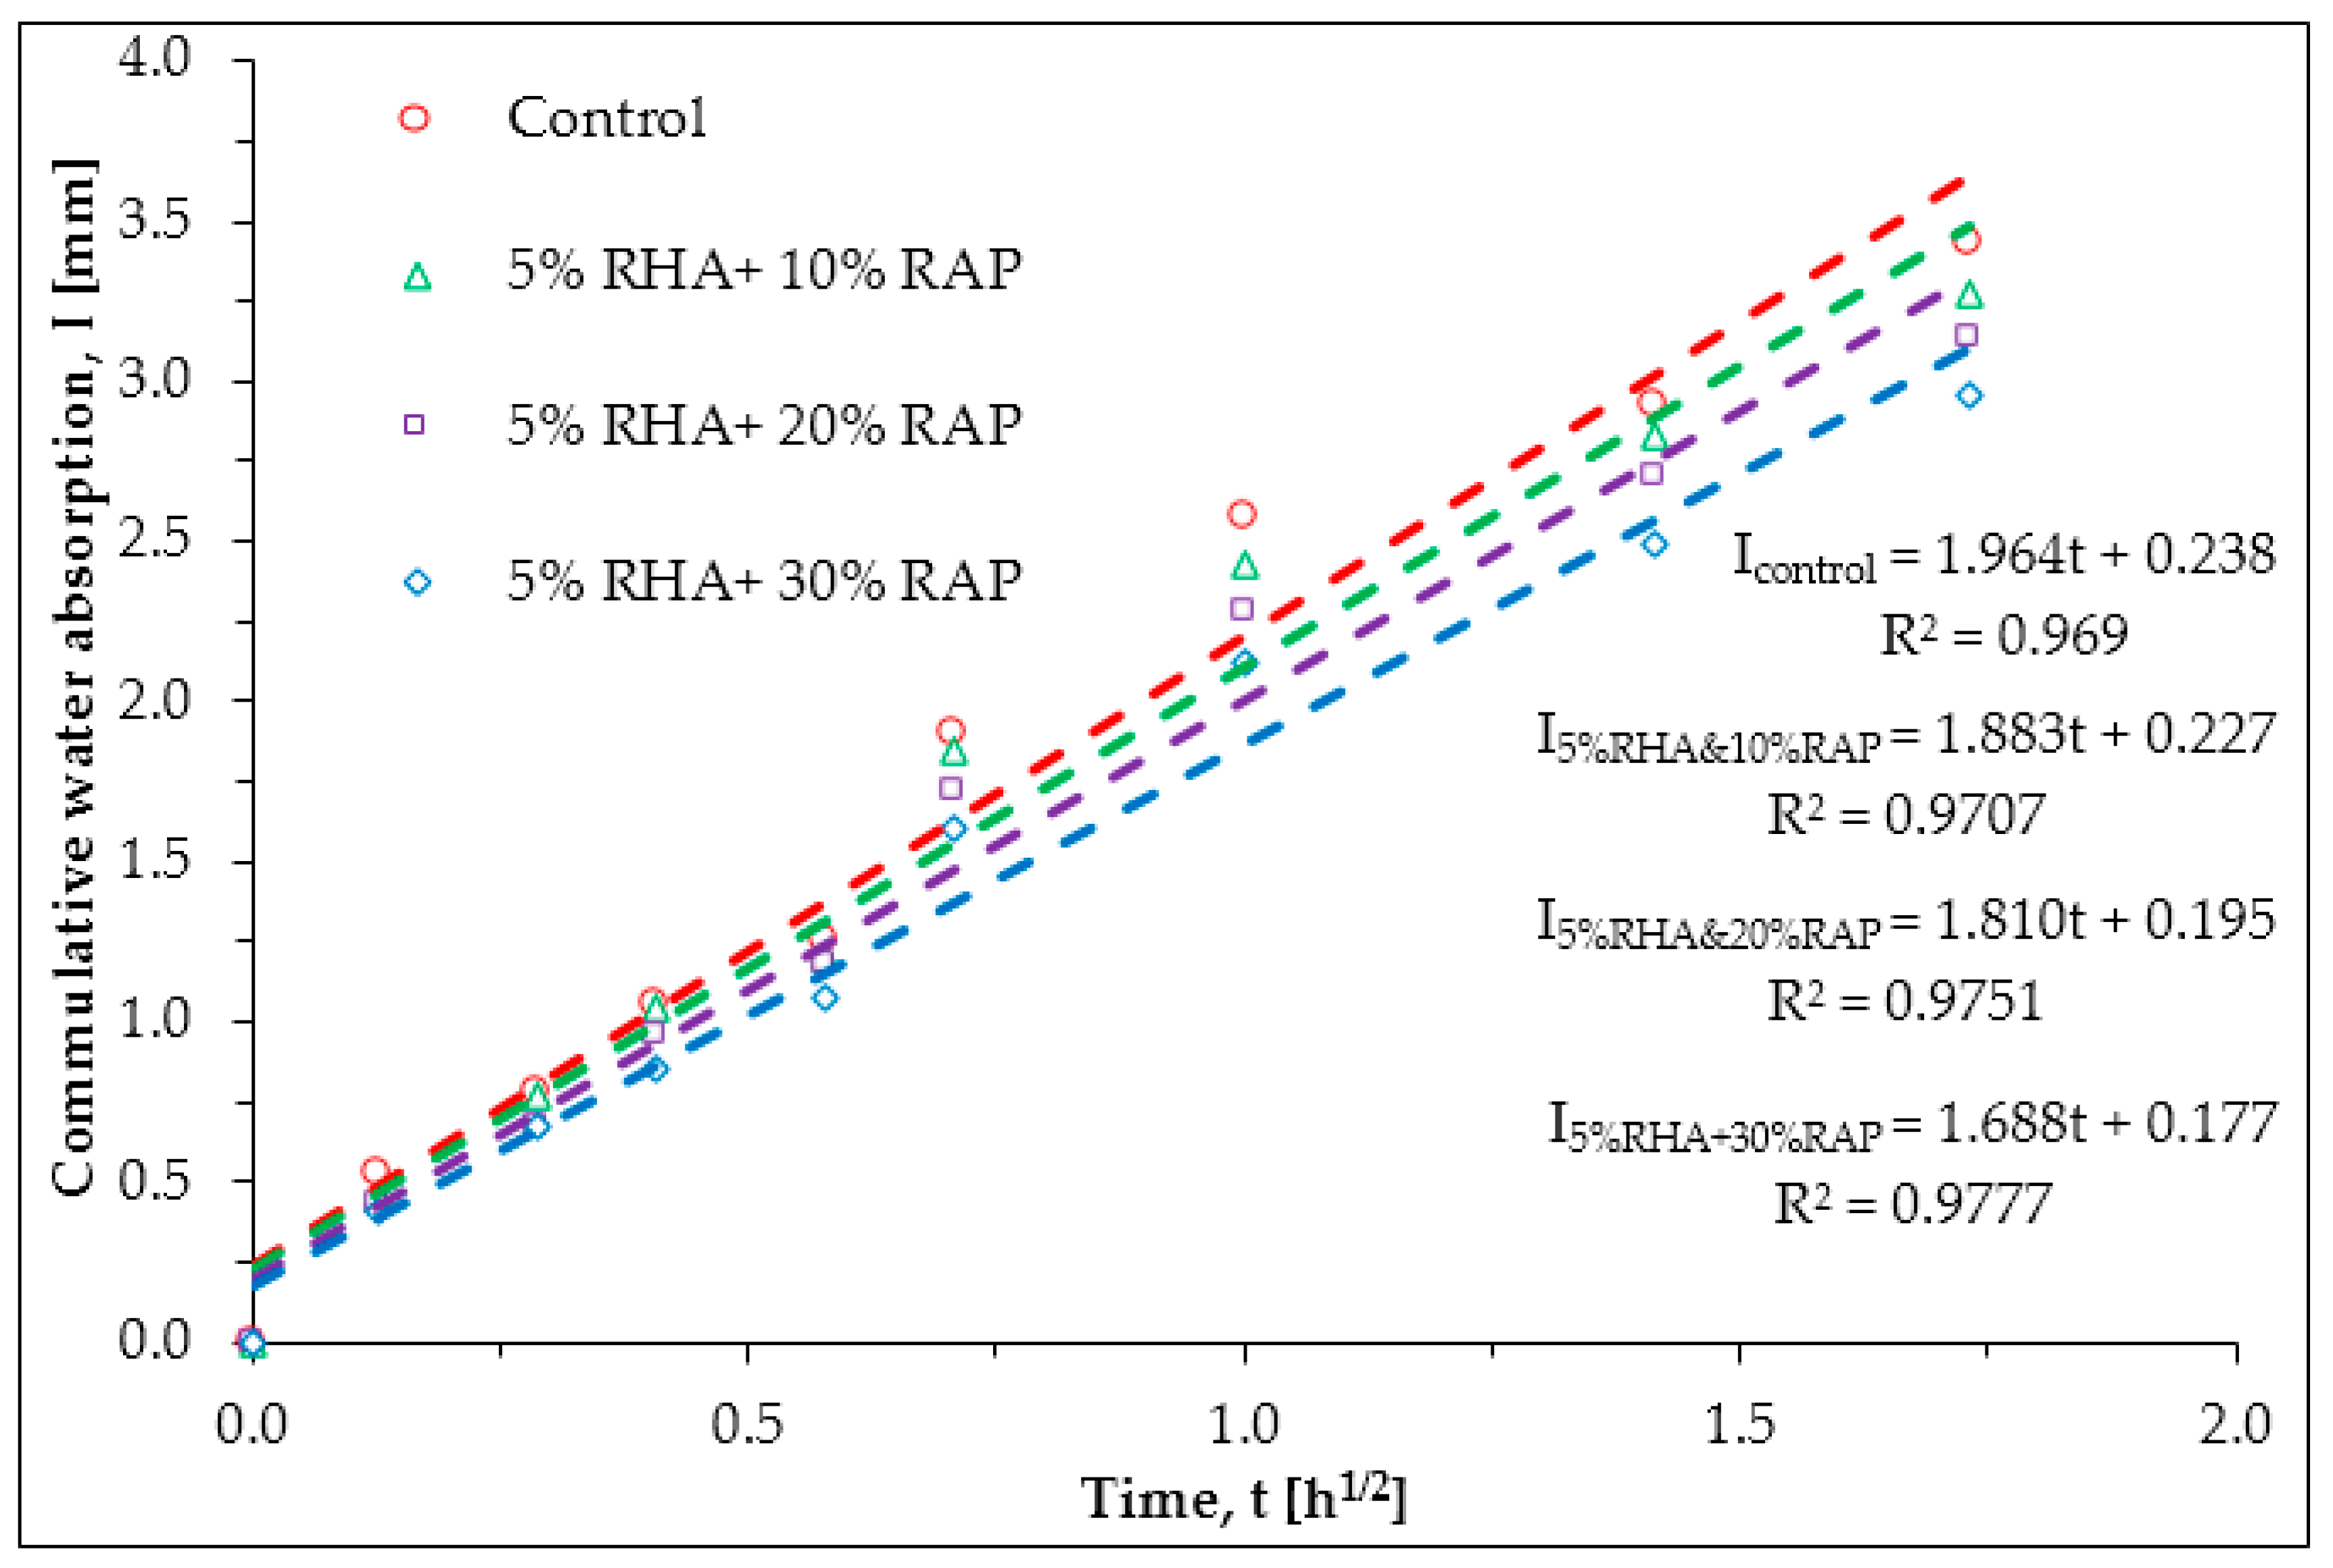
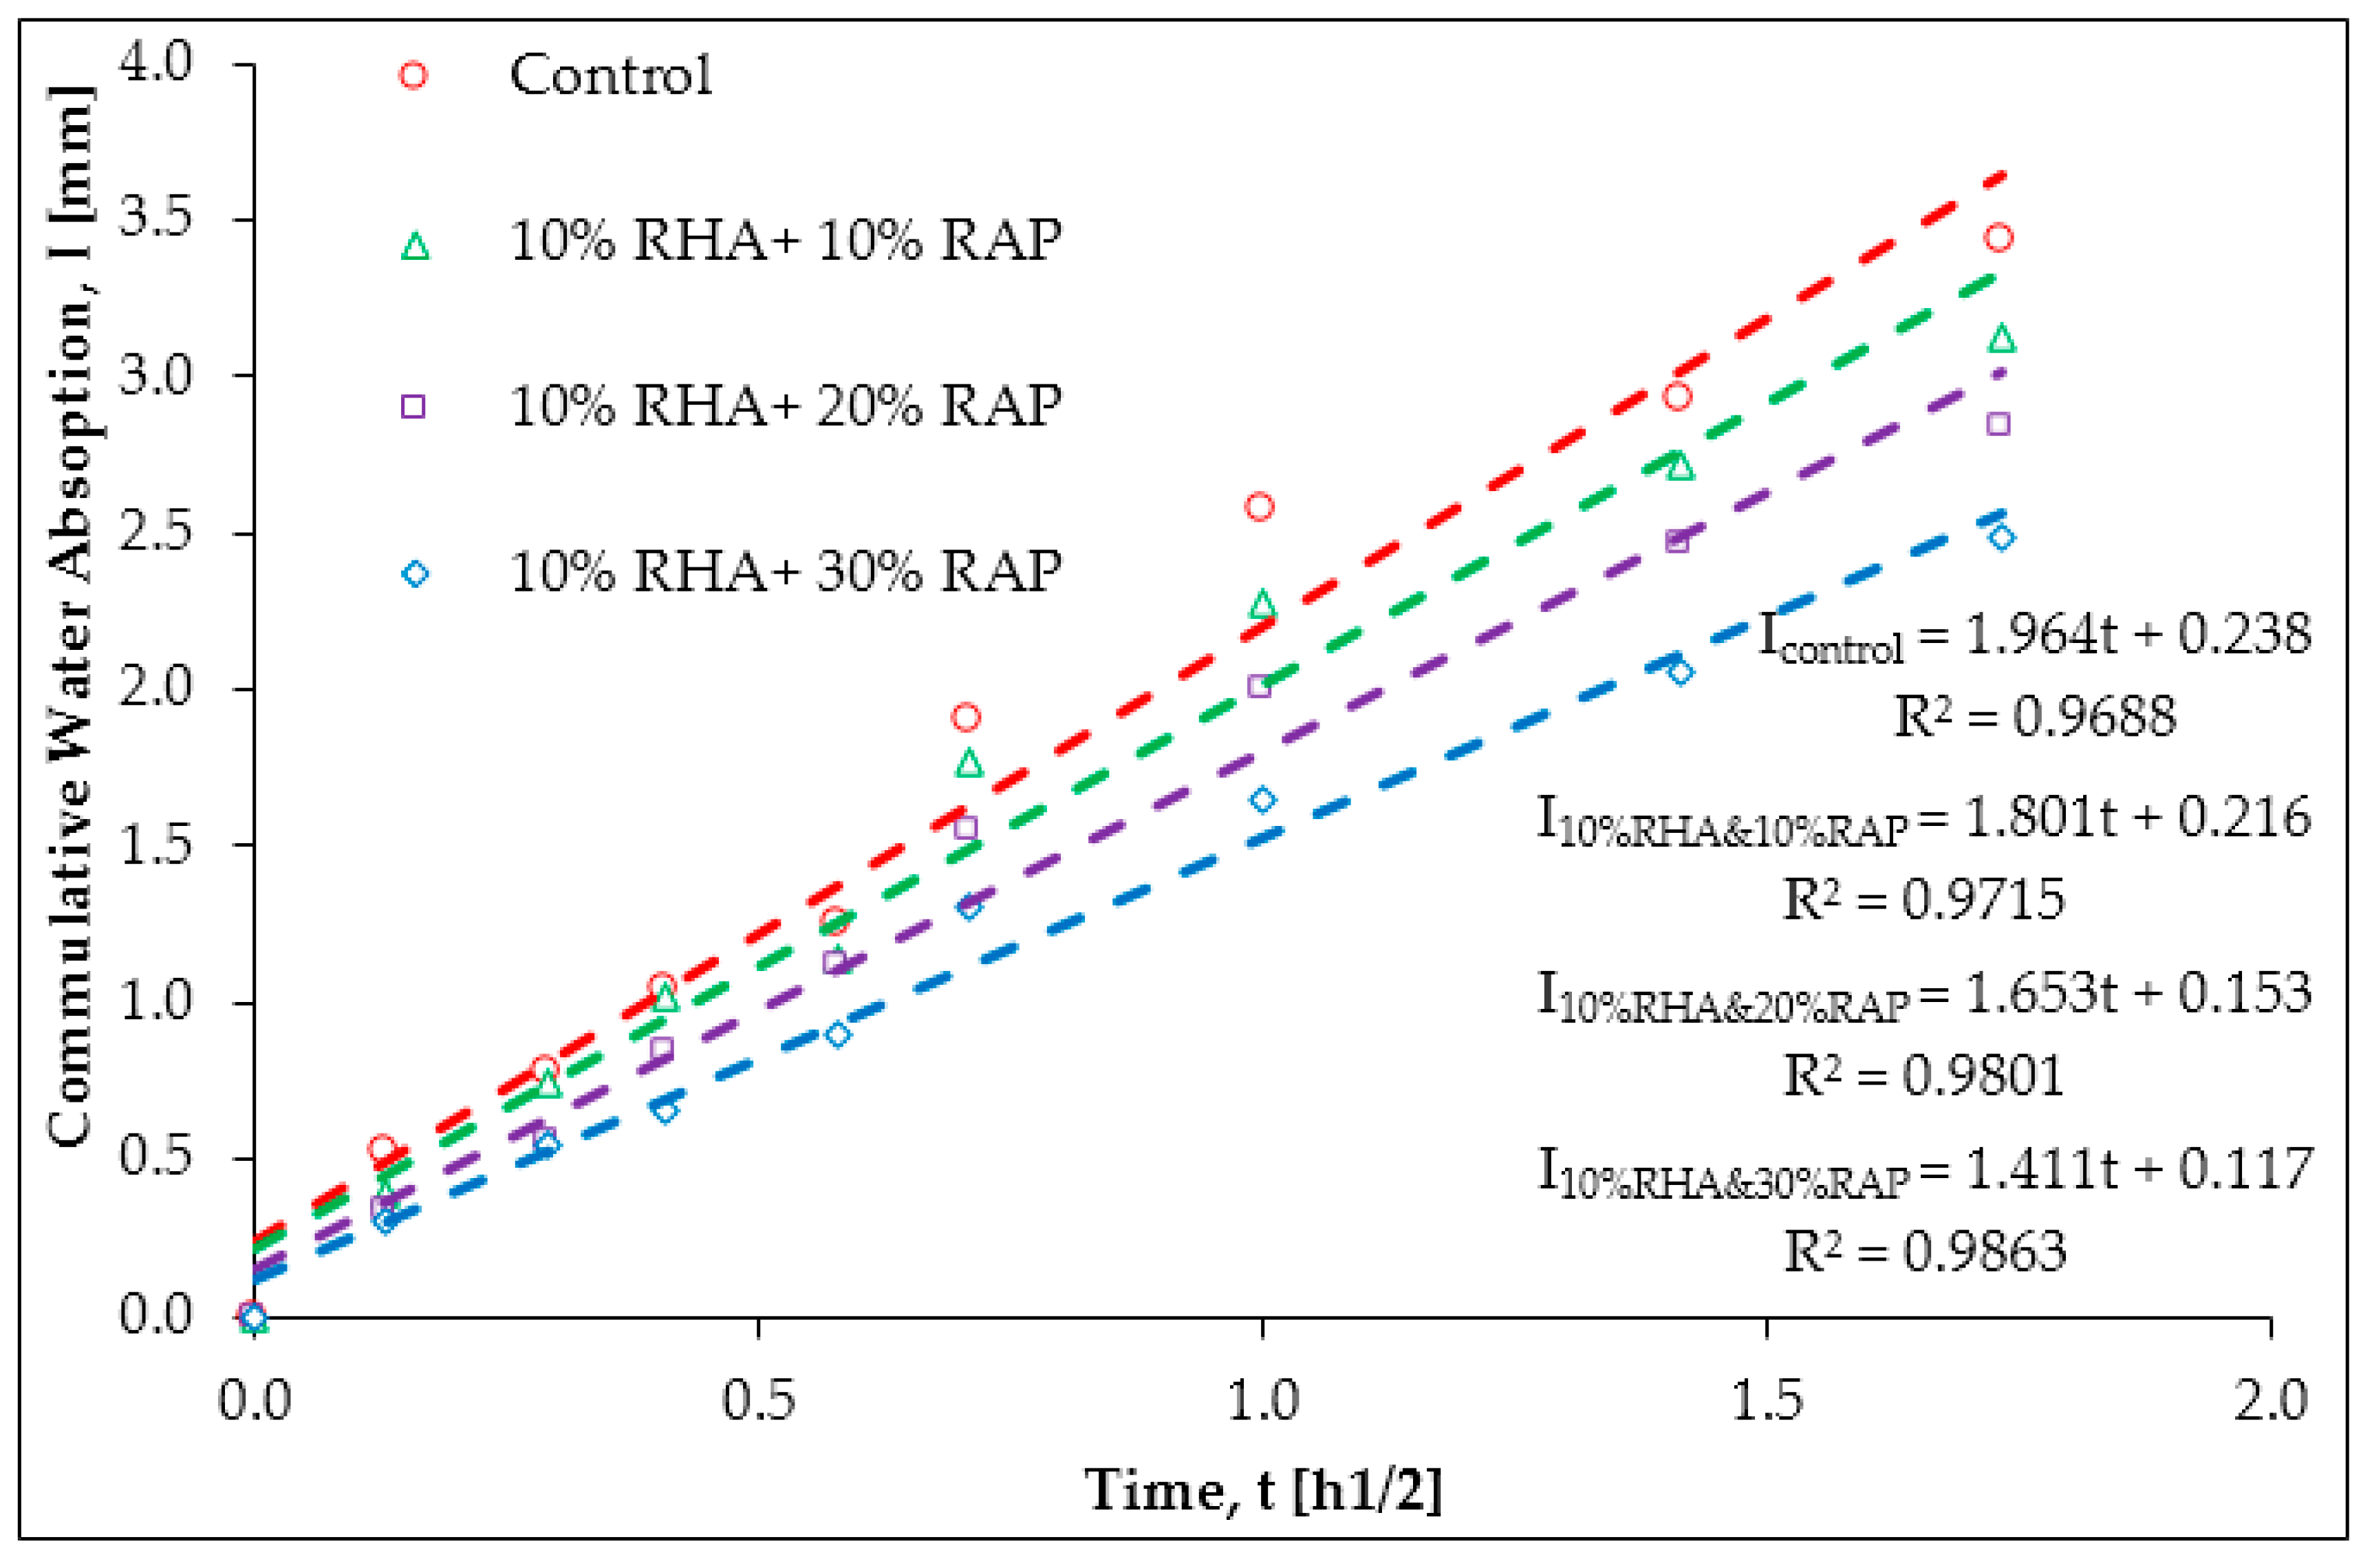
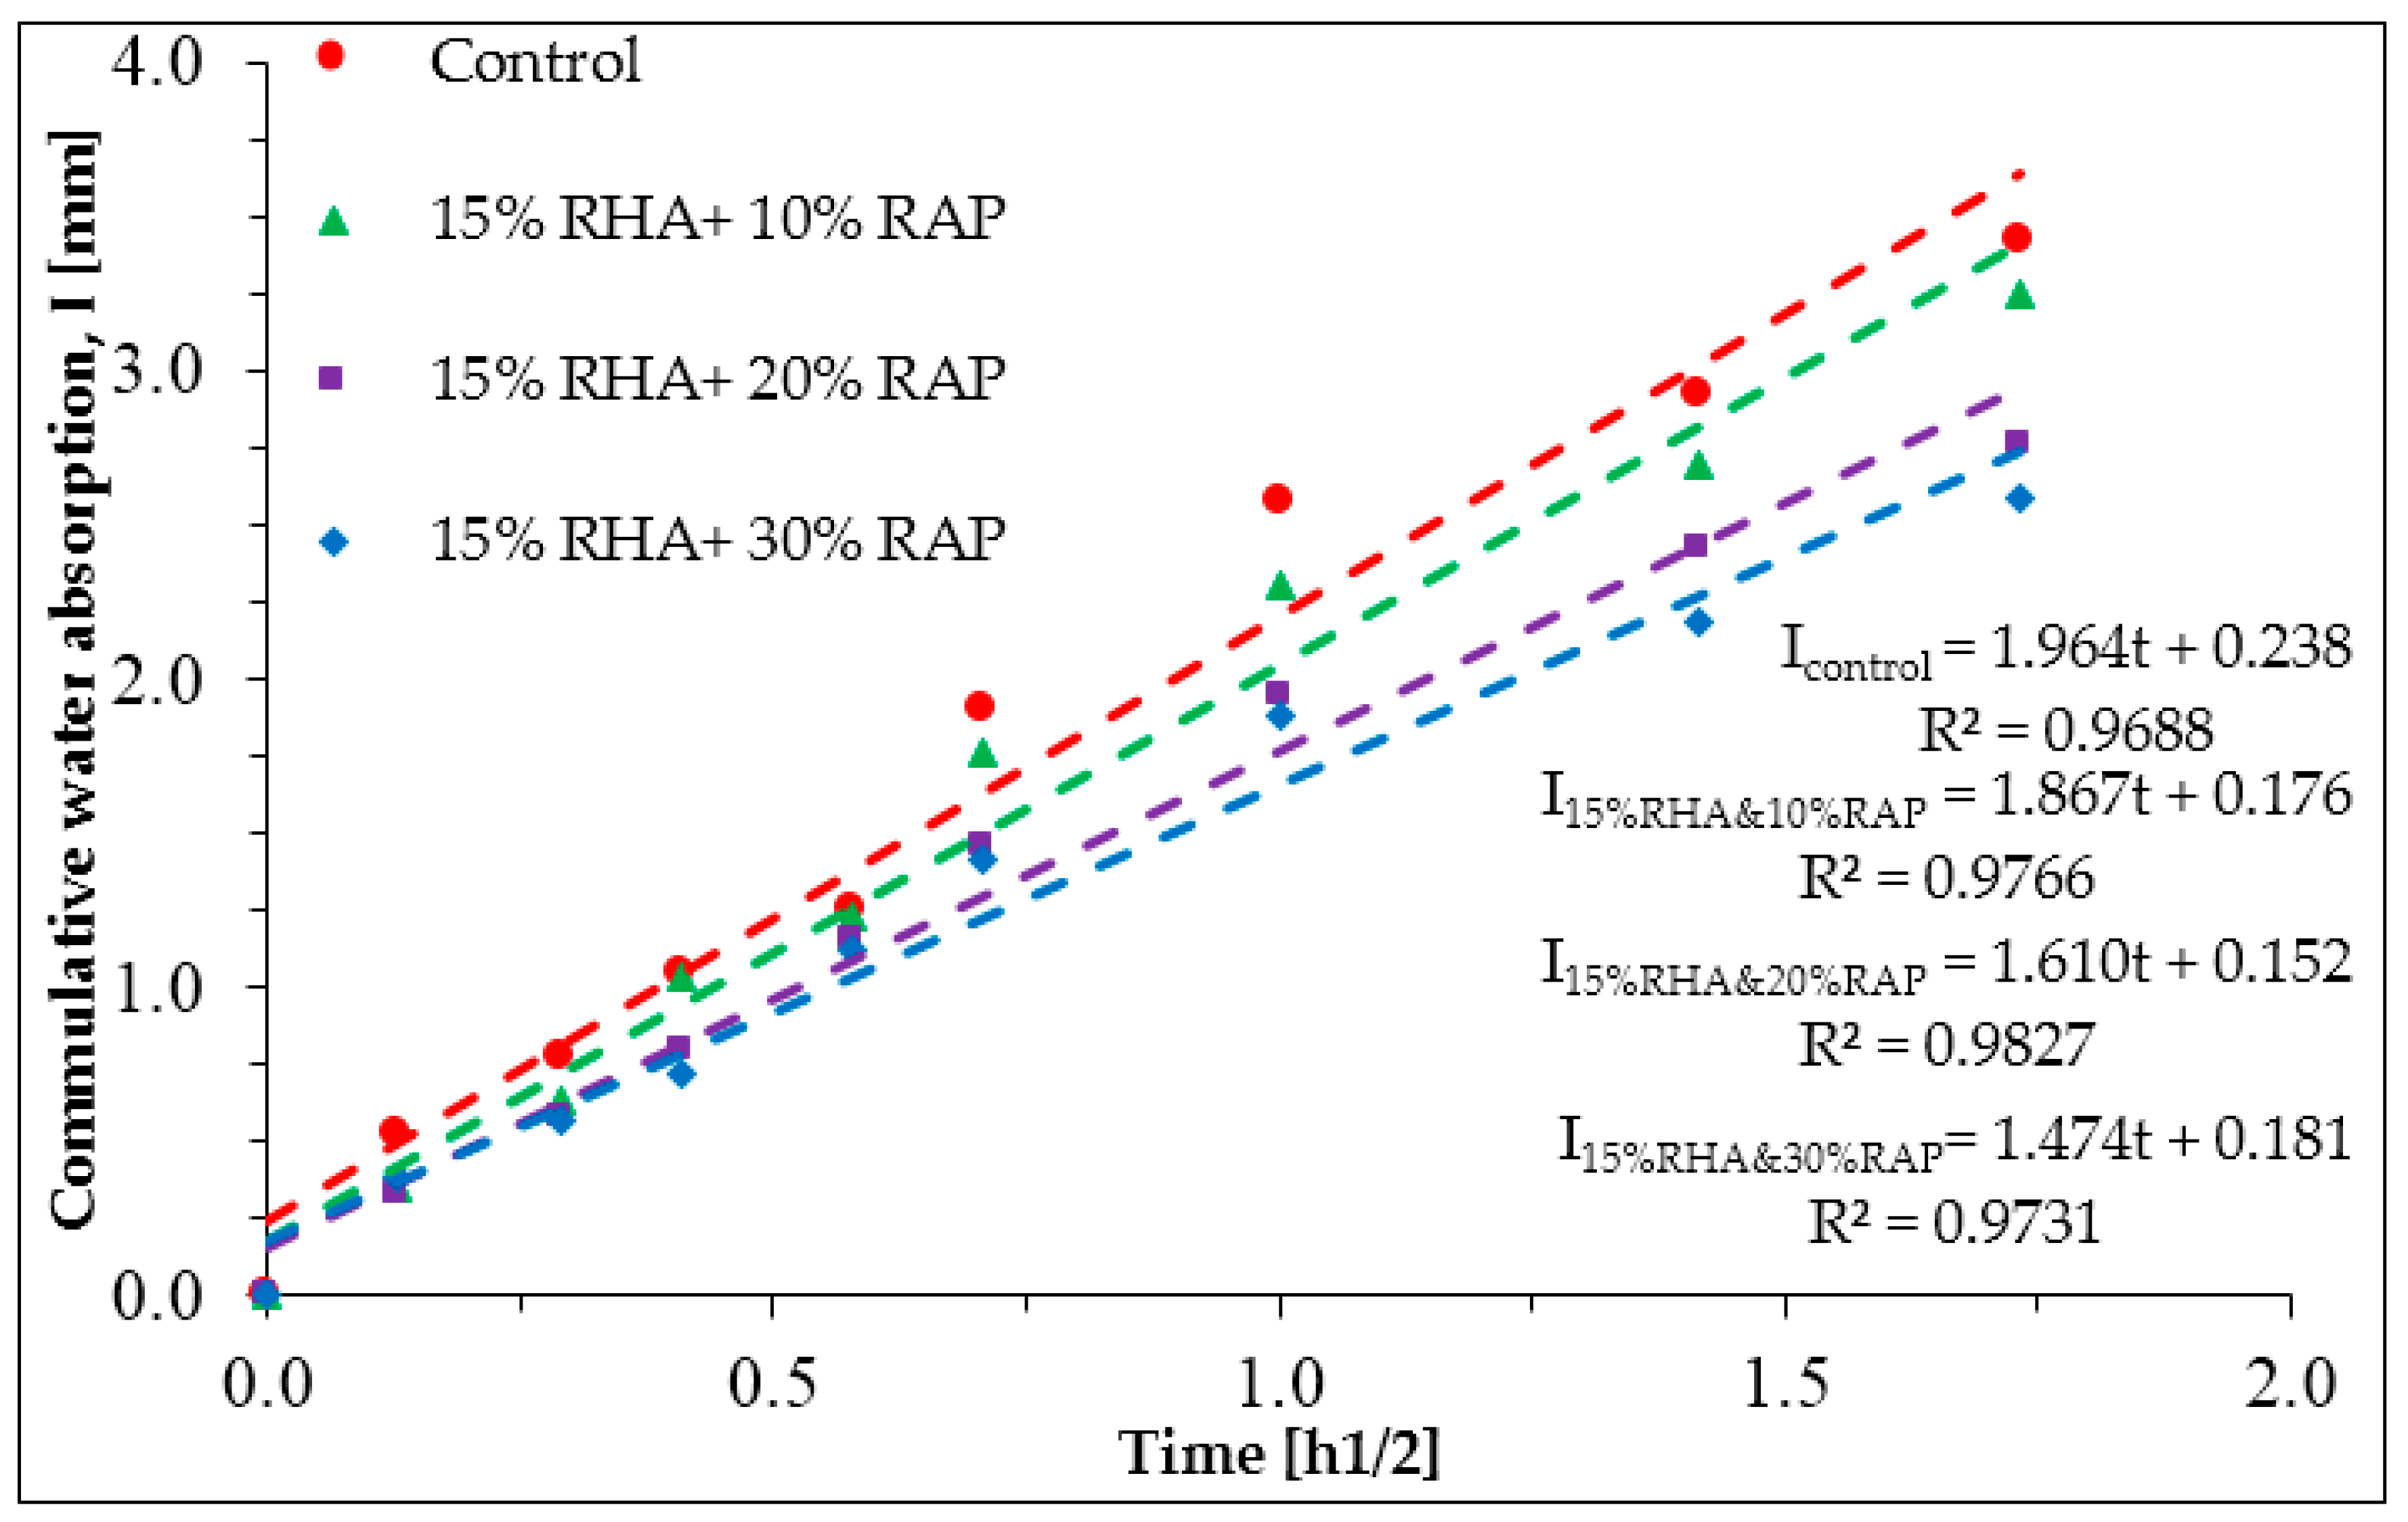
Figure A3, Figure A4, Figure A5 and Figure A6 depict the cumulative amount of water absorption (I) plotted against the square root of time (t1/2), from which the sorptivity by both RHA and RAP inclusive concrete was determined and tabulated in Table 12.
It is evident from experimental results that the sorptivity by RHA and RAP inclusive concrete was decreased as expected. The reduction in sorptivity ranged from 2.29 to 28.16% relative to the control specimens. The reduction in sorptivity could be due to the combined influences of RHA and RAP as already discussed.
Although sorptivity value alone does not suffice to envisage the service life of a structure [63], according to the research conducted by Hinczak, Conroy, and Lewis, cited in the study [64], a concrete is said to be durable if sorptivity is less than 6 mm/h1/2. The experimental results of this study revealed that all concrete specimens had sorptivity values under the limit specified i.e., considered as durable concrete holding other factors constant.

4. Conclusions

The effects of RHA and RAP on the engineering properties of concrete were studied. Based on the experimental results obtained and the analysis and discussion made, the following conclusions can be drawn:
  • The water demand of the mix increased as the RHA and RAP content increased; as a result, the slump and compaction factor of the fresh concrete decreased significantly.
  • The density of concrete decreased with increasing RHA and RAP content in the concrete mix.
  • RHA-inclusive concrete exhibited an increase in both compressive and tensile splitting strength. The maximum possible strength was obtained when cement was replaced by 15% RHA.
  • Compressive and tensile splitting strength decreased drastically as the RAP content increased beyond 20%.
  • Comparable strength and favorable sorptivity values were obtained when 15% RHA was combined with up to 20% RAP in the concrete mix.
  • Specimens containing both RHA and RAP exhibited lower water absorption, permeable void space and sorptivity values compared to that of the control specimens. This indicates that RHA and RAP inclusive concrete might perform better when subjected to aggressive environment.

Author Contributions

S.M.S., M.A.G. and Z.C.A.G. designed the experiments; M.A.G. performed the experiment and collected data; S.M.S. and M.A.G. analyzed the data; Z.C.A.G. facilitated resources; M.A.G., S.M.S. and Z.C.A.G. wrote the paper.

Funding

The authors wish to thank the African Union Commission (AUC) and Japan International Cooperation Agency (JICA) for funding this research.

Conflicts of Interest

The authors confirm that there are no known conflicts of interest.

Appendix A. Cumulative Water Absorption

Figure A1. Cumulative water absorption by RHA Concrete.
Buildings 08 00115 g0a1
Figure A2. Cumulative water absorption by RAP Concrete.
Buildings 08 00115 g0a2
Figure A3. Cumulative water absorption by 5% RHA and (10–30) % RAP-inclusive concrete.
Buildings 08 00115 g0a3
Figure A4. Cumulative water absorption by 10% RHA and (10–30) % RAP-inclusive concrete.
Buildings 08 00115 g0a4
Figure A5. Cumulative water absorption by 15% RHA and (10–30) % RAP-inclusive concrete.
Buildings 08 00115 g0a5
Figure A6. Cumulative water absorption by 20% RHA and (10–30) % RAP-inclusive concrete.
Buildings 08 00115 g0a6

References

  1. World Economic Forum. Shaping the Future of Construction: A Breakthrough in Mindset and Technology; World Economic Forum: Cologny, Switzerland, 2016. [Google Scholar]
  2. Meyer, C. The greening of the concrete industry. Cem. Concr. Compos. 2009, 31, 601–605. [Google Scholar] [CrossRef]
  3. Kosmatka, A.W. Design and Control of Concrete Mixtures, 5th ed.; Portland Cement Association: New York, NY, USA, 2011. [Google Scholar]
  4. Suhendro, B. Toward green concrete for better sustainable environment. Procedia Eng. 2014, 95, 305–320. [Google Scholar] [CrossRef]
  5. Benhelal, E.; Zahedi, G.; Shamsaei, E.; Bahadori, A. Global strategies and potentials to curb CO2 emissions in cement industry. J. Clean. Prod. 2013, 51, 142–161. [Google Scholar] [CrossRef]
  6. Khan, R.; Jabbar, A.; Ahmad, I.; Khan, W.; Naeem, A.; Mirza, J. Reduction in environmental problems using rice-husk ash in concrete. Constr. Build. Mater. 2012, 30, 360–365. [Google Scholar] [CrossRef]
  7. Pin, K.; Behnood, A.; Ash, F. Effects of deicers on the performance of concrete pavements containing air-cooled blast furnace slag and supplementary cementitious materials. Cem. Concr. Compos. 2018, 90, 27–41. [Google Scholar]
  8. Adom-Asamoah, M. Comparative Study of the Physical Properties of Palm Kernel Shell Concrete and Normal Concrete in Ghana; University of Johannesburg: Johannesburg, South Africa, 2013. [Google Scholar]
  9. Lun, L.T. Effects of Rice Husk Ash Produced from Different Temperatures on the Performance of Concrete; Faculty of Engineering and Green Technology Universiti Tunku Abdul Rahman: Petaling Jaya, Malaysia, 2015. [Google Scholar]
  10. Ismail, S.; Wai, K.; Ramli, M. Sustainable aggregates: The potential and challenge for natural resources conservation. Procedia Soc. Behav. Sci. 2013, 101, 100–109. [Google Scholar] [CrossRef]
  11. Aprianti, E.; Shafigh, P.; Bahri, S.; Nodeh, J. Supplementary cementitious materials origin from agricultural wastes—A review. Constr. Build. Mater. 2015, 74, 176–187. [Google Scholar] [CrossRef]
  12. Alex, J.; Dhanalakshmi, J.; Ambedkar, B. Experimental investigation on rice husk ash as cement replacement on concrete production. Constr. Build. Mater. 2016, 127, 353–362. [Google Scholar] [CrossRef]
  13. Bida, S.M.; Danraka, M.N.; Ma’ali, J.M. Performance of Reclaimed Asphalt Pavement (RAP) as a Replacement of Fine Aggregate in Concrete. Int. J. Sci. Res. 2016, 5, 2015–2017. [Google Scholar]
  14. Singh, S.; Ransinchung, G.D.R.N.; Debbarma, S.; Kumar, P. Utilization of reclaimed asphalt pavement aggregates containing waste from Sugarcane Mill for production of concrete mixes. J. Clean. Prod. 2018, 174, 42–52. [Google Scholar] [CrossRef]
  15. Behnood, A.; Modiri, M.; Gozali, F.; Ameri, M. Effects of copper slag and recycled concrete aggregate on the properties of CIR mixes with bitumen emulsion, rice husk ash, Portland cement and fly ash. Constr. Build. Mater. 2015, 96, 172–180. [Google Scholar] [CrossRef]
  16. Food and Agriculture Organization. FAO Rice Market Monitor; FAO: Rome, Italy, 2017. [Google Scholar]
  17. Tuaum, W.O.A.; Shitote, S. Incorporating Recycled Glass Aggregate. Buildings 2018, unpublished. [Google Scholar]
  18. Szilagyi, F.H.; Dico, C. Concrete production with recycled materials in the sustainable development context. J. Environ. Res. Prot. 2016, 13, 19–25. [Google Scholar]
  19. American Society of Civil Engineers. Sustainable Construction Materials; American Society of Civil Engineers: Reston, VA, USA, 2012. [Google Scholar]
  20. Modarres, A.; Hosseini, Z. Mechanical properties of roller compacted concrete containing rice husk ash with original and recycled asphalt pavement material. J. Mater. Des. 2014, 64, 227–236. [Google Scholar] [CrossRef]
  21. Johari, M.A.M.; Brooks, J.J.; Kabir, S.; Rivard, P. Influence of supplementary cementitious materials on engineering properties of high strength concrete. Constr. Build. Mater. 2011, 25, 2639–2648. [Google Scholar] [CrossRef]
  22. Elahi, A.; Basheer, P.A.M.; Nanukuttan, S.V.; Khan, Q.U.Z. Mechanical and durability properties of high performance concretes containing supplementary cementitious materials. Constr. Build. Mater. 2010, 24, 292–299. [Google Scholar] [CrossRef]
  23. Snellings, R.; Salze, A.; Scrivener, K.L. Cement and Concrete Research Use of X-ray diffraction to quantify amorphous supplementary cementitious materials in anhydrous and hydrated blended cements. Cem. Concr. Res. 2014, 64, 89–98. [Google Scholar] [CrossRef]
  24. Lothenbach, B.; Scrivener, K.; Hooton, R.D. Cement and Concrete Research Supplementary cementitious materials. Cem. Concr. Res. 2011, 41, 1244–1256. [Google Scholar] [CrossRef]
  25. Shi, X.; Mukhopadhyay, A.; Liu, K.W. Mix design formulation and evaluation of portland cement concrete paving mixtures containing reclaimed asphalt pavement. Constr. Build. Mater. 2017, 152, 756–768. [Google Scholar] [CrossRef]
  26. Huang, B.; Shu, X.; Li, G. Laboratory investigation of portland cement concrete containing recycled asphalt pavements. Cem. Concr. Res. 2013, 35, 2008–2013. [Google Scholar] [CrossRef]
  27. Ibrahim, A.; Mahmoud, E.; Khodair, Y.; Patibandla, V.C. Fresh, Mechanical, and Durability Characteristics of Self-Consolidating Concrete Incorporating Recycled Asphalt Pavements. J. Mater. Civ. Eng. 2014, 26, 668–676. [Google Scholar] [CrossRef]
  28. Abraham, S.M.; Ransinchung, G.D.R.N. Strength and permeation characteristics of cement mortar with Reclaimed Asphalt Pavement Aggregates. Constr. Build. Mater. 2018, 167, 700–706. [Google Scholar] [CrossRef]
  29. Brand, A.S.; Roesler, J.R. Bonding in cementitious materials with asphalt-coated particles: Part I—The interfacial transition zone. Constr. Build. Mater. 2017, 130, 171–181. [Google Scholar] [CrossRef]
  30. Brand, A.S.; Roesler, J.R. Bonding in cementitious materials with asphalt-coated particles: Part II—Cement-asphalt chemical interactions. Constr. Build. Mater. 2017, 130, 182–192. [Google Scholar] [CrossRef]
  31. Berry, M.; Stephens, J.; Bermel, B.; Hagel, A.; Schroeder, D. Feasibility of Reclaimed Asphalt Pavement as Aggregate in Portland Cement Concrete; Montana Department of Transportation: Helena, MT, USA, 2013. [Google Scholar]
  32. Chao-lung, H.; le Anh-tuan, B.; Chun-tsun, C. Effect of rice husk ash on the strength and durability characteristics of concrete. Constr. Build. Mater. 2011, 25, 3768–3772. [Google Scholar] [CrossRef]
  33. ASTM C595. Standard Specification for Blended Hydraulic Cements 14; ASTM International: West Conshohocken, PA, USA, 2003.
  34. Mamlouk, M.S.; Zaniewski, J.P. Materials for Civil and Construction Engineers, 3rd ed.; Pearson Education Ltd.: Hoboken, NJ, USA, 2011. [Google Scholar]
  35. Jamil, M.; Kaish, A.B.M.A.; Raman, S.N.; Zain, M.F.M. Pozzolanic contribution of rice husk ash in cementitious system. Constr. Build. Mater. 2013, 47, 588–593. [Google Scholar] [CrossRef]
  36. BS EN 932-1. Tests for General Properties of Aggregates: Part 1. Methods for Sampling; Concrete Society: Farmington Hills, MI, USA, 1997.
  37. BS EN 933-1. Tests for Geometrical Properties of Aggregates Part 1: Determination of Particle Size Distribution—Sieving Method; Concrete Society: Farmington Hills, MI, USA, 2012.
  38. BS ISO 3310-2. Test Sieves—Technical Requirements and Testing Part 2: Test Sieves of Perforated Metal Plate; ISO: Geneva, Switzerland, 2013.
  39. BS EN 1097-6. Tests for Mechanical and Physical Properties of Aggregates Part 6: Determination of Particle Density and Water Absorption; BSI Standards Ltd.: Brussels, Belgium, 2013.
  40. ASTM C29/C29M. Standard Test Method for Bulk Density (“Unit Weight”) and Voids in Aggregate; ASTM International: West Conshohocken, PA, USA, 2003.
  41. IS 2386: Part IV. Methods of Test for Aggregates for Concrete: Part IV Mechanical Properties; Concrete Society: Farmington Hills, MI, USA, 2002.
  42. BS EN 206. Concrete Specification, Performance, Production and Conformity; British Standards Institution: London, UK, 2014.
  43. BS 8500-2. Concrete Complementary British Standard to BS EN 206: Constituent Materials and Concrete; BSI Standards Ltd.: London, UK, 2012.
  44. BS 1881-125. Testing Concrete—Part 125: Methods for Mixing and Sampling Fresh Concrete; British Standards Institution: London, UK, 2013.
  45. BS EN 196-2. Method of Testing Cement, Part 2: Chemical Analysis of Cement; BSI Standards Ltd.: London, UK, 2013.
  46. ASTM C188. Standard Test Method for Density of Hydraulic Cement; ASTM International: West Conshohocken, PA, USA, 2016; Volume I, pp. 1–3.
  47. BS EN 12350-1. Testing fresh concrete, Part 1: Sampling Fresh Concrete; BSI Standards Ltd.: London, UK, 2009.
  48. BS EN 12350-2. Testing Fresh Concrete, Part 2: Slump Test; BSI Standards Ltd.: London, UK, 2009.
  49. BS 1881-103. Testing Concrete, Part 103: Method for Determination of Compacting Factor; BSI Standards Ltd.: London, UK, 1993.
  50. BS EN 12350-6. Testing Fresh Concrete, Part 6: Fresh Density; BSI Standards Ltd.: London, UK, 2009.
  51. BS EN 12390-1. Concrete—Complementary British Standard to BS EN 206-1—Guidance for the Specifier; BSI Standards Ltd.: London, UK, 2012.
  52. BS EN 12390-2. Testing Hardened Concrete, Part 2: Making and Curing Specimens for Strength Tests; BSI Standards Ltd.: London, UK, 2009.
  53. BS EN 12390-3. Testing Hardened Concrete, Part3: Compressive Strength of Test Specimens; BSI Standards Ltd.: London, UK, 2009.
  54. BS EN 12390-6. Testing Hardened Concrete, Part 6: Tensile Splitting Strength of Test Specimens; BSI Standards Ltd.: London, UK, 2009.
  55. BS EN 12390-4. Testing Hardened Concrete, Part 4: Specification for Compressive Strength Testing Machines; BSI Standards Ltd.: London, UK, 2000.
  56. ASTM C642. Standard Test Method for Density, Absorption, and Voids in Hardened Concrete; ASTM International: West Conshohocken, PA, USA, 2013.
  57. ASTM C1585. Standard Test Method for Measurement of Rate of Absorption of Water by Hydraulic Cement Concretes; ASTM International: West Conshohocken, PA, USA, 2013.
  58. BS 882. Specification for Aggregates from Natural Sources For Concrete; BSI Standards Ltd.: London, UK, 1992.
  59. IS 383. Specification for Coarse and Fine Aggregates from Natural Sources for Concrete; BSI Standards Ltd.: London, UK, 2002.
  60. BS EN 450-1. Fly Ash for Concrete, Part 1: Definition, Specifications and Conformity Criteria; BSI Standards Ltd.: London, UK, 2012.
  61. El, S.; Ben, E.; El, S.; Khay, E.; Achour, T.; Loulizi, A. Modelling of the adhesion between reclaimed asphalt pavement aggregates and hydrated cement paste. Constr. Build. Mater. 2017, 152, 839–846. [Google Scholar]
  62. Singh, S.; Ransinchung, G.D.; Kumar, P. An economical processing technique to improve RAP inclusive concrete properties. Constr. Build. Mater. 2017, 148, 734–747. [Google Scholar] [CrossRef]
  63. Martys, N.S.; Ferraris, C.E. Pii sooos-8846(97)00052-5 capillary transport in mortars and concrete. Cem. Concr. Res. 1997, 27, 747–760. [Google Scholar] [CrossRef]
  64. Menéndez, G.; Irassar, V.L.B.E.F. Hormigones con cementos compuestos ternarios. Parte II: Mecanismos de transporte Ternary blend cements concrete. Part II: Transport mechanism. Constr. Build. Mater. 2007, 57, 31–43. [Google Scholar]
Figure 1. Materials.
Buildings 08 00115 g001
Figure 2. Coarse aggregate particle size distribution as per BS 882 specifications.
Buildings 08 00115 g002
Figure 3. Fine aggregate particle size distribution as per BS 882 specifications.
Buildings 08 00115 g003
Figure 4. Relationship between slump and compaction factor for RHA and RAP concrete.
Buildings 08 00115 g004
Figure 5. Relationship between slump and compaction factor.
Buildings 08 00115 g005
Figure 6. Fresh density for RHA and RAP concrete.
Buildings 08 00115 g006
Figure 7. Fresh density for both RHA- and RAP-inclusive concrete.
Buildings 08 00115 g007
Figure 8. Compressive strength for RHA and RAP concrete.
Buildings 08 00115 g008
Figure 9. Relationship between RHA and RAP content and CS.
Buildings 08 00115 g009
Figure 10. Compressive strength for both RHA and RAP inclusive concrete.
Buildings 08 00115 g010
Figure 11. Splitting strength for RHA and RAP concrete.
Buildings 08 00115 g011
Figure 12. Relationship between CS and TSS for RHA and RAP concrete.
Buildings 08 00115 g012
Figure 13. Tensile splitting strength for RHA and RAP inclusive concrete.
Buildings 08 00115 g013
Figure 14. Relationship between TSS and CS for RHA and RAP inclusive concrete.
Buildings 08 00115 g014
Figure 15. Water absorption by RHA and RAP concrete.
Buildings 08 00115 g015
Figure 16. Water absorption by both RHA- and RAP-inclusive concrete.
Buildings 08 00115 g016
Figure 17. Voids in RHA and RAP concrete.
Buildings 08 00115 g017
Figure 18. Relationship between water absorption and voids for RHA and RAP concrete.
Buildings 08 00115 g018
Figure 19. Void spaces in both RHA- and RAP-inclusive concrete.
Buildings 08 00115 g019
Figure 20. Relationship between sorptivity and RHA, and RAP contents.
Buildings 08 00115 g020
Table 1. Test methods adopted.
Test on Constituent MaterialsTests on Fresh and Hardened Concrete
Test PerformedStandard UsedTest PerformedStandard Used
Sieve analysisBS EN 933-1SlumpBS EN 12350-2
Aggregate specific gravity (SG)BS EN 1097-6Compacting factorBS 1881-103
Fineness modulusASTM C136Fresh densityBS EN 12350-6
cement and RHA SGASTM C188Compressive strengthBS EN 12390-3
Aggregate water absorptionBS EN 1097-6Tensile strengthBS EN 12390-6
Aggregates densityASTM C29Water absorptionASTM C642
Voids in aggregatesASTM C29SorptivityASTM C1585
ACVIS 2386-IVPermeable voidsASTM C642
AIVIS 2386-IVHardened densityASTM C642
Table 2. Mix proportions for 25 MPa concrete comprising RHA and RAP.
Mix DescriptionCement (kg/m3)RHA (kg/m3)FVA (kg/m3)FRAP (kg/m3)CVA (kg/m3)CRAP (kg/m3)
Control3900712015930
(5–20)% RHA(312–371)(20–78)712015930
(10–50)% RAP3900(356–641)(71–356)(796–1434)(159–796)
5% RHA + (10–30)% RAP37120(499–641)(71–214)(1115–1434)(159–478)
10% RHA + (10–30)% RAP35139(499–641)(71–214)(1115–1434)(159–478)
15% RHA + (10–30)% RAP33259(499–641)(71–214)(1115–1434)(159–478)
20% RHA + (10–30)% RAP31278(499–641)(71–214)(1115–1434)(159–478)
Table 3. Physical and mechanical properties of materials.
PropertyOPCRHAFVAFRAPCVACRAP
Fineness modulus--2.653.61--
Silt Content (%)--5.190.81--
Bulk specific gravity3.122.032.432.322.622.41
Bulk specific gravity, SSD basis--2.522.372.682.45
Apparent specific gravity--2.682.462.802.51
Water Absorption (%)--3.952.422.411.63
Loose bulk density (kg/m3)13983591456131814211300
Rodded bulk density (kg/m3)14354701577140715841326
Voids in loose aggregates (%)--39.3343.0945.7543.97
Voids in Rodded aggregates (%)--34.3139.2539.5242.83
Maximum particle size (mm)0.090.10552020
Aggregate crushing values (%)----18.7315.92
Aggregate Impact values (%)----15.519.83
Table 4. Chemical composition of cement, RHA, FRAP, and FVA.
Chemical Compound (%)CementRHAFRAPFVA
CaO63.380.862.001.03
SiO220.6292.9758.8580.00
Al2O35.060.9315.611.00
MgO0.820.480.042.00
Na2O0.162.436.203.20
K2O0.532.544.302.50
TiO2--0.850.16
MnO--0.290.02
Fe2O33.230.885.441.00
C3A7.90---
SO32.764.84--
Loss on ignition (LOI)2.917.4010.000.90
Table 5. Properties of superplasticizers.
PropertySuperplasticizer
Sikament NNGSika ViscoCrete 3088
Appearance/colorDark brown liquidYellowish liquid
Density (kg/L)1.21.06
pH value85.5
Chemical baseNaphthalene formaldehyde sulphonateAqueous solution of modified polycarboxylate
Dosage0.5–3.0% by weight of cement0.2–2% by weight of cement
Table 6. Fresh properties of RHA concrete mixes.
Fresh PropertiesMix Designation (RHA)%
Control(5)(10)(15)(20)
Slump (mm)6074484015
Compaction Factor (CF)0.9350.9440.9120.9080.758
Fresh Density (g/cm3)2.4802.4412.4082.3992.386
Table 7. Fresh properties of RAP concrete mixes.
Fresh PropertiesMix Designation (RAP)%
Control(10)(20)(30)(40)(50)
Slump (mm)604032232013
Compaction Factor (CF)0.9350.9310.9220.9210.9020.892
Fresh Density (g/cm3)2.4802.4422.4142.3952.3672.339
Table 8. Fresh properties of both RHA and RAP concrete mixes.
Fresh PropertiesMix Designation (RHA + RAP) %
(5 + 10)(5 + 20)(5 + 30)(10 + 20)(10 + 30)(10 + 30)
Slump (mm)62.058.053.549.045.040.5
Compaction Factor (CF)0.9530.9480.9430.9370.9320.927
Fresh Density (g/cm3)2.4412.4272.4182.4212.4112.401
Fresh Properties(15 + 10)(15 + 20)(15 + 30)(20 + 10)(20 + 20)(20 + 30)
Slump (mm)45.041.036.532.528.524.0
Compaction Factor (CF)0.9340.9300.9240.8600.8550.850
Fresh Density (g/cm3)2.4212.4072.3972.4142.4002.391
Table 9. Hardened properties of concrete.
Mix DescriptionCS (MPa)TSS (MPa)
w (%)

v (%)

K (mm/h1/2)
7 Days28 Days28 Days
Control17.34 (0.41)26.72 (0.42)2.13 (0.13)7.24 (0.18)17.33 (0.01)1.96 (0.02)
RHA5%19.42 (0.61)27.90 (0.75)2.19 (0.20)7.19 (0.30)17.09 (0.29)1.92 (0.06)
RHA10%20.13 (0.71)29.60 (0.73)2.26 (0.06)7.16 (0.18)17.02 (0.60)1.90 (0.25)
RHA15%21.23 (0.41)30.05 (0.79)2.29 (0.01)7.15 (0.11)16.90 (0.40)1.80 (0.78)
RHA20%20.90 (0.80)29.13 (0.32)2.25 (0.09)7.15 (0.01)16.77 (0.03)1.75 (0.11)
RAP10%16.75 (0.20)20.87 (0.90)1.87 (0.06)6.86 (0.30)16.86 (0.18)1.82 (0.20)
RAP20%16.14 (0.40)19.56 (0.0.5)1.69 (0.07)6.74 (0.09)16.61 (0.08)1.30 (0.02)
RAP30%14.51 (0.40)17.86 (0.08)1.50 (0.01)6.65 (0.19)16.28 (0.64)1.16 (0.13)
RAP40%12.73 (0.60)16.36 (0.07)1.39 (0.10)6.54 (0.20)15.98 (0.47)0.91 (0.03)
RAP50%11.08 (0.30)14.87 (0.12)1.26 (0.04)6.45 (0.30)15.68 (0.65)0.69 (0.01)
[5RHA + 10RAP]%18.37 (0.75)23.00 (0.68)2.05 (0.03)6.69 (0.15)16.94 (0.16)1.88 (0.27)
[5RHA + 20RAP]%16.90 (0.38)21.42 (0.47)1.85 (0.10)6.65 (0.04)16.79 (0.05)1.81 (0.08)
[5RHA + 30RAP]%15.00 (0.84)19.42 (0.54)1.77 (0.04)6.62 (0.08)16.53 (0.08)1.69 (0.05)
[10RHA + 10RAP]%19.66 (0.84)25.12 (0.66)2.12 (0.06)6.68 (0.01)16.92 (0.11)1.80 (0.55)
[10RHA + 20RAP]%17.00 (0.97)23.62 (0.07)2.09 (0.01)6.49 (0.18)16.72 (0.24)1.65 (0.18)
[10RHA + 30RAP]%16.65 (0.38)20.4 4(0.61)1.80 (0.03)6.20 (0.10)16.64 (0.06)1.41 (0.17)
[15RHA + 10RAP]%20.02 (0.55)27.62 (0.54)2.22 (0.25)6.33 (0.06)16.78 (0.02)1.87 (0.35)
[15RHA + 20RAP]%19.54 (0.24)25.01 (0.56)2.10(0.03)6.32 (0.05)16.76 (0.10)1.61 (0.07)
[15RHA + 30RAP]%17.14 (0.13)21.69 (0.12)1.89 (0.01)6.30 (0.07)16.60 (0.17)1.47 (0.29)
[20RHA + 10RAP]%18.95 (0.50)25.48 (0.14)2.15 (0.05)6.30 (0.13)16.81 (0.45)1.92 (0.46)
[20RHA + 20RAP]%17.30 (1.04)22.19 (0.92)1.99 (0.01)6.25 (0.08)16.88 (0.52)1.89 (0.04)
[20RHA + 30RAP]%16.38 (0.43)20.20 (0.93)1.79 (0.06)6.25 (0.11)16.48 (0.03)1.65 (0.06)
Average value for three replicate specimens and standard deviation (in parentheses).
Table 10. Sorptivity by RHA inclusive concrete.
RHA Content (%)(0)(5)(10)(15)(20)
Sorptivity, K (mm/h1/2)1.9641.9221.8991.7991.746
Determination Coefficient (R2)0.9690.9760.9740.9820.977
Correlation Coefficient (R)0.9840.9880.9870.9910.988
Table 11. Sorptivity by RAP inclusive concrete.
RAP Content (%)(0)(10)(20)(30)(40)(50)
Sorptivity (mm/h1/2)1.9641.8161.3011.1640.9080.694
Determination Coefficient (R2)0.9690.9710.9890.9830.9850.993
Correlation Coefficient (R)0.9840.9850.9940.9920.9930.997
Table 12. Sorptivity by both RHA- and RAP-inclusive concrete.
RHA and RAP ContentSorptivity [mm/h1/2]Determination Coefficient (R2)Correlation Coefficient (R)
Control1.9640.96880.984
5% RHA + 10% RAP1.8830.9710.985
5% RHA+ 20% RAP1.8080.9750.987
5% RHA+ 30% RAP1.6880.9780.989
10% RHA+ 10% RAP1.8010.9720.986
10% RHA+ 20% RAP1.6530.980.990
10% RHA+ 30% RAP1.4110.9860.993
15% RHA+ 10% RAP1.8670.9770.988
15% RHA+ 20% RAP1.6100.9830.991
15% RHA+ 30% RAP1.4740.9730.986
20% RHA+ 10% RAP1.9190.9830.991
20% RHA+ 20% RAP1.8910.9880.994
20% RHA+ 30% RAP1.6460.9820.991

