1. Introduction
Thermal comfort is defined in the American Society of Heating, Refrigerating and Air-Conditioning Engineers (ASHRAE) 55 standard as the “that condition of mind which expresses satisfaction with the thermal environment” [
1]. This definition is later adopted by International Standard Organization (ISO) in its Standard 7730 [
2]. According to Gagge et al. [
3] the sense of comfort is complex because it applies the entire environment including all the psychological and physiological aspects. In details, Fanger [
4] explained that thermal comfort is determined by several factors, including thermal environments, personal factors, and other contributing factors. Environmental factors include air temperature, air velocity, humidity, and radiation. Personal factors include the clothing and the activity (metabolic rate). Contributing factors include food and drink, acclimatization, body shape, subcutaneous fat, age and sex, and state of health. During his live, late Professor P.O. Fanger has extensively carried out research involving most of the variables mentioned above. The summary of his works can be read in the recent work done by d’Ambrosio Alfano et al. [
5]. However, there are still a lot of unsolved problems in the thermal comfort studies, especially in the tropic area, such as in Indonesia.
Thermal comfort is one of the important environmental factors for building occupants to work productively and live well [
6,
7]. Several literatures found that there was a positive correlation between thermal environments and productivity of workers in office buildings [
8,
9]. Occupants’ well-being and comfort are dependent on the indoor environmental quality [
10]. Similar to the office buildings, thermal comfort is also becoming an important requirement in educational buildings for enabling students learn to productively. A quite old study in 1968 revealed that there was a positive effect of the thermal quality of classrooms on students’ performance [
11]. According to d’Ambrosio Alfano et al. [
12] providing a comfortable and healthy environment in school is necessary for students well-being and productivity. Pepler and Warner [
11] reported the result from an experimental study of learning efficiency among adults in a school laboratory as the temperatures increased from 17 to 27 °C. An extensive literature review by Mendell and Heath [
13] showed a good correlation between indoor school settings and the performance and attendance of students. They also found that warmer temperatures (above 24 °C) tended to reduce the performance of students.
Numerous researchers have conducted studies on thermal comfort of students in the classrooms in various places in the world. These studies include the analysis of thermal comfort in schools in the temperate climate in the United Kingdom (UK) [
14,
15,
16], Mediterranean climate in Italy [
17,
18,
19,
20,
21], subtropical climate in Taiwan [
22,
23,
24,
25], Japan [
26,
27], and Australia [
28,
29]. In the tropical area, studies of thermal comfort at schools have been made in Singapore [
30], Malaysia [
26] and Hawaii [
31].
A result of the study was carried out in the United Kingdom (UK) by Teli et al. [
14] suggests that children are more sensitive to higher temperatures than adults with the comfort temperatures being about 4 °C and 2 °C lower than the PMV (predicted mean vote) and the EN 15251 adaptive comfort model predictions, respectively. In Italian naturally ventilated schools, d’Ambrosio Alfano et al. [
21] found a good agreement between PMV and TSV (thermal sensation vote) with expectation factor e 0.9. They found that the use of Fanger’s basic approach in calculating thermal comfort could also be applied in naturally ventilated environments if the right expectancy factor is known. Hwang et al. [
23] carried out an extensive field measurement in air conditioning (AC) and naturally ventilated (NV) classrooms in Taiwan. The survey involved 944 students at 36 classrooms (ten of them were naturally ventilated classrooms). They found that the thermal neutrality and thermal preference of students were 26.3 and 24.7 °C T
e, respectively. This result shows that the neutral temperature was higher than the thermal preference of students. Also, the study shows that the neutral temperature in Taiwan was lower than the neutral temperature found in the secondary school in Singapore [
30]. The PMV model overestimated the TSV of students. Kwok and Chun [
27] carried out a research in high schools in Japan to determine students’ thermal comfort. They found that the thermal environments in the surveyed schools were beyond the thermal comfort zone specified in the ASHRAE standard. The average air temperature was 26.9 °C and MRT was 27.1 °C. However, about 72% of respondents found this condition acceptable. Most of the students (74%) voted within the neutral category (“slightly cool”, “neutral”, and “slightly warm”), while only less than 10% voted for “warm” and “hot”. Based on a large data gathered from the survey at six elementary and three high schools in Australia, de Dear et al. [
28] found the neutral and preferred operative temperatures were about 22.5 °C, which falls below predictions of both PMV and adaptive models of thermal comfort. The temperatures at that time were 18.2–31.1 °C, with an average value of 25.1 °C. They also found that children’s thermal sensation and temperature preference drop 1–2 °C below those of adults. Kim and de Dear [
29] study the applicability of adaptive thermal comfort model in the Australian primary and secondary school students. They found that more than 80% of students in primary (89.2%) and secondary (86.0%) school accept the indoor operative temperature of 24.5 °C and 24.7 °C in primary and secondary, respectively.
Based on a survey carried out in the Singaporean secondary schools, Wong and Khoo [
30] found that none of the thermal performances of classrooms were within the thermal zone of the ASHRAE standard. However, students found these conditions acceptable. The acceptability rates were 72% and 74% for NV and AC classrooms, respectively. The neutral temperature found in this study was 28.8 °C. The neutral temperature predicted by the PMV model was higher than the one obtained from actual votes TSV. Kwok [
31] examined the acceptability of the ASHRAE thermal comfort standard for the tropical classroom in Hawaii. Kwok found that the majority of classrooms failed to meet the ASHRAE standard. However, the acceptability rate was more than 80% irrespective of the thermal condition of classrooms. The neutral temperature values in these tropical classrooms were 26.8 and 27.1 °C for NV and AC classrooms, respectively.
Unfortunately, research on the thermal comfort of students in the secondary schools still lacks in Indonesia, especially in Makassar. Makassar, the provincial capital of South Sulawesi, is the largest city on Sulawesi Island in terms of population, and the fifth largest city in Indonesia. The city has a tropical monsoon climate with the average temperature for the year at 27.5 °C, the average high around 32.5 °C and the average low around 22.5 °C. There are few thermal comfort studies in tropical Indonesia. A thermal comfort study by Feriadi and Wong [
32] is focused on residential buildings in Jogyakarta. Feriadi and Wong [
32] showed that the prediction of thermal comfort using a PMV model overestimated the thermal sensation vote (TSV) and the thermal comfort vote (TCV) of the respondents. More than 95% of the respondents were predicted by the PMV method to have thermal sensation in the warmer region(+1 to +3) and only very little (less than 5%) in the “neutral” to cooler region (0 to −3). Karyono [
33] carried out thermal comfort study in air conditioned office buildings in Jakarta. Karyono’s study was based on an extensive survey of 596 office workers from seven high-rise office buildings in Jakarta. The study showed that most of the office workers were still comfortable in room temperatures between 26.7 and 28.6 °C. Karyono found a neutral temperature of 26.7 °C (T
o) for air conditioned (AC) office buildings in Jakarta.
Recent studies in Indonesia carried out by Hamzah et al. [
34] and Karyono et al. [
35] were focused on the university classrooms. Hamzah et al. [
34] investigated the naturally ventilated classrooms, while Karyono et al. [
35] studied the air conditioning classrooms. Hamzah et al. [
34] found that the thermal condition of the classrooms did not meet the requirement of ASHRAE and SNI standard. The major finding of this study is that more than 80% voted the central position (−1 to +1), either in ASHRAE or Bedford scale and the neutral temperature about 29.6 °C. Karyono et al. [
35] found that comfort temperature was 24.1 °C T
a and 24.9 °C T
a for students at Universitas Tarumanegara (Untar) and Universitas Mercu Buana (UMB), respectively. Both figures are very low in comparison to the naturally ventilated classroom in the study carried out by Hamzah et al. [
34].
Thermal comfort standards such as ASHRAE Standard 55 [
36] has been widely used as a guideline for designing thermal comfort in different countries. The measurement of the thermal comfort experienced by the users is usually according to the ASHRAE standard, using a questionnaire based on a study conducted by Fanger [
4]. This survey asks the sensation of thermal perceived users in seven scales, namely: hot (+3), warm (+2), slightly warm (+1), neutral (0), slightly cool (−1), cool (−2), and cold (−3). Bedford [
37] has proposed a method of measuring thermal comfort in buildings. It also consists of seven scales: much too warm (+3); too warm (+2); comfortably warm (+1); comfortable (0); comfortably cool (−1); too cool (−2), and; much too cool (−3).
Most schools in Indonesia were built as a prototype building, with no consideration based on the local climatic conditions. The schools were built to the same standards regardless of the user’s comfort and preference, in this case, the students of the secondary school, which is in the phase of changing from childhood to adulthood (11–18 years). There is no special regulation for the thermal comfort in the educational buildings in Indonesia. The government only provides thermal comfort guidelines for buildings in general. The requirement is based on the Mom and Wiesebron [
38] which later on used in the national standard SNI 03-6572-2001 [
39], where the building should provide the following thermal environment as follows:
comfortably cool: 20.5–22.8 °C (Te);
comfortable: 22.8–25.8 °C (Te); and
comfortably warm: 25.8–27.1 °C (Te).
The guideline used the effective temperature (T
e), which is defined as the temperature of a stagnant and saturated atmosphere, which would, in the absence of radiation, produce the same effect as the atmosphere in an inquiry. Therefore, it combines the effect of dry air temperature and humidity [
40].
Most of the classrooms in the secondary schools in Makassar are experiencing hot temperature during daytime. Through observations, we found that a lot of numbers of classrooms are equipped with fans and even air conditioning (AC). In order to improve the situation and considering the importance of thermal comfort in affecting the students’ learning process and performances, then a study of thermal comfort in the classrooms of secondary schools need to be undertaken. The objectives of this study are:
To report the thermal environmental conditions of classrooms in the secondary schools in Makassar;
To analyze the students’ responses to the thermal environmental conditions in their classrooms;
To find out the neutral and comfortable temperature in the classrooms of secondary schools based on the climate of Makassar.
2. Research Methods
2.1. Research Sample and Respondent
The present study was conducted at the 48 classrooms, which are used for the teaching and learning purpose. The classroom buildings are mostly one to two stories buildings. There are two types of state secondary schools: State Junior High School for year 7 to 9 (
Sekolah Menengah Pertama Negeri, which is abbreviated as SMPN) and State Senior High School for year 10 to 12 (
Sekolah Menengah Atas Negeri, which is abbreviated as SMAN). The locations of schools are spread out from the city center with busy streets and high-density settlements to the suburbs with lower density settlements.
Table 1 shows the characteristic of surveyed schools and samples. The schools were chosen to represent the six sub-districts in the city of Makassar, by considering the geographical conditions, and density of buildings. Also, the accessibility to each school is one of the main considerations in this selection.
The specific areas and descriptions of each school and classrooms are explained as follows. SMPN 33 Makassar is located in a high-density settlement. The weather condition was mostly sunny. The measurements were conducted from 8:30 to 13:50. Measurements were carried out in the six classes, where two classes were located on the ground floor, while four classes on the first floor. The size of the class is 63 and 56 m2. The height of the ceilings range from 2.8 m to 3.6 m. The opening in the classroom was located on the left and right sides of the class with the total window area and total door area of 21.7 m2. The natural ventilation is accessible through jalousies at the top and the openable window underneath.
SMAN 4 Makassar is located on Jalan Cakalang, about 2.5 km north of the city center. The weather condition on that day was mostly sunny. The measurement of the microclimate conditions in the classroom started at 8:30 and finished at 12:25. Measurements were conducted in seven classrooms. Six of classes are located on ground floor and only one class on the first floor. The class size was varied between 68, and 72.35 m2. The ceiling heights range from 3 m to 3.9 m. The opening in the class is located on the left and right sides of the class with the average window area on the right side of 11.75 m2 and the left side of 7 m2. The natural ventilation can be felt through jalousies at the top and the openable window underneath.
SMAN 21 Makassar is found in a periphery of the dense residential area bordering the road environment. The site was surrounded by less dense trees. The survey and measurements were started in the morning at 8:10 a.m. until noon at 1:45 p.m. The weather condition on the day of measurement was sunny. Measurements were made in six classes consisting of four North-South oriented classes and two East-West oriented classes. Three classes are located on ground floor, while other three on the first floor. The area of each class is 72 m2 (8 m × 9 m). The buildings are permanent building type with a plastered brick wall, and concrete tiles roof.
SMAN 1 Makassar is established in the area that is very close to the city center and adjacent to arterial roads. The school’s site has a lot of trees. The measurements were conducted in the six classes from 7:55 a.m. to 11:30 a.m. Two classes are located on the ground floor, two classes on the first floor, and one class on the second floor. The class size of the survey object varied: 63, 72, 96, and 100 m2, respectively. The height of the ceiling of the classrooms ranges from 3 m to 3.5 m. The window opening in the class is located on the left and right sides of the class with the average area of the window on the right side is 10 m2 and the left side is 7 m2. The natural ventilation is accessible through jalousies at the top and a glass window underneath.
SMPN 20 Makassar is located in the suburban area with less dense residential areas. The site has less vegetation in surrounding buildings. The weather condition was mostly sunny. The measurement of microclimate in the classroom was done from 8:20 a.m. to 12:00 p.m. The classroom area was varied, between 60 and 62.4 m2. The ceiling height of the classrooms ranges from 3 m to 3.5 m. The opening in the classroom is located on the left and right sides of the class with the average window area on the right side of 13.4 m2 and the left side is 6.26 m2. The natural ventilation made use of jalousies at the top and openable window underneath.
SMPN 30 is located in the high-density residential areas and bordering by busy roads. The measurement and survey were conducted in the morning at 8:15 a.m. until afternoon at 2:40 p.m. Measurements were made in six classes consisting of three Southeast-Northwest oriented classes and three Northeast-Southwest oriented classes. Four classes are located on the ground floor and two on the first floor. The size of each classroom is 7 m × 9 m (63 m2). The wall construction was the plaster-brick wall, and the roof using tile, asbestos, and zinc.
SMPN 8 Makassar is located in the medium density residential and commercial areas. In general, the weather conditions on that day was sunny with some cloudy. The measurement of microclimate in the classroom was done from 8:30 a.m. to 1:05 p.m. Measurements were made in six classes, four classes located on the ground floor and two classes located on the first floor. Except for one class, the size of the five classes was 63 m2. The ceiling height of the classroom ranges from 3 m up to 3.5 m. The opening in the class was located on the left and right sides of the class with the average area of the window on the right side of 10 m2 and the left side is 8.5 m2.
SMAN 2 Makassar is also found in the medium density residential and business areas. The weather condition on that day was sunny. The measurements were conducted from 8:30 a.m. to 11:30 a.m. Measurements were carried out in five classes, one class on the ground floor, two classes on the first floor, and one class on the second floor. The size of the classes was varied, 63 m2 and 72 m2. The height of ceiling was ranging from 3.2 m to 3.5 m. The opening in the classroom is located on the left and right sides of the class with the total window and open door area is 20.9 m2.
The distributions of respondents based on their age and sex are presented in
Table 2. As seen in the table, a number of female students are bigger than the male one. Basically, the normal age for junior high school is 13 to 15 years and senior high school is 16 to 18. The reason for a little number of students in the 18 years group and a big number in the 11 and 12 group is may be caused by the time of the survey. The survey was conducted in August, where the new academic year was just begun. Also, some students started their primary school at the age of five years and finished it in 11 years old.
2.2. Research Instrumentation
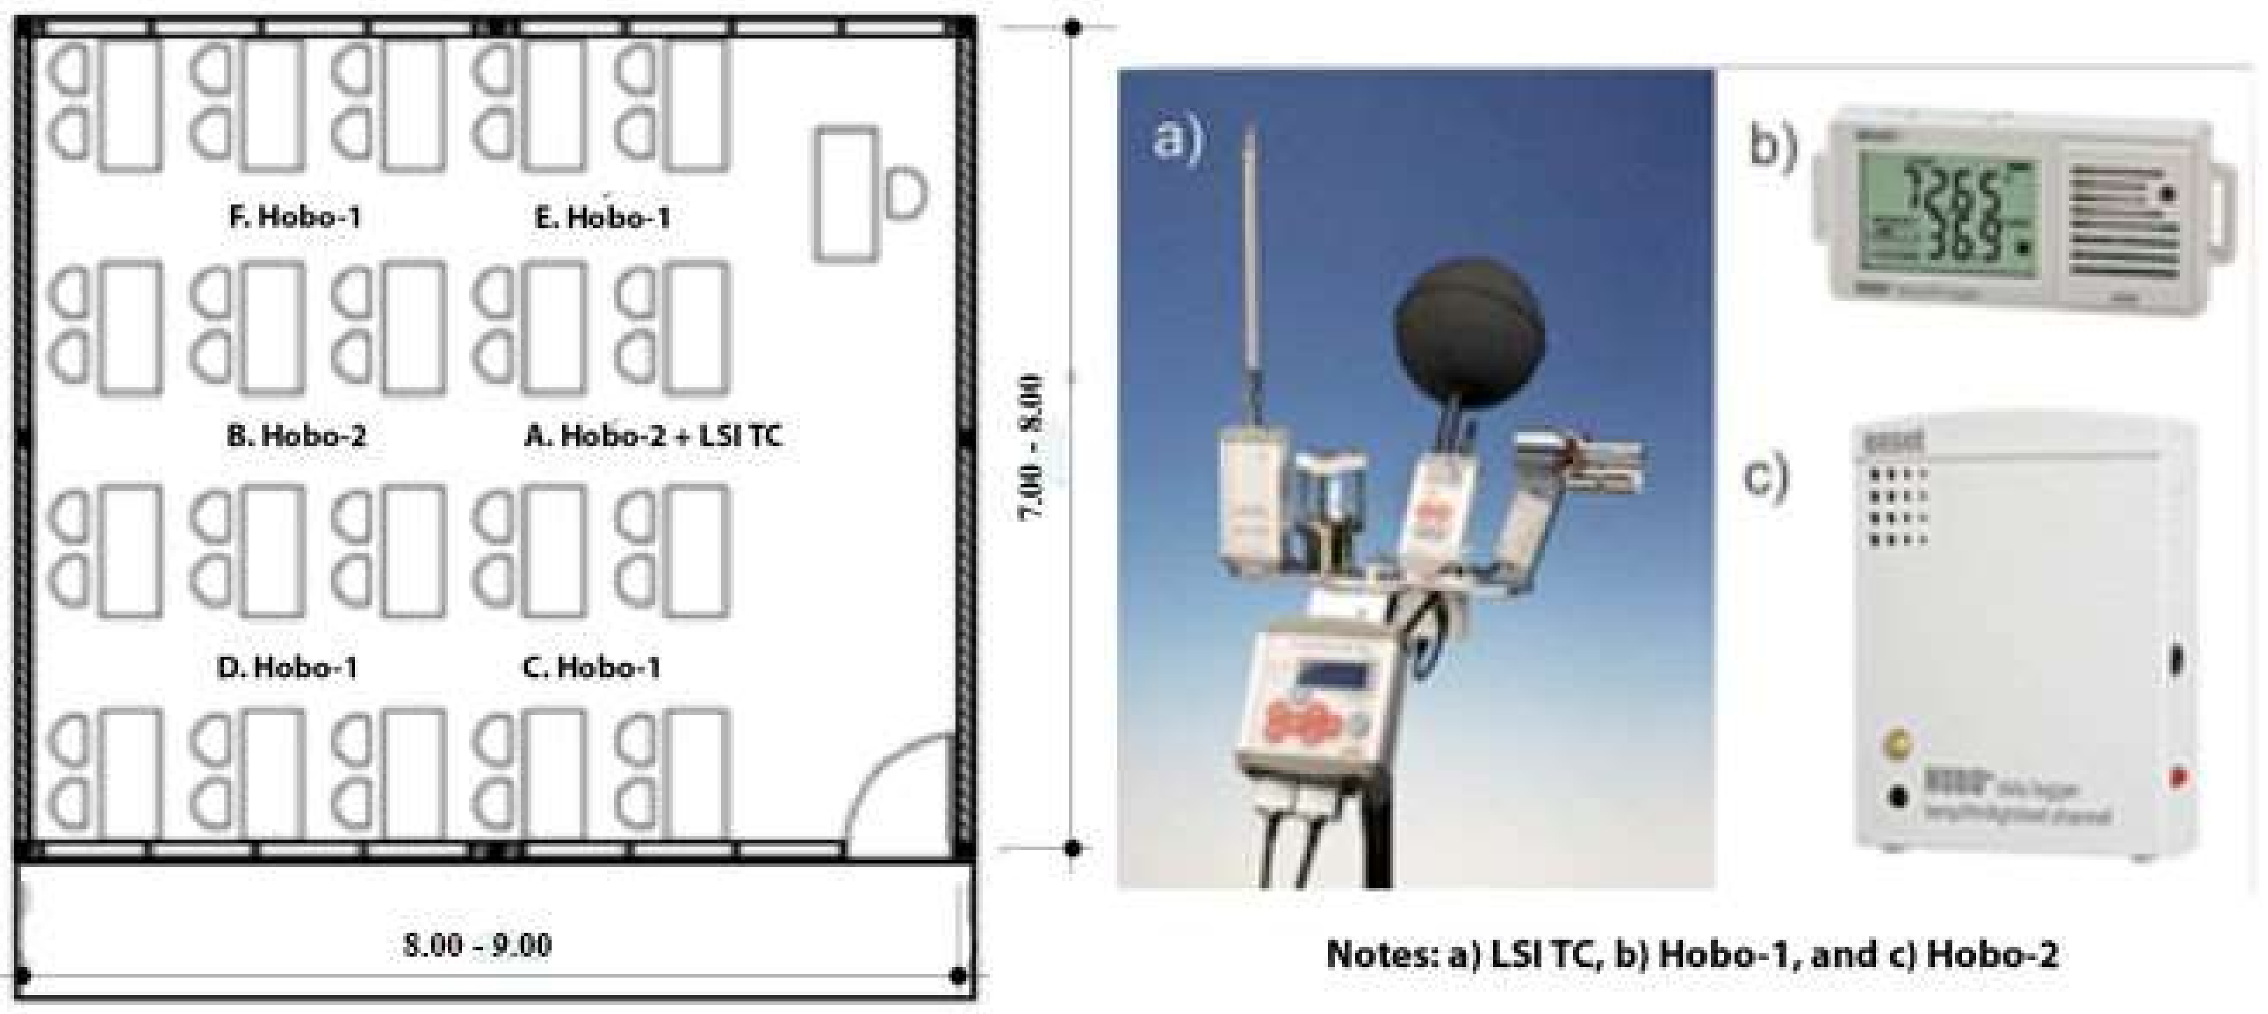
The research has been carried out using several instruments. The LSI-Lastem Thermal Comfort Multi Logger is a set of devices, which consists of several sensors and data loggers. The arrangements of LSI-Lastem applied in this survey including one data loggers and four sensors. The sensors including a globe thermometric probe (EST131) for measuring mean radiant temperature (MRT). A portable psychometric forced ventilation probe (ESU102) for measuring air temperature and relative humidity, and the hot wire anemometer (ESV106) for recording the air velocity in the classroom.
Figure 1 shows the arrangement of instruments inside the surveyed classroom (left), and the images of instruments used in the survey (right). Because there is only one set of LSI-Lastem logger, additional instruments were needed. Six HOBO loggers made by Onset, have been used for this research. These instruments enabled us to measure the thermal environments at six points in each classroom. Two types of loggers were used, that is, the HOBO temp/Relative Humidity (RH) logger (Hobo-1) and the HOBO temp/RH/Light/External logger (Hobo-2). Four HOBO temperature/RH loggers were used for measuring air temperature and relative humidity, and two HOBO temp/RH/Light/External were used for measuring air temperature, relative humidity, and airflow velocity. The specifications of the instruments used in the data collection are displayed in
Table 3.
2.3. Data Collection
The primary data has been collected through survey and questionnaire methods. The collection of data was carried out as follows:
Survey on objective measurement was conducted to collect the personal and the thermal environment data. Personal data was gathered by collecting the clothing and the activity of each respondent. The sensors for measuring the environmental data were attached at 100 cm above the floor level [
30,
34]. Because of the limited number of equipment, the MRT (Meant Radiant Temperature) was only recorded at one point that was the center of the room, while the air velocity, air temperature, and the relative air humidity were recorded at two points (A and B). The instruments placed in other points C, D, E, and F only measured the air temperature and the relative air humidity (see
Figure 1).
Survey on subjective measurement was conducted to measure the level of thermal comfort of respondents. The survey carried out by using questionnaire technique, which was adapted from Wong and Khoo and has been used in the previous study [
30,
34]. The questionnaire included seven questions, which captured the thermal sensation vote (TSV), thermal comfort vote (TCV), thermal preference and thermal acceptance of respondents. In addition to the air temperature, the questionnaire also intended to obtain the respondents’ votes on the air velocity, air velocity preference as well as the humidity of classrooms. The TSV responses were measured based on ASHRAE standard 55, which uses a seven-point scale to measure the thermal sensation of respondents. The thermal comfort can also be measured by asking the thermal preference and acceptance of occupants. Thermal preference related to the question of whether the occupants prefer to be warmer or cooler or no change. In addition, questions related to the air velocity and the humidity had also been included in the questionnaire (
Table 4). In the top part of the questionnaire, respondents are requested to write down his/her school name, class, student name, sex, age, clothing ensembles, weather condition, and his/her position in the classroom. Students fill out the questionnaire after at least 25 to 30 min sitting in the classroom. In order to prevent the error in choosing the relevant answer based on their feelings and preferences, an explanation on the indicator used in the questionnaire has been carried out, for example, the difference between “cold”, “cool”, “neutral”, “warm”, and “hot”.
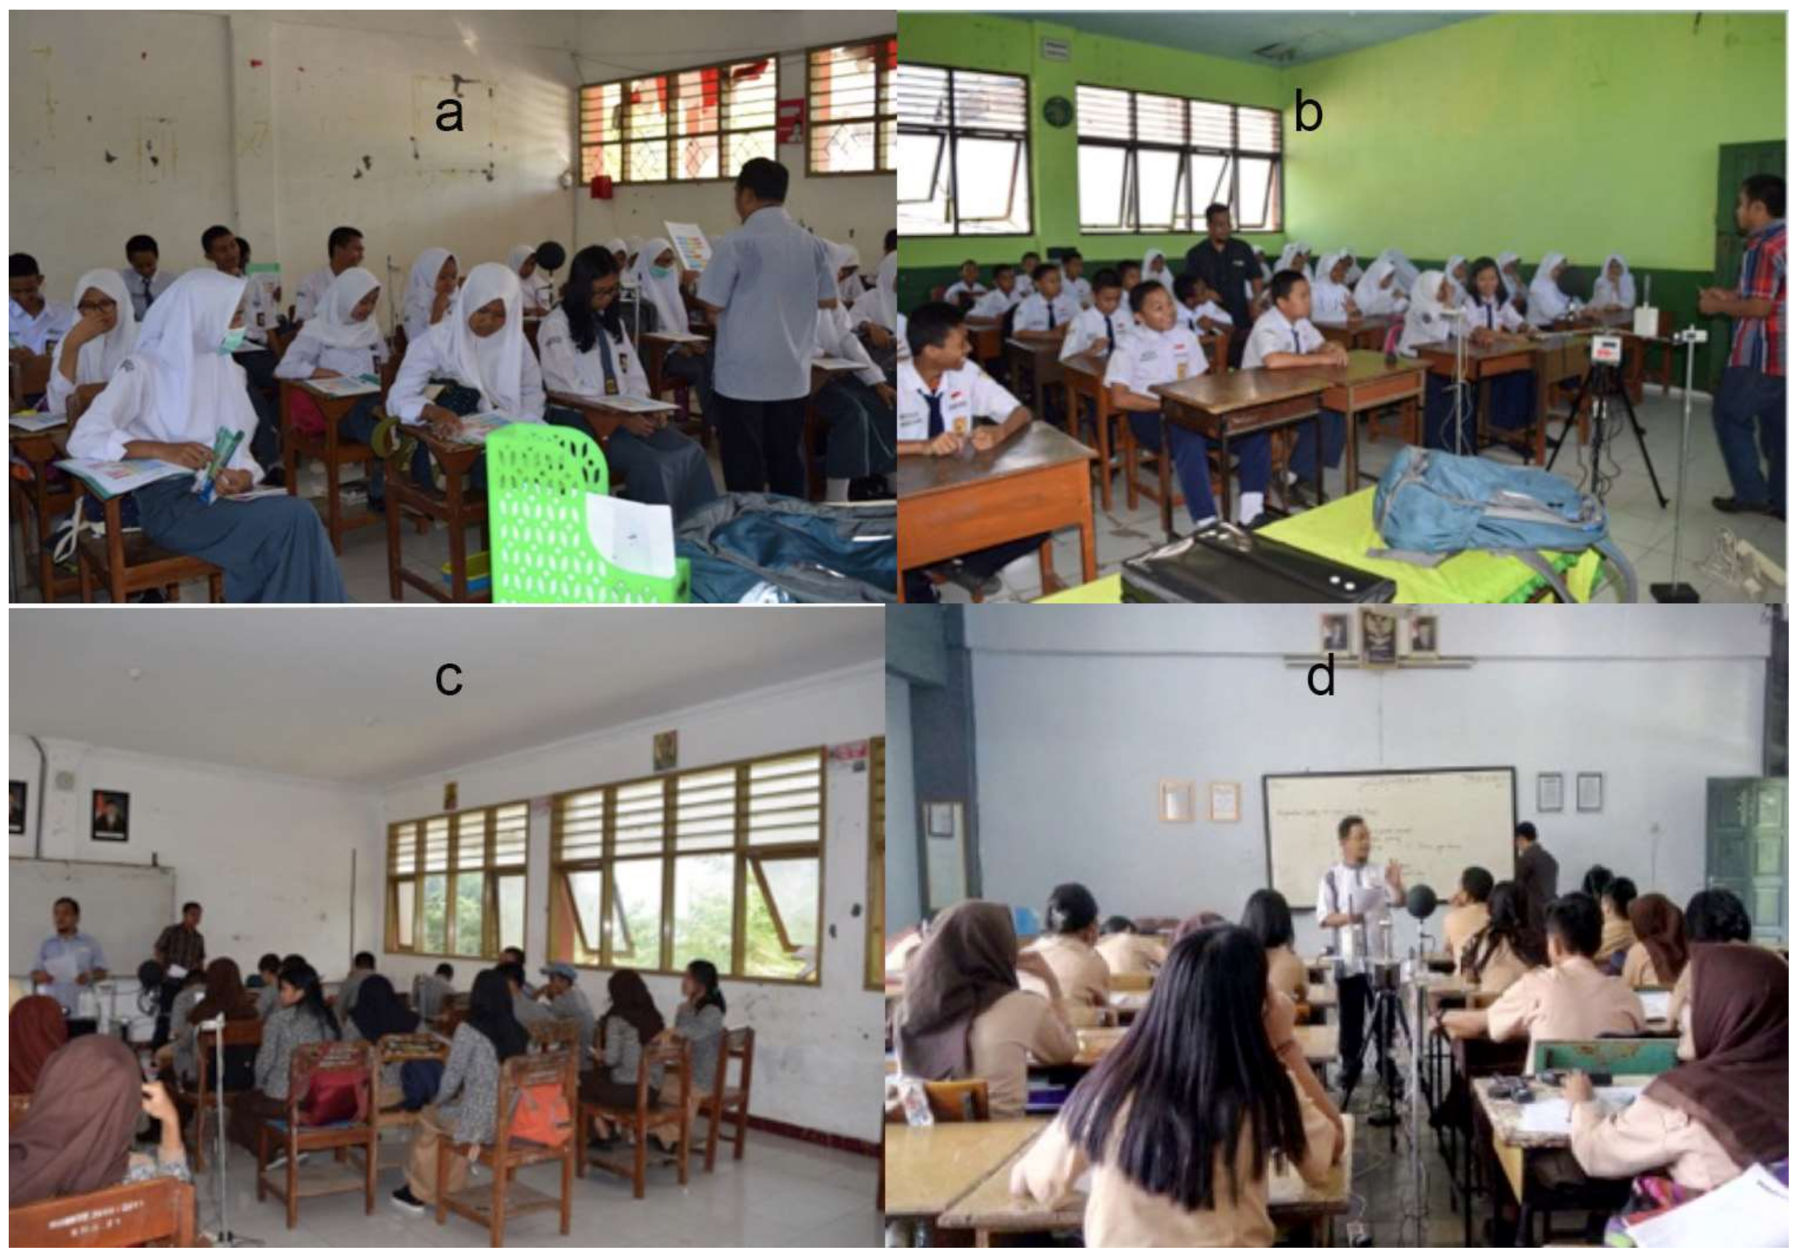
The situation of survey and measurement in the selected classrooms is shown in
Figure 2. The figure shows the students clothing and activities during the survey and measurement.
Typically, secondary students have five types of uniform that is, regular uniform,
batik uniform,
pramuka uniform, Moslem uniform, and the sports uniform. The regular,
batik and
pramuka uniforms basically have the same clothing ensembles. They are only different in terms of clothing’s color. The regular uniform for male students is a light short-sleeves shirt with light trousers, which has a clothing insulation of 0.57 clo. While the regular uniform for female students is light long-skirt (ankle-length skirt) and long-sleeves shirt with clothing insulation of 0.71 clo. Most of the female students wore regular uniform and hijab with clothing insulation 0.80 clo [
41]. Hijab is a veil worn by Moslem women, which usually covers the head and chest. Small numbers of female students wore light long-skirt and short-sleeves shirt with clothing insulation 0.67 clo. Except for ensembles with hijab, all other clothing insulation values have been taken or calculated from ASHRAE Standard [
36]. The details of clothing ensembles with its clothing insulation using the present study are illustrated in
Table 5.
The activities of students during surveys and measurements were mostly sitting and reading. In the ASHRAE standard, this kind of activity has the metabolic rate of 1.0. However, several kinds of literature proposed the estimation of the metabolic rate of students, which is different from an adult. The ISO 8896 provides a guideline in the calculation of metabolic rate [
42]. The metabolic rate used in this research has been increased from the figure of adult metabolic rate (1.0 to 1.2) [
14,
43,
44]. The increase of this number is to accommodate the fact that students are smaller than adults, which has smaller body coverage. In fact, this metabolic rate has been used by Wong and Khoo [
30] for thermal comfort study of secondary school students in the tropic.
2.4. Data Processing and Analyses
Data analyses were carried out by spreadsheet software MS Excel and the statistical package for social science (SPSS). The spreadsheet has been used to calculate the mean value of thermal environmental variables and to generate tables showing the microclimatic condition of classrooms. For the statistical analyses, a statistical software SPSS version 16 has been used to calculate regression analyses. The regression analyses examine the correlation and the linearity of data between TSV and operative temperature (T
o), TCV and operative temperature (T
o), and between PMV and operative temperature (T
o). The TSV and TCV were gathered from the respondents’ votes written in the questionnaire, while the PMV calculated based on ASHRAE standard [
36] using the spreadsheet software developed by Farina [
45]. The PMV values calculated by spreadsheet software has a good agreement with calculation example provided in ASHRAE standard [
36]. According to Nicol [
46], the problem of using PMV in predicting thermal comfort in a hot climate in tropical countries because of the air temperature and the air velocity exceeding the limit that can be handled by PMV. Even though the air temperature exceeds the limit of PMV model, a number of researchers still used it as an indicator to evaluate the thermal comfort of buildings in the tropic [
30,
32,
47]. The TSV votes were grouped according to ASHRAE scale, while the TCV was grouped by using Bedford scale.
To calculate the PMV for each respondent, the availability of four corresponding environmental variables as well as two personal variables for each respondent is essential. However, not all these variables were collected at all points of measurement due to the limitation of equipment. The MRT was only measured at the center point of the classrooms, while air velocity values were only measured at two points, that is, A and B. To simplify the procedure of calculation the MRT values were applied to all points. Regarding air velocity, the arrangements were: the values of air velocity collected in A were shared with the points C and E, while the ones collected at point B were shared with points D and F, respectively. By applying these arrangements, all respondents, who were sitting near the point of measurements, had all six required variables. These enabled us to calculate the PMV values. Based on the four environmental and two personal variables, the PMVs for the 1594 respondents have been calculated.
Research results were analyzed based on the statistical analyses using SPSS version 16. The statistical analysis used in this research was regression analysis, which is based on Pearson correlation. The acceptance of linear regression analyses was determined by two criteria: the test of linearity of regression (F-test) and the significance of equation coefficient (t-test). The equation is statistically linear if the absolute value of F > Ftable and sig. value < its probability (0.05). The F table for the case is 3.844. The equation coefficients are significant if the absolute value of t > ttable and the sig. value < half of its probability (0.025 for two tails). The ttable for infinity number of degree of freedom is 1.960. The data used for statistical analysis, have been verified by checking their normality and reliability.
4. Discussion
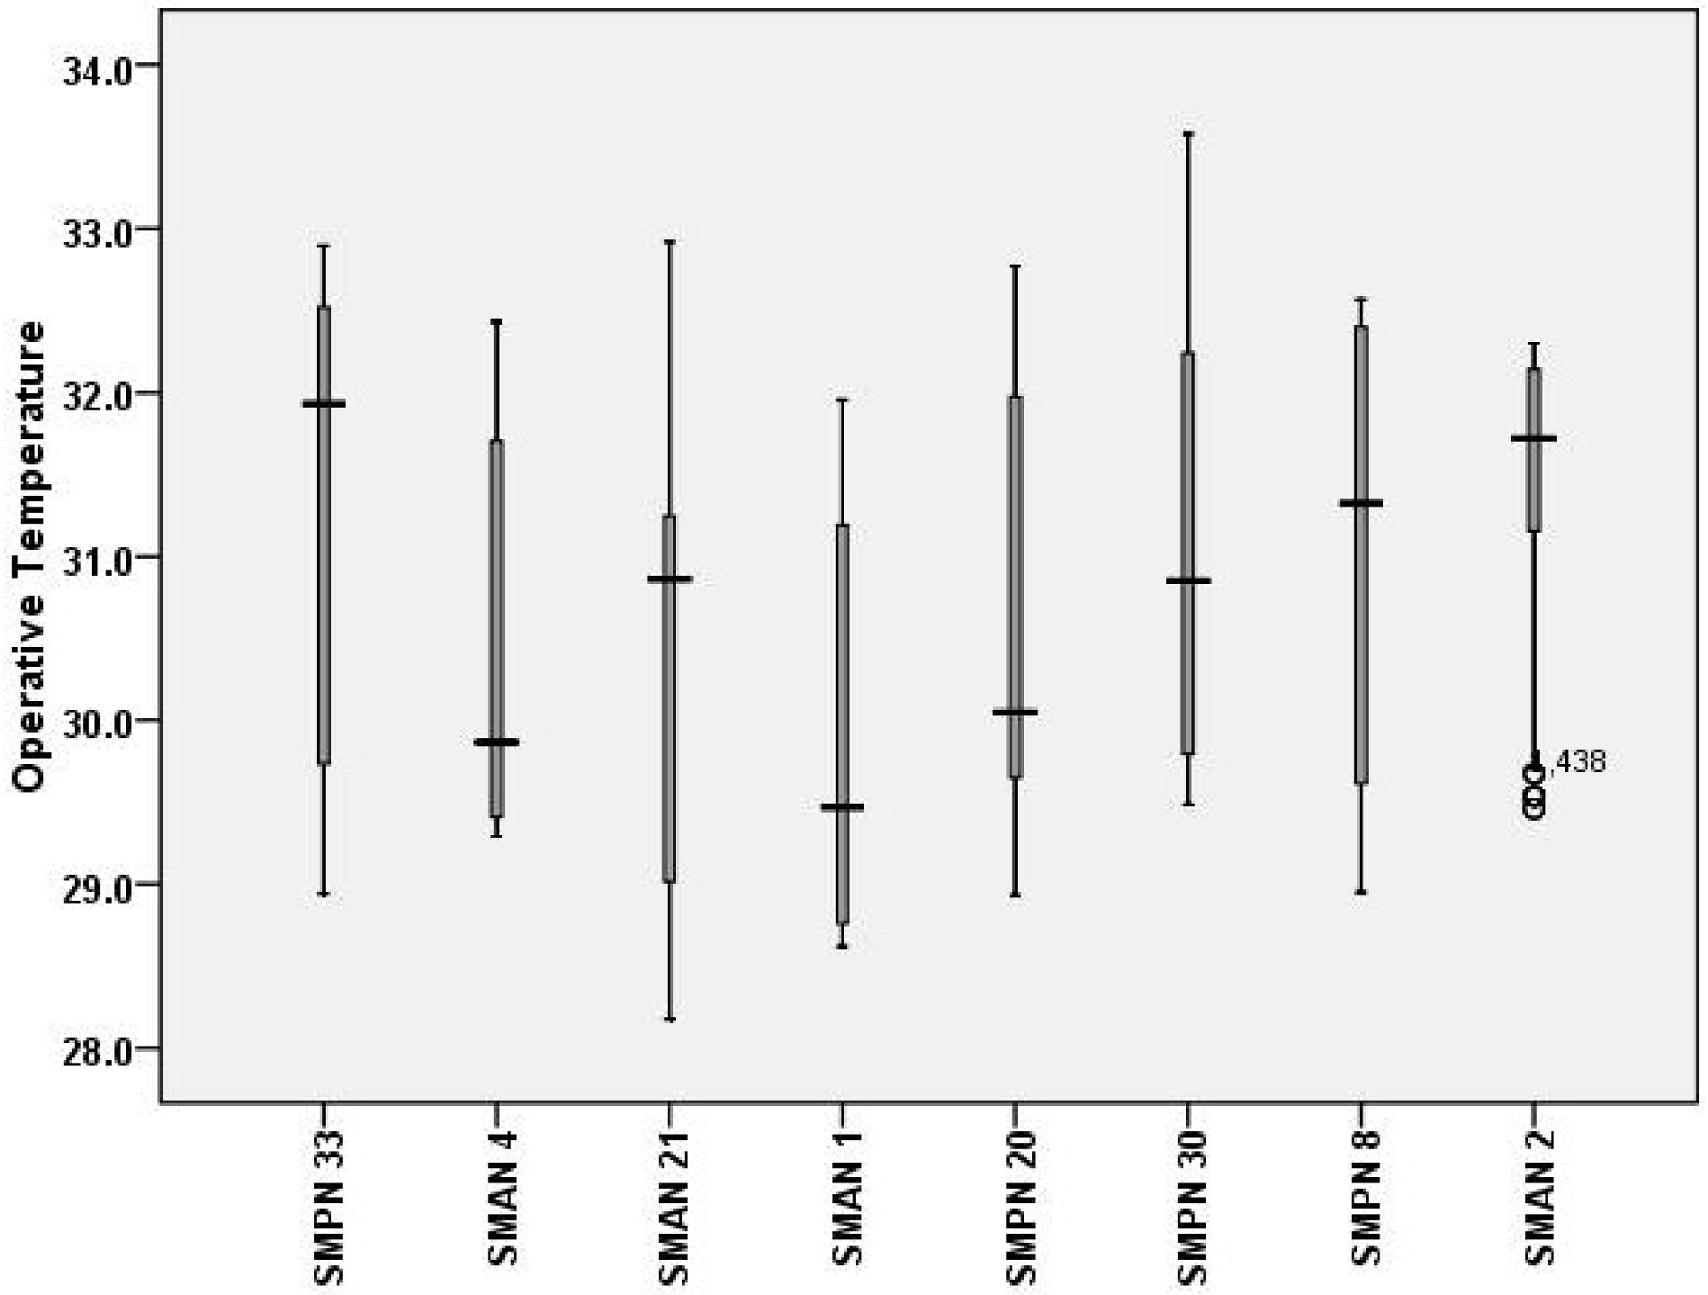
The classroom condition of the surveyed secondary schools shows hot thermal environments. The indoor air temperature ranging from 28.2 °C to 33.6 °C with average 30.8 °C, which has already beyond the thermal comfort zone as specified in the ASHRAE 55 standard [
36] and the national standard [
39]. This condition could have the problem for students [
48]. However, the students’ responses on the thermal sensation give very different figures, where more than 80% voted within the central (−1 to +1) option. This thermal environment quite similar to the one recorded in the naturally ventilated secondary school in Singapore [
30] and in the residential buildings in Jogyakarta [
32]. These indicate that naturally ventilated buildings in the tropic area in South East Asia experience hot temperature during daytime.
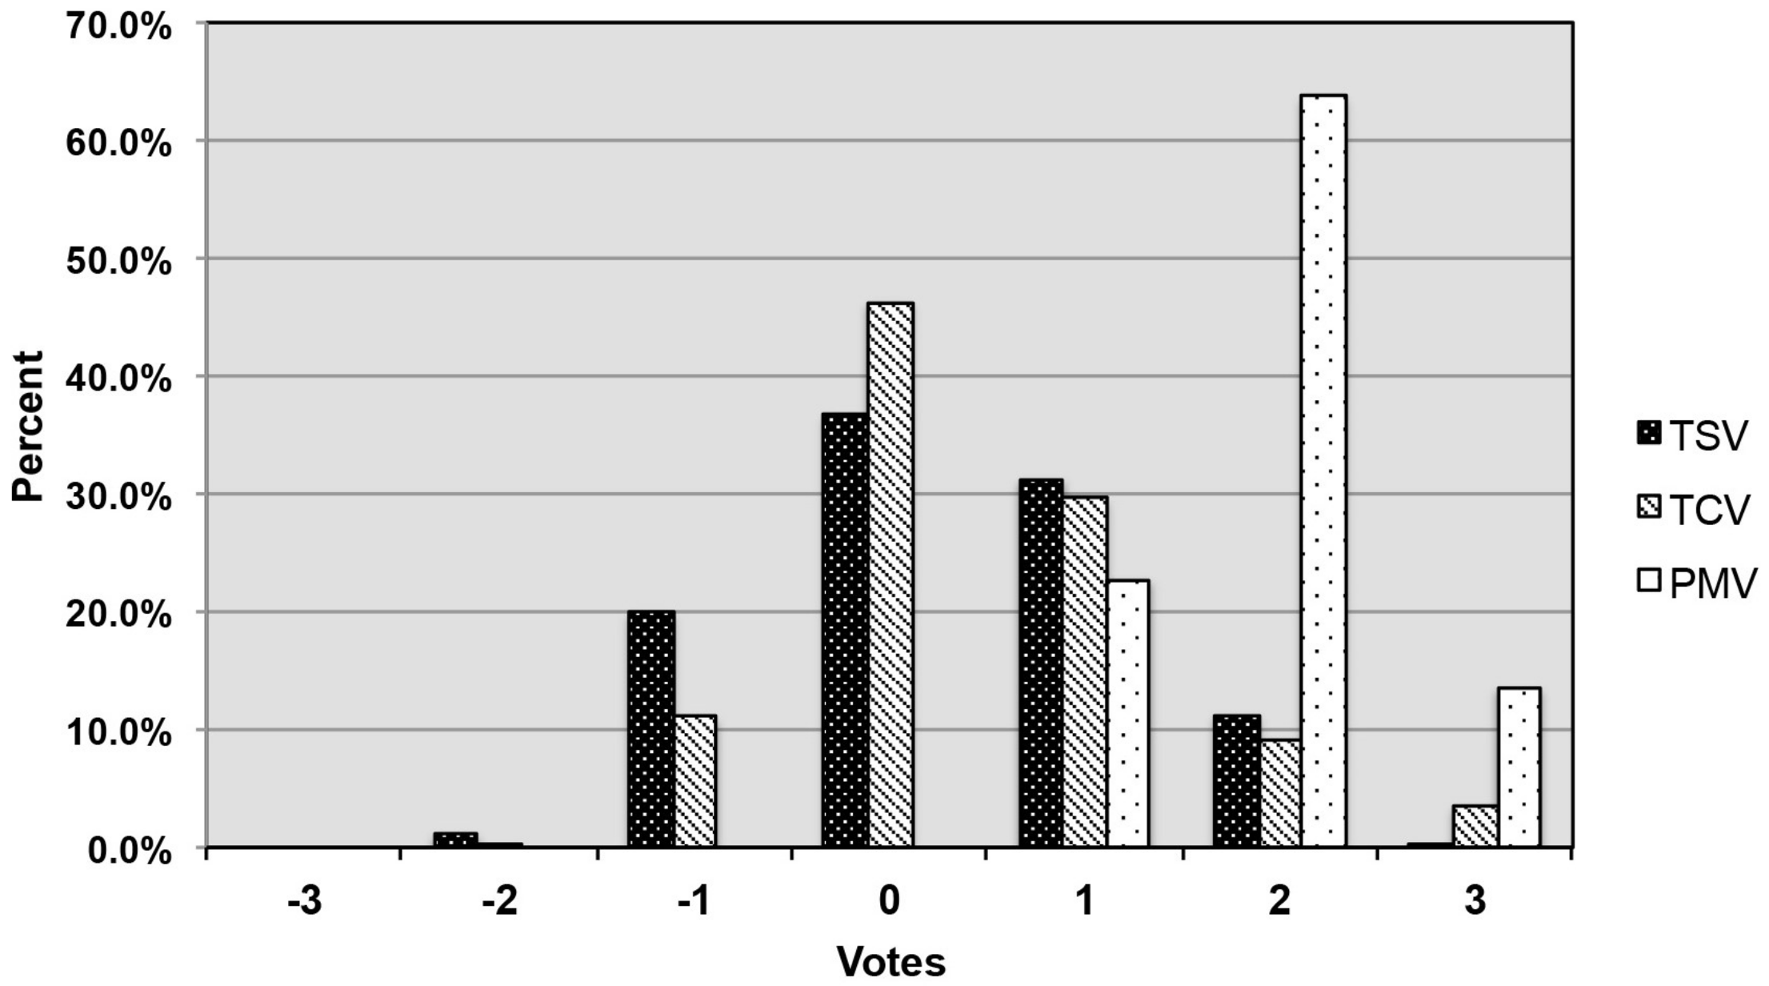
The high percentage of students (more than 85%) voted in the centerline options (−1 to +1) either in TSV of TCV shows that students are comfortable in the classrooms despite their hot temperature. The percentage of respondents who voted 0 (comfortable) in the TCV is higher than the percentage of respondents who voted 0 (neutral) in the TSV. A similar result was found in Feriadi and Wong [
32], where about 40% of respondents voted the 0 (comfortable) in the TCV, and only less than 20% voted the 0 (neutral) in TSV. Feriadi and Wong [
32] proposed two reasons for the difference between TSV and TCV. Firstly, respondents are more stringent when they vote for the thermal sensation than the thermal comfort perception. Secondly, there is a tendency for occupants in naturally ventilated buildings to perceive cold (coolness) as comfortable.
The mean vote of PMV model overestimates the actual votes of respondents in TSV and TCV. This result agrees with a result of a study done by Feriadi and Wong [
32], where they found that the PMV always overestimated the actual votes of respondents in the residential buildings in the tropics. More respondents are predicted to vote uncomfortably warm and hot in PMV rather than in the TSV and TCV. To improve the accuracy of PMV in predicting the thermal sensation of occupants Fanger and Toftum [
49] propose an extension of PMV to be applicable in the naturally ventilated buildings. In this study, Fanger and Toftum proposed the reduction of the estimated metabolic rate, and the calculation of expectation factor
e. The expectation factor derived from the equation as follows:
The expectation factor
e gathered from Equation (4) is 0.15. This figure is very low in comparison to the lowest expectation factor proposed by Fanger and Toftum [
49], with a minimum value of 0.5. The expectation factor
e 0.5 is suitable for non-air conditioned buildings located in regions with few air conditioned buildings, warm weather during all seasons [
49].
We already know that one reason for the discrepancy between the PMV and the actual votes TSV and TCV is that the accuracy of data inputted into the model. We can argue that disagreement between PMV and TSV is mostly dependent on the determination of clothing insulation and metabolic rate used in the PMV model because the four other variables related to the thermal environment were recorded directly from the surveyed classrooms. For example, using the clo values as specified in the ASHRAE standard [
36] will give higher PMV value in comparison to the clo values used in the Teli et al. [
14]. This is also true for the determination of metabolic rate. This has a big impact on the calculation of PMV. Therefore, the clothing insulation and metabolic rate should be calculated accurately as demonstrated in Al-ajmi et al. [
41], Havenith [
43], and Haddad et al. [
44].
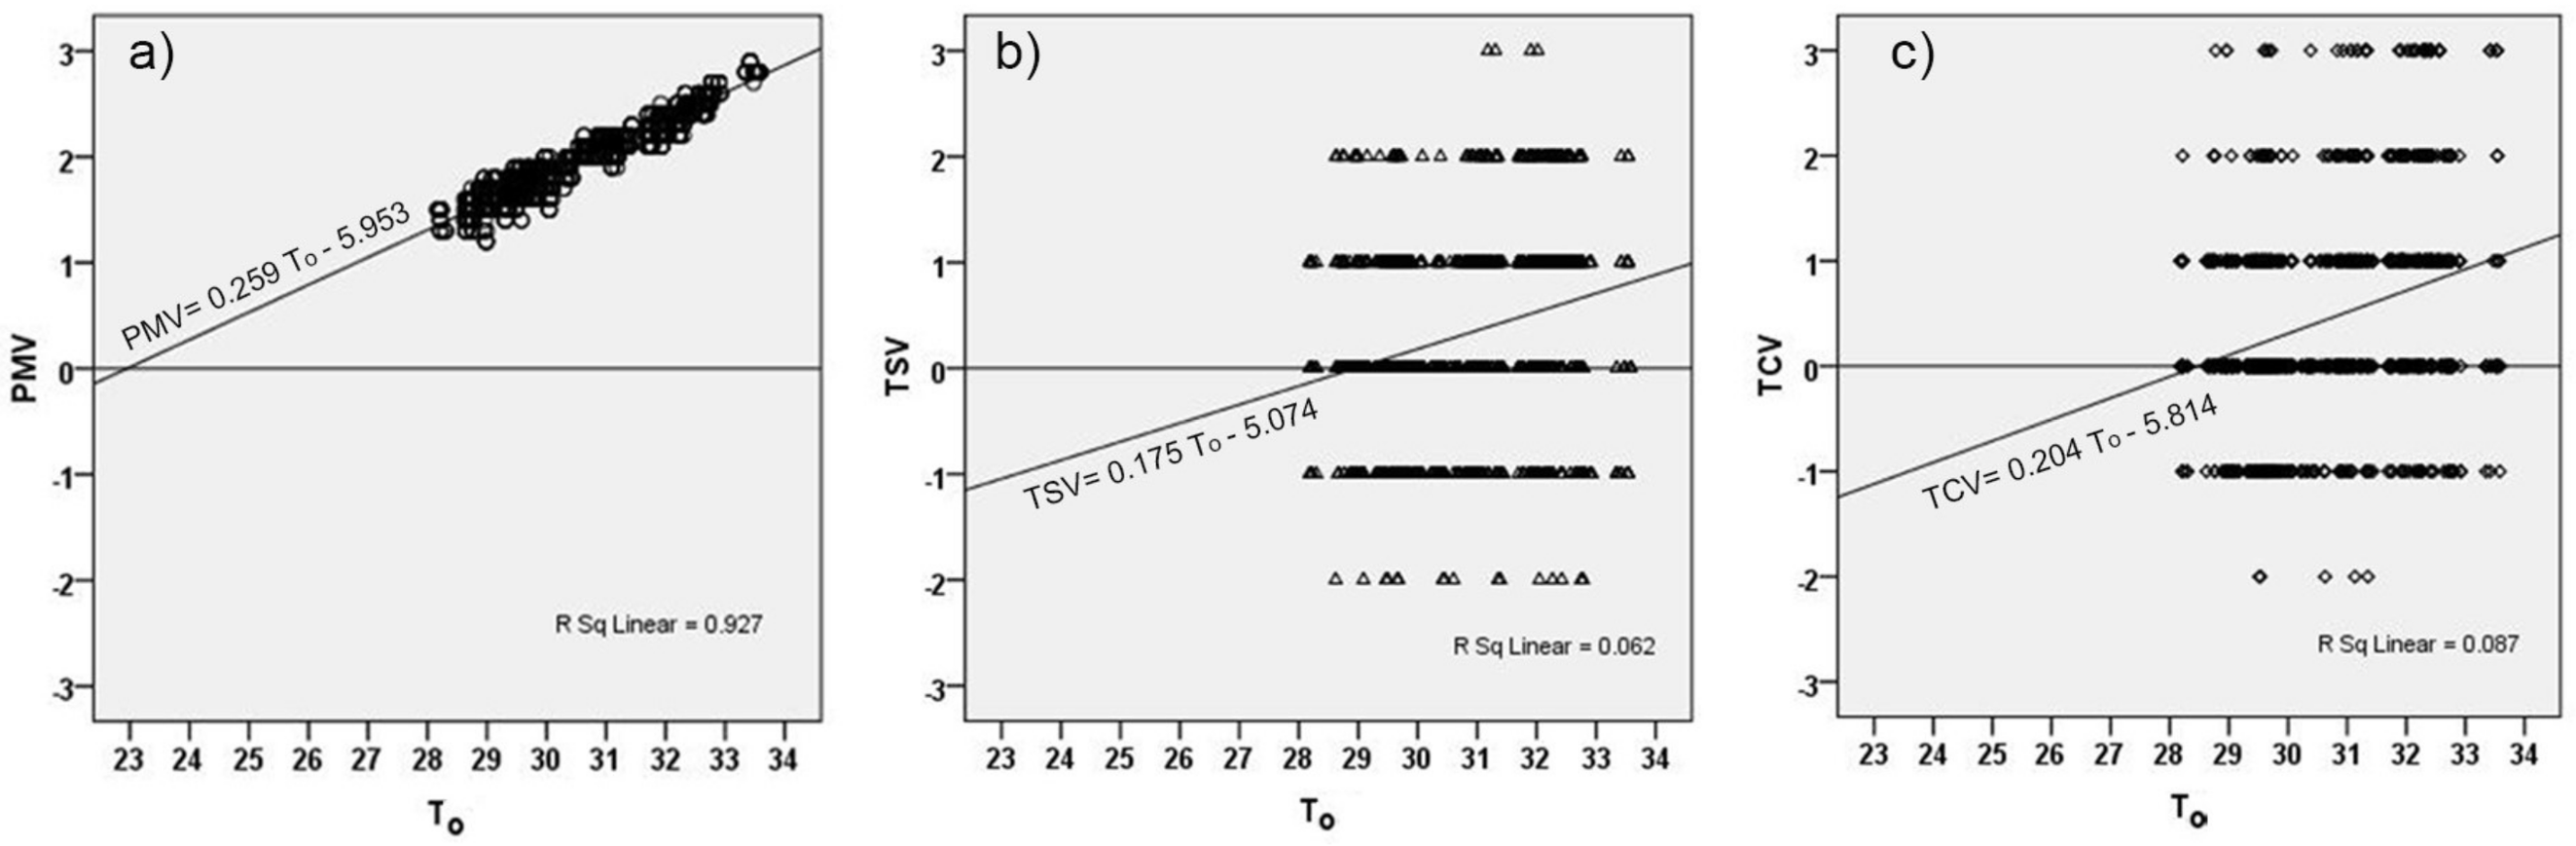
The neutral temperatures obtained the actual votes (TSV and TCV) are very different with the neutral temperature obtained the predicted one (PMV). The PMV predicts the neutral temperature for this case is about 23 °C, which about 6 °C lower than the TSV and TCV. In the room with operative temperatures (T
o) ranging from 28.2 °C to 33.6 °C, no respondents will be predicted neutral or comfortable using this PMV model. The neutral temperature gathered from actual votes TSV is 29.0 °C. This temperature has a good agreement with studies carried out in the tropics. For example, neutral temperature found by Wong and Khoo [
30] in school buildings in the tropical city of Singapore is only 0.2 °C lower than this present study. Based on the two days survey and measurements in the secondary school, they found the neutral temperature of 28.8 °C. Another study by de Dear [
47] found the neutral temperature of 28.5 °C. Feriadi and Wong [
32] found the neutral temperature in Jogyakarta Indonesia of about 29.2 °C, which is a little bit higher than the neutral temperature found in this study.
Considering the limitation of applicability of PMV model in predicting the thermal sensation and neutral temperature of respondents, the adaptable thermal comfort should be used. Several schools have provided means of increasing thermal comfort such as fan and openable windows that can be open when in need. Some female students also carried a small battery-operable portable fan to increase her comfort. The explanation of this adaptable thermal comfort will be discussed in another article in the future, which is combined the survey carried out in the primary and secondary schools.
5. Conclusions
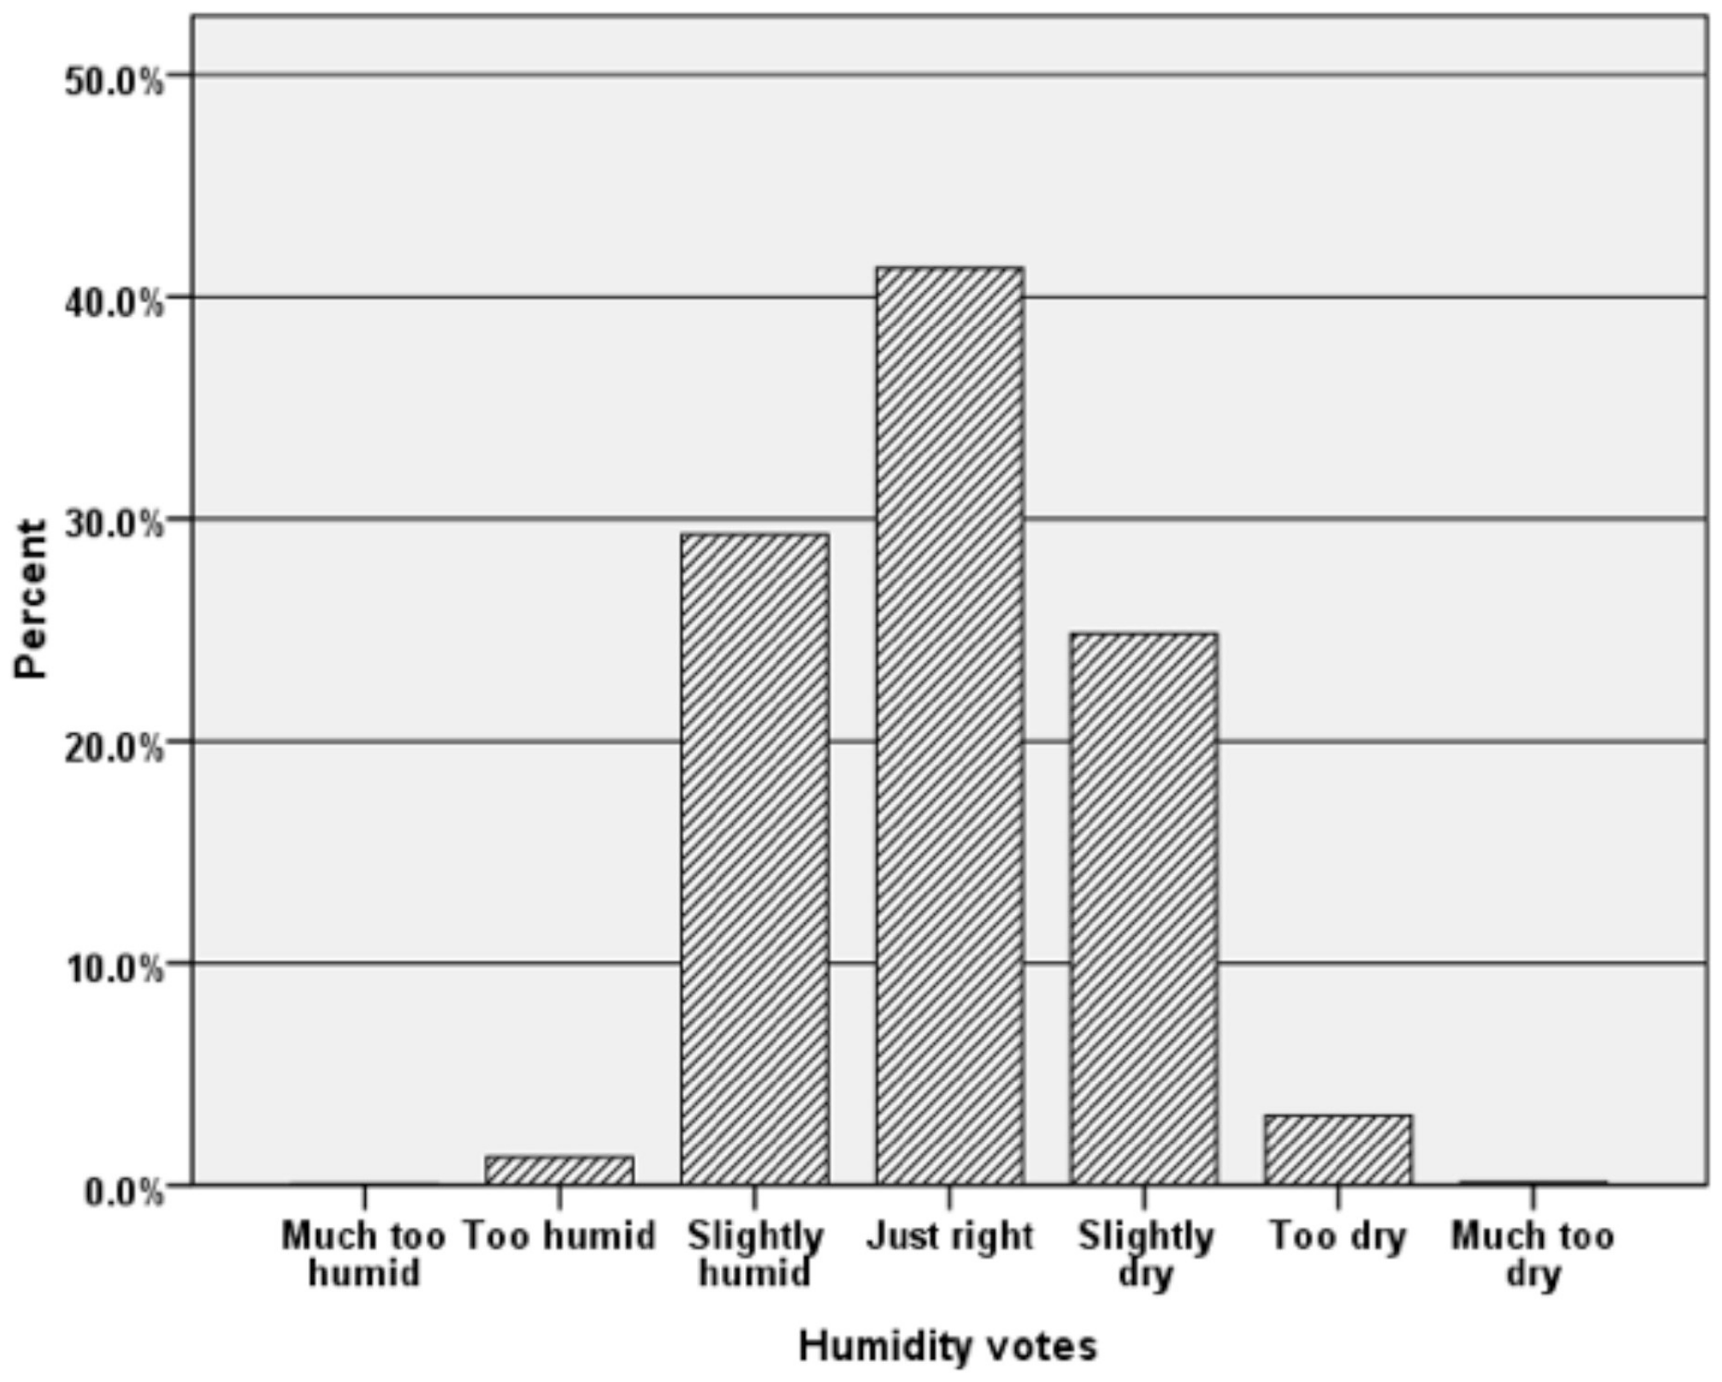
The measurement of classrooms in the eight selected secondary schools in the tropical city of Makassar showed hot air environments. The air temperatures ranged from 28.2 °C in the morning to 33.6 °C in the midday. The radiant temperatures (28.2 °C to 33.6 °C) were very similar to the air temperature. The airflow speeds were fairly stagnant, characterized by an average of 0.15 m/s and a maximum of 0.5 m/s. The only parameter that could meet the Indonesia national standard (SNI) is the air humidity, which is ranging from 44% to 73% with an average of 60%.
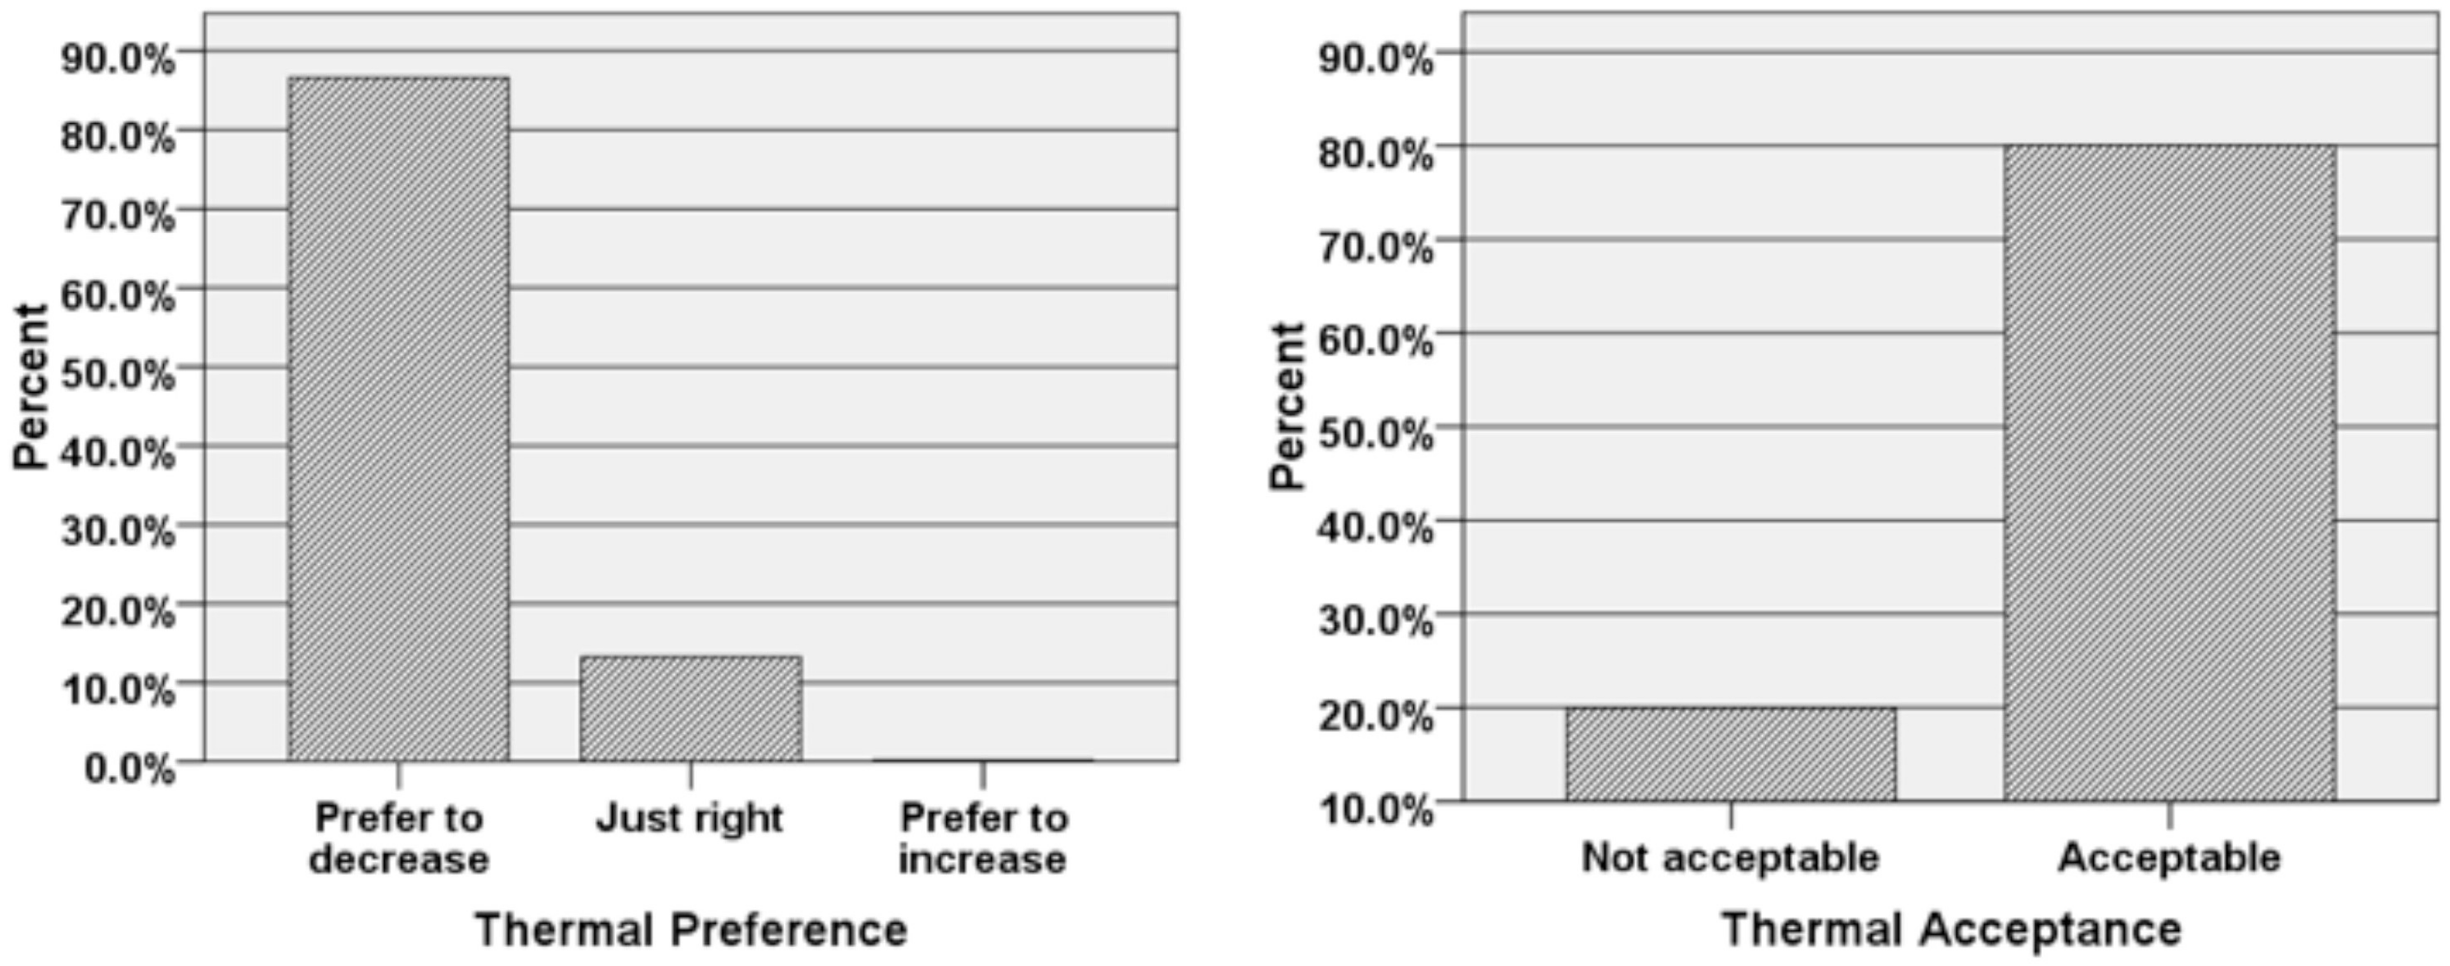
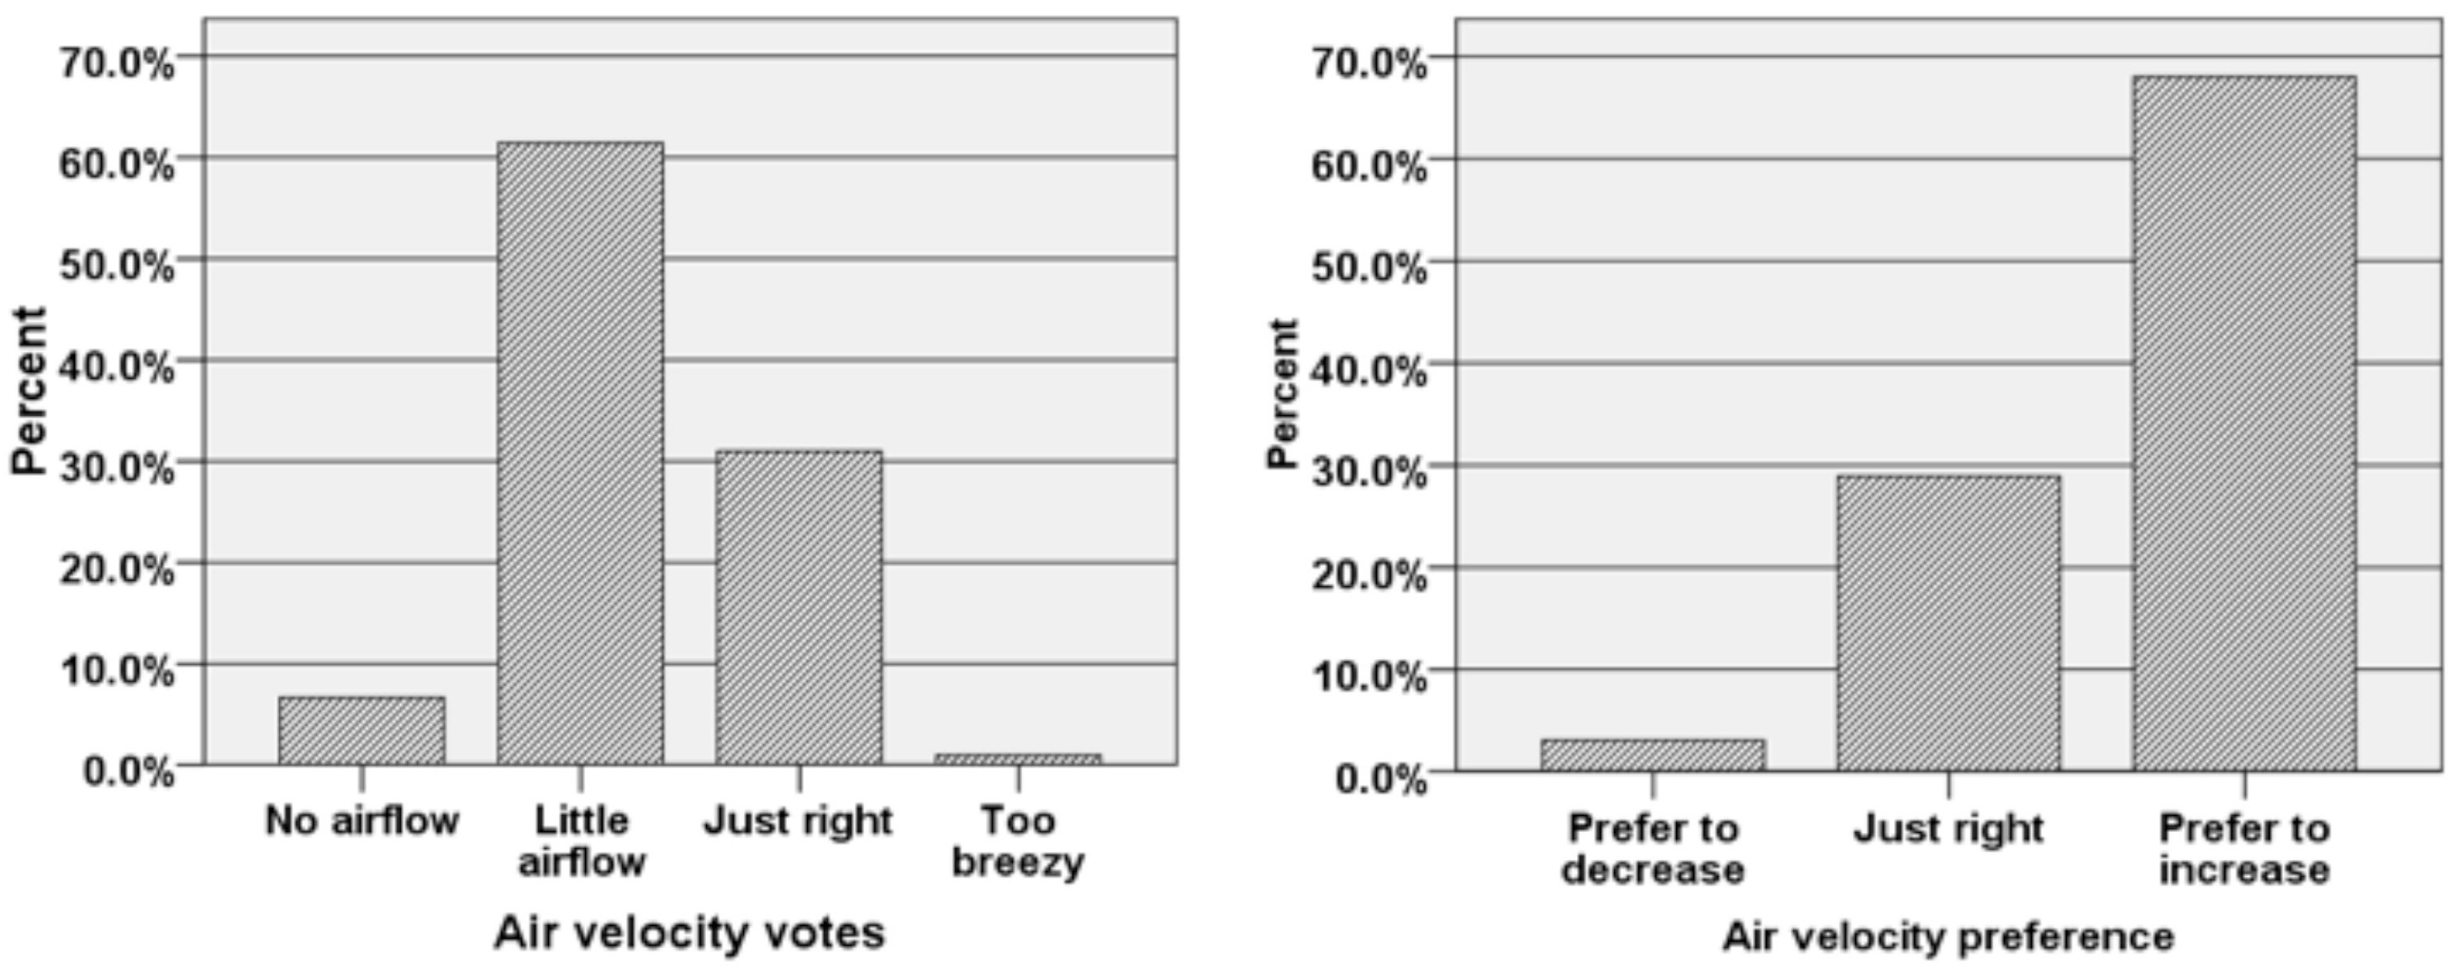
The thermal comfort survey results show that secondary school students were tolerant of the hot temperatures. About 37% of respondents voted the neutral (0) option, while about 20% voted slightly cool (−1), and more than 30% voted slightly warm (+1). Interestingly, there were only about 12% of them who voted the warm and hot regions (+2 to +3). These votes confirmed that despite the hot temperature in the classrooms, most of the students still felt comfortable. In fact, more than 86% of respondents accepted these thermal conditions. Even though the acceptance rate is very high, if there is a chance, 72% of respondents wanted cooler air temperature. Most of the respondents did not feel the airflow in the classrooms so that most wanted the increase in airflow velocity. A very small portion of respondents complained about the air humidity.
The result of the calculation of neutral temperature (Tn) using a model predicted mean vote (PMV) produced the value 23.0 °C which is very low when compared with the operative temperature in the room. It is smaller than the value of the neutral temperature (Tn) obtained from the actual votes either by TSV or TCV. The Tn obtained from TSV and TCV were 29.0 °C and 28.5 °C, respectively.
This study suggests that in the tropical Indonesian city, the secondary school students are able to acclimatize themselves with respect to thermal environments, which are beyond the comfort zone specified by the international and national standards. The evidence encourages the use of passive design in the school building construction and operation. There is a great potential for passive design working with electrical fans to lower the classroom temperature in response to students’ needs. This study, on the other hand, suffers from several limitations, especially the availability of equipment, which handicapped the accuracy of the measurement. Future studies shall deploy more meters and sensors working simultaneously to collect data on thermal environments.


